absorption of active pharmaceutical ingredients in process...
TRANSCRIPT

UPTEC X 18 013
Examensarbete 30 hpJuni 2018
Absorption of active pharmaceutical ingredients in process material
Fredrik Johansson


Teknisk- naturvetenskaplig fakultet UTH-enheten Besöksadress: Ångströmlaboratoriet Lägerhyddsvägen 1 Hus 4, Plan 0 Postadress: Box 536 751 21 Uppsala Telefon: 018 – 471 30 03 Telefax: 018 – 471 30 00 Hemsida: http://www.teknat.uu.se/student
Abstract
Absorption of active pharmaceutical ingredients inprocess material
Fredrik Johansson
The purpose of this project was to provide Galderma with information regarding theabsorption processes for a selected group of active pharmaceutical ingredients andprocess materials. The acquired information can support Galderma in future decisionsfor design of process equipment and strategies for cleaning of process equipment.
A UV spectrophotometric method was developed to study the absorption processesfor the three active pharmaceutical ingredients lidocaine hydriochloride, prilocainehydrochloride and mepivacaine hydrochloride in the three process materials ethylenepropylene diene monomer rubber (EPDM), silicone rubber andpolytetrafluoroethylene (PTFE). Absorption profiles for the different processes werecreated in Microsoft Excel.
The observed order of absorption, from highest to lowest, in both silicone and EPDMwere lidocaine hydriochloride, prilocaine hydrochloride and mepivacainehydrochloride. An overall higher absorption in silicone than in EPDM was seen for allthree active pharmaceutical ingredients. The results also showed that the selectedtime range of the experiments were not enough to achieve equilibrium for some ofthe absorption processes. It was not possible to detect any significant absorption inPTFE for any of the substances.
A hypothesis that the polarity of the active pharmaceutical ingredient might bedecisive for the order of absorption is suggested in this report. It is also proposedthat absorption might be higher in silicone because of the high free volume of thesilicone polymer compared to EPDM and PTFE. Since equilibrium was never reachedfor some of the experiments it is however possible that the results presented in thisreport do not show the true order of equilibrium absorption for the threesubstances. If so, it is possible that other properties than the polarity of the activepharmaceutical ingredient play a more significant role in the latter part of theabsorption process.
The following three recommendations for how to improve the method in futurework are given in this report:- Use fresh material in all experiments.- Use material with the exact same dimensions and surface area.- Conduct experiments over a longer time range.
ISSN: 1401-2138, UPTEC X18 013Examinator: Jan AnderssonÄmnesgranskare: Per HanssonHandledare: Eric Johansson och Martin Karlsson


iii
Sammanfattning
Inom läkemedelsindustrin utförs ett kontinuerligt arbete med att utveckla och förbättra tillverkningsprocesser, arbetsrutiner och metoder för att säkerställa produktsäkerheten. Ett område som är särskilt viktigt att ständigt förbättra är det område som berör rengöringsprocesser. En mycket viktig del i utvecklingsarbetet för detta område är att undersöka hur olika processmaterial påverkas av de substanser som används eller är tänkta att användas i tillverkarens produkter. Detta görs för att patienters hälsa och välbefinnande inte ska behöva riskeras, varför tillverkaren måste kunna garantera att korskontamination av läkemedelssubstanser mellan olika produkter inte kan ske.
Examensarbetet beskrivet i denna rapport är utfört på Galderma i Uppsala och pågick i totalt 20 veckor. Arbetet har utförts på avdelningen för industriell utveckling och syftet har varit att undersöka vilken av ett antal potentiellt användbara läkemedelssubstanser som har störst absorption i diverse processmaterial. Resultatet av arbetet ämnar ge svar på vilken av de olika substanserna som är svårast att rengöra och är tänkt att användas av Galderma vid framtida beslut om rengöringsstrategier och vid val av rengöringsutrustning.
Under arbetet har absorptionsprocessen för tre olika läkemedelssubstanser i tre olika material utvärderats. De tre substanserna var lidokain hydroklorid, prilokain hydroklorid och mepivakain hydroklorid och de tre valda materialen var silikongummi, etenpropengummi och teflon.
Utförandet av absorptionsstudier var möjligt efter utvecklandet och testandet av en framtagen spektrofotometrisk metod. Genom att jämföra resultaten från de individuellt utförda absorptionsstudierna drogs slutsatsen att det slutliga upptaget av lidokain hydroklorid troligtvis är större än det slutliga upptaget för de två andra substanserna, i två av de undersökta materialen. De två berörda materialen var silikongummi och etenpropengummi. Dessutom visade resultaten att upptaget troligtvis är större i silikongummi än i etenpropengummi för varje enskild substans. Det var inte möjligt att urskilja någon signifikant absorption i materialet teflon för någon av de tre substanserna med den framtagna metoden.
Ett flertal rekommendationer för fortsatt arbete inom området har getts i denna rapport. En av dessa rekommendationer är att inte återanvända samma material i de olika försöken, utan istället bör oanvänt material användas för varje försök. Dessutom bör material med samma form och dimensioner användas för att underlätta jämförandet av resultaten mellan de olika försöken. Avslutningsvis gavs rekommendationen att utföra försök som får pågå under en längre tidsperiod, för att med större säkerhet kunna bedöma vilken av substanserna som i slutlig mängd tas upp mest i de olika materialen.

iv

v
Table of content Abbreviations ............................................................................................................................1
1 Background..........................................................................................................................3
2 Theory ................................................................................................................................. 5 2.1 Diffusion ........................................................................................................................ 5
2.1.1 Fick's first law of diffusion ..................................................................................... 5
2.1.2 Concentration dependent diffusion coefficient ....................................................... 5
2.2 Sorption of organic compounds in polymers ................................................................. 6
2.2.1 Effects on sorption: Molecular weight, temperature and polymer properties ......... 6
2.3 Properties of the APIs .................................................................................................... 7
2.3.1 Molecular weight, pKa, solubility and structure..................................................... 7
2.3.2 Behaviour in solution during sorption .................................................................... 9
3 Development of experimental method ............................................................................ 10 3.1 Initial layout of method ............................................................................................... 10
3.2 Selection of initial parameter settings ......................................................................... 10
3.3 Selection of polymeric material ................................................................................... 11
3.4 Investigating experiment: Sorption of L-HCL in EPDM ............................................ 13
3.5 Investigating experiment: Sorption of B-HCl in EPDM ............................................. 16
3.6 Investigating experiment: Sorption of L-HCL in silicone ........................................... 16
4 Materials and methods for final experiments ................................................................ 18 4.1 Materials ...................................................................................................................... 18
4.2 Method ......................................................................................................................... 20
4.2.1 Calibration curves and system precision .............................................................. 20
4.2.2 Sorption in silicone and EPDM ............................................................................ 20
4.2.3 Sorption in PTFE .................................................................................................. 21
5 Results ............................................................................................................................... 23 5.1 Calibration curves and system precision ..................................................................... 23
5.2 API sorption in silicone ............................................................................................... 26
5.3 API sorption in EPDM ................................................................................................ 29
5.4 API sorption in PTFE .................................................................................................. 32
5.5 API sorption: silicone vs EPDM ................................................................................. 32

vi
6 Discussion and conclusion ............................................................................................... 34 5.1 Comparison of API sorption: L-HCl, P-HCl and M-HCl in silicone .......................... 34
5.2 Comparison of API sorption: L-HCl, P-HCl and M-HCl in EPDM ........................... 35
5.3 Comparison of API sorption: L-HCl, P-HCl and M-HCl in PTFE ............................. 36
5.4 Comparison of API sorption for all API : Polymer pairs ............................................ 36
7 Recommendations for future work ................................................................................. 38 References ................................................................................................................................ 39
Appendix A:1 ........................................................................................................................... 41
Appendix A:2 ........................................................................................................................... 42
Appendix A:3 ........................................................................................................................... 43
Appendix A:4 ........................................................................................................................... 45
Appendix B:1 ........................................................................................................................... 46
Appendix B:2 ........................................................................................................................... 47
Appendix B:3 ........................................................................................................................... 48
Appendix B:4 ........................................................................................................................... 50
Appendix B:5 ........................................................................................................................... 51
Appendix B:6 ........................................................................................................................... 52
Appendix B:7 ........................................................................................................................... 54
Appendix B:8 ........................................................................................................................... 55
Appendix B:9 ........................................................................................................................... 56

vii

1
Abbreviations API Active pharmaceutical ingredient B-HCl Bupivacaine Hydrochloride EMA European Medicines Agency EPDM Ethylene propylene diene monomer rubber FDA Food and Drug Administration GMP Good Manufacturing Practice L-HCl Lidocaine Hydrochloride M-HCl Mepivacaine Hydrochloride P-HCl Prilocaine Hydrochloride PLA Polylactic acid PTFE Polytetrafluoroethylene SBR Styrene-butadiene rubber

2

3
1 Background
If a company intends to manufacture and distribute products for pharmaceutical usage, an approval from the authority responsible for the supervision in the specific region the company intend to sell their product in is mandatory. Authorities like Läkemedelsverket in Sweden, European Medicine Agency (EMA) in Europe and The Food and Drug Administration (FDA) in the USA put very specific and high demands on the life science industry. One of the most important regulatory frameworks that a company has to obey is the Good Manufacturing Practise (GMP) framework [1]. The GMP framework was developed in order to guarantee the quality of the product and that consumers can use it without any risks to their health. Post approval, authorities commonly perform regular inspections to ensure that the company continues to follow the framework. Hence, it is crucial for companies to continuously develop and improve their work practices and procedures to ensure the continued delivery of high quality products.
Galderma Uppsala uses active pharmaceutical ingredients (APIs) in their products. One of these APIs is Lidocaine hydrochloride (L-HCl, Figure 1), which is an ingredient in some of Galderma Uppsala's sodium hyaluronate fillers and fulfils its purpose as a local anaesthetic for patients during injections in the skin. When the manufacturing of different products containing different APIs is being conducted using the same process equipment, it is crucial that correct and sufficient cleaning has been performed. In order to ensure that this is the case, Galderma develop and validate cleaning processes. As part of this development it is important to investigate how different materials present during the manufacture process are affected by different APIs since it may affect the effectiveness of the cleaning method in production plant.
Figure 1. Structural formula for L-HCl
Galderma has previously conducted internal studies on sorption of L-HCl. The results showed that sorption of L-HCl occurs from products into different polymeric materials. These processes might, if insufficient cleaning of process equipment has been performed, affect the API content of the product or in worst case lead to unwanted transfer of APIs to other products. This is usually referred to as cross contamination and these processes are important to study since it might affect the safety of the products. Hence, the aim of this project was to investigate which of the APIs has the highest sorption in different polymeric materials. This information could be used when determining which of the APIs is more difficult to clean and why. The results from this master thesis could potentially be used by Galderma in future
HCl

4
design of process equipment and when choosing different strategies for cleaning of the equipment.

5
2 Theory In order to get a good understanding of the theoretical background important for this work it was initially necessary to conduct a literature study. Since no published work regarding sorption of caines in polymeric material was found, literature describing methods for investigating the sorption process of different organic compounds in polymers were instead used as a basis for this work. The literature study also included the gathering of information regarding theory of general diffusion, transport properties of polymeric materials and characteristics of the APIs since these are all factors that influence the sorption processes. The acquired information combined with results from conducted investigating experiments were used in the development of an experimental method, explained in section 4. The method was used to study the sorption processes of the APIs in the different polymeric materials.
2.1 Diffusion
Diffusion is a process that is caused by Brownian motion which is the random motion of individual molecules [3]. The diffusion process is defined as the net transfer of matter from one point within a system to another point. Hence, even though every individual molecule’s movement can be considered random, the net transfer of molecules is taking place from a higher concentration of molecules to a lower concentration and thus gives the diffusion a defined direction [3].
2.1.1 Fick’s first law of diffusion The diffusion process in a medium can be described with Fick’s first law of diffusion, explained in Equation 1
= −𝐷 𝜕𝐶/𝜕𝑥 (1)
were F is the net transfer of matter per area and time, D is the diffusion coefficient, C is the concentration of the diffusing matter and x is the length parameter measured vertical to the surface [3]. This equation describes how the transfer of matter within a system is related to the concentration gradient and the relationship is only applicable in a steady state, when the concentration is no longer varying with time [3].
2.1.2 Concentration dependent diffusion coefficient In situations when concentration is varying with time, which is the case when equilibrium is not reached, the diffusion process can instead be described with Fick’s second law of diffusion
= 𝐷 𝜕+𝐶
𝜕𝑥+ (2)

6
Where C is the concentration, t is the time, D is the diffusion coefficient and x is the length parameter. Equation 2 shows how the rate of assembled matter in a specific point within a system is proportional to the second derivative of the concentration [3].
2.2 Sorption of organic compounds in polymers
The diffusion of organic molecules in a thin sheet of polymer can be determined by using a method developed by Crank (1975) after analysis of kinetic data from sorption studies [3]. Consider a polymer sheet with the thickness h. If we assume that the concentration of molecules on the outside of the polymer is held constant, C1, and that the concentration of molecules within the polymer is initially held constant, C0, then it is possible to determine the diffusion coefficient, D after measuring the mass uptake of molecules of the polymer sheet and applying Equation 3, which is an approximate solution of Fick’s second law of diffusion [3].
,- = /01/2
𝑡5/+ (3)
,. 341/2
Here Mt is the mass uptake at a specific time point, M∞ is the mass uptake at equilibrium, h is the thickness of the polymer sheet and t is the time. The approximate solution is only applicable for values of Mt / M∞ < 0.5.
2.2.1 Effects on sorption: Molecular weight, temperature and polymer properties Variations of the proposed method by Crank to study sorption has been used quite extensively in studies of sorption of organic compounds in polymers. For example, diffusion coefficients for the sorption process of carbohydrates in different polymeric materials were determined by Unnikrihnan, Thomas and Varghese (1996) [4]. In this study, sorption of four different carbohydrates was investigated at different temperatures and the authors used gravimetric measurements to determine the mass uptake of solvent. The results indicated that the rate of sorption is increasing with temperature and reversely dependent on molecular weight of the diffusing molecule.
Shivaputrappa, Harogoppad and Aminabhavi (1991) has studied the sorption of long chained hydrocarbons in neoprene, styrene butadiene rubber (SBR), ethylene propylene diene monomer rubber (EPDM) and natural rubber [5]. Again, the authors used gravimetric measurements to determine the mass uptake of solvent. The results showed that the rate of sorption is reversely dependent on molecular weight of the diffusing molecule and the authors hypothesises that the abnormal sorption curves presented in the study are probably due to leaching substances either contributed by additives in the polymers or by elastomeric compounds.
In a study conducted by Widiastuti, Sbarski and Masood (2016) the performance of PLA based materials undergoing sorption of organic liquids has been examined [6]. The results

7
showed that the processes follow Fick’s law of diffusion at low temperatures but deviates from Fick’s law at higher temperatures. Also, it was noted that the elasticity and strength of the materials were decreasing as the amount of absorbed liquid increased.
Izák et al. (2009) used another method to study the sorption of binary liquids in two different polymer membranes [7]. Here, the authors used gravimetric measurements to determine the mass uptake of solvent and found that the polarities of the liquid and the polymer were important for the sorption process. It was observed that the polar component of the binary liquid was sorbed in a higher amont by the most polar polymer and that the non-polar component of the binary liquid was sorbed in a higher amount by the other, more non-polar, polymer.
2.3 Properties of the APIs
Since the purpose of this master thesis was to compare the sorption processes of different APIs in polymers, it was important to know the properties of the APIs of interest. For instance, if one is to decide on appropriate API concentrations to use during the sorption experiments it is first important to know the solubility of the APIs in question. It is also important to know the chemical structure, the pKa value and the molecular weight of the APIs since these are factors that could affect the sorption process or determine how some parts of the experiments should be conducted.
2.3.1 Molecular weight, pKa, solubility and structure The APIs examined in this master thesis are all caines. Some of the chemical properties for these APIs are listed in Table 1. Caines are molecules synthesised with cocaine as the model structure. Their solubility in water is mainly poor and they are therefore mostly sold and used as hydrochloride salts, which increases the water solubility of the caine significantly. The general structure of a caine is made up of three parts, a lipophilic aromatic ring, an ester or amid chain and a hydrophilic tertiary amine [8]. The lipophilic aromatic ring is strongly contributing to the solubility in fatty solvents and substitutions can increase it even further [8]. Experimental logPo/w values for these APIs are presented in Table 1. These values are obtained by measuring the distribution of the uncharged free base of the APIs between an organic phase and a water phase [16]. The caine with the poorest water solubility, the highest logPo/w value, will set the upper limit for the concentration of API that can be used in the experiments.

8
Table 1. Chemical properties of L-HCl, B-HCl, P-HCl and M-HCl, showing the chemical structure, the molecular weight, the pKa and the logPo/w value of the APIs. The experimental logPo/w values were obtained by measuring the distribution of the uncharged free base of the APIs between an organic phase and a water phase [16].
API Structure Mw (g/mol)
[2] pKa [2]
logPo/w [16]
L-HCl
x HCl
234.343
7.86
3.40
B-HCl
x HCl
288.435
8.09
4.05
P-HCl
x HCl
220.316
7.89
2.73
M-HCl
x HCl
246.354
7.7
2.69

9
2.3.2 Behaviour in solution during sorption Galderma Uppsala has previously conducted two in-house studies on sorption of L-HCl in different materials [9] [10]. The materials used were silicone, EPDM and PTFE. The results from these studies showed that sorption of L-HCl in PTFE is limited. The studies also showed that sorption of L-HCl is greater in silicone than in EPDM. Another interesting note was that the pH of the L-HCl solution decreased during sorption. Therefore, Galderma Uppsala drew the conclusion that it is the uncharged, free base of the API that is sorbed by the polymer, Figure 2.
API + H+ ⇄ API-H+
Figure 2. The chemical equilibrium between the uncharged free base and the salt, for API in solution.
When the pH of the solution is the same as the pKa value of the API, there is an equal amount of charged and uncharged molecules [11]. Literature have shown that when there is an increase in temperature of the solution, the pKa might decrease [12]. This would result in an increase of uncharged API molecules and thus water solubility might decrease with increasing temperature.

10
3 Development of experimental method
In order to find appropriate conditions and procedures for the experimental method, initial investigating experiments were conducted. This was necessary since the gathered information from the literature study showed that there are many different parameters that might affect the sorption process. For instance, changes in pH, temperature and solution concentration are all factors that may affect the sorption process of caines in polymers in different ways [3] [4] [5] [9]. To be able to determine which of the API that has the highest sorption in respective polymer it is important to find parameter settings that are suitable for all of the APIs, so that these parameters can be held constant between the different sorption experiments.
3.1 Initial layout of method
Several studies regarding the sorption process of organic liquids in polymers have been conducted in previous work. A widely used method for this purpose, developed by Crank (1975), is described in section 2.2. The mass uptake of solvent is often determined by gravimetric measurements, but since the APIs that are being studied in this work are salts and have to be dissolved in a solvent it is not possible to accurately estimate the mass uptake of the API using a gravimetric method. Hence, a spectrophotometric method has instead been used to determine the mass uptake of API. In the next coming paragraph, a basic description of how the sorption experiments were planned to be conducted is presented.
The polymer samples are intended to be placed in an API solution and collected over a time interval. The samples are then dipped two times in Milli-Q water and dried with a soft tissue, in order to remove adsorbed API. After transfer of the samples to fresh bottles, 0.12 M HCl can be added to each bottle. Based on the discussion in the two in house studies on sorption of L-HCl by Galderma [9] [10], a lowering of the pH should result in the extraction of the absorbed API as the equilibrium is shifted. The extraction solution can then be analysed with the help of a UV-3100PC spectrophotometer from VWR [17]. By producing a calibration curve for each API it is then possible to determine the mass uptake of API for the polymer.
The mass uptake of API per volume polymer, Qm, can then be plotted against time to create sorption profiles. Using Qm values in the results enables easier comparison of API sorption between polymeric materials.
3.2 Selection of initial parameter settings
One aspect that had to be taken into account was the possible limitations in sensitivity and selectivity of the analytical method. Any disturbances caused by leaching substances from the polymers was an issue that had to be considered [5]. Hence, leachable tests on the polymers were conducted. As a precaution and in order to avoid any possible limitations in sensitivity it was initially decided that the best approach would be to conduct the first experiments with a

11
relatively high concentration (10 mg mL-1) of API. Also, since the rate of the sorption process was initially unknown it was decided that the best approach would be to start at a temperature above room temperature, since literature have shown that the rate of the sorption process in many cases is dependent on temperature [4] [6]. Hence, 40o C was chosen as the initial sorption temperature. In order to speed up the extraction of the API as much as possible it was decided that the extraction temperature would be set to 80o C. It was decided that a temperature above 80o C would not be suitable since this would increase the risk of damaging the polymeric material during long time exposure.
3.3 Selection of polymeric material
Several different polymeric materials are being used in the manufacturing of Galderma Uppsala’s products. For the purpose of this study Galderma purchased and provided a wide range of polymeric materials that they considered to be of interest. These materials were purchased from RubberStock in Trelleborg, Sweden and included a set of three EPDM sheets with the thicknesses of two mm, four mm and eight mm respectively, a four mm thick SBR sheet, a four mm thick Viton sheet and a four mm thick silicone sheet. PTFE and EPDM packing material used in Galderma’s manufacturing processes were also available. Galderma considered that the two polymeric materials EPDM and PTFE were the most important materials and they should therefore have the highest priority. If there was time other materials could be included in the study. Since PTFE is a fluoropolymer and a thermoplastic material, it has a much more crystalline structure than EPDM [13] [14] [15] it is likely to absorb much less of the APIs [10]. It was therefore decided that it would be suitable to start with sorption studies on EPDM.
The EPDM sheet with a thickness of four mm was chosen. The reason for this was concerns that sorption in the two mm thick sheet might lead to sensitivity complications and that sorption in the eight mm thick sheet might instead lead to complications in reaching sorption equilibrium within the a reasonable time range.
Before proceeding with sorption studies on the chosen EPDM material, a leachable test of the material was necessary to perform. EPDM plates with dimensions 50 x 50 x 4 mm was cut out from the four mm thick EPDM sheet. The plates were placed in a Duran bottle containing 120 mM phosphate buffer, pH 6.8, and placed on a magnetic plate in a thermostatic container set to 40o C. A magnetic flea was added so that stirring would occur. One ml samples of the solution were taken out over time and analysed. The results showed that the material leached substances that absorbed UV light at wavelengths interfering with API measurements. Also, small black particles were visible in the solution after a couple of days. The particles were probably small pieces of EPDM which led to the conclusion that the material was physically damaged during the experiment. Most likely it was the magnetic flea that caused the material to shed small pieces from the rough cut edges. Still, after one week it was not possible to macerate the material of the substance that caused the disturbances. It was therefore decided

12
that negative controls would be necessary throughout the sorption experiments to compensate for the leaching substances. However, after placing the material in extraction solution consisting of 0.12 M HCl it was noted that the material leached substance that coloured the solution purple. The leached substances were probably additives that is used to give the polymer certain qualities. The change in colour was however a major setback, since it affected the UV-VIS measurements in such a way that it would not be possible to determine API concentration using this method. Unfortunately, the same results were shown for the two mm thick EPDM sheet and by then it was obvious that the EPDM material purchased from RubberStock would not be suitable for further studies. Similar leachable tests were therefore performed on the EPDM packing’s from Sveflow and on the four mm thick Silicon sheet from RubberStock, Figure 3. The leachable studies for these two materials showed much better results, although some disturbances were visible. The disturbances were noted and as previously discussed it was decided that negative controls would have to be used to compensate for this factor.
Figure 3. (A) EPDM packing from Sveflow. (B) Cut EPDM packing from Sveflow. (C) Cut silicone plate from RubberStock.

13
3.4 Investigating experiment: Sorption of L-HCl in EPDM The purpose of the investigating experiments, conducted during the method developmental part of this master thesis, was to get an estimation of the sorption equilibrium time for different API : Polymer pairs and to find suitable parameter settings for final sorption experiments. Hence, no negative controls were used in the investigating experiments and the results are presented as Qa which is the measured UV absorbance of extraction solution per mass polymer. Thus, comparison of presented sorption results between the different API : Polymer pairs is not possible for these experiments. The reagents used during the investigating experiments, included in the developmental part of this master thesis, were provided by Galderma and are presented in Table 2.
Table 2. Reagents used during investigating experiments.
Reagent Provided by
L-HCl MOEHS
B-HCl MOEHS
HCl APL
NaOH APL
KH2PO4 Merck KGaA
Na2HPO4 Merck KGaA
Since L-HCl is the API used in some of Galdermas products at present time it was chosen for the first sorption experiment. UV-VIS measurements of L-HCl solution showed absorbance maximum at 263 nm and it was decided that measurements would be performed at that wavelength. The EPDM material from Sveflow in Figure 3 were cut into pieces of approximately 20 x 10 mm. The pieces were placed in 120 mM phosphate buffer, pH 6.7, and were allowed to swell for 24 hours. All EPDM pieces were weighed and the values were noted. A 10 mg mL-1 L-HCl solution was prepared with 120 mM phosphate buffer and pH was adjusted to 6.8. A total amount of 16 EPDM pieces were placed in a Duran bottle containing the L-HCl solution. The bottle was then placed in a thermostatic container set to 40o C. Samples consisting of a set of four EPDM pieces each were taken out after 3 h, 19 h, 26.5 h and 48 h respectively. The samples were placed in separate bottles and 20 ml of 0.12 M HCl was added. The bottles were placed in a thermostatic container set to 80o C. UV-VIS measurements of the extraction solutions were performed over time until no significant change was visible at 263 nm.

14
As seen in Figure 3 the thickness and surface area of the cut pieces of EPDM were not uniform. It was simply too difficult to estimate these values for the different pieces of EPDM in a precise way and it was therefore decided that the mass of the EPDM pieces would be used to compensate for the deviations in sizes. The results from the experiment are presented in Figure 4. For experimental data, see Appendix A:1. It was not possible to draw any conclusions from the results regarding when sorption equilibrium occurs other than that more time than 48 hours is needed. Therefore, a second experiment was conducted on sorption of L-HCl in EPDM but over a longer period of time and with a larger set of samples.
0,45
0,4
0,35
0,3
0,25
0,2
0,15
0,1
0,05
0
0 500 1000 1500 2000 2500 3000 3500
Time (min)
Figure 4: First sorption experiment of L-HCl in EPDM. Values are presented as Qa, the absorbance value of the extraction solution per mass polymer.
The results from the second sorption experiment are presented in Figure 5. Experimental data is presented in Appendix A:2. These results were quite contradictive. On one hand, indication that the sorption process is starting to slow down after 48 hours was seen. On the other hand, the last two data points implied that there was still a significant and somewhat irregular increase after 48 hours. The contradictive results might be explained by deviations in individual data points due to weaknesses of the method and since the deviation was not known it was not possible to say for certain if equilibrium was reached after 48 hours or not.
Qa(A
bs./
g)

15
1
0,9
0,8
0,7
0,6
0,5
0,4
0,3
0,2
0,1
0
0 2000 4000 6000 8000 10000 12000
Time (min)
Figure 5: Second sorption experiment of L-HCl in EPDM. Values are presented as Qa, the absorbance value of the extraction solution per mass polymer.
An important factor that might have contributed to the contradictive results is the difference in the size and shape of the EPDM pieces. The decision to use the weight of the pieces to compensate for this difference was probably not ideal, since sorption is very dependent on the surface area to volume ratio [15]. This meant that the cut EPDM material would not be suitable to use for the comparison of sorption of the different APIs. Hence, a new type of packing of the same material but with a different shape was ordered from Sveflow, which made it possible to produce circular plates with less variation in surface area and thickness, see Figure 6. The original pieces of EPDM were however used throughout the developmental part of the master thesis since it took time for the new material to be delivered and prepared. It was decided that it would be suitable to conduct the next experiment in replicates of three in order to get an estimation of the repeatability of the method.
Figure 6. New EPDM packing ordered from Sveflow.
Qa (
Abs.
/g)

16
3.5 Investigating experiment: Sorption of B-HCl in EPDM
UV-VIS measurements of B-HCl solution showed absorbance maximum at 263 nm [18]. The experimental procedures, reagents and materials used for the experiments on L-HCl, described in the previous section, were also used for B-HCl. Instantly, it was obvious that the same parameter settings used for L-HCl would not work for the sorption experiments on B- HCl. A 10 mg mL-1 solution of B-HCl was not possible to achieve at given pH, buffer concentration and temperature. Therefore both the concentration of the buffer and B-HCl was lowered. A problem with precipitation of B-HCl over time was noted. At room temperature, pH 6.7, buffer concentration 12mM and B-HCl concentration 3 mg mL-1 no precipitation of B-HCl was visible over time. The sorption experiment with B-HCl was therefore conducted with the adjusted parameter settings and performed in replicates of three. The results from the sorption experiment on B-HCl in EPDM are presented in Figure 7. Experimental data is presented in Appendix A:3. The results indicated that sorption equilibrium is not reached within the given time range of the experiment.
0,35
0,3
0,25
0,2
0,15
0,1
0,05
0
0 1000 2000 3000 4000 5000 6000 7000 8000 9000
Time (min)
Figure 7. Sorption experiment on B-HCl in EPDM. Values are presented as Qa, the absorbance value of the extraction solution per mass polymer.
3.6 Investigating experiment: Sorption of L-HCl in silicone
Plates with dimensions of 50 mm x 50 mm were cut from the 4 mm thick silicone sheet, Figure 3 C. The same parameter settings as for sorption of B-HCl in EPDM was used, since B-HCl had set the upper limit of API concentration and temperature (3 mg mL-1, room temperature). The same experimental procedures and reagents as in previous experiments were used. Samples were collected after 1, 3, 6.75, 22.5, 29, 46.5 and 53.75 hours. Replicates
Qa (
Abs.
/g)

17
of the experiment were not conducted. The results from the sorption experiment on L-HCl in silicone is presented in Figure 8. Experimental data is presented in Appendix A:4.
0,03
0,025
0,02
0,015
0,01
0,005
0 0 500 1000 1500 2000 2500 3000 3500
Time (min)
Figure 8. Sorption experiment on L-HCl in silicone. The results from the sorption experiment on L-HCl in silicone indicated that sorption reaches equilibrium in less than 48 hours.
The conclusion from the experiments during the developmental part of this master thesis was that it would probably not be possible to reach sorption equilibrium for B-HCl in a time range that was possible for this master thesis. From further experiments conducted with different concentrations of B-HCl it was noted that the sorption rate appeared to slow down with decreasing solution concentration (data not presented). The same trend was visible for L-HCl (data not presented). Results also showed that 48 hours of sorption might not be enough time to achieve equilibrium in the EPDM material, but that it should be sufficient for the silicone material.
After discussion with Galderma it was decided that B-HCl would not be included in the final sorption experiments and instead M-HCl and P-HCl would be used, since preliminary solubility experiments and literature indicated that there would not be a problem with water solubility for these two APIs and thus the higher concentration of 10 mg mL-1 could be used [16]. It also meant that the higher sorption temperature of 40o C could be used. In order to improve the repeatability of the method it was decided that the mechanical stirring of the solutions, used during investigating experiments, would not be used during the final sorption experiments since the stirring caused a problem with irregular displacement and damage of the polymer samples.
Qa (
Abs.
/g)

18
4 Materials and methods for final experiments
Because of the complications with B-HCl, the APIs chosen for final sorption studies were L- HCl, M-HCl and P-HCl. Sorption experiments on one of the three APIs were scheduled to be conducted in both silicone and EPDM simultaneously. Experiments for one API were estimated to last one week, starting with L-HCl and proceeding with M-HCl and P-HCl. After receiving the new EPDM material from Sveflow both the EPDM and silicone material were sent to Galderma Uppsala´s workshop for cutting. Since there was a limit in how much of the material that the workshop could prepare it was decided that the same material would be used throughout the sorption studies. This meant that cleaning of the material was necessary in between the three different sorption experiments on silicone and EPDM. The weekly schedule for the sorption experiments for one API in the two materials was therefore as follows: two days for sorption of the API, two days for extraction and measurements of the extraction solutions and three days for cleaning and preparing the material for next coming week.
During the three weeks of sorption experiments on silicone and EPDM, the PTFE material was sent to Galderma´s workshop for cutting. The sorption studies on PTFE were therefore performed after the experiments on silicone and EPDM.
4.1 Materials
All reagents, materials and instrumentation used during final sorption experiments were purchased and provided by Galderma Uppsala. Reagents and materials are presented in Table 3. Spectrophotometric analyses were performed using a UV-3100PC spectrophotometer from VWR [17]. Cut plates of silicone, EPDM and PTFE used during the final sorption experiments are presented in Figure 8.

19
Table 3. Reagents and materials used during final sorption experiments.
Reagent Provided by Material Provided by
HCl APL Silicone FDA (4mm)
RubberStock
NaOH APL EPDM clamp blind packing 1”-1.5”
Sveflow
KH2PO4 Merck KGaA PTFE Galderma
Na2HPO4 Merck KGaA
L-HCl MOEHS
P-HCl MOEHS
M-HCl MOEHS
Figure 8. (A) Cut silicone plate with a diameter of 40 mm and a thickness of. 4 mm (B) Cut EPDM plate with a diameter of 40 mm and a thickness of 2 mm. (C) Cut PTFE plate with a diameter of 15 mm and a thickness of 4 mm.

20
4.2 Method
The methods used for the final sorption experiments on L-HCl, M-HCl and P-HCl in silicone, EPDM and PTFE were based on information from the literature study and the results from the experiments conducted during the developmental part of this master thesis. The methods are very similar for the sorption studies on the different polymeric materials, but they differ in some small parts due to limitations in resources and time.
4.2.1 Calibration curves and system precision Standard solutions of 1 mg mL-1 were prepared for L-HCl, P-HCl and M-HCl using 0.12 M HCl. From stock solutions, dilution were performed obtaining solutions with concentrations ranging from 0.2-1 mg mL-1. UV-VIS measurements of the different solutions were performed in replicates of three, using 0.12 M HCl as zero blank. Maximum absorbance was found at 263 nm for L-HCl and M-HCl [18] [19] [20]. For P-HCl, no distinct absorption maximum was found. Values at 263 nm were noted for L-HCl and M-HCl. Values at 273 nm were noted for P-HCl.
Evaluation of the precision of the three different systems was performed at a concentration of 1 mg mL-1. Six replicates of the 1 mg mL-1 solution were measured for each API.
4.2.2 Sorption in silicone and EPDM After receiving the cut silicone and EPDM plates, Figure 7, from the Galderma workshop all plates were washed carefully with Milli-Q water. A total of 39 silicone plates and 42 EPDM plates were received. The silicone plates were sorted in three separate groups with a total amount of 10 silicone plates in one group. The plates were marked with a knife, numbering the plates from Ⅰ-Ⅹ. The same procedure was performed on the EPDM plates but with a total amount of eleven EPDM plates in one group, numbered from Ⅰ-Ⅺ. Three plates of both materials were stored to be used as negative controls and six more plates were stored for a cross contamination control to be conducted during the sorption studies on M-HCl. The six groups of plates were placed in separate bottles and 12 mM phosphate buffer, pH 6.7, was added. Plates were left to swell over weekend.
Six solutions of L-HCl (1 L, 10 mg mL-1) were prepared with 12 mM phosphate buffer in separate bottles. The bottles were placed in a thermostatic container set to 40o C and left over weekend.
The pH of the six L-HCl solutions were adjusted to 6.5. The silicone plates in groups of ten were placed in three of the bottles and the EPDM plates in groups of eleven were placed in the other three bottles. Starting time of the experiments was noted. A sample consisting of one plate was collected after 1, 2, 3, 4, 6, 8, 24, 32, 48 and 55 hours respectively from the three different bottles containing silicone plates. For the bottles containing the EPDM plates samples were collected after 1, 2, 3, 4, 6, 8, 24, 32, 48, 52 and 55 hours respectively. Samples were dipped twice in Milli-Q water and dried with a soft tissue. All samples were then placed

21
in separate bottles and 15 ml extraction solution consisting of 0.12 M HCl was added to each bottle. The three controls for both materials were also placed in separate bottles and 15 ml extraction solution was added. The bottles were placed in a thermostatic container set to 80o C and left for 23 hours. A UV-VIS measurement was performed on the extraction solution for every sample and control, using 0.12 M HCl as zero blank. The value at 263 nm was noted. All samples, including controls, were transferred to new bottles and 15 ml fresh extraction solution was added. The bottles were placed in a thermostatic container set to 80o C and left for 23 hours. UV-VIS measurements were performed on the extraction solutions and the values at 263 nm were noted.
Plates were returned in their original grouping and placed in fresh bottles, including the controls which were placed in a separate bottle. Milli-Q water was added to each bottle. After 3 hours the Milli-Q water was discarded and 12 mM phosphate buffer, pH 6.7, was added. Plates were left in phosphate buffer over weekend.
The same procedure was conducted for M-HCl and P-HCl, in that order. For M-HCl, the six never before used plates, stored for cross contamination tests, were used in order to get an estimation of possible contaminations of L-HCl still remaining in the plates. Three of the never before used plates were placed in respective M-HCl solution and used as cross contamination controls. The other three plates were stored and used as negative controls for the cross contamination controls. The plates used for cross contamination control were collected after 55 hours.
When conducting UV-VIS measurements of M-HCl samples the values at 263 nm were noted for both samples and controls. For P-HCl, the values at 273 nm were noted.
4.2.3 Sorption in PTFE After receiving the cut PTFE plates from Galderma´s workshop the plates were washed carefully with Milli-Q water. A total of 30 PTFE plates were used. The plates were separated and placed in different bottles, resulting in nine groups consisting of three plates each. Three plates were stored as negative controls. 12 mM phosphate buffer, pH 6.7, was added to each bottle and left over weekend.
Three solutions of L-HCl, M-HCl and P-HCL (300 ml, 10 mg mL-1) were prepared with 12 mM phosphate buffer in separate bottles. The resulting nine bottles were placed in a thermostatic container set to 40o C and left over weekend.
The pH of the nine solutions were adjusted to 6.5. Three PTFE plates were placed in each bottle and the starting time of the experiments was noted. A sample consisting of one PTFE plate was collected after 48, 96 and 192 hours respectively. Each sample was dipped twice in Milli-Q water and dried with a soft tissue. Samples and negative controls were then placed in separate bottles and 10 ml extraction solution consisting of 0.12 M HCl was added. The bottles were placed in a thermostatic container set to 80o C and left for 48 hours. A UV-VIS

22
measurement was performed on all samples and negative controls, using 0.12 M HCl as zero blank. The values at 263 nm for the L-HCl and M-HCl samples were noted. The values at 273 nm were noted for the P-HCl samples. For negative controls the values at 263 nm and 273 nm were noted.

23
5 Results
In the following section the results from the conducted sorption experiments on the different API : Polymer pairs are presented. The results from the sorption experiments are presented as Qm, which is the mass of sorbed API per volume polymer. Qm was used since it made the comparison of API sorption between polymeric materials easier. Curve fitting for sorption profiles were created in Microsoft Excel.
5.1 Calibration curves and system precision
Calibration curves for L-HCl, P-HCl and M-HCl are presented in Figure 9. Calibration curves were created in Microsoft Excel by plotting the mean values of the measured absorbance against solution concentration. The absorptivity was found to be 1.6079 mL mg-1 cm-1 for L- HCl, 1.8299 mL mg-1 cm-1 for P-HCl and 1.7757 mL mg-1 cm-1 for M-HCl.
A 2 1,5
1
0,5
0
Equation: y = 1,6079x - 0,0016 R² = 0,9999
0 0,2 0,4 0,6 0,8 1 1,2
Conc. (mg mL-1)
B 2
1,5
1
0,5
0
Equation: y = 1,8299x + 0,0299 R² = 0,9993
0 0,5 1 1,5
Conc. (mg mL-1)
C 2
1,5
1
0,5
0
Equation: y = 1,7757x + 0,0075 R² = 0,9999
0 0,5 1 1,5 Conc. (mg mL-1)
Figure 9. (A) Calibration curve for L-HCl. (B) Calibration curve for P-HCl. (C) Calibration curve for M-HCl. The regression coefficient were 0.9999 for L-HCl, 0.9993 for P-HCl and 0.9999 for M-HCl.
Abs.
Abs.
Abs.

24
Experimental measurements conducted for evaluation of system precisions were conducted at a concentration of 1 mg mL-1. Six replicates were used for all of three system precision tests and results are presented in Tables 4-6. Relative standard deviation (RSD) was found to be 0.4 % for L-HCl, 1.4 % for P-HCl and 0.2 % for M-HCl.
Table 4. Experimental measurements for system precision of L-HCl. System precision was tested at a concentration of 1 mg mL-1 and six replicates were used.
No. Abs.
1 1.6053
2 1.5947
3 1.5988
4 1.5883
5 1.5899
6 1.5933
Average 1.5951
RSD (%) 0.4

25
Table 5. Experimental measurements for system precision of P-HCl. System precision was tested at a concentration of 1 mg mL-1 and six replicates were used.
No. Abs.
1 1.8672
2 1.8088
3 1.8413
4 1.8714
5 1.8749
6 1.8671
Average 1.8551
RSD (%) 1.4
Table 6. Experimental measurements for system precision of L-HCl. System precision was tested at a concentration of 1 mg mL-1 and six replicates were used.
No. Abs.
1 1.7907
2 1.7880
3 1.7829
4 1.7912
5 1.7894
6 1.7920
Average 1.7890
RSD (%) 0.2

26
5.2 API sorption in silicone
The results from the individual sorption experiments of L-HCl, P-HCl and M-HCl in silicone are presented in Figures 10-12. The experimental data from the individual sorption experiments of L-HCl, P-HCl and M-HCl in silicone is presented in Appendix B:1, B:2 and B:3 respectively. The mean absorbance value for negative controls was subtracted from sample values. Samples with measured absorbance values of less than two times the average negative control were not included in the results. Sorption profiles were constructed by using the mean value of the three replicate experiments and results are presented in Figure 13. Absorbance values from UV-VIS measurements after the extra 23 hours of extraction were not included in the results, since the values did not contribute to any significant increase. Curve fitting was achieved using spline in Microsoft Excel. The results from the cross contamination test, performed during sorption of M-HCl in silicone, are presented in Table 7. The Qm values of M-HCl samples after 55 hours are compared with Qm values of cross contamination controls. Results show that an average of about 9 % of the Qm values for M- HCl samples after 55 hours were due to insufficient extraction of L-HCl.
8
7
6
5
4
3
2
1
0 0 500 1000 1500 2000 2500 3000 3500
Time (min)
Figure 10. Comparison of the three replicate sorption experiments of L-HCl in silicone.
Qm
(mg/
cm3 )

27
5
4,5
4
3,5
3
2,5
2
1,5
1
0,5
0
0 500 1000 1500 2000 2500 3000 3500
Time (min)
Figure 11. Comparison of the three replicate sorption experiments of P-HCl in silicone.
3
2,5
2
1,5
1
0,5
0 0 500 1000 1500 2000 2500 3000 3500
Time (min)
Figure 12. Comparison of the three replicate sorption experiments of M-HCl in silicone.
Qm
(mg/
cm3 )
Qm
(mg/
cm3 )

28
8
7
6
5
4 L-HCl
P-HCl 3
M-HCl
2
1
0 0 500 1000 1500 2000 2500 3000 3500
Time (min)
Figure 13. Sorption profiles for sorption of L-HCl, P-HCl and M-HCl in silicone. Table 7. Experimental data from cross contamination test during sorption experiments of M- HCl in silicone. Where M-HCl (1), (2) and (3) are the samples taken out after 55 hours of sorption for the three experimental replicates and T (1), (2) and (3) are the never before used plates that were placed in respective M-HCl sorption solution as cross contamination controls. The average contribution (AC) is the percentage of Qm values for M-HCl samples after 55 hours contributed by L-HCl.
Sample Qm (mg/cm3)
M-HCl (1) 2.78
M-HCl (2) 2.79
M-HCl (3) 2.63
T (1) 2.46
T (2) 2.64
T (3) 2.35
AC (%) 9
Qm
(mg/
cm3 )

29
5.3 API sorption in EPDM
The results from the individual sorption experiments of L-HCl, P-HCl and M-HCl in EPDM are presented in Figures 14-16. The experimental data from the individual sorption experiments of L-HCl, P-HCl and M-HCl is presented in Appendixes B:4, B:5 and B:6 respectively. The mean absorbance value for negative controls was subtracted from sample values. Samples with measured absorbance values of less than two times the average negative control were not included in the results. Sorption profiles were constructed by using the mean values of the three replicate experiments and are presented in Figure 17. Absorbance values from UV-VIS measurements after the extra 23 hours of extraction were not included in the results, since the values did not contribute to any significant increase. Curve fitting was achieved using spline in Microsoft Excel. The results from the cross contamination test, performed during sorption of M-HCl in EPDM, are presented in Table 8. The Qm values of M-HCl samples after 55 hours are compared with Qm values of cross contamination controls. Results show that an average of about 36 % of Qm values for the M-HCl samples after 55 hours were due to insufficient extraction of L-HCl.
4,5
4
3,5
3
2,5
2
1,5
1
0,5
0
0 500 1000 1500 2000 2500 3000 3500
Time (min)
Figure 14. Comparison of the three replicate sorption experiments of L-HCl in EPDM.
Qm
(mg/
cm3 )

30
4
3,5
3
2,5
2
1,5
1
0,5
0
0 500 1000 1500 2000 2500 3000 3500
Time (min)
Figure 15. Comparison of the three replicate sorption experiments of P-HCl in EPDM.
2,5
2
1,5
1
0,5
0 0 500 1000 1500 2000 2500 3000 3500
Time (min)
Figure 16. Comparison of the three replicate sorption experiments of M-HCl in EPDM.
Qm
(mg/
cm3 )
Qm
(mg/
cm3 )

31
4,5
4
3,5
3
2,5
2
1,5
1
0,5
0
0 500 1000 1500 2000 2500 3000 3500 4000
Time (min)
L-HCl
P-HCl
M-HCl
Figure 17. Sorption profiles for L-HCl, P-HCl and M-HCl in EPDM. Table 8. Experimental data from cross contamination test during sorption experiments of M- HCL in EPDM. Where M-HCl (1), (2) and (3) are the samples taken out after 55 hours of sorption for the three experimental replicates and T (1), (2) and (3) are the never before used plates that were placed in respective M-HCl sorption solution as cross contamination controls. The average contribution (AC) is the percentage of Qm values for M-HCl samples after 55 hours contributed by L-HCl.
Sample Qm (mg/cm3)
M-HCl (1) 2.05
M-HCl (2) 1.68
M-HCl (3) 2.02
T (1) 1.14
T (2) 1.16
T (3) 1.37
AC (%) 36
Qm
(mg/
cm3 )

32
5.4 API sorption in PTFE
The results from the individual sorption experiments of L-HCl, P-HCl and M-HCl in PTFE showed that every sample value, for all of the three APIs, was lower than two times the value of the average negative control. Hence, no sorption profiles are presented for the experiments in PTFE. For experimental data from the individual sorption experiments of L-HCl, P-HCl and M-HCl in PTFE, see Appendixes B:7, B:8 and B:9.
5.5 API sorption: silicone vs EPDM
The sorption profiles from sorption in silicone and EPDM are presented together for each API in Figures 18-20.
8
7
6
5
4 Silicone
3 EPDM
2
1
0 0 500 1000 1500 2000 2500 3000 3500 4000
Time (min)
Figure 18. Sorption profiles for sorption of L-HCl in EPDM and silicone.
Qm
(mg/
cm3 )

33
4,5
4
3,5
3
2,5
2
1,5
Silicone
EPDM
1
0,5
0 0 500 1000 1500 2000 2500 3000 3500 4000
Time (min)
Figure 19. Sorption profiles for sorption of P-HCl in EPDM and silicone.
3
2,5
2
1,5
1
Silicone
EPDM
0,5
0 0 500 1000 1500 2000 2500 3000 3500 4000
Time (min)
Figure 20. Sorption profiles for sorption of M-HCl in EPDM and silicone.
Qm
(mg/
cm3 )
Qm
(mg/
cm3 )

34
6 Discussion and conclusion
In the following section the results from the conducted sorption experiments on the different API : Polymer pairs are discussed. In section 6.4, Table 11, the order of API sorption between all of the investigated API : Polymer pairs is presented.
6.1 Comparison of API sorption: L-HCl, P-HCl and M-HCl in silicone
The results from the sorption experiments of L-HCl, P-HCl and M-HCl in silicone presented in Figure 13 indicates that final amounts of sorbed L-HCl is higher than for P-HCl and M- HCl. After reaching sorption equilibrium, results show that sorption of L-HCl is approximately 2.5 times greater than M-HCl and 1.8 times greater than P-HCl. The order of final amounts of sorbed API in silicone, from highest to lowest, is presented in Table 9. Since cross contamination controls indicated that there was a small contribution of L-HCl to the Qm values for M-HCl of about 9 %, it is likely that the observed Qm values for both M-HCl and P- HCl are higher than the true values. The difference between sorption of L-HCl and the other two APIs in silicone is therefore likely to be slightly greater than what is reported in this master thesis. Since no cross contamination test was conducted during sorption experiments of P-HCl it is not possible to determine the contribution of M-HCl to the P-HCl Qm values. However, since results show that sorption of M-HCl is significantly lower than sorption of L- HCl, a contribution of M-HCl to P-HCl Qm values is not considered to change the order of API sorption. It should however be noted that the difference between the sorption of P-HCl and M-HCl in silicone, reported in this master thesis, is probably less for the true values.
Table 9. Order of API sorption in silicone, from highest to lowest.
API Order of sorption
L-HCl (1)
P-HCl (2)
M-HCl (3)
The observed results from the sorption experiments with silicone indicate that the polarity of the APIs are very decisive for the order of final amounts of sorbed API. The molecular weight of the API does not seem to play a major role for the final amounts of sorbed API, in contrary to what have been shown in previous studies on sorption of different organic compounds in various polymers [5] [6]. As can be seen in Tables 1 and 9, the order of the logPo/w values for

35
the APIs are the same as the order of final amounts of sorbed API (M-HCl < P-HCl < L-HCl). It can be speculated that a higher polarity of the sorbing API results in lower amounts of sorbed API. This observation might be explained by the hydrophobic effect between the uncharged form of the API and the silicone polymer´s non-polar side chains [21]. The proposed hypothesis is that when the silicone polymer is submerged in the aqueous solution of the API, the uncharged hydrophobic form of the API will start to diffuse into the polymer. It can be argued that sorption is greater for an API with a higher logPo/w value because of the increased hydrophobicity of the uncharged form of the API.
6.2 Comparison of API sorption: L-HCl, P-HCl and M-HCl in EPDM
As for sorption in silicone, the results from the sorption experiments of L-HCl, P-HCl and M- HCl in EPDM presented in Figure 17 indicates that final amounts of sorbed L-HCl is higher than for P-HCl and M-HCl. After reaching sorption equilibrium, results show that sorption of L-HCl is approximately 2 times greater than M-HCl and 1.2 times greater than P-HCl. The order of final amounts of sorbed API in EPDM, from highest to lowest, is presented in Table 10. However, since sorption equilibrium was never reached during the time range of the EPDM sorption experiments, the Qm values for sorption equilibrium were extrapolated using spline in Microsoft Excel. Because of this approximation, the conclusions drawn regarding when sorption equilibrium occurs for the three different APIs are not to be considered certain. Hence, caution should be taken when drawing conclusions regarding which of the API that has the highest sorption in EPDM. Nonetheless, the results do show that sorption of L-HCl in EPDM is greater than sorption of both P-HCl and M-HCl in EPDM, after 55 hours.
Also, since cross contamination controls indicated that there was a significant contribution of L-HCl to the Qm values for M-HCl of about 36 %, it is likely that the observed Qm values for both M-HCl and P-HCl are significantly higher than the true values. The difference between sorption of L-HCl and the other two APIs in silicone is therefore likely to be greater than what is reported in this master thesis. Since no cross contamination test was conducted during sorption experiments of P-HCl it is not possible to determine the contribution of M-HCl to the P-HCl Qm values. Again, since results show that sorption of M-HCl is significantly lower than sorption of L-HCl, a contribution of M-HCl to P-HCl Qm values is not considered to change the order of API sorption. However, the difference between the sorption of P-HCl and M-HCl in EPDM, reported in this master thesis, is probably less for the true values.

36
Table 10. Order of API sorption in EPDM, from highest to lowest.
API Order of sorption
L-HCl (1)
P-HCl (2)
M-HCl (3)
The relationship between logPo/w values and final amounts of sorbed API is also observed for sorption in EPDM. Since EPDM is a non-polar elastomer [22], the proposed explanation for the sorption process in silicone is therefore also suggested for the sorption process in EPDM. However, since sorption equilibrium was never reached in EPDM for any of the APIs, it is possible that the sorption profiles after 55 hours might look different than the ones presented in this work. If so, other explanations for the sorption process of the APIs in EPDM might be more valid.
6.3 Comparison of API sorption for L-HCl, P-HCl and M-HCl in PTFE
Since all sample values from the sorption experiments with PTFE were found to be less than two times the average negative control, it was not possible to detect any significant sorption in PTFE for any of the three APIs. However, it cannot be concluded that no sorption of the APIs in PTFE occurred. It might have been that the volume ratio of polymer sample per extraction solution was simply too low for detection to be possible with this method. Still, the PTFE samples taken out after 192 hours were allowed to stay in sorption solution for about 3.5 times longer than the longest sorbing silicone and EPDM samples. Hence, there is strong indication that sorption of all three APIs is significantly lower in PTFE than in the other two materials. The high crystallinity of PTFE compared to both EPDM and silicone might be one explanation for the observed difference in API sorption [13]. Also, since PTFE is a fluorocarbon it is possible that the non ideal interactions observed between most fluorocarbons and hydrocarbons in aqueous solution can explain these results [23].
6.4 Comparison of API sorption for all API : Polymer pairs
The comparison of the results between sorption in silicone and EPDM indicate that sorption is higher in silicone than in EPDM for all of the investigated APIs. The order of sorption for the API : Polymer pairs, from highest to lowest, is presented in Table 11. As no sorption was visible for any of the APIs in PTFE, all three API : PTFE pairs are rated the same. Since

37
sorption equilibrium was never reached for some of the API : Polymer pairs, it should be noted that the presented order of API sorption might not show the true order of final amounts of sorbed API. It is however valid to suggest that it shows the true order of sorption for the first 55 hours.
Table 11. Order of API sorption in EPDM and silicone, from highest to lowest.
API : Polymer
Pair Order of sorption
L-HCl : Silicone (1)
P-HCl : Silicone (2)
M-HCl : Silicone (3)
L-HCl : EPDM (4)
P-HCl : EPDM (5)
M-HCl : EPDM (6)
L-HCl : PTFE (7)
P-HCl : PTFE (7)
M-HCl : PTFE (7)
One possible explanation for the observed order of API sorption in the different polymers, (PTFE < EPDM < silicone), is the great flexibility of the polymer chains of silicone rubbers compared to EPDM and PTFE which results in more free volume [21]. This is however based on the assumption that the observed order in the three different polymers is correct for the final amounts of sorbed API. If the presented order is only valid for the initial part of the sorption profiles it is also possible that a more non-polar surface of the silicone polymer, compared to the surface of the EPDM polymer, can explain the observed difference in sorption rates after 55 hours between silicone and EPDM. If the latter hypothesis is true, it is also possible that other chemical properties play a more significant role in the later part of the sorption process. This could mean that a different order of final amounts of sorbed API, than the one presented in this master thesis, is possible.

38
7 Recommendations for future work
In this section, I aim to give suggestions on how the developed method in this master thesis can be improved and used in future work. In essence, there were three crucial decisions that I made for the final sorption experiments which turned out to be reoccurring issues.
The first decision was to use the same materials in the different API sorption experiments. Because of this choice, the conclusions regarding the order of API sorption can be questioned. Since the time and resources for preparation of further material were not available to me, it was unfortunately a choice I had to make. If similar work is to be conducted in the future, a strong recommendation is to use new material for every experiment. I would also recommend that more time is spent on pre-treatment of the materials, in order to remove the leaching substances that disturbed the UV-VIS measurements as much as possible.
The second decision that I would have liked to change was the choice of using materials with different thickness and surface area. The three different variants of produced polymer plates, used during the final sorption experiments, did not have the same dimensions. I made the selection of using the volume of the polymer plates to compensate for this difference and it can therefore be argued that the presented results in this report can be incorrect. I should have put more effort in the beginning of my work to find more suitable materials for this purpose. As a future recommendation I would suggest that materials with the exact same dimensions are used.
The third and final remark I would like to comment on is the time range that I selected for the sorption experiments. I would say that this was, without any doubts, the most inconvenient issue throughout this master thesis. Since sorption equilibrium was never reached for some of the API : Polymer pairs, approximations to estimate the equilibrium Qm values were used. I would say that it is very likely that these values do not represent the true values at absorption equilibrium. The recommendation for how to solve this problem in future work is simply to conduct sorption experiments during longer time, thus enabling sorption equilibrium to be reached for all API : Polymer pairs.

39
References
[1] The International Council for Harmonisation (ICH). 2000. Q7 Good Manufacturing Practice Guidance for Active Pharmaceutical Ingredients.
[2] National Center for Biotechnolgy Information. PubChem Compound Database. https://pubchem.ncbi.nlm.nih.gov/compound/3676. (Accessed 2018-05-18).
[3] Crank, J. 1975. The mathematics of diffusion. 2. Uppl. Oxford: Oxford University Press. [4] Unnikrishnan, G., Thomas, S and Varghese, S. 1996. Sorption and diffusion of aromatic hydrocarbons through filled natural rubber. Polymer. 37(13): 2687-2693. doi: 10.1016/0032- 3861(96)87629-4.
[5] Shivaputrappa, B., Harogoppad and Aminabhavi, T M. 1991. Diffusion and Sorption of Organic Liquids through Polymer Membranes. 5. Neoprene, Styrene-Butadiene-Rubber, Ethylene-Propylene-Diene Terpolymer, and Natural Rubber versus Hydrocarbons (C8-C16). Macromolecules. 24 (9): 2598-2605. doi: 10.1021/ma00009a070.
[6] Widiastuti, I., Sbarski, I. och Masood, SH. 2016. Sorption characteristic of organic liquid and its effect on the mechanical performance of a PLA-based plastic. J. Appl. Polym. Sci. 133(20): 43250. doi: 10.1002/app.43250
[7] Randová, A., Bartovská, L., Hovorka, Š., Friess, K och Izák, P. 2009. The membranes (Nafion and LDPE) in binary liquid mixtures benzene + methanol – sorption - and swelling. European Polymer Journal 45: 2895-2901.
[8] Becker, D and Reed, K. 2006. Essentials of Local Anesthetic Pharmacology. Anesthesia progress. 53:98–109.
[9] Internal document, Galderma Uppsala. MA-2316.
[10] Internal document, Galderma Uppsala. MA-5964.
[11] Bhagavan, N.V. Ha, C. 2011. Water, Acids, Bases, and Buffers. Essentials of Medical Biochemistry. Elsevier, 9-7. E-book.
[12] Lee, R. Kim, Y. Choi, E. Choi, Y and Chung, M. 2012. Effect of warmed ropivacaine solution on onset and duration of axillary block. Korean J Anesthesiol. 62 (1): 52-56. doi.org/10.4097/Experimental Research Article kjae.2012.62.1.52.

40
[13] Sperati CA, Starkweather HW. 1961. Fluorine-containing polymers. ii. Polytetrafluoroethylene. Fortschritte Der Hochpolymeren-Forschung: Adv Polym Sci. Springer, 465–95. E-book.
[14] Shong, K. Kong, I. 2013. General Purpose Elastomers: Structure, Chemistry, Physics and Performance. P. M. Visakh et al. Advances in Elastomers I. Springer, 11-45. E-book.
[15] Ritums, J. 2004. Diffusion, Swelling and Mechanical Properties of Polymers. Diss., Kungliga Teknologiska Högskolan.
[16] Groulsa, R. Ackermana, E. Korstenb, H. Hellebrekersc, L and Breimerd, D. 1997. Partition coefficients (n-octanol/water) of N-butyl-p-aminobenzoate and other local anesthetics measured by reversed-phase high-performance liquid chromatography. Journal of Chromatography B: Biomedical Sciences and Applications. 694 (2): 421-425. doi: /10.1016/S0378-4347(97)00207-7.
[17] VWR International. VWR® Spectrophotometers, UV-Vis Scanning UV-3100PC and Vis V-3000-PC. https://us.vwr.com/store/product/12243112/vwr-spectrophotometers-uv-vis- scanning-uv-3100pc-and-vis-v-3000-pc. (Accessed 2018-05-15).
[18] Preda, G. Rogobete, A. Săndesc, D. Bedreag, O. Cradigati, C. Sarandan, M. Papurica, M. Popovici, S and Dragomirescu, M. 2016. An in vitro study of the release capacity of the local anaesthetics from siloxane matrices. Rom J Anaesth Int Care. 23 (2): 123-131. doi: 10.21454/rjaic.7518.232.vit.
[19] Kumar, B. Rajan V and Begum, N. 2012. Analytical method development and validation of lidocaine in ointment formulation by U.V spectrophotometric method. Int J Pharm Pharm Sci. 4 (2): 610-614.
[20] Cereda, C. Brunetto, G. Ribeiro de Araújo, D and de Paula, E. 2006. Liposomal formulations of prilocaine, lidocaine and mepivacaine prolong analgesic duration. Can J Anesth. 53 (11): 1092-1097.
[21] Polymer Properties Database. 2015. http://polymerdatabase.com/polymer%20classes/Silicone%20type.html. (Accessed 2018-05- 23).
[22] Polymer Properties Database. 2015. http://polymerdatabase.com/Elastomers/EPDM.html. (Accessed 2018-05-23).
[23] Mukerjee, P. 1982. Fluorocarbon-hydrocarbon interactions in interfacial and micellar systems. JAOCS. 59(12): 573-578. doi: 10.1007/BF02636327

41
Appendix A:1 – Experimental data from investigating sorption experiments (L-HCl : EPDM, 1)
Table 1. Experimental data from the first sorption experiment of L-HCl in EPDM.
Sample No. Abs. (263 nm) Mass (g)
1 0.319 2.947
2 0.828 2.827
3 0.818 2.568
4 0.974 2.356

42
Appendix A:2 – Experimental data from investigating sorption experiments (L-HCl :EPDM, 2)
Table 1. Experimental data from the second sorption experiment of L-HCl in EPDM.
Sample No. Abs. (263 nm) Mass (g)
1 0.172 2.798
2 0.374 2.762
3 0.726 2.566
4 0.947 2.599
5 1.000 2.532
6 2.234 2.548
7 1.127 2.242

43
Appendix A:3 – Experimental data for investigating sorption experiments (B-HCl : EPDM)
Table 1. Experimental data from sorption experiment of B-HCl in EPDM, Replicate 1.
Replicate 1. Sample No. Abs. (263 nm) Mass (g)
1 0.1017 1.820
2 0.1296 1.645
3 0.1252 1.635
4 0.2082 1.527
5 0.3094 1.755
6 0.3006 1.700
7 0.3277 1.666
8 0.3774 1.719
9 0.4023 1.762
10 0.4817 1.632

44
Table 2. Experimental data from sorption experiment of B-HCl in EPDM, Replicate 2.
Replicate 2. Sample No. Abs. (263 nm) Mass (g)
1 0.0986 1.652
2 0.1386 1.694
3 0.1403 1.605
4 * 1.600
5 0.2707 1.607
6 0.3246 1.691
7 0.3142 1.605
8 0.3135 1.491
9 0.4387 1.904
10 0.5538 1.900
*Missed measurement of sample Table 3. Experimental data from sorption experiment of B-HCl in EPDM, Replicate 3
. Replicate 3. Sample No. Abs. (263 nm) Mass (g)
1 0.0852 1.671
2 0.1300 1.662
3 0.1862 2.087
4 0.2870 1.794
5 0.3562 2.046
6 0.3478 1.571
7 0.4421 2.025
8 0.4202 1.832
9 0.4474 1.787
10 0.5766 1.897

45
Appendix A:4 – Experimental data from investigating sorption experiments (L-HCl : Silicone)
Table 1. Experimental data from sorption experiment of L-HCl in silicone.
Sample No. Abs. (263 nm) Mass (g)
1 * *
2 0.1220 11.547
3 0.1675 11.859
4 0.2603 11.289
5 0.2888 11.174
6 0.3144 12.023
7 0.3167 11.684
*Missed measurement of sample

46
Appendix B:1 – Experimental data from final sorption experiments (L-HCl : Silicone)
Table 1. Experimental data of negative controls from the sorption experiment of L-HCl in silicone.
Negative Control Abs. (263 nm)
Replicate 1 0.1960
Replicate 2 0.1480
Replicate 3 0.1925
Table 2. Experimental data of samples from the sorption experiment of L-HCl in silicone.
Sample No. Replicate 1
(Abs. 263 nm) Replicate 2
(Abs. 263 nm) Replicate 3
(Abs. 263 nm)
1 0.8527 0.8375 0.8534
2 1.1772 1.1122 1.0708
3 1.3184 1.2874 1.4376
4 1.4924 1.5244 1.4276
5 1.8458 1.8666 1.8196
6 2.1258 2.1280 2.1254
7 3.2412 3.3146 3.1726
8 3.6816 3.8619 3.774
9 3.7284 3.9114 3.9912
10 3.6969 3.7428 3.8124

47
Appendix B:2 – Experimental data from final sorption experiments (P-HCl : Silicone)
Table 1. Experimental data of negative controls from the sorption experiment of P-HCl in silicone.
Negative Control Abs. (273 nm)
Replicate 1 0.0452
Replicate 2 0.0433
Replicate 3 0.0435
Table 2. Experimental data of samples from the sorption experiment of P-HCl in silicone.
Sample No. Replicate 1
(Abs. 273 nm) Replicate 2
(Abs. 273 nm) Replicate 3
(Abs. 273 nm)
1 0.5542 0.5318 0.4920
2 0.7158 0.7001 0.7258
3 0.8695 0.8394 0.9257
4 1.0089 1.0298 1.0037
5 1.2635 1.2438 1.3039
6 1.4028 1.3892 1.4054
7 1.0895* 1.1231* 1.1167*
8 1.1548* 1.1901* 1.1491*
9 1.2762* 1.2935* 1.2361*
10 1.2255* 1.3077* 1.3671*
*Sample was diluted 1:2.

48
Appendix B:3 – Experimental data from final sorption experiments (M-HCl : Silicone)
Table 1. Experimental data of negative controls from the sorption experiment of M-HCl in silicone.
Negative Control Abs. (263 nm)
Replicate 1 0.0758
Replicate 2 0.0729
Replicate 3 0.0762
Table 2. Experimental data of samples from the sorption experiment of M-HCl in silicone.
Sample No. Replicate 1
(Abs. 263 nm) Replicate 2
(Abs. 263 nm) Replicate 3
(Abs. 263 nm)
1 0.2945 0.2934 0.2521
2 0.3797 0.3579 0.3477
3 0.4647 0.4608 0.4990
4 0.5022 0.5385 0.5151
5 0.6472 0.6341 0.6190
6 0.7460 0.7088 0.7067
7 1.2746 1.3429 1.2594
8 1.4492 1.4503 1.4362
9 1.5838 1.7114 1.5727
10 1.7305 1.7364 1.6400

49
Table 3. Experimental data of negative controls used for cross contamination test during sorption experiment of M-HCl in silicone.
Negative Control Abs. (263 nm)
Replicate 1 0.3375
Replicate 2 0.2921
Replicate 3 0.2598
Table 4. Experimental data of samples used for cross contamination test during sorption experiment of M-HCl in silicone.
Sample No. Abs. (263 nm)
Replicate 1 1.7619
Replicate 2 1.8657
Replicate 3 1.6933

50
Appendix B:4 – Experimental data from final sorption experiments (L-HCl : EPDM)
Table 1. Experimental data of negative controls from the sorption experiment of L-HCl in EPDM.
Negative Control Abs. (263 nm)
Replicate 1 0.1205
Replicate 2 0.0972
Replicate 3 0.0914
Table 2. Experimental data of samples from the sorption experiment of L-HCl in EPDM.
Sample No. Replicate 1
(Abs. 263 nm) Replicate 2
(Abs. 263 nm) Replicate 3
(Abs. 263 nm)
1 0.2628 0.2436 0.2562
2 0.2807 0.2996 0.2989
3 0.3216 0.3401 0.3211
4 0.3747 0.3807 0.3832
5 0.4334 0.4360 0.4267
6 0.4855 0.4898 0.4782
7 0.8913 0.8242 0.8182
8 0.9252 0.9026 0.9100
9 1.0976 1.1279 1.1426
10 1.1488 1.0920 1.0908
11 1.2145 1.1522 1.2093

51
Appendix B:5 – Experimental data from final sorption experiments (P-HCl : EPDM)
Table 1. Experimental data of negative controls from the sorption experiment of P-HCl in EPDM.
Negative Control Abs. (273 nm)
Replicate 1 0.0336
Replicate 2 0.0337
Replicate 3 0.0369
Table 2. Experimental data of samples from the sorption experiment of P-HCl in EPDM.
Sample No. Replicate 1 (Abs. 273 nm)
Replicate 2 (Abs. 273 nm)
Replicate 3 (Abs. 273 nm)
1 0.2475 0.2801 0.2702
2 0.2499 0.3047 0.3173
3 0.3344 0.3703 0.3275
4 0.4306 0.3717 0.3972
5 0.4518 0.4703 0.4787
6 0.4880 0.4984 0.4067
7 0.7788 0.7714 0.8052
8 0.8939 0.7613 0.8448
9 0.8936 1.0641 1.0718
10 1.1197 0.9733 0.9412
11 1.1120 0.9779 1.1109

52
Appendix B:6 – Experimental data from final sorption experiments (M-HCl : EPDM)
Table 1. Experimental data of negative controls from the sorption experiment of M-HCl in EPDM.
Negative Control Abs. (263 nm)
Replicate 1 0.0655
Replicate 2 0.0766
Replicate 3 0.0759
Table 2. Experimental data of samples from the sorption experiment of M-HCl in EPDM.
Sample No. Replicate 1
(Abs. 263 nm) Replicate 2
(Abs. 263 nm) Replicate 3
(Abs. 263 nm)
1 0.1776 0.2239 0.1931
2 0.1875 0.2226 0.2423
3 0.2405 0.2622 0.2353
4 0.3083 0.2489 0.2777
5 0.3087 0.3326 0.3190
6 0.3393 0.3430 0.2711
7 0.5128 0.4893 0.5073
8 0.5336 0.4541 0.5216
9 0.5470 0.5956 0.6406
10 0.6644 0.5525 0.5634
11 0.6831 0.5735 0.6739

53
Table 3. Experimental data of negative controls used for cross contamination test during sorption experiment of M-HCl in EPDM.
Negative Control Abs. (263 nm)
Replicate 1 0.1155
Replicate 2 0.1268
Replicate 3 0.1287
Table 4. Experimental data of samples used for cross contamination test during sorption experiment of M-HCl in EPDM.
Sample No. Abs. (263 nm)
Replicate 1 0.4625
Replicate 2 0.4691
Replicate 3 0.5329

54
Appendix B:7 – Experimental data from final sorption experiments (L-HCl : PTFE)
Table 1. Experimental data of samples from the sorption experiment of L-HCl in PTFE.
Sample No. Replicate 1 (Abs. 263 nm)
Replicate 2 (Abs. 263 nm)
Replicate 3 (Abs. 263 nm)
Negative control 0.0846 0.0685 0.0647
1 0.0639 0.0633 0.0704
3 0.0817 0.0967 0.0816
3 0.0957 0.1109 0.0838
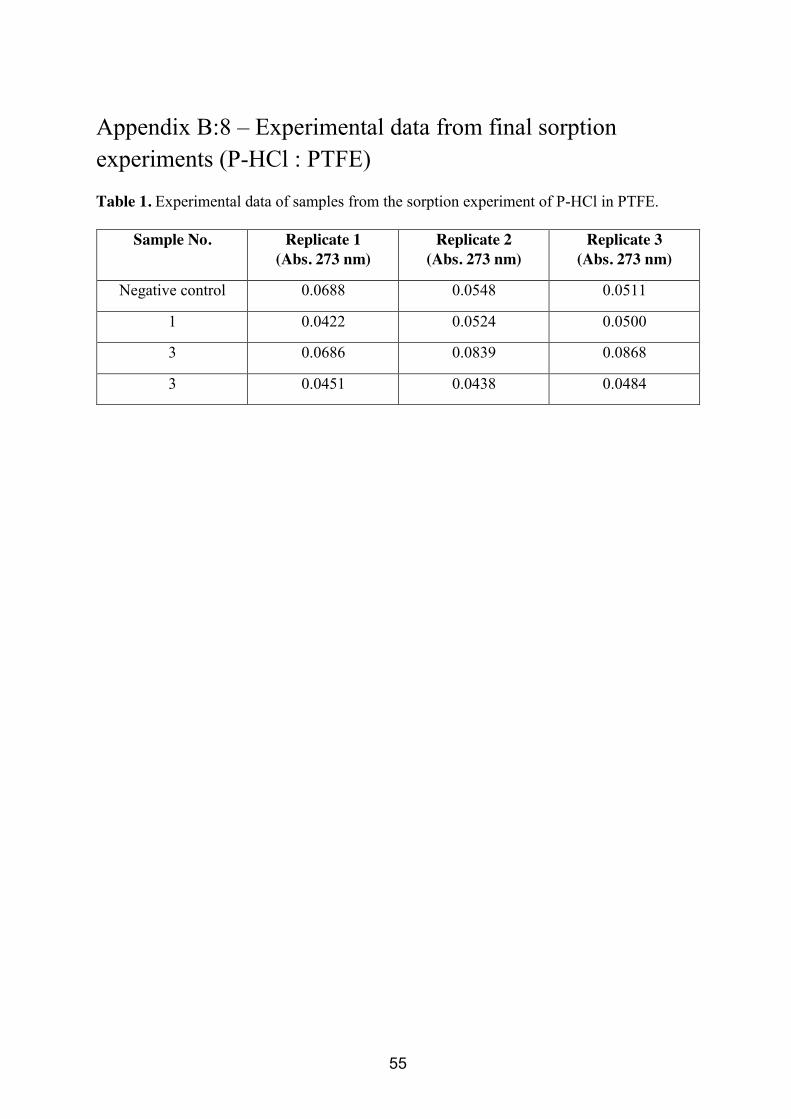
55
Appendix B:8 – Experimental data from final sorption experiments (P-HCl : PTFE)
Table 1. Experimental data of samples from the sorption experiment of P-HCl in PTFE.
Sample No. Replicate 1 (Abs. 273 nm)
Replicate 2 (Abs. 273 nm)
Replicate 3 (Abs. 273 nm)
Negative control 0.0688 0.0548 0.0511
1 0.0422 0.0524 0.0500
3 0.0686 0.0839 0.0868
3 0.0451 0.0438 0.0484

56
Appendix B:9 – Experimental data from final sorption experiments (M-HCl : PTFE)
Table 1. Experimental data of samples from the sorption experiment of M-HCl in PTFE.
Sample No. Replicate 1 (Abs. 263 nm)
Replicate 2 (Abs. 263 nm)
Replicate 3 (Abs. 263 nm)
Negative control 0.0846 0.0685 0.0647
1 0.0647 0.0613 0.0615
3 0.1097 0.0733 0.0584
3 0.0651 0.0577 0.0833