met · the absorption experiment gives the vale of powder density, p, ... m 160 gm/sec 32 al. mass...
TRANSCRIPT

ARL 72.0007JANUARY 1972
Im• Aerospace Esearclh Laboratorles
met
APPLICATION OF RADIOGRAPHIC TECHNIQUESTO STUDIES OF PARTICLE LADEN FLOW
B. N. TURMAN, IstLT, USAF
ENERGY CONVERSION RESEARCH LABORATORY
RICHARD E. PERRAJULT
SYSTEMS RESEARCH LABORATORY
DAYTON, OHIO
PRoErNO. 7116 D D\.NATIONAL T.eCHNICAL .1..INFORMATION SERVICE (_ll
Va 22131 i
ApRX.W forpm f~muc; 6M3cMC dlziibtio Baiju
AM FORCE SYSTFEMS COMMAND
United St*rl Air Pee
! -~.
- NOTICES
-ins, pmfictioi.or thr cataar us~lfor any ptrjxmw other than in
hae ornc:il. furnishved, or in any way suppliedl the saidl dIr-o-ings. sp,-cifieations. or other data. isnot to be regardect by implication or otherwise as it; any manner licensing the holdler or any otherL~rson or corporation, or conveying any rights or lxwrmission to mianufacwture. use, or sell myv patcente.1invention that may in any way he related thereto.
Agencies of the Department of Defense, qualified contractors and othiergovenrnment agencies may obtain copies from the
Defense Documentation CenterCameron StationAlexa~dria, Virginia 22314
This document has been released to the
CLEARINGHOUSEU. S. Department of CommerceSpringfield, Virginia 22151
for the sale to the public.
Ccpies of ARL Technical Documentary Repsorts shouldi notA be re-turnedl to Aerospace BerwarchLaboratories un' css return is r-equired by security consitleratiorg. confractua! oblig~ations or notices ima specificddocuiM6AL.-
AItR FORCE: 19-s-7*1300
UNCLASSIFIEDSeecinty Ctagainkatlon
DOCUMENT CONTROL DATA. R &D(SeoCW)V (0S448&1c!o4,!n of tite. body of abstrect &nd htdeRshlo wnelotath must 60 .n•tar.a when zhe ovreall report It clasillIed)
I ORIGINATING ACTIVITY (Copo~aIO aNJhor) Z0. RIEPORTr SECrVRtTlV CLASSIFICATION
Energy Conversion Research Laboratory UNCCLA tVIFI
Aerospace Research Laboratories b. CROUPWright-Patterson Air Force Base, Ohio 45433
3. RE[PORT TITLE i
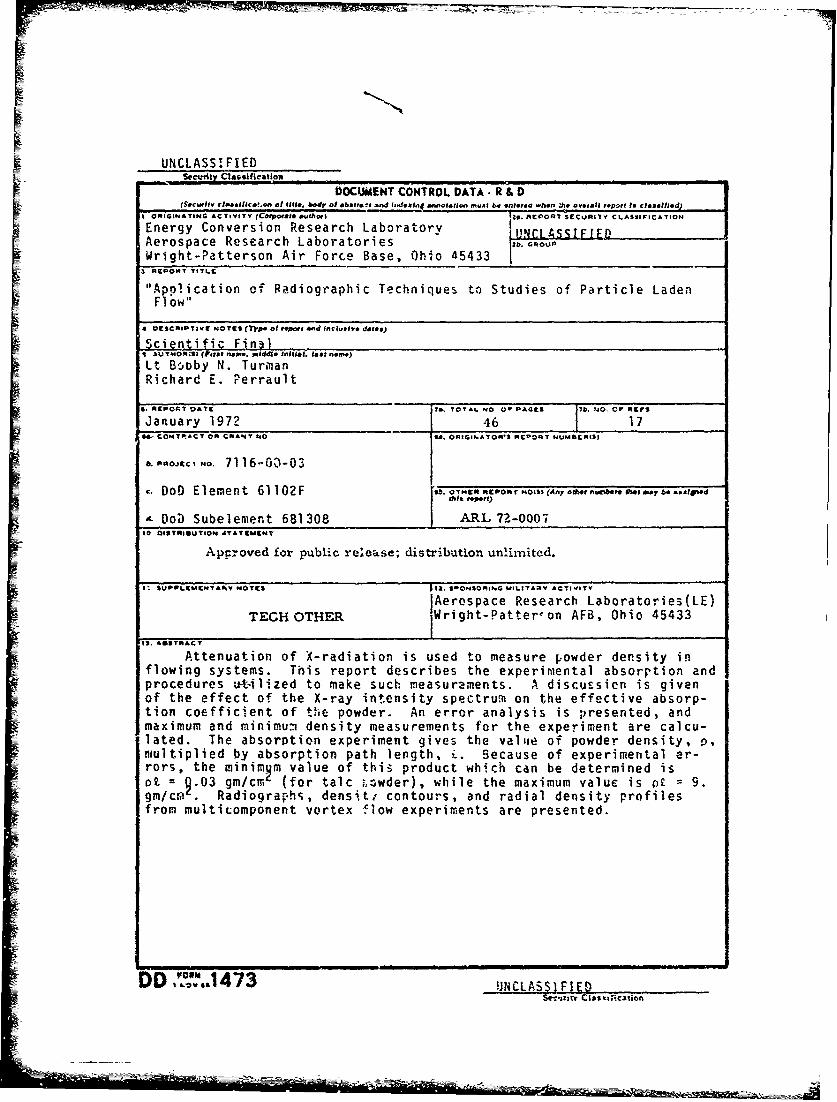
"Application of Radiographic Techniques to Studies of Particle LadenFlow"
4 OCSCXIPTtV NOTES (Type of teport ind incueiv. ddiree)
Scientific Fin3
Lt B:obby N. TurmanRichard E. Perrault
, NREPORT OATC 7I. oO rAL NO O" PACES j7b. NJO. Or ir s
January 1972 46 17W CONTRACT O0 CRANIT NO 1 ORIGINPATO0S*1 REPORT NUMSChIS)
DoD Element 61 102F 9b. OTMUR RrON T %0t1% Any o&Atnur~er " u~may b4..*fWd
SDoD Subelement 681308 ARL7-2000710 OfiSTtIIU"ION .9TATCIAZAIT
App:,oved for public release; distribution unrimited.
1' SuPPLg9CKg4 V NOTEI Ill. $SONSOI1ING MILIANtY ACT|IiTY
Aerospace Research Laboratories(LE)TECHOTHER 1Wright-Patter~on AFB, Ohio 45433
Attenuation of X-radiation is used to measure powder density inflowing systems. This report describes the experimental absorption andprocedures u-t-ilized to make such measurznments. A discussien is givenof the effect of the X-ray intensity spectrum on the effective absorp-tion coefficient of the powder. An error analysis is presented, andmaximum and minimum density measurements for the experiment are calcu-lated. The absorption experiment gives the vale of powder density, p,multiplied by absorption path length, i. Because of experimental er-rors, the minimum value of this product which can be determined iso. = 2.03 gm/cm (for talc Lowder), while the maximum value is oR = 9.gm/cn, . Radiographs, densit,' contours, and radial density profilesfrom multicomponent vortex flow experiments are presented.
DD 'tO 1473 UNCLAS
Sr ( .. r ' ~ •••¢lo
I4, LINK A LIN 0 LINK C
POLIC W? ROLE VT WT
X-aMulticomponent Flow
Flow DiagnostiAcs
*U-S.Gc 01.niIt Printi" OUMC.: 1972 - 7SM.4/4n UNCLA5S I IEDbecwity ciessificatioim

I
ARL 72.0007
APPLICATION OF RADIOGRAPHIC TECHNIQUESTO STUDIES OF PARTICLE LADEN FLOW
B. N. TURMAN
ENERGY CONVERSION RESEARCH LABORATORY
AND
RICHARD E. PERRAULT
SYSTEMS RESEARCH LABORATORY
JANUARY 1972
PROJECT 7116
Approved for publk rede•e; distribution unlimited.
AEROSPACE RESEARCH LABORA4TORiESAIR FORCE SYSTEMS COMMAN1D
UNITED STATES AIR FORCEWRIGHT-PATTERSON AIR FORCE BASE, OHIO
FOREWORD
The radiographic techniques described in this report were developed
for measurements of powder density distributions in multi-component vertex
flow. This work is part 5f the multi-component flow research program con-
ducted by the Energy Conversion Research Laboratory, under Project No.
7116.
The authors wish to thank the following people for their assistance,
advice, and consultation during the course of this work: Lt James 1.
Howard, Mr. Siegfried Hasinger, and Dr. Hans J.P. VonOhain, of Aerospace
Re!search Laboritories, and Mr. Jack Watson, Mr. 6rian HausfelG, and
Dr. Ronald Versic of Systems Research Laboratories.
ii

ABSTRACT
Attenuation of X-radiation is used to measure powcer density in
flowing systems. This report uescribes the experimertal aLsorption and
procedures utilizea to make such measurements. A discussion is given of
the effect of the X-ray intensity spectrum on the effective absorption
coefficient of the powder. An error analysis is presented, and maximum
ana minimum density measurements for the experiment are calculated. The
absorption experiment gives the value of powder density, p, multiplied by
absorption path lengtn, Z. Because of experimental errors, the minimum
value of this product whi-h can be determined is pt = 0.03 gm/cm2 (for
2talc powder), while the maximum value is p. = 9. gm/cm . Radiographs,
density contours, and radial density profiles from multicomponent vortex
flow experiments are presenteu.
iii
• , m m w m •- r • - = • r • •} • - _ -•:.•-• .

TABLE OF CONTENTS
SECTION PAGE
I INTRODUCTION l
II EXPERIMENTAL EQUIPMENT 3
III EXPERIMENTAL ANALYSIS 10
IV [EN:SITY MEASUREMENTS OF POWDER liN VORTEX FLOWS 20
V REFERENCES 33
VI APDENUIX 36
i• iv

LIST OF FIGURES
Figure Page
1. X-Ray Schematic 4
t.Experime.ntal S.tup 5
k , ode;,z omiter Schemnatic 7
aotodensitomieter Readings under "choked conuiti on 8
5. Film Density versu. Exposure Time ;5
6. Signal Variation from Photodensitoineter 16
Radiograph of Vortex Flow: 2.00 gm powder 21
8. Radiograph of Vortex Flow: 603 gm powder 22
9. RadioGraph of Vortex Chamber: No powder 23
10. Density Co.,ours: m = 160 gmi/sec, mew/ = 0.33 25
'I. Density Contours: in = 160 gin/sec, inew/n = 0.67 26
"12. Oensity Contours: m = 135 gm/sec, inme = 0.4 27ew
13. Density Cor.tours: in = 135 gm/sec, mi /m = 0.5 28
14. Dei'qi; Contours" i = 15. gm/sec, in wl/m = 0.6 29
15. Radial Profile of Density: m, = 135 gm/sec 31
16. Radial Profile of Density: m 160 gm/sec 32
Al. Mass Absorption Coefficie;t for Mg as a Functionof Wavelength 37
A2. Effect of Absorption Path Length on EffectiveAbsorption Coefficient and Intensity Spectrum 40
V
- - N2

I. INTRODUCTION
For a number of years, the Energy Conversion Laboratory has been en-
gaged in the study of multi-phase, multi-component flows, with principal
applications in the areas of dust separation devices and high power den-
sity energy sources. One of the many variables to be measured in these
experiments is particle concentration within the flow, and several tech-
niques have been proposed to meast're this quantity. One possible technique
would employ a tube inside the flow, with a suitable extraction and
monitoring systl.m to measure the density of particles at a givei, location.
This method suffers limitations at large particle density because of the
tendency of the powider to plug the probe, as well as having the problem
of flow disturbances produced by the probe. Another method of measuring
particle density in the flow is to observe attenuation of a beam of light
passing through the flow. This method is good for a limited r.ange of
particle concentration, but becomes completely useless at large particle
density. A fiber-optics probe could be devised to alleviate this problem
(by using a shorter absorption path length), but the use of a probe inside
tne flow field would stil'i present disturbance problems. An alternate
solutijn to this problem would be to use radiation which is not absorbed
as readily by the particle material. For example, the light beam could
be replaced by an X-ray beam, thus increasing the maximum measurable powder
dettsity. Through extensive experimentation, we nave shown that this X-ray
absorption technique is an effective method of measuring particle concen-
tration fn the high density range of interest here,
--- --. - -... .--

The X-ray absorption technique has been used previously in a number
of fluid dynamic experiments. Absorption of soft X-rays (about 4 kv.
energy) was used to study density profiles in supersonic gas flow
(Reference 1); detonation waves in combustible gases were studied through
X-ray absorption (Reference 2); and shock waves in water were analyzed
from soft X-ray photography (Reference 3). Rowe and Partridge (References
4, 5) showed that relatively hard X-rays (about 100 kv. energy) were
effective for photographing the bubbling process in fluidized beds. In
order to provide the sharp time resolution required to get distinct images
of rising gas bubbles in the bed, end to take sequential exposures to
determine bubble velocities, an intensifying screen and high speed movie
camera were used tt, record X-ray transmission. Very good qualitative data
was obtained: zliar) images of air bubbles in the bed were shown, and eddy
currents, particle diffusion, and mixing were clearly observable. This
method has been widely used to observe bubbling and slugging phenomena in
fluidized beds (References 6, 7). Absorption of low energy X-rays has
been used in an automatic system for determining particle size distribu-
tions by sedimentation (Reference 8).
The purpose of this report is t, show the utility of the X-ray
a,•sorptor, method for quantitative ineasurements of powder density in
.ulti-component fiews. The general experimental tochnique will be de-
scribed, as well as expected e)rors. Representative data from several
experiments will be presented to illustrete the results obtained with
t6his technique.
2

I1. EXPERIMENTAL EQUIPMENT
A schematic drawing of the X-ray system is shown in Figure 1. The
radiation source was d General Electric Model 100-15 Medical X-ray unit,
designed for general medical and dental X-ray diagnosis. Operating
voltage was variable from 40 - 100 kvp, with regulated tube currelit of
either 10 or '5 ma: typically the unit was operated at 100 kvp and 15
ma. The X-ray tube was self-rectifying, meaning that output radiation
followed a 60 cps, half-wave rectified curve. Focal spot for the tube
was 1.5 mn in diameter. Exposure time could be varied fr'om 1/60 sec to
5 sec: although this unit was not designed for high precision work,
exposure time variations were found to be less than 1%. A variable iris
diaphragm was provided to limit the X-ray field of view to the minimum
required for a given exposure, thus reducing stray scattering from
peripheral apparatus. This scattering problem was further reduced by
the use of a lead mask placed directly over the subject area. Kodak
Industrial X-ray film, type AA-2, was used to record X-ray intensity
transmitted through the subject flow. 4" x 5" sheet film, prepackaged
in lighttight paper envelope, was clamped in position on a plexiglas film
holder, as shown in Figure 1. Considerable back scatter was observed with
this arrangement, but the problen was eliminated by placing a 1/16" thick
lead sheet behind the film.
To protect personnel from hazardous stray radiation, the X-ray tube,
film, and flow experiment were all situated inside a lead-lined box. In
order to house vortex chambers with diameters of scr.e 36 inches and lengths
3

BO::
IIL c,)

cop-
IC
IC
5x

up to 50 inches, this lead box had dimeosions of approximately
73" x 49" x 38". These dimensions limited the source-to-object distance
to some 20 inches. The •oy was built from plywood covered with 1,/16"
thick lead sheet. A double thickcess of lead on the side exposed to
the direct X-ray beam insured that the direct beam was adequately
attenuated. Two small access doors were used for service adjustments
and film changes during an experiment. The complete X-ray system, set
up for observation of powder flow in a vortex chamber, is shown in
Figure 2.
The photographic film density was measured by the photodensitometer
shown schematically in Figure 3. Photographic density is defined as
the log10 of the ratio of intensity of incident light to transmitted
light through the radiograph (exposed film). These intensities were
detected by a photomultiplier tube, and indicated on the Y-axis of an
X-Y recorder. A Spectra Physics 131 He-Ne oas laser was used as the
light source. By using a laser source, a 2 mm spatial resolution was
obtained without the tedious alignment and focusing associated with
lens-aperture devices. However, there is a danger in producing con-
sistently erroneous results with the laser-photomultiplier system.
This problem arises from the high power density associated with the
laser beam, and the possibility of overloading, or choking, the pnoto-
multiplier system. The effect of photomultiplier choking is illustrated
in Figure 4. A test film was scanned under normal, non-choked, operating
conditions (photomultiplier voltage at 565 v) with the transmitted in-
tensity given by curve 1. 4*hen the photomultiplier voltage was increased6

IF-
rKLi IL
E-
N76

1.4- 3 FILTERS F FiLTER
765 v. on RM. 1765665 v.
0 565 v.
El ElID-
-.-
.8 8
31/ O
VOTAENAITIN
J* 4f
-e 2 4/5(ILMEPSRY
Fi. Potdesiomte Radng ude "hoed cndtin
¶7 Gi8

[ to some 660 v, the apparent intensity followed curve 2, the photomulti-
plier choked, indicated a decreasing intensity over a certain range, and
then gradually recovered. This erroneous curve was accurately repeatable:
therefore much care must be taken to insure that one does not unknowingly
extend the photomultiplier into this choke range. Much time was spent
with the photodensitometer, varying photomultiplier voltage and laser
beam intensity (by varying beam filter thickness) to insure tnat the
system did not choke under normal operation.
The film was mounted on a two-dimensional traverse, with manual
adjustment in tne vertical direction, and motor-driven movement in
the horizontal direction. A position transducer connected to the
X-axis of the X-Y recorder provided direct plotting of light beam
intensity as a function of horizontal position. With this arrangement,
a series of horizontal scans at various heights could be taken to
obtain two-dimensional plots of film density.
9

III. EXPERIMENTAL ANALYSIS
The Absorption Process
When an X-ray beam of intensity I passes through a thickness of
material dt, the beam intensity is decreased by an amount
-dIL = (l)zdT
where p, is the linear absorption coefficient for the material. Therefore,
the intensity of a beam which has passed through a length of material, k,
is
I = I0 exp(-vk), (2)
10 is the initial intensity of the beam. In X-ray absorption work, it is
customary to use the mass absorption rcoefficient, pm, which is the linear
absorption coefficient divided by material mass density. Equation 2 can
then be rewritten:
mp= -1 ln(I/ 10 ) (3)
When pm for a given material is known, this equation can be used to relate
X-ray beam attenuation to mass density of material. The mass absorption
coefficient for a given material is determined frcm atomic mass absorptlocyn
coefficients, which can be obtained from X-ray physics tables (see
Appendix). Equation 3 is zhe basis for our measurements of particle den-
sity in multi-component flow.
10
- - -- • .-
HanM iecondary effects can complicate this relatively simple process.
For instance, mass absorption coefficient is dependent on wavelength, and
"white" radiation (bremsstraghlung) is employed in our X-ray experiment
(that is, no attempt was rade tc limit wavelength range of radiation).
This problem is discussed in detail in the Appendix. Use of a broad,
diverging beam can also introduce errors in an absorption measurement
(Reference 9). Additional arrors may arise from small-angle scattering
(Reference 10), particularly when nonhomogeneous medium is studied
(Reference 11). In view of these complications, calibration tests were
made to determine the mass absorption coefficient for talc powder (the
powder used in flow experiments described in the next section), and
possible variations of this coefficient over the range of particle density
and beam attenuation covered in flow tests. Incident intensity and
transmitted intensity of a beam passing through a talc bed thickness of
3.0 cm was measured. From these measurements, the mass absorption
coefficient for talc was calculated as 0.71 cm2/gm (details of this
analysis are given in the Appendix). This calibration can be performed
for other powders that may be of interest in flow tests: the Appendix
lists approximate ijm values from X-ray tables for a number of materials.
Intensity Data from Photographic Film
The photographic recording technique has several advantages and
disadvantages when used for quantitative analvsis. On the posltive si0,
Sintenbity data over a wide test area can be collected quickly and
efficiently with film; time-averaged data is obtained from film, thus11

Ismoothing out statistical fluctuations in the process measured; equipment
investment is nominal; and the film data format can be directly used for
qualitative visualization of flow patterns. There is also the debit side:
at large film density, the recorded density is no longer linearly related
to X-ray exposure; sensitivity may vary from one film to the next; devel-
opment procedures must be consistent for all films; and film granularity
may produce an inherent noise level in the system. Before the photo-
graphic process can be used for accurate intensity measurements, these
problem areas must be analyzed to define proper ranges of application
and practical operating limits.
As mentioned earlier, Kodak type AA X-ray film was used for our
experiments. Our standard developing procedure was: 5 min developer,
40 sec stop bath, 5 min fixer, apd 30 min wash. Developer temperature
was at room level, 680F ± 20. According to Kodak film data (Reference 12),
this variation in temperature could give as much as 3% change in film
speed.* in normial operation, we developed some 20 films (5" x 7" area)
with one gallon of X-ray developer, with no noticeable decrease in
chemical strength.
When the photographic process is used for quantitative analjsis,
the relationship between X-ray exposure and resultant film density becomes
quite important. The tem "exposure" as used here means the product of
radiatior lnt~n:i• and ti.,e of the exposure. A commrn problem in optical
*if develclmnt time is Varied to compensate for temperature changes (assuggested in Reference 12), this film speed error can be further reduced.
12

MIT" - -bW
photography is the failure of the reciprocity law at low intensity levels
(Reference i3), which may lead to nonlinearity in the density-exposure
curve at low exposures. This effect does not occur in X-ray work, because
of the large energy associated with the X-ray photon. Therefore the
density-exposure curve for X-rays is expected to be linear for small
exposure. An experimental determination of film density as a function
of X-ray exposure (constant intensity and variable exposure time) is shown
'in Figure 5. This curve is linear up to a filmn density of about 1.5, with
the slope of the curve decreasing rapidly as density increases above 1.5.
The shape of the curve agrees well with film characteristics reported in
Reference 14. This cu:rve could be used to calibrate measured density to
relative exposure over the full range of density from 0 to 2.5 or so.
Whenever possible, is better practice to limit film density to the
linear region of the curve.
Error Analysis
Calculation of flow density from this X-ray data must follow four
principal steps: (1) measurement of light transmission through photo-
graphic film, (2) conversion of light transmission data to photographic
density, (3) comparison of exposure, E, of the attenuated and unattenuated
beams, (4) and finally application of fhe mass absorption coefficient to
obtain flow density values. Each of these steps can introduce error into
the experiment, and each step will be analyzed in this section.
The photographic density of a film is defined as
D -109glo JIjO (4)
13

_ __M
where uo is incident light beam inteniity and J is intensity of beam
after nassing through the film. As described in the preceeding section,
J and J1 were measured with a iaser-photomultiplier system. Reproduc-
ibility of intensity data was studied by making 10 scans of an X-ray
picture of a column of plastic balls (about 1/8"' diametsr balls). The
photograph of the packed bed of plastic balls made a good test subject
for intensity readings, Decause of large intensity gradients produced
by voids between spheres. Two of the ten intensity scans are shown in
FigurL, 6: these curves were chosett to show the maximum deviation observed
in the test. Intensity readings were taKea at 20 points along the scan:
standard deviation, aj, was found to be 14 of the intensity reading J.
Part of this error appeared to be a slight scale shift from one run to
the next. We anticipate that minor improvements in electronic equiprentý
such as a regulated power supply, could improve the reproducibility of
inteirsity measurements considerably.
Variations in radiographic density values recorded on successive
films were checked by making ten exposures of a calibration subject. The
calibratiop subject was a series of strips of electrical tape, with varying
thicknesses *o give sepj. Of increasing density on the exposed film.
Average standard deviation, q), over 45 reference points on the pattern,
was 2% of the recorded density. A series of radiographs of the flcw
chamber, with no air or powder flow, was also made to test film density
variation: againi the result was 2% of the recorded density. This error
is somewhat above that expected from intensity error propagation, so that
14

//
//S,,"/
525
EXOUE "TIME (go c)" ~Fig. 5 Film Density versus Ei.posure Time.
z /

- -
r�.
N
-01K)
05,.4-,0)
0
tnC0)
*00
4-,-� 0
ci.0
-I-L
'4-- C
00- -0 4-,
to
'0
toID
.0
U-
0

Ir ...
film sensitivity and film processing appear to contribute some 11 error in
this experiment.
The final step in the calculation is the determination of flow den-
sity, p, from Equation 3. The beam intensity, I, shown in Equation 3 must
be obtained from film density data. As shown in Figure 5, intensity is
linearly related to film density, U, for D 5 1.5. When film density is
below that value,+ then, Equation 3 can be expressed as
pk 1 In D/D0 (5)
Propagation of error in measuring D 3hould give about 4, variation in
tVe determination of p.'Z. The standard deviation in a series of powder
flow experiments was found to be about. 4% of the mean value. The absolute
value of pk. is determined when absorption coefficient uv,, is knA.n. ,As
described in the Appendix, calibration tests were made to obtain U m for
the powcer used in the flow expcriment. Standard deviation of those
calibration tests was also 4'a. Table 1 presents a summnry of these
experimental errors.
+If D is extended above the linear range, substantial error rIwy arisefrom D-E calibration error as jell as increased sensitivity of the calcu-lation to error in D. For that reason, we will limit our discussion tothe linear region of the D-E curve.
17

Table 1
Standard Deviations of Experimental Measurements
Light Intensity j/d ; - 01
Radiographic Density Determination oDiD = 0.02
Flow Density Calculation a /P = 0.04
The maximum and minimum powder densities that can be measured by this
process are determined by error limits. The minimum measu,-able powder
density is reached when attenuated X-rdy inte.sity is lower thal, the
unuctenuated intensity by the amount jD: that is,
S1min I In Do0-D (6)uIm DO
Since CD/D<<I, this is approximately
(P•)min __I°Pm Do(7)
With 2% standard deviation, and powder absorption coefficient of 0.7 Lt /m,
the minimum observable value of p2 is about 0.03 qm/cm The maximum
measurable powder density is somewhat more ambiguous than the previous
example. A large film density span is required: betause of nonlinearity
of the O-E curve (Figure 5), the highest film density must be limited to
scanet.hing like 2. The smallest film density that can be accurately read
is determined by measurement error in light beam intensity.
18
D~i0min Jig O~j
0.
or Drain=O0.43 ..J (8)Jo
This figure is Dmin 0.005, giving maximum powder density of
(P•)max - I In 0.005
and again using p.= 0.7 cmm/gm, (Pa)xa 9" gm/cr 2
An estimate of spatial resolution obtainable with the Kodak AA film
was made from X-ray shadowgraphs of tungsten powder. Particle sizes of
the tungsten ranged from 1 micron to mcre than 100 micron, and the par-
ticles had angular, irregular shape. An enlargement of the shadowgraph
showed very good reproduction of the jagged shapes of 100 micron tungsten
particles, but particles as small as 10 micrnns were at the limit of
distinct resolution.
19

IV. DENSITY MEASUREMENTS OF POWDER IN VORTEX FLOWS
As examples of t.a application of the X-ray absorption technique to
aerodynamic tests, density measurements of powder-laden vortex flows will
be presented. The vortex chamber is shown in Figure 2: outer radius
of the chamber was 15 cm, and the chamber was modified for axial lengths
of 6.3 cm, 12.6 cm, and 18.9 cm. As described in Refs. 15 and 16, the
purpose of measuring powder Jensities in vortex flows was to determine
both uniformity and magnitude of the density within the flow.
Positive prints of radlographs of a portion of the vortex flow near
the outer radius are shown in Figures 7 and 8. Solid black sections
of the nhotograph are vanes which make up the outer cylindrical wall
of the chamber, and also provide tangential slots for gas injection to
drive the vortex (see Figure 9). The first pbotograph shows the flow
established with 200 gm of talc powder in the chamber: the second phcto-
graph is with 600 gm powder in the chamber. The average powder density
appears to remain fairly constant, with the powder zone thickness increasing
with increased powder load. A striking feature of these photos is the
rather low density of powder at the vane. This low density region is
probably generated by the particle-free gas injection at the vane. Be-
cause of the large wall torque produced by powder flow in contact with
container surfaces, the existence of this low density region leads to
significantly larger angular velocity than had been anticipated.
Numerical calculations of powder density were possible when the
unattenuated beam intensity was determined. Figure 9 shows an X-ray20

ITC'Cj
a):4J
LU

41
0 S-w 0)4-300
0.
-c:
00__ 14.t
w'U
22

L•
0 Q)
0 1
ow
cc
IV-
E
0z
0
0**0w
23,

photograph of the vortex chamber with no flow. Radiographic density
measurement of this no-flow condition gave the required D0 needed in
Equation 5, and corresponding photographic density measurement of the
flow photograph gave D. Equation 5 was then used to calculate powder
density p. Figures 10-14 show a series of powder density centours cal-
culated by this method. Total powder load for these cases was 400 gm,
with a variety of gas injection flow rates. These contours show how
the large density islands above the injection slots are reduced as gas
flow rate through the slots, mCR, is increased relative to the flow rate
of gas injected through nozzles at a radius of 2 inches, mew. (For de-
tails, the reader should consult Reference 15. The intent of this presen-
tatien is not to describe the vortex flow, but to show the utility of the
X-ray absorption analysis).
Powder density profiles alung the chamber radius, halfway betweenthe gas injection slots, are shown in Figure 15 for a number of different
total powder loads. In Figure 16, data from three different axial chamber
lengths are presented. The profiles were expected to be similar for
constant H/k, and this did prove to be the case. The axial chamber
length, 1, is also the absorption path length, so this similarity in pro-
files indicates that the analysis is little affected by absorption length
variation.
The X-ray process may have important uses for visualizing flow
procesSes that must be contained within metal containers, for reasons of
high pressure or electrical or radiation isoiation. The X-rey beam could
24

C~C
-M*
255
ZV,3
-7-54
. ......... .
CD
4Q-i
__ LOc
Yte, M.
442
~ ~ RMi
26
7ý ýMMDM

II
00
C ~t.
ci'Q
272

WA-
Zii.--
E:
U.'
Z-n-
x- Z'3
28

510
It
2.9.n0
k MZ
29L

be transmitted through aluminv. or brass walls, with sufficier, intensity
to recori density variations within %.he internal flow.
The theoretical analysis presented here has shown that the X-ray
absorption process is capable of producing reliable, accurate density
data for multi-component flow experiments. The experimental data shown
here has verified that analysis. Qualitative photographs, such as Figures
7 and 8, have had considerable impact on our understanding and formulation
of the multi-component vortex flow. Quantitative data, such as Figures
15 and 16, have helped to test the accuracy of such formulations. Measure-
ment errors enicountered in these experiments could be substantially re-
duced by more refined procedures. The medical X-ray source used here was
n,• particularly designed for extreme accuracy, our photopraphic processing
techniques can be improved considerably, and more X-ray beam filtration
could further reduce the absorption coefficient uncertainties.
30

4-)
0)
'rnr. I. 0)
OR LL. j
cii
_.-
*~J 1
Fn
03 OD
4000
0 C>
C50
1•w:D/uwr ) d
Fig. 16 Radial Profile of Density: m 160 gm/sec
32

V. REFERENCES
1. Winkler, Eva M., "Density Measurenents in Supersonic Flow by Means of
the X-ray Absorption Method", Journal of Applied Physics, 22, 201 (1951).
2. Kistiakowsky, G. 3., and P. H. Kydd, "Gaseous Detonations IX. A Study
of the Reaction Zone by Gas Density Measurements", Journal of Chemical
Physics, 25, 824 (1956).
3. Dapoigny, J., J. Kieffer, and B. Vodar, "Some Results Relating to the
Compression of Water in a Shock Wave", C.R. Acad. Sci., 238, 215 (1954).
4. Rowe, P. N., and B. A. Partridge, "An X-ray Study of Bubbles in
Fluidized Beds", Transactions of the Institution of Chemical Engineers,
43. 157 (1965).
5. Rowe, P. N. et al, "The Mechanisms of Solids Mixing in Fluidized Beds",
Transactions of the Institution of Chemical Engineers, 43, 271 (1965).
6. Botterill, J. S. M., J. S. George, and H. Besford, "Bubble Chains in
Gas Fluidized Beds", Fluid Particle Technology (Chemical Engineering
Progress Symposium Series), 62, 7 (1966).
7. Matsen, J. M., S. Hovmand, and J. F. Davidson, "Expansion of Fluidized
Beds in Slug Flow", Chemical Engineering Science, 24, 1743 t1969).
8. Oliver, J. P., G. K. Hickin. and Clyde Orr, Jr., "Rapid, Automatic
Particle Size Analysis in the Subsieve Range", Powder Techluology, 4. 257
(1970).
S~33

I
9. Compton, Arthur H., and Samuel K. Allison, "X-Rays in Theory and
Experiments", Second Edition, D, Van Nostrand Company, Inc., New York
(1935).
It 10. Chipman, 1. R., "Mass Absorption Coefficient of Carbon for Cu Ko
Radiation", Journal of Applied Physics, 26, 1387 (1955).
11. Parratt, L. G., .). 0. Porteous, H. W. Schnopper, and T. Watanabe,
"X-ray Absorption Coefficients and Geometrical Collimation of the Beam",
Review of Scientific Instruments, 30, 344 (1959).
12. "Kodak Products for Industrial Rddiography", Eastman Kodak Company,
Rochester, New York.
13. Mees, C. 1. Kenneth, "The Theory of the Photographic Process",
MacMillan Co., New York, (1954).
14. "A Comparison of Various Coiinercially Available X-ray Films",
Acta Crystallo~raphica, 9, 520, (1956).
15. Anderson, L, A., S. Hasinger, and B. N. Turman, "Two Component Vortex
Flow Studies, with implications for the Colloid Core Nuclear Rocket Con-
cept", AIAA Paper No. 71-637, A!AA/SAE 7th Propulsion Joint Specialist
Conference, Salt Lake City, Utah, June, 1971.
16. Turman, B. •'., and S. H. Hasinger, "Experimental Flow Studies of the
Colloid Core Reactor Concept", Proceedings, 2nd Symposium on Uranium
Plasmas, Atlanta, Georgia, November 1971.
34
- --O

17. "Nuclear Data", Vol. 7, No. 6, U.S. National Bureau of Standards,
1970.
I
23
. --•--
VI. APPENDIX
The mass absorption coefficient, 1;m' for the elements is given in
any number of X-ray physics texts and handbooks, for example, References
9, 17. As explained in Reference 9, mass absorption coefficients for a
compound, p c is calculated from absorption coefficients for the component
element, px, and relative mass concentration of the element, Cx:
11c x 'x x Al
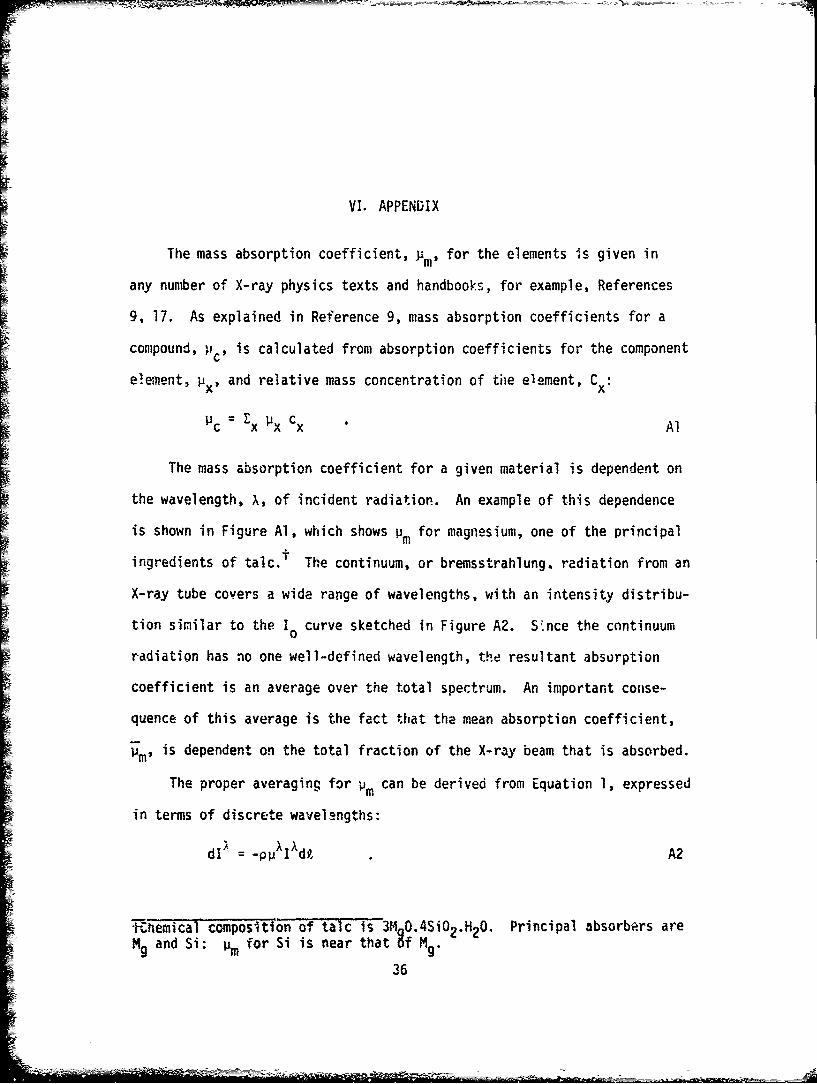
The mass absorption coefficient for a given material is dependent on
the wavelength, X, of incident radiation. An example of this dependence
is shown in Figure Al, which shows p m for magnesium, one of the principal
ingredients of talc.T The continuum, or bremsstrahlung. radiation from an
X-ray tube covers a wide range of wavelengths, with an intensity distribu-
tion similar to the 10 curve sketched in Figure A2. Since the continuum
radiation has no one well-defined wavelength, the resultant absorption
coefficient is an average over the total spectrum. An important couise-
quence of this average is the fact that the mean absorption coefficient,
is dependent on the total fraction of the X-ray beam that is absorbed.
mmThe proper averaging~ for P'm can be derived from Equation 1, expressed
in terms of discrete wavelengths:
dI = -pulI~d9k A2
tChemical composition of talc is 3M O.4SiO2.H20. Principal absorbers areMg and Si: m for Si is near that gf 1M .
9.316

lao-
18.0-
4.0-6.0-
"•E2
S4.0- / "
0000
I .. ...I... . . .. I " I I '
.2 4 B .8 1.0
Fig. Al Mass Absorption Coefficient for Mg as a Function of Wavelength
37

The total absorption experienced over length dk is
Edix = -pdkluJI X A3
Dividing both sides by I, we have
Idlt = p EIAA d , A4
which takes the form of Equation I when the mean absorption coefficimnt
is defined by
- LI2llA A5A A
Zl
The intensity I still has wavelength dependence, given by
i = oX exp(-uo) A6
where 10 is the unattenuated intensity.
The shape of the intensity distribution is therefore dependent on the
amount of absorption of the beam, through the exp(pX)function. This fact
is unsettling when put in the perspective of a density diagnostic: the
absorption coeffic'ent is ambiguously related to the density measured.
The nature and extent of this indeterminancy must be established. To
analyze the mean absorption coefficient, a somewhat oversimplified inten-
sity distribution is used. The major features of X-ray continuum distri-
bution is a well-defined minimum wavelength (Amin = 12400/V, where V is
accelerating tube voltage), a peak at approximately 1.5,Amin" and a XI
dependence at large wavelength (Reference 9). These major features are38

[ incorporated in the simplified distribution shown in Figure A2a. The
first curve is the intensity distribution with no absorption: the second
curve is with absorption arising from p2 = 0.5, and the third curve is
with pt = 5.0. As the intensity curve shifts toward lower wavelength, the
mean absorption coefficient should decrease, as shown by Figure A2b. The
inherent absorption in the X-ray tube window is shown on this figure, alon9
with experimental absorption data for talc. The absorption from tile alumi-
num window greatly reduces the spread or, effective absorption coefficient,
with measured values varying from about 0.8 to 0.6.
The experimental absorption coefficients for talc were obtained
by measuring attenuation of an X-ray bediml through a Pnown density and
absorption length of talc powder. The stanoard devi"Lion was 4% nf the
absorption coefficient value, as would be expected from the error analysis
presented in a previous section.
Table 2 gives a short compilation of absorption coefficients for
several powcer materi3ls that are of interest in portions of our multi-
component flow investigations.
39

- f-- -
G-=-='- - - = --- --
97--
• o,-
-iCm-1)
-
I
. 0
>00~
I/
-
S~Fig. A2 Effect.
of
A~bsor-pt~ion Path Length
on Effective
3" I
Absorption Coefficient and Intensity Spectrum
40

Table 2
Mass Absorption Coefficients
MassAbsorption
Density CoefficientMateril Comositiri (g/cm3) __________ _______Material Com,__osition _ Calculated(O.26A) Experimental
Talc 3Mg0,Si0 2 .H20 2.73 0.31 .71
Aluminum Oxide A12 03 3.85 0.31 .55
Aluminum PowderPlasma Spray Al 2.70 0.40 .90
Chromic Oxide Cr2 03 5.21 1.33 1.46
Tungsten W 19. 3.50
Zinc Zn 7.0 3.55
Silica S102 2.20 .35
41