about watershed assessmentcetg.weebly.com/.../3/9/7/0/39707378/1.9.15_s10_watershed_assess… ·...
TRANSCRIPT

10-1
Section 10
About Watershed Assessment
Introduction This section is an overview of the Bear River
watershed assessment. It presents water quality
goals and summarizes water quality characteristics
like natural resources, population, land and water
use, water quality, existing watershed impairments,
pollutant loading analysis, and potential future
watershed impairments.
Overview of the Bear River Watershed Watersheds delineate areas based on water flow
and direction. A watershed is defined as an area of
land where surface water from rain and melting
snow flow to a certain point, like the rim of a bowl
tipped on edge (Figure 10-1).
The United States Geological Survey has created a
tiered system of hydrologic (water) units to help
understand water flow. Each unit has a unique
hydrologic unit code (HUC), starting at the point
where water enters the oceans and moving up the
landscapes. There are six levels in the hydrologic
unit code system, identified by 2 to 12 digits:
regions, subregions, basins, subbasins, watersheds,
and subwatersheds. Table 10-1 describes the
hydrologic unit levels and their characteristics,
names, and codes.1
This document focuses on primary lakes in the Bear
River watershed. The Bear River flows into the
Flambeau River Subbasin, which flows into the
Upper Chippewa River Basin, which flows into the
Mississippi River Headwaters Region, which flows
into the Lower Mississippi River, and ultimately into
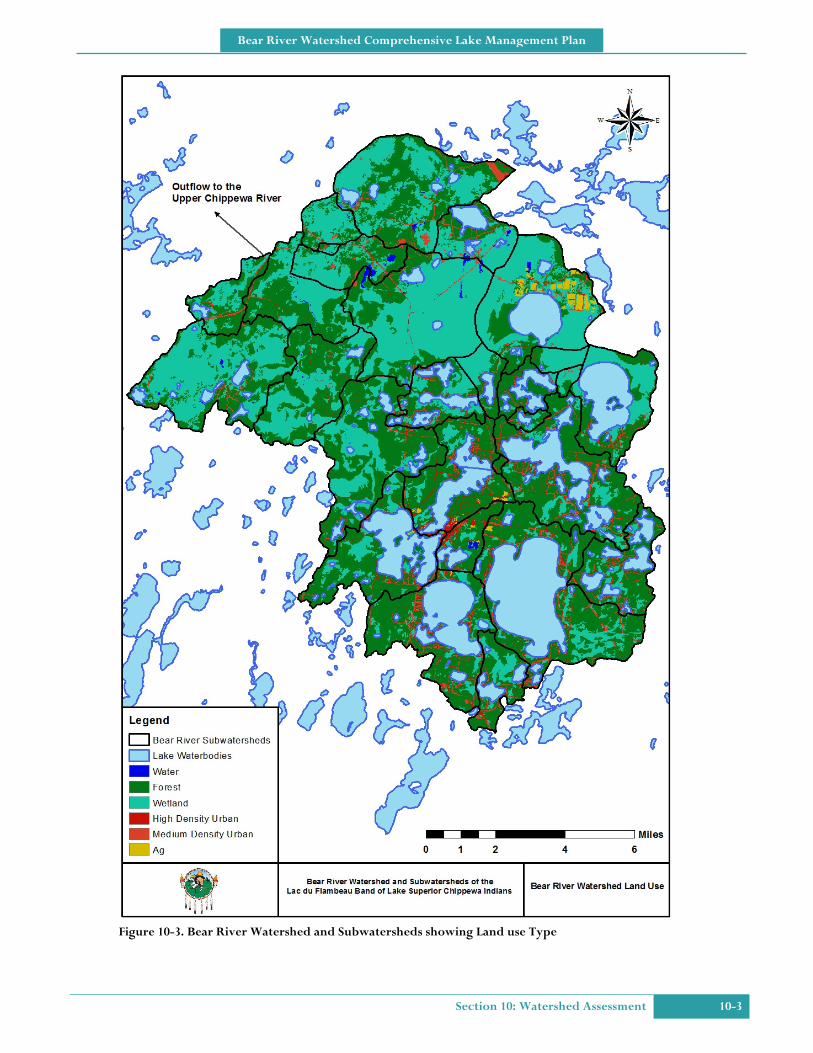
the Gulf of Mexico (See Figure 10-2). The Bear
River Watershed includes four subwatersheds, three
of which include lakes that are addressed in this
Table 10-1. Hydrologic Unit Code Classification Descriptions
Name Level Digits Average size (square miles) Relevant Name Relevant Number
Region 1 2 189,189 Mississippi River 07
Subregion 2 4 9570 Chippewa River 0705
Basin 3 6 1940 Upper Chippewa 070500
Subbasin 4 8 1178 Flambeau River 07050002
Watershed 5 10 140 Bear River 0705000202
Subwatershed 6 12 116 Multiple Lakes 070500020201
070500020202
070500020203
Figure 10-1. Conceptual Drawing of a Watershed

10-2 Section 10: Watershed Assessment
Bear River Watershed Comprehensive Lake Management Plan
document. Their 12-digit HUCs are as follows:
•••• Subwatershed 070500020201 includes Fence
Lake, Big Crawling Stone Lake, and Little
Crawling Stone Lake
•••• Subwatershed 070500020202 includes White
Sand Lake, Pokegama Lake, Moss Lake, Long
Interlaken Lake, and Flambeau Lake
•••• Subwatershed 070500020203 includes Ike
Walton Lake, and Little Trout Lake
Table 10-2 summarizes the hydrologic area and
volume for each study lake within the sub-
watersheds. These lakes were selected for study
because they are the largest lakes in the watershed
in Lac du Flambeau, associated with high use
landings, and have complete data sets required for a
lake management plan.
The majority of the Bear River Watershed is part of
the Lac du Flambeau Band of Lake Superior
Chippewa Indian Reservation, established by treaty
in 1854, and the Town of Lac du Flambeau,
established in 1900. The Tribe has undergone
Intergraded Resource Planning2, but this time it is in
cooperation with the greater community.
The ownership of land in the Bear River Watershed
is divided between Tribal Trust Land (>30%), Tribal
Allotted Land(>30%), County Land, Town Land,
State Land, Federal Land and private land owned in
fee simple.
The Bear River Watershed is in the Northern
Highland Ecological Landscape, which is
characterized by:
•••• Exceptional density of glacial kettle lakes,
•••• Large peatlands (bogs and conifer swamps);
•••• Intense development pressure along lakeshores;
•••• Former enormous pinery with important stands of
white and red pines remaining; and
•••• Very soft water lakes.
Shaped by glaciers, this area is believed to have the
third highest concentration of lakes in the world.
Native people settled here originally because the
water resources supported their subsistence lifestyle.
They gathered wild rice and berries, fished, and
hunted wildlife, practices they continue to this day.
Figure 10-2. Hydraulic Unit Nesting Configuration for Lac du Flambeau Waterbodies
Region: Mississippi
River
Subregion: Chippewa
Basin: Upper
Chippewa
Subbasin:
Flambeau River
Watershed: Bear
River
Subwatersheds:
Multiple Lakes
Section 10: Watershed Assessment 10-3
Bear River Watershed Comprehensive Lake Management Plan
Figure 10-3. Bear River Watershed and Subwatersheds showing Land use Type

10-4 Section 10: Watershed Assessment
Bear River Watershed Comprehensive Lake Management Plan
Table 10-2. Hydraulic Summary for Selected Lac du Flambeau Subwatersheds
Subwatershed HUC Number Lake Name
Lake Drainage Area in Acres
Lake Size in Acres Lake Volume
Subwatershed Stream Miles Wetland Acres
070500020201 Fence Lake 9006.57 3482.76 4.21 x10¹⁰ 5.68 895.74
Big Crawling Stone Lake 5398.50 1483.31 1.53 x10¹⁰ 5.28 410.96
Little Crawling Stone Lake 5398.50 113.30 6.65 x10⁸ 5.28 410.96
070500020202 White Sand Lake 6411.07 1180.87 9.23 x10⁹ 7.16 560.57
Moss Lake 1227.63 184.85 8.60 x10⁸ 0 109.65
Long Interlaken Lake 4742.30 379.91 4.48 x10⁹ 5.89 790.69
Pokegama Lake 4153.79 1041.39 7.61 x10⁹ 5.41 448.14
Flambeau Lake 4742.30 1165.55 1.06 x10¹⁰ 5.89 790.69
070500020203 Ike Walton Lake 3746.29 1416.63 4.62 x10⁹ 2.30 1144.86
Little Trout Lake 2989.26 1006.53 8.20 x10⁹ 3.23 1415.28
Table 10-3. Relevant Hydraulic Budget Data for Each Study Lake
Subwatershed Lake Drainage area Precipitation in/yr
(percent) Groundwater in/yr
(percent) Evaporation in/yr
(percent) Outflow in/yr (percent)
070500020201 Fence Lake 32 (63%) 15 (30%) 26 (51%) 25 (49%)
Big Crawling Stone Lake
32 (34%) 27 (29%) 26 (28%) 66 (72%)
Little Crawling Stone Lake
070500020202 White Sand Lake
Moss Lake
Long Interlaken Lake
Pokegama Lake
Flambeau Lake
070500020203 Ike Walton Lake
Little Trout Lake
Table 10-3 shows the data used for the hydraulic
budget developed by USGS3 and used in the
WILMS model to determine the Total Phosphorus
loads. Fence Lake is the only lake that is molded
differently due to the large surface area for
evaporation.
The Bear River Watershed also supports large
forests with a sustainable logging industry, and
numerous lakes that provide a variety of recreational
opportunities.
The Bear River Watershed sustains industries like
Simpson Electric and Lake of the Torches Resort
Casino, among others. Agriculture and aquaculture
such as the cranberry marshes and the Tribal Fish
Hatchery are within the Bear River Watershed.
Pollution threatens traditional and current cultural,
recreational, agri/aquaculture, and industrial water
uses. This document identifies the sources of
pollution, categorizes sectors of the economy reliant
on water resources, and suggests a plan for
balancing development with lake protection.

Section 10: Watershed Assessment 10-5
Bear River Watershed Comprehensive Lake Management Plan
Figure 10-4. Sub-basin with Flow Direction in relation to the Lac du Flambeau Indian Reservation Waters
10-6 Section 10: Watershed Assessment
Bear River Watershed Comprehensive Lake Management Plan
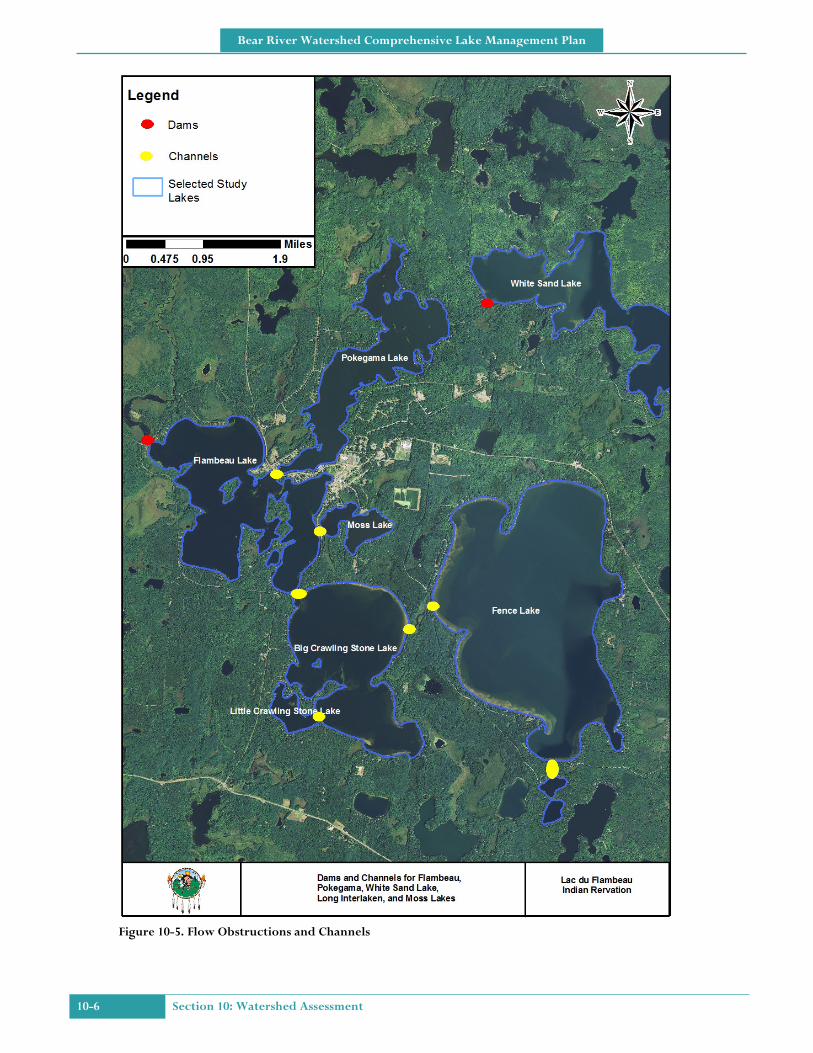
Figure 10-5. Flow Obstructions and Channels
Section 10: Watershed Assessment 10-7
Bear River Watershed Comprehensive Lake Management Plan
Overview of Water Quality Based Goal Assessments The Lac du Flambeau Tribal Natural Resources
Department has been monitoring and assessing the
water quality of numerous lakes in Lac du Flambeau,
including the ten lakes within the Bear River
Watershed, to determine the effectiveness of land use
management practices and best management
processes to achieve or maintain water quality based
goals derived from Tribal Water Quality Standards,
both narrative and numerical criteria.4
Data used in the assessment and development of the
report card/condition assessments were collected by
the Tribal Water Resource Department under a US
EPA approved LdF Tribal Quality Assurance
Protection Plan (QAPP)5, 6, 7, 8
and through the Citizen
Lake Monitoring Network (CLMN QAPP).9 Data
collected under these quality assured protocols are
then compared to water quality standards criteria to
determine if the water quality is in a condition that is
protective of Designated Uses, such as fishing,
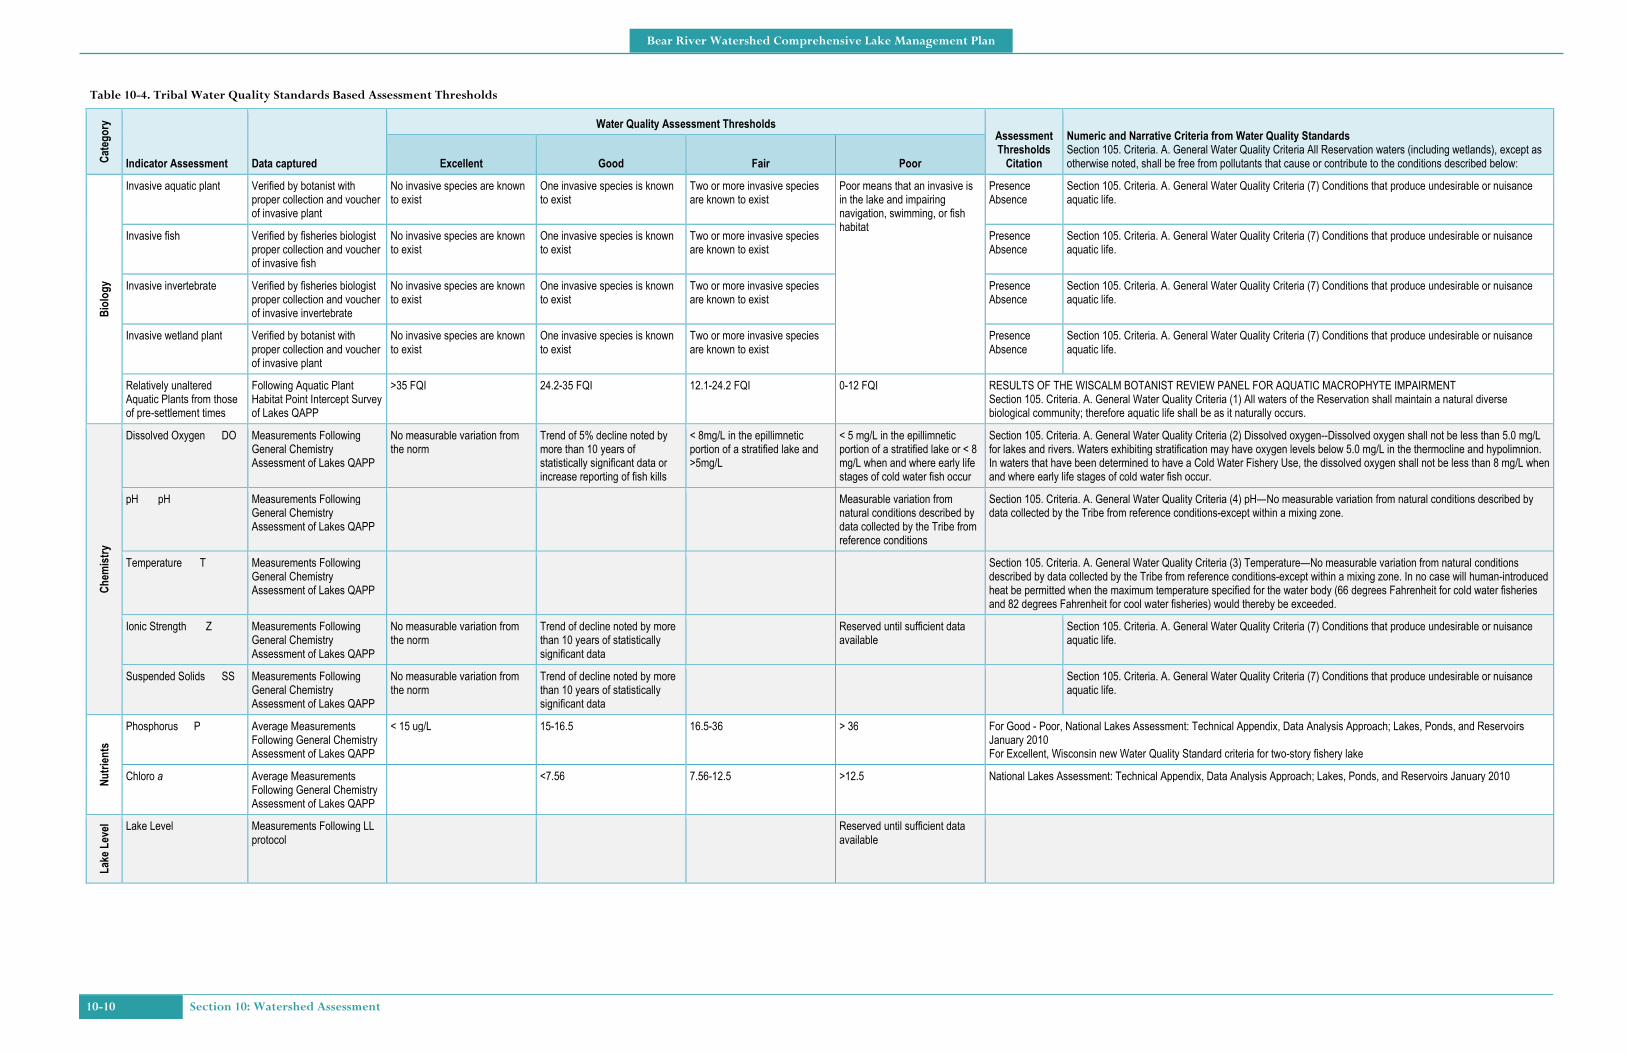
swimming, and drinking. Table 10-4 shows the
assessment thresholds which determine whether the
water quality is meeting the water quality standards
and designated uses.
Assessed waters are displayed in a report card that
represents a continuum of water condition ranging
from poor to fair to good to excellent. Only a poor
status denotes a water body not supporting a
designated use for the category. Designated uses
are defined by US EPA as specified beneficial water
uses (like fishing or swimming) to be achieved and
protected using water quality standards.10
Excellent Fully Supporting Designated Use
Good Supporting Designated Use
Fair Supporting Designated Use with Downward Trend
Poor Not Supporting Designated Use
Concern Showing Concern
NA Not Assessed in Category
General Water Condition Continuum
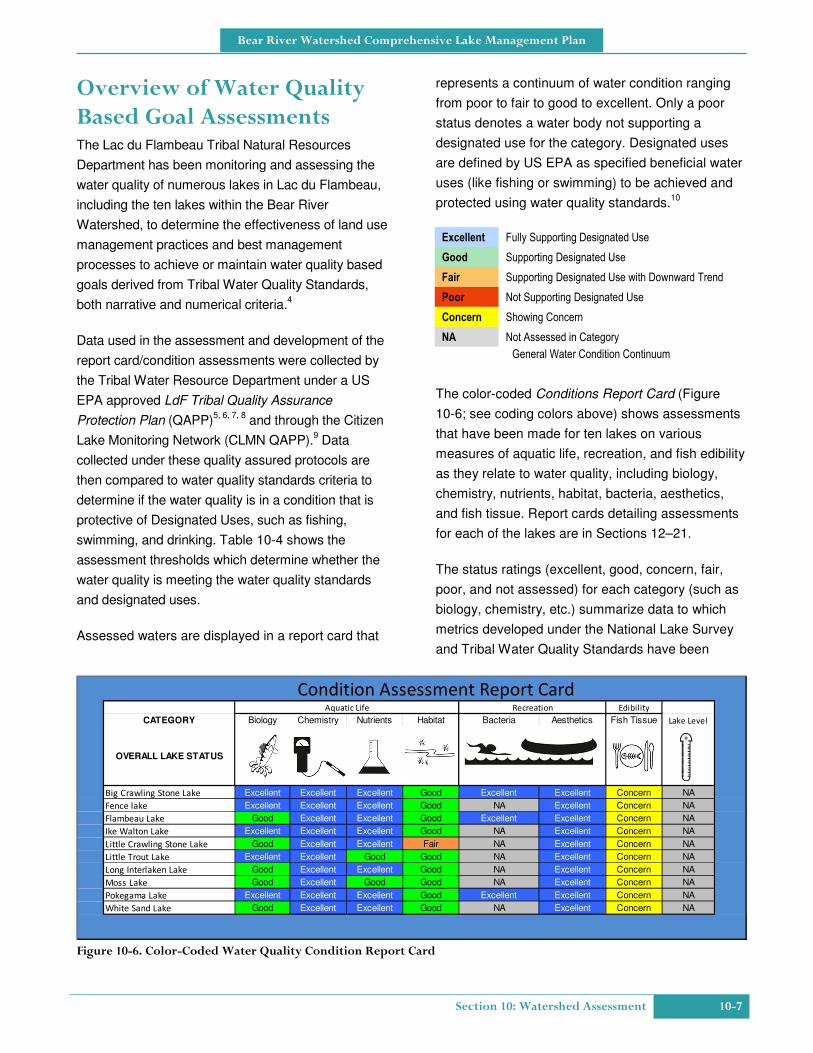
The color-coded Conditions Report Card (Figure
10-6; see coding colors above) shows assessments
that have been made for ten lakes on various
measures of aquatic life, recreation, and fish edibility
as they relate to water quality, including biology,
chemistry, nutrients, habitat, bacteria, aesthetics,
and fish tissue. Report cards detailing assessments
for each of the lakes are in Sections 12–21.
The status ratings (excellent, good, concern, fair,
poor, and not assessed) for each category (such as
biology, chemistry, etc.) summarize data to which
metrics developed under the National Lake Survey
and Tribal Water Quality Standards have been
Figure 10-6. Color-Coded Water Quality Condition Report Card
Edibility
CATEGORY Biology Chemistry Nutrients Habitat Bacteria Aesthetics Fish Tissue Lake Level
OVERALL LAKE STATUS
Big Crawling Stone Lake Excellent Excellent Excellent Good Excellent Excellent Concern NA
Fence lake Excellent Excellent Excellent Good NA Excellent Concern NA
Flambeau Lake Good Excellent Excellent Good Excellent Excellent Concern NA
Ike Walton Lake Excellent Excellent Excellent Good NA Excellent Concern NA
Little Crawling Stone Lake Good Excellent Excellent Fair NA Excellent Concern NA
Little Trout Lake Excellent Excellent Good Good NA Excellent Concern NA
Long Interlaken Lake Good Excellent Excellent Good NA Excellent Concern NA
Moss Lake Good Excellent Good Good NA Excellent Concern NA
Pokegama Lake Excellent Excellent Excellent Good Excellent Excellent Concern NA
White Sand Lake Good Excellent Excellent Good NA Excellent Concern NA
Condition Assessment Report Card Aquatic Life Recreation
10-8 Section 10: Watershed Assessment
Bear River Watershed Comprehensive Lake Management Plan
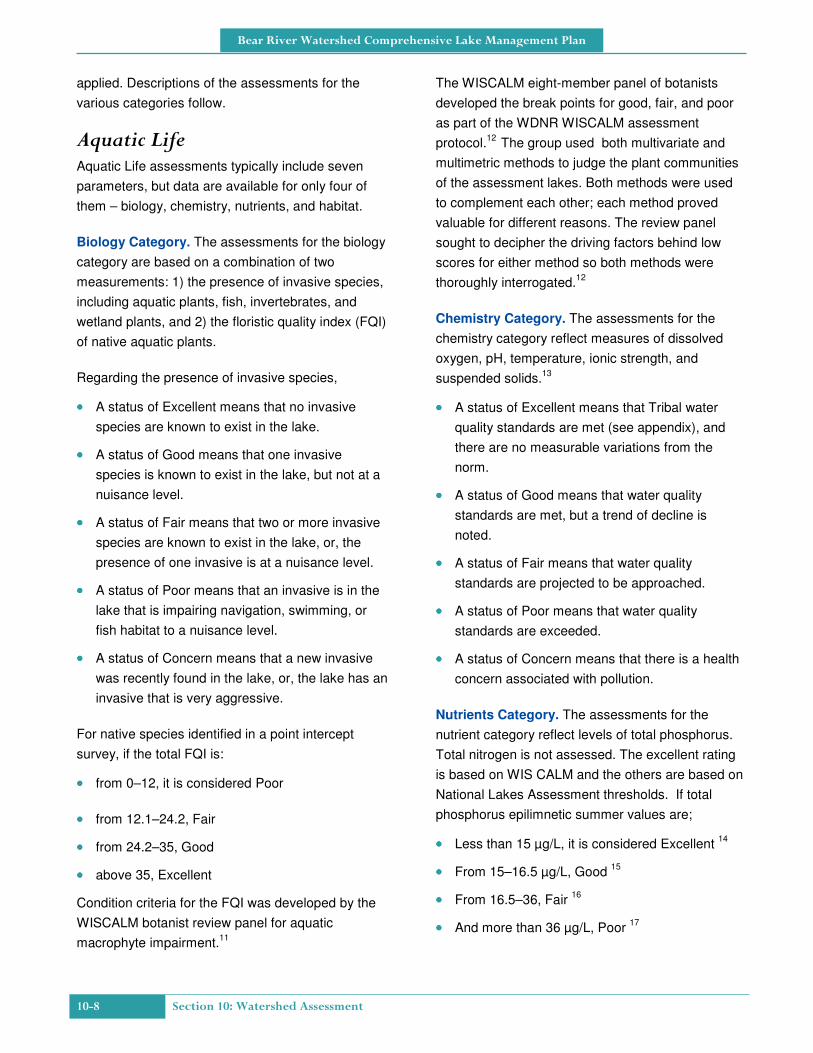
applied. Descriptions of the assessments for the
various categories follow.
Aquatic Life Aquatic Life assessments typically include seven
parameters, but data are available for only four of
them – biology, chemistry, nutrients, and habitat.
Biology Category. The assessments for the biology
category are based on a combination of two
measurements: 1) the presence of invasive species,
including aquatic plants, fish, invertebrates, and
wetland plants, and 2) the floristic quality index (FQI)
of native aquatic plants.
Regarding the presence of invasive species,
•••• A status of Excellent means that no invasive
species are known to exist in the lake.
•••• A status of Good means that one invasive
species is known to exist in the lake, but not at a
nuisance level.
•••• A status of Fair means that two or more invasive
species are known to exist in the lake, or, the
presence of one invasive is at a nuisance level.
•••• A status of Poor means that an invasive is in the
lake that is impairing navigation, swimming, or
fish habitat to a nuisance level.
•••• A status of Concern means that a new invasive
was recently found in the lake, or, the lake has an
invasive that is very aggressive.
For native species identified in a point intercept
survey, if the total FQI is:
•••• from 0–12, it is considered Poor
•••• from 12.1–24.2, Fair
•••• from 24.2–35, Good
•••• above 35, Excellent
Condition criteria for the FQI was developed by the
WISCALM botanist review panel for aquatic
macrophyte impairment.11
The WISCALM eight-member panel of botanists
developed the break points for good, fair, and poor
as part of the WDNR WISCALM assessment
protocol.12
The group used both multivariate and
multimetric methods to judge the plant communities
of the assessment lakes. Both methods were used
to complement each other; each method proved
valuable for different reasons. The review panel
sought to decipher the driving factors behind low
scores for either method so both methods were
thoroughly interrogated.12
Chemistry Category. The assessments for the
chemistry category reflect measures of dissolved
oxygen, pH, temperature, ionic strength, and
suspended solids.13
•••• A status of Excellent means that Tribal water
quality standards are met (see appendix), and
there are no measurable variations from the
norm.
•••• A status of Good means that water quality
standards are met, but a trend of decline is
noted.
•••• A status of Fair means that water quality
standards are projected to be approached.
•••• A status of Poor means that water quality
standards are exceeded.
•••• A status of Concern means that there is a health
concern associated with pollution.
Nutrients Category. The assessments for the
nutrient category reflect levels of total phosphorus.
Total nitrogen is not assessed. The excellent rating
is based on WIS CALM and the others are based on
National Lakes Assessment thresholds. If total
phosphorus epilimnetic summer values are;
•••• Less than 15 µg/L, it is considered Excellent 14
•••• From 15–16.5 µg/L, Good 15
•••• From 16.5–36, Fair 16
•••• And more than 36 µg/L, Poor 17

Section 10: Watershed Assessment 10-9
Bear River Watershed Comprehensive Lake Management Plan
For Chlorophyll a, if the values are18
:
•••• Less than 7.56 µg/L, it is considered Good
•••• From 7.56–12.5, Fair
•••• And more than 12.5 µg/L, Poor
Toxicity, sediments, and flow have not been
assessed.
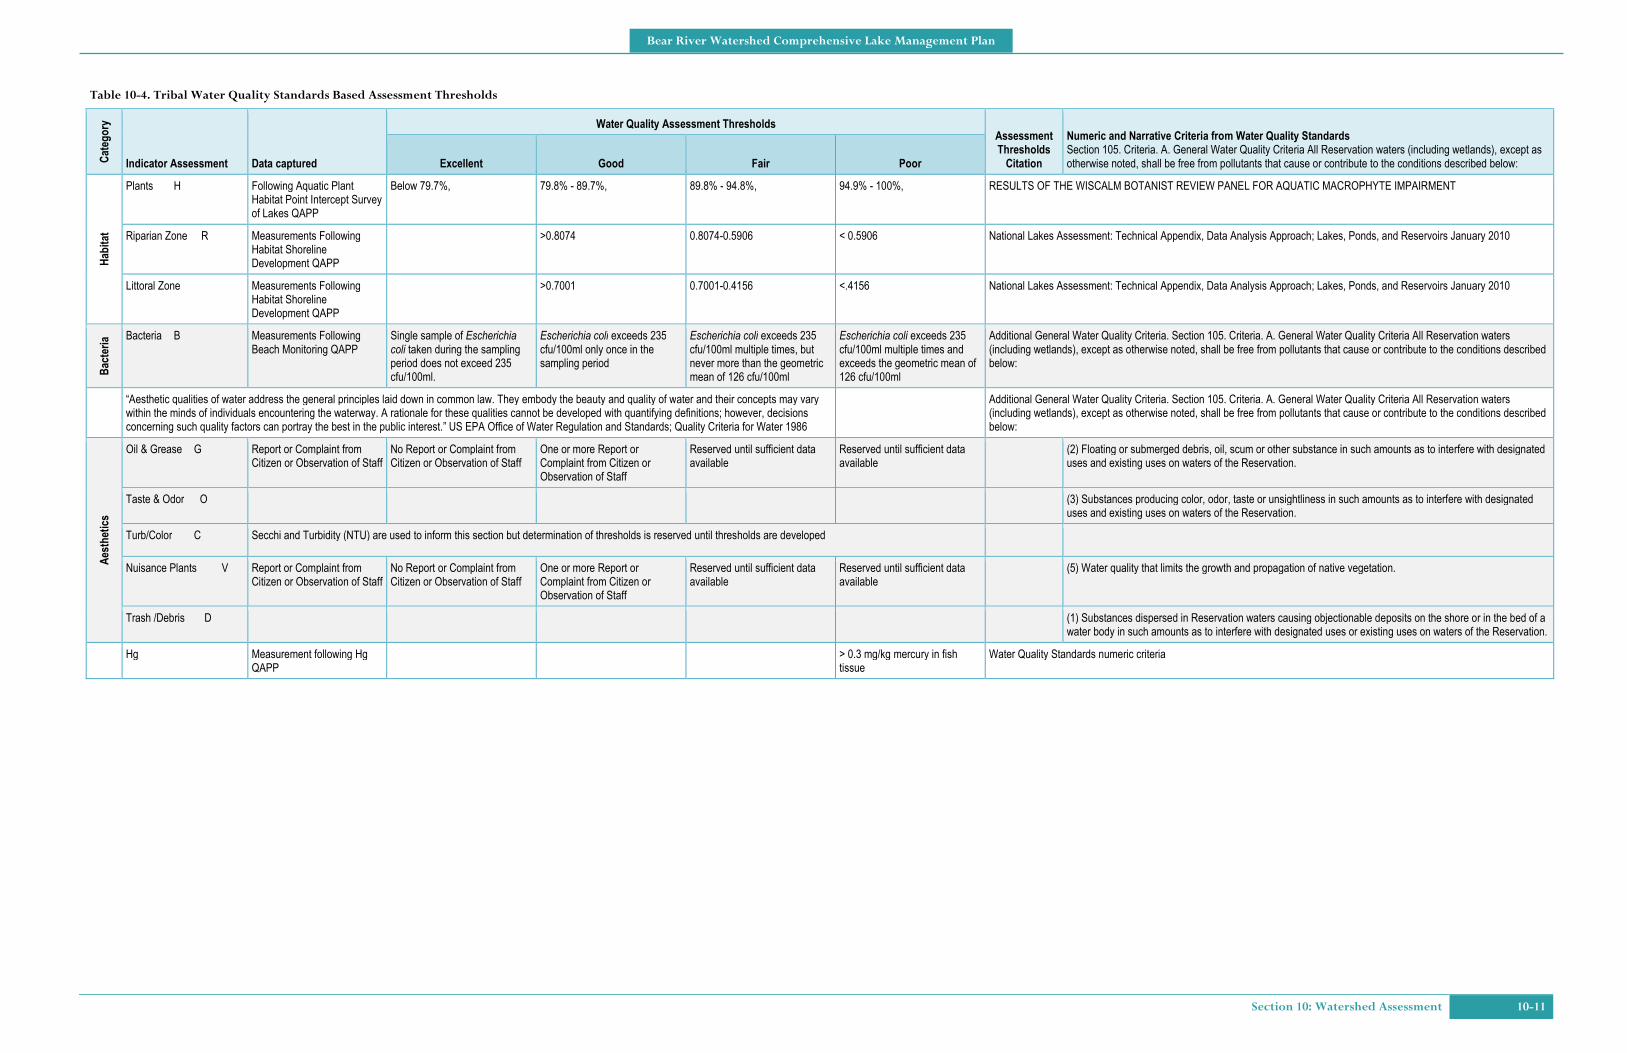
Habitat Category. The assessments within the
habitat category are based on a combination of
measures: 1) presence of aquatic plants, and
2) assessment of riparian and littoral zone.
For the presence of plants, vegetation is calculated
by dividing the number of sampling points where
plants were found by the total number of sampling
points within the littoral zone as defined by the points
equal to or shallower than the maximum depth
where plants were identified. For plants identified in
a point intercept survey19
, if the percent vegetated in
the littoral zone is
•••• Below 79.7%, it is considered Excellent
•••• from 79.8% - 89.7%, Good
•••• from 89.8% - 94.8%, Fair
•••• from 94.9% - 100%, Poor
The degree of human development in the riparian
zone and littoral zone categories are based indexes
developed under the National Lake Assessment.
Thresholds for good, fair, and poor were developed
for the Upper Mid-west Ecoregion. If the score
developed using riparian zone habitat Index20
is;
•••• Above 0.8074, it is considered Good
•••• from 0.8074 - 0.5906, Fair
•••• below 0.5906, Poor
If the score developed using littoral zone habitat
Index21
is
•••• Above 0.7001, it is considered Good
•••• from 0.7001 - 0.4156, Fair
•••• below 0.4156, Poor
Recreation Recreation includes two segments: bacteria and
aesthetics.
Bacteria Category. The assessments for the
bacteria category include measures of
bacteriological density and are assessed against
Tribal Water Quality Standards Criteria22
to protect
human health.
•••• A status of Excellent means that a single sample
of Escherichia coli taken during the sampling
period does not exceed 235 cfu/100ml.
•••• A status of Good means that a sample of
Escherichia coli exceeds 235 cfu/100ml only
once in the sampling period.
•••• A status of Fair means that a sample of
Escherichia coli exceeds 235 cfu/100ml multiple
times, but never more than the geometric mean
of 126 cfu/100ml.
•••• A status of Poor means that a sample of
Escherichia coli exceeds 235 cfu/100ml multiple
times and exceeds the geometric mean of 126
cfu/100ml.
Aesthetics Category. The Aesthetics Category
reflects an assessment of data and information on
water quality, color, and turbidity as well as an
assessment of reports received by the Tribal Natural
Resources Department on the presence of oil,
grease, nuisance aquatic plants, and trash/debris.
This information is compared to narrative criteria as
described the Water Quality in the Water Quality
Standards. A status of Excellent means no
complaints have been received. Otherwise, the
status is Good.
10-10 Section 10: Watershed Assessment
Bear River Watershed Comprehensive Lake Management Plan
Table 10-4. Tribal Water Quality Standards Based Assessment Thresholds Categ
ory
Indicator Assessment Data captured
Water Quality Assessment Thresholds Assessment Thresholds Citation
Numeric and Narrative Criteria from Water Quality Standards Section 105. Criteria. A. General Water Quality Criteria All Reservation waters (including wetlands), except as otherwise noted, shall be free from pollutants that cause or contribute to the conditions described below: Excellent Good Fair Poor
Biology
Invasive aquatic plant Verified by botanist with proper collection and voucher of invasive plant
No invasive species are known to exist
One invasive species is known to exist
Two or more invasive species are known to exist
Poor means that an invasive is in the lake and impairing navigation, swimming, or fish habitat
Presence Absence
Section 105. Criteria. A. General Water Quality Criteria (7) Conditions that produce undesirable or nuisance aquatic life.
Invasive fish Verified by fisheries biologist proper collection and voucher of invasive fish
No invasive species are known to exist
One invasive species is known to exist
Two or more invasive species are known to exist
Presence Absence
Section 105. Criteria. A. General Water Quality Criteria (7) Conditions that produce undesirable or nuisance aquatic life.
Invasive invertebrate Verified by fisheries biologist proper collection and voucher of invasive invertebrate
No invasive species are known to exist
One invasive species is known to exist
Two or more invasive species are known to exist
Presence Absence
Section 105. Criteria. A. General Water Quality Criteria (7) Conditions that produce undesirable or nuisance aquatic life.
Invasive wetland plant Verified by botanist with proper collection and voucher of invasive plant
No invasive species are known to exist
One invasive species is known to exist
Two or more invasive species are known to exist
Presence Absence
Section 105. Criteria. A. General Water Quality Criteria (7) Conditions that produce undesirable or nuisance aquatic life.
Relatively unaltered Aquatic Plants from those of pre-settlement times
Following Aquatic Plant Habitat Point Intercept Survey of Lakes QAPP
>35 FQI 24.2-35 FQI 12.1-24.2 FQI 0-12 FQI RESULTS OF THE WISCALM BOTANIST REVIEW PANEL FOR AQUATIC MACROPHYTE IMPAIRMENT Section 105. Criteria. A. General Water Quality Criteria (1) All waters of the Reservation shall maintain a natural diverse biological community; therefore aquatic life shall be as it naturally occurs.
Chem
istry
Dissolved Oxygen DO Measurements Following General Chemistry Assessment of Lakes QAPP
No measurable variation from the norm
Trend of 5% decline noted by more than 10 years of statistically significant data or increase reporting of fish kills
< 8mg/L in the epillimnetic portion of a stratified lake and >5mg/L
< 5 mg/L in the epillimnetic portion of a stratified lake or < 8 mg/L when and where early life stages of cold water fish occur
Section 105. Criteria. A. General Water Quality Criteria (2) Dissolved oxygen--Dissolved oxygen shall not be less than 5.0 mg/L for lakes and rivers. Waters exhibiting stratification may have oxygen levels below 5.0 mg/L in the thermocline and hypolimnion. In waters that have been determined to have a Cold Water Fishery Use, the dissolved oxygen shall not be less than 8 mg/L when and where early life stages of cold water fish occur.
pH pH Measurements Following General Chemistry Assessment of Lakes QAPP
Measurable variation from natural conditions described by data collected by the Tribe from reference conditions
Section 105. Criteria. A. General Water Quality Criteria (4) pH—No measurable variation from natural conditions described by data collected by the Tribe from reference conditions-except within a mixing zone.
Temperature T Measurements Following General Chemistry Assessment of Lakes QAPP
Section 105. Criteria. A. General Water Quality Criteria (3) Temperature—No measurable variation from natural conditions described by data collected by the Tribe from reference conditions-except within a mixing zone. In no case will human-introduced heat be permitted when the maximum temperature specified for the water body (66 degrees Fahrenheit for cold water fisheries and 82 degrees Fahrenheit for cool water fisheries) would thereby be exceeded.
Ionic Strength Z Measurements Following General Chemistry Assessment of Lakes QAPP
No measurable variation from the norm
Trend of decline noted by more than 10 years of statistically significant data
Reserved until sufficient data available
Section 105. Criteria. A. General Water Quality Criteria (7) Conditions that produce undesirable or nuisance aquatic life.
Suspended Solids SS Measurements Following General Chemistry Assessment of Lakes QAPP
No measurable variation from the norm
Trend of decline noted by more than 10 years of statistically significant data
Section 105. Criteria. A. General Water Quality Criteria (7) Conditions that produce undesirable or nuisance aquatic life.
Nutrients
Phosphorus P Average Measurements Following General Chemistry Assessment of Lakes QAPP
< 15 ug/L 15-16.5 16.5-36 > 36 For Good - Poor, National Lakes Assessment: Technical Appendix, Data Analysis Approach; Lakes, Ponds, and Reservoirs January 2010 For Excellent, Wisconsin new Water Quality Standard criteria for two-story fishery lake
Chloro a Average Measurements Following General Chemistry Assessment of Lakes QAPP
<7.56 7.56-12.5 >12.5 National Lakes Assessment: Technical Appendix, Data Analysis Approach; Lakes, Ponds, and Reservoirs January 2010
Lake Level
Lake Level Measurements Following LL protocol
Reserved until sufficient data available
Section 10: Watershed Assessment 10-11
Bear River Watershed Comprehensive Lake Management Plan
Table 10-4. Tribal Water Quality Standards Based Assessment Thresholds Categ
ory
Indicator Assessment Data captured
Water Quality Assessment Thresholds Assessment Thresholds Citation
Numeric and Narrative Criteria from Water Quality Standards Section 105. Criteria. A. General Water Quality Criteria All Reservation waters (including wetlands), except as otherwise noted, shall be free from pollutants that cause or contribute to the conditions described below: Excellent Good Fair Poor
Hab
itat
Plants H Following Aquatic Plant Habitat Point Intercept Survey of Lakes QAPP
Below 79.7%, 79.8% - 89.7%, 89.8% - 94.8%, 94.9% - 100%, RESULTS OF THE WISCALM BOTANIST REVIEW PANEL FOR AQUATIC MACROPHYTE IMPAIRMENT
Riparian Zone R Measurements Following Habitat Shoreline Development QAPP
>0.8074 0.8074-0.5906 < 0.5906 National Lakes Assessment: Technical Appendix, Data Analysis Approach; Lakes, Ponds, and Reservoirs January 2010
Littoral Zone Measurements Following Habitat Shoreline Development QAPP
>0.7001 0.7001-0.4156 <.4156 National Lakes Assessment: Technical Appendix, Data Analysis Approach; Lakes, Ponds, and Reservoirs January 2010
Bacteria Bacteria B Measurements Following
Beach Monitoring QAPP Single sample of Escherichia
coli taken during the sampling period does not exceed 235 cfu/100ml.
Escherichia coli exceeds 235 cfu/100ml only once in the sampling period
Escherichia coli exceeds 235 cfu/100ml multiple times, but never more than the geometric mean of 126 cfu/100ml
Escherichia coli exceeds 235 cfu/100ml multiple times and exceeds the geometric mean of 126 cfu/100ml
Additional General Water Quality Criteria. Section 105. Criteria. A. General Water Quality Criteria All Reservation waters (including wetlands), except as otherwise noted, shall be free from pollutants that cause or contribute to the conditions described below:
“Aesthetic qualities of water address the general principles laid down in common law. They embody the beauty and quality of water and their concepts may vary within the minds of individuals encountering the waterway. A rationale for these qualities cannot be developed with quantifying definitions; however, decisions concerning such quality factors can portray the best in the public interest.” US EPA Office of Water Regulation and Standards; Quality Criteria for Water 1986
Additional General Water Quality Criteria. Section 105. Criteria. A. General Water Quality Criteria All Reservation waters (including wetlands), except as otherwise noted, shall be free from pollutants that cause or contribute to the conditions described below:
Aesthetics
Oil & Grease G Report or Complaint from Citizen or Observation of Staff
No Report or Complaint from Citizen or Observation of Staff
One or more Report or Complaint from Citizen or Observation of Staff
Reserved until sufficient data available
Reserved until sufficient data available
(2) Floating or submerged debris, oil, scum or other substance in such amounts as to interfere with designated uses and existing uses on waters of the Reservation.
Taste & Odor O (3) Substances producing color, odor, taste or unsightliness in such amounts as to interfere with designated uses and existing uses on waters of the Reservation.
Turb/Color C Secchi and Turbidity (NTU) are used to inform this section but determination of thresholds is reserved until thresholds are developed
Nuisance Plants V Report or Complaint from Citizen or Observation of Staff
No Report or Complaint from Citizen or Observation of Staff
One or more Report or Complaint from Citizen or Observation of Staff
Reserved until sufficient data available
Reserved until sufficient data available
(5) Water quality that limits the growth and propagation of native vegetation.
Trash /Debris D (1) Substances dispersed in Reservation waters causing objectionable deposits on the shore or in the bed of a water body in such amounts as to interfere with designated uses or existing uses on waters of the Reservation.
Hg Measurement following Hg QAPP
> 0.3 mg/kg mercury in fish tissue
Water Quality Standards numeric criteria
10-12 Section 10: Watershed Assessment
Bear River Watershed Comprehensive Lake Management Plan
Fish Edibility Fish edibility includes one category: Fish Tissue.
Fish Tissue Category. The assessments for the
fish tissue category reflect the presence of mercury
in fish tissue. Considering the dangers associated
with mercury, all of the lakes have as assessment of
Concern. The water quality standard for mercury is
0.3mg/kg and all of the lakes, larger fish (>18
inches) have mercury >0.3mg/kg, posing a human
health risk.23
Water Quality Summary Presentation and Analysis of Data The Bear River Watershed overall is in very good
condition. The condition of Chemistry, Bacteria, and
Aesthetics for all lakes is Excellent.
The biology category, consisting of the measure of
invasive species and FQI, only has a divergence
from Excellent for the lakes with purple loosestrife
(Flambeau, Moss, and White Sand Lakes). Little
Crawling Stone Lake is the one lake that does not
have purple loosestrife but rates Good due to a
lower FQI. Little Crawling Stone Lake also has a Fair
Habitat condition due to the Riparian and Littoral
Zone assessment. The remainder of the lakes have
a Good condition in the Habitat category.
Nutrient is another category that has lakes diverging
from Excellent. Little Trout Lake Nutrient Category is
Good instead of Excellent most likely due to the
cranberry operation that is on the northern third of
the lake. Moss Lake also has a Good condition due
most likely to a combination of runoff from the
downtown area and the waste water lagoon.
Lastly Fish Tissue Category is a Concern for all
lakes as all lakes have fish with mercury
concentration in fish tissue that is higher than what
is protective for human health.
Each subwatershed has some room for
improvement yet with the level of development in the
watersheds the condition is very good.
Wisconsin Department of Natural Resources
(WDNR) developed a healthy watershed
assessment titled, Wisconsin Intergraded
Assessment of Watershed Health.24
In this
assessment they looked at the status and
vulnerability of the watershed based on existing data
intended for screening-level assessment. From the
WDNR watershed assessment HUC 70500020201
(Fence Lake Subwatershed) had an Aquatic
Ecosystem Health Index of 70.5 and a Watershed
Vulnerability Index of 59.56 (100 being best health
and most vulnerable). HUC 70500020202
(Flambeau Lake Subwatershed) and HUC
70500020203 (Little Trout) respectively has a value
for Aquatic Ecosystem Health Index of 75.63 and
48.87; and Watershed Vulnerability Index of 61.86
and 62.23. This screening-level assessment reveals
similar overall results in that the watershed is in
good health (over the 50th percentile) but has room
for improvement.
The Bear River Watershed Comprehensive Lake
Management Plan takes an in-depth, site-specific
look at the three watersheds on a lake-by-lake
subwatershed level to determine priorities for
protection and restoration. The report card reveals
that attention for restoration and protection are in
habitat/shoreline and nutrient health.
Shoreline Development Shoreline development is the primary source of local
pollution. Inappropriate or irresponsible construction
practices lead to increased erosion and
sedimentation. Increases in impervious surface
areas – coupled with decreases in natural shoreline
vegetation – contribute greatly to erosion and loss of
habitat. Increases of erosion and sedimentation lead
to the introduction of unwanted nutrients, and to
turbidity, or cloudiness of the water.

Section 10: Watershed Assessment 10-13
Bear River Watershed Comprehensive Lake Management Plan
Lakeshore residents are at times tempted to remove
aquatic vegetation and downed trees from the lake.
When this occurs, valuable habitat areas for fish and
other aquatic organisms are lost and conditions
favorable for aquatic invasive species are created.
Most soils in Lac du Flambeau are very porous and
not well suited for the treatment of septic waste,
especially near lake shorelines. Poorly treated septic
waste leads to excessive turbidity, nutrients, and
loss of habitat for native plants, fish, and wildlife.
To reduce anthropogenic nutrients and pathogen
loads – and to restore and maintain aquatic habitats
where commercial and housing developments exist
or will be developed – Tribal Water Resource
Program staff conduct site inspections on all permits
for construction near the water and recommend best
management practices (BMPs) to insure that
construction is completed according to applicable
codes and water quality standards.
Applying control and structural BMPs that provide for
stormwater runoff storage and infiltration reduces
peak flows and volume and filters pollutants, while
enhancing habitat and protecting and preserving
water quality.
The Town of Lac du Flambeau government has a
zoning ordinance for fee property within the
watershed and the Tribe regulates allotted and trust
land with a zoning and shoreline protection
ordinance.25
Enforcement of the shoreline
development code and participation in the “green
sheet” (land management/construction permits)
process helps limit pollution associated with land
development. This information is detailed in the
tribes nonpoint source pollution management plan.26
Nuisance and invasive plants may proliferate under
high nutrient conditions, especially when
exacerbated by shoreline development. Such growth
can devastate a lake ecosystem where the aquatic
plant community is the nursery for fish and other
aquatic animals, a source of oxygen for all
organisms, a refuge for prey as well as foraging area
for predators, and a buffer against erosion and
sediment from waves and shoreline runoff.
Moreover, it can significantly contribute to overall
lake productivity. Fish, especially walleye, are
extremely important to Ojibwe culture and the Lac
du Flambeau way of life, and are dependent on a
healthy aquatic plant community.
The Tribal Natural Resources Department
conducted point intercept surveys on ten lakes in the
Bear River Watershed per the Wisconsin
Department of Natural Resources point intercept
protocol as adapted by the Tribe and approved by
US EPA in the Tribal QAPP.27
When conducting the point intercept surveys, a rake
was dropped at points marked on a grid. The
distance between the points varied from 50-100 feet,
depending on lake size (see attachments). The
plants brought up on the rake were assessed for
abundance on a 0-3 scale. The substrates were
identified as muck, sand, or rock, and lake depths
were also recorded. The data were then compiled
and transferred to maps which display the most
dominant plant species, plant types (emergent,
submerged, floating leaf plants), and substrates.
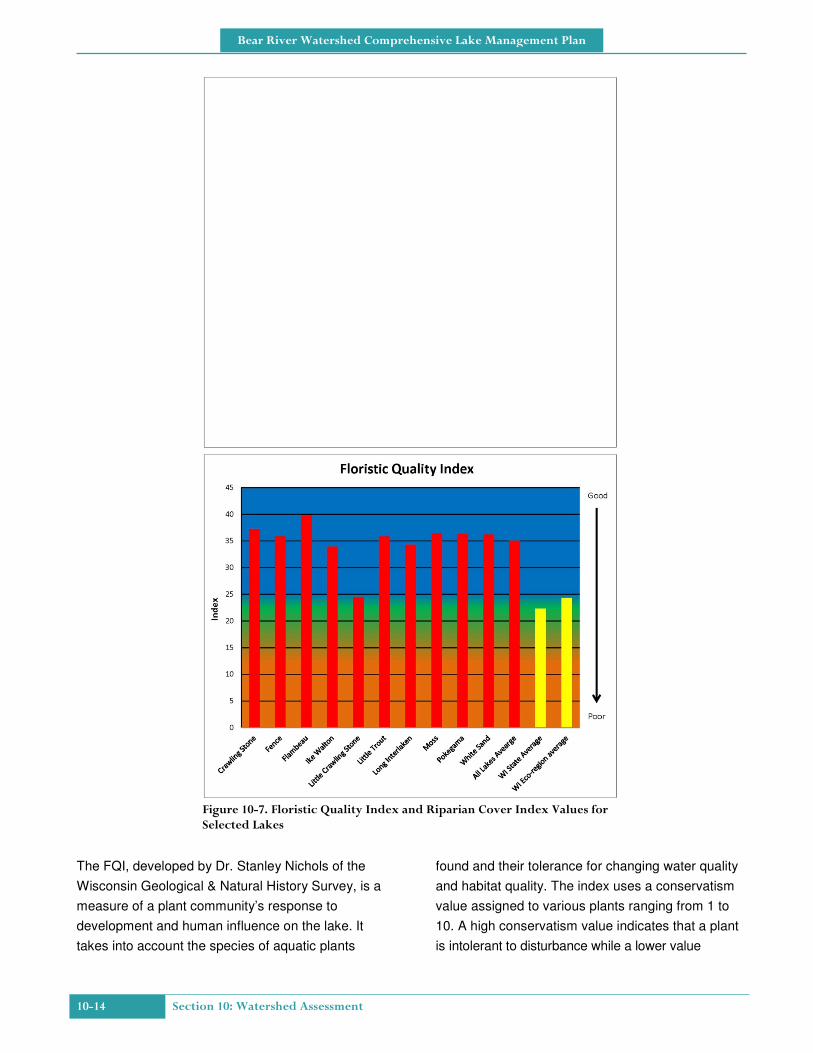
Floristic quality index values, described in Section 8,
were established during the plant surveys. Those
values and values for the riparian cover index
(developed under the National Lake Survey) are
shown in Figure 10-7.
10-14 Section 10: Watershed Assessment
Bear River Watershed Comprehensive Lake Management Plan
The FQI, developed by Dr. Stanley Nichols of the
Wisconsin Geological & Natural History Survey, is a
measure of a plant community’s response to
development and human influence on the lake. It
takes into account the species of aquatic plants
found and their tolerance for changing water quality
and habitat quality. The index uses a conservatism
value assigned to various plants ranging from 1 to
10. A high conservatism value indicates that a plant
is intolerant to disturbance while a lower value
Figure 10-7. Floristic Quality Index and Riparian Cover Index Values for Selected Lakes

Section 10: Watershed Assessment 10-15
Bear River Watershed Comprehensive Lake Management Plan
indicates tolerance. Therefore, a higher FQI
indicates a healthier aquatic plant community. Those
plants with higher values are less apt to tolerate
water quality and habitat changes due to human
influence.
The riparian cover index is calculated using the
National Lake Survey Habitat Assessment method
developed28
by US EPA. In the riparian cover index,
high values equate with greater riparian cover along
the shoreline. The values present in Figure 10-7 for
riparian cover have been normalized by a
multiplication of 40 so the indices can be placed on
the same scale.
The FQI (health of rooted water plants) and riparian
cover index (health of shoreline plants) are similar
for the lakes in the Bear River Watershed with the
exception of Little Crawling Stone Lake, which has a
greater degree of development, considering its size.
Simpson’s diversity index is a measure of diversity in
a lake’s plant community. (See Figure 10-8). This
value can be from 0 to 1.0; the greater the value, the
more diversity in a lake’s plant community. Diversity
in a lake’s plant community is related directly to the
resiliency of the lake’s overall ecosystem. Figure
10-7 and Figure 10-8 show that aquatic plant
distribution among lakes is fairly consistent and
above the average for the eco-region, with the
exception of Little Crawling Stone Lake.
The Lac du Flambeau Tribal Water Resource
Program monitors lakes for pH, temperature, ionic
strength, turbidity, dissolved oxygen, total
phosphorus, total nitrogen, Chlorophyll a, turbidity,
mercury in fish tissue, and aquatic plant habitat.
Also, three beaches on the chain of lakes are
monitored weekly for E. coli, and seven lakes for
aquatic plant habitat and substrate.
E. coli samples were collected by Tribal water staff
from public swimming beaches in the Bear River
watershed and analyzed by the Vilas County Health
Department certified laboratory. Data have been
collected, managed and interpreted using calibrated
equipment, statistical analysis, and QA/QC
procedures outlined in the beach monitoring
QAPP.29
Figure 10-8. Simpson’s Diversity Index Scores
10-16 Section 10: Watershed Assessment
Bear River Watershed Comprehensive Lake Management Plan
The Wisconsin’s Citizen Lake Monitoring Network
(CLMN) measures Secchi Depth on many of the
lakes as well as water temperature, dissolved oxygen,
total phosphorus, and Chlorophyll a . Data are
compared to the Tribal water quality standards, land
use data, and data for other waters in the same
ecoregion to determine health of the lakes and
sources of stressors. The data are summarized in the
report cards of lake health (Figure 10-6).
Figure 10-9 illustrates a comparison between
phosphorus and average number of aquatic plant
species per vegetated site. It shows that total lake
phosphorus is likely to influence the number of
plants at suitable depth for rooted vegetation.
Comparisons can also be made between habitat
and the macrophytes, fish, and other aquatic biota.
Human disturbance is measured following the
National Aquatic Resource Survey lakes protocol30
by noting the presence or absence of buildings,
parks, beaches, docks, boats, walls, dikes or
revetments, landfills, trash, roads, power lines, row
crops, pastures, ranges, hayfields, orchards, and
lawns that are within or in sight of the survey plots.
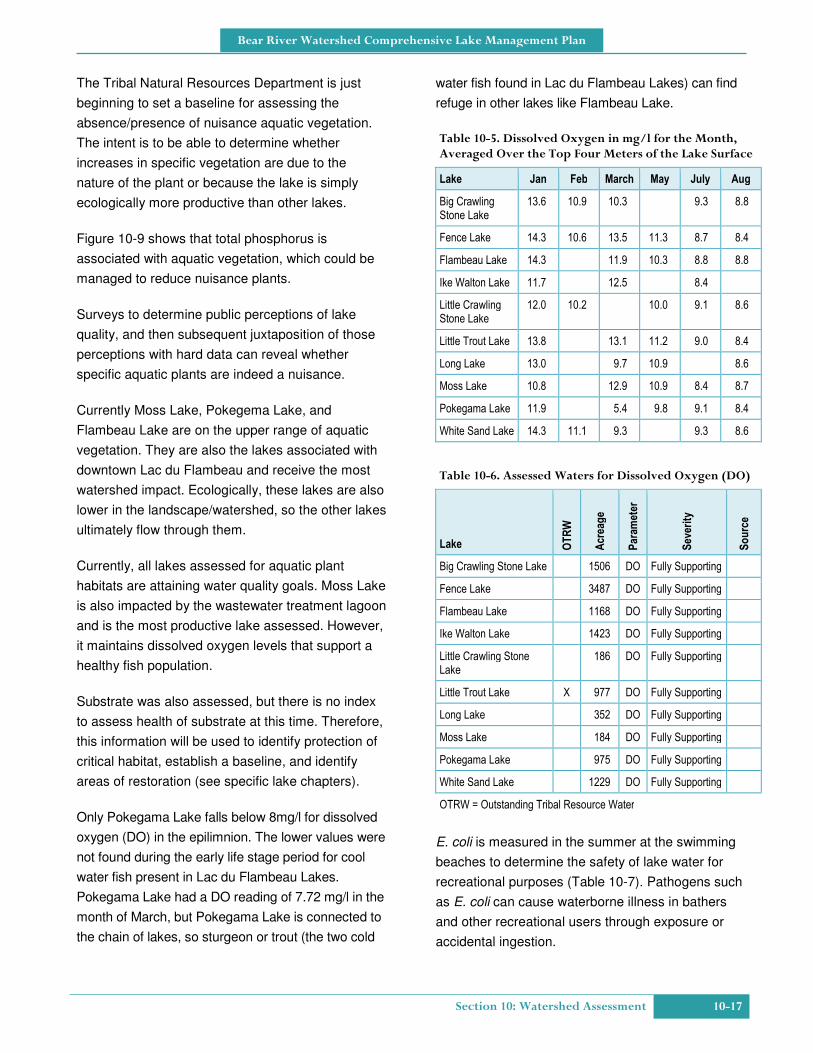
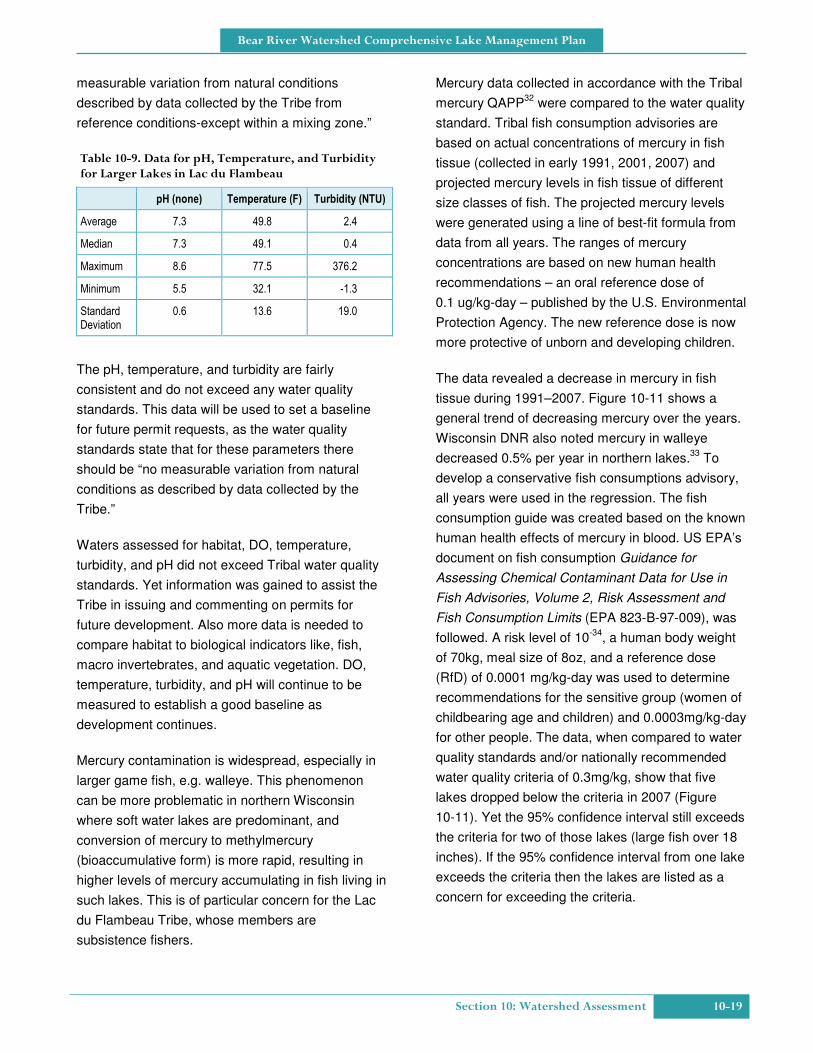
The Tribal water quality standards include narrative
standards on the absence of nuisance aquatic
vegetation. Figure 10-10 implies that people are less
likely to invest in use of the lake by placing
structures close to lakes with more vegetation.
Figure 10-9. Comparison of Photic Zone Vegetation and Total Average Phosphorus for Selected Lakes
Figure 10-10. Comparison of Vegetated Sites vs the National Lake Survey Human Disturbance Index
Section 10: Watershed Assessment 10-17
Bear River Watershed Comprehensive Lake Management Plan
The Tribal Natural Resources Department is just
beginning to set a baseline for assessing the
absence/presence of nuisance aquatic vegetation.
The intent is to be able to determine whether
increases in specific vegetation are due to the
nature of the plant or because the lake is simply
ecologically more productive than other lakes.
Figure 10-9 shows that total phosphorus is
associated with aquatic vegetation, which could be
managed to reduce nuisance plants.
Surveys to determine public perceptions of lake
quality, and then subsequent juxtaposition of those
perceptions with hard data can reveal whether
specific aquatic plants are indeed a nuisance.
Currently Moss Lake, Pokegema Lake, and
Flambeau Lake are on the upper range of aquatic
vegetation. They are also the lakes associated with
downtown Lac du Flambeau and receive the most
watershed impact. Ecologically, these lakes are also
lower in the landscape/watershed, so the other lakes
ultimately flow through them.
Currently, all lakes assessed for aquatic plant
habitats are attaining water quality goals. Moss Lake
is also impacted by the wastewater treatment lagoon
and is the most productive lake assessed. However,
it maintains dissolved oxygen levels that support a
healthy fish population.
Substrate was also assessed, but there is no index
to assess health of substrate at this time. Therefore,
this information will be used to identify protection of
critical habitat, establish a baseline, and identify
areas of restoration (see specific lake chapters).
Only Pokegama Lake falls below 8mg/l for dissolved
oxygen (DO) in the epilimnion. The lower values were
not found during the early life stage period for cool
water fish present in Lac du Flambeau Lakes.
Pokegama Lake had a DO reading of 7.72 mg/l in the
month of March, but Pokegama Lake is connected to
the chain of lakes, so sturgeon or trout (the two cold
water fish found in Lac du Flambeau Lakes) can find
refuge in other lakes like Flambeau Lake.
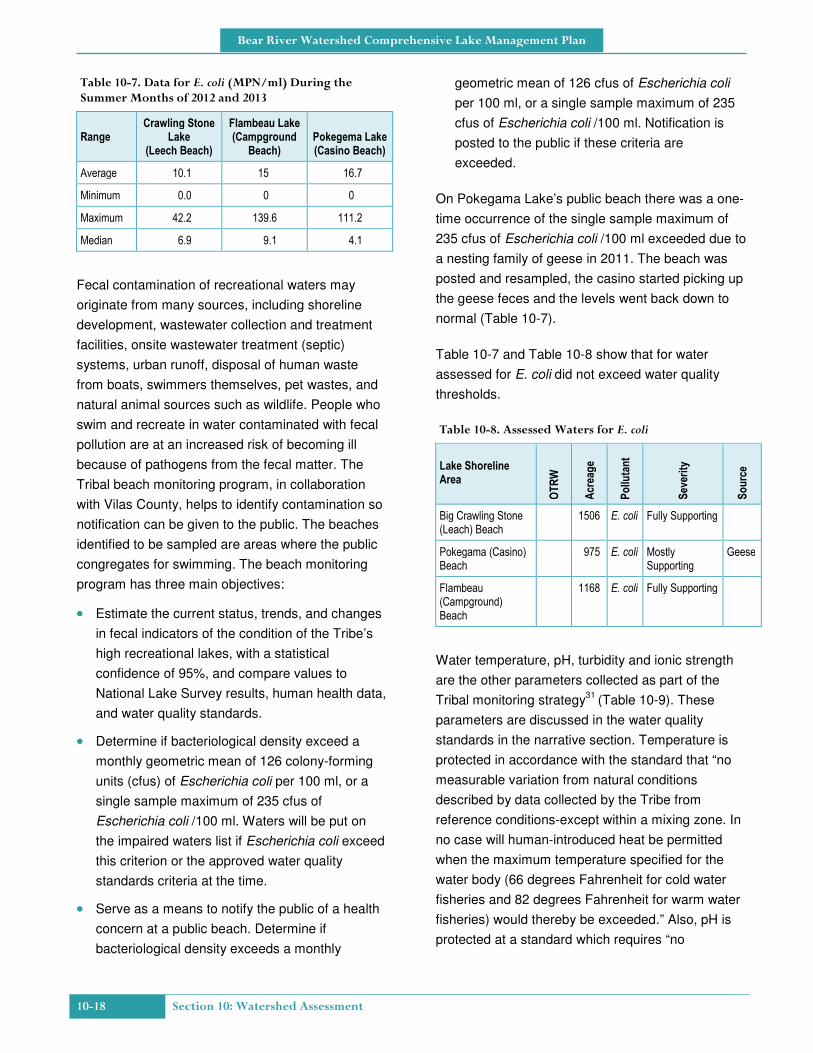
Table 10-5. Dissolved Oxygen in mg/l for the Month, Averaged Over the Top Four Meters of the Lake Surface
Lake Jan Feb March May July Aug
Big Crawling Stone Lake
13.6 10.9 10.3 9.3 8.8
Fence Lake 14.3 10.6 13.5 11.3 8.7 8.4
Flambeau Lake 14.3 11.9 10.3 8.8 8.8
Ike Walton Lake 11.7 12.5 8.4
Little Crawling Stone Lake
12.0 10.2 10.0 9.1 8.6
Little Trout Lake 13.8 13.1 11.2 9.0 8.4
Long Lake 13.0 9.7 10.9 8.6
Moss Lake 10.8 12.9 10.9 8.4 8.7
Pokegama Lake 11.9 5.4 9.8 9.1 8.4
White Sand Lake 14.3 11.1 9.3 9.3 8.6
Table 10-6. Assessed Waters for Dissolved Oxygen (DO)
Lake OTRW
Acreage
Param
eter
Severity
Source
Big Crawling Stone Lake 1506 DO Fully Supporting
Fence Lake 3487 DO Fully Supporting
Flambeau Lake 1168 DO Fully Supporting
Ike Walton Lake 1423 DO Fully Supporting
Little Crawling Stone Lake
186 DO Fully Supporting
Little Trout Lake X 977 DO Fully Supporting
Long Lake 352 DO Fully Supporting
Moss Lake 184 DO Fully Supporting
Pokegama Lake 975 DO Fully Supporting
White Sand Lake 1229 DO Fully Supporting
OTRW = Outstanding Tribal Resource Water
E. coli is measured in the summer at the swimming
beaches to determine the safety of lake water for
recreational purposes (Table 10-7). Pathogens such
as E. coli can cause waterborne illness in bathers
and other recreational users through exposure or
accidental ingestion.
10-18 Section 10: Watershed Assessment
Bear River Watershed Comprehensive Lake Management Plan
Table 10-7. Data for E. coli (MPN/ml) During the Summer Months of 2012 and 2013
Range
Crawling Stone Lake
(Leech Beach)
Flambeau Lake (Campground
Beach) Pokegema Lake (Casino Beach)
Average 10.1 15 16.7
Minimum 0.0 0 0
Maximum 42.2 139.6 111.2
Median 6.9 9.1 4.1
Fecal contamination of recreational waters may
originate from many sources, including shoreline
development, wastewater collection and treatment
facilities, onsite wastewater treatment (septic)
systems, urban runoff, disposal of human waste
from boats, swimmers themselves, pet wastes, and
natural animal sources such as wildlife. People who
swim and recreate in water contaminated with fecal
pollution are at an increased risk of becoming ill
because of pathogens from the fecal matter. The
Tribal beach monitoring program, in collaboration
with Vilas County, helps to identify contamination so
notification can be given to the public. The beaches
identified to be sampled are areas where the public
congregates for swimming. The beach monitoring
program has three main objectives:
•••• Estimate the current status, trends, and changes
in fecal indicators of the condition of the Tribe’s
high recreational lakes, with a statistical
confidence of 95%, and compare values to
National Lake Survey results, human health data,
and water quality standards.
•••• Determine if bacteriological density exceed a
monthly geometric mean of 126 colony-forming
units (cfus) of Escherichia coli per 100 ml, or a
single sample maximum of 235 cfus of
Escherichia coli /100 ml. Waters will be put on
the impaired waters list if Escherichia coli exceed
this criterion or the approved water quality
standards criteria at the time.
•••• Serve as a means to notify the public of a health
concern at a public beach. Determine if
bacteriological density exceeds a monthly
geometric mean of 126 cfus of Escherichia coli
per 100 ml, or a single sample maximum of 235
cfus of Escherichia coli /100 ml. Notification is
posted to the public if these criteria are
exceeded.
On Pokegama Lake’s public beach there was a one-
time occurrence of the single sample maximum of
235 cfus of Escherichia coli /100 ml exceeded due to
a nesting family of geese in 2011. The beach was
posted and resampled, the casino started picking up
the geese feces and the levels went back down to
normal (Table 10-7).
Table 10-7 and Table 10-8 show that for water
assessed for E. coli did not exceed water quality
thresholds.
Table 10-8. Assessed Waters for E. coli
Lake Shoreline Area O
TRW
Acreage
Pollu
tant
Severity
Source
Big Crawling Stone (Leach) Beach
1506 E. coli Fully Supporting
Pokegama (Casino) Beach
975 E. coli Mostly Supporting
Geese
Flambeau (Campground) Beach
1168 E. coli Fully Supporting
Water temperature, pH, turbidity and ionic strength
are the other parameters collected as part of the
Tribal monitoring strategy31
(Table 10-9). These
parameters are discussed in the water quality
standards in the narrative section. Temperature is
protected in accordance with the standard that “no
measurable variation from natural conditions
described by data collected by the Tribe from
reference conditions-except within a mixing zone. In
no case will human-introduced heat be permitted
when the maximum temperature specified for the
water body (66 degrees Fahrenheit for cold water
fisheries and 82 degrees Fahrenheit for warm water
fisheries) would thereby be exceeded.” Also, pH is
protected at a standard which requires “no
Section 10: Watershed Assessment 10-19
Bear River Watershed Comprehensive Lake Management Plan
measurable variation from natural conditions
described by data collected by the Tribe from
reference conditions-except within a mixing zone.”
Table 10-9. Data for pH, Temperature, and Turbidity for Larger Lakes in Lac du Flambeau
pH (none) Temperature (F) Turbidity (NTU)
Average 7.3 49.8 2.4
Median 7.3 49.1 0.4
Maximum 8.6 77.5 376.2
Minimum 5.5 32.1 -1.3
Standard Deviation
0.6 13.6 19.0
The pH, temperature, and turbidity are fairly
consistent and do not exceed any water quality
standards. This data will be used to set a baseline
for future permit requests, as the water quality
standards state that for these parameters there
should be “no measurable variation from natural
conditions as described by data collected by the
Tribe.”
Waters assessed for habitat, DO, temperature,
turbidity, and pH did not exceed Tribal water quality
standards. Yet information was gained to assist the
Tribe in issuing and commenting on permits for
future development. Also more data is needed to
compare habitat to biological indicators like, fish,
macro invertebrates, and aquatic vegetation. DO,
temperature, turbidity, and pH will continue to be
measured to establish a good baseline as
development continues.
Mercury contamination is widespread, especially in
larger game fish, e.g. walleye. This phenomenon
can be more problematic in northern Wisconsin
where soft water lakes are predominant, and
conversion of mercury to methylmercury
(bioaccumulative form) is more rapid, resulting in
higher levels of mercury accumulating in fish living in
such lakes. This is of particular concern for the Lac
du Flambeau Tribe, whose members are
subsistence fishers.
Mercury data collected in accordance with the Tribal
mercury QAPP32
were compared to the water quality
standard. Tribal fish consumption advisories are
based on actual concentrations of mercury in fish
tissue (collected in early 1991, 2001, 2007) and
projected mercury levels in fish tissue of different
size classes of fish. The projected mercury levels
were generated using a line of best-fit formula from
data from all years. The ranges of mercury
concentrations are based on new human health
recommendations – an oral reference dose of
0.1 ug/kg-day – published by the U.S. Environmental
Protection Agency. The new reference dose is now
more protective of unborn and developing children.
The data revealed a decrease in mercury in fish
tissue during 1991–2007. Figure 10-11 shows a
general trend of decreasing mercury over the years.
Wisconsin DNR also noted mercury in walleye
decreased 0.5% per year in northern lakes.33
To
develop a conservative fish consumptions advisory,
all years were used in the regression. The fish
consumption guide was created based on the known
human health effects of mercury in blood. US EPA’s
document on fish consumption Guidance for
Assessing Chemical Contaminant Data for Use in
Fish Advisories, Volume 2, Risk Assessment and
Fish Consumption Limits (EPA 823-B-97-009), was
followed. A risk level of 10-34
, a human body weight
of 70kg, meal size of 8oz, and a reference dose
(RfD) of 0.0001 mg/kg-day was used to determine
recommendations for the sensitive group (women of
childbearing age and children) and 0.0003mg/kg-day
for other people. The data, when compared to water
quality standards and/or nationally recommended
water quality criteria of 0.3mg/kg, show that five
lakes dropped below the criteria in 2007 (Figure
10-11). Yet the 95% confidence interval still exceeds
the criteria for two of those lakes (large fish over 18
inches). If the 95% confidence interval from one lake
exceeds the criteria then the lakes are listed as a
concern for exceeding the criteria.
10-20 Section 10: Watershed Assessment
Bear River Watershed Comprehensive Lake Management Plan
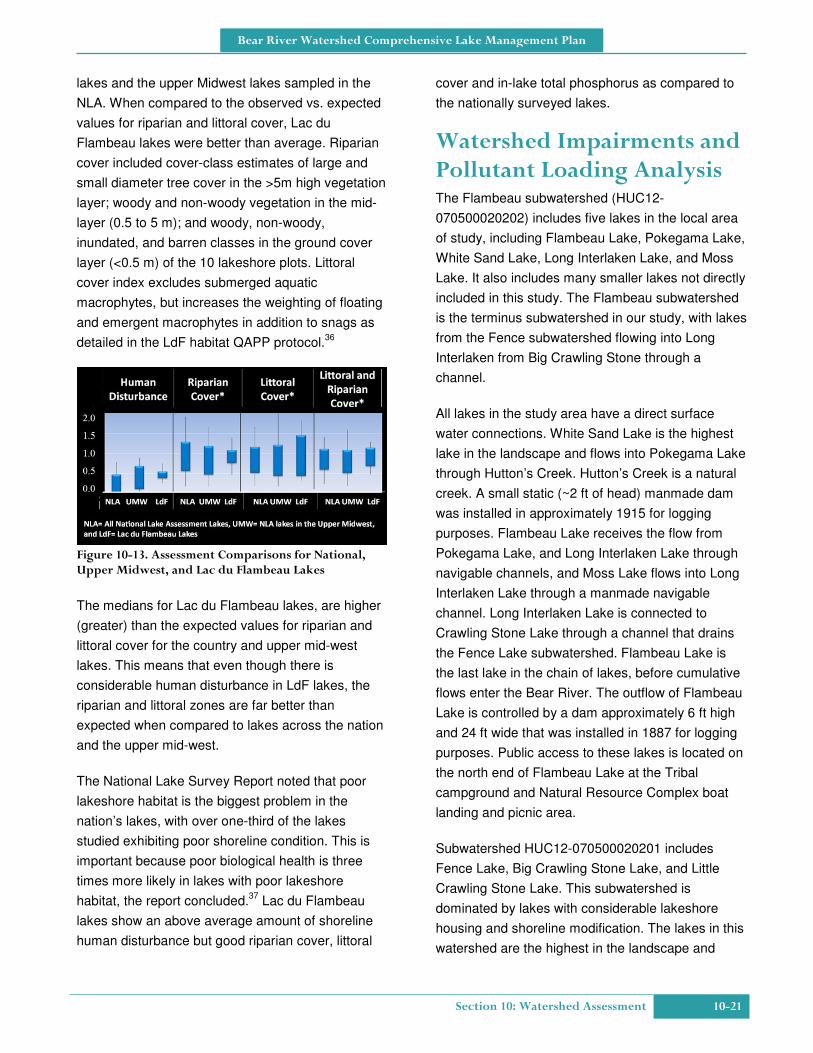
The Lac du Flambeau Reservation Lakes when
compared to National Lakes Assessment condition
criteria35
revealed medium human disturbance, but
mostly good habitat. The shoreline human
disturbance index was based on field observations
tallying the presence and proximity of 12 types of
human activities or disturbances at 10 systematically
located shoreline positions (A-J Figure 10-12). As
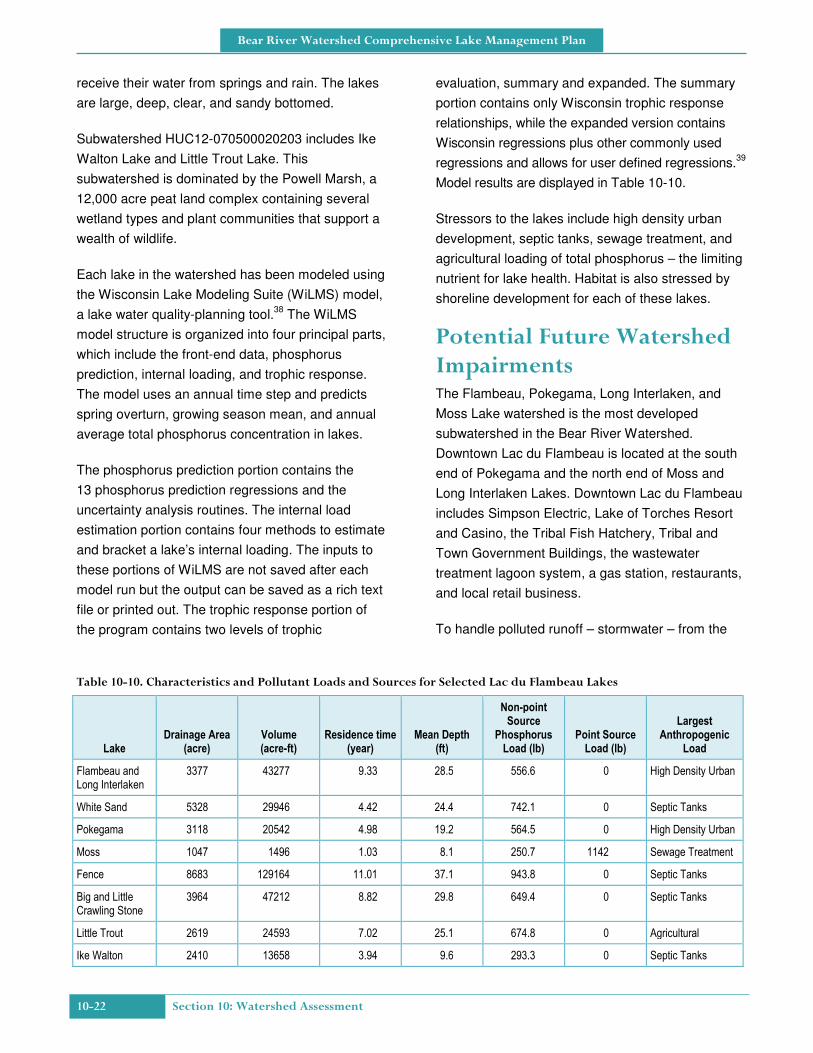
noted in Figure 10-13, the condition criteria for
human disturbance is a direct reflection of human
alteration of the lakeshore, and shows Lac du
Flambeau Lakes to be higher than the average total
Figure 10-11. Data Trends for Mercury in Fish Tissue for Selected Lakes During 1991–2007
Figure 10-12. Shoreline Positions for Lake Monitoring and Assessment Activities
Section 10: Watershed Assessment 10-21
Bear River Watershed Comprehensive Lake Management Plan
lakes and the upper Midwest lakes sampled in the
NLA. When compared to the observed vs. expected
values for riparian and littoral cover, Lac du
Flambeau lakes were better than average. Riparian
cover included cover-class estimates of large and
small diameter tree cover in the >5m high vegetation
layer; woody and non-woody vegetation in the mid-
layer (0.5 to 5 m); and woody, non-woody,
inundated, and barren classes in the ground cover
layer (<0.5 m) of the 10 lakeshore plots. Littoral
cover index excludes submerged aquatic
macrophytes, but increases the weighting of floating
and emergent macrophytes in addition to snags as
detailed in the LdF habitat QAPP protocol.36
Figure 10-13. Assessment Comparisons for National, Upper Midwest, and Lac du Flambeau Lakes
The medians for Lac du Flambeau lakes, are higher
(greater) than the expected values for riparian and
littoral cover for the country and upper mid-west
lakes. This means that even though there is
considerable human disturbance in LdF lakes, the
riparian and littoral zones are far better than
expected when compared to lakes across the nation
and the upper mid-west.
The National Lake Survey Report noted that poor
lakeshore habitat is the biggest problem in the
nation’s lakes, with over one-third of the lakes
studied exhibiting poor shoreline condition. This is
important because poor biological health is three
times more likely in lakes with poor lakeshore
habitat, the report concluded.37
Lac du Flambeau
lakes show an above average amount of shoreline
human disturbance but good riparian cover, littoral
cover and in-lake total phosphorus as compared to
the nationally surveyed lakes.
Watershed Impairments and Pollutant Loading Analysis The Flambeau subwatershed (HUC12-
070500020202) includes five lakes in the local area
of study, including Flambeau Lake, Pokegama Lake,
White Sand Lake, Long Interlaken Lake, and Moss
Lake. It also includes many smaller lakes not directly
included in this study. The Flambeau subwatershed
is the terminus subwatershed in our study, with lakes
from the Fence subwatershed flowing into Long
Interlaken from Big Crawling Stone through a
channel.
All lakes in the study area have a direct surface
water connections. White Sand Lake is the highest
lake in the landscape and flows into Pokegama Lake
through Hutton’s Creek. Hutton’s Creek is a natural
creek. A small static (~2 ft of head) manmade dam
was installed in approximately 1915 for logging
purposes. Flambeau Lake receives the flow from
Pokegama Lake, and Long Interlaken Lake through
navigable channels, and Moss Lake flows into Long
Interlaken Lake through a manmade navigable
channel. Long Interlaken Lake is connected to
Crawling Stone Lake through a channel that drains
the Fence Lake subwatershed. Flambeau Lake is
the last lake in the chain of lakes, before cumulative
flows enter the Bear River. The outflow of Flambeau
Lake is controlled by a dam approximately 6 ft high
and 24 ft wide that was installed in 1887 for logging
purposes. Public access to these lakes is located on
the north end of Flambeau Lake at the Tribal
campground and Natural Resource Complex boat
landing and picnic area.
Subwatershed HUC12-070500020201 includes
Fence Lake, Big Crawling Stone Lake, and Little
Crawling Stone Lake. This subwatershed is
dominated by lakes with considerable lakeshore
housing and shoreline modification. The lakes in this
watershed are the highest in the landscape and
10-22 Section 10: Watershed Assessment
Bear River Watershed Comprehensive Lake Management Plan
receive their water from springs and rain. The lakes
are large, deep, clear, and sandy bottomed.
Subwatershed HUC12-070500020203 includes Ike
Walton Lake and Little Trout Lake. This
subwatershed is dominated by the Powell Marsh, a
12,000 acre peat land complex containing several
wetland types and plant communities that support a
wealth of wildlife.
Each lake in the watershed has been modeled using
the Wisconsin Lake Modeling Suite (WiLMS) model,
a lake water quality-planning tool.38
The WiLMS
model structure is organized into four principal parts,
which include the front-end data, phosphorus
prediction, internal loading, and trophic response.
The model uses an annual time step and predicts
spring overturn, growing season mean, and annual
average total phosphorus concentration in lakes.
The phosphorus prediction portion contains the
13 phosphorus prediction regressions and the
uncertainty analysis routines. The internal load
estimation portion contains four methods to estimate
and bracket a lake’s internal loading. The inputs to
these portions of WiLMS are not saved after each
model run but the output can be saved as a rich text
file or printed out. The trophic response portion of
the program contains two levels of trophic
evaluation, summary and expanded. The summary
portion contains only Wisconsin trophic response
relationships, while the expanded version contains
Wisconsin regressions plus other commonly used
regressions and allows for user defined regressions.39
Model results are displayed in Table 10-10.
Stressors to the lakes include high density urban
development, septic tanks, sewage treatment, and
agricultural loading of total phosphorus – the limiting
nutrient for lake health. Habitat is also stressed by
shoreline development for each of these lakes.
Potential Future Watershed Impairments The Flambeau, Pokegama, Long Interlaken, and
Moss Lake watershed is the most developed
subwatershed in the Bear River Watershed.
Downtown Lac du Flambeau is located at the south
end of Pokegama and the north end of Moss and
Long Interlaken Lakes. Downtown Lac du Flambeau
includes Simpson Electric, Lake of Torches Resort
and Casino, the Tribal Fish Hatchery, Tribal and
Town Government Buildings, the wastewater
treatment lagoon system, a gas station, restaurants,
and local retail business.
To handle polluted runoff – stormwater – from the
Table 10-10. Characteristics and Pollutant Loads and Sources for Selected Lac du Flambeau Lakes
Lake Drainage Area
(acre) Volume (acre-ft)
Residence time (year)
Mean Depth (ft)
Non-point Source
Phosphorus Load (lb)
Point Source Load (lb)
Largest Anthropogenic
Load
Flambeau and Long Interlaken
3377 43277 9.33 28.5 556.6 0 High Density Urban
White Sand 5328 29946 4.42 24.4 742.1 0 Septic Tanks
Pokegama 3118 20542 4.98 19.2 564.5 0 High Density Urban
Moss 1047 1496 1.03 8.1 250.7 1142 Sewage Treatment
Fence 8683 129164 11.01 37.1 943.8 0 Septic Tanks
Big and Little Crawling Stone
3964 47212 8.82 29.8 649.4 0 Septic Tanks
Little Trout 2619 24593 7.02 25.1 674.8 0 Agricultural
Ike Walton 2410 13658 3.94 9.6 293.3 0 Septic Tanks
Section 10: Watershed Assessment 10-23
Bear River Watershed Comprehensive Lake Management Plan
developing downtown area, the Lac du Flambeau
Tribe, in coordination with surrounding governments
and non-governmental-organizations, partnered in
sponsoring education and proactive green
development to hold the line in water quality as
development boomed.
The Tribe passed lake protection ordinances in
1997, and implemented a green sheet land use
review process for environmental review of all
construction projects happening on Tribal land. This
enabled the tribe to take a proactive approach to
development projects to insure that on-the-ground
best management practices were followed to protect
water quality. This included installing constructed
wetlands and sediment traps for larger projects and
maintaining a 75 foot buffer around all waters where
possible.
The Tribe also installed shoreline restoration
demonstration projects to educate the public and
staff on lake steward techniques. In 1996, the Tribe
held the first of a continuing annual Lakes Fest to
showcase lake protection activities and educate the
public regarding lake protection. Lakes Fest has
been the hallmark of the Tribe’s water protection
program, with over 30 lake protection partners
present during the latest protection activities,
designed as a fun family and community celebration.
Figure 10-6 shows that the majority of the waters in
Lac du Flambeau are in good to excellent quality.
This is because of the protective action the Tribe
and Town have taken over the years. Still with
proactive protection the reservation waters receive
stress from mercury deposition, nutrient loading, and
loss of habitat from development.
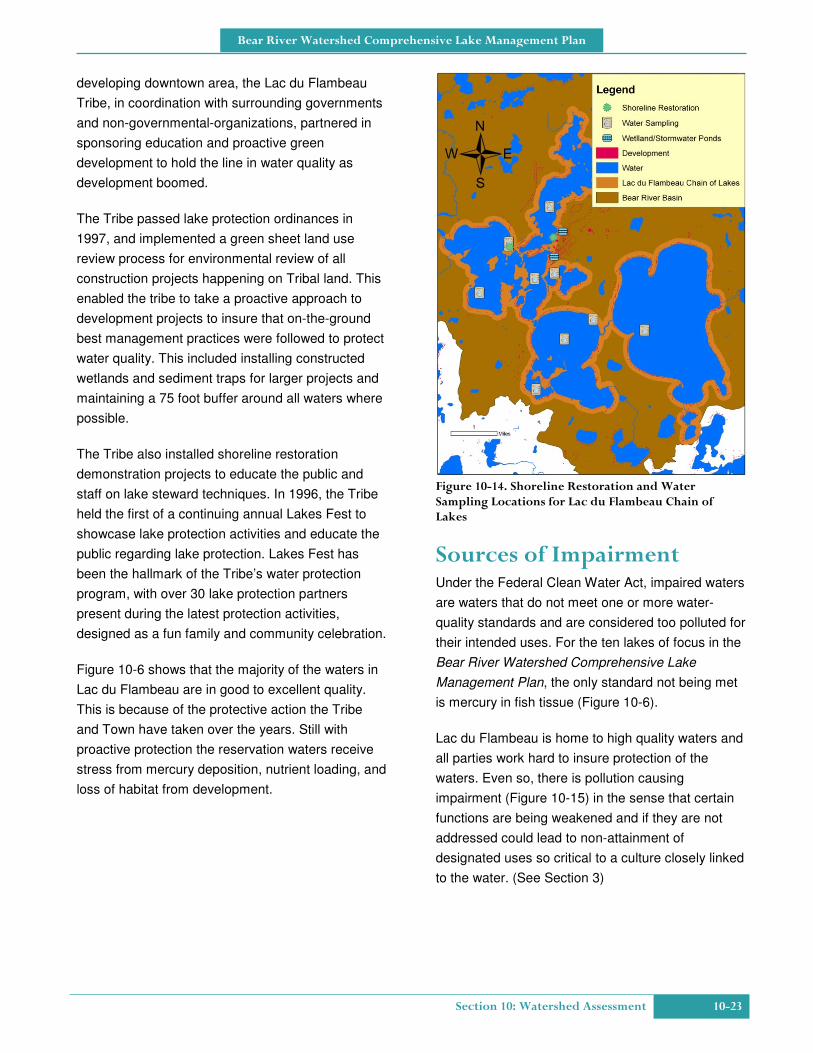
Figure 10-14. Shoreline Restoration and Water Sampling Locations for Lac du Flambeau Chain of Lakes
Sources of Impairment Under the Federal Clean Water Act, impaired waters
are waters that do not meet one or more water-
quality standards and are considered too polluted for
their intended uses. For the ten lakes of focus in the
Bear River Watershed Comprehensive Lake
Management Plan, the only standard not being met
is mercury in fish tissue (Figure 10-6).
Lac du Flambeau is home to high quality waters and
all parties work hard to insure protection of the
waters. Even so, there is pollution causing
impairment (Figure 10-15) in the sense that certain
functions are being weakened and if they are not
addressed could lead to non-attainment of
designated uses so critical to a culture closely linked
to the water. (See Section 3)

10-24 Section 10: Watershed Assessment
Bear River Watershed Comprehensive Lake Management Plan
The three major non-point sources of pollution
leading to impairment within the watersheds are
mercury deposition, shoreland development, and
cranberry operations.
Mercury deposition originates from coal fired electric
utilities and other small source anthropogenic loads.
The closest coal utility is in Wausau, Wisconsin,
eighty miles south of the reservation. At this time the
impairment is quantified based on mercury in fish
tissue (Figure 10-11), but further research needs to
be done to quantify sources of mercury. Mercury
deposition is a complex pollutant as it can be
dispersed over thousands of miles. Watershed-level
estimates of necessary pollution control will be
refined by participating in statewide and national
mercury load reductions.
Development in the watershed is expanding in the
downtown and shoreline areas, increasing over 10%
a year, stressing habitat, septic, and sewage
treatment facilities (Figure 10-15). Table 10-10
shows that the majority of nutrient load is related to
septic, sewage treatment, and development of
impervious areas. Habitat conditions in the outlying
lakes are also declining due to increasing
development, mostly within the near shore area.
Little Trout Lake is the only lake that is not degraded
with lakeshore development, but it has large
agricultural cranberry operations on the northern
third of the lake (Figure 10-15). that contribute to
increased nutrients and habitat degradation. Table
10-3 maps the source of nutrient loads that informed
the WILMS model used to quantify nutrient loads.
Expected Load Reductions from Management Measures
Load reductions for mercury are modeled on a
statewide and national scale. Lac du Flambeau
participates based on comments to national and
statewide rule making, sharing local fish tissue data
for development of TMDL’s (Total Maximum Daily
Loads) for mercury, and by reducing their energy
demand by implementing energy conservation
practices. Proposed management measures are to
continue to comment on national and regional
permits to eliminate new sources of mercury
emission. Management measures along with
technical and financial assistance needs, schedule
and milestones, load reduction criteria, and
monitoring component are detailed in Setting the
Pace (Table 11-3) and detailed prioritized action.
Each lake has its own unique set of stressors – and
its own unique set of responses to those stressors –
as detailed in the subsequent sections. Much of the
management is based on reducing impact from
future development. Lac du Flambeau waters are
very high quality waters and protection is most cost
effective. Setting the Pace details three priority
areas for restoration and load reduction. The
majority of the management measures are ongoing
protective measures as outlined in Section 3, Table
3-1.
To evaluate the effectiveness of the management
measures the Tribe will assess biology, chemistry,
nutrients, habitat, bacteria, aesthetics, and fish
tissue to water quality standards as detailed in
Figure 10-6 to show minimal degradation from
baseline while growth continues. The management
measures are expected to reduce loads by not
increasing loads as Lac du Flambeau develops.
.

Section 10: Watershed Assessment 10-25
Bear River Watershed Comprehensive Lake Management Plan
Figure 10-15. Sources leading to Impairment

10-26 Section 10: Watershed Assessment
Bear River Watershed Comprehensive Lake Management Plan
Notes for Section 10 1. http://water.usgs.gov/GIS/huc.html.
2. Integrated Resource Management Plan, IRMP.
3. Simulation of Groundwater Flow and Interactions of Groundwater and Surface Water on the Lac du Flambeau Reservation, Wisconsin. Prepared in cooperation with the lac du Flambeau Band of Lake Superior Chippewa and Indian Health Service. published by U.S. Department of the Interior, U. S. Geological Survey. By Paul F. Juckem, Michael N. Fienen, and Randall J. Hunt: Scientific Investigations Report 2014, Draft.
4. Tribal Water Quality Standards.
5. Quality Assurance Protection Plan, Lac du Flambeau Band of Lake Superior Chippewa Indians, General Chemistry Assessment of Waters within the Lac du Flambeau Reservation 2012 (QAPP) for General Chemistry.
6. Quality Assurance Protection Plan, Lac du Flambeau Band of Lake Superior Chippewa Indians, (QAPP) for Beach Monitoring, 2008.
7. Quality Assurance Protection Plan, Lac du Flambeau Band of Lake Superior Chippewa Indians, (QAPP) Shore land Development Habitat, 2008.
8. Quality Assurance Protection Plan (QAPP) , Lac du Flambeau Band of Lake Superior Chippewa Indians, Aquatic Plant Habitat Point Intercept Survey of Lakes for Plants, 2010.
9. http://dnr.wi.gov/lakes/CLMN/qualityassurance/CLMNQAPP2010.pdf.
10. http://water.epa.gov/scitech/swguidance/standards/uses.cfm.
11. Results of the WISCALM Botanist Review Panel for Aquatic Macrophyte Impairment.
12. Wisconsin 2012 Consolidated Assessment and Listing Methodology (WIS CLAM) for Clean Water Act Section 305(b), 314, and 303(d) Integrated Reporting, April 2012 http://dnr.wi.gov/topic/surfacewater/documents/FINAL_2012_WisCALM_04-02-12.pdf.
13. Quality Assurance Protection Plan, Lac du Flambeau Band of Lake Superior Chippewa Indians, General Chemistry Assessment of Waters within the Lac du Flambeau Reservation 2012 (QAPP) for General Chemistry.
14. Wisconsin 2012 Consolidated Assessment and Listing Methodology (WIS CLAM) for Clean Water Act Section 305(b), 314, and 303(d) Integrated Reporting, April 2012 http://dnr.wi.gov/topic/surfacewater/documents/FINAL_2012_WisCALM_04-02-12.pdf.
15. National Lakes Assessment: Technical Appendix, Data Analysis Approach; Lakes, Ponds, and Reservoirs January 2010 Pg 10-12.
16. Ibid.
17. Ibid.
18. Ibid.
19. Ibid.
20. Ibid.
21. Ibid.
22. Tribal Water Quality Standards.
23. Ibid.
24. Wisconsin Integrated Assessment of Watershed Health. U.S. Environmental Protection Agency, March 2014, EPA 841-R-14-001. http://water.epa.gov/polwaste/nps/watershed/index.cfm
25. Reservation Water and Shoreline Protection and Enhancement Ordinance. http://www.ldftribe.com/Courts/CHAP23%20Reservation%20Water%20and%20Shoreline%20Protection%20and%20Enhancement%20Ordinance.pdf.
26. Non-point Source Assessment and Management Plan.
27. Quality Assurance Protection Plan, Lac du Flambeau Band of Lake Superior Chippewa Indians, (QAPP) Shore land Development Habitat, 2008.
28. National Lakes Assessment: Technical Appendix, Data Analysis Approach; Lakes, Ponds, and Reservoirs January 2010 Pg 10-12.
29. Quality Assurance Protection Plan, Lac du Flambeau Band of Lake Superior Chippewa Indians, (QAPP) for Beach Monitoring 2008
30. Quality Assurance Protection Plan (QAPP) , Lac du Flambeau Band of Lake Superior Chippewa Indians, Aquatic Plant Habitat Point Intercept Survey of Lakes for Plants, 2010.
31. Monitoring strategy.
32. Quality Assurance Protection Plan, Lac du Flambeau Band of Lake Superior Chippewa Indians, General Chemistry Assessment of Waters within the Lac du Flambeau Reservation 2012 (QAPP) for General Chemistry.
33. Paul W. Rasmussen, Schrank S., Campfield, C., (2007) Temporal trends of mercury concentrations in Wisconsin walleye (Sander vitreus), 1982–2005, 27 July 2007; Springer Science+Business Media, LLC 2007.
34. Quality Assurance Protection Plan, Lac du Flambeau Band of Lake Superior Chippewa Indians, General Chemistry Assessment of Waters within the Lac du Flambeau Reservation 2012 (QAPP) for General Chemistry.
35. National Lakes Assessment: Technical Appendix, Data Analysis Approach; Lakes, Ponds, and Reservoirs, January 2010, Pg 10-12.
36. Quality Assurance Protection Plan, Lac du Flambeau Band of Lake Superior Chippewa Indians, (QAPP) Shore land Development Habitat, 2008.
37. http://dnr.wi.gov/lakes/CLMN/qualityassurance/CLMNQAPP2010.pdf
38. http://dnr.wi.gov/lakes/Model/WiLMSDocumentation.pdf Wisconsin Lake Modeling Suite Program Documentation and User’s Manu, Version 3.3 for Windows Wisconsin Department of Natural Resources, October 2003, PUBL-WR-363-94 Natural Resources Board, Nutrients.
39. Ibid.
Figures Figure 10-1. Conceptual Drawing of a Watershed ........... 10-1
Figure 10-2. Hydraulic Unit Nesting Configuration for Lac du Flambeau Waterbodies ............................ 10-2
Figure 10-3. Bear River Watershed and Subwatersheds showing Land use Type .............. 10-3

Section 10: Watershed Assessment 10-27
Bear River Watershed Comprehensive Lake Management Plan
Figure 10-4. Sub-basin with Flow Direction in relation to the Lac du Flambeau Indian Reservation Waters ................................................................. 10-5
Figure 10-5. Flow Obstructions and Channels ................ 10-6
Figure 10-6. Color-Coded Water Quality Condition Report Card ......................................................... 10-7
Figure 10-7. Floristic Quality Index and Riparian Cover Index Values for Selected Lakes ............. 10-14
Figure 10-8. Simpson’s Diversity Index Scores ............. 10-15
Figure 10-9. Comparison of Photic Zone Vegetation and Total Average Phosphorus for Selected Lakes ................................................................. 10-16
Figure 10-10. Comparison of Vegetated Sites vs the National Lake Survey Human Disturbance Index ................................................................. 10-16
Figure 10-11. Data Trends for Mercury in Fish Tissue for Selected Lakes During 1991–2007 ............... 10-20
Figure 10-12. Shoreline Positions for Lake Monitoring and Assessment Activities ................................. 10-20
Figure 10-13. Assessment Comparisons for National, Upper Midwest, and Lac du Flambeau Lakes .... 10-21
Figure 10-14. Shoreline Restoration and Water Sampling Locations for Lac du Flambeau Chain of Lakes .................................................. 10-23
Figure 10-15. Sources leading to Impairment ............... 10-25
Tables Table 10-1. Hydrologic Unit Code Classification
Descriptions ......................................................... 10-1
Table 10-2. Hydraulic Summary for Selected Lac du Flambeau Subwatersheds ................................... 10-4
Table 10-3. Relevant Hydraulic Budget Data for Each Study Lake3 ......................................................... 10-4
Table 10-4. Tribal Water Quality Standards Based Assessment Thresholds .................................... 10-10
Table 10-5. Dissolved Oxygen in mg/l for the Month, Averaged Over the Top Four Meters of the Lake Surface ..................................................... 10-17
Table 10-6. Assessed Waters for Dissolved Oxygen (DO) .................................................................. 10-17
Table 10-7. Data for E. coli (MPN/ml) During the Summer Months of 2010 and 2011 .................... 10-18
Table 10-8. Assessed Waters for E. coli ....................... 10-18
Table 10-9. Data for pH, Temperature, and Turbidity for Larger Lakes in Lac du Flambeau ................ 10-19
Table 10-10. Characteristics and Pollutant Loads and Sources for Selected Lac du Flambeau Lakes .. 10-22