about janaagraha centre for citizenship and · pdf fileabout janaagraha centre for citizenship...
TRANSCRIPT

About Janaagraha Centre for Citizenship and Democracy
The Janaagraha Centre for Citizenship and Democracy is a non-profit organisation based
in Bengaluru, India. We aim to improve quality of life in urban India, through systemic
change. Janaagraha sees ‘quality of life’ as comprising two distinct, but inter-related
aspects – ‘quality of urban infrastructure and services’ (the quality of urban of amenities
such as roads, drains, traffic, transport, water supply etc.) and ‘quality of citizenship’ (the
role that urban citizens play by participating in their local communities). We work with
both citizens and government to catalyse civic participation from the grassroots up, as
well as governance reforms from the top down. You can read more about Janaagraha at
www.janaagraha.org
About Jana Urban Space Foundation (Jana USP)
Jana Urban Space Foundation (Jana USP), a sister organisation of Janaagraha is a non-
partisan, not-for-profit trust working on the core premise that urban planning & urban
design are central to shaping vibrant cities and city regions, thus enhancing quality of life.
You can read more about Jana USP at www.janausp.org
About IDFC Foundation
IDFC Foundation is a wholly-owned subsidiary of IDFC Limited and a not-for-profit
company within the meaning of Section 8 of the Companies Act, 2013. IDFC Foundation,
since its inception, has been involved in policy advocacy and research, programme
support, capacity-building and community engagement programmes. Its activities are
aimed at promoting inclusive growth, creating livelihood opportunities for the rural
population and executing corporate social responsibility (CSR) initiatives.
IDFC Foundation primarily focuses on CSR activities as well-defined projects or
programmes promoting the development of (a) livelihoods, (b) rural areas, (c) social
infrastructure such as healthcare and education and (d) other infrastructure that would
meet the objectives of inclusion and environmental sustainability such as water supply,
sanitation, sustainable urbanisation, public transport system, renewable energy, slum re-
development and affordable housing.
Supported by:
ASICS 2015Revised Edition Dated 30/01/2017
2015

2
5
23
35
43
47
Foreword
Empowered &Legitimate
PoliticalRepresentation
Urban Planning& Design
ReformsRoadmap
Data Sources
AnnexureScorecard
63OverallScores
3
15
29
40
45
61
Urban Capacities& Resources
ExecutiveSummary
Transparency,Accountability &Participation
Methodology
Errata
Scores :PrincipalQuestions

AbbreviationsAhd . . . . . . . . . . . . . . . . . . . . . . . . . . AhmedabadASICS . . . . . . . . . . . . . . . . . . . . . . . . . . Annual Survey of India’s City-SystemsBBMP . . . . . . . . . . . . . . . . . . . . . . . . . . Bruhat Bengaluru Mahanagara PalikeBCP . . . . . . . . . . . . . . . . . . . . . . . . . . Bangalore City PoliceBDA . . . . . . . . . . . . . . . . . . . . . . . . . . Bangalore Development AuthorityBESCOM . . . . . . . . . . . . . . . . . . . . . . . . . . Bangalore Electricity supply company Ltd.Bho . . . . . . . . . . . . . . . . . . . . . . . . . . BhopalBhu . . . . . . . . . . . . . . . . . . . . . . . . . . BhubaneswarBlr . . . . . . . . . . . . . . . . . . . . . . . . . . BengaluruBMTC . . . . . . . . . . . . . . . . . . . . . . . . . . Bangalore Metropolitan Transport CorporationBTP . . . . . . . . . . . . . . . . . . . . . . . . . . Bangalore Traffic PoliceBWSSB . . . . . . . . . . . . . . . . . . . . . . . . . . Bangalore Water Supply and Sewerage BoardCA . . . . . . . . . . . . . . . . . . . . . . . . . . Chartered AccountantCAG . . . . . . . . . . . . . . . . . . . . . . . . . . Comptroller and Auditor General of IndiaCapex . . . . . . . . . . . . . . . . . . . . . . . . . . Capital ExpenditureChd . . . . . . . . . . . . . . . . . . . . . . . . . . ChandigarhChe . . . . . . . . . . . . . . . . . . . . . . . . . . ChennaiCPL . . . . . . . . . . . . . . . . . . . . . . . . . . Community Participation LawDeh . . . . . . . . . . . . . . . . . . . . . . . . . . DehradunDel . . . . . . . . . . . . . . . . . . . . . . . . . . DelhiELPR . . . . . . . . . . . . . . . . . . . . . . . . . . Empowered and Legitimate Political RepresentationFRBM . . . . . . . . . . . . . . . . . . . . . . . . . . Fiscal Responsibility and Budget ManagementGIS . . . . . . . . . . . . . . . . . . . . . . . . . . Geographical Information SystemGLA . . . . . . . . . . . . . . . . . . . . . . . . . . Greater London AuthorityHyd . . . . . . . . . . . . . . . . . . . . . . . . . . HyderabadJnNURM . . . . . . . . . . . . . . . . . . . . . . . . . . Jawaharlal Nehru National Urban Renewal MissionJpr . . . . . . . . . . . . . . . . . . . . . . . . . . JaipurKol . . . . . . . . . . . . . . . . . . . . . . . . . . KolkataKpr . . . . . . . . . . . . . . . . . . . . . . . . . . KanpurKSFES . . . . . . . . . . . . . . . . . . . . . . . . . . Karnataka State Fire & Emergency ServicesKSPCB . . . . . . . . . . . . . . . . . . . . . . . . . . Karnataka State Pollution Control BoardKSRTC . . . . . . . . . . . . . . . . . . . . . . . . . . Karnataka State Road Transport CorporationLck . . . . . . . . . . . . . . . . . . . . . . . . . . LucknowLon . . . . . . . . . . . . . . . . . . . . . . . . . . LondonLud . . . . . . . . . . . . . . . . . . . . . . . . . . LudhianaMA . . . . . . . . . . . . . . . . . . . . . . . . . . Metropolitan AreaMC . . . . . . . . . . . . . . . . . . . . . . . . . . Municipal CorporationMPC . . . . . . . . . . . . . . . . . . . . . . . . . . Metropolitan Planning CommitteeMum . . . . . . . . . . . . . . . . . . . . . . . . . . MumbaiNUSPD . . . . . . . . . . . . . . . . . . . . . . . . . . National Urban Spatial Planning & Development GuidelinesNYC . . . . . . . . . . . . . . . . . . . . . . . . . . New York CityPat . . . . . . . . . . . . . . . . . . . . . . . . . . PatnaPDL . . . . . . . . . . . . . . . . . . . . . . . . . . Public Disclosure LawPPP . . . . . . . . . . . . . . . . . . . . . . . . . . Public-Private PartnershipPun . . . . . . . . . . . . . . . . . . . . . . . . . . PuneRai . . . . . . . . . . . . . . . . . . . . . . . . . . RaipurRan . . . . . . . . . . . . . . . . . . . . . . . . . . RanchiRTI . . . . . . . . . . . . . . . . . . . . . . . . . . Right to InformationSARC . . . . . . . . . . . . . . . . . . . . . . . . . . Second Administrative Reforms CommissionSDP . . . . . . . . . . . . . . . . . . . . . . . . . . Spatial Development Plan (Master Plan)SEC . . . . . . . . . . . . . . . . . . . . . . . . . . State Election CommissionSFC . . . . . . . . . . . . . . . . . . . . . . . . . . State Finance CommissionSur . . . . . . . . . . . . . . . . . . . . . . . . . . SuratTAP . . . . . . . . . . . . . . . . . . . . . . . . . . Transparency, Accountability and ParticipationThi . . . . . . . . . . . . . . . . . . . . . . . . . . ThiruvananthapuramUA . . . . . . . . . . . . . . . . . . . . . . . . . . Urban AgglonerationUCR . . . . . . . . . . . . . . . . . . . . . . . . . . Urban Capacities and ResourcesULB . . . . . . . . . . . . . . . . . . . . . . . . . . Urban Local BodyUPD . . . . . . . . . . . . . . . . . . . . . . . . . . Urban Planning and Design74th CAA . . . . . . . . . . . . . . . . . . . . . . . . . . Constitution (Seventy-fourth Amendment) Act, 1992
1
Foreword
For decades, we have been repeatedly confronting the same quality of life challenges in our cities. On the one hand,
hundreds of thousands of crores are being spent on urban projects beginning with the Jawaharlal Nehru National Urban
Renewal Mission (JnNURM) over a decade ago and followed up through AMRUT, Smart Cities Mission and the Swachh
Bharat Mission. During the same decade, the floods in Mumbai, the garbage crisis in Bangalore, and more recently the air
pollution levels in Delhi and the Chennai floods are alarm bells that more of the same solutions i.e. a series of patchwork
projects, will not suffice. Root causes need to identified and addressed; the disease needs to be treated and not just the
symptoms.
Our work has led us to the firm belief that there are a common set of root causes that underlie most quality of life challenges
in our cities. We have synthesised these root causes into a City-Systems framework that comprises the following four
components
Urban Planning and Design (Spatial Planning, Urban Design standards)
Urban Capacities and Resources (Municipal Finance, Municipal Staffing, Performance Management and Process
efficiencies)
Empowered and Legitimate Political Representation (Powers and functions and legitimacy of city council and elected
leaders)
Transparency, Accountability and Participation (public disclosure of civic data, accountability for service levels and
citizen services, citizen participation in neighbourhood decisions)
The phrase “city-systems” connotes the interconnected nature of the root causes and the systemic nature of our cities,
their challenges and solutions.
The Annual Survey of India’s City-Systems (ASICS) is an objective evaluation of Indian cities based on the City-Systems
framework. In its third edition now, ASICS covers 21 cities across 18 states, including all state capitals. New York and
London are covered as benchmark cities. With 11 principal questions and 83 detailed parameters, ASICS is intended to
serve as a health diagnostic of cities. The better a city’s score on ASICS, the more likely it is to be able to deliver a better
quality of life over the medium and long-term.
We believe that ASICS, with its rich data and insights on city-systems would aid elected and administrative leaders across
levels to identify specific reform agendas for their cities. A City Blueprint to effect transformative, holistic change or
specific city-system blueprints such as a Municipal Finance Blueprint or a Citizen Participation Blueprint could be logical
next steps. It is for State Governments to take the leadership in transforming the quality of our city-systems through such
actionable blueprints.
Srikanth Viswanathan
Coordinator-Advocacy and Reforms, Research and Insights
2

The Annual Survey of India’s City-Systems (ASICS) seeks to provide an objective basis to evaluate the quality of governance in our cities. It measures the health of India’s City-Systems. Like a health check-up, ASICS shows us the deep systemic flaws in our cities and highlights the corrective actions that need to be taken. We believe that the quality of life experienced by the citizen on the street is a derivative of the quality and robustness of the laws and policies that govern the city, as well as their implementation.
In its third edition, ASICS 2015 evaluates 21 major cities from 18 states of the country. The survey uses the Janaagraha City-Systems Framework as its basis – Urban Planning and Design (UPD), Urban Capacities and Resources (UCR), Empowered and Legitimate Political Representation (ELPR) and Transparency, Accountability and Participation (TAP). Each of the four components of this framework has been broken down into a few critical questions that we believe every city must ask itself. In all, there are 11 such ‘BIG QUESTIONS’. Each of the 21 cities has been evaluated and scored on these 11 questions.
Additional questions introduced in the survey this year include those on the quality of leadership in our cities, specifically the stability of tenure and relevant experience of the Commissioner of the Municipal Corporation. We also scored the cities on whether they conduct citizen satisfaction surveys and whether they require public disclosure of related party interests by Councillors. Also included are questions to assess the mechanisms that cities have in place to deter plan violations.
The findings have been presented in a simplified manner, so that the reader can easily relate to the issues highlighted. Visuals and graphs have been used to portray key data nuggets. Also, a few best practices and case studies have been cited to showcase how certain governments and non-government organizations have successfully tackled some of the challenges in urban governance.
The 11 BIG QUESTIONS around which the report has been structured are:
Urban Planning and Design Does your city have a decentralised system of Spatial Development Planning? How successfully has your city implemented its SDPs? Does your city have effective mechanisms to deter plan violations? Does your city encourage Participatory Planning?
Urban Capacities and ResourcesDoes your city have adequate number of skilled human resources? Does your city invest adequate funds in public infrastructure and services? Does your city make optimum use of information technology?
Empowered and Legitimate Political Representation Do your city leaders have adequate power? Is your city truly democratic?
Transparency, Accountability and Participation Does your city put out adequate information and facilitate citizen participation? How well does your city address citizen complaints?
Executive Summary
3
Indian cities continue to score in the range of 2.0 to 4.4 on 10, as against the global benchmarks of London and New York, which have scored 9.4 and 9.7 respectively. On the individual City-Systems components, our cities have scored in a range of 0.6 to 6.4. These scores imply that Indian cities are grossly under-prepared to deliver a high quality of life that is sustainable in the long term. This is particularly worrisome, given the rapid pace of urbanisation in India and the huge backlog in public service delivery. Only robust City-Systems can prepare Indian cities to surmount both these challenges.
Interdependence between the City-Systems components shows the systemic nature of the challenge. For example, lack of adequate number of skilled staff in Municipalities (an aspect measured under the question on quality of human resources) could lead to lower property tax collections and own revenues, which affects a city’s financial resources. However, the ability to attract quality talent requires financial self-sufficiency. Similarly, land and spatial planning under UPD are crucial for financial self-sufficiency, but empowered political leadership, an aspect under ELPR, is essential to harness those opportunities.
It is disappointing to note that the scores in this survey do not, by and large, show any significant improvement over those in the last edition. Mumbai and Pune improved their scores under TAP, due to the passage of the Maharashtra Rights to Public Services Act. The Act assures that essential services are delivered in a time-bound manner and at nominal charges. The state government has notified more than 110 services and says it will make most of them available online in the near future. Kolkata, the best performing city in the last edition, has marginally slipped in the rankings this year.
We believe this survey will serve as a diagnostic for city leaders. It can help them identify the systemic reforms that have to be undertaken to strengthen the governance framework in their cities, ultimately leading to a better quality of life for their citizens.
Janaagraha Centre for Citizenship and Democracy and Jana Urban Space Foundation are committed to partnering with city leaders across the country who are willing to commit to the City-Systems approach for transforming quality of life in their cities.
0 2 4 6 8 10
Does your city have a decentralised system ofSpatial Development Planning?
Can your city implement SDPs successfully?
Does your city encourage Participatory Planning?
Does you city have effective mechanismsto deter plan violations?
Does your city invest adequate fundsin public infrastructure and services?
Does your city have adequate numberof skilled human resources?
Does your city make optimum use ofinformation technology?
AhmedabadBengaluruBhopal
Bhubaneswar
ChandigarhChennai
DelhiDehradun
Hyderabad
Jaipur
KanpurKolkata
Lucknow
LudhianaMumbai
Patna
PuneRaipur
Ranchi
Surat
London
New YorkThiruvananthapuram
Do your city leaders have adequate power?
Is your city truly democratic?
Does your city put out adequate information andfacilitate citizen participation?
How well does your city address citizen complaints?
4
Highlights of Scores

5
In this section, the cities are scored on these four key questions to assess adherence to the process and principles in the development of its spatial plan:
Does your city have a decentralised system of Spatial Development Planning?Can your city implement SDPs successfully?Does you city have effective mechanisms to deter plan violations?Does your city encourage participatory planning?
URBAN PLANNING & DESIGNUrban planning may be described as a technical and political process concerning the welfare of people, control of the use of land, design of the urban environment including transportation and communication networks, and protection and enhancement of the natural environment.
6

Does your city have a decentralised system of Spatial Development Planning?
Decentralised spatial planning allows local empowerment
and favors the successful implementation of urban projects.
Including the lowest levels of urban governance leverages
additional resources and information about the ground
reality. Inclusive planning allows a common strategy to be
adopted and enforced at the city level, therefore curbing the
risk of implementation failures.
Currently, there is a limited interpretation of Spatial
Development Plans (SDPs), which fail to pay attention to rural-
urban integration and neighbourhood-level development.
Haphazard timelines and boundaries of various ULBs and
parastatals further complicate the implementation of vision
statements. The level of coordination between various levels
of urban governance (neighbourhood, city, and region) is
indicative of how authentically citizens’ aspirations and
needs are represented in the plans. This component scores
cities on their efforts at integrated, coordinated planning for
holistic urban development.
STATEAmend Planning Act: » To mandate Regional, Municipal and Ward level plans in a nested structure, with concurrent timelines» To clearly define objective and contents for each level of SDP
Amend Cadre and Recruitment Rules to ensure that adequate skilled workforce is availableConstitute:» A Metropolitan Planning Committee anchored by municipal elected representatives for formulating city’s metropolitan plan» A State Spatial Planning Board with well-defined composition, powers and functions
Create a common digital base map shared by all Planning Authorities which is updated by all civic agencies through GIS at fixed periodic intervals
Immediate
* For a detailed list of reform recommendations, please refer to the section under reforms - Page 36** For details on parameters used for scoring, please refer to Pages 45 & 46
Reform RoadmapListed below are key reforms to be undertaken
7
Ahd
Blr
Bho
Bhu
Chd
Che
Del
Deh
Hyd
Jpr
Kpr
Kol
Lck
Lud
Mum
Pat
Pun
Rai
Ran
Sur
Thi
10 -
9 -
8 -
7 -
6 -
5 -
4 -
3 -
2 -
1 -
LONDON
4.35
4.44.7
1.9
6.4
4.74
4.7 4.94.4
3.7 3.7 3.73.3 3.1 3.1
4.34.4
4.
NEW YORK
794.
In 2003, the Kollam District Planning Committee initiated an Integrated District Development Plan (IIDP) and Local
Development Plan (LDP) under a project of the Kerala State Planning Board. The project aimed to improve the well-
established process of plan preparation in Panchayats and Municipalities, by introducing the “spatial” element in the
decentralised planning process. This element was to be incorporated in every aspect of planning such as: data collection
as part of the stock-taking and envisioning exercise; presentation of data to decision makers in the District Planning
Committee and Panchayats; and visualisation and depiction of the plan. As information was collected and presented
location wise, the exercise prompted thinking in the direction of proper land use planning.
The project also integrated Geographic Information System (GIS) technology into spatial presentations. A sectoral
analysis was carried out for 18 basic services/ primary sectors i.e. health education, water supply, poverty alleviation, etc.
In each sector, problems and initiatives were identified with location-specific details. An analysis of completed projects/
programmes was also carried out with location-specific analysis and suggestions. This incorporated Human Resource
Development and the availability of finances, presenting these aspects spatially. Thus, at every stage of the decentralised
planning and participative planning process, stakeholders were encouraged to give suggestions on the overall development
plan and take decisions on the appropriate locations. Therefore, spatial decisions were also captured in the participative
process with suggestions and solutions prompted by the District Planning Committee. The execution plan, drawn from
this perspective plan is currently under implementation and is being monitored.
The integrated development plan of Kollam is a perspective plan of 15-20 years dealing with long-term issues of settlement
patterns, district-level policies for urban/rural integrated development, best spatial strategies to adopt for optimum resource
utilisation and long-term regional infrastructure projects covering water management, energy, transport network and
tourism. The uniqueness of the Kollam participatory planning exercise lay in the successful conversion of sectoral policies
of various development agencies into spatial plans. The Kollam experience, particularly the methodologies developed by
it can be easily replicated to other districts too.
CASE STUDY : Kollam Decentralised Planning Process
Source: Planning Commission Documents
8
Local Level data collection Draft LDPAnalysis
Development IssuesGoals and Objectives
Development ConceptPolicies and Strategies
Draft IDDP SanctionedIDDP
Block/Jilla Panchayat
Development Plan
Suggestions of LSGI’s
AnalysisAnalysis
Development IssuesGoals and objectives
Development ConceptPolicies and Strategies
Final LDP

Urban Planning And design
Can your city implement SDP’s successfully?
A critical factor for the success of implementation of
metropolitan SDPs is the ability of ULBs to coordinate and
work together when needed. This translates to harmony of
space and time in the planning ideals and objectives. The
lack of a harmonious timeline makes SDPs more vulnerable
to political change and to challenging visions/conflicts in
project implementation which, in turn, has a severe impact
on the delivery of municipal services. This component
assesses the measures and frameworks adopted by the
cities to enable the implementation of spatial plans.
CITY/STATEInstitute» A robust framework to measure success of the SDP against quantitative benchmarks» A mechanism to ensure adequate institutional capacity to enforce SDPs» Urban design standards to guide the execution of urban projects» Single window clearance for development projects that are in conformity with SDPs
CENTRE/STATECreate enabling policies to:» Guarantee land title
» Maximize land utilization for development and financing
Medium-term
Immediate
* For a detailed list of reform recommendations, please refer to section under reforms - Page 36.** For details on parameters used for scoring, please refer to Pages 47 & 48.
Reform RoadmapListed below are key reforms to be undertaken, classified by the relevant level of government.
9
Ahd
Blr
Bho
Bhu
Chd
Che
Del
Deh
Hyd
Jpr
Kpr
Kol
Lck
Lud
Mum
Pat
Pun
Rai
Ran
Sur
Thi
10 -
9 -
8 -
7 -
6 -
5 -
4 -
3 -
2 -
1 -
LONDON
NEW YORK
.9 .9 .9 .9 .9
CITY DEVELOPMENT PLAN 1
98
0
19
90
20
00
20
10
20
20
Mumbai Regional Plan 91 99 11 Under preparation
Greater Mumbai 93 13
Thane
Kalyan-Dombivali 96 16
Ulhasnagar Draft CDP
Ambernath 5 25
Kulgaon-Badlapur 5 25
Navi Mumbai 80 0
Panvel 84 4
Uran 82 98
Bhiwandi-Nizampur 92 2
Mira Bhayandar Road 98 8
Vasai-Virar 92 12
Vasai 98 18
Virar 98 18
Nalasopara 98 18
Navghar-Manikpur 98 18
Khopoli 94 14
Karjat 98 18
Pen 8 2
Alibaug 98
Matheran 80 0
The local development plans of ULBs in the Mumbai Metropolitan Region are clearly disconnected. For example, the
plans of the localities of Vasai-Virar stretch from 1998 to 2018 while Kalyan-Dombivali have theirs extending until 2025.
In Bengaluru, discontinuity in administration
boundaries between different city and state agencies
leads to disrupted decision-making processes, as
well as conflicts over governance. This has dire
consequences on the efficiency of administration in
those areas and affects the delivery of civic services.
Source: City Development Plans* Only 8-10% of plan approved by the Urban Development Department of Maharashta state.
Unconnected start and end dates for local development plans
LEGEND
BMTC Routes
Major Roads
BWSSB Boundary
Source : www.bbmprestructuring.org
Service Provider Jurisdictions in Bengaluru
Incongruent Development Plan Timelines for Mumbai
A Closer Look
BBMP Boundary
BESCOM - Metropolitan Zone
BDA Boundary
BESCOM - Rural Zone
10

Does you city have effective mechanisms to deter plan violations?
Complicated development controls and building codes can
cause confusion and uncertainty. Coupled with the lack of
coordination between planning bodies and enforcement
agencies, this can cause frequent plan deviations. Plan
enforcing agencies remain excluded from the planning
exercise, despite having an implementation-level
understanding of practical problems. This indicate a lack
of accountability in SDP execution. This component looks
at how well cities deter plan violations and manipulations.
CITY/STATEImplement an effective system to monitor and prevent plan violations in a decentralised manner and to penalize the same
Immediate
* For a detailed list of reform recommendations, please refer to the section under reforms - Page 36** For details on parameters used for scoring, please refer to Pages 47 & 48
Reform RoadmapListed below are key reforms to be undertaken, classified by the relevant level of government.
11
LONDON
Ahd
Blr
Bho
Bhu
Chd
Che
Del
Deh
Hyd
Jpr
Kpr
Kol
Lck
Lud
Mum
Pat
Pun
e
Rai
Ran
Sur
Thi
10 -
9 -
8 -
7 -
6 -
5 -
4 -
3 -
2 -
1 -
NEW YORK
Mumbai : Distortion of heritage conservation in urban planning
Regularisation of Unauthorised Colonies in New Delhi
* Final approval from the Centre is awaited Source: Planned Illegalities: The Production of Housing in Delhi 1947-2 10, Gautam Bhan
Source: www.mcgm.gov.in
State government enforces Heritage Conservation Act.
Maharashtra Regional Town Planning Act formed. No provisions
made for heritage conservation
1966 1995 1999
State allows redevelopment
of heritage buildings in
heritage precincts up to 24 mts.
height
2006 2009 2012 2013 to now
Revision of heritage list undertaken by a team of
architects and heritage experts
State allows redevelopment of heritage buildings
in heritage precincts above 24 mts.
BMC publishes revised draft
list of 1323 heritage structures for
public suggestions and objections
Heritage review committee set up to further revise new draft heritage list
First list of 633 notified
heritage structures published.
1996 2008
MHCC submits newly proposed heritage list to BMC & State
1
2
3
4
5
1. No heritage structures/precincts protected.2. Heritage list includes precincts/ structures/ buildings in Mumbai island city. 3. New redevelopment policy threatens heritage character of the city. Exposes list of 633 structures to unplanned
modification4. New redevelopment policy further threatens heritage character. Existing and new proposed list of structures/
precincts exposed to unplanned modification.5. New list of 1323 structures awaits final notification by state government.
It includes 455 originally listed structures + 868 newly proposed structures covering Mumbai suburbs. Incentives to promote heritage conservation recommended to State (awaiting notification).
Today, more than 30% of Delhi’s population lives in illegal settlements. Since the 1960s, Delhi’s flawed masterplans with
insufficient allocation for low-cost housing have led to the mushrooming of illegal housing colonies in the face of large-
scale migration from neighbouring states. Since then, the government has undertaken a range of efforts to legitimize these
settlements.
A Closer Look
12
1962 1975 2009
102 colonies
regularised
567colonies
regularised
733colonies
regularised
Master Plan 1962 M
aster Plan 1962 Master Plan 2021
2012
859colonies
regularised*
Master Plan 2021
Total numberof colonies authorized since 1947 3041

Does your city encourage participatory planning?
Does your city encourage participatory planning?
Participatory planning brings citizens to the fore in shaping
the character of their city. It also helps raise a consensus
around the vision for the city, which in turn, consolidates the
legitimacy of SDPs. Citizens must have a voice in deciding the
vision for the city, choosing the process followed for framing
the vision, and in evaluating its progress. To integrate local
development plans for the city and its peri-urban and rural
surrounding regions, efforts should be co-ordinated between
the Metropolitan, Municipal and Ward-level authorities.
Elected representatives, Area Sabhas and Agencies must
be actively engaged for scrutiny, raising objections and
responses to ensure the SDPs are prepared keeping in mind
equitable development of civic infrastructure and service
delivery. This component evaluates the policies in place to
encourage citizen participation in plan preparation.
CITY/STATEEnforce:» Participation of agencies and elected representatives at respective levels for SDP, i.e. Metropolitan, Municipal and Ward. » Dissemination of SDP and meaningful participation of citizens in its formulation
Medium-term
* For a detailed list of reform recommendations, please refer to the section under reforms - Page 36** For details on parameters used for scoring, please refer to Pages 47 & 48
Reform RoadMapListed below are key reforms to be undertaken, classified by the relevant level of government
13
Ahd
Blr
Bho
Bhu
Chd
Che
Del
Deh
Hyd
Jpr
Kpr
Kol
Lck
Lud
Mum
Pat
Pun
e
Rai
Ran
Sur
Thi
10 -
9 -
8 -
7 -
6 -
5 -
4 -
3 -
2 -
1 -
LONDON
5 5 5 5 5 5 5 5 5 5 5 5 5 5 5 5 5 5 5 5 5
NEW YORK
The Maharashtra Regional Town Planning (MRTP) Act of 1966 specifies that every Municipal Corporation must prepare a
development plan to be implemented over 20 years. The first Development Plan (DP) for Mumbai was adopted in 1967 and
was superseded by the revised DP in 1994. The preparation of DP 1994-2014 started in 1977 and it was finally adopted in
1994. The work on preparation of the Development Plan for 2014-34 was begun by the MCGM in 2011 and was scheduled
to be completed by December 2013.
The Plan, still in its draft stage is delayed by over two years and is expected to be delayed further. While it is mandatory
under the Maharashtra Regional Town Planning (MRTP) Act of 1966, to engage the public in the draft preparation, the
civic administration has been criticized for holding public consultations for previous plans, only after the draft DPs were
at the final stage. However, on account of sustained public pressure, the BMC modified the process in 2012 to seek more
inputs from citizens. MCGM was also accused of not making available existing land use ( ELU) maps, prepared as part of
the planning schedule, to the public.
When the newly proposed Mumbai DP 2014-34 was published in February 2015 for public scrutiny, it was seriously
reproached for its lack of meaningful public participation. Though the BMC had sought inputs through stakeholder
consultation workshops, the final draft of the Development Plan was criticized for not having incorporated citizens
observations and comments. The DP was said to have ignored several crucial aspects in slum mapping, integrating special
planned areas and economic zones etc. Under public pressure, Maharashtra Chief Minister Devendra Phadnavis withdrew
the proposed DP and demanded that a revised plan be prepared with increased public participation.
Source: Planning Commission Documents
For participatory planning to be a meaningful exercise,
the planning authorities must take into account public
suggestions and objections to create a vision that
truly reflects the needs and aspirations of its citizens
and to build public trust. Adequate justification
must be provided if suggestions are not included in
the plan preparation. This is necessary for raising
public ownership of the plan and therefore its better
implementation .
CASE STUDY : Mumbai Development Plan (2014-34)
14Source : www.mcgm.gov.in

15
In this section, the cities are scored on three key questions to assess the quality and strength of their key resources:
Does your city invest adequate funds in public infrastructure and services?Does your city have adequate number of skilled human resources?Does your city make optimum use of information technology?
URBAN CAPACITIES & RESOURCESAdequate financial resources and skilled manpower is a sine qua non for cities and yet in India, it is our weakest link. Any effort to transform Indian cities needs to begin here.
16

Does your city invest adequate funds in public infrastructure & services?
The financial sustainability of ULBs is essential for the
sustenance and growth of cities. The ability of ULB to
invest in improving its infrastructure and civic services
has a significant impact on the quality of life the city can
provide. Yet, municipal revenues continue to underperform,
accounting for barely 0.75 % of India’s GDP. To enhance
sustainability, financial independence (including powers
for raising resources, investment and expenditure) is a
necessity. This component scores the cities on the adequacy
of the laws and policies governing their fiscal powers and
their adherence to sound budgetary practices.
STATEAmend Municipal Corporation Act to:» Mandate a medium-term Fiscal Plan » Empanel CAs to audit annual accounts» Make public the Annual Report with audited annual accounts, operational performance, including service levels, significant projects accomplished, best practices, risks and mitigants and plans for subsequent year» To fully devolve powers to set tax rates and the underlying base values to the city in respect of:Entertainment tax. Establish a comprehensive and integrated financial management information system for the city and its constituent entities, which can serve as a City Resource Planning platform, on the lines of an ERP system for the city
STATEAmend Municipal Corporation Act to fully devolve powers to set tax rates and the underlying base values to the city in respect of: Property tax & Profession tax
CITYEstablish a Land and Property Management division to:» Create a GIS-based database of all land and property owned by the central, state and city governments in the city » Optimise return on assets» Mark to Market lease agreements
CENTREMake all municipal bond issuances tax-exempt, incentivise insurance companies and pension funds to invest in the same
Medium-term
Immediate
* For a detailed list of reform recommendations, please refer to the section under reforms - Pages 37** For details on parameters used for scoring, please refer to Pages 49 & 50
Reform RoadmapListed below are key reforms to be undertaken, classified by the relevant level of government.
17
Ahd
Blr
Bho
Bhu
Chd
Che
Del
Deh
Hyd
Jpr
Kpr
Kol
Lck
Lud
Mum
Pat
Pun
Rai
Ran
Sur
Thi
10 -
9 -
8 -
7 -
6 -
5 -
4 -
3 -
2 -
1 -
LONDON
NEWYORK
4.4
1.6 1.5
2.2
3.1
1.9
4.5
2.8 2.83.1
2.62.9
2
4.44
1.2
3.3
4.3
3.4
1.8
4.2
Ahmedabad Bengaluru Chennai Pune Bhubaneswar Patna TVM
1,480
3,753
1,445
3,343 27%
909
3,366
85.5%
2,7083,167
21.1%
61289
50.9%
115 226
62.1%
90 145
Own Revenue (Rs Cr)
Total Expenditure (Rs Cr)
Own Revenue as a % of Total Expenditure
43.2%39.4%
Own Revenues / Total Expenditure
Budgeted Capex vs Actual Revenue surplus / deficit
Where does the money come from and where does it go?
Salaries and wages constitute a significant portion of municipal expenditure, leaving little for capital expenditure. Cities remain heavily dependent on state and central grants to fund civic infrastructure.
Property Tax
Other Taxes
Non-Tax own revenue
Assigned Revenue
Transfers
Capital receipts
Operations & Maintenance
Salary & Wages
Other Establishment costs
Interest Cost
Others
Capital expenditure
Income Expenditure
16%
8%
7%
41%
19%
8%
11%
24%
41%
0.26%
0.13%
23%
Lacs Lacs
Source: Municipal Corporation Budgets (Actuals 2013-14)
Source: Chennai Municipal Corporation Budget (Actual 2013-14)
Source: Municipal Corporation Budgets (Actuals 2013-14)
A Closer Look
826
-114
2,271 2,293
585 174
-680
5,704
-259
1,775
-147
665
-2000
0
2000
4000
6000
Bengaluru Bhubaneswar Chennai Hyderabad Kolkata Surat
(Rs Cr)
Budgeted Capex
Actual Revenue deficit
Actual Revenue surplus
18

ULBs must be equipped with adequate number of skilled
human resources to satisfactorily dispense all of its
responsibilities. In order to be run efficiently, it is essential
to empower the ULB with powers for managing their human
resources to achieve desired results. This component scores
the cities on the adequacy of the policies governing their
manpower resources, including adequacy of manpower,
stability of top leadership and relevant experience.
Does your city have adequate number of skilled human resources?
STATEUpdate Cadre and Recruitment Rules incorporating the following:» Detailed and specific job descriptions» Dynamic workforce planning» Lateral hiring in key departments » Security of tenure of at least 3 years for senior leadership
CITYExplore outsourcing of tax and fee collections such as property tax, parking fee and non-core activitiesImplement a medium-term workforce plan and an annual workforce plan linked to target service levels, which
is factored into annual budgets
STATEUpdate Cadre and Recruitment Rules incorporating the following:» Introduction of performance incentives and a robust performance evaluation process
Medium-term
Immediate
* For a detailed list of reform recommendations, please refer to the section under reforms - Pags 37** For details on parameters used for scoring, please refer to Pages 51 & 52
Reform RoadmapListed below are key reforms to be undertaken, classified by the relevant level of government.
19
Ahd
Blr
Bho
Bhu
Chd
Che
Del
Deh
Hyd
Jpr
Kpr
Kol
Lck
Lud
Mum
Pat
Pun
Rai
Ran
Sur
Thi
10 -
9 -
8 -
7 -
6 -
5 -
4 -
3 -
2 -
1 -
LONDON
3.5
4.6
2.3
3.8
1.7
6
1.61.2
3.6
1.7
2.9 2.8
1.21.7
NEW YORK
6.7
5.5
4.1 4.23.5 3.8
0.3
Staff Vacancies in Municipal Corporations
There are fewer registered planners than the census towns in India
Most corporations have huge vacancies which severly impacts the quality of service delivery and operational efficiency
Raipur has had eight commissioners in the last 5 years
Average tenure of a municipal commissioner in office
Source: Parliamentary Question, Rajya Sabha
Source: Municipal Corporation Data
Note : Data covers tenure for previous two CommissionersSource: Municipal Corporations
(yrs
)
Patna
Bangalore
Mumbai
Chennai
52%
21%
64%
14%
7935 Census towns
5000 Registered town
planners
0
1
2
3
4
5
AhmedabadRaipur Bengaluru Pune Chennai Hyderabad Surat Mumba i
A Closer Look
20
0.7
1.11.5
1.92.2
3.63.8
4.1

Does your city make optimum use of information technology?
Information Technology comprises, digital media and tools
for enhancing the productivity of individual employees
and the connectivity within the organization to augment
decision-making processes and render quality services to
citizens through more efficient and transparent structures.
Information Technology tools for Municipalities include
web-based citizen services like property tax payments or
birth-death registration and enterprise management tools
such as Management Information System (MIS), Financial
Management System (FMS), or Performance Management
System (PMS)
This component scores the cities on how well they have
harnessed technology including sharing of information
online on schemes and services rendered and the use of
e-procurement systems
CITYLeverage digital platforms including the ULB website and social media platforms for two-way engagement with citizens for sharing information and soliciting feedback to improve service delivery
CITYImplement a real-time works management system to track the lifecycle of each civic work with detailed schedule, progress, payment schedule
Medium term
Immediate
* For a detailed list of reform recommendations, please refer to the section under reforms - Pages 37** For details on parameters used for scoring, please refer to Pages 51 & 52
Reform RoadmapListed below are key reforms to be undertaken
21
LONDON
Ahd
Blr
Bho
Bhu
Chd
Che
Del
Deh
Hyd
Jpr
Kpr
Kol
Lck
Lud
Mum
Pat
Pun
Rai
Ran
Sur
Thi
10 -
9 -
8 -
7 -
6 -
5 -
4 -
3 -
2 -
1 - .6
5
.61.7
3.9
5
1.7 1.7 1.7 1.7
3.9
1.7
5
1.7
5
1.7
5
1.10.6
NEW YORK
3.9
Wor
kflo
ws
Wat
er C
harg
es
Proper
ty T
ax
Works
Management
Payroll & Pension
Inventory Management
Asset ManagementGrievance &
Redressal
Building Plan
Approval
Birth
& D
eathMar
riag
e R
egis
trat
ionCounci
l
Man
agem
ent
Legal Case
Management
File
Management
Employee Management
User Charges
Land & Estate
Licenses
Ad
vertisement
Revenue
Wo
rkfl
ow
s
Reports Receivables
Expenditure
Citizen
Payables
Bud
get
Ad
min
MunicipalAccounting
Rs 13,610 Cr, 5.1Lakh payments, 33 lakh financial vouchers
1.5Lakh Complaints, 80% complaint resolution
Tracked 11.5Lakh properties, collected Rs 1,400 Cr and allowed online assessment
45,000 work orders, 69,000 contractor payments, Rs 5,676 Cr, Efficiency gain: 400 MANYEARS
9,000 plans, of which 6,000 approved
City Dashboard
Citizen Porta
l
Mob
ile G
over
nanc
e
Chennai Municipal Corporation is the oldest Municipal Corporation in India, having been established on September 29,
1688. The city has grown in size, with a population of 6.5 million spread over 426 sq. km. To provide efficient services to
citizens, administrators and elected representatives, the Corporation of Chennai opted implemented an integrated web
-based ERP that would cater to all its departments. The implementation of the eMunicipal ERP was undertaken with the
help of eGovernments Foundation in 2009.
The objectives of the implementation included:
Re-engineering processes for better service delivery to the beneficiaries.
Shift from process accountability to productivity accountability and from transactional to transformative governance.
Improvement of administrative processes by cutting cost and managing performance.
Empowering officials and decision makers with accurate information using the data captured.
Provision of integrated and simplified services to citizens with single-window delivery for services and information.
Over the last 7 years, the Corporation has notched up significant successes:
building plan approval, application etc.
CASE STUDY: Chennai Corporation e-Municipal ERP
Source: e-governments foundation
22

23
EMPOWERED & LEGITIMATE POLITICAL REPRESENTATIONCity Councils speak for the people of the city. As the body elected by urban citizens and representative of them, the quality of the Council, the powers it exercises and its legitimacy are important factors which determine the quality of life that citizens enjoy.
In this section, the cities are scored on two key questions to assess if the City Councillors are truly empowered and legitimate:
Do your city leaders have adequate power?Is your city truly democratic?
24

Even after the passage of 22 years since the 74th
Amendment to the Constitution, several of its provisions
relating to the devolution of powers and functions to ULBs
are yet to take effect. While a ULB in India does not have
legislative powers, it is an elected body responsible for
providing citizen-centric services and infrastructure in the
city. Delivery of these functions requires adequate powers
– executive and financial – to be devolved to the council
who are legitimate representatives of the citizens. This
component scores the cities on the level of devolution, in
respect of powers of the elected representatives.
STATEEnsure Councillors are reasonably compensated and are equipped with adequate resources
STATEAmend Municipal Corporation Act to : » Extend the term of Mayor to 5 years» Devolve all 18 functions to ULBs, as stated under Schedule 12 of the Constitution of India» Grant reasonable powers to the Council over budgets, expenditure, investments, loans and certain city specific policiesRevise the number of wards and delimit ward boundaries based on the city’s spatial growth
Medium-term
Immediate
* For a detailed list of reform recommendations, please refer to the section under reforms - Page 38** For details on parameters used for scoring, please refer to Pages 53 & 54
Reform RoadmapListed below are key reforms to be undertaken, classified by the relevant level of government
25
Ahd
Blr
Bho
Bhu
Chd
Che
Del
Deh
Hyd
Jpr
Kpr
Kol
Lck
Lud
Mum
Pat
Pun
Rai
Ran
Sur
Thi
10 -
9 -
8 -
7 -
6 -
5 -
4 -
3 -
2 -
1 -
LONDON
NEW YORK
1.3
2.8
4.4
.8 .8
2.1
4.6
1.21.6
4.8
Do your city leaders have adequate power?
0.8
4.3 4.3 4.2 4.2
2.9
4.7
2.5
1.1
3.7
2.7
Many cities grant a one-year term for its mayor significantly weakening city leadership
A Closer Look
A Mumbai Councillor represents 7 times the citizens represented by his counterpart in Thiruvananthapuram
In most cities, the Councillors are paid even lesser than Grade D employees
Avg. constituency size : 7,437
Thiruvananthapuram Mumbai
Avg. constituency size : 54,812
Clerk
53,534
Driver
41,302
Sweeper
30,088
Peon
25,624
Mayor
7,500
Councillor
2,175
0
20000
40000
60000
80000
100000
120000
Commissioner
104,114
Source: Jaipur Municipal Corporation
Source: Census of India
Rs p.m.
Ahmedabad Bengaluru Bhubaneswar Chennai Mumbai
2.5yrs
1yr
5yrs
5yrs
1yr
Source: Municipal Corporation Acts
26

CENTREInstitutionalise a process for maintaining accurate voter lists
Immediate
Is your city truly democratic?
For a city to flourish, urban governments must be democratic
and take into account citizens’ aspirations. As the third tier
of urban governance, voter turnout and adequate numbers
of elected Councillors for citizens shows how well the
population’s needs are represented in Municipal Councils.
The establishment of SECs with adequate controls is
indicative of states’ eagerness to devolve powers for good
quality city governance. This component scores cities based
on the strength of their democracy in law and practice. It
scores the cities on aspects such as voter participation in
local body elections and the powers of the State Election
Commission
CENTREAmend Representation of People Act (RPA), 1951 to include public disclosure of income, assets (including securities and equity in private corporations), and liabilities of Councillors and all related party interests
STATEDevolve the power to delimit ward boundaries to the State Election Commission
Medium-term
* For a detailed list of reform recommendations, please refer to the section under reforms - Page 38** For details on parameters used for scoring, please refer to Pages 53 & 54
Reform RoadmapListed below are key reforms to be undertaken, classified by relevant level of government
27
Ahd
Blr
Bho
Bhu
Chd
Che
Del
Deh
Hyd
Jpr
Kpr
Kol
Lck
Lud
Mum
Pat
Pun
e
Rai
Ran
Sur
Thi
10 -
9 -
8 -
7 -
6 -
5 -
4 -
3 -
2 -
1 -
LONDON
5.34.5
7 7.3
4.85.3
7.5
8.89.3
7.37
9.5
5.3
NEW YORK
55.
7.3
4.8 4.8 4.8
5.8
6.8 6.8
Over 66 % of the spending in the city of Bengaluru is outside the purview of the elected Council.
More cities experience lower voter turnout in municipal elections. Notable exceptions are Kolkata and Thiruvananthapuram where voter turnouts are at par with turnouts for Lok Sabha elections.
Source: Election Commission of India
Source: ISEC compilation: Revised Estimate 2014-15
BBMP
BDA
BWSSB
BMTC
BMRCL
BESCOM
`2,927
16%
9%
6%14%
7%
4%
`2,601
`1,694
`1,156
`1,384
`804
0
10
20
30
40
50
60
70
80
Ahmedabad Chennai Delhi Hyderabad Kolkata Ranchi Thiruvananthapuram
7066 66
53
66 656869
6265
53
68
64
69
44
48
58
46
69
38
69
Urban Local Body State Assembly Lok Sabha
A Closer Look
28
29
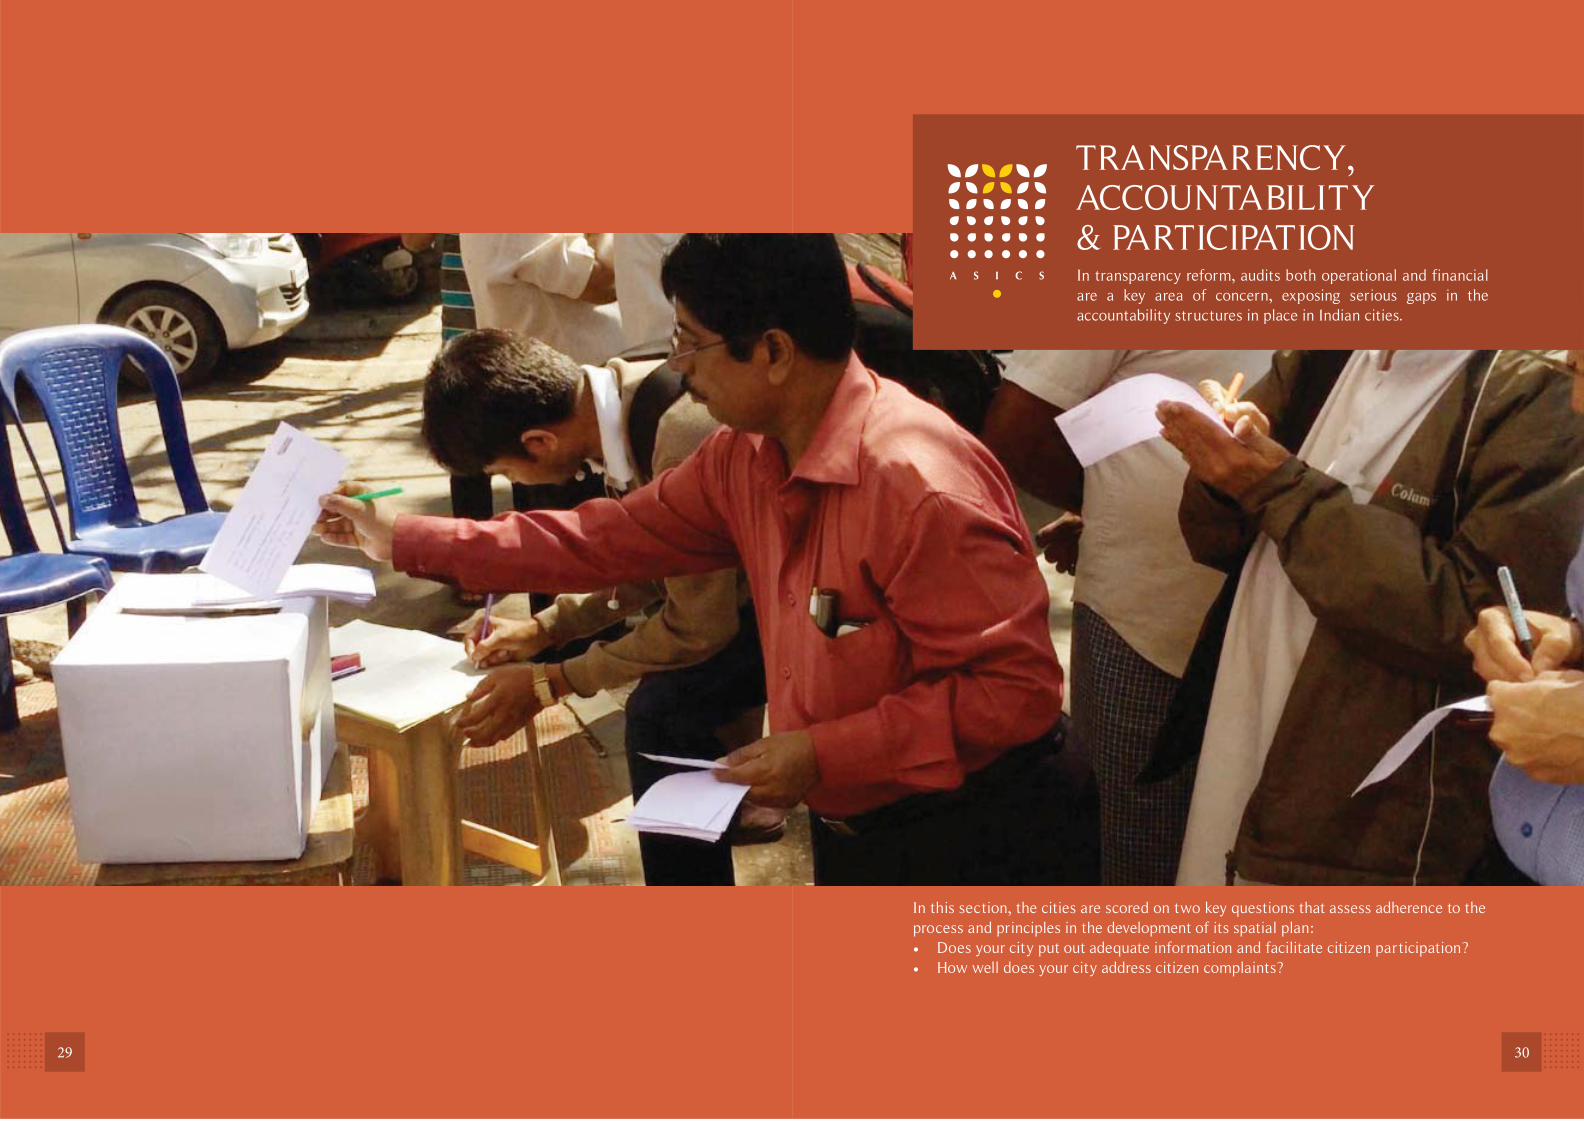
TRANSPARENCY, ACCOUNTABILITY & PARTICIPATIONIn transparency reform, audits both operational and financial are a key area of concern, exposing serious gaps in the accountability structures in place in Indian cities.
In this section, the cities are scored on two key questions that assess adherence to the process and principles in the development of its spatial plan:
Does your city put out adequate information and facilitate citizen participation?How well does your city address citizen complaints?
30

Does your city put out adequate information and facilitate citizen participation?
Increased transparency in the functioning of city
governments is fundamental to fostering public trust and
improving the quality of life. Presently, most Indian cities
have a poor track record of disclosing accurate up-to-date
information on its various policies and decisions for citizens.
This section assesses the quality of public disclosure of
local bodies such as, information on its financial position,
audit information and quality of services rendered. This
component scores the cities on the implementation of laws
on Public Disclosure and Community Participation.
CITYCreate and maintain a robust, user-friendly website which serves as the primary source of information of all services and functions of the ULB. Institutionalise a process to ensure regular and accurate sharing of information on the sameCreate a position of Chief MIS Officer with a team of specialist staff for regular and systematic release of accurate data relating to the operations and performance of the ULBImplement a practical Participatory Budgeting cycle, where a portion of the city’s budget is allocated based on citizens’ inputs
CITYAdopt Open-Data standards, publish both raw and synthesised data in public domainMake the information based on real-time Works Management System accessible to citizens at the neighbour-hood/street level with end-to-end information including lifecycle of each civic work, vendor information, progress and payment schedule
Medium-term
Immediate
* For a detailed list of reform recommendations, please refer to the section under reforms - Page 38** For details on parameters used for scoring, please refer to Pages 55 & 56
Reform RoadmapListed below are key reforms to be undertaken
31
Ahd
Blr
Bho
Bhu
Chd
Che
Del
Deh
Hyd
Jpr
Kpr
Kol
Lck
Lud
Mum
Pat
Pun
Rai
Ran
Sur
Thi
10 -
9 -
8 -
7 -
6 -
5 -
4 -
3 -
2 -
1 -
LONDON
NEW YORK
2.7
6.35.7
3.2
4
2.5 2.5
6.7
1.7
5.55
5.54.8
5.8
4.2
5.8
4.2
3.32.8
5.5
3.3
What is the quality of infrastructure and services that I experience?
Budgetary allocations along with infrastructure quality data, is used to push for effective civic work allocations across
the city.
Data obtained from the government is digitized, spatially mapped and fed into measuring the quality of the available infrastruc-
ture and services.
The lifecycle of civic works in the city are tracked in order to drive quicker turnarounds in government and in turn create/update existing civic datasets.
The Ward/Street Quality Score is the assessment of infrastructure and services in city wards, and provides objective data to serve as the basis for budgetary allocations in the city.
What is the current availability of infrastructure and services in my neighbourhood?
BudgetBriefs
Works MIS
Ward/StreetQuality
Score
Open Civic Data
If budgets are allocated, then how is the work progressing?
How much budget is allocated to improve infrastructure and services in my neighbourhood?
A Closer Look
Janaagraha’s Open Works platform envisages a seamless integration of data, in driving the decision-making processes in
Bengaluru. Through a periodic assessment of the adequacy and quality of infrastructure and services available in a ward,
it aims to inform work and budgetary allocations in the city, by also making the acquired data understandable and usable
by both citizens and government officials.
The recent release of Janaagraha’s Street Quality Score (SQS) 2015 was a step forward in this connection. SQS is an
objective measure of street-level quality of life (Footpaths, Pedestrian Crossings, Street Lighting, Bus Stops and Air
Pollution) in Bengaluru. The underlying street-level data that was collected highlights the fact that Bengaluru requires
more targeted budgeting measures to ensure that resources are specifically allocated to the wards/sectors that need the
most work, in order to gradually improve the quality of life in the city.
Decisions made based on data, along with citizen participation, drive a more significant and transparent process of
prioritization of funds and works and keeps elected representatives accountable to any variances in priorities, to gradually
enable a more participatory budgeting process.
32

How well does your city address citizen complaints?
As providers of civic services, Municipalities are obliged to
address gaps in services and complaints received. Citizens are
their primary stakeholders, under whose taxes and elected
legitimacy Municipalities operate. Grievances received from
citizens can be on the quality of service or the quality of
infrastructure in their neighbourhood. The scores below
assess the approaches adopted by Municipalities across
India to address citizens’ grievances. A robust mechanism
for citizens to air their grievances and seek redressal is a
necessary component of a healthy urban democracy. This
component scores the cities on the mechanisms they have
in place to address citizen complaints effectively.
CITYPublish actual and target service levels for various functions provided by the city on its website Institute an effective complaint management system Put in place a system to measure citizen satisfaction levels and publish the same at frequent intervals
CITYEstablish an office of Ombudsman, with responsibility for civic service issues and inter-agency coordination
Medium-term
Immediate
Reform RoadmapListed below are key reforms to be undertaken
33
* For a detailed list of reform recommendations, please refer to the section under reforms - Page 38** For details on parameters used for scoring, please refer to Pags 57 & 58
Ahd
Blr
Bho
Bhu
Chd
Che
Del
Deh
Hyd
Jpr
Kpr
Kol
Lck
Lud
Mum
Pat
Pun
Rai
Ran
Sur
Thi
10 -
9 -
8 -
7 -
6 -
5 -
4 -
3 -
2 -
1 -
LONDON
2.5
3.9 3.9 3.9
0.7
2.5
3.63.9
3.23.9
2.5 2.5
1.4
2.1 2.12.5
4.3
1.4
2.52.5
NEW YORK 7.5
0
500
1000
1500
2000
2500
3000
3500
Issues Complaints
Riding without a helmet
No parking
Parking on footpath
GarbageBad roads
5413 (9.23%)
3903 (6.65%)
2743 (4.68%)
2508 (4.28%)2116 (3.61%)
Ward Complaints
BellanduruDodda NekkundiShantala NagarSampangiram NagarKoramangala
1185 (3.64%)1037 (3.18%)1011 (3.10%)892 (2.74%)709 (2.18%)
0
200
400
600
800
1000
Open
On the job
Resolved
Open
On the job
Resolved
BBMP
I Change My City (www.ichangemycity.com), an online initiative of Janaagraha, is a social network that allows users to
build communities of active citizens at the local level, using online grievance-redressal as a trigger. The complaints that
citizens post on www.ichangemycity.com are forwarded to the civic agencies in the city and are followed up actively for
resolution. The portal also encourages citizens to vote up on issues and work with their neighbours in resolving civic issues
at the neighbourhood level.
ICMyC has on-boarded seven parastatal agencies which oversee the majority of Bengaluru’s infrastructure and services.
They include: BBMP, Bengaluru Development Authority (BDA) and Bengaluru Water Supply and Sewerage Board (BWSSB).
There are currently over 3.5 lakh ICMyC users, who have logged in more than 1,25,000 complaints. The portal reported
a resolution rate of 50%.
CASE STUDY : Janaagraha’s IChangeMyCity
Location map of complaints
Complaints by Agency
Complaint categories
Ward wise data
Source: www.ichangemycity.com34
BTP
BBMP
BMTC
BWSSB
BESCOM
KSPCB
BCP
BDA
KSFES
KSRTC
25,882
25,258
2173
2297
894
121
82
37
15
3
Others
Bangalore Electric Supply Company Limited
Bangalore Traffic Police
Bruhat Bengaluru Mahanagara PalikeBangalore Water Supply and Sewerage Board
Bangalore Metropolitan Transport Corporation
258
25,882
25,258
894
2,297
2,173
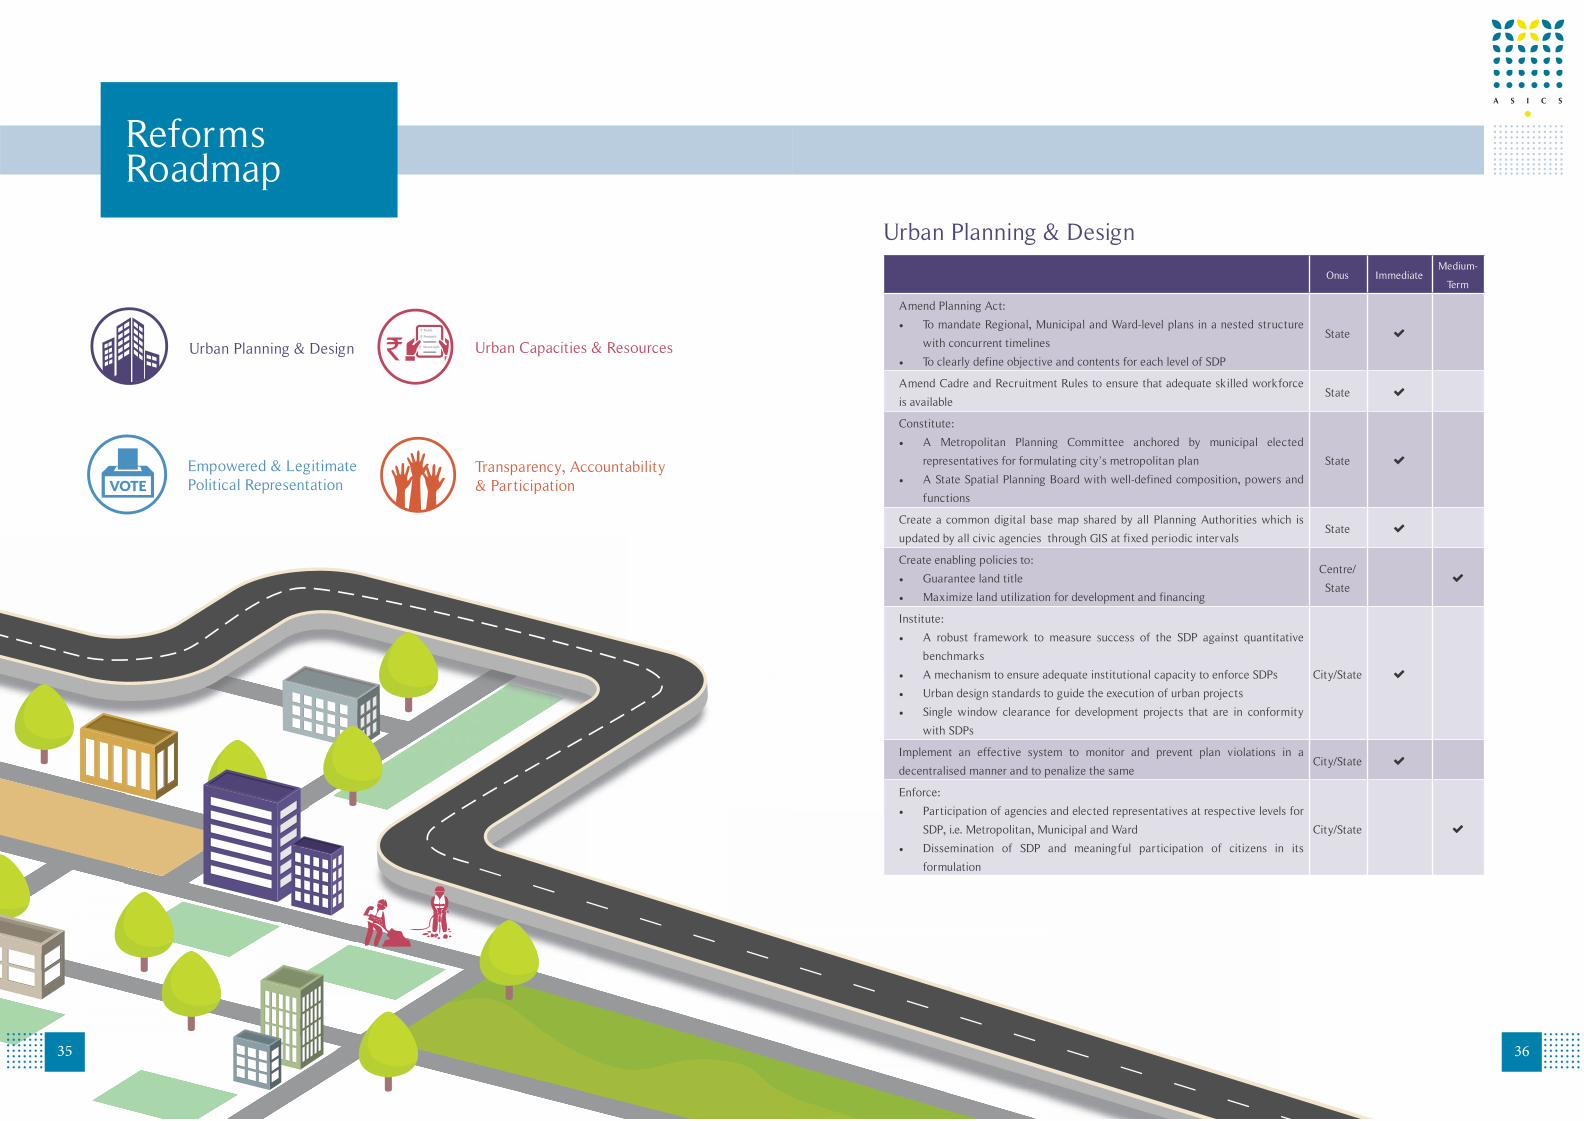
Urban Planning & Design
Transparency, Accountability& Participation
Empowered & Legitimate Political Representation
Urban Capacities & Resources
Reforms Roadmap
35
Onus ImmediateMedium-
Term
Amend Planning Act:
To mandate Regional, Municipal and Ward-level plans in a nested structure
with concurrent timelines
To clearly define objective and contents for each level of SDP
State
Amend Cadre and Recruitment Rules to ensure that adequate skilled workforce
is availableState
Constitute:
A Metropolitan Planning Committee anchored by municipal elected
representatives for formulating city’s metropolitan plan
A State Spatial Planning Board with well-defined composition, powers and
functions
State
Create a common digital base map shared by all Planning Authorities which is
updated by all civic agencies through GIS at fixed periodic intervalsState
Create enabling policies to:
Guarantee land title
Maximize land utilization for development and financing
Centre/
State
Institute:
A robust framework to measure success of the SDP against quantitative
benchmarks
A mechanism to ensure adequate institutional capacity to enforce SDPs
Urban design standards to guide the execution of urban projects
Single window clearance for development projects that are in conformity
with SDPs
City/State
Implement an effective system to monitor and prevent plan violations in a
decentralised manner and to penalize the sameCity/State
Enforce:
Participation of agencies and elected representatives at respective levels for
SDP, i.e. Metropolitan, Municipal and Ward
Dissemination of SDP and meaningful participation of citizens in its
formulation
City/State
Urban Planning & Design
36

37
Onus ImmediateMedium-
term
Amend Municipal Corporation Act to:
Mandate a medium-term Fiscal Plan
Empanel CAs to audit annual accounts
Make public the Annual Report with audited annual accounts, operational
performance, including service levels, significant projects accomplished, best
practices, risks and mitigants and plans for subsequent year
To fully devolve powers to set tax rates and the underlying base values to the
city in respect of:
Property tax
Profession tax
Entertainment tax
State
Establish a comprehensive and integrated financial management information
system for the city and its constituent entities, which can serve as a City Resource
Planning platform, on the lines of an ERP system for the city.
State
Establish a Land and Property Management division to:
Create a GIS-based database of all land and property owned by the central,
state and city governments in the city
Optimise return on assets
Mark to Market lease agreements
City
Make all municipal bond issuances tax-exempt, incentivise insurance companies
and pension funds to invest in the sameCentre
Update Cadre and Recruitment Rules incorporating the following:
Detailed and specific job descriptions
Dynamic workforce planning
Introduction of performance incentives and a robust performance evaluation
process
Lateral hiring in key departments
Security of tenure of at least 3 years for senior leadership
State
Explore outsourcing of tax and fee collections such as property tax, parking fee
and non-core activitiesCity
Implement a medium term workforce plan and an annual workforce plan linked to
target service levels which is factored into annual budgetsCity
Implement a real-time works management system to track the lifecycle of each
civic work with detailed schedule, progress, payment scheduleCity
Leverage digital platforms including the ULB website and social media platforms
for two-way engagement with citizens for sharing information and soliciting
feedback to improve service delivery
City
Urban Capacities and Resources
Onus ImmediateMedium-
Term
Amend Municipal Corporation Act to : Extend the term of Mayor to 5 yearsDevolve all 18 functions to ULBs as stated under Schedule 12 of the Constitution of IndiaGrant reasonable powers to the Council over budgets, expenditure, investments loans and certain city specific policies
State
Revise number of wards and delimit ward boundaries based on the city’s spatial growth
State
Ensure Councillors are reasonably compensated and are equipped with adequate resources
State
Amend Representation of People Act (RPA), 1951 to include public disclosure of income, assets (including securities and equity in private corporations), and liabilities of Councillors and all related-party interests
Centre
Institutionalise a process for maintaining accurate voter lists Centre
Devolve the power to delimit ward boundaries to the State Election Commission State
Onus ImmediateMedium-
Term
Create and maintain a robust, user-friendly website which serves as the primary
source of information of all services and functions of the ULB. Institutionalise a
process to ensure regular and accurate sharing of information on the same
City
Create a position of Chief MIS Officer with a team of specialist staff for regular
and systematic release of accurate data relating to the operations and performance
of the ULB
City
Adopt open-data standards, publish both raw and synthesised data in public domain City
Make the information based on real-time Works Management System accessible to
citizens at the neighbourhood/street level, with end-to-end information including
lifecycle of each civic work, vendor information, progress and payment schedule
City
Implement a practical Participatory Budgeting cycle, where a portion of the city’s
budget is allocated based on citizens’ inputsCity
Establish an office of Ombudsman, with responsibility for civic service issues and
inter-agency coordinationCity
Publish actual and target service levels for various functions provided by the city
on its websiteCity
Institute an effective complaint management system City
Put in place a system to measure citizen satisfaction levels and publish the same at
frequent intervalsCity
Empowered & Legitimate Political Representation
Transparency, Accountability & Participation
38

ASICS 2015 Geographical distribution of cities
Figure 1.0Source: Census of India 2011*All population in millions
Raipur
Medium City 0.5 million - 1 million
Large City 1 million - 5 million
Mega/Emerging Mega City >5 million
Ludhiana
1.6
0.9
0.5
11
2.8
2.7
1.6
1.0
4.4
0.81.0
12.4
3.0
5.5
1.7
4.4
3.1 6.7
8.4
4.6
0.7
Chandigarh
Delhi
Jaipur
Ahmedabad
Bhopal
Surat
Mumbai
Pune
Bangalore
Thiruvananthapuram
Chennai
Hyderabad
Bhubaneswar
Kolkata
Ranchi
Patna
Kanpur
Lucknow
Dehradun
39
The approachThe third edition of ASICS builds on the approach taken in the editions in 2013 & 2014. It is an objective benchmarking
of 21 cities on 83 questions, covering 112 parameters, and takes a systematic, data-driven approach towards urban
governance.
ASICS does not focus on the dysfunctional aspects of Indian cities that stare out at citizens-the potholed roads,
lack of 24x7 water supply, unfettered proliferation of slum settlements or over-stretched public transport. It seeks to
highlight the flawed legislations, policies, processes and practices that lie at the root of these issues.
ASICS devises a quantitative assessment, that is reflected in individual scores. The scoresheet that is comparable
across cities is meant to provide administrators and policymakers with a diagnosis of systemic reforms needed in
their respective areas. It also seeks to identify and acknowledge innovations in governance and best practices across
cities, which could provide valuable peer learning.
The questionnaire is divided into four parts as follows:
Components of the City-Systems framework Number of Questions
Urban Planning and Design 33
Urban Capacities and Resources 20
Empowered and Legitimate Political Representation 11
Transparency, Accountability and Participation 19
Key modificationsASICS acknowledges that urbanisation is a dynamic process. This Edition of ASICS has sharpened its approach from
last year. Measuring urban governance is complex with regard to laws, policies, practices and institutions and ASICS
2015 has devised a sharper approach to measurement. Accordingly 12 new questions have been added and 12 from
the previous year were dropped.
Selection of citiesThe third edition of ASICS employs the size (in terms of population) and the geographic distribution of cities as the
main selection criteria. The coverage has been retained at 21 cities.
Thus, the scope of ASICS 2015 comprises five mega-cities (population of 5 million -10 million or more), 12 large
cities (population of 1 million-5 million) and four medium cities (population of 0.5 million-1 million), as depicted in
Figure 1.0. The 21 ASICS cities constitute 21% of India’s urban population.
London and New York have been retained as global benchmarks from the previous editions given that they are cities
with functional democracies and are widely considered to be offering their citizens a high quality of life.
Methodology
40

41
Selection of categories and questionsThe questions have been categorized into four parts, drawing from the city-systems framework of Janaagraha :
Urban Planning & Design, Urban Capacities and Resources; Empowered and Legitimate Political Representation; and
Transparency, Accountability and Participation.
The questions used to evaluate cities were drawn from Janaagraha’s experience of over a decade in urban governance
reforms . We also used as a basis for framing questions some relevant laws, policies and administrative reports. These
included the 74th CAA, Report of the Second Administrative Reforms Commission, Report of the Fourteenth Finance
Commission, the NUSPD guidelines and reform conditions from JnNURM. A clear rationale was adopted to ensure
that the questions comprehensively represented polices, institutions, processes and aspects of implementation which,
if fixed, could substantially transform the shape of our cities and ensure a better quality of life to citizens.
Data collectionData collection spanned a period of six months. Latest amendments in laws and policies have been factored in and
we have taken care to ensure that the data collected in the early months was re-checked for its latest available form.
We continuously encountered a lack of transparency within governments while seeking information as basic as the
budgets of ULBs, SDPs and audit reports. We also relied on phone calls to relevant government and ULB officials
and on the opinions of experts such as former Chief Town Planner of the Town and Country Planning Organisation -
Government of India - Prof. E F N Ribeiro. For a detailed break-up of sources, please refer to Data Sources on Page 58.
Scoring & WeightageAll questions have been scored on a range of 0 to 10, with 10 being the highest that a city can score. Select questions
have been divided into sub-questions and given graded scores to ensure that various facets are captured within a
single parameter. For instance, ULBs have been assessed for preparing and implementing SDPs. The sub-questions
effectively capture the essence of devolution by specifically evaluating cities on three levels of planning - Metropolitan
SDPs, Municipal Plans and Ward SDPs. ASICS presents an overall score only to provide a more holistic representation
of the data.
Uniform weightage has been assigned to individual questions. We believe each question probes a defining quality and
is equally important for building a City-Systems framework. Each category within the City-Systems framework has
also been weighted equally.
Explanatory ScheduleWe have provided explanations for some of the questions listed below, as their evaluation deserved elucidation beyond
the Scoring Method that is carried in the individual scorecards.
UCRQ) What is the Percentage of own revenues to total expenditure for the ULB?
We have evaluated this question by computing the revenues generated by the ULB on its own, as a percentage of the
ULBs’ total expenditure, from the 2013-14 revised budget estimates of ULBs. This percentage was subsequently
reflected into a score on 10.
42
Q) Does the ULB have adequate staff commensurate with the population?
We considered the total number of ULB employees, which included permanent staff as well as contractual workers.
We subsequently computed the ratio of employees per lakh population and the figure for individual cities was
benchmarked against Delhi, which had the highest number of staffers.
Q) Have five SFCs been constituted by the state government?
We derived the periodicity for the setting up of SFCs from the 74th CAA. Accordingly, states are required to have
constituted five SFCs in the period between 1994 and 2015. We factored in the requirement for newly-formed
states such as Chhattisgarh, Jharkhand and Uttarakhand to have only three SFCs. We have scored cities as 10 for
constituting all five SFCs, 7.0 if they constituted four, 5.0 if the constituted three, 3.0 if they constituted two, and
1.0 if they constituted one.
ELPRQ) Is the ULB responsible for providing 10 specific and critical functions and the services?
We checked whether 10 critical civic functions have been devolved from State list to the ULB. Seven of these
parameters (urban planning, planning for economic and social development, roads and bridges, water supply,
fire and emergency services, promotion of cultural, educational and aesthetic aspects and urban environment
management & heritage) were selected from XIIth Schedule functions and the other three (public health,
traffic management and civic policing activities) from recommendations of the Second Administrative Reforms
Commission. Each function was scored on 1.0.
TAPQ) Does the ULB have single-window civic service centres?
We evaluated civic centres on whether they provide services such as issue of birth/death certificates, payment of
bills, payment of property tax, and complaint redressal, and whether they meet the criteria of population coverage
of one civic service centre per one lakh population.
Additional pointsWe have used the term ‘city’ throughout the report and have considered the ULB and its population for this
purpose.
The scores for Delhi reflect the juridiction covered by North Delhi Municipal Corporation, South Delhi Municipal
Corporation and East Delhi Municipal Corporation.
MCD has been given zero for Capex due to the non-availability of the budget.
In UPD, Bhubaneswar and Dehradun have population of less than one million and have been scored as NA. As
per the 74th CAA, UA/ULB with more than one million population are required to have MA demarcated and
SDPs to be prepared for the same.

Municipal Corporation Acts City
Bombay Provincial Municipal Corporation Act, 1949 Ahmedabad, Surat, Pune
Karnataka Municipal Corporations Act, 1976 Bengaluru
Madhya Pradesh Municipal Corporation Act, 1956 Bhopal
Orissa Municipal Corporation Act, 2003 Bhubaneswar
Punjab Municipal Corporation Act, 1976 Chandigarh, Ludhiana
The Chennai City Municipal Corporation Act, 1919 Chennai
Uttarakhand Municipal Corporation Act, 1959 Dehradun
Delhi Municipal Corporation Act, 1957 Delhi
Greater Hyderabad Municipal Corporation Act, 1955 Hyderabad
Rajasthan Municipality Act, 2009 Jaipur
Uttar Pradesh Municipal Corporation Act, 1959 Kanpur, Lucknow
Kolkata Municipal Corporation Act, 1980 Kolkata
Mumbai Municipal Corporation Act, 1888 Mumbai
Bihar Municipal Act 2007 Patna
Chhattisgarh Municipal Corporation Act, 1956 Raipur
Jharkhand Municipal Act, 2011 Ranchi
Kerala Municipality Act, 1994 Thiruvananthapuram
Municipal Corporation Budgets 2015-16, 2014-15, 2013-14
Metropolitan/Municipal Master Plans City
AUDA (Ahmedabad Urban Development Authorit y) MasterPlan 2021
Ahmedabad
BDA (Bengaluru Development Authority) Master Plan 2015 BMRDA (Bengaluru Metropolitan Regional Development Authority) Master Plan 2031
Bengaluru
Bhopal Development Authority Master Plan 2005 Bhopal
Bhubaneswar Comprehensive Development Plan 2030 Bhubaneswar
Chandigarh Master Plan 2031 Chandigarh
CMDA (Chennai Metropolitan Development Authority) Master Plan 2026
Chennai
Town and Country Planning Acts City
Chhattisgarh Nagar Tatha Gram Nivesh Niyam, 1975 Raipur
Kerala Town and Country Planning Ordinance 2013 Thiruvananthapuram
Data Sources
43
Metropolitan/Municipal Master Plans City
Dehradun Development Authority Master Plan 2021 Dehradun
Delhi Development Authority Master Plan 2021 Delhi
Hyderabad Metropolitan Development Authority Master Plan 2031
Hyderabad
Jaipur Development Authority Master Plan 2025 Jaipur
Kanpur Development Authority Master Plan 2021 Kanpur
Kolkata Metropolitan Development Authority Master Plan 2025
Kolkata
Lucknow Development Authority Master Plan 2021 Lucknow
Ludhiana Master Plan 2021 Ludhiana
Mumbai Metropolitan Region Development Authority Master Plan 2011
Mumbai
Patna Master Plan 2021 Patna
Pune Development Plan 2027 Pune
Raipur Master Plan 2021 Raipur
Ranchi Master Plan 2037 Ranchi
Surat Urban Development Authority Development Plan 2004
Surat
Trivandrum Master Plan 2031 Thiruvananthapuram
Websites of Municipal Corporations City
http://www.egovamc.com/ Ahmedabad
http://bbmp.gov.in/ Bengaluru
http://www.bhopalmunicipal.com/ Bhopal
http://bmc.gov.in/ Bhubaneswar
http://mcchandigarh.gov.in/ Chandigarh
http://www.chennaicorporation.gov.in/ Chennai
http://www.nagarnigamdehradun.com/ Dehradun
http://mcdonline.gov.in/ Delhi
http://www.ghmc.gov.in/ Hyderabad
http://jaipurmc.org/ Jaipur
http://kmc.up.nic.in/ Kanpur
https://www.kmcgov.in/ Kolkata
http://lmc.up.nic.in/ Lucknow
http://main.mcludhiana.gov.in/ Ludhiana
http://www.mcgm.gov.in/ Mumbai
http://www.patnanagarnigam.in/ Patna
http://www.punecorporation.org/ Pune
http://www.nagarnigamraipur.com/ Raipur
http://www.ranchimunicipal.com/ Ranchi
http://www.suratmunicipal.gov.in/ Surat
http://www.corporationoftrivandrum.in/ Thiruvananthapuram
Government Reports, Other Acts & Rules
National Urban Spatial Planning & Development Guidelines - 2013
Report on Indian Urban Infrastructure and Services- March 2011 by the High Powered Expert
Committee (HPEC) for Estimating the Investment Requirements for Urban Infrastructure Services
Report of the Thirteenth Finance Commission
Second Administrative Reforms Commission Report - ‘Sixth Report on Local Governance’ an inspiring journey into the future’
Audit Reports of the CAG of India
State Advertisement Tax Acts
State Civil Service Rules
State Election Acts/Rules
State Entertainment Tax Acts
State Lokayukta Acts
State Profession Tax Acts
State Public Services Guarantee Acts
State FRBM Acts
Town and Country Planning Acts City
Gujarat Town Planning and Urban Development Act, 1976
Ahmedabad, Surat
Karnataka Town and Country Planning Act, 1961 Bengaluru
Madhya Pradesh Town and Country Planning Act, 1973 Bhopal
Orissa Town Planning and Improvements Trust Act, 1956 Bhubaneswar
) Act, 1952
Tamil Nadu Town and Country Planning Act, 1971 Chennai
Uttarakhand Urban Planning and Development Act, 1973 Dehradun
Delhi Development Act 1957/Delhi (NCR) Planning Board Act, 1985
Delhi
Andhra Pradesh Town Planning Act, 1920 Hyderabad
Andhra Pradesh Urban Areas Development Act, 1975 Hyderabad
Hyderabad Metropolitan Development Act, 2008 Hyderabad
Jaipur Development Authority Act,1982 Jaipur
Uttar Pradesh Urban Planning and Development Act, 1973
Kanpur, Lucknow
West Bengal Town and Country (Planning and Develop-ment) Act,
Kolkata
Punjab Regional and Town Planning and Development Act, 1995
Ludhiana
Maharashtra Regional and Town Planning Act, 1966 Mumbai, Pune
Bihar Urban Regional Planning and Development Act, 2012
Patna
Jharkhand Town Planning and Improvement Trust Act,
1954
c
44

Errata
Location Error Correction
Page 1, line 13 - Addition: CA – Chartered Accountant
Page 1, line 54 - Addition: UA – Urban Agglomeration
Page 4, para 1, line 1 ...in the range of 2 to 4.2… …in the range of 2 to 4.4…
Page 4, 7 (graph) – Plotting of scores - Revised as per corrected scores in
‘Scores: Principal Questions’ in page
61,62
Page 12, para 1, line 2 face large scale face of large scale
Page 13, (box), line 2 …it’s… …its…
Page 17,19, 25, 27, 33 (graph) – Plot-
ting of scores
- Revised as per corrected scores in
‘Scores: Principal Questions’ in page
61,62
Page 36, line 30 …it’s… …its…
Page 47, Serial No. 6(i) …SPD… …SDP…
Page 47 (Average) Bhu (5.1), Deh (4.8), Lon (9.5), NYC
(9.5)
Bhu (4.9), Deh (4.7), Lon (9.8), NYC
(9.8)
Page 51, 52 , Serial No.2 Ahd (4.0), Blr (4.6), Bho (3.0), Bhu
(2.1), Che (3.1), Del (7.7)
Ahd (3.9), Blr (4.3), Bho (4.6), Bhu
(2.2), Che (2.7), Del (4.8)
Page 51, 52 , Serial No.5 Ahd (7.3), Blr (2.3), Bho(5.6), Bhu
(0.9), Chd (5.8), Che (6.7), Deh (3.0),
Hyd (3.4), Jpr (2.2), Kpr (9.8), Kol
(3.6), Lck (3.8), Lud (1.4), Mum (7.3),
Pat (0.2), Pun (10), Rai (3.3), Ran
(0.8), Sur (8.1), Thi (3.7)
Ahd (4.3), Blr (1.7), Bho(2.6), Bhu
(0.5), Chd (4.0), Che (4.0), Deh
(1.8), Hyd (2.0), Jpr (1.4), Kpr (5.8),
Kol (2.1), Lck (2.3), Lud (0.9), Mum
(10.0), Pat (0.1), Pun (5.9), Rai (2.0),
Ran (0.5), Sur (4.8), Thi (2.2)
Page 51, 52 , Serial No.6 Ahd (0.0), Mum (10), Sur (0.0) Ahd (10), Mum (0.0), Sur (10)
Page 51, 52 , (Average) Ahd (4.3), Blr (5.0), Bho (4.4), Bhu
(5.1), Che (4,7), Deh (4.8), Del (6.4),
Hyd (4.7), Jpr (4.1), Kpr (4.7), Kol
(4.9), Lck (4.4), Lud (4.0), Mum (4.0),
Pun (3.3), Rai (3.1), Ran (3.1), Thi
(4.4), NYC (9.9)
Ahd (4.4), Blr (1.6), Bho (1.5), Bhu
(2.2), Che (3.1), Deh (1.8), Del (4.5),
Hyd (2.8), Jpr (2.8), Kpr (3.1), Kol
(2.6), Lck (2.9), Lud (2.0), Mum (4.4),
Pun (5.1), Rai (1.2), Ran (3.3), Thi
(3.4), NYC (10)
Page 53, Serial No.15 Bhu (10.0), Hyd (0.0) Bhu (0.0), Hyd (10.0)
Page 53, (Average) Bhu (3.5), Hyd (2.1) Bhu (1.9), Hyd (3.8)
Location Error Correction
Page 55, Serial No.3 Jpr (10.0) Jpr (0.0)
Page 55, (Average) Chd (4.8), Blr (0.6), Bho (4.1), Chd
(0.8), Jpr (4.0), Kpr (4.0), Lck (4.0),
Lud (2.6), Patna (2.7), Rai (4.5), Thi
(3.8)
Chd (5.5), Blr (0.8), Bho (4.3), Chd
(0.8), Jpr (2.4), Kpr (4.2), Lck (4.2),
Lud (2.9), Patna (4.7), Rai (4.7), Thi
(3.8)
Page 60, Serial No.15 Score of Thi ‘0’ Changes to ‘10’
Page 60, (Average) Thi (6.1) Thi (7.5)
Page 61, Serial No .1 Average of Bhu (5.1), Deh (4.8), Lon
(9.5), NYC (9.5)
Average of Bhu (4.9), Deh (4.7), Lon
(9.8), NYC (9.8)
Page 61, Serial No .5 Ahd (3.8), Blr (1.7), Bhu (2.3), Che
(2.0), Deh (1.9), Del (4.7), Hyd (3.0),
Jpr (2.9), Kpr (3.5), Kol (2.7), Lck
(3.0), Mum (5.1), Pun (4.6), Rai (1.3),
Thi (3.5)
Ahd (4.4), Blr (1.6),Bhu (2.2), Che
(3.1), Deh (1.8), Del (4.5), Hyd (2.8),
Jpr (2.8), Kpr (3.1), Kol (2.6), Lck
(2.9), Mum (4.4), Pun (5.1), Rai (1.2),
Thi (3.4)
Page 61, Serial No.6 Bhu (3.5) Bhu (1.9)
Page 61, Serial No .9 Chd (4.8) Chd (5.5)
Page 61, Serial No .11 Thi (6.1) Thi (7.5)
Page 63, Column 2 Bhu (2.6), Deh (2.5), Lon (9.4), NYC
(9.8)
Bhu (2.7), Deh (2.6), Lon (9.6), NYC
(9.9)
Page 63, Column 3 Ahd (3.2), Bhu (2.3), Del (4.3), Hyd
(2.4), Kol (3.3), Lck (2.6), Lud (1.6),
Mum (5.3), Pat (3.4), Pun (4.7), Rai
(1.2), Ran (2.8), Sur (3.5), Thi (2.3)
Ahd (3.7), Bhu (1.9), Del (4.4), Hyd
(2.9), Kol (3.4), Lck (2.7), Lud (1.7),
Mum (4.7), Pat (3.5), Pun (4.7), Rai
(1.1), Ran (2.9), Sur (4.0), Thi (2.4)
Page 63, Column 4 Blr (2.5), Bho (4.6), Chd (2.7), Jai(4.6), Kpr (4.3), Lck(4.3), Lud (4.0), Patna (4.5), Rai (5.8), Thi (6.4)
Blr (2.6), Bho (4.7), Chd (3.0), Jai(3.7), Kpr (4.3), Lck(4.4), Lud (4.1), Patna (4.6), Rai (5.9), Thi (6.3)
Page 63, Column 5 Thi (5.7) Thi (6.2)
Page 63, Column 6 Ahd (3.0), Chd (2.0), Deh (3.0), Lck (3.4), Pun (4.1), Sur (3.1), Thi (4.2)
Ahd (3.2), Chd (2.1), Deh (3.1), Lck (3.5), Pun (4.2), Sur (3.2), Thi (4.4)
Page 63, Column 7 Che (7), Del (6), Hyd (9),Kpr (8), Mum (1), Thi (2)
Che (8), Del (7), Hyd (6),Kpr (9), Mum (2), Thi (1)
45 4645 46

Seri
al N
o.
Questions
Ahm
edab
ad
Ben
galu
ru
Bho
pal
Bhu
-ba
nesw
ar
Cha
ndig
arh
Does your city have a decentralised system of Spatial Development Planning?
1Is there a provision for a State Spatial Planning Board, which is mandated with planning policies and reforms for the state, and is the final approving authority for Regional and Municipal SDPs?
0.0 10.0 10.0 10.0 NA
2Does the Act require 3 levels of SDPs (Master Plans) for Metropolitan cities: Regional, Municipal and Ward(s) /Local
6.7 6.7 6.7 3.3 NA
3 Are there three levels of currently notified SDPs?
i Is there a Metropolitan Region SDP? 3.3 3.3 0.0 NA 0.0
ii Is there a Municipal SDP? 3.3 3.3 3.3 3.3 3.3
iii Is there a Ward(s) /Local Area/ Neighbourhood SDP? 0.0 0.0 0.0 0.0 0.0
4 Does the Act define clearly the Objectives and Contents of each level of SDP? 10.0 10.0 10.0 10.0 NA
5Are planning boundaries for Metropolitan SDP, Municipal SDP and Ward(s) SDP clearly defined in accordance with political, planning, and administrative structures?
0.0 10.0 10.0 10.0 10.0
6 Are all SDPs in a concurrent or nested timeline of validity?
i Is the Metropolitan SDP in a concurrent or nested timeline of validity with Municipal SDP? 5.0 0.0 0.0 NA 0.0
ii Is the Municipal SDP in a concurrent or nested timeline of validity with Ward SDP? 0.0 0.0 0.0 0.0 0.0
7 Is there a clear decentralised procedure for the approval of each level of plans?
i Is the Metropolitan SDP approved by the State Government? 3.3 3.3 0.0 NA NA
ii Is the Municipal SDP approved by the MPC (State government for small/medium cities)? 0.0 0.0 0.0 3.3 NA
iii Is the Ward SDP approved by the ULB? 0.0 0.0 0.0 0.0 NA
8Is there a provision for the establishment of Planning Authorities for notified new towns or special developments?
10.0 10.0 10.0 10.0 NA
9Is there a clear provision for a competent technical cell to enable preparation of the SDP for each level?
3.3 0.0 0.0 3.3 NA
10Is there an institutional structure which defines authorities for development approvals, zoning and building regulations enforcement, and restrictions for conservation, in accordance with the notified SDP?
0.0 0.0 0.0 0.0 NA
11 Do the SDPs reflect a stated articulation of future vision and development priorities? 0.0 0.0 0.0 0.0 0.0
12Do the SDPs at each level-integrate the plans and priorities of various sectoral public departments and agencies?
0.0 0.0 0.0 0.0 0.0
13Is there a common digital based SDP Map shared among Planning Authorities, and data updated through GIS with fixed periodicity by the relevant sectoral agencies (transport, network infrastruc-ture, land use changes)?
0.0 0.0 0.0 0.0 0.0
14Are the current SDPs also approved by the appropriate Planning Authorities as per the constitutional requirements of decentralisation?
i Is the Metropolitan SDP also approved by MPC/Metropolitan Planning Authority? 3.3 3.3 0.0 NA 0.0
ii Is the Municipal SDP also approved by the ULB? 0.0 0.0 0.0 0.0 0.0
iii Is the Ward SDP also approved by the ULB? 0.0 0.0 0.0 0.0 0.0
15 Are there clear provisions in the Act for modifications to notified SDPs? 10.0 10.0 10.0 10.0 NA
16Does the Act facilitate easy approval of development projects that conform to the regulations, as per the notified SDP?
10.0 10.0 10.0 10.0 NA
Average 4.3 5.0 4.4 4.9 1.9
AnnexureScorecard
URBAN PLANNING & DESIGN
47
Che
nnai
Deh
radu
n
Del
hi
Hyd
erab
ad
Jaip
ur
Kan
pur
Kol
kata
Luck
now
Ludh
iana
Mum
bai
Patn
a
Pun
e
Rai
pur
Ran
chi
Sura
t
Thi
ruva
nan-
thap
uram
Lon
don
New
Yor
k
10.0 10.0 10.0 10.0 0.0 10.0 10.0 10.0 10.0 0.0 10.0 0.0 0.0 0.0 0.0 10.0 10.0 10.0
6.7 3.3 10.0 6.7 6.7 6.7 6.7 6.7 6.7 6.7 6.7 6.7 6.7 6.7 6.7 6.7 6.7 6.7
3.3 NA 3.3 3.3 3.3 3.3 3.3 0.0 0.0 3.3 0.0 0.0 0.0 0.0 3.3 0.0 3.3 3.3
3.3 3.3 3.3 3.3 3.3 3.3 3.3 3.3 3.3 3.3 3.3 3.3 3.3 3.3 3.3 3.3 NA NA
0.0 0.0 3.3 0.0 0.0 0.0 0.0 0.0 0.0 0.0 0.0 0.0 0.0 0.0 0.0 0.0 3.3 3.3
10.0 10.0 10.0 10.0 10.0 10.0 10.0 10.0 10.0 10.0 10.0 10.0 10.0 10.0 10.0 10.0 10.0 10.0
0.0 10.0 10.0 0.0 0.0 0.0 0.0 10.0 0.0 0.0 0.0 0.0 0.0 0.0 0.0 0.0 10.0 10.0
5.0 NA 5.0 5.0 5.0 5.0 5.0 0.0 0.0 0.0 0.0 0.0 0.0 0.0 5.0 0.0 NA NA
0.0 0.0 0.0 0.0 0.0 0.0 0.0 0.0 0.0 0.0 0.0 0.0 0.0 0.0 0.0 0.0 NA NA
3.3 NA 3.3 3.3 3.3 3.3 3.3 0.0 0.0 3.3 0.0 0.0 0.0 0.0 3.3 0.0 3.3 3.3
0.0 3.3 0.0 0.0 0.0 0.0 0.0 0.0 0.0 0.0 0.0 0.0 0.0 0.0 0.0 3.3 NA NA
0.0 0.0 3.3 0.0 0.0 0.0 0.0 0.0 0.0 0.0 0.0 0.0 0.0 0.0 0.0 0.0 3.3 3.3
10.0 10.0 10.0 10.0 10.0 10.0 10.0 10.0 10.0 10.0 10.0 10.0 10.0 10.0 10.0 10.0 NA NA
3.3 0.0 3.3 0.0 0.0 0.0 3.3 0.0 3.3 3.3 3.3 3.3 0.0 0.0 3.3 6.7 6.7 6.7
0.0 0.0 0.0 0.0 0.0 0.0 0.0 0.0 0.0 0.0 0.0 0.0 0.0 0.0 0.0 0.0 10.0 10.0
0.0 0.0 0.0 0.0 0.0 0.0 0.0 0.0 0.0 0.0 0.0 0.0 0.0 0.0 0.0 0.0 10.0 10.0
0.0 0.0 0.0 0.0 0.0 0.0 0.0 0.0 0.0 0.0 0.0 0.0 0.0 0.0 0.0 0.0 10.0 10.0
0.0 0.0 0.0 0.0 0.0 0.0 0.0 0.0 0.0 0.0 0.0 0.0 0.0 0.0 0.0 0.0 10.0 10.0
0.0 NA 3.3 3.3 3.3 3.3 3.3 0.0 0.0 3.3 0.0 0.0 0.0 0.0 3.3 0.0 3.3 3.3
0.0 0.0 0.0 0.0 0.0 0.0 0.0 0.0 0.0 0.0 0.0 0.0 0.0 0.0 0.0 0.0 NA NA
0.0 0.0 3.3 0.0 0.0 0.0 0.0 0.0 0.0 0.0 0.0 0.0 0.0 0.0 0.0 0.0 3.3 3.3
10.0 10.0 10.0 10.0 10.0 10.0 10.0 10.0 10.0 10.0 10.0 10.0 10.0 10.0 10.0 10.0 10.0 10.0
10.0 10.0 10.0 10.0 10.0 10.0 10.0 10.0 10.0 10.0 10.0 10.0 10.0 10.0 10.0 10.0 10.0 10.0
4.7 4.7 6.4 4.7 4.1 4.7 4.9 4.4 4.0 4.0 4.0 3.3 3.1 3.1 4.3 4.4 9.8 9.8
48

Seri
al N
o.
Questions
Ahm
edab
ad
Ben
galu
ru
Bho
pal
Bhu
bane
swar
Cha
ndig
arh
Can your city implement SDPs successfully?
17Is there adequate town planning competence available to Planning Authorities to anchor the formulation of a high quality SDP?
0.0 0.0 0.0 0.0 0.0
18Are there progressive recommendations prescribed in the SDP to protect historic and cultural assets in the general public realm?
0.0 0.0 0.0 0.0 0.0
19 Are there prescribed urban design standards to guide the execution of urban projects? 0.0 0.0 0.0 0.0 0.0
20 Is there adequate institutional capacity to enforce the provisions of the act? 0.0 0.0 0.0 0.0 NA
21 Are there enabling policies on land titling? 0.0 0.0 0.0 0.0 0.0
22Are there enabling policies on maximising land utilisation for development and financing?
0.0 0.0 0.0 0.0 0.0
23Does your city have a single-window clearance process in place for development projects that are in conformity with SDPs?
0.0 0.0 0.0 0.0 0.0
24Is there a framework to evaluate the success of the SDP on the economy and infrastructure?
0.0 0.0 0.0 0.0 0.0
25Is there a framework to evaluate the success of the SDP on environment and heritage conservation?
0.0 0.0 0.0 0.0 0.0
26 Is there a framework to evaluate the success of the SDP on social development? 0.0 0.0 0.0 0.0 0.0
27Is there a framework to evaluate the success of the SDP on the quality of life in residential neighbourhoods?
0.0 0.0 0.0 0.0 0.0
Average Score 0.0 0.0 0.0 0.0 0.0
URBAN PLANNING & DESIGN
Does your city encourage participatory planning?
32Does the Planning Act require the Planning Authority to adhere to public scrutiny, objections, and responses to SDPs?
iAt the Metropolitan Level, is there adequate participation of regional development authorities/ sectoral agencies in planning?
3.3 3.3 3.3 3.3 NA
iiAt the Municipal Level, is there adequate participation of municipal bodies and elected representatives in planning?
3.3 3.3 3.3 3.3 NA
iiiAt the Ward level, is there adequate participation of citizens and local municipal Councillors in planning?
3.3 3.3 3.3 3.3 NA
33Is there a public process of dissemination of the SDP and participation held through formal platforms of Area Sabhas or equivalent structures and processes?
0.0 0.0 0.0 0.0 0.0
Average Score 5.0 5.0 5.0 5.0 0.0
Does you city have effective mechanisms to deter plan violations?
28 Is there a decentralised system for enforcement of SDP regulations? 0.0 0.0 0.0 0.0 0.0
29Are there adequate provisions to create a high deterrent for plan and building violations?
0.0 0.0 0.0 0.0 0.0
30 Is there an effective system to monitor and prevent violations? 0.0 0.0 0.0 0.0 0.0
31Are effective mechanisms put in place to undertake punitive/corrective action for plan violations?
0.0 0.0 0.0 0.0 0.0
Average Score 0.0 0.0 0.0 0.0 0.0
49
Che
nnai
Deh
radu
n
Del
hi
Hyd
erab
ad
Jaip
ur
Kan
pur
Kol
kata
Luck
now
Ludh
iana
Mum
bai
Patn
a
Pun
e
Rai
pur
Ran
chi
Sura
t
Thi
ruva
nant
ha-
pura
m
Lon
don
New
Yor
k
10.0 0.0 10.0 10.0 0.0 0.0 10.0 0.0 0.0 10.0 0.0 0.0 0.0 0.0 0.0 0.0 10.0 10.0
0.0 0.0 0.0 0.0 10 0.0 0.0 0.0 0.0 0.0 0.0 0.0 0.0 0.0 0.0 0.0 10.0 10.0
0.0 0.0 0.0 0.0 0.0 0.0 0.0 0.0 0.0 0.0 0.0 0.0 0.0 0.0 0.0 0.0 10.0 10.0
0.0 0.0 0.0 0.0 0.0 0.0 0.0 0.0 0.0 0.0 0.0 0.0 0.0 0.0 0.0 0.0 10.0 10.0
0.0 0.0 0.0 0.0 0.0 0.0 0.0 0.0 0.0 0.0 0.0 0.0 0.0 0.0 0.0 0.0 10.0 10.0
0.0 0.0 0.0 0.0 0.0 0.0 0.0 0.0 0.0 0.0 0.0 0.0 0.0 0.0 0.0 0.0 10.0 10.0
0.0 0.0 0.0 0.0 0.0 0.0 0.0 0.0 0.0 0.0 0.0 0.0 0.0 0.0 0.0 0.0 0.0 10.0
0.0 0.0 0.0 0.0 0.0 0.0 0.0 0.0 0.0 0.0 0.0 0.0 0.0 0.0 0.0 0.0 10.0 10.0
0.0 0.0 0.0 0.0 0.0 0.0 0.0 0.0 0.0 0.0 0.0 0.0 0.0 0.0 0.0 0.0 10.0 10.0
0.0 0.0 0.0 0.0 0.0 0.0 0.0 0.0 0.0 0.0 0.0 0.0 0.0 0.0 0.0 0.0 10.0 10.0
0.0 0.0 0.0 0.0 0.0 0.0 0.0 0.0 0.0 0.0 0.0 0.0 0.0 0.0 0.0 0.0 10.0 10.0
0.9 0.0 0.9 0.9 0.9 0.0 0.9 0.0 0.0 0.9 0.0 0.0 0.0 0.0 0.0 0.0 9.1 10.0
3.3 3.3 3.3 3.3 3.3 3.3 3.3 3.3 3.3 3.3 3.3 3.3 3.3 3.3 3.3 3.3 3.3 3.3
3.3 3.3 3.3 3.3 3.3 3.3 3.3 3.3 3.3 3.3 3.3 3.3 3.3 3.3 3.3 3.3 3.3 3.3
3.3 3.3 3.3 3.3 3.3 3.3 3.3 3.3 3.3 3.3 3.3 3.3 3.3 3.3 3.3 3.3 3.3 3.3
0.0 0.0 0.0 0.0 0.0 0.0 0.0 0.0 0.0 0.0 0.0 0.0 0.0 0.0 0.0 0.0 10.0 10.0
5.0 5.0 5.0 5.0 5.0 5.0 5.0 5.0 5.0 5.0 5.0 5.0 5.0 5.0 5.0 5.0 10.0 10.0
0.0 0.0 0.0 0.0 0.0 0.0 0.0 0.0 0.0 0.0 0.0 0.0 0.0 0.0 0.0 0.0 10.0 10.0
0.0 0.0 0.0 0.0 0.0 0.0 0.0 0.0 0.0 0.0 0.0 0.0 0.0 0.0 0.0 0.0 10.0 10.0
0.0 0.0 0.0 0.0 0.0 0.0 0.0 0.0 0.0 0.0 0.0 0.0 0.0 0.0 0.0 0.0 10.0 10.0
0.0 0.0 0.0 0.0 0.0 0.0 0.0 0.0 0.0 0.0 0.0 0.0 0.0 0.0 0.0 0.0 10.0 10.0
0.0 0.0 0.0 0.0 0.0 0.0 0.0 0.0 0.0 0.0 0.0 0.0 0.0 0.0 0.0 0.0 10.0 10.0
50

URBAN CAPACITIES & RESOURCES
Seri
al N
o.
Questions
Ahm
edab
ad
Ben
galu
ru
Bho
pal
Bhu
bane
swar
Cha
ndig
arh
Che
nnai
Does your city invest adequate funds in public infrastructure and services?
1 Is the ULB empowered to set and collect the following taxes?
i Property tax 2.5 2.5 2.5 2.5 2.5 2.5
ii Entertainment tax 0.0 0.0 0.0 0.0 0.0 0.0
iii Profession tax 2.5 0.0 0.0 0.0 2.5 2.5
iv Advertisement tax 0.0 2.5 0.0 2.5 2.5 2.5
2 What is the percentage of Own Revenues to Total Expenditure for the ULB? 3.9 4.3 4.6 2.2 2.1 2.7
3Is the ULB authorised to raise borrowings without State Government/ Central Government approval?
0.0 0.0 0.0 10.0 0.0 0.0
4Is the ULB authorised to make investments or otherwise apply surplus funds without specific State Government/ Central Government approval?
10.0 0.0 0.0 0.0 0.0 0.0
5 What is the Per Capita Capital Expenditure of the ULB? 4.3 1.7 2.6 0.5 4.0 4.0
6 Is the budget of the ULB realistic? 10.0 0.0 0.0 0.0 0.0 10.0
7 Is the ULB required by law to have a long-term and/or medium-term fiscal plan? 0.0 0.0 0.0 0.0 0.0 0.0
8 How does the city rate on adherence to budget timelines? 10.0 0.0 0.0 0.0 0.0 0.0
9Are the annual accounts of the ULB mandated to be audited by an independent/external agency?
0.0 0.0 0.0 0.0 0.0 0.0
10Are the audited annual financial statements/audited annual accounts of the ULB available in the public domain?
0.0 0.0 0.0 0.0 0.0 0.0
11Have five State Finance Commissions (SFCs) been constituted by the state government?
5.0 7.0 7.0 7.0 7.0 10.0
Average 4.4 1.6 1.5 2.2 1.9 3.1
51
Deh
radu
n
Del
hi
Hyd
erab
ad
Jaip
ur
Kan
pur
Kol
kata
Luck
now
Ludh
iana
Mum
bai
Patn
a
Pun
e
Rai
pur
Ran
chi
Sura
t
Thi
ruva
nant
ha-
pura
m
Lon
don
New
Yor
k
2.5 2.5 2.5 2.5 2.5 2.5 2.5 2.5 2.5 2.5 2.5 2.5 2.5 2.5 2.5 NA NA
0.0 0.0 2.5 0.0 0.0 0.0 0.0 0.0 0.0 0.0 0.0 0.0 0.0 0.0 2.5 NA NA
2.5 2.5 0.0 2.5 2.5 0.0 2.5 2.5 0.0 2.5 0.0 0.0 2.5 2.5 2.5 NA NA
2.5 2.5 2.5 2.5 2.5 2.5 2.5 2.5 2.5 2.5 2.5 0.0 2.5 0.0 2.5 NA NA
0.9 4.8 8.6 2.2 0.8 4.0 2.0 3.2 6.7 6.2 8.6 3.3 3.3 2.7 5.1 9.1 9.9
0.0 0.0 0.0 10.0 0.0 0.0 0.0 0.0 0.0 10.0 0.0 0.0 10.0 0.0 0.0 10.0 10.0
0.0 10.0 10.0 0.0 0.0 0.0 0.0 0.0 10.0 10.0 10.0 0.0 10.0 10.0 10.0 10.0 10.0
1.8 0.0 2.0 1.4 5.8 2.1 2.3 0.9 10.0 0.1 5.9 2.0 0.5 4.8 2.2 10.0 10.0
0.0 10.0 0.0 0.0 10.0 10.0 10.0 0.0 0.0 0.0 0.0 0.0 0.0 10.0 0.0 10.0 10.0
0.0 0.0 0.0 0.0 0.0 0.0 0.0 0.0 0.0 0.0 0.0 0.0 0.0 0.0 0.0 10.0 10.0
0.0 10.0 0.0 0.0 0.0 0.0 0.0 0.0 10.0 0.0 10.0 0.0 0.0 10.0 0.0 10.0 10.0
0.0 0.0 0.0 0.0 0.0 0.0 0.0 0.0 0.0 0.0 0.0 0.0 0.0 0.0 0.0 10.0 10.0
0.0 0.0 0.0 0.0 0.0 0.0 0.0 0.0 0.0 0.0 0.0 0.0 0.0 0.0 0.0 10.0 10.0
10.0 7.0 3.0 10.0 10.0 7.0 10.0 10.0 7.0 10.0 7.0 5.0 5.0 5.0 10.0 NA NA
1.8 4.5 2.8 2.8 3.1 2.6 2.9 2.0 4.4 4.0 4.2 1.2 3.3 4.3 3.4 9.4 9.6
52

Does your city make optimum use of information technology?
18 Has the ULB put in place a Digital Governance Roadmap? 0.0 0.0 0.0 0.0 10.0 0.0
19 Does the ULB website incorporate the following:
i Citizen Participation 1.7 1.7 1.7 1.7 1.7 1.7
ii Basic service delivery 0.0 0.0 3.3 0.0 0.0 3.3
iii Schemes and Services 0.0 0.0 0.0 0.0 0.0 0.0
20 Does the ULB have an e-procurement system (including vendor registration)? 0.0 10.0 10.0 0.0 0.0 0.0
Average 0.6 3.9 5.0 0.6 3.9 1.7
Seri
al N
o.
Questions
Ahm
edab
ad
Ben
galu
ru
Bho
pal
Bhu
bane
swar
Cha
ndig
arh
Che
nnai
Does your city have adequate number of skilled human resources?
12 Does the ULB have the following powers with respect to its employees?
i Appointment 1.7 1.7 1.7 1.7 0.0 0.0
ii Disciplinary Action 3.3 0.0 3.3 0.0 0.0 0.0
iii Termination 3.3 0.0 3.3 0.0 0.0 0.0
13 Does the ULB have adequate staff, commensurate with its population? 4.7 2.6 1.6 2.1 6.0 3.9
14 Is the staffing data of the ULB available in the public domain? 0.0 0.0 0.0 0.0 0.0 0.0
15 Does the ULB have access to a municipal cadre for its staffing? 0.0 10.0 10.0 0.0 0.0 10.0
16 Does the commissioner have adequate experience in urban related departments? 6.5 7.0 0.0 2.5 8.0 8.8
17 What is the average tenure of the commissioner? 5.0 0.0 5.0 5.0 0.0 5.0
Average 4.1 3.5 4.2 3.5 2.3 4.6
URBAN CAPACITIES & RESOURCES
53
0.0 0.0 0.0 0.0 0.0 0.0 0.0 0.0 0.0 0.0 0.0 0.0 0.0 0.0 0.0 10.0 10.0
1.7 1.7 1.7 1.7 1.7 1.7 1.7 1.7 1.7 1.7 1.7 0.0 1.7 1.7 0.0 3.3 3.3
0.0 3.3 3.3 3.3 3.3 3.3 0.0 3.3 3.3 3.3 3.3 0.0 3.3 3.3 3.3 3.3 3.3
0.0 0.0 0.0 0.0 0.0 0.0 0.0 0.0 0.0 0.0 0.0 0.0 0.0 0.0 0.0 3.3 3.3
0.0 10.0 0.0 0.0 0.0 0.0 10.0 0.0 10.0 0.0 10.0 0.0 0.0 10.0 0.0 10.0 10.0
0.6 5.0 1.7 1.7 1.7 1.7 3.9 1.7 5.0 1.7 5.0 0.0 1.7 5.0 1.1 10.0 10.0
Deh
radu
n
Del
hi
Hyd
erab
ad
Jaip
ur
Kan
pur
Kol
kata
Luck
now
Ludh
iana
Mum
bai
Patn
a
Pun
e
Rai
pur
Ran
chi
Sura
t
Thi
ruva
nant
ha-
pura
m
Lon
don
New
Yor
k
1.7 3.3 0.0 0.0 1.7 1.7 1.7 0.0 1.7 3.3 1.7 1.7 0.0 1.7 1.7 3.3 3.3
3.3 3.3 0.0 0.0 3.3 3.3 3.3 0.0 3.3 3.3 3.3 3.3 3.3 3.3 3.3 3.3 3.3
3.3 3.3 0.0 0.0 3.3 3.3 3.3 0.0 3.3 3.3 3.3 3.3 3.3 3.3 0.0 3.3 3.3
1.8 10.0 3.0 2.0 1.6 6.4 1.5 3.6 7.1 1.9 5.7 1.9 0.7 3.7 2.2 10.0 10.0
0.0 0.0 0.0 0.0 0.0 0.0 0.0 0.0 0.0 0.0 0.0 0.0 0.0 0.0 0.0 10.0 10.0
0.0 0.0 10.0 0.0 0.0 10.0 0.0 0.0 10.0 10.0 10.0 0.0 10.0 0.0 0.0 10.0 10.0
0.0 3.0 4.5 0.0 0.0 3.0 0.0 3.5 10.0 0.0 4.0 0.0 0.0 0.0 0.0 NA NA
0.0 0.0 5.0 0.0 0.0 8.0 0.0 0.0 5.0 0.0 5.0 0.0 0.0 5.0 0.0 NA NA
1.7 3.8 3.8 0.3 1.7 6.0 1.6 1.2 6.7 3.6 5.5 1.7 2.9 2.8 1.2 10.0 10.0
54

55
Seri
al N
o.
Questions
Ahm
edab
ad
Ben
galu
ru
Bho
pal
Bhu
bane
swar
Cha
ndig
arh
Che
nnai
Do your city leaders have adequate power?
1Does your city have sufficient number of Councillors commensurate with popula-tion?
2.6 1.7 2.9 5.9 2.0 3.2
2 Does the Mayor of the ULB have a five year term? 0.0 0.0 10.0 10.0 0.0 10.0
3 Is the Mayor directly elected? 0.0 0.0 10.0 0.0 0.0 10.0
4Does the Mayor have the authority to appoint the Municipal Commissioner/Chief Executive of the ULB?
0.0 0.0 0.0 0.0 0.0 0.0
5 Has the MPC been constituted with the Mayor as an ex-officio member? 0.0 0.0 0.0 0.0 0.0 0.0
6Is the ULB responsible for providing ten specific and critical functions and services?
5.0 3.0 3.0 1.0 3.0 3.0
Average 1.3 0.8 4.3 2.8 0.8 4.4
EMPOWERED & LEGITIMATE POLITICAL REPRESENTATION
Is your city truly democratic?
7 Has the State Election Commission (SEC) been constituted? 10.0 10.0 10.0 10.0 10.0 10.0
8Is the SEC empowered to decide on matters of electoral delimitation of the Council?
10.0 0.0 0.0 0.0 0.0 0.0
9 Have elections to the ULB been conducted every five years? 10.0 0.0 10.0 10.0 10.0 10.0
10 Did the city witness a high voter turnout in the last election?
i Council 1.3 1.3 2.5 1.3 3.8 1.3
ii Legislative Assembly 5.0 2.5 3.8 1.3 NA 3.8
11Are locally-elected officials required to publicly disclose their income and assets (and those of their immediate family) prior to taking office? (UGI)
0.0 10.0 0.0 0.0 0.0 10.0
Average 7.3 4.8 5.3 4.5 5.5 7.0
56
Deh
radu
n
Del
hi
Hyd
erab
ad
Jaip
ur
Kan
pur
Kol
kata
Luck
now
Ludh
iana
Mum
bai
Patn
a
Pun
e
Rai
pur
Ran
chi
Sura
t
Thi
ruva
nant
ha-
pura
m
Lon
don
New
Yor
k
8.0 1.9 1.7 2.2 3.0 2.3 2.9 3.4 1.4 3.2 3.6 5.2 3.8 1.9 10.0 NA NA
10.0 0.0 10.0 10.0 10.0 10.0 10.0 10.0 0.0 10.0 0.0 10.0 10.0 0.0 10.0 10.0 10.0
10.0 0.0 0.0 0.0 10.0 0.0 10.0 0.0 0.0 0.0 0.0 10.0 10.0 0.0 0.0 10.0 10.0
0.0 0.0 0.0 0.0 0.0 0.0 0.0 0.0 0.0 0.0 0.0 0.0 0.0 0.0 0.0 10.0 10.0
0.0 0.0 0.0 0.0 0.0 10.0 0.0 0.0 0.0 0.0 0.0 0.0 0.0 0.0 0.0 10.0 10.0
1.0 3.0 1.0 2.0 2.0 5.0 2.0 3.0 6.0 4.0 6.0 3.0 3.0 5.0 2.0 10.0 10.0
4.8 0.8 2.1 2.4 4.2 4.6 4.2 2.7 1.2 2.9 1.6 4.7 4.5 1.1 3.7 10.0 10.0
10.0 10.0 10.0 10.0 10.0 10.0 10.0 10.0 10.0 10.0 10.0 10.0 10.0 10.0 10.0 10.0 10.0
0.0 0.0 0.0 0.0 0.0 10.0 0.0 0.0 10.0 0.0 10.0 0.0 0.0 10.0 10.0 10.0 10.0
10.0 10.0 0.0 10.0 10.0 10.0 10.0 10.0 10.0 10.0 10.0 10.0 10.0 10.0 10.0 10.0 10.0
2.5 2.5 1.3 2.5 1.3 3.8 1.3 3.8 1.3 1.3 2.5 2.5 0.0 1.3 3.8 NA NA
3.8 3.8 2.5 3.8 2.5 3.8 2.5 5.0 2.5 2.5 3.8 3.8 3.8 3.8 3.8 NA NA
0.0 10.0 10.0 0.0 0.0 0.0 0.0 0.0 10.0 10.0 10.0 10.0 10.0 0.0 10.0 10.0 10.0
5.3 7.3 4.8 5.3 4.8 7.5 4.8 5.8 8.8 6.8 9.3 7.3 6.8 7.0 9.5 10.0 10.0

57
Seri
al N
o.
Questions
Ahm
edab
ad
Ben
galu
ru
Bho
pal
Bhu
bane
swar
Cha
ndig
arh
Che
nnai
Does your city put out adequate information and facilitate citizen participation?
1 Has the State Government enacted the Public Disclosure Law (PDL)? 0.0 10.0 10.0 10.0 0.0 10.0
2 Have Rules implementing the PDL been notified? 0.0 10.0 10.0 0.0 0.0 10.0
3 Is the State PDL compliant with the Model PDL with respect to:
i Audited financial statement on quarterly basis 0.0 0.0 0.0 0.0 0.0 0.0
ii Audited financial statement on annual basis 0.0 0.0 2.0 2.0 0.0 2.0
iii Service level benchmarks 0.0 2.0 2.0 0.0 0.0 2.0
iv Particulars of major works 2.0 0.0 2.0 2.0 0.0 2.0
v Details of plans, income and budget 0.0 0.0 2.0 2.0 0.0 0.0
4 Has the ULB adopted open data standards and principles in respect of:
i Annual report of works done last year 0.0 0.0 0.0 0.0 0.0 0.0
ii Financial information (budgets) of the corporation and of respective wards 0.0 0.0 0.0 0.0 0.0 0.0
iii Raw and synthesized data on civic works 0.0 2.0 0.0 0.0 0.0 0.0
ivInformation under Right To Information, Section 4(1) b on minutes of council meetings, rules, regulations and documents of the ULB and its decision-making processes
0.0 2.0 0.0 2.0 0.0 2.0
v Quarterly audited financial reports 0.0 0.0 0.0 0.0 0.0 0.0
5 Has the State Government enacted the Community Participation Law (CPL)? 0.0 10.0 10.0 0.0 10.0 10.0
6 Have Rules implementing the CPL been notified? 0.0 10.0 10.0 0.0 0.0 0.0
7 Have Ward Committees been constituted for all wards of the ULB? 10.0 10.0 10.0 10.0 10.0 10.0
8 Have Area Sabhas been constituted in all wards of the ULB? 0.0 0.0 0.0 0.0 0.0 0.0
9Does the ULB harness the spirit of volunteering among its citizens and provide such opportunities for them?
10.0 10.0 0.0 0.0 0.0 0.0
10 Does the ULB have a participatory budgeting process in place? 0.0 0.0 0.0 0.0 0.0 0.0
11Is the ULB required by its Municipal Act to carry out an internal audit within a predetermined frequency, at least annual?
10.0 10.0 10.0 10.0 10.0 0.0
12 Are the internal audits of the ULB available in the public domain? 0.0 0.0 0.0 0.0 0.0 0.0
Average 2.7 6.3 5.7 3.2 2.5 4.0
TRANSPARENCY, ACCOUNTABILITY & PARTICIPATION
58
Deh
radu
n
Del
hi
Hyd
erab
ad
Jaip
ur
Kan
pur
Kol
kata
Luck
now
Ludh
iana
Mum
bai
Patn
a
Pun
e
Rai
pur
Ran
chi
Sura
t
Thi
ruva
nant
ha-
pura
m
Lon
don
New
Yor
k
0.0 0.0 10.0 10.0 10.0 10.0 10.0 10.0 10.0 10.0 10.0 10.0 10.0 0.0 10.0 10.0 10.0
0.0 0.0 10.0 0.0 10.0 0.0 10.0 10.0 0.0 0.0 0.0 0.0 0.0 0.0 10.0 NA NA
0.0 0.0 2.0 0.0 2.0 0.0 2.0 0.0 2.0 2.0 2.0 0.0 2.0 0.0 0.0 0.0 2.0
0.0 0.0 2.0 0.0 0.0 0.0 0.0 2.0 2.0 2.0 2.0 0.0 2.0 0.0 0.0 2.0 2.0
0.0 0.0 2.0 0.0 0.0 0.0 0.0 2.0 2.0 2.0 2.0 0.0 2.0 0.0 2.0 2.0 2.0
0.0 0.0 2.0 0.0 2.0 0.0 2.0 2.0 2.0 2.0 2.0 0.0 2.0 2.0 2.0 0.0 2.0
0.0 0.0 2.0 0.0 2.0 0.0 2.0 2.0 2.0 2.0 2.0 0.0 2.0 0.0 2.0 2.0 2.0
0.0 0.0 0.0 0.0 0.0 0.0 0.0 0.0 0.0 0.0 0.0 0.0 0.0 0.0 0.0 2.0 2.0
0.0 0.0 0.0 0.0 0.0 0.0 0.0 0.0 0.0 0.0 0.0 0.0 0.0 0.0 0.0 2.0 2.0
0.0 0.0 0.0 0.0 0.0 0.0 0.0 0.0 0.0 0.0 0.0 0.0 0.0 0.0 0.0 2.0 2.0
0.0 0.0 0.0 0.0 0.0 0.0 0.0 0.0 0.0 0.0 0.0 0.0 0.0 2.0 0.0 2.0 2.0
0.0 0.0 0.0 0.0 0.0 0.0 0.0 0.0 0.0 0.0 0.0 0.0 0.0 0.0 0.0 2.0 2.0
10.0 0.0 10.0 10.0 10.0 10.0 10.0 10.0 10.0 10.0 10.0 10.0 10.0 0.0 10.0 NA NA
10.0 0.0 10.0 0.0 10.0 10.0 10.0 0.0 0.0 10.0 0.0 10.0 0.0 0.0 10.0 NA NA
10.0 10.0 10.0 0.0 10.0 10.0 10.0 10.0 10.0 0.0 10.0 10.0 0.0 10.0 10.0 10.0 10.0
0.0 0.0 10.0 0.0 0.0 0.0 0.0 0.0 0.0 0.0 0.0 0.0 0.0 0.0 0.0 NA NA
0.0 0.0 0.0 0.0 0.0 10.0 0.0 0.0 10.0 0.0 10.0 0.0 0.0 10.0 0.0 10.0 10.0
0.0 0.0 0.0 0.0 0.0 0.0 0.0 0.0 0.0 0.0 10.0 0.0 0.0 0.0 0.0 0.0 10.0
10.0 10.0 10.0 0.0 10.0 10.0 10.0 10.0 10.0 10.0 10.0 10.0 10.0 10.0 10.0 10.0 10.0
0.0 10.0 0.0 0.0 0.0 0.0 0.0 0.0 10.0 0.0 0.0 0.0 0.0 0.0 0.0 10.0 10.0
3.3 2.5 6.7 1.7 5.5 5.0 5.5 4.8 5.8 4.2 5.8 4.2 3.3 2.8 5.5 8.3 10.0

59
Seri
al N
o.
Questions
Ahm
edab
ad
Ben
galu
ru
Bho
pal
Bhu
bane
swar
Cha
ndig
arh
Che
nnai
How well does your city address citizen complaints?
13 Has the state mandated guaranteed public service delivery to citizens? 10.0 10.0 10.0 10.0 0.0 0.0
14 Does the city have a citizens' charter providing for:
i Services provided by it 2.5 2.5 2.5 2.5 2.5 2.5
ii Target levels of service 0.0 0.0 0.0 0.0 0.0 0.0
iii Timelines for delivery of services 2.5 2.5 2.5 2.5 2.5 0.0
iv Protocols for obtaining relief, where service levels are not met 2.5 2.5 2.5 2.5 2.5 2.5
15 Does the ULB have single window civic service centres? 0.0 10.0 10.0 10.0 10.0 0.0
16 Does the ULB conduct citizen satisfaction surveys? 0.0 0.0 0.0 0.0 0.0 0.0
17 Does the ULB have an Ombudsman for service related issues? 0.0 0.0 0.0 0.0 0.0 0.0
18 Has the position of Ombudsman been filled? 0.0 0.0 0.0 0.0 0.0 0.0
19 Is the Ombudsman authorized to:
i Investigate corruption suo motu? 0.0 0.0 0.0 0.0 0.0 0.0
ii Resolve inter-agency disputes? 0.0 0.0 0.0 0.0 0.0 0.0
Average 2.5 3.9 3.9 3.9 2.5 0.7
TRANSPARENCY, ACCOUNTABILITY & PARTICIPATION
60
Deh
radu
n
Del
hi
Hyd
erab
ad
Jaip
ur
Kan
pur
Kol
kata
Luck
now
Ludh
iana
Mum
bai
Patn
a
Pun
e
Rai
pur
Ran
chi
Sura
t
Thi
ruva
nant
ha-
pura
m
Lon
don
New
Yor
k
10.0 10.0 0.0 10.0 10.0 10.0 10.0 10.0 10.0 10.0 10.0 10.0 10.0 10.0 10.0 NA NA
2.5 2.5 2.5 0.0 2.5 2.5 2.5 0.0 2.5 2.5 2.5 2.5 0.0 2.5 2.5 NA NA
0.0 0.0 0.0 0.0 0.0 0.0 0.0 0.0 0.0 0.0 0.0 2.5 0.0 0.0 0.0 NA NA
2.5 0.0 2.5 0.0 2.5 2.5 2.5 0.0 0.0 0.0 2.5 2.5 0.0 2.5 2.5 NA NA
2.5 2.5 2.5 2.5 2.5 2.5 2.5 0.0 2.5 2.5 2.5 2.5 0.0 2.5 2.5 NA NA
0.0 10.0 10.0 10.0 10.0 0.0 0.0 0.0 0.0 0.0 0.0 10.0 0.0 0.0 10.0 10.0 10.0
0.0 0.0 10.0 0.0 0.0 0.0 0.0 0.0 0.0 0.0 0.0 0.0 0.0 0.0 0.0 10.0 0.0
0.0 0.0 0.0 0.0 0.0 0.0 0.0 0.0 0.0 0.0 0.0 0.0 0.0 0.0 10.0 10.0 10.0
0.0 0.0 0.0 0.0 0.0 0.0 0.0 0.0 0.0 0.0 0.0 0.0 0.0 0.0 10.0 10.0 10.0
0.0 0.0 0.0 0.0 0.0 0.0 0.0 0.0 0.0 0.0 0.0 0.0 0.0 0.0 5.0 0.0 5.0
0.0 0.0 0.0 0.0 0.0 0.0 0.0 0.0 0.0 0.0 0.0 0.0 0.0 0.0 0.0 0.0 0.0
2.5 3.6 3.9 3.2 3.9 2.5 2.5 1.4 2.1 2.1 2.5 4.3 1.4 2.5 7.5 8.0 7.0

Ser
ial N
o.
Questions
Ahm
edab
ad
Ben
galu
ru
Bho
pal
Bhu
bane
swar
Cha
ndig
arh
Che
nnai
Deh
radu
n
1DOES YOUR CITY HAVE A DECENTRALISED SYSTEM OF
SDP?4.3 5.0 4.4 4.9 1.9 4.7 4.7
2 CAN YOUR CITY IMPLEMENT SDPs SUCCESSFULLY? 0.0 0.0 0.0 0.0 0.0 0.9 0.0
3DOES YOU CITY HAVE EFFECTIVE MECHANISMS TO DETER
PLAN VIOLATIONS?0.0 0.0 0.0 0.0 0.0 0.0 0.0
4 DOES YOUR CITY ENCOURAGE PARTICIPATORY PLANNING? 5.0 5.0 5.0 5.0 0 5.0 5.0
5DOES YOUR CITY INVEST ADEQUATE FUNDS IN PUBLIC
INFRASTRUCTURE AND SERVICES?4.4 1.6 1.5 2.2 1.9 3.1 1.8
6DOES YOUR CITY HAVE ADEQUATE NUMBER OF SKILLED
HUMAN RESOURCES?4.1 3.5 4.2 3.5 2.3 4.6 1.7
7DOES YOUR CITY MAKE OPTIMUM USE OF INFORMATION
TECHNOLOGY?0.6 3.9 5.0 0.6 3.9 1.7 0.6
8 DO YOUR CITY LEADERS HAVE ADEQUATE POWER? 1.3 0.8 4.3 2.8 0.8 4.4 4.8
9 IS YOUR CITY TRULY DEMOCRATIC? 7.3 4.8 5.3 4.5 5.5 7.0 5.3
10DOES YOUR CITY PUT OUT ADEQUATE INFORMATION AND
FACILITATE CITIZEN PARTICIPATION?2.7 6.3 5.7 3.2 2.5 4.0 3.3
11HOW WELL DOES YOUR CITY ADDRESS CITIZEN-COM-
PLAINTS?2.5 3.9 3.9 3.9 2.5 0.7 2.5
Scores : Principal Questions
61
Del
hi
Hyd
erab
ad
Jaip
ur
Kan
pur
Kol
kata
Luck
now
Ludh
iana
Mum
bai
Pat
na
Pun
e
Rai
pur
Ran
chi
Sur
at
Thir
uvan
anth
apur
am
Lond
on
New
Yor
k
6.4 4.7 4.1 4.7 4.9 4.4 4.0 4.0 4.0 3.3 3.1 3.1 4.3 4.4 9.8 9.8
0.9 0.9 0.9 0.0 0.9 0.0 0.0 0.9 0.0 0.0 0.0 0.0 0.0 0.0 9.1 10.0
0.0 0.0 0.0 0.0 0.0 0.0 0.0 0.0 0.0 0.0 0.0 0.0 0.0 0.0 10.0 10.0
5.0 5.0 5.0 5.0 5.0 5.0 5.0 5.0 5.0 5.0 5.0 5.0 5.0 5.0 10.0 10.0
4.5 2.8 2.8 3.1 2.6 2.9 2.0 4.4 4.0 4.2 1.2 3.3 4.3 3.4 9.4 9.6
3.8 3.8 0.3 1.7 6.0 1.6 1.2 6.7 3.6 5.5 1.7 2.9 2.8 1.2 10.0 10.0
5.0 1.7 1.7 1.7 1.7 3.9 1.7 5.0 1.7 5.0 0.0 1.7 5.0 1.1 10.0 10.0
0.8 2.1 2.4 4.2 4.6 4.2 2.7 1.2 2.9 1.6 4.7 4.5 1.1 3.7 10.0 10.0
7.3 4.8 5.3 4.8 7.5 4.8 5.8 8.8 6.8 9.3 7.3 6.8 7.0 9.5 10.0 10.0
2.5 6.7 1.7 5.5 5.0 5.5 4.8 5.8 4.2 5.8 4.2 3.3 2.8 5.5 8.3 10.0
3.6 3.9 3.2 3.9 2.5 2.5 1.4 2.1 2.1 2.5 4.3 1.4 2.5 7.5 8.0 7.0
62
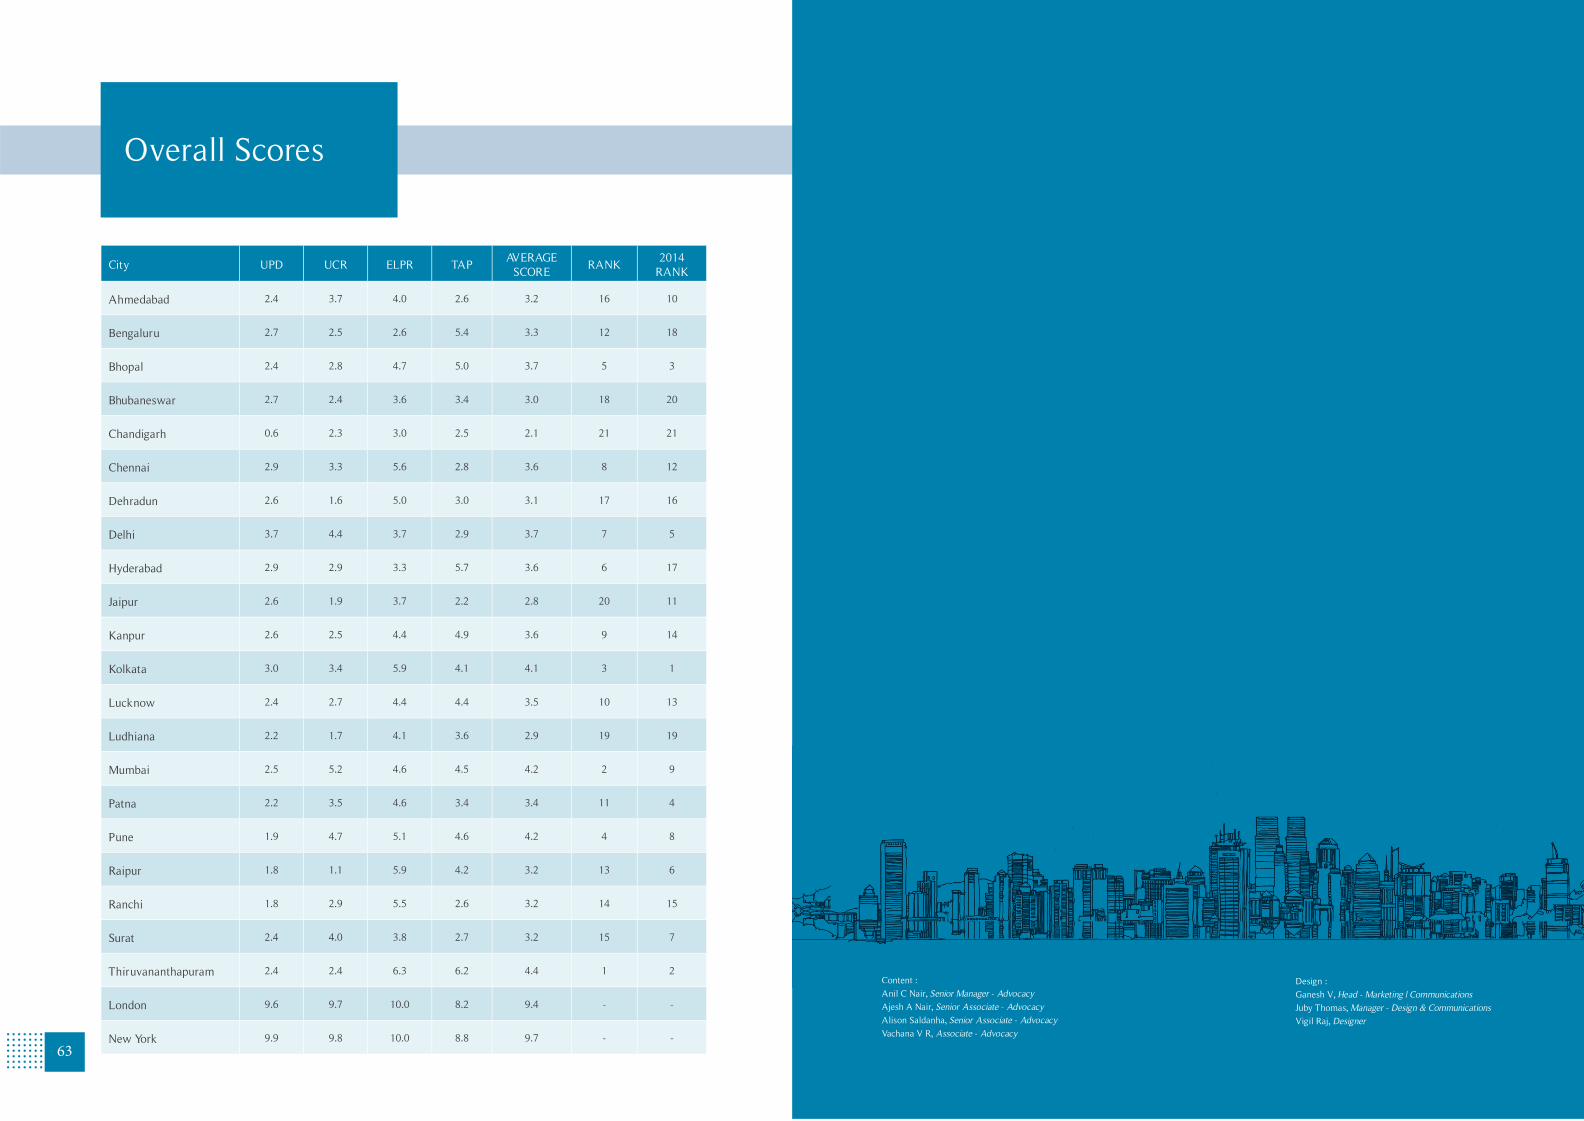
City UPD UCR ELPR TAP AVERAGE
SCORERANK
2014 RANK
Ahmedabad 2.4 3.7 4.0 2.6 3.2 16 10
Bengaluru 2.7 2.5 2.6 5.4 3.3 12 18
Bhopal 2.4 2.8 4.7 5.0 3.7 5 3
Bhubaneswar 2.7 2.4 3.6 3.4 3.0 18 20
Chandigarh 0.6 2.3 3.0 2.5 2.1 21 21
Chennai 2.9 3.3 5.6 2.8 3.6 8 12
Dehradun 2.6 1.6 5.0 3.0 3.1 17 16
Delhi 3.7 4.4 3.7 2.9 3.7 7 5
Hyderabad 2.9 2.9 3.3 5.7 3.6 6 17
Jaipur 2.6 1.9 3.7 2.2 2.8 20 11
Kanpur 2.6 2.5 4.4 4.9 3.6 9 14
Kolkata 3.0 3.4 5.9 4.1 4.1 3 1
Lucknow 2.4 2.7 4.4 4.4 3.5 10 13
Ludhiana 2.2 1.7 4.1 3.6 2.9 19 19
Mumbai 2.5 5.2 4.6 4.5 4.2 2 9
Patna 2.2 3.5 4.6 3.4 3.4 11 4
Pune 1.9 4.7 5.1 4.6 4.2 4 8
Raipur 1.8 1.1 5.9 4.2 3.2 13 6
Ranchi 1.8 2.9 5.5 2.6 3.2 14 15
Surat 2.4 4.0 3.8 2.7 3.2 15 7
Thiruvananthapuram 2.4 2.4 6.3 6.2 4.4 1 2
London 9.6 9.7 10.0 8.2 9.4 - -
New York 9.9 9.8 10.0 8.8 9.7 - -
Overall Scores
63
Content :
Anil C Nair, Senior Manager - AdvocacyAjesh A Nair, Senior Associate - AdvocacyAlison Saldanha, Senior Associate - AdvocacyVachana V R, Associate - Advocacy
Design :
Ganesh V, Head - Marketing | CommunicationsJuby Thomas, Manager - Design & CommunicationsVigil Raj, Designer
Content : Design :
