the janaagraha-brown citizenship index...
TRANSCRIPT

The Janaagraha-Brown Citizenship Index Study
Citizenship in Urban India: Evidence from Bangalore
December 2014

2
The Janaagraha- Brown India Initiative Citizenship Index Report 2014
The Janaagraha- Brown India Citizenship Index StudyCitizenship in Urban India: Evidence from Bangalore
December 2014
Authors:Ms. Ebony Bertorelli Dr. Patrick HellerDr. Siddharth SwaminathanDr. Ashutosh Varshney
Acknowledgements
For field work and project management the authors would like to acknowledge: Krithi Venkat, Supriya Menon, Akshaya Madhavan, Ritu George Kalieden, the Janaagraha Jaagte Raho Field team particularly H.L. Manjunath and Ambarish B.C., Kshipra Hemal, Nabila Islam, Surbhi More, and the dedicated team of field monitors and field surveyors.
For assistance with data collection and analysis, the authors would like to thankfully acknowledge Gayatri Singh, and Yashas Vaidya.
For discussion and comments, the authors would like to thank Mukulika Bannerjee, Margot Jackson, Niraja Jayal, David Lindstron, John Logan, Partha Mukhopadhyay, Narendar Pani, Katie Pyle, Ramesh Ramanathan, Swati Ramanathan, and Nirupama Rao.

1
The Janaagraha- Brown India Initiative Citizenship Index Report 2014
Introduction 3
A. Theories of Citizenship 4
Marshall’s Formulations 6
Beyond Class: Social Exclusion 6
Beyond Marshall 8
Conceptualizing Citizenship 8
B. The Survey 9
The Variables 10
Control Variables 11
The Indices 11
C. Results 14
Class in Bangalore 15
Citizenship 20
Knowledge 24
Participation 25
The Basic Service Delivery and Infrastructure Index (BSDII) 30
D. Models 33
E. Discussion and Conclusions 36
References 38
F: Appendices 40
Appendix 1: Household Selection 40
Appendix 2: Household Type 42
Appendix 3: Questions Included Under BSDII 47
Appendix 4: Knowledge Questions 49
Participation Categories 50
Appendix 5: Quality of Engagement Questions 51
Appendix 6: Vignettes 67
TABLE OF CONTENTS

2
The Janaagraha- Brown India Initiative Citizenship Index Report 2014
3
The Janaagraha- Brown India Initiative Citizenship Index Report 2014
Introduction In 1951, India was a mere 17.3 per cent urban, and only five Indian cities had populations greater than 1 million. By 2011, three cities – Mumbai, Delhi, and Kolkata – had more than ten million people each, and 53 cities had populations of more than one million each. By 2031, six cities are projected to cross the population threshold of 10 million. Depending on what measures are used, India’s population, 32 percent urban in 2011, could well be over 40 percent urban over the next 15-20 years, if not higher.1 The latest Census shows that for the first time, the absolute increase in urban popula-tion during 2001-2011 exceeded the increase in rural popula-tion in any ten-year period since independence.
Unsurprisingly, governance of cities is fast becoming a central issue and the importance of cities will only continue to grow. At this point, agriculture, the dominant, if not the overwhelming, economic activity of rural India, accounts for less than 15 percent of the country’s Gross Domestic Product (GDP). Urban India has become, and will continue to be, the primary source of India’s economic growth.
Such rapid urbanization has critical implications for ensur-ing quality of life for all. Although there are those that have pointed to cities as bastions of freedom and opportunity, the prevalence of slums, low voter turnouts, low levels of civic participation, and the inequitable provision of infrastructure, point to poor quality of citizenship for many. A truncation of citizenship negatively affects people’s capabilities, making them less able to participate in the development process. It also affects the quality of democracy. A more active citizenry makes democracy deeper.
As India continues to urbanize it is critical to understand: what is the quality of citizenship in urban India and what are the factors that impact this quality? Are the rising cities witnessing the emergence of citizenship and a rights-based politics, heralding a greater citizen-based deepening of the polity, or do vertical patron-client ties and other forms of dependency remain obdurately strong? Do notions of citizen
rights and social exclusion simultaneously coexist? What forms of discrimination are common in urban settings?
These are important questions and putting together the data to answer such questions can have a powerful impact on policy leaders and actions that can affect the lives of the mil-lions of citizens living and working in India’s cities.
To date, the heavily rural nature of post-independence India has led political, sociological and economic research to re-main heavily focused on rural issues. Research and knowl-edge of urban affairs has been remarkably limited. Given what is happening to India and its cities, it is time to add a new urban angle to the predominantly rural gaze to identify its policy and practical implications.
It is in this spirit that this Janaagraha-Brown Citizenship In-dex (JB-CI) project was conceived in 2012. It is a collaboration of scholars and practitioners. We are making an attempt to infuse research with practical knowledge, and create a pow-erful tool, the Citizenship Index, which can focus discussion by making a wealth of data more easily understandable
1 This is the estimate of the United Nations (2012) in the World Urbanization Prospects, the 2011 Revision. But it heavily depends on India’s definition of “urban”, as well as on the as-sumed rate of economic growth. The United Nations compiles data on the basis of country-based definitions of urban. There is no consistent worldwide definition of a city. India has a very restrictive definition of the urban; Indonesia and China a more expansive one. Statistical precision, as a result, is hard to achieve in cross-country comparison. Overall trends in each country are easier to ascertain

4
The Janaagraha- Brown India Initiative Citizenship Index Report 2014
Key FindingsThe first leg of our survey has been completed in Bangalore, and this report is based on these findings. Overall plans include covering several other cities of India. We plan to ask roughly the same questions in all cities. We, of course, expect to find variation. Once completed, it will be possible to engage in cross-city comparisons in India regarding the quality of citizenship.
More specifically, the project has two aims: (i) construction of various measures of citizenship, including a citizenship index - a measurable statistical index assessing the quality of citizenship across individuals within a city; and (ii) exami-nation of the determinants of basic service delivery in urban centres. We ask how citizenship is distributed across the various categories of class, caste and religion. Who shows higher levels of citizenship? We also ask how basic services - education, health, power, sanitation, water, etc. - are provid-ed to the city and how citizens experience the bureaucracies and organizations associated with such services. How does citizenship matter relative to caste, class and religion? Based on a survey of over 4,000 households that we conducted in 2012, this report presents the following findings:
1 .The life of Bangalore citizens is vote-intensive. Bangalore-ans vote a lot, but don’t participate much in civic or political life between elections. Electoral forms of citizenship are more prevalent than the non-electoral forms. This seems consistent with India’s national picture. On the whole, we know that Indians have high voter turnouts, but they are less active between elections. But whether Bangalore votes more than other cities, or participates less between elections than other cities, we will know only after research elsewhere.
2. In terms of how they understand citizenship, Bangaloreans have more vertical than horizontal citizenship. By verti-cal citizenship, we mean how citizens view their rights and obligations vis-a-vis the state, and by horizontal citizenship we mean how citizens view their obligations and rights vis-a-vis fellow citizens. Bangaloreans clearly hold citizenship to mean voting and respecting the law, but treating others as rights-bearing and engaging in civic activities is less embed-ded in their consciousness.
3. Citizenship in Bangalore is highly differentiated. While all Bangaloreans know and cherish their formal rights, their capacity to use those rights – what we call “effective citizen-ship” - is very unevenly distributed. The biggest predictors of high effective citizenship are education and class. On
the whole, the higher the class, the greater the effective citizenship (with one exception: the highest class shows less effective citizenship). Caste and religion also impact citizenship. Scheduled Castes (SCs) and Muslims generally have lower levels of citizenship than non-SCs, Hindus and Christians. This general pattern of differentiated citizenship however comes with an important caveat. Unequal citizen-ship is largely driven by differences in knowledge of civic and political affairs. Participation, in contrast, is a leveler: lower classes, SCs and Muslims participate more than higher classes, higher castes and Hindus/Christians.
4. It is however on the dimension of social citizenship that urban governance has failed most conspicuously. We define social citizenship as the capacity of citizens to translate their rights into outcomes, and in particular to acquire basic ca-pabilities independently of their social or economic position. Thus, we find that access to basic services and infrastructure in Bangalore is unevenly distributed, and, that this is highly correlated with class and caste, though not with religion.
5. In this overall pattern of unequal effective and social citizenship, there is however one promising finding. Though the poor have less effective citizenship, it matters more to them. Specifically, we find that the poor get more in terms of access to basic services and infrastructure from the citizen-ship they do have than their class position would otherwise predict. To put it simply, if they did not participate in political and civic life, they would receive less from the state. Citizen-ship, in this sense, is an ally of the poor.
6. Though Bangalore is unequal, it may very well be that it is much less unequal than other Indian cities. Our findings provide confirmation of the widely held view that Bangalore has a proportionately larger middle class than the other big cities. It is also possible that Muslims of Bangalore are less underprivileged than Muslims elsewhere in India; that there are more SCs in the middle class than elsewhere. But we won’t know for sure until research in other cities is carried out.
A. Theories of Citizenship
A modern political community is different from the medieval polity, which had privileges for the rulers and duties for the subjects. The “moral economy” scholars make this picture more complex when they contend that the powers of the rul-ing class, even in pre-modern times, were constrained by the norms of a rural society. Reciprocity was a principal hallmark of such norms. The conduct of the landlord, for example, was

5
The Janaagraha- Brown India Initiative Citizenship Index Report 2014
judged by whether or not he could help peasants tide over a subsistence crisis and save the peasantry from going under (Scott, 1976). A certain moral concern for each other, thus, undergirded the functioning of a pre-modern, pre-capitalist society.
The virtues of modernity are intensely questioned in some other scholarly circles as well. The so-called anti-secularists argue that pre-modern societies were much more tolerant of social diversity and the equality of the modern age, in fact, hides its penchant for social uniformity. Moreover, modern societies have often sought to realize this goal through a violent suppression of human diversity (Nandy, 1988).
Both critiques of modernity contain elements of truth, but they do not amount to a denial that medieval rule insisted on the subjecthood of the members of the polity. Pre-modern polities were not premised upon the principle of equal citizenship. As Taylor (1994) has argued, medieval societies were based on the idea of birth-based, ascriptive hierar-chies, whereas the notion that everyone has equal dignity is essentially a modern idea. In modern times, in principle, rights are not a favour purveyed by the rulers; rights come to us because we are citizens. Pre-modern communities are marked by subjecthood, modern polities by citizenship. We are no longer subjects; we are citizens.
This basic idea runs through the existing literature on citi-zenship. The literature is marked by “the malodorousness of subjecthood and the fragrance of citizenship” (Jayal, 2013: 3). One may say that the idea of a modern polity presented in such a binary form is an ideal type. But the fact remains that it would be impossible to define modern polities in terms of subjecthood, even if the idea of citizenship is not fully realized, as is often the case.
For our purposes, then, citizenship and modern polities are twins. Modernity is both associated with the rise of citizen-ship as well as battles over its curtailment. That is as one would expect. People do not fight over equality if they have internalized the idea that human beings are unequal. We do not fight about dignity, unless we feel that denial of dignity is violation of a profound sort.
In colonial India, there was no conception of citizenship. Brit-ish colonial writings were shot through with the impossibility of citizenship in India. There were several arguments about why Indians could not be citizens. A familiar trope was that the “narrow-minded villages” were overwhelmingly domi-nant in India and the urban population, while having a more
modern consciousness, was too demographically miniscule. Colonized Indians did not deserve citizenship for the British thought they were not yet steeped in modernity.2
After independence, India’s leaders intensely debated the idea of citizenship, and the Citizenship Act was finally passed in 1955. On the whole, jus solis – the idea that any one born in India had the right to be an Indian citizen -- was accepted as the dominant, if not an exclusive, principle of citizenship. India’s first-generation leaders did not embrace the principle of jus sanguinis, the idea that any one born to Indian parents anywhere in the world could become an Indian citizen.3 Jus solis and jus sanguinis are the two ideal types of organizing modern citizenship.4
In her seminal account of the history of citizenship in India, Jayal calls attention to three different dimensions of citizen-ship: “citizenship as a legal status, citizenship as a bundle of rights, and citizenship as a sense of identity and belonging” (Jayal 2013: 2). We concur that these three dimensions exist, but we concentrate on rights. Above all, modern citizens are rights-bearing individuals. It is not that they don’t have obligations, but it is rights that distinguish citizenship from subjecthood. The latter was basically about obligations. Stated differently, in the bundle of rights and obligations that define citizenship, rights dominate. Modern citizenship is simply inconceivable without the idea of rights. Both the vertical and horizontal forms of citizenship can be viewed primarily through the prism of rights: vertical with respect to the state and horizontal with respect to other citizens.
The next question is: what rights does citizenship entail? To answer this question, we must go back to T. H. Marshall, widely regarded as the field’s theoretical pioneer. Some more recent scholars have dealt with him critically, and we will have reason to take a position on these critical engage-ments. But we turn now to three questions: (a) How did Marshall conceptualize citizen rights? (b) What might be his deficiencies, both generally and especially with respect to India? (c) In what ways do we address these deficiencies and go beyond Marshall in this study?
2 See Jayal (2013; Ch. 4) for a fuller discussion.
3 With the rise of non-resident Indians (NRIs) and their increasing acceptance in recent times, India has taken some steps towards jus sanguinis, though still not fully conceded the principle. Prime Minister Narendra Modi’s address at the Madison Square Garden (New York) in September 2014 was a dramatic illustration of the idea that the Indians abroad, even if citizens of another state, could be viewed as an extension of the Indian national family.4 Brubaker (1998)

6
The Janaagraha- Brown India Initiative Citizenship Index Report 2014
Marshall’s Formulations
Published originally in 1950 and reprinted many times, Marshall’s Citizenship and Social Class was the first, and highly influential, treatment of the subject. Marshall sought to divide citizenship into three components: civil, political and social. The civil component referred to individual freedoms, such as the freedom of speech, religion and association, and the right to property, contracts and justice. The courts were the main institutions concerned with this aspect of citizen-ship. The political component of citizenship encompassed franchise as well as the right to run for office. The local governments and parliament were the principal institutional arenas for with these rights. The third, social, element of citizenship, was split by Marshall into two parts: (a) “the right to a modicum of economic welfare and security” and (b) “the right to share to the full in the social heritage and to live the life of a civilized being according to the standards prevailing in the society” (Marshall 1992: 8). The so-called social ser-vices, especially, though not only, public provision of health care and education, were the institutions closely associated with the third set of rights. The third aspect of citizenship, also called social citizenship, is inextricably tied up with the rise of a welfare state. Marshall also argued that this con-ceptual classification was based on the historical evolution of citizenship in Britain. The civil rights were introduced in the 18th century, political rights in the 19th,5 and the social rights in the 20th.
It is noteworthy that Marshall conceptualized the problem of deprivation entirely in class terms. It was the economically poor, who had “the right to a modicum of economic welfare and security” and “the right to share to the full in the social heritage”. If the state did not guarantee such rights and make allocations for them through state-financed health, housing and education schemes, markets would not be able to provide them. Indeed, left unchecked, markets would de-prive the poor of full citizenship. Markets might be consist-ent with political and civil citizenship, but they were certainly in conflict with social citizenship.
Beyond Class: Social Exclusion
The policy literature that emerged after the 1990s started focusing on non-class dimensions of deprivation, though the scholarly lineage of this line of thinking is older.6 In the 1990s, as markets were vigorously embraced in economic policy, the World Bank also undertook studies of “social exclusion”. The basic rationale was presented as follows:
“Observing poverty in Latin America, it seems obvious that the poor, especially the extreme poor, are suffering from something other than just low incomes. ..Some form of causal relationship is observed between the char-acteristics that indicate who you are, such as your ethnic/racial group, and the position you hold in the income structure of society” (Perry 2001: 9; emphasis added).
The World Bank found that social exclusion had negative consequences for the standard indicators used to under-stand development-- for example, employment, incomes, health, and education.
“Poverty incidence among indigenous peoples in Guate-mala is 87 per cent versus 54 per cent for the non-indige-nous population; in Mexico, 81 per cent versus 18 per cent; in Peru, 79 per cent versus 50 per cent; and in Bolivia, 64 per cent versus 48 per cent. …Schooling is less than one third for indigenous groups in Bolivia. .. In Brazil, poverty rates for blacks and mixed-race people are twice as high as those for white families” (Perry 2001: 11).
This line of reasoning is not wrong; it is incomplete. We should worry about social exclusion not simply because its developmental consequences are bad. That is a sign of instrumental reasoning appropriate for a development agency focused on development outcomes. We should also be concerned about social exclusion because it is intrinsi-cally wrong. Rights accrue to individuals as citizens, not as members of some special communities.
Social exclusion, thus, refers to a systematic marginalization
5 In 1832, 19 per cent of the adult males had the right to vote. The 1867 Reform Act doubled this proportion. But it is only after World War I that the right to vote became universal. The process may have begun in the 19th century, but it was completed only in the 20th.
6 In the 1990s, the International Institute of Labor Studies (IILS) and United Nations Develop-ment Programme (UNDP) cosponsored a series of publications, entitled “Social Exclusion and Development Policy Series”. The International Labor Organization (ILO), Geneva, published the series. It included case studies of social exclusion – its forms and consequences – in India, Peru, Russia, Tanzania, Thailand and Yemen, among others.

7
The Janaagraha- Brown India Initiative Citizenship Index Report 2014
7A study of urban Dalit businessmen is highly illustrative. These businessmen were not illiterate Class-IV workers; they were educated but experienced widespread discrimination. “While most other businesses or enterprises are known by the service they provide or goods they sell, our shops are known by our caste names, Chamaron in dukan Chuhron ki factory (Chamar’s shop or factory of the Chuhra). Such identifications are not seen by the Dalits merely as a matter of violation of their dignity but also a way of harming their businesses. It discourages customers from coming to our shops.” (Jodhka, 2010: 46). The same study reported that “it was difficult for a Dalit to get a house in non-Dalit locality”, and in schools, unlike other children, some Dalit children were “made to wash (their) utensils and asked to keep them away from the rest”. (Jodhka, 2010: 46).
of groups - based on caste, race, ethnicity, class or religion or any durable category (Tilly 2004) - from normal citizen-ship rights, or to systematic prevalence of prejudice, making citizenship rights, though legally available, actually less than fully operative. Such communities are not only typically poorer than the rest of the population, but they are also treated shabbily by the state agencies and by many sections of society.
These are important matters for a study of citizenship. If one is denied legally assigned rights because of one’s caste or religion, it is a truncation of citizenship. Such groups suffer, but the society also does. To reformulate Dreze and Sen (2013), the deprived would contribute more to society, if they were given greater capabilities. Uneducated, unhealthy groups are unable to participate in market exchanges vigor-ously. Social exclusion is both intrinsically and instrumen-tally wrong.
Which communities of India experience truncated citizen-ship? Given what we know from existing studies, Dalits (Scheduled Castes, or SCs), Adivasis (Scheduled Tribes, or STs) Muslims and women are some of the obvious candidates for investigation. Also, important is an Ambedkar idea. He used to call the village a cesspool for Dalits, and viewed the city a site of potential liberation. Is that true? To what extent does caste discrimination exist in urban India, compromising citizenship? 7 By definition, that question acquires signifi-cance in the study of citizenship in urban India.
The relative neglect of non-class forms of exclusion high-lights some other limitations of the Marshallian model. Most notably, in painting his broad canvas of the history of citizenship in the UK, Marshall had a tendency to privilege rights, and he specifically conflated rights-as-status with rights-as-practice. All citizens are presumed to have the basic rights and the capacity to exercise free will, associ-ate as they choose and vote for what they prefer. Following in the relational tradition of analysis, Somers (1993) has argued that the conventional treatment wrongly equates the status of citizenship (a bundle of rights) with the practice
of citizenship (a set of relationships). Formal rights mat-ter, but formal rights must also be actionable. Somers goes on to argue that given the highly uneven rates of political participation and influence across social categories that persist in advanced democracies (and especially the United States), the notion of citizenship should always be viewed as contested. But in the context of developing democracies, where inequalities can be very high and access to rights is often circumscribed by social position or compromised by the weaknesses of state institutions, the very notion of citizen-ship comes into question (Fox 1994: Mahajan, 1999).
So how should we evaluate the actual character of citizen-ship? The point of departure in relational terms is to view the actual practice of citizenship both with respect to fellow citizens (the horizontal dimension) and to the institutions of the state (the vertical dimension). The horizontal dimension refers to the Tocquevillian view of democracy. Tocqueville argued that democracies function well when citizens make use of their associational capacities and recognize each other as rights-bearing citizens. This then leads us to the question of the extent to which pervasive inequalities within society, in effect, distort the associational playing field and produce a wide range of social exclusions (Heller 2013). In more con-crete terms, whether citizens believe in the intrinsic value of treating another citizen as an equal - not just for the ethnic/religious/socio-economic community to which one belongs, but for the civic community as a whole - has a vital effect on what can meaningfully be said about the quality of citizen-ship. In other words, it is not simply the state that truncates the rights of certain citizens or dictates what responsibilities or obligations citizens hold; this is also decided for individu-als as they interact with others.
The vertical dimension is essentially a Weberian problem: many new democracies suffer from weak forms of integra-tion between states and citizens. There are two issues at stake. On the one hand, there is the problem of how citizens engage the state. State-society relations in the develop-ing democracies tend to be dominated by patronage and populism, with citizens having either no effective means of holding government accountable (other than periodic elec-tions) or being reduced to dependent clients. In the absence of clear and rule-bound procedures of engagement, citizens cannot engage the national, or just as importantly the local state, as bearers of civil and political rights. In this relational

8
The Janaagraha- Brown India Initiative Citizenship Index Report 2014
view, citizenship becomes a critical characteristic of democ-racy (Tilly 2004).
On the other hand, we also need to ask where citizens engage the state. That is the problem of the relatively narrow insti-tutional surface area of the state. Given that local govern-ment is often absent or extraordinarily weak in much of the developing world, there are in fact very few points of contact with the state for ordinary citizens. This problem is particu-larly exacerbated in the rapidly growing cities of India, as the democratic principles upon which institutions are based have not made it down to the urban local level. Urban municipal governments have not had the same legislative and policy attention towards decentralization, capacity building, and innovation to address the unique burdens and opportuni-ties that exist with the stewardship of extremely large and extremely diverse metropolitan centres. As Heller and Evans (2010) note, the laundry list of obstacles facing Indian cities and citizenship is lengthy, including: limited autonomy for cities and almost no autonomous sources of revenue; the prevalence of top-down bureaucratic rule rife with clientelism built around inequalities of caste, community, and class; a lack of the fiscal and legal foundations necessary for con-struction of good-quality democratic institutions; few if any nodes of meaningful interface between state and citizens; and lastly, high levels of migration which gives rise to multi-ple competing identities other than civic.
Taken together, the vertical problem of state-society rela-tions and the horizontal problem of perverse social inequali-ties obstruct the emergence of a deeper democracy in India. Just because citizens can vote does not mean that they can they participate or engage effectively. It may indeed be impossible to conceptualize modern democracy without vot-ing, but voting is not all there is to democracies. The practice of citizenship is critical to the deepening of India’s actually existing democracy, vigorous though it is on voting (Varshney 2013).
Beyond Marshall
We thus seek to go beyond Marshall and much of the contemporary literature on citizenship in three ways. First, Marshall’s concentration is on class deprivation; we include non-class forms of deprivation – caste, religion, tribe, ethnic-ity – as well, since in the Indian context these are important
sources of social exclusion in their own right. Second, Mar-shall’s focus is on the legal availability of rights, not on how the legally enshrined rights are experienced on the ground. Our focus is less on the laws or rights in theory, more on the practices on the ground. Third, Marshallian political and civil rights were made available to citizens in post-1947 India, but social rights – right to food, right to education, right to health regardless of income – were not. The latter were not guaranteed as rights in India’s constitution, but enshrined as “directive principles”. They were supposed to normatively guide India’s governments, but the governments were not legally obligated to provide them. Rights to food and educa-tion have very recently been instituted as rights, but there is no right to health yet. How then does one translate the idea of social rights in Marshall to the Indian context? We argue that a more direct and basic measure of the extent to which civil and political rights have been translated into social rights is to focus on basic public services and infrastructure. The rationale is fully developed in a later section, but the central idea is that basic services and infrastructure – water, electricity, sanitation and roads – are critical in their own right and in fact can be said to constitute a core set of capa-bilities in Amartya Sen’s sense of the term. These capabili-ties are one of the obvious advantages that cities have over rural areas and can be measured much more precisely than education and health.
Conceptualizing Citizenship
Based on the above discussion, we propose a two-fold conceptualization of citizenship. First, following Somers, we argue that the formal nature of citizenship – the legal codi-fication of basic rights of citizenship – should be analytically distinguished from its efficacy, that is, the degree to which a citizen can effectively use their rights independently of their social position and without compromising their associational autonomy.8 There is no dispute as to the formal character of citizenship in India, at least with respect to basic civic and political rights. These are enshrined in the constitution, have
8 This later point is especially key to understanding why clientelism can be so corrosive to citizenship. When an individual or group exchanges their vote or support to secure goods from a patron, they are in effect undermining their own associational autonomy, i.e., their fundamental freedom to speak and associate freely. See Heller (2013) and Baiocchi, Heller and Silva (2011) for an elaboration.
9 Of course even these classic, core liberal rights are being constantly contested. The Supreme Court reversal on the rights of gays and increasing incidents of censorship illustrate the point. But unlike in authoritarian or pre-democratic regimes, the general principle of civic and political rights remains the key source of political authorization. For the performance of India’s democracy on two different dimension of democracy – popular sovereignty and freedom of expression – see Varshney (2013: Ch. 1)

9
The Janaagraha- Brown India Initiative Citizenship Index Report 2014
been upheld by the courts and are the bread-and-butter of Indian democratic life.9 Social rights in the Marshallian sense have only just really come into play as formal rights of citizenship, but the principle of being able to deploy civic and political rights to demand social rights is well established.
The effective dimension of citizenship is in contrast much less clear, and in fact presents the central conceptual and empirical challenge of this study. How effectively Indians make use of their rights to associate, vote, participate and engage remains an open-ended question. There is certainly widespread recognition that citizenship in India is highly dif-ferentiated. Chatterjee’s claim that the realm of civil society – the realm in which citizen’s use their rights - is largely the privileged domain of the middle classes and that the poor have only their electoral clout to work with has even become a dominant trope of the literature (Chatterjee 2006). Is Chatterjee right? Do the poor exercise only political, not civil, rights?
We argue that practicing citizenship means essentially three things. First, it requires having sufficient knowledge and un-derstanding to fully engage in public life. This means having, in effect, the basic knowledge of politics and how the state functions. These are necessary for making informed deci-sions about one’s preferences and about how to make claims on the state, be it by voting or directly interacting with state actors. Second, one must enjoy the full freedom to partici-pate in public life. This cannot simply be confined to voting, but means enjoying full associational freedom to engage in activities of public relevance across social boundaries, includ-ing gender, religion, caste and class. There is a large literature that in fact argues that the quality of democracy depends significantly on the breadth and depth of participation, and Rueschemeyer et al. (1992) have systematically linked the participatory dimension of citizenship to substantive out-comes. Third, one has to be able to engage the state and all its myriad offices and institutions as a bearer of rights, and not as a supplicant, client or subject. This means both being able to actually find and engage with the state, and being able to do so without having to pay a bribe, call in favours, mobilize personal networks or otherwise leverage social
10 We excluded respondents who had not lived in the city for at least a year since such residents might either be temporary (and as such not very invested in practicing their citizen-ship) or so new to the city that this alone would over-determine their ability to practice their citizenship.
power. These three components of citizenship – knowledge, participation and engagement – are the building blocks of the idea of citizenship we developed for this project and that we explain in detail in the next section.
B. The Survey
The sample was generated using multi-stage stratified systematic random sampling to ensure proportionate geo-graphical representation of the central and outer (or peri-urban) regions of Bangalore, as well as socio-political/eco-nomic representation of our selected minority/marginalised populations: the SC/STs and Muslims. Our achieved sample size was 4,093 individuals, allowing us robust representation and statistical significance at the city, ward, and neighbour-hood level. At the city level, our sample size gives us a 95% confidence level and a +/- 1.5% confidence interval.
We selected 20 wards out of a total of 198, and 10 Polling Parts from each ward. Polling Parts, which are the smallest political geographic entities in urban India, were selected be-cause they provide consistency in methods if the survey is to be used in other cities and also because they provide some indication of a neighbourhood due to their small size (ap-prox.: 7-14 streets and approx. 1,500-2,500 individuals above the age of 18). Thirty households were randomly selected from each polling part (PP). Within the selected households, individuals who were above the age of 18 and who had lived at that address for one year were randomized for selection.10
Wards and Polling Parts were selected using the following methods:
1. In classifying the wards as either central or outer wards, we followed the Bruhat Bangalore Mahanagara Palike (BBMP) categorization of Bangalore wards into zones. Cur-rently Bangalore has 8 zones, three of which are central or inner and five of which are outer or peri-urban. Using this classification there are 137 central and 61 outer wards. All Polling Parts falling in the central wards are classified “cen-tral” and all Polling Parts within the peri-urban wards are classified “outer.”

10
The Janaagraha- Brown India Initiative Citizenship Index Report 2014
2. In order to identify the SC/ST population we used ward level data on SC/ST population from the 2011 Census. To classify each ward as a high SC or low SC ward we devel-oped a decision rule using SC population quartiles. First, we created a variable that represented the proportion of SC population in a ward (to total ward population). Wards were then classified into quartiles based on the proportion of SC population in each ward. All wards whose SC proportion was equal to or exceeded the third quartile were classified as high SC wards, and those wards whose SC proportion fell below the third quartile were the low SC wards.
3. In order to ensure adequate Muslim population in the sample (and given that a distribution of Muslim population by ward is not available), we resorted to a five-step process that results in classifying a ward (and all Polling Parts within the ward) as either “Muslim” or “non-Muslim.” The major-ity of surveys conducted in India rely on using voter lists to identify a proxy for Muslim population by identifying Muslim names on the list. However, another strand of work under-taken by Janaagraha on the accuracy of urban Indian voting lists provided us with data that demonstrates that voter lists, and particularly those of Bangalore, are often inaccurate to a high degree.11
To overcome this issue, we created a proxy variable for ‘Muslim population density’ by identifying all mosques, Urdu medium schools, and Muslim burial grounds in Bangalore city through a Boolean internet search and a Google Map search and subsequently locating each mosque spatially on Polling Part maps.12 Second, we outlined a buffer zone with a radius of 1000m around each mosque (a “Muslim zone”) for all Poll-ing Parts. This buffer zone was a marker of the likelihood of greater density of Muslim population. Third, we computed the proportion of area that is Muslim zone in each Polling Part by dividing the Muslim zone buffer zone areas by the total Polling Part area. Importantly, if ‘Muslim Zone’ buffer zones overlapped, i.e. there were several mosques in close proxim-ity and thus the 1000 m radii overlay, this area was counted uniquely for each of the overlapping buffer zones. Fourth, we computed the average Muslim zone area within each ward, i.e. we summed all Muslim zone areas within a ward and divided the total Muslim zone area by the number of
Polling Parts in a ward. Finally, we applied the decision rule that if the average area was equal to or exceeded 50 percent, the ward was classified as a “Muslim” ward. This yielded 70 “Muslim” wards and 128 “non-Muslim” wards.
4. Once the strata were identified and the wards classified according to strata, we used a simple random method to select 20 wards from a pre-defined matrix. The distribution of wards across the three dimensions was also set as shown in Table 1 below.
TABLE 1: Distribution of wards across sam-pling strata
Strata Proportion inSample (%)
Proportion inPopulation (%)
RegionCentral/Inner 70 (n=14) 70 (n=137)Outer/Peri-
Urban30 (n=6) 30 (n=61)
SC/STLow SC/ST 60 (n=12) 75 (n=148)High SC/ST 40 (n=8) 25 (n=50)
MuslimMuslim 50 (n=10) 60 (n=128)
Non-Muslim 50 (n=10) 40 (n=70)
To ensure representation of our minority groups we over-sampled on the high SC wards by 15 percent and on the Muslim wards by 10 percent. Once the wards were selected, we used a systematic sampling with random start to select 10 Polling Parts from each of the selected wards.
Appendix 1 describes how, given this frame, 30 households were selected in each PP, and how the survey questionnaire was constructed and administered.
The Variables
The data we collected can be grouped into four different cat-egories. First, we gathered core demographic data, including class, caste, education and religion. Second, we collected data on a wide range of attributes of citizenship. Third, we collected information on various dimensions of infra-structure and service delivery. Fourth, we asked a range of questions on other variables or perceptions that we thought might shed light on the relationship between citizenship and development, including questions about respondent’s gen-eral views of discrimination in Bangalore, their assessment
11 Murthy, Krishnamurthy, Ramanathan and Ramanathan (2012).12 It should be noted that even Polling Part maps themselves are often not available in Indian cities, and when they are, are normally hand-drawn, lacking tremendously in accuracy. In a previous exercise, Janaagraha had created highly accurate geo-spatial maps of the entire city, which could be used for the sampling purposes of the JB-CI.

11
The Janaagraha- Brown India Initiative Citizenship Index Report 2014
of politicians and the nature and extent of their personal networks.
In this report we only draw on a small sub-set of the survey questions (Appendices 3, 4 and 5). They are presented here in keeping with the overall objective of the report, which is to measure, assess and explain the relationship between citizenship and public service delivery in Bangalore.
Control Variables
The first set of variables constitutes our basic control varia-bles. These are socio-economic measures, meant to capture various hypothesized sources of social exclusion or unequal endowments. These include caste, religion, education and class. We asked all Hindu respondents their caste as well as where they would place themselves in official categories of Scheduled Castes (SC), Scheduled Tribes (ST), Other Backward Castes (OBC), and “Forward Castes” (FC). All caste data re-ported here refers to respondents’ self-classification into one of these four categories. Given the relatively small number of STs in our sample, we club STs and SCs together in the analysis. We also only report findings for Muslims, Hindus and Christians, as the total number of other religions was very small (0.3%). Our education variable was a 5-point clas-sification scheme, running from illiterate to college degree.
Measuring class is a notoriously difficult proposition. There are definitional and measurement problems. By definition, it is important to distinguish conventional income or material-based measures from more relational measures.
We developed three different proxy measures for class. Because income reporting is unreliable, we relied instead on an asset-based measure and on a classification of housing types. We also followed the standard practice of using occu-pational data, which is far more likely to capture the specific experience of class as a location in a social hierarchy than static material measures.
For the asset-based measure we asked respondents to report household ownership of 16 different assets ranging from pressure cooker at the low end and car/jeep/van at the high end. For occupation we asked respondents to report the chief wage earner’s occupation. All occupations were
coded into a 6-point scale ranging from unskilled laborer to professional. As we explain in the next section, we rely primarily on household type (HT) as our measure of class in the models presented in this report. This turns out to be an excellent measure and a critical control variable.
Conceptually, HT conveys a very different material dimension of class than assets. Assets are for the most part procured on the market and directly reflect purchasing power, that is, income. Access to housing in India is driven by market forces, but is also highly regulated and sometimes directly supplied by the state and also shaped by social networks. As such, in addition to disposable income, housing type will also reflect one’s location in both formal and informal networks of distribution, including access through state patronage, inher-ited position, strategic networks etc. In this sense, “housing type” is a much noisier proxy for class, but is also more likely to capture the actual dynamics of class practices in an Indian city.
Another advantage of our HT variable is that it was not self-reported. Instead, field surveyors, after receiving extensive field training, were asked to classify each household they surveyed into one of five HTs. These were as follows:
HT 1: Informal settlementHT 2: Designated/Notified slumHT 3: Lower middle class housingHT 4: Middle class housingHT 5: Upper Class housing
Pictures that represent the model housing type for each classification are presented in Appendix 2
The Indices
For the purposes of this report, we constructed two indi-ces. The first is the Citizenship Index (CI), which serves as the independent variable in our analysis. The second is the Basic Service Delivery and Infrastructure Index (BSDII), which stands as our dependent variable.
Indices are as heuristically useful as they are statistically problematic. On the one hand, an index allows one to cap-ture the multidimensionality of a particular phenomenon. When we talk of “having” and “using” citizenship, we are

12
The Janaagraha- Brown India Initiative Citizenship Index Report 2014
talking of a complex, multidimensional process, which, the latest theory tells us, must capture a range of substantive and relational dynamics. Services and infrastructure may be more tangible, but nonetheless vary along important dimen-sions such as access and quality. As such, it is very useful to develop indices that capture the totality of the experience and provide us a “general” measure.
There are however real conceptual and statistical problems with any such exercise. Setting aside the actual choice of variables that constitute an index (a problem that accompa-nies every exercise of treating a variable as a measure of a real-world phenomenon), there are three challenges: direc-tionality, collinearity and aggregation. First, any measure that goes into an index must be monotonic, that is move in a logical direction. Specifically, it should be clear that more (or less) of the indicator (e.g. literacy) contributes to the out-come you are measuring. For instance, to include rainfall in an index of good agricultural conditions would obviously be problematic: more rain up to a point will enhance productiv-ity, but too much rain can destroy a crop. If the measure is curvilinear then it should not be included in an index. Second, one must contend with the problem of collinearity, that is that two separate variables may in fact be capturing the same underlying phenomenon, thus inadvertently amplifying the effect of that phenomenon. There are statistical tools to address such problems, but we chose to address them by relying on variables that we believe are independently significant. The third problem of aggregation is both concep-tual and statistical. How much weight does one give each component of the index, and how much weight does one give each question of each component? Is knowledge of civic affairs more important than knowledge of political affairs? Is quality of water more important that supply of water? We do not believe that there is a plausible case for weighting our questions or the components of each index. Rather, follow-ing the logic that went into the construction of the Human Development Index (HDI), in which growth, infant mortality/life expectancy and literacy were all given equal weight, we use a simple process of aggregation.
The construction of the BSDII index was fairly straightfor-ward. This index includes 3 major service (water, electricity and sanitation) and one infrastructure (roads) components. All of our measures for each service have clear directionality (having more or cleaner water is good) each is clearly signifi-
cant in its own right,13 and the case for aggregating them equally is strong.
Constructing the CI index was more complicated. As dis-cussed in the theory section, we conceptualized citizenship as a multifaceted and relational concept. Specifically we ar-gue that the effective exercise of citizenship requires having the necessary knowledge, being able to participate in public life and being able to engage with the state as a rights-bearing citizen. To capture each of these we asked a series of questions and developed specific aggregated component measures of knowledge, participation and engagement. Each of these is presented and analyzed independently in this report. But building an index proved more difficult. The knowledge and participation measures have a logical direction – the more you know and the more you participate, the better. Collinearity is not a problem, since each form of knowledge and each type of participation is valuable in its own right, and both measures lend themselves to aggrega-tion without weights. But our engagement measure proved to be problematic. As we explain in the next section, we actually found that it was curvilinear, with some forms of “poor quality” engagement actually meaning that citizens were able to engage with the state more effectively. As such, we present the findings for engagement, but do not include them in the CI.
The BSDII covers water, sanitation, electricity and roads. Each of these carries the same weight in the index. Water provision service, for instance, is based on 5 dimensions: source, usability, convenience, gaps in supply, and consist-ency. Water source is coded as 1 if water to the household is provided by a public agency such as the Bangalore Water Supply Board; and coded 0 if provided privately (i.e. a bore well or a water tanker). Convenience measures whether the primary source of water is located within the house-hold premises (coded as 1) or outside (coded as 0). Usability measures whether water provided is used for both drinking and general use (1) or only one purpose, either drinking or general use (0). Gap measures whether households experi-ence gaps in the supply of water (1: No; 0: Yes), and consist-ency captures whether households possess water storage facilities (1: Yes; 0: No). The indicators for electricity provision
13 The quality of water provisioning (e.g. inside or outside the house) and the frequency of water provisioning might well be highly correlated, but again, each matters in its own right.

13
The Janaagraha- Brown India Initiative Citizenship Index Report 2014
include whether a household has an electricity connection (1:Yes; 0: No) and the number of gaps (in hours per week) in power supply experienced by the household (0: 18-39 hours; 1: 12 to 13 hours; 2: 4 to 6 hours; 3: 2 hours; 4: no power cuts). The indicators for sanitation capture whether a household has own toilet (2), or shared/community toilet (1), or whether the toilet is an open or shared pit, or open defecation is practiced (0). Similarly, the measure for infrastructure, i.e. roads, is based on three dimensions: whether the road is kuccha (unpaved) or pucca (paved); in good or poor condi-tion; and if water gets logged during monsoon. This measure equals 2 if the road is paved, in good condition, and there is no water logging. Conversely the measure equals 0 if the road is unpaved, in poor condition, and water logged. For any other combination (i.e. paved, good condition but with water logging or unpaved, good condition and no water logging) the variable equals 1. Each dimension was given the same weight. The BSDII is, thus, a simple aggregation of these 12 questions. The exact questions are presented in Appendix 3.
The Citizenship Index has three components. Knowledge refers to a citizen’s basic cognitive map of political and civic affairs as well as the basic citizenship values they embrace. Knowledge of civil and political affairs was relatively easy to capture: for political/electoral knowledge we asked if the re-spondent knew which parties and individuals held which po-sitions (i.e. which party or coalition rules at the national and state levels) and for civic knowledge we asked if they knew about different opportunities for participation (e.g. aware-ness of ward meetings), redress of grievances (e.g. Right to Information) and if they know which agencies delivered which services (i.e. specific knowledge that the state agency for water provision is Bangalore Water Supply and Sewerage Board, or the agency that provides electricity to households is the Karnataka Electricity Board). (See Appendix 4 for the questions).14
Participation refers to specific forms or instances of direct involvement in political and civic life. The participation index is thus composed of three dimensions of participation: voting activity, political participation, and civic participation. Voting focuses on whether a respondent voted in the three recent elections (the 2009 Lok Sabha elections, 2013 Karnataka State elections, and the 2010 local elections). Political partici-pation refers to a respondent’s political activities outside of voting, i.e. participation in elections and rallies, contributions to political parties, and so forth. Civic participation measures a respondent’s civic involvement i.e. participation in neigh-bourhood redressal of common problems, participation in a variety of associations and participation and frequency of participation in local ward meetings (Appendix 4 and 5).
Engagement refers to the frequency and quality of inter-action with public and private agencies that provide basic services. Most studies of citizenship take this dimension of citizenship for granted and focus exclusively on knowledge and participation. But as we argued in the theoretical sec-tion on citizenship, the quality of engagement with public institutions cannot be taken for granted. When citizens approach the state or other agencies that provide public services, they often do so not as right-bearing citizens but as bearers of various political or socio-economic attributes. On the one hand institutions can discriminate, that is, treat citi-zens differentially depending on their caste, religion, gender or class. On the other hand, some citizens may have more connections, authority or capacity in dealing with the state. The facility with which citizens engage with public and pri-vate agencies that provide basic services and the quality of that engagement is thus a critical dimension of citizenship.
Measuring engagement presents significant challenges. Our initial approach was to ask fairly generic questions, such as asking respondents how they would evaluate their engage-ments with the state. But perception questions are highly relative. People will evaluate an experience in relation to what their expectations are. If one doesn’t expect a public agency to be responsive, a question about the quality of your experience with that agency will not provide a useful meas-ure. We chose instead to ask respondents about concrete experiences of engagement with nine separate services: water, electricity, ration shops, securing ration/BPL cards, securing caste cards, obtaining a driver’s license, using police services, using public health facilities and public educational facilities (see Appendix 5 for questions on this section).
14 The basic idea for each form of knowledge is to establish the extent to which the
respondent has the basic knowledge to use their rights effectively. But we also wanted to measure the extent to which respondents subscribe to basic values of civicness. Questions of this nature are intrinsically difficult, since respondents are likely to provide the surveyor with what they believe to be the “right” answer. As such, rather than ask direct and fairly loaded questions such as “would you resort to violence to solve a problem”, we instead asked respondents to react to a series of vignettes. Each vignette was based on a scenario in which a third party actor is given a choice of options when confronted with a complex situation in which the actor would have an incentive to act contrary to widely held views of “being a good citizen”. The respondent was then asked in response to each vignette how they think the third party actor “should” act. We report on these vignettes, but do not include them in our knowledge measure – see Appendix 6 for the vignettes.

14
The Janaagraha- Brown India Initiative Citizenship Index Report 2014
All such questions were asked at the household level, that is, if someone in the household has engaged these services in the past 2 years (or 10 years in the case of ration/BPL card applications in recognition of the fact that many of these services are provided for households). For each service we asked a chain of questions designed to unpack the actual en-gagement: did the individual in the household approach the agency alone or through an intermediary, were they treated fairly, did they have to pay a bribe and did their problem or demand get resolved? This provided a wealth of information that allowed us to develop very detailed measures of the quality of engagement for each service.
But for the purposes of this report, we had to develop a more simplified measure. We did this in two steps. First, an obvi-ous concern about trying to measure “engagement” is that those with more problems will engage more. We dealt with this problem by including in our list of engagements a wide swath of services (9 in all covering services that individuals across class lines would need to access), a generous time-span (2 years for services and 10 years for cards), and made this measure into a household level measure. It is inconceiv-able that a household would not have at least one occasion on which they “needed” to engage with the state. If across all 9 services and over the specified period households never engaged the state, we coded them as “no engagement” though we can safely assume that these respondents had a need to engage the state. Second, we combined the reported experiences of those who did engage the state into a binary score averaged across the number of engagements. We only used two measures here: whether an intermediary was used and whether a bribe was paid. If either or both of these happened we scored the engagement as a 1, that is, as one in which a respondent was not treated as a citizen (we label this as “poor quality engagement”). If the engagement was direct (that is not transacted through an intermediary) and if no bribe had to be paid, we scored it as a 2, that is, engage-ment as a citizen (labeled as “good quality engagement”). We actually coded and aggregated our series of engagement questions in a number of ways and found that this simpli-fied binary coding provided the most robust measure. The measure provided some important findings. Notably, we found that upper classes report significantly higher incidence of “poor quality engagement” that is were more likely to pay a bribe or use an intermediary. Clearly, this is not because they are discriminated against. Rather, they simply have the means (money and connections) to work around the institu-
tions. But just as clearly, this does not mean they have less effective citizenship. The engagement measure turns out to be curvilinear. We as such excluded it from the Index.
The overall CI index thus includes the average score of the two components of knowledge and participation.
C. Results
We begin by presenting the basic demographic characteris-tics of our sample, and compare these to the Census data for 2011.
As is seen in Tables 2 and 3, our sample over-represents the SCs/STs and Muslims. The proportion of SC/ST respondents in the entire sample is approximately 20.4 percent (16.8% SC and 3.6% ST), 15 while the comparable proportion for Ban-galore reported in the 2011 Census is approximately 14% of the entire population (12% SC and 2% ST). The sample Muslim population is 18% compared to 14% in the Census. Within the Hindu sample, of note is that “forward castes” (FCs) represent 54% (see Table 3), a figure that might strike some as high. From our analysis of individual respondents it is clear that many Lingayats and Vokkaligas self-classified as FC, even though legislatively they are considered to be “other backward castes” (OBCs). However, given the majoritarian status of Lingayats and Vokkaligas, much social research conducted in Karnataka and Bangalore recodes them as FC in order for the data to make better sense, given these groups’ social standing and access to resources. Since in our own sample many Lingayats and Vokkaligas self-classified as FC, we take self-classification as a social fact. Moreover, this number is perfectly consistent with a recent careful analysis of caste data from Indian cities with million plus populations (Singh 2014). We would also note that a major-ity of our respondents who reported having moved to Banga-lore in the past year self-identified as FC.
15 The SCs and STs account for about 29 percent of all Hindus in the sample (24 percent SC and 5 percent STs) – that is, if we exclude non-Hindus from the denominator.

15
The Janaagraha- Brown India Initiative Citizenship Index Report 2014
The gender break-up of our sample is 55.6% female as op-posed to 47.8% as per Census data, 44.3% male 16 as opposed to 52.4% from Census data.17
The largest percentages of our sample, 39.2% and 31.6% respectively, constitute people who belong to the 4th (High/Secondary School) and 5th (College and above) categories for education (see Table 4). Lastly, the average family size of our sample was found to be 2.94, i.e. ~3 people in each family.
TABLE 2: Religion breakdown of the sample
Religion PercentHindu 72.90%Muslim 18.00%Christian 8.80%Jain 0.10%Other 0.20%Refused to answer 0.00%Total 100%
TABLE 3: Caste breakdown of Hindu citizens in the sample
Caste (Hindus Only) PercentOBC 17%SC 24%ST 5%Other / FC 54%Total 100%
TABLE 4: Education breakdown of the sample
Education (Respondent) PercentNo School 11%Primary School 3.20%Middle School 14.9%High/Secondary School 39.2%College and above 31.6%Don’t know/Can’t say/Refused to answer 0.1%
Total 100%
Class in Bangalore
Tables 5, 6 and 7 present the basic findings from our three proxies of class: assets, household type and occupation. The assets are combined into 4 ranges, based on the number of assets owned. For those owning 0 assets, 0 is the value assigned; for 1-4 assets a value of 1 is assigned; for 5-8 as-sets a value of 2 is assigned; for 9-12 assets a value of 3 is assigned; and those with 13-16 assets are assigned a value of 4. The vast majority of our respondents fall into groups 2 and 3 pointing to very lumpy middle (see Table 5). The oc-cupation data confirms this picture. Though 40% of Banga-loreans are unskilled and semi-skilled workers, over 50% are in white collar occupations, of which the vast majority (45% of the whole sample) are professionals (see Table 6). This con-firms Bangalore’s status as an IT and high-end services city.
TABLE 5: Measures of Class (Assets and Oc-cupational Categories)
Asset Range Frequency (Households) Percent0 18 0.41 284 6.92 1446 35.33 1603 39.24 737 18
161%-3% people identified themselves in the ‘other’ gender category. The 2011 Census data
does not provide information for the ‘other’ gender category.17
Individuals were selected from households using randomization of all household members above the age of 18 who had lived in the household for a minimum of one year. The scheduled hours of interview ran seven days a week and from early morning until quite late into the evening after working hours in order to cast the widest net for finding the full range of individuals at home. In case the selected member was not home, an interview was scheduled. If the interview was abandoned by the selected household member three consecutive times, the household was dropped and was not substituted to avoid over-representation by households or individuals who were home during the day. To account for non-substitution, several other methods for household and participant selection were employed to avoid over or under representation against a number of strata. These methods are detailed in Appendix 1. Despite these efforts, we see an overrepresentation of women. This is likely either due to the randomization of participants at the household level, and/or the difficulty that all surveys in India face of surveying working males.

16
The Janaagraha- Brown India Initiative Citizenship Index Report 2014
TABLE 6: Occupation of household’s chief wage earner
Occupation of Household Chief Wage Earner Frequency Percent
Unskilled worker 707 17.3Vocational/semi-skilled worker 953 23.3Clerical/Sales work, Supervisory level
320 7.8
Petty trader, Shop owner 172 4.2Self-employed professional , Businessman/industrialist with 0 employees, Officers/Junior Executives
1001 24.5
Professional- Middle-Senior Executives/Officers, Business person/industrialist with 1-9+ employees, Armed forces/se-curity forces, Legislative/Law enforcement officials
833 20.4
Other (Student, Retired Other/Housewife
70 1.7
The findings from our asset and occupational measures of class find further confirmation in our analysis of household types. Using the 5-scale classification, 52.7% lived in Housing Type 3, that is Lower Middle Class Housing (Table 7). These homes are usually single-floored concrete structures, with 2-3 rooms. If housed within an apartment building, they generally have shared balconies, small windows, outside publically accessible staircases, no gate, wall, or security, and may have commercial units on the ground floor. Only 73 citi-zens in our sample live in informal slum settlements and 462 in one-room notified/designated slum housing. Taking these two categories together, we find that 13.1% live in slums.18 This is higher than the census figure of 8.5%. The census figure has however been widely criticized for undercounting slums.19 Housing type 4 is also quite large, accounting for 29.8% (1220) of our sample. Taking the asset measure and housing type together, it becomes very clear that Bangalore has a very sizeable middle class, that is very much in the
middle (in contrast to the conventional usage of “middle class” in India that encompasses all sectors that are not poor and that unhelpfully includes the “upper classes”).
TABLE 7: Measures of Housing Type
Household type Frequency PercentInformal Slum 73 1.8Notified Slum 462 11.3Lower Middle 2155 52.7Middle 1220 29.8Upper Class/Stand Alone
183 4.5
Total 4093 100%
Though all three measures of class paint a similar picture, these findings are limited. Occupational data is difficult to interpret given how different respondents might self-classify and that fact that some of these categories, which are bor-rowed from the census, clearly overlap: e.g. “shopkeepers” include vegetable sellers - subzi wallas - and the highly privileged mall shop owners. The asset data provides a lim-ited picture because of the high degree of lumpiness in the middle.20 The household type data has the advantage of not being self-reported, but also suffers from lumpiness in the middle. Overall, the picture of a larger, lumpy middle might conceal more than it reveals.
Fortunately, since as part of our sampling technique we identified the housing type of all households in the polling part (not just the ones surveyed),21 we can actually disag-gregate the lumpy middle (specifically the lower middle class category). In other words, with a full roster of housing type classifications for every unit in the polling parts from which we sampled it is possible to identify not only the HT of our sampled households, but also the exact mix of HTs in that polling part. This in effect gives us a sense of the neighbour-hood. We do this specifically by disaggregating our HT3 category into a “2.5” and “3.5” category. The disaggregation rule was simple. We began by using a threshold of 50%; that
18 This number does not include people who have not lived in the city for at least a year.
Adding these would however not change the percentage, since only 12% percent of those who said they had been in Bangalore less than a year lived in shacks. 19
Gautam Bhan and Arindan Jana, “Of Slums or Poverty: Notes of Caution from Census 2011, EPW May 4th, 2013; Ramanathan, Ramesh, “The State of the Slum”, retrieved from: http://archive.indianexpress.com/news/the-state-of-the-slum/1099426/ on 19th March 2014
20 The asset measure runs into a problem of saturation: there are a lot of households who
reported having a bulk of the assets present in the asset index, and without having more fine-grained data on the actual value of these assets (e.g. expensive vs. cheap TVs) lots of material distinctions get lost in the aggregation.21
For further explanation see Appendix 1.

17
The Janaagraha- Brown India Initiative Citizenship Index Report 2014
is, reclassifying all those HT3s that were in neighbourhoods in which less than 50% of all households were HT3s. If more than half of the other households were HT1 or HT2, then we reclassified the HT3 as an HT2.5. If more than half were HT4 or HT5, then it was reclassified the HT3 as an HT3.5. We then repeated this exercise using 70% as the threshold; that is re-classifying all households in neighbourhoods that were less than 70% HT3. These distributions are presented in Tables 8 and 9.
Two important findings emerge. First, 39.5 percentage of respondents not only live in HT3s, but live in HT3s that are in predominantly HT3 neighbourhoods (over 50% of the neigh-bourhood is made up of HT3 dwellings). This is the lower middle class that lives in lower middle class neighbourhoods. This is much lower than the 53% living in HT3s that we found in our first classification (Table 7) but still a substan-tial portion of the city. When we use the 70% cutoff, we find that nearly half of the HT3 households find themselves in neighbourhoods that have a significant presence of HT 1 and HT 2, or HT 4 and HT 5 households. In other words, half of the lower middle class (as measured by HT3) lives in quite diverse neighbourhoods (as measured by mixed housing type). For example, with the 70% cutoff we find that 14.3% of our sample consists of HT3s that live in neighbourhoods that have a sizeable presence of slums making them very distinct from predominantly lower middle class neighbourhoods. Such neighbourhoods are in all probability unauthorized, and given the presence of slums, certainly unplanned. By some definitions, these neighbourhoods might in fact be labeled as slums. But classification issues aside, what is clear is that what first appeared to be a large and homogenous lower middle class turns out to be much more disaggregated.
TABLE 8: Housing Type using 50% threshold for HT3
Household Type
Info
rmal
Sl
um
Not
ified
Sl
um 2.5
Low
er M
iddl
e
3.5
Uppe
r Mid
dle
Uppe
r Cla
ss/
Stan
d Al
one
Frequency 73 462 248 1616 291 1220 183
Percent 1.8 11.3 6.1 39.5 7.1 29.8 4.5
TABLE 9: Housing Type using 70% threshold for HT3
Household Type
Info
rmal
Sl
um
Not
ified
Sl
um 2.5
Low
er M
iddl
e
3.5
Uppe
r Mid
dle
Uppe
r Cla
ss/
Stan
d Al
one
Frequency 73 462 586 1003 567 1220 183
Percent 1.8 11.3 14.3 24.5 13.9 29.8 4.5
This analysis provides a fine-grained picture of class in Ban-galore as measured by housing type. Our last table (Table 9) suggests that 27.4% of Bangaloreans live in households that are in neighbourhoods that are lower than lower middle, meaning either slums or having a high presence of slums. But how do other forms of social exclusion, such as caste and religion, play into this? In the following set of tables we cross-tabulate housing type with caste and religion.
Tables 10 and 11 appear to paint a picture of a highly integrated city, at least in the middle. Thus 56% of SC/STs live in lower-middle class housing (see Table 10) and an extraordinary 63% of Muslims likewise live in lower middle class housing (see Table 11, number of households in paren-theses). Indeed, if we were to treat HT3 as a modal type of neighbourhood, then it would be the kind of neighbourhood that is home to large segments of all the major religious and caste groups.

18
The Janaagraha- Brown India Initiative Citizenship Index Report 2014
TABLE 10: Caste and Household Type Using 5-scale Housing classification*
Caste
Household Type
Informal Slum
Notified Slum
Lower Middle Middle
Upper Class/
Stand Alone
SC/ST(42) (203) (469) (109) (12)5.03 24.31 56.17 13.05 1.44
OBC(8) (43) (278) (171) (12)
1.56 8.40 54.3 33.0 2.34
Other (FC)(9) (67) (726) (646) (116)
0.58 4.28 46.42 41.3 7.42*Number of households in parentheses
TABLE 11: Religion and Household Type Using 5-scale Housing classification*
Caste
Household Type
Informal Slum
Notified Slum
Lower Middle Middle
Upper Class/
Stand Alone
Hindu(62) (327) (1508) (943) (143)
2.08 10.96 50.55 31.61 4.79
Muslim(6) (80) (463) (174) (12)
0.82 10.88 62.99 23.67 1.63
Chris-tian/Other
(4) (55) (184) (103) (28)
5.56 14.92 50 26.24 7.73*Number of households in parentheses
But once again, when we disaggregate the HT3s using our cutoffs, we get a very different picture.
When the 70% cutoff is applied, of the 56.17% SC/ST house-holds of housing type 3 approximately 19.16% of households move to housing type 2.5 and 13.29% get classified in housing type 3.5 (Table 12). Greater numbers of SC/ST households move to the 2.5 housing type relative to 3.5, pointing to a downward slide for SC/STs when we disaggregate HT3. We observe the opposite trend for FC: larger share shifts to housing type 3.5 neighbourhood. In other words, there is
far greater caste segregation observed in this analysis of neighbourhoods than in our original classification of housing types. It now becomes clear that half of the SC/STs live in poor neighbourhoods, specifically shacks (5%), designated slums (24%) and neighbourhoods with a sizeable slum population (HT2.5 = 19%). In contrast, only 16% of the OBCs and 8% of FCs live in these neighbourhoods.
When a particular group is clustered in a specific neighbour-hood, sociologists distinguish between “ethnic enclaves” and ghettos. Enclaves are neighbourhoods where people chose to live in order to share cultural resources or other desirable assets linked to membership in a specific group. Ghettoes are places where ethnic minorities are stuck, because of social exclusion or inadequate economic resources to live in more advantaged neighbourhoods.22 Our default assump-tion would be that that a 2.5 neighbourhood, with its large share of slums, is more a ghetto than ethnic enclave. This is partially confirmed by our later analysis that shows that these areas are poorly provisioned in terms of basic service and infrastructure. In this sense, we have clear evidence of SC/ST ghettoes. Not only do SC/STs account for the majority of informal slum and designated slums dwellers (71% and 65% respectively), they also account for 47% of the house-holds in the 2.5 housing category (Table C13). Having said this, there does nonetheless appear to by some caste mobil-ity in Bangalore. Thus, 24% of SC/ST households have made it to the housing type 3 neighbourhoods in which more than 70% of all households are HT3, that is solidly lower middle class neighbourhoods, and 13.3% into 3.5 neighbourhoods.
TABLE 12: Caste and Household Type (70% threshold)*
Caste 2.5 Lower Middle 3.5
SC/ST(160) (199) (111)19.16 23.83 13.29
OBC(59) (132) (87)6.25 39.45 8.59
Other (FC)(124) (366) (236)
7.93 23.40 15.09
*Number of households in parentheses
22 For a review of this literature and an application to post-apartheid South Africa, see Schensul and Heller (2001).

19
The Janaagraha- Brown India Initiative Citizenship Index Report 2014
TABLE 13: Caste and Household Type (70% threshold) with Percentage of Caste Group in that Housing Type
Household Type
Caste
Info
rmal
Slu
m
Notif
ied
Slum
2.5
Low
er M
iddl
e
3.5
Mid
dle
Uppe
r Cla
ss/
Stan
d Al
one
SC/ST 71.19 64.74 46.65 28.55 25.58 11.77 8.57
OBC 13.56 13.78 17.20 18.94 20.05 18.47 8.57
Other (FC) 15.25 21.47 36.15 52.51 54.38 69.76 82.86
An analysis of Muslims reveals a very similar pattern. When we use the 50% cutoff the percentage of Muslims in HT3 falls from 63% to 54% (see Table 14), and then in the 70% cutoff, drops precipitously to 28% (see Table 15). In other words, more than a third of Muslims that live in HT3s live in neighbourhoods with a large presence of slums. As with SC/STs, there is also a clear clustering effect here. More than 1/3 (36%) of all Muslims thus live in neighbourhoods that are either shacks (0.8%), slums (10.8%) or 2.5 neighbourhoods that have significant presence of slums (24%). In contrast only 25% of Hindus live in these neighbourhoods. But as our analysis of services will later show, Muslims on a whole are not more poorly serviced than other religious commu-nities. In other words, though many Muslims cluster into 2.5 neighbourhoods, most of these are probably closer to ethnic enclaves than ghettoes. Moreover, it should be noted that a solid majority of the Muslim population lives in HT3 (28%), HT3.5 (11%) and HT 4 (24%) neighbourhoods and that in contrast to SC/STs Muslims are not over-represented in informal settlements and slums (Table 16).
TABLE 14: Religion and Household Type (50%)*
Religion 2.5 Lower Middle 3.5
Hindu (191)6.40
(1076)36.07
(241)8.08
Muslim (39)5.31
(395)53.74
(29)3.95
Christian/Other (18)4.97
(145)39.5
(21)5.52
*Number of households in parentheses
TABLE 15: Religion and Household Type (70%)*
Religion 2.5 Lower Middle 3.5
Hindu (355)11.9
(709)23.77
(445)14.92
Muslim (177)24.08
(207)28.16
(79)10.75
Christian/Other (54)14.92
(87)23.76
(43)11.33
*Number of households in parentheses
TABLE 16: Religion and Household Type (70% threshold) with Percentage of Religious Group in that Housing Type
Household Type
Cast
e
Info
rmal
Slu
m
Notif
ied
Slum
2.5
Low
er M
iddl
e
3.5
Mid
dle
Uppe
r Cla
ss/
Stan
d Al
one
Hindu 86.11 70.72 60.58 70.69 78.48 77.30 78.14
Muslim 8.33 17.35 30.20 20.64 13.93 14.26 6.56
Chris-tian/Other
5.56 11.71 9.22 8.57 7.23 7.79 15.30
In the next section when we run our models, we only use the housing type proxy of class. We selected this measure over occupation and assets for two reasons. First, as one would expect, there is a high degree of multi-collinearity in these measures. For modeling purposes, it is important to exclude

20
The Janaagraha- Brown India Initiative Citizenship Index Report 2014
variables with high collinearity since this can produce sta-tistically perverse effects (changing the sign/direction of the relationship of our variables, for example). We found, moreo-ver, that when used in models, all three produced consistent relationships with our dependent variable both in terms of sign and significance. We opted to use HT because we think it is very robust (based on direct observation) and conceptu-ally gives us a bit more nuance. Not only does it reflect that material conditions of a household, but also the quality of the neighbourhood. The latter is important because it is now well established that neighbourhoods have significant independent effects on key social outcomes (violence, op-portunity, health etc.).23
Citizenship
Before turning to the Citizenship Index and its component parts, we want to comment on a few observations based on specific questions.
When asked what the two most important responsibilities of citizens are, as Table 17 shows, “voting” and “respect-ing the law” were at the top (72% and 71.8% respectively).24 These are what we call the vertical dimensions, the legal relationship of the citizen to the state. What is interesting to note is that Bangaloreans put this vertical dimension well above the horizontal (or Tocquevillian) ideal of citizenship as a relationship between citizens. Thus only 48% of respond-ents picked “treating other citizens as equals” as one of the two most important responsibilities of citizenship. There is more respect for the state as a legal entity than of one’s fellow citizens as rights-holders. It is also very clear that citizenship does not translate at all into an active sense of civic responsibility. Thus only 5.8% of our respondents chose “being involved in your community” as an important respon-sibility of citizenship.
TABLE 17: What are the two most important responsibilities of citizenship?
Responsibilities No. of responses PercentageVoting 2949 72.05%
Respecting the law 2937 71.76%Treating others as equal 1970 48.13%
Being involved 238 5.81%Don't know 40 0.98%
Refused to answer 6 0.15%
This later finding might at first appear to be contradicted by what we found in the data from a selection of vignettes on civic norms. Here the response rate was overwhelm-ingly positive, with over 80.1% providing the “correct” civic answer to all five of our hypothetical situations and 99.7% of respondents answering at least one vignette correctly. These vignettes were specifically designed to measure the extent to which citizens know what the “right” civic norm is. For example, 93% said that they would think it wrong of their neighbor to add a room to their house to accommodate an in-law without obtaining the necessary building permits. Yet we know for sure that building permissions are widely forged.25 Given that this practice is widespread, one has to draw the conclusion that Bangaloreans know what the cor-rect civic response is, even if this is not what they necessar-ily practice themselves or would demand of others in their community. Interpreted as such, this is consistent with the finding that only 5.8% think civic engagement is important. Also, only 500 of our respondents reported being members of any kind of association, and only 106 out of 4093 have gone to a ward meeting.
If Bangaloreans are not very active in civic life, they do vote. At all levels of elections, Bangaloreans vote in high per-centages: 77.5% at state level, 71.4% at the municipal level and 70.2% at national level, with the highest rates of voting occurring among the poorest segments of the sample. They also have quite good political knowledge. 83.4% respondents answered the question “ruling party at state-level’ correctly and 84.6% answered “ruling party at national-level” cor-rectly. But only 35.2% respondents knew the name of their municipal corporator. The level at which citizens are most
25 The forging levels could be as high as 80%. See Joseph, J. (2014).
23 The US literature on this topic is extensive.24 Minorities held similar views. “voting” and “respecting the law” were ranked 1st and 2nd amongst Muslims and SC too. Muslims: voting-69.65%; respecting the law-69.52%.; SCs- voting-75.29%.; respecting the law-67.29%.

21
The Janaagraha- Brown India Initiative Citizenship Index Report 2014
likely be able to use their rights - the local or municipal level - is precisely the level at which they have the least political knowledge. This no doubt reflects how weak local govern-ment has historically been at the local level.
But when it comes to participation in politics beyond elec-tions, Bangaloreans are once again not very active. Less than 10% contribute time to political campaigns in municipal elections and less than 10% participate in politics outside elections. Especially in local politics, the space in which classical democratic theorists from Locke to Gandhi have argued the skills and virtues of citizenship are forged, there clearly continues to be a massive deficit. Thus, 93% of our respondents reported that they did not know if there was a ward committee in their community, and only 2.6% reported to having attended a ward meeting, again no doubt reflecting the anemic nature of local institutions of representation.
In sum, Bangaloreans vote a lot, know something, but don’t do much beyond electoral participation.26
TABLE 18: Total Engagement Across all Services
Percent reporting no engagement with state agencies 23%
Percent reporting engagement with state agencies on their own 63%
Percent reporting engagement with state agencies through an intermediary 14%
TABLE 19: Quality of Engagement
Quality of Engagement (Of Respondents who report Engagement with State Agencies, %)
Percent Reporting Being Asked for a Bribe
at state agencies27%
Percent Reporting Not Asked for a bribe 73%
When we look at our battery of questions that were designed to capture the quality of engagement with public agen-
cies that provide basic services, a very interesting picture emerges. First, the degree of engagement across our 9 services varies dramatically. Almost 81% of our respondents reported that someone in their household went to a hospital in the past two years, but only 4.7% went to the electric-ity department. The vast majority of our respondents used private schools (65%) and private health care facilities (62%) over public ones.
Overall though what is probably most surprising is that almost a quarter of respondents in our sample had not en-gaged with state agencies to solve problems related to wa-ter, power, or acquiring a ration/BPL and/or caste card (Table 18). Recall that being coded as “no engagement” means not having engaged once with any of the 9 state agencies over the past 2 years for services and 10 years for cards. This is a very low bar for engagement. Interpreting this finding is dif-ficult. Given how much citizens in urban India are dependent on the state for services and given that service provisioning is on the whole quite poor (a point underscored by our own findings on the BSDII index reported later), we had anticipat-ed higher levels of engagement. For example, over 50% of our sample reports having very poor quality water provisioning (as measured by frequent shortages), yet only 7% of our sam-ple has gone to the water department in the past 2 years. There are two possible interpretations: one is that citizens have very low expectations of the returns to engaging with the state and thus poor service provision is accepted as a norm to live with. The other is that the transaction costs of engaging the state are so high, that it is either very time-consuming or otherwise expensive (finding an intermediary or paying a bribe) thus creating an extremely strong disin-centive to engage the state for improving problems in basic service delivery.
Table 18 further breaks down the nature of engagement with the state and shows that the percent of respondents visiting state agencies is approximately 77, of which 63 percent re-port engagement with a state agencies on their own and 14 percent report engaging through an intermediary. Table 19 further indicates that of the total number who engaged with the state, about 27% report having been asked for a bribe.
We can now turn to the Citizenship Index (CI). The CI consists of both the knowledge and participation measures weighted equally. We have not included the engagement measure in
26 See, however, Kamath and Vijaybhaskar (2014). They document the more recent forms of civic activity in Bangalore, both in the slums and middle class neighborhoods, but they concede that in the end, the electoral triumphs over the civic.

22
The Janaagraha- Brown India Initiative Citizenship Index Report 2014
the CI. On its own, the engagement measure is useful, but as we report below, the fact that elites have largely opted out of using state services distorts the usefulness of the measure as an indicator of effective citizenship.
Table 20 provides the summary statistics on CI. The index can take on values in a 0-1 range. The mean is 0.32 indicat-ing the citizenship of a typical respondent in Bangalore, and Figure 1 suggests that the distribution does not have large outliers.
To get a substantive sense of what this means, recall that this index is based on 12 questions that focus on knowledge about national, state, and local political actors, institutions and state service provision agencies, and 9 questions on voting, political and civic participation, with each set ques-tions being equally weighted, as is each component. As such, a perfect score would require answering all questions positively. Our mean score means that a respondent typi-cally answered correctly about 3-4 of the knowledge ques-tions, and tends to participate in about 3 political and/or civic activities, without exceeding 7-8 of these together. For example, a respondent with mean citizenship tends to vote in two (and sometimes three) elections, participates in one political or civic activity, and has some knowledge about po-litical actors (typically national and state political actors) and state agencies (about 2-3 key ones such as water, electricity, and transportation). Participation, in the form of attending meetings and rallies organized by political parties during or between elections, is typically low. While civic participation in specific caste, religious, or voluntary associations is also low, respondents occasionally participate in neighbourhood meet-ings that address service problems.
TABLE 20: Citizenship Index Summary Statis-tics
Mean Standard Deviation Min-MaxCitizenship
Index 0.324 0.16 0-1
Figure 1: Citizenship Index
We turn next to the CI’s distribution across each of our control variables: education, caste, religion, and household type. These are reported in tables 21-24 below as cross tabs. We then take a more disaggregated look, examining the components of the CI – knowledge, participation and, where relevant, quality of engagement. In order to tease out the relationships between the citizenship index and the control variables, we recode the CI (a continuous measure) into a discrete binary variable. Respondents who score above the mean CI value are coded as having ‘high’ citizenship and those with CI values equal to or less than the mean are cod-ed as having ‘low’ citizenship. While we use the continuous measure of CI in all the models presented later, this recode enables us to isolate patterns across the control variables (which are discrete and nominal) clearly and intuitively.27
27 Based on this classification, we find that about 47 percent of the respondents fall below the mean CI level and 53% above.

23
The Janaagraha- Brown India Initiative Citizenship Index Report 2014
Beginning with Table 21 and carrying through Table 27, all cross-tabs we report are statistically significant.28 Table 21 reveals, as one might expect, that there is a very clear and linear relationship between citizenship and education. The lower one’s educational level the lower the level of citizen-ship. Those with no schooling are most likely to have low citizenship. Those with secondary schooling and college are much more likely to fall into the high categories of citizen-ship.
Caste appears to have some effect on citizenship, with the SCs having lower citizenship than the FCs (Table 22). The same is true for religion (Table 23). Muslims are slightly more likely to have lower citizenship, and Christians are slightly likely to have higher citizenship, but the differences across the three religious groups are not pronounced.
Household type, which is our selected proxy for class, has a very strong impact on the distribution of citizenship (Table 24). The majority of those living in HT1 (shacks) have low levels of citizenship and only about 15% score high levels of citizenship. Those living in designated slums also score much lower levels of citizenship than the middle classes (HT3 and HT4) with only 31% having high citizenship. But the over-all relationship between class and citizenship is not perfectly linear. Thus, those living in the highest category of housing – the upper class – in fact display lower levels of citizenship than the middle class (HT4) and are really only marginally higher than the lower middle. In sum, the bottom of the class hierarchy has lower than average citizenship, the middle has high citizenship, and the citizenship of the upper classes tapers off somewhat.
Tables 25, 26 and 27 explore the distribution of citizenship across gender, location and migrant status. Though all three of these categories impact the distribution of citizenship in the direction one might have anticipated, the gap between women and men, and between migrants and non-migrants – roughly 16% in both cases- is especially high.
TABLE 21: Cross-Tabulation of Citizenship Index and Education Level
Education Level (Respondent)
Citizen-ship No Schooling Primary
SchoolMiddle School
Secondary School
College & Above
Low 71.40 62.41 59.77 43.64 36.69High 28.60 37.59 40.23 56.36 63.31
TABLE 22: Cross-Tabulation of Citizenship Index and Caste
CasteCitizenship SC/ST OBC Forward
Low 52.57 48.24 42.84High 47.43 51.76 57.16
TABLE 23: Cross-Tabulation of Citizenship Index and Religion
ReligionCitizenship Hindu Muslim Christian/Others
Low 46.83 51.43 43.92High 53.17 48.57 56.08
TABLE 24: Cross-Tabulation of Citizenship Index and Household Type
Household TypeCitizen-
shipInformal
SlumNotified
SlumLower Middle Middle Upper
ClassLow 84.72 68.40 48.26 36.28 45.36High 15.28 31.60 51.74 63.72 54.64
28 We have looked at the Pearson chi-square test statistic (Pearson 2) and statistical sig-nificance for the cross tabulations of CI and the control variables. Statistical significance sug-gests that the differences in CI observed across levels or categories of the control variables are meaningful and not due to chance. However, we also note that these tests are bivariate tests and statistical significance may disappear in a multivariate statistical environment. In later sections we present the results from a statistical estimation using OLS regression models.

24
The Janaagraha- Brown India Initiative Citizenship Index Report 2014
TABLE 25: Cross-Tabulation of Citizenship Index and Gender
GenderCitizenship Female Male
Low 54.46 38.70High 45.54 61.30
TABLE 26: Cross-Tabulation of Citizenship Index and Location
Ward LocationCitizenship Inner Outer
Low 46.24 52.09
High 53.76 47.91
TABLE 27: Cross-Tabulation of Citizenship Index and Migrant Status
Migrant
Citizenship Migrant Non-Migrant (always lived in Bangalore)
Low 56.01 40.90
High 43.99 59.10
The CI is a highly aggregated measure. To make more sense of the general relationships we have found between citizen-ship and our control variables, we now take a closer look at the components of the CI, knowledge and participation. We also report results from the engagement measure. As with the CI measure, we converted knowledge and participa-tion components (both continuous measures) into binary discrete measures with the mean value marking low and high levels.29 What we find is that knowledge and participa-tion are unevenly distributed across social categories, but move in opposite directions. Higher social groups have more knowledge, but participate less than the lower social groups. The relationship between patterns of engagement and social categories does not reveal a distinct trend across social categories.
Knowledge
The relationship between the knowledge component of CI and our social-economic categories are represented in Tables 28-34. As expected, there is an extremely pronounced and linear association between education and knowledge (Table 28). Higher levels of education are associated with greater knowledge of political and civic affairs. There is also an association between knowledge and caste. The FCs score higher than the OBCs and SC/STs and the SC/STs score below the OBCs (Table 29). Muslims also clearly have lower levels of knowledge than Christians and Hindus, though the difference between Hindus and Christians/Others is not significant (Table 30).
Housing type is a very strong predictor of knowledge (Table 31). The vast majority of those living in shacks and slums have low knowledge (93% and 82%) whereas a majority of the middle and upper classes have high knowledge (level 4 and 5).
We also find that women have significantly lower knowledge then men, though the gap is not as pronounced as between upper and lower classes. The location of wards does not have a strong impact, with outer wards only slightly less knowledgeable than inner wards. The gap between migrants and non-migrants is somewhat surprisingly not very large. One would have expected that time in the city would impact knowledge, but this effect is no doubt countered by the fact that many migrants to Bangalore are in fact highly educated (Tables 32-34).
TABLE 28: Cross-Tabulation of Knowledge Index and Education Level
Education Level (Respondent)
Knowledge No Schooling Primary School
Middle School
Sec-ondary School
College & Above
Low 82.71 76.69 73.73 54.55 38.00
High 17.29 23.31 26.27 45.45 62.00
29 We find that about 56% and 44% of respondents fall into the low-high knowledge cat-egory respectively; and 33% and 67% in the low-high participation categories respectively.

25
The Janaagraha- Brown India Initiative Citizenship Index Report 2014
TABLE 29: Cross-Tabulation of Knowledge Index and Caste
CasteKnowledge SC/ST OBC FC/Others
Low 65.15 57.23 46.80
High 34.85 42.77 53.20
TABLE 30: Cross-Tabulation of Knowledge Index and Religion
ReligionKnowledge Hindu Muslim Christian/Others
Low 54.21 63.13 55.25
High 45.79 36.87 44.75
TABLE 31: Cross-Tabulation of Knowledge Index and Household Type
Household Type
Knowledge Informal Slum
Notified Slum
Lower Middle Middle
Upper Class/Stand Alone
Low 93.06 81.82 58.33 41.20 46.45
High 6.94 18.18 41.67 58.80 53.55
TABLE 32: Cross-Tabulation of Knowledge Index and Gender
GenderKnowledge Female Male
Low 64.38 45.31
High 35.62 54.69
TABLE 33: Cross-Tabulation of Knowledge Index and Location
Ward LocationKnowledge Inner Outer
Low 55.18 58.82
High 44.82 41.18
TABLE 34: Cross-Tabulation of Knowledge Index and Migrant Status
Migrant
Knowledge Migrant Non-Migrant (always lived in Bangalore)
Low 59.49 53.22
High 40.51 46.78
Participation
We now turn to the participation component of the CI. This measures the degree of active involvement in politics and civic life. As reported earlier, overall, Bangaloreans don’t participate much beyond elections. In the cross tabs (Tables 35-41) we present the recorded levels of participation of the entire sample across high and low levels and show these against our socio-economic variables.
Some interesting patterns emerge. First, level of education has a negative impact on participation (Table 35). Those with no schooling and only primary schooling demonstrate higher levels of participation than those with higher levels of educa-tion. Those with college degrees or higher are the most likely to not participate. Similarly, the SC/STs have higher partici-pation scores than the OBCs and FCs (Table 36) and the Mus-lims are slightly more likely to participate than the Hindus and Christians and others (Table 37). Finally, there is clearly a relationship between class (HT) and participation. Table 38 shows that the lower-middle class and notified slum dwell-ers participate the most and shack dwellers participate the least. The upper class is somewhat of an anomaly, display-ing a fickle relationship to participation. Only those living in shacks – whose status in the city is by definition highly tenuous – participate less than the upper class. It is also very notable that while the knowledge gap between men and women is highly pronounced, women participate just

26
The Janaagraha- Brown India Initiative Citizenship Index Report 2014
as much as men (Table 39). Ward location does not appear to have much of an impact on participation (Table 40), but somewhat predictably non-migrants participate much more than migrants (Table 41).
In reviewing the effect that knowledge and participation have on citizenship it is quite clear that as much as knowledge is unequally distributed across most social categories, but especially across class, caste, and gender, participation has an equalizing effect. For instance, only 35% of the SC/STs indicate high knowledge in our sample, but 72% exhibit high levels of participation. The numbers are very similar for Muslims as well: only 36% have high knowledge, but participation among them is very high, about 71%. Finally, while only 18% of desig-nated slum dwellers exhibit high knowledge, 68% participate in political and civic life. Indeed, the greater propensity of the poor and the relatively marginalized social groups to partici-pate in both political and civic life goes a long way in closing the citizenship gap.
TABLE 35: Cross-Tabulation of Participation Index and Education Level
Education Level
Participation No Schooling Primary School
Middle School
Secondary School
College &
Above
Low 24.17 19.55 28.08 29.24 43.42
High 75.83 80.45 71.92 70.76 56.58
TABLE 36: Cross-Tabulation of Participation Index and Caste
CasteParticipation SC/ST OBC Forward
Low 28.38 35.16 36.00
High 71.62 64.84 64.00
TABLE 37: Cross-Tabulation of Participation Index and Religion
Religion
Participation Hindu Muslim Christian/Others
Low 33.79 28.71 30.11
High 66.21 71.29 69.89
TABLE 38: Cross-Tabulation of Participation Index and Household Type
Household Type
Participation Informal Slum
Notified Slum
Lower Middle Middle
Upper Class/Stand Alone
Low 58.33 31.82 29.7 34.81 45.36
High 41.67 68.18 70.3 65.19 54.64
TABLE 39: Cross-Tabulation of Participation Index and Gender
GenderParticipation Female Male
Low 33.25 31.97
High 66.75 68.03
TABLE 40: Cross-Tabulation of Participation Index and Location
LocationParticipation Inner Outer
Low 31.97 35.27
High 68.03 64.73
TABLE 41: Cross-Tabulation of Participation Index and Migrant Status
Migrant
Participation Migrant Non-Migrant (always lived in Bangalore)
Low 45.62 22.70
High 54.38 77.30
Finally, we turn to our third dimension of citizenship - en-gagement. This component is based on citizens’ experi-ences of engaging with public and private providers of basic services. This measure includes nine agencies a respondent can potentially engage with (water, electricity, BPL/Ration card, Ration Shop, Caste card, Regional Transport office for driver’s license, police, hospitals, and schools). We recorded responses that included engagements with private provid-ers, essentially schools and hospitals. Even though these
27
The Janaagraha- Brown India Initiative Citizenship Index Report 2014
are not examples of engagement with the state, we include them for two reasons. First, we did not want to confuse a substitution with a failure of the state. That is, where private institutions are available they may be used for reasons that have nothing to do with the state (e.g. sending children to a parochial school). Second, even private schools and hospi-tals are highly regulated by the state and often staffed by professionals trained in state institutions. As such, they do to some extent reflect the quality of state intervention. However, we do recognize that there is a difference between private and public institutions, so we present our findings with and without private institutions.
In terms of our larger findings, we do not present all the standard cross tabs here because most did not produce sta-tistically significant findings. Thus, across education levels, caste and religion, we found that the nature of engagement, going from no engagement, to poor quality engagement (meaning an intermediary had to be used or a bribe had to be paid) to high quality engagement (a direct engagement) there is no statistically significant variation. Though the quality of engagement varies widely with our sample, it does not vary significantly across our social categories, with three notable exceptions. First, class (as measured by housing type) seems to have a large impact. As table 42 shows, those living in informal settlements are approximately three times more likely to not have had any engagement with the state. This is not surprising, but it is notable that across all other classes the level of “no engagement” is consistently the same (be-tween 3-5%). In contrast, and somewhat counter-intuitively, the level of “poor engagement” – that is those who had to use an intermediary or pay a bribe in their interaction with the state actually increases quite dramatically going from shacks to the upper class (21% to 38%). Indeed, the upper class has both the highest level of “poor engagement” and the lowest level of “good engagement”. Since it is highly un-likely that the state discriminates against the upper classes, the only plausible explanation is that the upper classes are more likely to choose use of an intermediary or to pay a bribe to get things done. The upper classes are much more likely to cir-cumvent official channels and procedures when engaging the state. This is not because they have less citizenship (that is the ability to use their rights) but because they can use their superior resources and networks to get things done. In other words, they don’t need their rights as much as other classes. We believe that this is a robust finding. Our engagement measure however turns out not to be monotonic (e.g. more
engagement means more citizenship). As such, and for the statistical reasons explained earlier, we are not able to include it in the CI.
The second interesting finding (Table 43) is that women generally have a better experience engaging the state than men do. Again, because it is nonsensical that men would be discriminated against, it follows, as with upper classes, that men are more likely to resort to an intermediary or to a bribe, reflecting undoubtedly the fact that they have more con-nections and more opportunities to “work the system” than women do.
The third finding (Table 44) is that outer wards have a less positive experience engaging the state than inner wards do. This no doubt reflects the fact that state institutions and practices are less will established in newly settled areas.

28
The Janaagraha- Brown India Initiative Citizenship Index Report 2014
TABLE 42: Cross-Tabulation of Quality of Engagement and Household Type (Includes all Services, Public and Private)
Household Type
Engagement Informal Slum
Notified Slum
Lower Middle Middle
Upper Class/Stand Alone
No Engage-ment 13.89 3.90 3.39 5.08 4.92
Poor Quality Engagement 20.83 32.25 30.35 29.16 38.25
Good Quality Engagement 65.28 63.85 66.26 65.77 56.83
TABLE 43: Cross-Tabulation of Quality of En-gagement and Gender (Includes all Services, Public and Private)
GenderEngagement Female Male
No Engagement 4.00 4.47
Poor Quality Engagement 26.17 35.61
Good Quality Engagement 69.83 59.92
TABLE 44: Cross-Tabulation of Quality of En-gagement and Location (Includes all Services, Public and Private)
Ward LocationInner Outer
No Engagement 4.15 4.41
Poor Quality Engagement 28.75 36.54
Good Quality Engagement 67.10 59.05
If we take these results from our engagement measure as a whole, an important finding about the local state emerges. In contrast to what we had anticipated, there seems to be no evidence that the state, in its day-to-day interactions with citizens, actively discriminates against any particular social group. Specifically, the incidence of state engagement and the quality of that engagement does not vary significantly across social classes. To the extent that effective citizenship is unevenly distributed, this has more to do with knowledge and participation, than with the institutional context. Having
said this, as we shall see when we examine the Basic Ser-vices Index (BSDII), the extent to which the state does provide for all its citizens does vary substantially across social categories. Also, as Tables 42-44 show, when we disaggre-gate our engagement findings, we do find some interesting variation on who actually engages the state.
Table 45 reports engagement with state agencies – includ-ing all services and only public schools and public health facilities - across different classes. Again, the differences across class are not dramatic. But what is striking here is that about a third of all engagements with these institutions were of poor quality and required an intermediary or a bribe and that in the case of the upper class, of those who did engage, almost as many report poor quality engagement as good quality engagement
TABLE 45: Cross-Tabulation of Quality of Engagement (includes all services and only public schools and public hospitals) and Household Type
Household Type
Engagement Informal Slum
Notified Slum
Lower Middle Middle Upper
ClassNo Engage-
ment 23.61 13.85 16.71 24.32 18.03
Poor Quality Engagement 20.83 32.03 30.07 28.99 38.25
Good Quality Engagement 55.56 54.11 53.23 46.68 43.72
When we limit our engagement measure to services and exclude all educational and health facilities (public and pri-vate), we also get some interesting findings. When it comes to having to deal with the state on matters of basic services (electricity, water, ration/BPL card, caste card, and driver’s li-cense), about one fourth of all households have not engaged the state at all. Given that as we shall see in the next sec-tion services delivery is plagued with problems, it is striking that over the past two years for water and power, and over the past decade for cards, so many households have not engaged with the state. The figure for informal settlements is a stunning 50% (see Table 46).

29
The Janaagraha- Brown India Initiative Citizenship Index Report 2014
TABLE 46: Cross-Tabulation of Quality of Engagement (without schools and hospitals) and Household Type
Household Type
Engagement Informal Slum
Notified Slum
Lower Middle Middle
Upper Class/Stand Alone
No Engage-ment 50.00 26.19 21.95 26.78 18.58
Poor Quality Engagement 13.89 28.35 27.94 27.44 37.16
Good Quality Engagement 36.11 45.45 50.12 45.78 44.26
Drawing on our engagement measure, a final finding is worth reporting. When we asked respondents about engaging with schools or health facilities, we asked if they were public or private institutions. In Table 47 we report which classes use private, public or a mix of both. The differences across class are striking. 42% and 37% of households in informal settlements and designated slums rely exclusively on public education and health institutions, whereas only 4% of house-holds in the upper class reported using public institutions. The figure for the lower middle class and middle class is also very low (14% and 7% respectively). Caste also matters, with the SCs relying much more than the FCs on public institu-tions (Table 48), but the difference is not as strong as with class. Religion makes little difference (Table 49). There is, in other words, a very sharp class divide when it comes to how health and education are accessed, and it is quite clear that in Bangalore the middle class has all but abandoned public education and health.
TABLE 47: Private-Public Ratio (Schools & Hospitals) and Class
Household Type
Private-Public Informal Slum
Notified Slum
Lower Middle Middle Upper
ClassNot Used
Service 18.06 10.17 13.33 11.31 14.75
Both Services PUBLIC 41.67 36.58 13.66 6.72 4.37
One Pub-lic-One Private 15.28 16.02 8.5 3.2 0
Both Services PRIVATE 25 37.23 64.51 78.77 80.87
TABLE 48: Private-Public Ratio (Schools & Hospitals) and Caste
CastePrivate-Public SC/ST OBC Forward
Not Used Service 10.2 13.28 13.55
Both Services PUBLIC 23.29 14.45 8.82
One Public-One Private 12.97 7.62 3.84
Both Services PRIVATE 53.54 64.65 73.79
TABLE 49: Private-Public Ratio (schools & hospitals) and religion
Religion
Private-Public Hindu Muslim Christian/Others
Not Used Service 12.71 10.61 14.64
Both Services PUBLIC 13.99 15.92 13.26
One Public-One Private 7.11 9.80 6.35
Both Services PRI-VATE 66.19 63.67 65.75
Having examined the relationship of citizenship compo-nents - knowledge, and participation, as well as the quality of engagement - against all our socio-economic controls, we can now summarize our findings. This is done in the form of bivariate correlation coefficients and the summary is presented in Table 50. A positive sign indicates a positive association between the two variables i.e. higher levels of education, for example, are associated with higher levels of citizenship. Similarly, a negative sign indicates a negative relationship between the two variables: higher levels of class are, for instance, associated with lower levels of participa-tion. A cell with ‘no effect’ indicates that the correlation between the two variables is not statistically different from zero and hence no relationship exists between the two vari-ables.

30
The Janaagraha- Brown India Initiative Citizenship Index Report 2014
TABLE 50: Relationship between Citizenship, its components, Quality of Engagement, and Socio-Demographic Variables
Citizenship(Knowledge & Participation)
Knowledge Participa-tion
Quality of Engage-
mentCasteSC/STOBCForward
-no effect
+
-no effect
+
+no effect
-
no effectno effectno effect
ReligionMuslim - - + no effect
EducationIlliteratePrimaryMiddleHigher SecondaryCollege & Above
-+++
+
---+
+
++++
-
no effectno effectno effectno effect
no effect
Housing TypeType 1Type 2Type 3Type 4Type 5
---++
---++
-++--
no effect++-no effect
GenderFemale - - - +
Location
Outer Ward - - + -
Non-Migrant (Always lived in Bangalore)
+ + + no effect
In summary, the density of citizenship increases with class and with education, though it tapers off for the upper classes. This tapering off is explained by the fact that the up-per classes do not participate as much. We also found that the SC/STs tend to exhibit higher levels of participation in political and civic life but lower levels of knowledge. Mus-lims similarly have lower overall citizenship scores, but they combine low levels of knowledge with high levels of partici-pation. Thus, for a number of variables, the knowledge and participation components work in opposite directions, and this effect is more pronounced for the poor, and the Muslims.
More education tends to enhance knowledge but depresses participation. Similarly, higher classes exhibit higher knowl-edge but participate much less. We also saw that participa-tion rates are particularly high amongst the middle class. As we noted earlier, quality of engagement does not exhibit a systematic relationship with many of the socio-economic factors excepting some class levels, gender, and location.
The Basic Service Delivery and Infrastructure Index (BSDII)
We now turn to our dependent variable, the BSDI Index. The BSDII is built on measures of quality of four services: water, sanitation, electricity and roads. In this section we provide the overall distributions of BSDII across our socio-economic factors (Tables 51-56). An ordinal scale measure from 1 to 6 for BSDI index is used for the cross tabs and a continuous measure is used in the regression models presented in later sections. The ordinal measure of BSDII ranges from 1 (Low BSDI) to 6 (High BSDI) and the continuous measure from 0 to 1.30 A perfect BSDII score would translate to having quality and convenient water with no interruptions, electricity with very infrequent interruptions, excellent roads and drain-age, and good sanitation, specifically in-house flush toilets that are connected to sewage systems. The average of the continuous measure falls in level 4. Here a household could expect to have a public source of water that is located inside the premises (a tap or hand-pump) with gaps in provision. Water is typically used for a single purpose (either gen-eral use or drinking, mostly the former), and some of these households are likely to have water storage. Level 4 house-holds are also characterized by power outages between 4 to 6 hours a week, have flush toilets inside the house (as opposed to a community toilet or pit toilet), and located in areas with roads that tend to be pucca, in good condition, but with poor drainage during monsoon.
Levels 1 and 2 households are characterized by very low levels of basic service delivery and infrastructure. In such households, the water source is typically located outside the household premises and is shared. There are gaps in the provision of water, and such households seldom have capac-ity to store water, In addition, the supplied water is not fit for both drinking and general purposes. These households either do not have power or experience long power outages some-times more than 39 hours a week. Toilets are open shared pits, and roads tend to be kuchha (unpaved), in poor condi-
30 The mean is 0.648 with a standard deviation of 0.189. The levels of BSDII are coded as follows: Level 1 represents the range from 0 to less than 0.2; level 2 ranges from 0.2 to less than 0.4; level 3 from 0.4 to less than 0.6; level 4 from 0.6 to less than 0.8; level 5 from 0.8 to less than 0.99; and level 6 is the case where BSDII is equal to 1.

31
The Janaagraha- Brown India Initiative Citizenship Index Report 2014
tion with poor drainage during monsoon. Level 3 households represent an improvement over levels 1 and 2, and are served by a public water source likely inside the household premises. These households also experience gaps in water provision, do not have water storage facilities, and are unable to use the water for multiple purposes. They face power out-ages of up to 13 hours a week, share toilets, and are located in areas where roads are pucca but in poor conditions. Drains are not effective during monsoon and water logging on roads is prevalent.
In contrast, a BSDII of 5 indicates relatively high levels of ser-vice provision and infrastructure. These households receive water from public sources, have taps inside the household premises, experience limited water supply interruptions, and have water storage facilities. Similarly, power outages are minimal (between 2 and 4 hours a week or less). Most such households have a toilet with flush and are located in neigh-bourhoods with pucca roads in relatively good condition, and improved drainage.
As the frequency distribution in figure 2 and Table 51 shows, the BSDII score varies significantly across our sample. At the low end (levels 1 and 2) 11 % of our sample is at level 1 or 2, that is, it receives very poor services. If we combine this with level 3, then we can conclude that more than a third of Bangalore (approximately 37%) receives very poor (level 1 and 2) to poor (level 3) services.
At the very high end (level 6), there are very few households, less than 1 percent, that enjoy high quality in all services. The bulk of our sample, about 62%, clusters into the 3 and 4 levels of service delivery and infrastructure, and about 27% receive high quality services (level 5 and 6).
Table 51: Distribution of Basic Service Delivery and Infrastructure
Frequency Percent1: Low 65 1.61
2 360 8.91
3 1070 26.48
4 1454 35.98
5 1069 26.45
6: High 23 0.57
Figure 2: Distribution of Basic Service Delivery and Infrastructure Index
What might explain this very unequal distribution of servic-es? Table 52 shows a strong and linear relationship between education and access to quality of services. This no doubt reflects the tight relationship between education and class. Table 53 confirms what one might have predicted, namely that the SCs receive much lower services than the FCs, and that the FCs are better off than the OBCs. The fact that 53.1% of the SC/STs get low levels of service (1-3) compared to 33.3% of the OBSC, confirms our earlier findings about SCs and ghettoes.
In contrast, religion does not seem to have any relationship to services (Table 54). Muslims are as well serviced as any other religion, despite the fact that as we saw earlier, they are twice as likely to live in the lower housing types. We can only speculate here, but this would seem to suggest that though many Muslims are clustered into some of the poorer neighbourhoods (HT 2.5), these are quite possibly older neighbourhoods that over time have been able to secure better services. In this respect these are more akin to ethnic enclaves than ghettoes.
When we look at BSDII scores across housing types, we get our strongest finding yet. The relationship here is very linear (Table 55). It is remarkable, but not surprising, that there are no upper class households receiving poor services (level 1 and 2), but that the scores for the majority of shack and slum dwellers fall into the three lower categories of delivery. Two other observations are worth making. First, the quality of service delivery in notified slums is highly varied with as many falling into level 2 (24%) as level 4 (25%). Second, as we have seen before, the middle category is also very lumpy. But with 53% of our households living in HT3, it is important to note that 30% of this category has level 3 service.

32
The Janaagraha- Brown India Initiative Citizenship Index Report 2014
TABLE 52: Cross-Tabulation of Basic Services-Infrastructure Index and Education Level
Education Level
Basi
c Ser
vice
s/
Infra
stru
ctur
e
No
Scho
olin
g
Prim
ary
Scho
ol
Mid
dle
Scho
ol
Seco
ndar
y Sc
hool
Colle
ge &
Abo
ve1: Low 9.3 2.27 1.84 0.63 0.00
2 13.6 16.7 13.4 8.9 4.3
3 34.2 34.1 34.2 26.8 19.0
4 27.6 31.8 33.3 38.4 37.5
5 15.1 15.2 17.1 25.0 37.7
6: High 0.0 0.0 0.2 0.3 1.4N=4037, Pearson χ2 = 456.0511 (Pr=0.000)
TABLE 53: Cross-Tabulation of Basic Services-Infrastructure Index and Caste
CasteBasic Services/ Infrastructure SC/ST OBC Forward
1: Low 4.4 1.4 0.58
2 14.5 6.5 5.4
3 34.2 25.4 22.6
4 31.0 38.3 37.4
5 16.0 28.0 33.2
6: High 0.0 0.4 0.8N=2871, Pearson χ2 = 199.7148 (Pr=0.000)
TABLE 54: Cross-Tabulation of Basic Services-Infrastructure Index and Religion
ReligionBasic Services/ Infrastructure Hindu Muslim Christian/
Others1: Low 1.80 0.55 2.22
2 8.19 10.71 11.39
3 26.49 27.61 23.89
4 35.7 37.5 35
5 27.3 23.35 25.83
6 0.51 0.27 8.91N=4040, Pearson χ2 = 29.2332 (Pr=0.015)
TABLE 55: Cross-Tabulation of Basic Services-Infrastructure Index and Household Type
Household TypeBasic Ser-
vices/ Infrastruc-
ture
Informal Slum
Notified Slum
Lower Middle
Middle Upper Class/Stand Alone
1: Low 38.2 5.5 0.7 0.0 0.0
2 23.5 24 9.2 3.2 0
3 20.6 37.6 30.5 17.5 13
4 17.7 25.5 37 39 37.3
5 0 7.5 22.5 39.1 46.3
6: High 0 0 0.1 1.7 3.4N=4041, Pearson c2 = 1.2E+03 (Pr=0.000)
TABLE 56: Cross-Tabulation of Basic Services-Infrastructure Index and Household Type (70% threshold)
Basi
c Ser
vice
s/
Infra
stru
ctur
e
Info
rmal
Slu
m
Notif
ied
Slum
2.5
Low
er M
iddl
e
3.5
Mid
dle
Uppe
r Cla
ss/S
tand
Al
one
1: Low
38.2 5.5 0.86 0.4 0.8 0.0 0.0
2 23.5 24.0 15.46 7.34 6.07 3.2 0.0
3 20.6 37.6 33.16 28.6 30.8 17.5 13.0
4 17.7 25.5 36.94 37.5 36.1 39.0 37.3
5 0.0 7.5 13.57 25.9 25.7 39.1 46.3
6: High
0.0 0.0 0.0 0.1 0.36 1.7 3.4
N=4041, Pearson χ2 = 1.2E+03 (Pr=0.000)
We summarize the relationship between all the control vari-ables as well as citizenship variables using bivariate correla-tions in the Table 57. Table 57 confirms our basic findings from the crosstabs. SC/ST households are characterized by lower levels of basic service delivery and infrastructure. Being Muslim, however, does not indicate a relationship with basic service delivery and infrastructure. Household type and education levels in a household have significant effects on basic service delivery and infrastructure. Similarly, as the education level in a household increases, so does the provi-

33
The Janaagraha- Brown India Initiative Citizenship Index Report 2014
sion of basic service delivery and infrastructure.
However, when we run the correlation with our Citizenship Index, we find that citizenship has no effect on basic service delivery and infrastructure. In other words, having and us-ing your rights does not appear to increase the likelihood of getting better services. Citizenship, as we have measured it (based on the components of knowledge and participation), does not appear to impact quality of services. This might lead us to the conclusion that citizenship does not abate class. But as we show in the next section, this finding is subject to a significant qualification.
TABLE 57: Relationship between Caste, Class, Education, Religion, Citizenship and BSDI
Basic Service Delivery and Infrastructure
CasteSC/STForward
-no effect
ReligionMuslim no effect
EducationIlliteratePrimaryMiddleHigher SecondaryCollege & Above
---++
Household Type Type 1 & 2Type 3, 4 & 5
-+
Citizenship no effect[Interaction Effect]
31The results presented here are from unweighted models. We find that the results do not
change when we weight the models to account for the oversampling of the SC/ST popula-tion.
32 Since our independent variables are either nominal (caste, religion) or ordinal (housing
type, level of education) we recode all variables into dummy variables that take on values of 0 and 1. For example, we generate a new variable, Type 1=1 if Housing Type variable =1, and 0 otherwise (i.e. for all other values of Housing Type). We repeat this procedure for all other housing types and generate a set of 5 dummy variables, one for each household type. Note that in all the regression models presented, we keep Type 3 as the reference case (i.e. do not include Type 3 variable in the estimation). This implies that the coefficients on the Type 1, Type 2, Type 4, and Type 5 variables have to be interpreted relative to Type 3. Similarly, the variable SC/ST and Forward are coded as equal to 1 if the respondents identified themselves as either SC/ST or Forward castes respectively. The reference category here is Other Back-ward Castes (OBC). For religion, we include only a Muslim dummy variable that identifies a respondent as Muslim (1) or otherwise (0). All other religions in this variable are coded as 0. The reference case here is non-Muslim. For education we created 5 binary variables each representing the respondent’s level of education. Comparisons are made with those respondents who have had no schooling.
D. Models
In this section we present the relationship between BSDII, CI and our socio-economic variables in multivariate models. The results of a statistical estimation using ordinary least squares are reported in Tables 58 and 59. Table 58 (models 1-4) explains the Basic Service Delivery and Infrastructure Index (BSDIII) as a function of citizenship and other socio-economic and demographic control variables.31 Models 1 and 2 are baseline models (including only the control variables and not the citizenship variable) for Hindus in the sample as well as the entire sample respectively.32
The BSDII is the dependent variable in the second set of models presented in Table 59. The baseline model includes only the control variables, housing type, caste, religion, and education.
The baseline models 1 & 3 in Table 58 confirm what emerged from our crosstabs. This model includes all our socio-economic measures, including households broken down by housing types. All housing types are highly significant, and the signs correspond to the direction of the overall relation-ship. Type 1 and Type 2 exhibit significantly lower levels of basic service delivery and infrastructure relative to Type 3, while Type 4 and Type 5 show higher levels. We also find that basic service delivery and infrastructure for the SCs/STs is highly significant and negative relative to the OBC category, and that education is significant and positive for the second-ary level and above, relative to those without schooling. We don’t observe any statistical differences among respondents below the middle school. In sum, education has a positive effect on access to infrastructure and there is also a clear threshold effect. That is, it only makes a difference once one is educated above the middle school.
We also find that households in the outer areas of Bangalore are characterized by lower levels of basic service provision and infrastructure. However there is no statistical differ-ence between non-migrant (those who have lived their entire lives in Bangalore) and migrant households when it comes to service provision and infrastructure.
In Models 2 & 4 (in Table 58) we introduce CI. The introduc-tion of CI does not change any of the effects of the control variables. The coefficients for the control variables are stable, consistent, and statistically significant. The effect of CI is positive, but not significant at the conventional levels. This implies that citizenship has no effect on the levels of basic services and infrastructure a household receives.

34
The Janaagraha- Brown India Initiative Citizenship Index Report 2014
Dependent Variable: Basic Service Delivery and Infrastructure Index
Independent Variable 1. Baseline Model (Hindus Only)
2. Baseline Model + Citizenship
(Hindus Only)
3. Baseline Model (All Sample)
4. Baseline Model + Citizenship (All Sample)
Household TypeType 1Type 2Type 4Type 5
-0.302 (0.027)***-0.103 (0.012)***0.057 (0.007)***0.071 (0.013)***
-0.294 (0.027)***-0.099 (0.012)***0.057 (0.007)***0.072 (0.013)***
-0.299 (0.026)***-0.121 (0.010)***0.065 (0.006)***0.088 (0.011)***
-0.292 (0.026)***-0.118 (0.010)***0.063 (0.006)***0.089 (0.011)***
CasteSC/ST
Forward-0.048 (0.009)***
0.0006 (0.008)-0.047 (0.009)***
0.0006 (0.008) - -
ReligionMuslim - - 0.001 (0.007) 0.003 (0.007)
Education LevelPrimaryMiddle
Secondary College & Above
0.022 (0.022)0.017 (0.014)
0.058 (0.012)***0.081 (0.012)***
0.021 (0.022)0.016 (0.014)***0.054 (0.012)***0.078 (0.012)***
0.017 (0.018)0.010 (0.011)
0.048 (0.010)***0.079 (0.010)***
0.016 (0.018)0.010 (0.011)
0.046 (0.010)***0.078 (0.010)***
Location (Outer Ward) -0.046 (0.007)*** -0.046 (0.008)*** -0.050 (0.006)*** -0.049 (0.008)***
Non-Migrant 0.004 (0.006) 0.002 (0.006) 0.002 (0.005) 0.002 (0.005)
Citizenship - 0.035 (0.019) - 0.025 (0.017)
Constant 0.614 (0.013)*** 0.605 (0.014)*** 0.609 (0.010)*** 0.602 (0.011)***
ObservationsF
Root MSE
287170.610.164
280463.400.165
404195.610.167
394385.4
0.167
Robust standard errors in parentheses [*** p<0.01, ** p<0.05, * p<0.1]
This general relationship however must be significantly quali-fied when we introduce the second set of models 5 through 8 presented in Table 59. Here we have included a multiplicative interaction term between citizenship and (a) housing type, (b) education level (c) caste and (d) religion. Our claim is that the effect of citizenship is conditional on housing type. That is, instead of having a uniform effect on service delivery and infrastructure levels, the effect of citizenship is expected to vary across class or housing type levels. More specifically, we anticipate citizenship to have larger (positive) effect for poor households relative to the wealthier households.
Similarly, we suggest that citizenship mitigates the effects of lower levels of education, caste, and religion on basic service delivery and infrastructure.
In order to test the interaction effect between citizenship and housing type, we first create a dummy variable for housing that combines Type 1 and 2. That is, the variable House=1 if
housing types are 1 and 2, and equal to 0 (for housing type 3, 4, and 5). This variable is interacted with citizenship and included in the model in order to test for the effect of citizen-ship on basic service delivery and infrastructure conditional on housing type. We do the same for education levels as well. All respondents reporting no education are coded as 1 and others as 0. This variable is interacted with citizenship to test for the effects of citizenship on basic service delivery and infrastructure conditional on education (i.e. illiterate versus others). Similarly, we interact citizenship with the variables representing caste (SC/ST respondents coded as 1 and others as 0) and religion (Muslims respondents coded as 1 and others as 0). The results are presented in Table 59.
TABLE 58: The Effect of Citizenship on Basic Service Delivery and Infrastructure

35
The Janaagraha- Brown India Initiative Citizenship Index Report 2014
TABLE 59: Conditional Effects of Citizenship on Basic Service Delivery and Infrastructure
Dependent Variable: Basic Service Delivery and Infrastructure Index
Independent Variables 5. (Hindus Only) 6. (All Sample) 7. (Hindus Only) 8. (All Sample)
Citizenship 0.028 (0.019) 0.015 (0.021) 0.049 (0.021)* 0.036 (0.019)
House -0.212 (0.023)*** -0.218 (0.019)*** -0.223 (0.024)*** -0.228 (0.020)
Citizenship* House 0.291 (0.081)*** 0.244 (0.066)*** 0.272 (0.082)*** 0.200 (0.067)***CasteSC/ST
Forward-0.057 (0.009)***
0.003 (0.008)--
-0.044 (0.018)**-
--
Citizenship*(SC/ST) - - -0.083 (0.050) -ReligionMuslim - -0.0006 (0.007) - -0.008 (0.017)
Citizenship *Muslim - - - -0.025 (0.045)Education Level
PrimaryMiddle
SecondaryCollege & Above
0.031 (0.023)0.028 (0.014)
0.065 (0.012)***0.105 (0.012)***
0.022 (0.019)0.017 (0.011)
0.056 (0.010)***0.109 (0.010)***
----
Non-Literate - - -0.129 (0.025)*** -0.092 (0.021)***
Citizenship*(Non-Literate) - - 0.233 (0.079)*** 0.128 (0.067)**Location (Outer Ward) -0.057 (0.007)*** -0.061 (0.006)*** -0.057 (0.007) -0.059 (0.006)***
Constant 0.621 (0.014)*** 0.617 (0.011)*** 0.696 (0.008)*** 0.682 (0.007)***
ObservationsF
Root MSE
280463.340.167
394385.650.171
280470.370.169
394375.580.173
Robust standard errors in parentheses [*** p<0.01, ** p<0.05, * p<0.1] + p<0.1 One tailed
All models in Table 59 show that citizenship conditional on the lowest housing types has a significant effect on service delivery and infrastructure. That is, an increase in citizenship for respondents living in the lowest housing types increases the level of basic service and infrastructure for those house-holds. For instance, the same unit increase in citizenship re-sults in a 0.33 unit increase in infrastructure for the poor and not for wealthier households. The poor have less of citizenship and less of public service delivery and infrastructure, but they get more services and infrastructure for their citizenship than others. The marginal return to citizenship is higher for the poor.
Models 6, 7 & 8 in Model D2 also include an interaction effect between citizenship and (a) illiterate, (b) SC/ST and (3) Mus-lim households. We test whether citizenship mitigates the effect of illiteracy, caste, and religion on the provision of basic services and infrastructure.
We find, similar to the interactive effect of citizenship and
class, a unit increase in citizenship increases the basic service and infrastructure for the illiterate households, but not for those with higher levels of education. The magnitude of this effect is approximately 0.28 units. However, we find that a conditional effect does not exist for SC/ST or Muslim households. While citizenship mitigates the effect of class and illiteracy, it does not seem to do the same for caste, particularly SC/ST or for religion.

36
The Janaagraha- Brown India Initiative Citizenship Index Report 2014
neigbourhoods, but do not on average receive lower levels of services than Hindus. This suggests that many Muslims live in ethnic enclaves.
Taken together, our finding of highly uneven patterns of service delivery and clear evidence of social exclusion might suggest that citizenship doesn’t make a difference, or worse yet, that levels of citizenship reflect and reinforce social inequality. But in fact, we find that citizenship does make a difference, but this itself is a complicated story.
Because citizenship is relational, it is by definition hard to measure. We identified and measured three separate components: knowledge, participation and engagement. We found that knowledge and participation could be combined into a single index and using this index we have shown that citizenship, as an effective attribute of individuals, is unevenly distributed. Women, Muslims, SCs/STs and lower classes enjoy less effective citizenship than men, Hindus/Christians, OBCs/FCs and middle and upper classes. This is not entirely surprising, and supports arguments in the litera-ture, most notably by Chatterjee (2001), that citizenship in India is largely the preserve of elites. But lurking behind this aggregate finding are some patterns that suggest a more complicated picture.
First, we did not find any evidence that social exclusion is a result of direct discrimination. We asked a battery of direct questions about discrimination both against individuals (have you been discriminated against) and groups (do you think ‘x’ group is discriminated against) and found no clear evidence of discrimination. Such questions are imperfect ways of capturing discrimination, so we also asked about people’s experience of engaging with the state. Here we did find that there are pronounced institutional problems. Thus, many routine engagements with the state, as meas-ured in our “quality of engagement” measure, are based on the use of intermediaries and often require bribes. And the state seems quite hard to find. Despite the fact that most of our respondents experience almost continuous problems with basic service delivery, a surprisingly high number of households simply do not engage with the relevant state agencies. Even clearer is the conspicuous absence of ac-countable democratic institutions at the local level. Few of our respondents know their corporators and even fewer have ever attended a ward meeting. The institutional space for non-electoral participation in public affairs is very limited.
E. Discussion and Conclusions
The promise of cities is, among other things, the promise of citizenship whether or not it is fully realized. Historically, cit-ies have been associated with greater associational freedom and more social and economic opportunity. In India, con-stitutional guarantees and political practices have secured basic political and civic rights. But social rights have only recently been made constitutional rights, and this does not include the basic services that most urban residents expect. This then leads to two important questions. First, can all citi-zens, irrespective of their socio-economic status, use these civic and political rights effectively? Second, to what extent can citizens secure basic services as a matter of rights? Can citizenship, as Marshall so famously argued, abate the ef-fects of class and, more broadly, social exclusion?
We addressed these two core questions on the strength of a survey of over 4,000 households - the largest and most detailed survey of its kind ever undertaken in urban India. On the whole, the answer to both questions would appear to be no. On the one hand we found that citizenship is very unevenly distributed, and that this distribution closely tracks class, caste, religion and gender. On the other hand, we found that basic services and infrastructure are highly unevenly distributed and that class, though not caste and religion, drive much of this effect. Given that Bangalore has not only been the poster child of India’s recent economic success - indeed a global icon of the information technology revolution – and it has also generally been perceived as In-dia’s best governed mega-city, it is alarming that such larger swaths of the city are deprived of adequate services.
We also found that this social exclusion has a clear spatial dimension. Informal settlements, slums and lower middle class neighbourhoods that have a significant presence of slums, are all poorly serviced. This should not come as a sur-prise to any scholar of urban India but our survey does pro-vide clear empirical and statistically reliable confirmation of this basic observation. Using our expansive data on housing types, we also found that roughly half of SCs/STs live in what might be described as ghettoes, that is, neighbourhoods that have high concentration of either group and that are poorly serviced. In proportional terms, the SCs/STs are four times as likely as the OBCs or FCs to live in these neighbour-hoods. Muslims are twice as likely as Hindus to live in these

37
The Janaagraha- Brown India Initiative Citizenship Index Report 2014
But here again, while we found obvious problems of insti-tutional and democratic weakness, we found no evidence of discrimination. Problems of engagement are problems that cut across all socio-economic groups.
Second, when we disaggregate our measures of citizenship a more nuanced picture emerges. A detailed analysis of our knowledge and participation components reveals that they work in opposite directions. Socio-economic difference, including gender, drives significant differences in knowledge. The more privileged one is, the more one knows about the system and presumably how to use it. Participation works in quite the opposite direction, with the poor, women, SCs/STs and Muslims participating much more than the rich (who in fact participate very little), men, OBCs/FCs and Christians and Muslims. Participation is the lifeblood of citizenship for the poor. This supports an existing body of literature that has found that the poor and lower castes are far more active electorally than the rich and upper castes.33
Third, while the urban poor exercise less citizenship than the middle class, the poor get more out of their exercise of citizenship than the middle class, and specifically that if it were not for the citizenship they do have, they would have less access to basic services and infrastructure. In sum, the poor suffer from citizenship deficits as well as public service and infrastructure deficits, but these latter deficits would be greater without the poor exercising their citizenship rights. While citizenship has not closed the gap between the classes, it does make a significant difference for the poor. Citizen-ship abates class in Bangalore.
33 Yadav and Palshikar, 2009.

38
The Janaagraha- Brown India Initiative Citizenship Index Report 2014
References1. Baiocchi, Gianpaolo, Heller, Patrick, and Silva, Marcelo K,
2011, Bootstrapping Democracy: Transforming Local Govern-ance and Civil Society in Brazil, Stanford University Press.
2. Bhan, Gautam, and Arindam Jana, 2013, “Of Slums or Poverty: Notes of Caution from Census 2011”, Economic and Political Weekly, May 4.
3. Brubaker, Rogers, 1998, Citizenship and Nationhood in France and Germany, Harvard University Press.
4. Chatterjee, Partha, 2006, Politics of the Governed, Columbia University Press.
5. Dreze, Jean, and Amartya Sen, 2013, An Uncertain Glory: India’s Contradictions, Allen Lane.
6. Fox, Jonathan. 1994. “The Difficult Transition From Clien-telism to Citizenship.” World Politics 46(2):151-184.
7. Heller, Patrick, 2000, “Degrees of Democracy: Some Com-parative Lessons from India”, World Politics 52(4).
8. Heller, Patrick. 2013. “Democracy, Participatory Politics and Development: Some Comparative Lessons from Brazil, India and South Africa,” Polity, 44, 643-665.
9. Heller, Patrick, and Peter Evans, 2010. “Taking Tilly South: Durable Inequalities, Democratic Contestation and Citizenship in the Southern Metropolis,” Theory and Society, 39.
10. Jayal, Niraja Gopal, 2013, Citizenship and its Discontents: An Indian History, Harvard University Press.
11. Joseph, J. (2014,). Regularizing the Illegal: How does Akrama Sakrama affect you. http://bangalore.citizenmat-ters.in/articles/how-does-akrama-sakrama-affect-you
12. Jodhka, Surinder S. (2010): “Dalits in Business: Self Employed Scheduled Castes in Northwest India”, Economic and Politi-cal Weekly, 45(11).
13. Kamath, Lalitha, and M. Vijaybhaskar, 2014, “Sum-based Collective Action in Bangalore: Contestations and Conver-gences in a Time of Market Reforms”, Journal of South Asian Development, Vol. 9. No. 2, August, 121-146.
14. Marshall, T.H. 1950, Citizenship and Social Class, Pluto Press.
15. Marshall, T.H., 1965. Social Policy, Hutchinson.
16. Marshall, T.H., 1992, Citizenship and Social Class, With a Commentary from Tom Bottomore, Pluto Classics Series, Pluto Press.
17. Mahajan, Gurpreet. 1999. “Civil Society and its Avtars: What Happened to Freedom and Democracy.” Economic and Political Weekly 34:1188-1196.
18. Murthy, N.R. Narayana, Krishnamurthy, Swati Ramana-than and Ramesh Ramanathan, 2012, “The Urban Voter, Not on a Roll”, The Indian Express, August 1.
19. Nandy, Ashis, 1988, “The Politics of Secularism and the Recovery of Religious Tradition”, Alternatives, Vol. 1, pp. 177-194.
20. Perry, Guillermo, 2001, “Prologue to Workshop Proceedings on Poverty and Social Exclusion in Latin America”, in Estan-islao Gacitua, Carlos Sojo, with Shelton H. Davis, eds, Social Exclusion and Poverty Reduction in Latin America and the Caribbean, World Bank Press.
21. Rueschemeyer, Dietrich, Evelyn Huber Stephens, and John D Stephens. 1992. Capitalist development and democ-racy, University of Chicago Press.
22. Schensul, Daniel and Patrick Heller. 2010. “Legacies, Change and Transformation in the Post-Apartheid City: Towards an Urban Sociological Cartography,” International Journal of Urban and Regional Research.
23. Scott, James C, 1976, The Moral Economy of the Peasant: Rebellion and Subsistence in Southeast Asia, New Haven: Yale University Press.
24. Somers, Margaret, 1993, “Citizenship and the Place of the Public Sphere: Law, Community, and Political Culture in the Transition to Democracy”, American Sociological Review, 58 (5).
25. Taylor, Charles, 1994,”The Politics of Recognition”, in Multiculturalism and the Politics of Recognition, Princeton University Press.
26. Thompson, Edward P, 1971, “The Moral Economy of the English Crowd in the Eighteenth Century”, Past and Present, February.

39
The Janaagraha- Brown India Initiative Citizenship Index Report 2014
27. Tilly, Charles. 2004. Social Movements, 1768-2004. Boulder, Colo.: Paradigm Publishers.
28. United Nations, 2012, World Urbanization Prospects: The 2011 Revision, United Nations Secretariat: Department of Social and Economic Affairs.
29. Varshney, Ashutosh, 1995, Democracy, Development and the Countryside: Urban-Rural Struggles in India, Cambridge University Press.
30. Varshney, Ashutosh, 2013, Battles Half Won: India’s Im-probable Democracy, Penguin.
31. Yadav, Yogendra, and Suhas Palshikar, 2009. “Revisiting Third Electoral System : Mapping Electoral Trends in In-dia, 2004-09” in Sandeep Shastri et.al., Electoral Politics in Indian States. Oxford University Press.

40
The Janaagraha- Brown India Initiative Citizenship Index Report 2014
Figure 1b: Sample Ground-truthed Ground-map
Right-hand Rule
The Polling Part is then divided into sections of approximate equal household density and the right-hand rule method is used for household selection to ensure complete coverage of the Polling Part, including pathways, lanes, and lots where informal housing may be located.
Accuracy in terms of household selection was maintained by creating a substitution rule where a household had to be visited at least three times during different days of the week (including one weekend day) and different times of those days to capture the most respondents. Further, data was kept on instances where surveys could not be conducted and the reasons why, allowing for another additional rich data source on recent migrants, language break-up of the city, as well as lack of research access due to the unique phenom-enon of gated communities.
The Survey Instrument
The questions for the survey were created through an intensive process, in which a previous version of the Janaa-graha Citizenship Index survey underwent additions from the Brown Team, which drew upon other relevant surveys in the academic sphere. A meeting at Brown University was then held with external leading researchers to give feedback on the drafted survey questions. The final survey took an aver-age time of 35 minutes to administer.
To ensure that the maximum amounts of selected par-
F. Appendices
Appendix 1: Household Selection
Household selection is broken up into two major processes: ground-mapping and on-field household selection through use of the right hand-rule methodology of sampling. The key in this section is to highlight the significant level of rigour and data that was captured through systematically “ground-truthing” the number of households and their dwelling clas-sifications for every Polling Part that sampling was to occur in. This additional process provided a rich source of data outside of the survey for certain neighbourhood characteris-tics, particularly, homogeneity and heterogeneity of dwelling type (a proxy for class).
Ground-mapping
Maps of the Polling Parts selected through the sampling frame were created using two base layers (Google Maps and Janaagraha GPS Polling Part layers) to incorporate the maxi-mum number of recognizable landmarks (See Figure 1a)
Figure 1a: Sample Ground-map
A field team was then sent to the Polling Parts to gauge location of housing, socio-economic housing type, and ap-proximate household numbers and population numbers to give a robust approximation of population density. Figure 1b is the same Polling Part map as it appears completed by the ground-mapping team.
41
The Janaagraha- Brown India Initiative Citizenship Index Report 2014
ticipants were able to participate in the survey the questionnaire was translated into: Kannada, Hindi, and English. Moreover, it was decided to run the survey on tablets in order to allow for several critical innovations in data collection and hygiene, including the following:
i. Completed survey forms can be sent by tab-let directly to a cloud-based server, allowing for real-time hygiene checks, decreasing error due to improper data entry.
ii. As the survey is lengthy and multiple surveys are conducted in a day in multiple languages, using the paper/pencil method becomes less feasible.
iii. GPS information informing survey location can be automatically generated allowing for increased generation of spatial data and analysis.
iv. More elaborate monitoring and evaluation of surveyors could occur due to unique log-in IDs and ability to trace and contact.
Lastly, in order to ensure the greatest level of participa-tion and comfort of respondents, surveyors were sent in teams of two, a male and a female, who could collec-tively cover all three languages the survey was offered in. Depending on the language needs and the gender preference of the respondent, the most suitable pairing was utilized. Surveyors were also monitored by a team of experienced personnel to ensure professionalism and consistency in implementation. Lastly, surveyors were mandated to keep daily field notes, providing an in-depth view of the ground situation for each survey and neigh-bourhood, including never before systematically collected information such as: record of additional persons who were present during the survey, situations/questions in which the respondent seemed uncomfortable and street-level infrastructure data.

42
The Janaagraha- Brown India Initiative Citizenship Index Report 2014
Appendix 2: Household Type
HT 5 Dwellings: Upper-Class Housing
• Independent house or apartment building
• Rarely has outdoor staircases
• Often constructed using materials in addition to con-crete such as: glass, wood
• If house, multiple rooms, one family or joint family lives there. Generally not multiple independent units of unrelated families within one house. Can assess this by single mailbox on the outside, single address marked doorway entrance.
• Usually has surrounding wall with gate in front of house
• If apartment building will also have wall and gate with security guarding entrance
Example neighbourhoods with high density of category 5 housing: Dollars Colony, Sadashiv Nagar, Lavelle Road near UB City, Jayamahal, Brigade Gateway Apartment etc.
• Often apartment complexes/gated communities. Amen-ities such as a swimming pool, shopping mall, gym, will be inside of complex.
• Size of individual apartments will be large
• Multiple balconies for one apartment
• Large windows

43
The Janaagraha- Brown India Initiative Citizenship Index Report 2014
HT 4 Dwellings: Upper Middle-Class Housing
• Independent house or apartment building
• If independent house and large (more than three BHK) often a shared dwelling between independent family units which can be indicated by multiple mailboxes and different entrances
• There may be a gate but usually no high-wall present around house
• Apartment buildings often have outdoor staircases, may have a gate entrance to building but generally not part of a complex or gated community
• Often mostly concrete but some have additional materi-als such as glass/wood/brick, etc.
• Apartments often have private balconies

44
The Janaagraha- Brown India Initiative Citizenship Index Report 2014
HT 3 Dwellings: Lower Middle-Class Housing
• Apartments and houses are most often made only of concrete
• Windows are often smaller
• Houses are small often two-three rooms with concrete roofs, usually only one level
• Usually no gate around house, electricity meter is usually present as is piped water
• Often in neighbourhoods containing 2s and 1s
• Interspersed with commercial shops/denser neighbour-hoods
• Apartment buildings may often be above small shops, often no gate around apartment building
• May often have shared balconies across units

45
The Janaagraha- Brown India Initiative Citizenship Index Report 2014
HT 2 Dwellings: One room home/Designated slum
• One-room pakka row house
• Corrugated metal roof
• Densely packed
• Often not located on a main street, behind buildings, down gullys
• Often uses community-tap, often no sump storage
• Often in neighbourhoods containing 2s and 1s, and small one room commercial businesses
• Few windows, small windows, often shutters not glass
• One entrance

46
The Janaagraha- Brown India Initiative Citizenship Index Report 2014
HT 1 Dwellings: Self-built Informal Slum Housing
• Self-built dwelling often made from: reclaimed wood, fabric, tarpaulin, corrugated metal, sack-cloth
• Often not located on street-fronts, often located in vacant lots, behind buildings, on sidewalk, road medi-ans, small green spaces, large slums, under overpasses, construction sites
• Can be two floors or one floor
• Can be a family living inside of a larger vacant-aban-doned/under-construction non-self-made structure, but often using self-made materials within that building (tent, etc.)
• JNNURM social housing built for slum relocation; these buildings are often green and white with JNNURM printed on the side. Small concrete open windows/no glass, inside staircases, community bathrooms (E.g. Neelasandra JNNRUM relocation projects.

47
The Janaagraha- Brown India Initiative Citizenship Index Report 2014
Appendix 3: Questions included under BSDII
Where does your primary source of water supply come from?
1:Within premises: tap2:Within premises: hand-pump3:Within premises: open well4:Outside premises: public tap/hand-pump5:Outside premises: private-tap/hand-pump6:Outside premises: open well7:Other8:Don’t Know9:Refused to answer
Do you have a water storage system for this source?
0:No1:Yes88:Don’t Know99:Refused to answer
Is this source of water for general use or for drinking?
0:general use1:drinking2:Both88:Don’t Know99:Refused to answer
Who is the provider of this water?
1:Self-provision (E.g. Bore-Well)2:Private (E.g. Hired tanker truck) 3:BWSSB/Corporation/Cauvery water 88:Don’t Know99:Refused to answer
Do you ever experience a gap in this water supply?
0:No1:Yes88:Don’t Know99:Refused to answer
Do you have an electricity meter?
0:No1:Yes88:Don’t Know99:Refused to answer
How many times a week are there power cuts in the summer?
1:Never2:Once a week3:Twice a week4:More than twice a week88:Don’t Know99:Refused to answer
In that gap, how many hours are you without electricity?
1:1-2 hours 2:2-6 hours 3:6-12 hours4:More than 1288:Don’t Know99:Refused to answer

48
The Janaagraha- Brown India Initiative Citizenship Index Report 2014
What kind of toilet facility does the household have?
1:Own septic tank/flush latrine2:Own pit3:Shared septic tank/flush latrine4:Shared pit 5:Open defecation6:Community septic tank/flush latrine7:Community dry latrine88:Don’t Know99:Refused to answer
What is the type of road in front of your house?
1:Pakka2:Kutcha88:Don’t Know99:Refused to answer
What type of condition is the road in?
1:Good2:Poor88:Don’t Know99:Refused to answer
Does the road in front of your house get water-logged in the monsoon?
0:No1:Yes88:Don’t Know99:Refused to answer

49
The Janaagraha- Brown India Initiative Citizenship Index Report 2014
Appendix 4: Knowledge Questions
Which party/coalition of parties is currently ruling at the national level?
1:Indian National Congress2:Bharatiya Janata Party3:Janata Dal4:United Progressive Alliance(UPA)5:National Democratic Alliance (NDA)88:Don’t Know 99:Refused to answer
Which party/coalition of parties is currently ruling at the state level?
1:Indian National Congress2:Bharatiya Janata Party3:Janata Dal United(JDU)4:Janata Dal Secular(JDS)88:Don’t Know99:Refused to answer
Now I will read out a few public facilities. Please tell me which public department/agency is responsible for providing the following public facilities in your city:
Water supply
Electricity
Public transport
Traffic
With which authority would you file complaints regarding issues of corruption in urban government offices?
(Read out all responses. Record only one answer)
1:Police2:Lokayukta3:Elected Officials (Corporator/MLA/MP)4:Public Information officer (PIO)5:Local middle-man/pradhan88:Don’t Know99:Refused to answer
Are you aware of a ward committee for your locality?
0:No1:Yes88:Don’t Know99:Refused to answer
Name of your ward
Number of your ward
Corporator of your ward

50
The Janaagraha- Brown India Initiative Citizenship Index Report 2014
Participation Questions
Have you voted in BBMP Elections (2010)0: No1: Yes
Have you voted in Karnataka State Assembly Elections (2013)0: No1: Yes
Have you voted in Lok Sabha Elections (2009)0: No1: Yes
How many ward committee meetings did you, or someone in your household, attend?
0: None1: One or More
Do you or a member of your household participate in any of the following voluntary organizations? (Mark as many as applicable)
1:NGO 2:Resident Welfare Association (RWA) 3:Caste Organisation 4:Religious Organisation 5:Non-Caste, Non-Religious Organisation6:None of the above 88:Don’t Know99:Refused to answer
In the last two years, has your neighbourhood come together to address a common problem such as garbage, crime, sanitation, water, roads, or electricity?
0:No1:Yes88:Don’t Know99:Refused to answer
How often do you, or someone in your household, contribute your time to election campaigns during municipal elections?
0:Always1:Sometimes2:Never88:Don’t know99:Refused to answer
How often do you, or someone in your household, participate in meetings/ rallies organized by political parties/ officials outside of election time?
0:Always1:Sometimes2:Never88:Don’t know99:Refuse to answer
During the last municipal election, did you or someone from your household talk to friends, neighbors or other people in the commu-nity about supporting a candidate?
0:No1:Yes88:Don’t Know99:Refused to answer

51
The Janaagraha- Brown India Initiative Citizenship Index Report 2014
Appendix 5: Quality of Engagement Questions
ELECTRICITY
During the last two years, did you ever experience any problems with electricity in your house that you were unable to fix on your own?
0:No1:Yes88:Don’t Know99:Refused to answer
How did you solve these problems? (DO NOT READ OUT OPTIONS)
1: I went to the electricity board office on my own2:I approached an agent/middle-man3:I approached my Elected Representative/MLA/ Corporator4:I approached someone from a formal organization/ NGO/church/ other5:Other88:Don’t Know99:Refused to answer
If other please specify
Did you have to pay them for the services they provided?
0:No1:Yes88:Don’t Know99:Refused to answer
Was the issue resolved?
0:No1:Yes88:Don’t Know99:Refused to answer
How long did it take for your issue to be resolved?(Enter the number of days/months as applicable)
Days
Months
During the last two years, did any other member of your household face problems with electricity that they were unable to fix on their own?
0:No1:Yes88:Don’t Know99:Refused to answer
How did they solve these problems? (DO NOT READ OUT OPTIONS)
1:Went to the electricity office alone2:Approached an agent/middle-man3:Approached the Elected Representative/MLA/ Corporator4:Approached someone from a formal organization/ NGO/church/ other5:Other88:Don’t Know99:Refused to answer
If other please specify
Did he/she have to pay them for the services they provided?
0:No1:Yes88:Don’t Know99:Refused to answer

52
The Janaagraha- Brown India Initiative Citizenship Index Report 2014
Was he/she asked for a bribe?
0:No1:Yes88:Don’t Know99:Refused to answer
Was the issue resolved?
0:No1:Yes88:Don’t Know99:Refused to answer
Were you asked for a bribe?
0:No1:Yes88:Don’t Know99:Refused to answer
Why do you think you were asked a bribe?(DO NOT READ THE RESPONSE OPTIONS. LET RESPONDENT ANSWER AND THEN ENTER ACCORDINGLY.)
1:They ask everyone a bribe2:Because I am a woman/man3:Because of my religion4:Because of my caste5:Because I am poor6:Other88:Don’t know99:Refused to answer
If other please specify
Was your issue resolved?
0:No1:Yes88:Don’t Know99:Refused to answer
How long did it take for your issue to be resolved? (Enter the number of days/months as applicable)
Days
Months
What is your overall assessment of your experience at this office?
1:Fully Satisfied2:Somewhat satisfied3:Somewhat dissatisfied4:Fully dissatisfied88:Don’t know99:Refused to answer
Did you formally complain to someone about your dissatisfaction?
0:No1:Yes88:Don’t Know99:Refused to answer
Why did you not formally complain?
1:I was afraid of the consequences2:Tried to but could not / was not listened to3:Thought about it but did not complain as I did not think it would make a difference4:Thought about it but did not complain as I did not know how5:I did not think it would matter88:Don’t Know99:Refused to answer

53
The Janaagraha- Brown India Initiative Citizenship Index Report 2014
WATER SUPPLY
During the last two years, did you ever experience any problems with water supply in your house that you were unable to fix on your own?
0:No1:Yes88:Don’t Know99:Refused to answer
How did you solve these problems? (DO NOT READ OUT OPTIONS)
1:I went to the water supply board office on my own2:I approached an agent/middle-man3:I approached my Elected Representative/MLA/ Corporator4:I approached someone from a formal organization/ NGO/church/ other5:Other88:Don’t Know99:Refused to answer
If other please specify
Did you have to pay them for the services they provided?
0:No1:Yes88:Don’t Know99:Refused to answer
Was your issue resolved?
0:No1:Yes88:Don’t Know99:Refused to answer
How long did it take for your issue to be resolved?(Enter the number of days/months as applicable)
Days
Months
During the last two years, did any other member of your household face problems with water supply that they were unable to fix on their own?
0:No1:Yes88:Don’t Know99:Refused to answer
How did they solve these problems? (DO NOT READ OUT OPTIONS)
1:Went to the water supply board office alone2:Approached an agent/middle-man3:Approached the Elected Representative/MLA/ Corporator4:Approached someone from a formal organization/ NGO/church/ other5:Other88:Don’t Know99:Refused to answer
If other please specify
Did he/she have to pay them for the services they provided?
0:No1:Yes88:Don’t Know99:Refused to answer

54
The Janaagraha- Brown India Initiative Citizenship Index Report 2014
Was he/she asked for a bribe?
0:No1:Yes88:Don’t Know99:Refused to answer
Was the issue resolved?
0:No1:Yes88:Don’t Know99:Refused to answer
Were you asked for a bribe?
0:No1:Yes88:Don’t Know99:Refused to answer
Why do you think you were asked a bribe?
(DO NOT READ THE RESPONSE OPTIONS. LET RESPONDENT ANSWER AND THEN ENTER ACCORDINGLY.)
1:They ask everyone a bribe2:Because I am a woman/man3:Because of my religion4:Because of my caste5:Because I am poor6:Other 88:Don’t know99:Refused to answer
If other please specify
Was your issue resolved?
0:No1:Yes88:Don’t Know99:Refused to answer
How long did it take for your issue to be resolved?(Enter the number of days/months as applicable)
1:Fully Satisfied2:Somewhat satisfied3:Somewhat dissatisfied4:Fully dissatisfied88:Don’t know99:Refused to answer
Days
Months
What is your overall assessment of your experience at this of-fice?
1:Fully Satisfied 2:Somewhat satisfied3:Somewhat dissatisfied4:Fully dissatisfied88:Don’t know99:Refused to answer
Did you formally complain to someone about your dissatisfaction?
0:No1:Yes88:Don’t Know99:Refused to answer

55
The Janaagraha- Brown India Initiative Citizenship Index Report 2014
Why did you not formally complain?
1:I was afraid of the consequences2:Tried to but could not / was not listened to3:Thought about it but did not complain as I did not think it would make a difference4:Thought about it but did not complain as I did not know how5:I did not think it would matter88:Don’t Know99:Refused to answer
RATION SHOP
During the last two years, did you buy anything from the ration shop?
0:No1:Yes88:Don’t Know99:Refused to answer
During the last two years, did any other member of your household visit the ration shop to buy anything?
0:No1:Yes88:Don’t Know99:Refused to answer
In your experience, what is the general availability of food grains and other items at the ration shop?
1:Always available2:Mostly available3:Sometimes available, sometimes not 4:Mostly unavailable5:Never available88:Don’t Know99:Refused to answer
Do you believe the shop owner is keeping a share of your quota for himself?
0:No1:Yes88:Don’t Know99:Refused to answer
Why do you think you were not given your full share?
(DO NOT READ THE RESPONSE OPTIONS. LET RESPONDENT ANSWER AND THEN ENTER ACCORDINGLY.)
1:They keep a share out of everyone’s quota2:Because I am a woman/man3:Because of my religion4:Because of my caste5:Because I am poor6:Other 88:Don’t know99:Refused to answer
If other, please specify

56
The Janaagraha- Brown India Initiative Citizenship Index Report 2014
What is your overall assessment of your experience at the ration shop?
1:Fully Satisfied 2:Somewhat satisfied3:Somewhat dissatisfied4:Fully dissatisfied88:Don’t know99:Refused to answer
Did you formally complain to someone about your dissatisfaction?
0:No1:Yes88:Don’t Know99:Refused to answer
Why did you not formally complain?
1:I was afraid of the consequences2:Tried to but could not / was not listened to3:Thought about it but did not complain as I did not think it would make a difference4:Thought about it but did not complain as I did not know how5:I did not think it would matter88:Don’t Know99:Refused to answer
APPLYING FOR A CASTE CERTIFICATE
During the last ten years, did you apply for a caste certificate for your-self or on behalf of anyone else in the household?
0:No1:Yes88:Don’t Know99:Refused to answer
How did you apply for the caste certificate? (DO NOT READ OUT OPTIONS)
1:I went to the government office on my own2:I approached an agent/middle-man3:I approached my Elected Representative/MLA/ Corporator4:I approached someone from a formal organization/ NGO/church/ other5:Other88:Don’t Know99:Refused to answer
If other please specify
Did you have to pay them for the services they provided?
0:No1:Yes88:Don’t Know99:Refused to answer
Did you manage to get the caste certificate?
0:No1:Yes88:Don’t Know99:Refused to answer
How long did it take to get the caste certificate?(Enter the number of days/months as applicable)

57
The Janaagraha- Brown India Initiative Citizenship Index Report 2014
Days
Months
During the last two years, did anyone else in your household apply for a caste certificate?
0:No1:Yes88:Don’t Know99:Refused to answer
How did he/she apply for the caste certificate? (DO NOT READ OUT OPTIONS)
1:Went to the government office alone2:Approached an agent/middle-man3:Approached the Elected Representative/MLA/ Corporator4:Approached someone from a formal organization/ NGO/church/ other5:Other88:Don’t Know99:Refused to answer
If other please specify
Did he/she have to pay them for the services they provided?
0:No1:Yes88:Don’t Know99:Refused to answer
Was he/she asked for a bribe?
0:No1:Yes88:Don’t Know99:Refused to answer
Did he/she manage to get the caste certificate?
0:No1:Yes88:Don’t Know99:Refused to answer
Were you asked for a bribe?
0:No1:Yes88:Don’t Know99:Refused to answer
Why do you think you were asked a bribe?(DO NOT READ THE RESPONSE OPTIONS. LET RESPONDENT ANSWER AND THEN ENTER ACCORDINGLY.)
1:They ask everyone a bribe2:Because I am a woman/man3:Because of my religion4:Because of my caste5:Because I am poor6:Other88:Don’t know99:Refused to answer
If other please specify
Did you manage to get the caste certificate?
0:No1:Yes88:Don’t Know99:Refused to answer

58
The Janaagraha- Brown India Initiative Citizenship Index Report 2014
How long did it take to get the caste certificate?(Enter the number of days/months as applicable)
Days
Months
What is your overall assessment of your experience at this office?
1:Fully Satisfied2:Somewhat satisfied3:Somewhat dissatisfied4:Fully dissatisfied88:Don’t know99:Refused to answer
Did you formally complain to someone about your dissatisfaction?
0:No1:Yes88:Don’t Know99:Refused to answer
Why did you not formally complain?
1:I was afraid of the consequences2:Tried to but could not / was not listened to3:Thought about it but did not complain as I did not think it would make a difference4:Thought about it but did not complain as I did not know how5:I did not think it would matter88:Don’t Know99:Refused to answer
APPLYING FOR A RATION CARD/BPL CARD
During the last ten years, did you apply for a ration card/BPL Card?
0:No1:Yes88:Don’t Know99:Refused to answer
During the last two years, did you apply for a ration card/BPL Card?
0:No1:Yes88:Don’t Know99:Refused to answer
How did you apply for the ration card/BPL Card? (DO NOT READ OUT OPTIONS)
1:I went to the government office on my own2:I approached an agent/middle-man3:I approached my Elected Representative/MLA/ Corporator4:I approached someone from a formal organization/ NGO/church/ other5:Other88:Don’t Know99:Refused to answer
If other please specify
Did you have to pay them for the services they provided?
0:No1:Yes88:Don’t Know99:Refused to answer

59
The Janaagraha- Brown India Initiative Citizenship Index Report 2014
Did you get the ration card/BPL card?
0:No1:Yes88:Don’t Know99:Refused to answer
How long did it take for you to get the ration card/BPL card?(Enter the number of days/months as applicable)
Days
Months
During the last ten years, did anyone else in your household apply for a ration card/BPL card?
0:No1:Yes88:Don’t Know99:Refused to answer
During the last two years, did anyone else in your household apply for a ration card/BPL card?
0:No1:Yes88:Don’t Know99:Refused to answer
How did they apply for the ration card/BPL Card? (DO NOT READ OUT OPTIONS)
1:Went to the government office alone2:Approached an agent/middle-man3:Approached the Elected Representative/MLA/ Corporator4:Approached someone from a formal organization/ NGO/church/ other5:Other88:Don’t Know99:Refused to answer
If other please specify
Was he/she asked for a bribe?
0:No1:Yes88:Don’t Know99:Refused to answer
Did he/she have to pay them for the services they provided?
0:No1:Yes88:Don’t Know99:Refused to answer
Did he/she get the ration card/BPL card?
0:No1:Yes88:Don’t Know99:Refused to answer
Were you asked for a bribe?
0:No1:Yes88:Don’t Know99:Refused to answer

60
The Janaagraha- Brown India Initiative Citizenship Index Report 2014
Why do you think you were asked a bribe?(DO NOT READ THE RESPONSE OPTIONS. LET RESPONDENT ANSWER AND THEN ENTER ACCORDINGLY.)
1:They ask everyone a bribe2:Because I am a woman/man3:Because of my religion4:Because of my caste5:Because I am poor6:Other88:Don’t know99:Refused to answer
If other please specify
Did you get the ration card/BPL card?
0:No1:Yes88:Don’t Know99:Refused to answer
How long did it take for you to get the ration card/BPL card?(Enter the number of days/months as applicable)
Days
Months
What is your overall assessment of your experience at this office?
1:Fully Satisfied2:Somewhat satisfied3:Somewhat dissatisfied4:Fully dissatisfied88:Don’t know99:Refused to answer
Did you formally complain to someone about your dissatisfaction?
0:No1:Yes88:Don’t Know99:Refused to answer
Why did you not formally complain?
1:I was afraid of the consequences2:Tried to but could not / was not listened to3:Thought about it but did not complain as I did not think it would make a difference4:Thought about it but did not complain as I did not know how5:I did not think it would matter88:Don’t Know99:Refused to answer
DRIVER’S LICENSE / VEHICLE REGISTRATION OFFICE
Have you ever applied for a driver’s license or vehicle registration?
0:No1:Yes88:Don’t Know99:Refused to answer

61
The Janaagraha- Brown India Initiative Citizenship Index Report 2014
How did you apply for the driver's license or vehicle registration? (DO NOT READ OUT OPTIONS)
1:I went to the RTO office on my own2:I approached an agent/middle-man3:I approached my Elected Representative/MLA/ Corporator4:I approached someone from a formal organization/ NGO/church/ other5:Other88:Don’t Know99:Refused to answer
If other please specify
Did you have to pay them for the services they provided?
0:No1:Yes88:Don’t Know99:Refused to answer
Did you get the license/registration issued?
0:No1:Yes88:Don’t Know99:Refused to answer
How long did it take for you to get the license/registration?(Enter the number of days/months as applicable)
Days
Months
Has any other member of your household ever applied for a driver’s license or vehicle registration?
0:No1:Yes88:Don’t Know99:Refused to answer
How did they apply for the driver's license or vehicle registration? (DO NOT READ OUT OPTIONS)
1:Went to the RTO office alone2:Approached an agent/middle-man3:Approached the Elected Representative/MLA/ Corporator4:Approached someone from a formal organization/ NGO/church/ other5:Other88:Don’t Know99:Refused to answer
If other please specify
Was he/she asked for a bribe?
0:No1:Yes88:Don’t Know99:Refused to answer
Did he/she have to pay them for the services they provided?
0:No1:Yes88:Don’t Know99:Refused to answer

62
The Janaagraha- Brown India Initiative Citizenship Index Report 2014
Did he/she get the license/registration issued?
0:No1:Yes88:Don’t Know99:Refused to answer
Were you asked for a bribe?
0:No1:Yes88:Don’t Know99:Refused to answer
Why do you think you were asked a bribe?(DO NOT READ THE RESPONSE OPTIONS. LET RESPONDENT ANSWER AND THEN ENTER ACCORDINGLY.)
1:They ask everyone a bribe2:Because I am a woman/man3:Because of my religion4:Because of my caste5:Because I am poor6:Other88:Don’t know99:Refused to answer
If other please specify
Did you get the license/registration issued?
0:No1:Yes88:Don’t Know99:Refused to answer
How long did it take for you to get the license/registration?(Enter the number of days/months as applicable)
Days
Months
What is your overall assessment of your experience at this office?
1:Fully Satisfied2:Somewhat satisfied3:Somewhat dissatisfied4:Fully dissatisfied88:Don’t know99:Refused to answer
Did you formally complain to someone about your dissatisfaction?
0:No1:Yes88:Don’t Know99:Refused to answer
Why did you not formally complain?
1:I was afraid of the consequences2:Tried to but could not / was not listened to3:Thought about it but did not complain as I did not think it would make a difference4:Thought about it but did not complain as I did not know how5:I did not think it would matter88:Don’t Know99:Refused to answer
Other Experiences of State or Private Institutional Discrimination

63
The Janaagraha- Brown India Initiative Citizenship Index Report 2014
In the past two years have you or a member of your family visited a hospital for any kind of medical service?
0:No1:Yes88:Don’t Know99:Refused to answer
What kind of a hospital did you or a member of your family visit?
1:Government hospital2:Private hospital3:Other88:Don’t Know99:Refused to answer
Were you denied health service/treated poorly at a hospital?
0:No1:Yes88:Don’t Know99:Refused to answer
If yes, why do you believe you/your family member were denied health service/treated poorly at a hospital?(If more than one instance, ask about the last instance. Read each one, mark all that apply)
1:Because everyone is treated poorly at this hospital2:Because I/they am a woman/man3:Because of my/their religion4:Because of my/their caste5:Because I/they am poor6:Other88:Don't know99:Refused to answer
If other, please specify
What is your overall assessment of your hospital experience?
1:Fully Satisfied2:Somewhat satisfied3:Somewhat dissatisfied4:Fully dissatisfied88:Don’t Know99:Refuse to Answer
Did you formally complain to someone about your dissatisfaction?
0:No1:Yes88:Don’t Know99:Refused to answer
If no, why did you not formally complain?
1:I was afraid of the consequences2:Tried to but could not / was not listened to3:Thought about it but did not complain as I did not think it would make a difference4:Thought about it but did not complain as I did not know how5:I did not think it would matter6:I was afraid of the consequences88:Don’t Know99:Refused to answer
Are there any school going children in the family unit?
0:No1:Yes88:Don’t Know99:Refused to answer

64
The Janaagraha- Brown India Initiative Citizenship Index Report 2014
If yes, does this child go to a government school or a private school?(If more than one school-going child, ask all following questions about the eldest child.)
1:Government school2:Private school88:Don’t Know99:Refused to answer
To get your child admitted to the school whose influence/approach/pull or help did you have to use, if at all?
1:No one2:a politician3:a local middle man/dada4:a family member/friend5:other88:Don't know99:Refused to answer
If other, please specify
To get your child admitted to the school, were you (or your spouse), asked to pay any bribe?(NOTE: a bribe is not the same as a donation)?
0:No1:Yes88:Don’t Know99:Refused to answer
If yes, why do you believe you were asked for a bribe?(If more than one instance, ask about the last instance. Read each one, mark all that apply)
1:Because everyone pays a bribe2:Because I am a woman/man3:Because of my religion4:Because of my caste5:Because I am poor6:Other88:Don't know99:Refused to answer
If other, please specify
Has your child ever been treated poorly at school (by his/her teacher? for example: asked to sit in the back of the classroom, harassed, beaten?)
0:No1:Yes88:Don't know99:Refused to answer
If yes, why do you believe your child was treated poorly?(If more than one instance, ask about the last instance. Read each one, mark all that apply.)
1:Because all children are treated poorly at my child’s school2:Because my child is a girl/boy3:Because of the family’s religion4:Because of the family’s caste5:Because the family is poor6:Other88:Don't know99:Refuse to answer
If other, please specify
Did you formally complain to someone about the poor treatment?0:No1:Yes88:Don’t Know99:Refused to answer
If no, why did you not formally complain?
1:I was afraid of the consequences2:Tried to but could not / was not listened to3:Thought about it but did not complain as I did not think it would make a difference4:Thought about it but did not complain as I did not know how5:I did not think it would matter6:I was afraid of the consequences88:Don’t Know99:Refused to answer
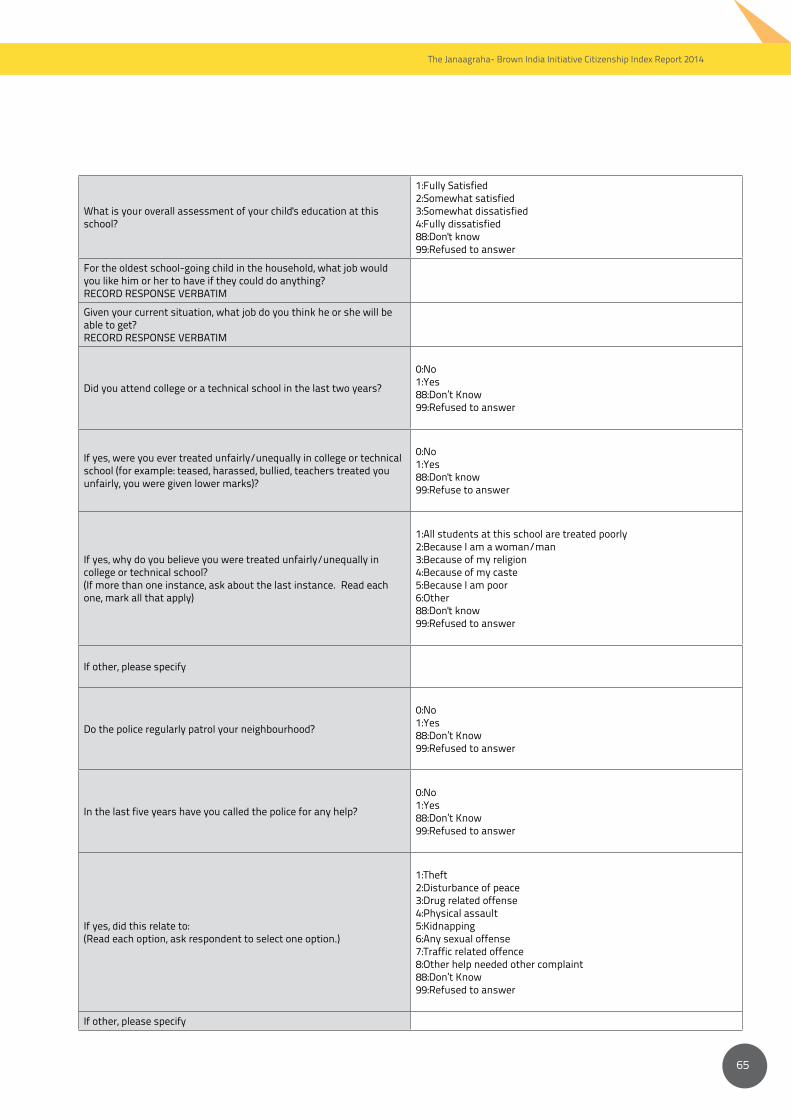
65
The Janaagraha- Brown India Initiative Citizenship Index Report 2014
What is your overall assessment of your child's education at this school?
1:Fully Satisfied2:Somewhat satisfied3:Somewhat dissatisfied4:Fully dissatisfied88:Don't know99:Refused to answer
For the oldest school-going child in the household, what job would you like him or her to have if they could do anything?RECORD RESPONSE VERBATIM
Given your current situation, what job do you think he or she will be able to get?RECORD RESPONSE VERBATIM
Did you attend college or a technical school in the last two years?
0:No1:Yes88:Don’t Know99:Refused to answer
If yes, were you ever treated unfairly/unequally in college or technical school (for example: teased, harassed, bullied, teachers treated you unfairly, you were given lower marks)?
0:No1:Yes88:Don't know99:Refuse to answer
If yes, why do you believe you were treated unfairly/unequally in college or technical school?(If more than one instance, ask about the last instance. Read each one, mark all that apply)
1:All students at this school are treated poorly2:Because I am a woman/man3:Because of my religion4:Because of my caste5:Because I am poor6:Other88:Don't know99:Refused to answer
If other, please specify
Do the police regularly patrol your neighbourhood?
0:No1:Yes88:Don’t Know99:Refused to answer
In the last five years have you called the police for any help?
0:No1:Yes88:Don’t Know99:Refused to answer
If yes, did this relate to:(Read each option, ask respondent to select one option.)
1:Theft2:Disturbance of peace3:Drug related offense4:Physical assault5:Kidnapping6:Any sexual offense7:Traffic related offence8:Other help needed other complaint88:Don’t Know99:Refused to answer
If other, please specify

66
The Janaagraha- Brown India Initiative Citizenship Index Report 2014
What was your experience with the police?
1:Arrived immediately after being called2:No Response3:Demanded a bribe to pursue the case4:Filed an FIR5:Refused to file and FIR6:followed proper procedure7:Other88:Don’t Know99:Refused to answer
If other, please specify
Why do you believe you were treated this way?
1:Police treat everyone poorly2:Because I am a woman/man3:Because of my religion4:Because of my caste5:Because I am poor6:Other88:Don’t know99:Refuse to
If other, please specify
Have you or any member of your family ever been beaten/threatened by the police?
0:No1:Yes88:Don’t Know99:Refused to answer
If yes, where did this take place?
0:In the street1:At the police station2:Other88:Don’t Know99:Refused to answer
If other, please specify
Why do you believe you or a member of your family was beaten/threatened by the police?
0:The police treat everyone poorly1:Because I am a woman/man2:Because of my religion3:Because of my caste4:Because I am poor5:Other88:Don’t know99:Refuse to answer
If other, please specify

67
The Janaagraha- Brown India Initiative Citizenship Index Report 2014
Appendix 6: Vignettes
A friend tells you that he needs more room in his home for his family. He knows that building an extra room is illegal. He says he will build an extra room because all (most of) his neighbours have built extra rooms and have not faced significant government sanctions. He feels that it is unlikely he will get punished. Do you agree or disagree with his reason for not following the law?
0:Agree1:Disagree88:Don’t Know99:Refused to answer
There is a stagnant pool of water acting as a breeding ground for mosquitoes on your street that affects you and your neighbours. Your neighbour tells you that he is unwilling to clean the pool with his time or money but will inform (has informed) the local ward councillor (to get it fixed) since it is the state’s responsibility. It may take some time. Do you agree or disagree with his reason for not helping clean the pool?
0:Agree1:Disagree88:Don’t Know99:Refused to answer
You are waiting for a bus/taxi/auto/car when you see an accident happen in front of you. You notice that someone is lying on the ground and looks badly injured. You hear the person standing next to you say that he will not do anything as he does not want to get involved with the police. Do you agree or disagree with his statement?
0:Agree1:Disagree88:Don’t Know99:Refused to answer
Your colleague at work tells you that he lives in an area that faces frequent power outages. He also tells you that he believes the frequent power cuts are because of the caste/religious composition of the community. He says that he has decided to get power through an illegal wire connection from the mainline in order to address the problem. Do you agree or disagree with your colleagues’ proposed action.
0:Agree1:Disagree88:Don’t Know99:Refused to answer
Your friend has a daughter who is in high school. He tells you that he is planning on getting her married very soon as she has received an extremely suitable marriage offer. He knows that it is illegal to get his daughter married while she is not of legal age, but he feels that if he misses this opportunity another one might not come along, and it would be more difficult for him to find a suitable boy for his daughter when she is older. Do you agree or disagree with your friend’s proposed action?
0:Agree1:Disagree88:Don’t Know99:Refused to answer


69
