about arabiaarabiainsurance.com/css/pdf/location1441784992.pdftable of contents 2 4 5 6 9 11 about...
TRANSCRIPT

Preserving your lifestyle... Simply.
Arabia Insurance Company s.a.l. - Paid up capital L.L. 51,000,000,000 –Commercial Court Register 1889Insurance Register 2, dated 11/9/1956 – Subject to Decree 9812 of 4/5/1968 - MOF #4976
Lebanon | Kuwait | Bahrain | Qatar | UAE | OmanKSA | Syria | JordanAnnual Report 2014

Table of conTenTs
2
456911
abouT aRabIa
branch officesArabia’s Vision, Mission & Goalssubsidiaries and affiliated companiesboard of Directors as of 31/12/2014executive General Management (Head office)
63consolIDaTeD fInancIal sTaTeMenT anD auDIToR’s RepoRT . . . . . . . . . . . . . . . . . . . . . . . . . . . . . . . . . . .. . . . . . . . . . . . . . . . . . . . . .
I. execuTIVe suMMaRy . . . . . . . . . . . . . . . . . . . . . . . . . . . . . . . . . . . . . . . .
II. InsuRance secToR oVeRVIew . . . . . . . . . . . . . . . . . . . . .
1. Insurance IndustryIII. aRabIa opeRaTIons oVeRVIew. . . . . . . . . . . . . . . . . .
1. Insurance operations1.1 non-life Global overview1.2 life insurance operations
2. Investment operations2.1 world economy and financial market 2.2 Investment operations - General
Departments2.3 Investment operations - life
3. financial Highlights3.1 non-life3.2 life
4. other Issues4.1 Human capital update4.2 other operational Highlights
IV. coRpoRaTe GoVeRnance, RIsK & capITal ManaGeMenT . . . . . . . . . . . . . . . . . . . . . . . . . . . . . . . . . . . . . . . . . . . . . . . . .
1. corporate Governance2. Group Risk & capital Management
2.1 capital Management 2.2 Risk Management
152021242525273232
3334
353741434345
4849515155
RepoRT of THe boaRD of DIRecToRs on THe 70TH fInancIal yeaR of THe coMpany’s opeRaTIons

abouT aRabIa

annual Report 2014Report of the Board of Directors and Statements of Accounts for the Financial year ending on 31/12/2014 submitted to the 70th Annual General Assembly of Shareholders.
Head office:Arabia House - Phoenicia street - Beirut - LebanonTel. 961 - 1 - 363610 /363611 & 961 - 3 - 314350 / 314351Telefax 961 - 1 - 365139 /363659
P.O.Box 11 - 2172 Beirut - LebanonE-mail [email protected] www.arabiainsurance.com
4
branch offices
Country Branch Local Sponsor Management
Lebanon
United Arab Emirates
Sultanate of Oman
BahrainKuwaitQatar Doha
ain el MreissehTripoliZalkasaidachtauraManamaKuwait
Muscat
salalahDubaiSharjahAbu DhabiAl-Ain
M/s. Moosa abdul Rahman Hassan & co.
Mr. Mohammad Jalal
ali bin ali establishmentMr. Mohammad abdul Rahman al bahar
Tony choueiryIsmail el Rifielias sawayaToufic DerianRoger Dawalibi
shaikh butti Maktoum Juma almaktoumsheikh Khaled al KassimiMr. ahmed bin GhanoumMr. saeed sultan salmeen bin Harmal al-Dhahiri
francis Karam Tareq fakhoury / antoine sfeirJihad salaminMohammad Kaddoura
alain Georr
Mohammad othmanclaude Jabbour
fadi said chammas – country ManagerMaurice shaheenRaed Daghmash

VisionTo be the leading “customer centric” Arab Insurer.
MissionTo provide accessible, simple, effective, and client friendly products and services that respond to the evolving needs of our customers.
Arabia’s Vision, Mission & Goals
5
Sustain a culture of leadership, trust, open communication, transparency, efficiency, effectiveness and innovation, thus adding further value to our stakeholders.
Develop, invest in, empower our human capital to take on the challenges of a fast changing and growing industry, capitalizing on teamwork spirit and a “customer centric” culture.
Enhance our corporate brand by using an advanced and holistic marketing approach.
Play a positive role in the countries of our operations through local CSR activities.
Use state of the art technology.
Goals
Enhance Shareholder value.
Emphasize excellence in our relations with our stakeholders, while exercising good corporate governance, enhancing our internal controls, simplifying processes, and upholding professional ethics, integrity and social responsibility.
Respond to our customers’ needs by offering them transparent quality products, good investment opportunities, outstanding personalized services, dedicated personnel, and an elaborate, easily accessible, distribution & claims’ handling networks.
Achieve a fair return on equity, benchmarked with local markets’ yields.

6
subsidiaries & affiliated companies
ARABIA s.a.l. HOLDInG COmPAnyHead Office Arabia House Building, Phoenicia St.Tel. 961 - 1 - 363610/1 & 961 - 3 - 314350/1Fax 961 - 1 - 362975P.O.Box 11 - 2172 Beirut - LebanonE-mail [email protected]
ARABIA InTERnATIOnAL COmPAny B.S.C. ClosedHead Office Bahrain Tower - Al Khalifa AvenueTelefax +973 - 17 - 214110P.O.Box 11432 Diplomatic Area manama – Bahrain
ARABIA InSURAnCE BROKERS s.a.r.l.Head Office Arabia House Building - Phoenicia St.Tel. 961 - 1 - 363610/1Fax 961 - 1 - 363659 / 365139P.O.Box 11 - 2172 Beirut – Lebanon

7
subsidiaries & affiliated companies
ARABIA InSURAnCE COOPERATIVE COmPAnyHead Office Bin Tami Center, King Abdel Aziz RoadTel. 966-11-2153360Fax 966-11-2153197P.O.Box 286555 - 11323 Riyadh - KSAURL www.aicc.com.sa
ARABIA InSURAnCE COmPAny - SyRIA S.A.Head Office Abu Remaneh, Al Sebki Park, Hugo Chavez StreetTel. 963 - 11 - 6627745Fax 963 - 11 - 6627750P.O.Box 34801 Damascus - SyriaURL www.arabiasyria.com
Branches in the Kingdom of Saudi Arabia:Riyadh - Head OfficeJeddah Branch 1Jeddah Branch 2mekkahTaefKhamis musheitRiyadh Branch 1Riyadh Branch 2DammamKhobarHoufouf
Branches in Syria:Damascus Head Office
[email protected] Branch

8
subsidiaries & affiliated companies
ARABIA InSURAnCE COmPAny - JORDAn LtdHead Office Arabia Insurance Building - Al Shmesani
Abed El Hameed Sharaf Street- Building 3Tel. 962 - 6 - 5630530Fax 962 - 6 - 5622303P.O.Box 20031 Amman (11118) JordanE-mail [email protected] www.gaic.jo
UPI (SERVICES) LImITEDHead Office 3, Chrysanthou - mylona StreetTelefax 5340734P.O.Box 6253 - 3305 Lemesos-Cyprus
AL mASHRIQ FInAnCIAL InVESTmEnT CO. s.a.l.Head Office Arabia House Building - 131 Phoenicia St.Tel. 961 - 1 - 363610/1Fax 961 - 1 - 362975P.O.Box 4069 Beirut – Lebanon

9
board of Directors as of 31/12/2014
board of Directors
mr. Wahbe Abdallah Tamari (Chairman)mr. Hani Atallah Freij (Vice - Chairman)Arab Bank PLC (Represented by mr. Riyad Kamal)mr. nadim BaroodyDr. Karma Fahoum EI-Hassanmr. Basim Farismr. Emad AI Baharmr. Tarek AI-Suleimanms. Randa Tannousmr. muneer mouashermr. nadim Ghantous
board committees
Investment committeemr. Wahbe Tamari / Committee Chairpersonmr. Hani Freijmr. nadim Ghantous
shares Transfer committeemr. Wahbe Tamari / Committee Chairpersonmr. Hani Freijmr. nadim Baroody
nomination & Remuneration committeemr. Wahbe Tamari / Committee Chairpersonmr. Hani Freijmr. nadim Baroodymr. Basim Faris
audit committeeDr. Karma Fahoum El-Hassan / Committee Chairpersonms. Randa Tannousmr. nadim Baroody
Risk committeemr. Riad Kamal / Committee Chairpersonmr. nadim Ghantousmr. Tarek Al-Suleiman

10
Management committee
executive & administrative committeemr. muneer mouasher / Chief Executive Officermr. Hisham Barraj / Chief Insurance Officermr. nabih Baaklini / Chief Operations Officermr. Carlos Saba / Chief Human Resources Officermr. naji Fayad / Chief Financial Officer
board of Directors as of 31/12/2014

11
executive General Management (Head office)
chief executive officermr. muneer mouasher
chief officersmr. Hisham Barraj. . . . . . . . . . . . . . . . . . . . . . . . . . . . . . . . . . . . . . . . . . . . . . . . . . . . . . . . . . . . . . . . . . . . . . . . . . . . . . . . . . . . .
mr. nabih Baaklini. . . . . . . . . . . . . . . . . . . . . . . . . . . . . . . . . . . . . . . . . . . . . . . . . . . . . . . . . . . . . . . . . . . . . . . . . . . . . . . . . . . .
mr. Carlos Saba. . . . . . . . . . . . . . . . . . . . . . . . . . . . . . . . . . . . . . . . . . . . . . . . . . . . . . . . . . . . . . . . . . . . . . . . . . . . . . . . . . . . . . . . .
mr. naji Fayad. . . . . . . . . . . . . . . . . . . . . . . . . . . . . . . . . . . . . . . . . . . . . . . . . . . . . . . . . . . . . . . . . . . . . . . . . . . . . . . . . . . . . . . . . . .
Managersmr. Abdul Hameed Habboub. . . . . . . . . . . . . . . . . . . . . . . . . . . . . . . . . . . . . . . . . . . . . . . . . . . . . . . . . . . . . . . .
ms. Amal mikdash. . . . . . . . . . . . . . . . . . . . . . . . . . . . . . . . . . . . . . . . . . . . . . . . . . . . . . . . . . . . . . . . . . . . . . . . . . . . . . . . . . . . .
mr. Antoine Haddad. . . . . . . . . . . . . . . . . . . . . . . . . . . . . . . . . . . . . . . . . . . . . . . . . . . . . . . . . . . . . . . . . . . . . . . . . . . . . . . . .
mr. Bassam Saadeh. . . . . . . . . . . . . . . . . . . . . . . . . . . . . . . . . . . . . . . . . . . . . . . . . . . . . . . . . . . . . . . . . . . . . . . . . . . . . . . . . . .
ms. Danielle Zakher Salloum. . . . . . . . . . . . . . . . . . . . . . . . . . . . . . . . . . . . . . . . . . . . . . . . . . . . . . . . . . . . . . . . . . .
mr. Elias malek. . . . . . . . . . . . . . . . . . . . . . . . . . . . . . . . . . . . . . . . . . . . . . . . . . . . . . . . . . . . . . . . . . . . . . . . . . . . . . . . . . . . . . . . . . .
mr. Fadi Sawaya. . . . . . . . . . . . . . . . . . . . . . . . . . . . . . . . . . . . . . . . . . . . . . . . . . . . . . . . . . . . . . . . . . . . . . . . . . . . . . . . . . . . . . . . .
mr. Fouad Oleiwan. . . . . . . . . . . . . . . . . . . . . . . . . . . . . . . . . . . . . . . . . . . . . . . . . . . . . . . . . . . . . . . . . . . . . . . . . . . . . . . . . . . .
mr. GaroSajian. . . . . . . . . . . . . . . . . . . . . . . . . . . . . . . . . . . . . . . . . . . . . . . . . . . . . . . . . . . . . . . . . . . . . . . . . . . . . . . . . . . . . . . . . . .
mr. Georges Bekhazi. . . . . . . . . . . . . . . . . . . . . . . . . . . . . . . . . . . . . . . . . . . . . . . . . . . . . . . . . . . . . . . . . . . . . . . . . . . . . . . . .
mr. Jamal Arnaout. . . . . . . . . . . . . . . . . . . . . . . . . . . . . . . . . . . . . . . . . . . . . . . . . . . . . . . . . . . . . . . . . . . . . . . . . . . . . . . . . . . . .
mr. Joseph yammouni. . . . . . . . . . . . . . . . . . . . . . . . . . . . . . . . . . . . . . . . . . . . . . . . . . . . . . . . . . . . . . . . . . . . . . . . . . . . .
mr. marwan Berjaoui. . . . . . . . . . . . . . . . . . . . . . . . . . . . . . . . . . . . . . . . . . . . . . . . . . . . . . . . . . . . . . . . . . . . . . . . . . . . . . . .
mr. median Fares. . . . . . . . . . . . . . . . . . . . . . . . . . . . . . . . . . . . . . . . . . . . . . . . . . . . . . . . . . . . . . . . . . . . . . . . . . . . . . . . . . . . . . .
Chief Insurance OfficerChief Operations OfficerChief Human Resources OfficerChief Financial Officer
ClaimsPropertymarketingLoss PreventionmedicalTreasury & InvestmentActuaryAdministrationInformation TechnologyRisk management General Accident Individual LifeReinsuranceBudgeting & Financial Reporting

12
executive General Management (Head office)
Managersmr. mohammad EI-Hassan. . . . . . . . . . . . . . . . . . . . . . . . . . . . . . . . . . . . . . . . . . . . . . . . . . . . . . . . . . . . . . . . . . . . . .
ms. noura Tabbara. . . . . . . . . . . . . . . . . . . . . . . . . . . . . . . . . . . . . . . . . . . . . . . . . . . . . . . . . . . . . . . . . . . . . . . . . . . . . . . . . . . .
ms. Rana Chammas. . . . . . . . . . . . . . . . . . . . . . . . . . . . . . . . . . . . . . . . . . . . . . . . . . . . . . . . . . . . . . . . . . . . . . . . . . . . . . . . . . .
ms. Sabine Salloum. . . . . . . . . . . . . . . . . . . . . . . . . . . . . . . . . . . . . . . . . . . . . . . . . . . . . . . . . . . . . . . . . . . . . . . . . . . . . . . . . . .
mr. Sadek Khoukas. . . . . . . . . . . . . . . . . . . . . . . . . . . . . . . . . . . . . . . . . . . . . . . . . . . . . . . . . . . . . . . . . . . . . . . . . . . . . . . . . . .
mr. Samir Karnabi. . . . . . . . . . . . . . . . . . . . . . . . . . . . . . . . . . . . . . . . . . . . . . . . . . . . . . . . . . . . . . . . . . . . . . . . . . . . . . . . . . . . . .
ms. Sana Saoud malti. . . . . . . . . . . . . . . . . . . . . . . . . . . . . . . . . . . . . . . . . . . . . . . . . . . . . . . . . . . . . . . . . . . . . . . . . . . . . . .
Internal audit & compliancemr. Wael El Bsat. . . . . . . . . . . . . . . . . . . . . . . . . . . . . . . . . . . . . . . . . . . . . . . . . . . . . . . . . . . . . . . . . . . . . . . . . . . . . . . . . . . . . . . . .
auditorsDeloitte & Touche
OperationsInsurance SupportHuman CapitalGroup LifeLife Sales marineAccounts
manager
life agenciesCedars Agency/ Verdun - Lebanon. . . . . . . . . . . . . . . . . . . . . . . . . . . . . . . . . . . . . . . . . . . . . . . . . . . . . . . . .
Elite Agency/Ashrafieh - Lebanon. . . . . . . . . . . . . . . . . . . . . . . . . . . . . . . . . . . . . . . . . . . . . . . . . . . . . . . . .
Kite Agency/Jdeideh- Lebanon. . . . . . . . . . . . . . . . . . . . . . . . . . . . . . . . . . . . . . . . . . . . . . . . . . . . . . . . . . . . . .
Unirisk Agency/Beirut - Lebanon. . . . . . . . . . . . . . . . . . . . . . . . . . . . . . . . . . . . . . . . . . . . . . . . . . . . . . . . . .
Dynamix Agency/Sharjah - UAE. . . . . . . . . . . . . . . . . . . . . . . . . . . . . . . . . . . . . . . . . . . . . . . . . . . . . . . . . . . .
Falcons Agency/Abu Dhabi, Al Ain & Dubai - UAE. . . . . . . . . . . . . . . . . . . . . . . . . . . . .
Pharaohs Agency/Sharjah - UAE. . . . . . . . . . . . . . . . . . . . . . . . . . . . . . . . . . . . . . . . . . . . . . . . . . . . . . . . . . .
The A Team Agency/Dubai - UAE. . . . . . . . . . . . . . . . . . . . . . . . . . . . . . . . . . . . . . . . . . . . . . . . . . . . . . . . .
managed by mr. Riad Shoukairmanaged by mr. Antoine Zakhiamanaged by mr. Georges Saadmanaged by mr. Ghaleb Damajmanaged by mr. Ashraf Hamdymanaged by mr. Hassan Al Khatibmanaged by mr. mohamad nabil El Kasedmanaged by mr. Assaad Abou Seif

13
executive General Management (Head office)
non-life agenciesAntelias Agency/Antelias-Lebanon. . . . . . . . . . . . . . . . . . . . . . . . . . . . . . . . . . . . . . . . . . . . . . . . . . . . . .
Ashrafieh Agency / Ashrafieh-Lebanon. . . . . . . . . . . . . . . . . . . . . . . . . . . . . . . . . . . . . . . . . . . . . . . . .
Baalbeck Agency/ Baalbeck-Lebanon. . . . . . . . . . . . . . . . . . . . . . . . . . . . . . . . . . . . . . . . . . . . . . . . . . .
Badaro Agency/Badaro-Lebanon. . . . . . . . . . . . . . . . . . . . . . . . . . . . . . . . . . . . . . . . . . . . . . . . . . . . . . . . . .
Hadath Agency/Hadath-Lebanon. . . . . . . . . . . . . . . . . . . . . . . . . . . . . . . . . . . . . . . . . . . . . . . . . . . . . . . .
Jdeideh Agency/Jdeideh-Lebanon. . . . . . . . . . . . . . . . . . . . . . . . . . . . . . . . . . . . . . . . . . . . . . . . . . . . . . .
Jib Jennine Agency/Jib Jennine-Lebanon. . . . . . . . . . . . . . . . . . . . . . . . . . . . . . . . . . . . . . . . . . . .
Koura Agency/Koura-Lebanon. . . . . . . . . . . . . . . . . . . . . . . . . . . . . . . . . . . . . . . . . . . . . . . . . . . . . . . . . . . . . .
Rabieh Agency/Rabieh-Lebanon. . . . . . . . . . . . . . . . . . . . . . . . . . . . . . . . . . . . . . . . . . . . . . . . . . . . . . . . . .
Saida Agency/Saida -Lebanon. . . . . . . . . . . . . . . . . . . . . . . . . . . . . . . . . . . . . . . . . . . . . . . . . . . . . . . . . . . . . . .
Verdun Agency/ Verdun-Lebanon. . . . . . . . . . . . . . . . . . . . . . . . . . . . . . . . . . . . . . . . . . . . . . . . . . . . . . . . .
Zahle Agency/Zahle-Lebanon. . . . . . . . . . . . . . . . . . . . . . . . . . . . . . . . . . . . . . . . . . . . . . . . . . . . . . . . . . . . . . .
Zgharta Agency/Zgharta-Lebanon. . . . . . . . . . . . . . . . . . . . . . . . . . . . . . . . . . . . . . . . . . . . . . . . . . . . . . .
Al Buraimi Agency/Al Buraimi-Sultanate of Oman. . . . . . . . . . . . . . . . . . . . . . . . . . .
Al Jabal Al Akhdar mound Trade Agency/Al Ghubra -Sultanate of Oman Al mazar Agency/Al Khud- Sultanate of Oman. . . . . . . . . . . . . . . . . . . . . . . . . . . . . . . . . .
Amani Al Faisal Agency/Al Hail - Sultanate of Oman. . . . . . . . . . . . . . . . . . . . . .
Future Safe Agency/Khoweir-Sultanate of Oman. . . . . . . . . . . . . . . . . . . . . . . . . . . . .
Sohar Agency/Sohar-Sultanate of Oman. . . . . . . . . . . . . . . . . . . . . . . . . . . . . . . . . . . . . . . . . . .
Gateway International Assurance L.L.C/ Dubai-UAE. . . . . . . . . . . . . . . . . . . . . . . .
managed by mrs. Vera Atallah Aramounimanaged by mr. Antoine Zakhiamanaged by mrs. Oumayma Haidar younessmanaged by mr. Samer Khalilmanaged by mr. matta Sakrmanaged by mr. Georges Saadmanaged by mr. Joseph Abi Faresmanaged by mr. nizam najjarmanaged by mrs. nivine Chediakmanaged by mr. Sami Awadmanaged by mr. Bassem Abou Dahermanaged by mrs. Lina Haroukmanaged by mr. Pascal masrimanaged by mr. Rached Al Jaberimanaged by mr. Khaled Al Ismailimanaged by mr. Shahul Hamedmanaged by mr. Faisal Al Farsimanaged by mr. nabih Drazmanaged by mr. Abdul Rahman Abdallah Al Farsimanaged by mr. Georges Ashkar

RepoRT of THe boaRD of DIRecToRs on THe 70TH fInancIal yeaR of THe
coMpany’s opeRaTIons

I. execuTIVe suMMaRy
RepoRT of THe boaRD of DIRecToRs

16
Dear Shareholders,
We welcome you at your company, and are glad, on behalf of the Board of Directors of Arabia Insurance Group, to present to you the Annual Report and the consolidated financial statements for the year ending December 31st
2014, along with the necessary illustrations and explanatory analysis.
As we have moved with great confidence into the year 2015, we can safely look back at the year 2014 as the year of exceptional recovery of our technical results, from an unusually bad underwriting year with losses from General Insurance departments of around LBP 0.3 B equivalent to USD 0.2 m in 2013, to a net income from General Insurance departments of around LBP 6.2 B equivalent to USD 4.1 m in 2014.
The main factor behind this transformation was a return to Technical Profitability of the motor lines from a Loss of LBP 3.5 B equivalent to USD 2.3 m in 2013 to a Profit of LBP 2.1 B equivalent to USD 1.4 m in 2014. The Property and General Accident departments also delivered an increase in their net Incomes from LBP 1.7 B equivalent to USD 1.1 m and LBP 1.1 B equivalent to USD 0.7 m respectively in 2013 to LBP 2.6 B equivalent to USD 1.7 m and LBP 3.4 B equivalent to USD 2.2 m respectively in 2014. The medical line continued to underperform, but mainly as a result of claims still flowing from non-renewed loss-producing groups. Accordingly, the Technical Loss of this line amounting to LBP 4.4 B equivalent to USD 2.9 m is expected to improve starting 2015 and onward. Total non-Life Production decreased from LBP 237 B in 2013 equivalent to USD 158 m to LBP 224 B equivalent to USD 149 m in 2014, as a result of the ongoing conservative selectivity of insured risks and more stringent underwriting, which remains a major pillar of our strategy, side by side with our strive to grow our book of business in a profitable way.
On the investments side, the company achieved in 2014 an investment income of LBP 9.8 B equivalent to USD 6.53 m, while the invested assets reached LBP 333 B equivalent to USD 222 m.
I. execuTIVe suMMaRy
RepoRT of THe boaRD of DIRecToRs

17
As mentioned last year, management was fully mobilized to tackle the sources of the previous year 2013 losses and, as promised, the drastic remedial measures it had started to implement reflected positively on the current year 2014, and will hopefully sustain an upward momentum in the subsequent years with the right strategy, the effective and efficient employment of our resources, and synergy among the various business units.
The reinsurance treaty renewals were relatively smooth this year, and reflected a true partnership between Arabia and its reinsurers in light of the large blows that those reinsurers absorbed in the past years from a number of jumbo losses that Arabia had sustained. We continued to subscribe to a Group treaty led by a first class European reinsurer, and covering the eight countries of our operations through the 3 sister companies; AIC-Lebanon, AICJ (Jordan) and AICS (Syria).
In April 2015, A.M. Best has re-affirmed the financial strength rating of B++ (Good) and the issuer credit rating of “bbb+” of Arabia Insurance Company s.a.l. (AIC) (Lebanon). The outlook for both ratings remains stable.
The ratings of AIC reflect its sound risk-adjusted capitalization and well-diversified business profile. A major factor also supportive of this rating was the remedial program which management implemented in 2014 to improve underwriting performance, which included non-renewal of loss-making contracts and the introduction of data-driven pricing tools.
I. execuTIVe suMMaRy
RepoRT of THe boaRD of DIRecToRs

18
The results of our sister companies and their respective insurance markets situation are as follows:
- Arabia Insurance Company - Jordan (AICJ) showed good results, whereby net profits before taxes increased from JD 581 K equivalent to USD 819 K in 2013 to JD 918 K equivalent to USD 1,294 K in 2014. AICJ premiums increased from JD 16 m equivalent to USD 22.6 m in 2013 to JD 17 m equivalent to USD 24.1 in 2014. Ongoing regional disruptions are still expected to impact and slow the growth of the Jordanian insurance industry over the coming few years.
- Arabia Insurance Company - Syria (AICS) continued to stand the test of the ongoing conflict in Syria, and the resultant economic and political situation. Total premiums increased from SyP 471.5 m equivalent to USD 3.3 m in 2013 to SyP 606.2 m equivalent to USD 3.4 m in 2014. Technical profitability decreased from SyP 113.6 m equivalent to USD 802 K in 2013 to SyP 106.7 m equivalent to USD 593 K in 2014.
- Arabia Insurance Cooperative Company-KSA (AICC): A major challenge faced by all insurance companies in the KSA, including AICC, is the highly competitive state of the insurance market, with 37 licensed insurance and reinsurance companies and 76 brokers and 76 insurance agencies. Despite that, the year 2014 was a positive year for AICC witnessing a major shift in its results, recovering from a loss of about SR 102 m equivalent to USD 27 m in 2013 to a profit of about SR 2 m equivalent to USD 533 K in 2014. A new Board of Directors and a new business strategy contributed to this transformation. Total premiums increased by around 10% from SR 586 m equivalent to USD 156 m in 2013 to SR 644 m equivalent to USD 172 m in 2014. It is very important to highlight that the motor and medical lines which were the main sources of underwriting losses in 2013 at deficits of SR 61 m equivalent to USD 16.3 m and SR 9.9 m equivalent to USD 2.6 m respectively, recorded handsome profits this year of SR 12.5 m equivalent to USD 3.3 m and SR 34.3 m equivalent to USD 9.1 m respectively. All the other lines also delivered good technical profits.
I. execuTIVe suMMaRy
RepoRT of THe boaRD of DIRecToRs

19
future outlook
We shall channel our efforts in 2015 and beyond towards consolidating our market position and increasing our bottom-line by continuing to identify and remove the threats to profitability in all lines of business. Fierce competition between insurance players will continue in the middle East insurance market as m&A activities become very likely. The turmoil in Syria and political instability in the region continue to remain a major concern in the short term. Despite these challenging conditions, we shall strive to capture all the opportunities in the areas of our operation, in order to achieve healthy growth and, eventually, attain a return on equity that truly reflects our history and real potential.
A key element in our insurance sales strategy is to break the vicious circle of tightening margins due to the soft market cycle, by targeting more of the personal lines of insurance and small to medium sized enterprises.
We will continue enhancing our online business solutions, and developing our human resources at all levels, always stimulating the culture of “customer centricity” across Arabia.
We are grateful to our CUSTOmERS for their continued support and loyalty, to Arabia Shareholders for their trust in Arabia, and to the board of directors, management and employees for their dedication, hard work and loyalty. Together we shall continue to plan our way forward.
yours sincerely,
Wahbe Abdallah TamariChairman of the Board of Directors
I. execuTIVe suMMaRy
RepoRT of THe boaRD of DIRecToRs

II. InsuRance secToR oVeRVIew
RepoRT of THe boaRD of DIRecToRs

21
1. Insurance Industry
In 2014, the global insurance industry finally emerged from the financial turmoil and economic uncertainty that has been challenging the life and non-life insurers for the last several years. This recovery in the economic activity has and will yield a mild improvement in non-life premium growth, as real (after inflation) premium growth is projected to be 1.4% in the advanced economies and around 8% in the emerging markets. As expected last year, the return on equity level (RoE) for the main non-life insurance markets was around 7% in the financial year 2014, down from 8.4% in the financial year 2013. This was mainly caused by the low investment returns that are continuously affecting profitability, whereby most insurers are still relying on decreased catastrophe losses and reserve releases to keep their profit margins at sustainable levels. However, it goes without saying that this cannot be relied upon forever, whereby an improvement in the underwriting standards is and will be strictly inevitable for a healthy and properly developed non-life insurance industry.
Life real premium growth in the developed markets has reached 4% in 2014, up from 1.5% in 2013, and is expected to be about 3% in 2015. In the emerging markets, life premium growth increased from 4.5% in 2013 to 9% in 2014, and is expected to score 10% in 2015. However, the low investment returns environment poses a greater challenge to the life insurance industry than the non-life, obviously because of the higher dependence of life insurers on investment yields for their profits. This is why life insurers are focusing and have to focus more on new products, increased market penetration, better distribution channels and cost-cutting. This has already started to pay off in new life business growth in major markets, mainly through the increased sales of savings policies, thus improving profitability with the RoE reaching 12%.
II. InsuRance secToR oVeRVIew
RepoRT of THe boaRD of DIRecToRs

22
In the emerging Asian markets, both non-life and life premium growth remained high at more than 12% in 2014, and is expected to grow by 13% in 2015 and 2016. In the emerging Central and Eastern Europe markets, however, premium growth will be low as a result of the slow economic recovery.
In the middle Eastern market, real growth in non-life premiums reached 1.8% in 2014, and is expected to reach 6% in 2015. Life premium growth reached around 9% in 2014, and is expected to reach 10% in 2015. Still, the irrational price competition, soft insurance terms and political instability in the region will remain a major obstacle to the healthy development of the insurance sector in this market.
2014 was a better year than 2013 in terms of natural catastrophic events, where significant insured losses totaled around USD 33 billion, down from USD 45 billion in 2013. Those insured losses were below the ten-year and five-year moving averages of around USD 59 billion and USD 56 billion, respectively. notable natural catastrophe insured losses included the February snowstorms in Japan, winter storms affecting Europe, flooding in the United Kingdom and a cold, stormy weather in the eastern half of north America. The East-Pacific witnessed Hurricane Odile and the West-Pacific was subject to Typhoon Rammasun that affected China, Vietnam and the Philippines. Cyclone Hudhud affected India in October. December witnessed a severe weather outbreak in Brisbane, Australia and severe floods in malaysia and Thailand.
1. Insurance Industry
II. InsuRance secToR oVeRVIew
RepoRT of THe boaRD of DIRecToRs

II. InsuRance secToR oVeRVIew
23
On the other hand, the year 2014 did not fare so well in terms of man-made events. These included the disappearance of malaysian Airlines Flight 370 in march, the loss of malaysian Airlines Flight 17, which was shot down over Ukraine in July, the AirAsia flight that crashed into the sea near Indonesia in December. Added to these were a refinery explosion and fire in Krasnoyarsk territory of Russia, and a militant attack on the Tripoli International Airport in Lybia.
In conclusion, and given the slim profit margins in the global insurance market in general in 2014 and last several previous years, insurers must continue to explore and identify opportunities for top line and bottom line growth, by basically developing a customer-centric culture focused on the distinctive needs and expectations of their clients, be ready to give up loss producing segments and allocate their capital to the more promising lines and markets, and investing in technologies that will enable them have a stronger digital presence, enhance their customer services, and develop a comprehensive enterprise- wide data analytics strategy aiming at appropriate business targeting, better product design, and more effective and efficient management control.
RepoRT of THe boaRD of DIRecToRs
1. Insurance Industry

RepoRT of THe boaRD of DIRecToRs
III. aRabIa opeRaTIons oVeRVIew

Consolidated Operations of Insurance Co. s.a.l, Arabia Insurance Co.-Syria and Arabia Insurance Co. – Jordan (hereinafter referred to as Arabia).
This year, we are pleased to report that Arabia recovered from an underwriting loss in its non-life operations of LBP 292 million in 2013, to an underwriting profitability of LBP 6.2 billion in 2014. This was mainly a result of the return to technical profitability recorded this year in the motor department and amounting to LBP 2.1 billion, up from a loss of LBP 3.5 billion in 2013. This was achieved through the drastic remedial measures taken to restore the positive results of this important line of business to their sustainable levels. The other good news was the increase in the net income of the Property and General Accidents departments as follows: Property from LBP 1.7 billion in 2013 to LBP 2.6 billion in 2014; General Accidents from LBP 1.1 billion in 2013 to LBP 3.4 billion in 2014. The marine department’s profitability declined from LBP 3.6 billion in 2013 to LBP 3.1 billion in 2014, mainly due to the decrease in the marine insurance rates as a result of the unreasonable competition, which naturally led to an organic shrinkage in our marine premiums. medical and Workmen’s Compensation continued to underperform, with losses of LBP 4.4 billion and LBP 0.4 million respectively. However, things will get back on track in respect of those two lines of business starting this year 2015.
25
1. Insurance operations
1.1 non-life Global overview
III. aRabIa opeRaTIons oVeRVIew
RepoRT of THe boaRD of DIRecToRs

26
As mentioned last year, we have swiftly embarked on a comprehensive plan involving all of the key aspects of our business operations. We are relentlessly following a roadmap which aim is threefold: cleaning our portfolio from loss-producing risks, increasing our underwriting bottom-line, and raising our market share in insurance segments and markets where extra profitability is possible and achievable. We shall always concentrate on deriving our net income from our core business which is insurance, whereby net income from investments will naturally always constitute a plus. At the end of the day, our ultimate raison-d’être is to arrive at a respectable Return on Equity, while serving our customer base in the most optimum level. The insurance operations of Arabia remain protected by a Group Reinsurance treaty with preferential terms and underwriting capacities, supported by first class reinsurance securities.
The continuation of the extremely soft market conditions, whether in terms of cut-throat low premium rates, wide uncontrollable terms, or inflow of opportunistic capacity in the countries where Arabia operates, will remain an ever-growing challenge. We are confident that we can overcome those challenges by capitalizing on our long history, distinguished resources and the will to succeed.
1. Insurance operations
1.1 non-life Global overview
III. aRabIa opeRaTIons oVeRVIew
RepoRT of THe boaRD of DIRecToRs

27
year after year, the Life Total Gross Written Premiums sustained their growth and reached in 2014 the amount of LBP 33.59 billion (USD 22.28 million), with a growth of 20.22% over 2013 figures.
The Life production is mainly originated from our Life Sales Consultants who are spread among Units, Agencies and Branches.
Consistently with the previous years, the “Arabia Lifestyle” product, which offers an optimum combination of Protection and Investment, scored the highest share in our production figure, reaching USD 6.10 million (First year Written Premiums), with an increase of 39% over last year figures.
During 2014, the First year Written Premiums of Individual Term Insurance soared by 57% (reaching USD 1.34 million) and the First year Written Premiums of Group Life Insurance increased by 14% (reaching USD 3.80 million).
life Division main goals for 2015:- Enhance the recruitment standards of new producers with increased focus on quality.
- Intensify the training for producers (old and new) in order to increase their level of professionalism, and therefore their production in quantity as well as in quality.
- Onboarding new members to the administration and technical team to optimize its productivity, enabling it to timely process the continuously increasing Life production.
1. Insurance operations
1.2 life Insurance operations
III. aRabIa opeRaTIons oVeRVIew
RepoRT of THe boaRD of DIRecToRs

- Vigorous follow-up on the collection of the renewal premiums, hence conserve our policies, resulting in a direct and positive impact on the company’s bottom line.
- Face Lift our products in terms of type and features, in addition to the re-drafting of the products existing Terms and Conditions in order to simplify their vocabulary, rendering them easily understood by the policyholders, in line with the principle of accurately and transparently dealing with them.
28
1. Insurance operations
1.2 life Insurance operations
Unit-Linked Premiums in Millions of US$
$12.00
$10.00
$8.00
$6.00
$4.00
$2.00
$0.00
$3.58
$4.38
$6.10
$7.75
$8.84
$10.23
2010 2011 2012 2013 2014
First Year Unit-Linked Renewal Unit-Linked
$4.44 $3.77
$8.66
$9.33
III. aRabIa opeRaTIons oVeRVIew
RepoRT of THe boaRD of DIRecToRs

29
1. Insurance operations
1.2 life Insurance operations
Geographical Distribution of Life Written Premiums in 2014
20141st Year Premiums
2014Renewal Premiums
2014Total Premiums
2013Total Premiums
LBP’000 LBP’000 LBP’000 LBP’000% % % %lebanonuaeomanbahrainKuwaitotherTotal
1,645,64611,980,5832,057,955123,229161,524499,625
16,468,562
2,692,37511,176,144
600,12542,935
486,9601,330,856
16,329,395
4,454,77923,722,8932,675,428166,164700,008
1,873,13933,592,411
4,630,61619,005,8411,654,255182,980733,794
1,493,84227,701,328
10%73%12%1%1%3%
100%
16%68%4%0%3%8%
100%
13%71%8%0%2%6%
100%
17%69%6%1%3%5%
100%
Geographical Distribution of Total Written Premiums in 2014
Lebanon
UAE
Oman
Bahrain
Kuwait
Other
71%
8%
13%0%2%6%
III. aRabIa opeRaTIons oVeRVIew
RepoRT of THe boaRD of DIRecToRs

30
1. Insurance operations
1.2 life Insurance operations
Life Production Historical Chart (Total Written Premiums)
2014
2012
2010
2008
2006
2004
2002
2000
0 5 10 15 20 25 30 35 40
3.44
3.86
4.19
5.09
6.16
7.92
9.59
12.06
17.39
18.06
23.68
26.07
26.74
27.94
33.59
III. aRabIa opeRaTIons oVeRVIew
RepoRT of THe boaRD of DIRecToRs

31
1. Insurance operations
1.2 life Insurance operations
Group & Open Policies
32%
Regular Premiums
63%
Additional Premiums
5%
First Year Written Premiums Distribution in 2014
III. aRabIa opeRaTIons oVeRVIew
RepoRT of THe boaRD of DIRecToRs

2. Investment operations
2.1 world economy and financial Market
2014 was a year of challenges for the Treasury & Investment Department, as the interest rates remained at historically low levels, volatility in the equity markets where high, and the regulation of the insurance industry in the Gulf area continued to strengthen, particularly in connection with regulatory reserve requirements.
The global economy saw the leading Asian economies growing strongly and recovery in the U.S. economy accelerating, contrasted with weak growth in the Eurozone.
The US and European stock markets reached new record levels during 2014 after the ECB’s meeting in early June, at which it cut its key lending rate to a record low level of 0.15% and imposed a negative interest rate for deposits with the central bank, but the overall stock markets full-year gains were not as high as in 2013, as fears of a fresh economic setback mounted in December where the markets in Europe in particular were disquieted from Greek problems.
The capital markets were unsettled in July by the crisis in Ukraine and the ensuing EU sanctions against Russia in addition to the flare-up of conflict in the middle East.
As for the currency markets, the divergence in monetary policies between the US and the other major economies caused the dollar to appreciate against all the main currencies – and especially the euro.
32
III. aRabIa opeRaTIons oVeRVIew
RepoRT of THe boaRD of DIRecToRs

2. Investment operations
2.2 Investment operations - General Departments
The value of Arabia invested assets in general insurance departments (excluding Property & Equipment) decreased by LBP 12.5 billion (-4.7%), from LBP 268.0 billion in 2013 to LBP 255.5 billion in 2014. This decrease was due to the drop in market price of our participation in Arabia Insurance Cooperative Company (yoy drop LBP 15.6 billion) and Saudi Enaya (yoy drop LBP 7.1 billion).
meanwhile, the net investment income of the general departments was at LBP 7.65 billion in 2014 versus LBP 9.52 billion in 2013; this decline was mainly due to the shift from term deposits in Lebanon to low yielding term deposits in the Gulf to meet the new regulatory reserve requirements, in addition to the maturity of several high coupon bonds.
33
2014all amounts in LBP’000 2013
cash and banksDue to banksfinancial assets at fair value through profit or lossfinancial assets at fair value through other comprehensive incomefinancial assets at amortized costTotal Invested AssetsInterests on bank depositsInterests and dividend income from investment securitiesnet gain on investment securities at fVTplnet gain/(loss) on disposal of investment securitiesnet foreign exchange lossesTotal Investment Income
159,056,574 (4,813,848)16,001,389 74,464,206 10,797,293
255,505,614 3,964,152 2,623,293 1,422,928 307,235
(670,618)7,646,990
146,386,111 (4,550,036)13,676,662
100,268,178 12,245,311
268,026,226 5,077,918 2,620,491 2,745,382 (58,338)
(861,826)9,523,627
III. aRabIa opeRaTIons oVeRVIew
RepoRT of THe boaRD of DIRecToRs

2. Investment operations
2.3 Investment operations - life
Arabia invested assets of the Life division (excluding Property & Equipment) increased by LBP 10 billion (+14.7%), from LBP 67.6 billion in 2013 to LBP 77.6 billion in 2014. This increase was mainly due to the additions on the unit linked fund assets.
The net investment income of the Life division was at LBP 2.2 billion in 2014 versus LBP 7.4 billion in 2013; this decrease was mainly due to:
- Lower term deposits after the maturity of the 3 years Security & Growth unit linked investment product for the amount of LBP 24 billion in December 2013.
- The outstanding performance of the unit linked funds in 2013 was not repeated in 2014.
34
2014all amounts in LBP’000 2013
cash and banksDue to banksfinancial assets at fair value through profit or lossfinancial assets at fair value through other comprehensive incomefinancial assets at amortized costTotal Invested AssetsInterests on bank depositsInterests and dividend income from investment securitiesnet gain on investment securities at fVTplnet foreign exchange lossesTotal Investment Income
26,991,323 (1,507,500)39,301,614 2,361,224
10,433,905 77,580,566
464,242 1,361,930 437,903
(106,047)2,158,028
21,846,968 (1,507,500)33,867,193 2,893,565
10,534,390 67,634,616 2,022,446 1,321,641 4,041,664
37,850 7,423,601
III. aRabIa opeRaTIons oVeRVIew
RepoRT of THe boaRD of DIRecToRs

35
3. financial Highlights
- FVTOCI investments decreased by around USD 15 million, mainly due to drop in the Group’s investment in AICC and Enaya.
- Reinsurance assets decreased by around USD 11 million, mainly resulting from the drop in general accidents and property reinsurance share of outstanding claims.
- net change in fair value of investments decreased by around USD 14 million, mainly resulting from the Group’s investment in AICC and Enaya.
- 2014 income from general insurance departments went up by around USD 7 million compared to 2013 from a loss of USD 6.7 million to a profit of USD 0.5 million, mainly resulting from better performance of the motor line of business, and drop in the operating expenses.
Total Assets
Total Equity
Net Profit
(usD Million)20142013
354,459380,889
Percentage -7% ↓
(usD Million)
2013 122,5832014 106,724
Percentage -13% ↓
(usD Million)
(6,660)20132014 488
Percentage 107% ↑
- medical & motor production went down by 12% & 4% respectively from 2013 to 2014, mainly due to non-renewing of some accounts in Kuwait and Lebanon.
Gross Written Premiums
(usD Million)
2013 184,0172014 178,778
Percentage -3% ↓
III. aRabIa opeRaTIons oVeRVIew
RepoRT of THe boaRD of DIRecToRs

36
3. financial Highlights
- 2014 net written premiums remained almost the same compared to 2013.
Net Written Premiums(usD Million)
2013 132,8072014 132,318
Percentage 0%
- Solvency ratio decreased from 92% in 2013 to 81% in 2014, as a result of drop in total equity.
- Retention ratio increased in 2014 compared to 2013, mainly in medical and life lines of business.
Underwriting Exposure
92%
72%
2013 2014
81%
74%
Solv
ency
Solv
ency
Rete
ntio
n
Rete
ntio
n - Earnings per share (EPS) went up from USD -0.35 in 2013 to USD 0.03 in 2014.
- Return on average equity (ROE) went up from -4.9% in 2013 to 0.4% in 2014.
Profitability Metrics
20132014
EPS
($0.35)$0.03
ROE
-4.9%0.4%
III. aRabIa opeRaTIons oVeRVIew
RepoRT of THe boaRD of DIRecToRs

37
3. financial Highlights
3.1 non-life
Net Loss ratioGross Loss ratio
Loss Ratio - Non-Life
80.0%
70.0%
60.0%
50.0%
40.0%
30.0%
20.0%
10.0%
0.0%
72.7%
62.3%68.9%
54.0%
2013 2014
III. aRabIa opeRaTIons oVeRVIew
RepoRT of THe boaRD of DIRecToRs
Gross Loss Ratio = Change in Outstanding Claims (gross of reinsurance) + Paid Claims (gross of reinsurance) – Recoveries (gross of reinsurance) / Gross Earned Premiums (gross of reinsurance)
net Loss Ratio = Change in Outstanding Claims (net of reinsurance) + Paid Claims (net of reinsurance)– Recoveries (net of reinsurance) / net Earned Premiums (net of reinsurance)

38
40.0%
35.0%
30.0%
25.0%
20.0%
15.0%
10.0%
5.0%
0.0%
12.8% 12.8%
22.8%21.6%
35.6% 34.4%
20142013
Acquisition ratio G&A ratio
Expense Ratio - Non-Life
III. aRabIa opeRaTIons oVeRVIew
RepoRT of THe boaRD of DIRecToRs
3. financial Highlights
3.1 non-life
Acquisition Ratio = Incurred Commission Expense – Earned Reinsurance Commissions + Other Expenses – Other Income / net Earned Premiums (net of reinsurance)
G&A Ratio = General & Administrative Expenses / net Written Premiums (net of reinsurance)
Expense Ratio = Acquisition Ratio + G&A Ratio

39
Combined Ratio - Non-Life
2014
120.0%
100.0%
80.0%
60.0%
40.0%
20.0%
0.0%
108.3%
34.4%
68.9%
103.3%
Net Loss ratio Expense ratio
2013
35.6%
72.7%
III. aRabIa opeRaTIons oVeRVIew
RepoRT of THe boaRD of DIRecToRs
3. financial Highlights
3.1 non-life
Combined Ratio = net Loss Ratio + Expense Ratio

40
Performance KPI’s - Non-Life120.0%
100.0%
80.0%
60.0%
40.0%
20.0%
0.0%
72.7%
108.3%102.6%
35.6%
68.9%
103.3%98.6%
34.4%
Expense ratio Combined ratio Operating ratioNet Loss ratio
2013 2014
III. aRabIa opeRaTIons oVeRVIew
RepoRT of THe boaRD of DIRecToRs
3. financial Highlights
3.1 non-life
Operating Ratio = Combined Ratio – (Investment Income / net Written Premiums)

41
3. financial Highlights
3.2 life
Acquisition Ratio = Commission Expense – Reinsurance Commissions / net Written Premiums
G&A Ratio = General & Administrative Expenses / net Written Premiums
Expense Ratio = Acquisition Ratio + G&A Ratio
20142013
70.0%
60.0%
50.0%
40.0%
30.0%
20.0%
10.0%
0.0%
59.1% 55.3%
44.7% 40.3%
14.4% 15.0%
Acquisition ratio G&A ratio
Expense Ratio - Life
III. aRabIa opeRaTIons oVeRVIew
RepoRT of THe boaRD of DIRecToRs

42
3. financial Highlights
Benefits Paid & Return on Premiums - Life
60.0%
50.0%
40.0%
30.0%
20.0%
10.0%
0.0%
48.6%
8.6%
13.5%
3.0%
Benefits paid to net insurance premiums
Return on net insurance premiums
Benefits Paid to net Insurance Premiums Ratio = Claims Paid (net of reinsurance) + Change in Insurance Contract Liabilities (net of reinsurance) + Distribution of Profits to Policyholders / net Written Premiums – Premiums Allocated to Insurance Contract Liabilities
Return on net insurance premiums Ratio = net Income / net Written Premiums – Premiums Allocated to Insurance Contract Liabilities
2013 2014
III. aRabIa opeRaTIons oVeRVIew
RepoRT of THe boaRD of DIRecToRs

43
The Human Resources Division strives to provide the highest level of service, and reflects this commitment through focusing on our mission to support Arabia’s vision of being the leading “customer centric” Arab insurer, through professional HR practices.
Our goals (supporting that mission) continue to include:-Working collaboratively with other divisions, departments and branches.
-Recruiting and retaining staff that are best qualified for Arabia’s position.
-Reviewing current and developing new, human resource-related policies and procedures.
-Conducting training for all employees to ensure all staff possess the necessary tools to perform the job.
- Providing excellent service by treating each employee with respect, and recognizing that each concern or question deserves attention.
- Providing excellent HR support that aims at managing the compensation, benefits and logistics in order to meet the demands for an efficient and performing staff.
The Workforce profile as at 31/12/2014:-630 employees (including Life Sales)
-446 employees without Life Sales
4. other Issues
4.1 Human capital update
III. aRabIa opeRaTIons oVeRVIew
RepoRT of THe boaRD of DIRecToRs

44
-184 Life Sales agents
-74% of the employees have a University level education
Recruitment in 2014:-798 CVs were received through Arabia website
-91% was the acceptance rate of Job Offers at the Head Office
-9 internal recruitments
-63 external recruitments
Training in 2014:-28% of employees went through training
-2% of the training was performed abroad
-63% of the training was performed In-house
-36% of the training was local
-4,617 total training hours
4. other Issues
4.1 Human capital update
III. aRabIa opeRaTIons oVeRVIew
RepoRT of THe boaRD of DIRecToRs

45
On the operations side, emphasis was placed on further enhancing Arabia’s sales strategy which calls for promoting a company wide sales driven culture for everyone working with Arabia. This approach involves training the staff on how to be skillful in approaching clients through a disciplined approach.
In preparation for this well-disciplined sales strategy, an elaborate products manual was prepared as a quick guideline to assist all branches in acquiring and growing profitable business.
The manual was comprised of 4P’s (price, place, production, product) approach to reach the needed study and included products by line, by country, place, distribution, commission structure, promotion when needed and price which will pave the way towards the strategy we want.
We revisited the role and functions of Accounts Executives in line with our strategy to become a customer centric company which is responsive to the needs of our customers.
The recruited accounts executives so far for our Lebanon operations are under the direct supervision and guidance of the Sales manager and their main functions is to grow business, retain direct and corporate accounts, be involved in cross selling and up selling of Arabia products to increase sales and revenues, grow business and always ensure client satisfaction, which will be the main target.
4. other Issues
4.2 other operational Highlights
III. aRabIa opeRaTIons oVeRVIew
RepoRT of THe boaRD of DIRecToRs

46
The Operations Division further enhanced the monthly follow up on accounts receivable and collections by preparing a receivable analysis report which provides a comparative summary of accounts receivable key performance indicators detailing the aging of accounts and listing all delinquent accounts which age more than 90 days and which are not in compliance with the credit policy.
The Credit Control Supervisor’s roles are being enhanced and monitored. This would help in identifying deteriorating and non moving accounts in order to take the needed corrective action in a timely manner. We are considering outsourcing independent and specialized firms to expedite the process of collections and delivery of policies.
In line with the new “Agile and Responsive” positioning of the company, Arabia’s corporate image underwent a face lift, and established a new motto: Preserving your lifestyle... Simply.
The outsourced Call Center activities have been improved to secure a superior service to our customers. Clients’ support included follow up on motor Claims in particular, and road assistance, and responding to general queries, as well as completing personal member’s data when possible.
4. other Issues
4.2 other operational Highlights
III. aRabIa opeRaTIons oVeRVIew
RepoRT of THe boaRD of DIRecToRs

III. aRabIa opeRaTIons oVeRVIew
47
year 2014 witnessed the finalization of phase one of Arabia’s e-Commerce portal, (e-Branch), the integrated virtual experience to sell and support insurance over the web interface. e-Arabia is now ready to operate from a client perspective, allowing prospects to simulate, buy and pay online their insurance policies. In the coming phase, the portal will be developed to operate from brokers and agents perspective, including a complete workflow automating claims, renewals, and collections processes.
In Lebanon, Arabia’s Customer Relationship management (CRm) department acted as a hub amongst the different touch points, putting the customer in the center of its operations. CRm has a major role in supporting the Call Center activities securing a swift follow up on client’s requirements. As far as e-Arabia is concerned CRm has a front office role in the portal’s operations.
We are currently improving the Front & Back office experience to increase the clients’ satisfaction when visiting a branch.
4. other Issues
4.2 other operational Highlights
RepoRT of THe boaRD of DIRecToRs

RepoRT of THe boaRD of DIRecToRs
IV. coRpoRaTe GoVeRnance, RIsK & capITal ManaGeMenT

49
“Through its well established and advanced corporate governance structure and effective role of its governing committees and entities, Arabia is committed to keep protecting and increasing the value of the shareholders’ investments, and consolidating its reputation as an insurance company that can be always trusted by clients, employees, governments and other stakeholders.”
board of Directors
The composition, elections, meetings, duties and responsibilities of the Board of Directors are described in the Company’s Corporate Governance Charter and in accordance with the Lebanese law.
The Board of Directors delegated part of its duties to specialized committees. These committees are conducting these duties based on authorities and specific responsibilities defined in each related charter.
The main functions of these specialized committees are:
shares Transfer committeeConsiders and approves the shares transfers, and/or the subscription of the company’s shares.
Investment committeeSets the Company’s investment guidelines, approves the investment policy and supervises its investment in accordance with its risk tolerance and against agreed benchmarks.
audit & compliance committeeEncourages and safeguards the highest standards of professional integrity, financial reporting, corporate governance, compliance to all applicable laws/regulations, conformity to business ethics, and internal control.
1. corporate Governance
IV. coRpoRaTe GoVeRnance, RIsK & capITal ManaGeMenT
RepoRT of THe boaRD of DIRecToRs

50
Risk committeeAssists the Board in fulfilling its oversight responsibilities of the Enterprise Risk management activities. Assesses the adequacy of the management of key internal and external risks, and monitors the Company’s risk profile.
executive & administrative committeeRuns and monitors the whole operations of the Company and ensures internal controls are in place.
asset-liability committeeSets the Company’s asset-liability management policy and supervises the resulting activity involving liquidity management, cash budget and forecasting.
IT steering committeemonitors and reviews IT projects, as well as provides oversight of the deliverable rollout.
business continuity Management committeeReviews the existing BCP and recommends improvements to address elements of continuity planning and restoration of the Company’s essential functions.
anti-fraud committeeAssists the Executive management in continuously developing and monitoring the Company’s Anti-Fraud Program across all functions.
IV. coRpoRaTe GoVeRnance, RIsK & capITal ManaGeMenT
RepoRT of THe boaRD of DIRecToRs
1. corporate Governance

51
“Arabia is expected to maintain a good level of risk-adjusted capitalization in 2015. The ratings reflect the sound risk-adjusted capitalization and well-diversified business profile”. (Excerpt from AM Best Report).
2.1 capital Management
The Group continues to manage its capital on a consolidated basis. Each company within the group has its own rating and capital requirements.
The overall strategy is to meet these requirements and ensure the Group’s ability to continue as a going concern, while maximizing the return through the optimal use of our capital.
processes for Managing capital
The Group’s capital monitoring activity is driven by the strategic objectives and the Board risk appetite statements. Revisions are made in light of changes in the economical and market conditions, and the risk characteristics of operations and underlying assets. The Group’s overall strategy remains unchanged from prior year.
The Group’s capital position to certain risks is being regularly monitored through ALm, stress testing and actuarial assessments. In addition, financial risks are being overseen by the Investment Committee and mitigated by abiding to risk limits defined and stated in the Group Investment policy.
IV. coRpoRaTe GoVeRnance, RIsK & capITal ManaGeMenT
RepoRT of THe boaRD of DIRecToRs
2. Group Risk & capital Management

52
capital adequacy assessment
The Group keeps improving the existing risk models, preparing for the upcoming solvency II capital adequacy and economic capital requirements.
At present, the Group assesses its capital position using a newly developed risk-based capital model. The assessment is made at both the group/entity level, as well as by line of business and by geographical location.
IV. coRpoRaTe GoVeRnance, RIsK & capITal ManaGeMenT
RepoRT of THe boaRD of DIRecToRs
2. Group Risk & capital Management
2.1 capital Management
2014 2013 2012
Gearing RatioSolvency RatioCapital Adequacy Ratio
1.5981%
192%
1.4592%
170%
1.15115%174%
net Liabilities / Total Equity (see note FS34)Total Equity / net Written Premiums*net Required Capital / Total Adjusted Equity**
*net Written Premiums = Technical Premiums + Other Technical Income - Reinsurance share of Technical Premiums + fees.
** net Required Capital (nRC) is computed to support the Group risks associated with the exposure of assets, business, and underwriting to adverse economic and market conditions.
The Group monitors its capital risk position based on widely-used capital ratios:

53
aM best Rating
Rating Results
In April 2015, Am. Best Europe published the rating results of Arabia (AIC) and affirmed the financial strength rating of B++ (Good) and the issuer credit rating of bbb+ (Secure). The outlook of both ratings is stable.
2014 2013 2012
Financial StrengthCredit RatingOutlook for Both Ratings
b++ (Good)bbb+ (secure)
stable
b++ (Good)bbb+ (secure)
stable
b++ (Good)bbb+ (secure)
stable
IV. coRpoRaTe GoVeRnance, RIsK & capITal ManaGeMenT
RepoRT of THe boaRD of DIRecToRs
2. Group Risk & capital Management
2.1 capital Management
2014 aM best opinion (Excerpts from AM. Best Report)
Rating Rationale
“The ratings reflect the sound risk-adjusted capitalisation and well-diversified business profile of Arabia Insurance Company”.
“Although AIC’s location exposes it to significant economic, financial system and political risk, country risk factors are partially mitigated by the company’s level of diversification and business continuity plans”.

54
business profile
“AIC’s good level of geographical diversification offset the risk of business interruption caused by prevailing political unrest in the region. Along with the diversification of revenue, the company’s numerous branches and subsidiaries together with robust contingency plans will help the company to function in spite of adversity”.
Risk Management
“AIC has been developing its risk management framework over recent years, in line with international best practice. A corporate governance framework is well established and is relatively well advanced when compared to many of the company’s regional peers”.
“At present AIC assesses its capital position using a risk-based capital model. The assessment is made at both the group level, as well as by business line division and geographic location”.
capitalization
“AIC is expected to maintain a good level of risk-adjusted capitalisation in 2015. The company’s capital requirements are divided equally between underwriting risks and investment risks”.
IV. coRpoRaTe GoVeRnance, RIsK & capITal ManaGeMenT
RepoRT of THe boaRD of DIRecToRs
2. Group Risk & capital Management
2.1 capital Management

55
liquidity
“AIC’s overall liquidity is adequate, given the significant holdings of cash and deposits. The company’s current liquidity ratio (total investments/[total liabilities - capital and surplus]) is expected to remain within the range of 85% and 90% over the coming two years”.
2.2 Risk Management
Risk Management strategy
The Group recognizes and understands that risk is inherent in seeking business opportunities, in developing and implementing new and original business strategies, and in dealing with local and global enterprises and communities.
While pursuing growth and achieving stakeholder’s needs and expectations, the Group is exposed to a variety of risks including credit, market, liquidity, underwriting, operational, compliance and other risks that require maintaining appropriate risk and control structure and ongoing oversight.
Through a robust enterprise risk management framework and effective Risk Committee role, these risks are identified, assessed, and managed in accordance with the risk appetite of the Group. Our Risk Strategy is embedded in our risk appetite framework defined and approved by the Board of Directors. Risk limits are being closely monitored by the Risk management Department and overseen by the Risk Committee and Chief Executive Officer.
IV. coRpoRaTe GoVeRnance, RIsK & capITal ManaGeMenT
RepoRT of THe boaRD of DIRecToRs
2. Group Risk & capital Management
2.1 capital Management

56
Risk Management Responsibilities
The Board of Directors, as a governing body, oversees the activities of the Group and sets the tone and culture towards effective enterprise risk management.
The Risk Committee (RC), appointed by the Board of Directors, assists in fulfilling the Board’s risk oversight responsibilities and advises the Board on matters related to risk governance, risk policies and risk appetite setting.
The RC monitors the risk profile of the Group as well as oversees the structure and operation of the risk management and control systems.
It also ensures proper adherence to the company’s risk management policies, approves risk limits and assesses the adequacy of internal controls designed to respond and mitigate the risks to an acceptable level.
The Executive & Administrative Committee (EAC), headed by the Chief Executive Officer (CEO), is responsible for implementing sound and transparent risk management activities throughout the Group. The EAC maintains a risk culture where people are accountable by effectively managing risk, sponsors the ERm framework and provides necessary commitment and support to the Risk management Department.
The EAC also ensures that the business owners implement risk management policies in the areas for which they operate.
IV. coRpoRaTe GoVeRnance, RIsK & capITal ManaGeMenT
RepoRT of THe boaRD of DIRecToRs
2. Group Risk & capital Management
2.2 Risk Management

57
IV. coRpoRaTe GoVeRnance, RIsK & capITal ManaGeMenT
RepoRT of THe boaRD of DIRecToRs
The Risk management Department integrates the corporate risk culture, as well as promotes the risk and internal control awareness among all entities and functions within the Group. It maintains and updates the ERm framework, develops risk methodologies as well as advises the Risk Committee on the risk tolerance and risk profile.
Through the application of the Group ERm Framework and Risk metrics, the Risk management Department identifies, measures and reports all types of risks within the Group. The Risk Committee is continuously informed on material risks along with assessment of internal controls and risk management action plans.
2. Group Risk & capital Management
2.2 Risk Management

58
IV. coRpoRaTe GoVeRnance, RIsK & capITal ManaGeMenT
RepoRT of THe boaRD of DIRecToRs
UNDERWRITING RISK
non-life / non-Medical Medical
premium Risk
Reserve Risk
catastrophic Risk
life
OPERATIONAL RISK
people Risk business process Risk
Information Technology Risk
IT system failures Risk
IT system Data security breaches
external events
natural Disaster
Man-Made Disaster
STRATEGIC RISK
business Risk
Governance Risk
Reputational Risk
external environmental Risk
economic Risk
societal Risk
Geopolitical Risk
FINANCIAL RISK
credit Risk
counterparty Default Risk
concentration Risk
Market Risk
equity Risk
Interest Rate Risk
spread Risk
others
asset-liability Management Risk
liquidity Risk
Insolvency Risk
COMPLIANCE RISK
legal Risk
Insurance laws & Regulations
Risk categories
The Group categorizes its risks to distinguish between the different types of risk exposures. The main five risk categories and related sub-categories are:
2. Group Risk & capital Management
2.2 Risk Management

59
Mitigation of Key Risks
underwriting Risk
The underwriting strategy attempts to ensure that the underwritten risks are well diversified in terms of type and amount of risk, industry and geography.
The Group mitigates this risk through underwriting guidelines and authority limits for issuing insurance contracts, as well as through diversification across lines of business and proper reinsurance arrangements.
Pricing benchmarks and formulas by line of business/type/category are set in the respective underwriting manuals, to serve as a guideline for risk commensurate premium quoting. A newly acquired software is used to continuously revise and enhance the pricing strategy.
claims settlement Risk
Clear documented claims settlement guidelines and limits by class of business are communicated to the claims functions.
Periodical reviews are carried out by the Head Office to ensure proper adherence to these guidelines and adequate internal control system.
IV. coRpoRaTe GoVeRnance, RIsK & capITal ManaGeMenT
RepoRT of THe boaRD of DIRecToRs
2. Group Risk & capital Management
2.2 Risk Management

60
Reserving Risk
The reserves are calculated based on substantiated assumptions, methods and assessments. Periodical reviews by internal and external parties are being made to ensure that the reported reserves are reasonable and sufficient.
Reinsurance credit Risk
The Group minimizes its financial exposure arising from large claims by entering into reinsurance agreements that are suitable and adequate for the corresponding business. Reinsurance placements are done with international reinsurers and in alignment with the risk appetite of the Board.
concentration Risk
This is the risk that the total coverage sum insured is aggregated at the level of a single policy, contract, or client and a large loss would be generated in the case that this single contract is hit by a covered event. The Group mitigates this risk and protects its equity through the transfer of catastrophe risks and proper reinsurance arrangements.
IV. coRpoRaTe GoVeRnance, RIsK & capITal ManaGeMenT
RepoRT of THe boaRD of DIRecToRs
2. Group Risk & capital Management
2.2 Risk Management

61
collection credit Risk
The financial loss that the Group could incur as a result of a change in the financial position of a counterparty is being managed through the Group’s credit policy and monitored through periodical analytical reports that highlight any breaches for the credit limits specified in the policy.
Market Risk
The Group closely monitors external market and regulatory developments through the supervision of the Board Investment Committee and Asset-Liability Committee.
The Board Investment Committee sets the guidelines and supervises the investment activities in accordance with the risk tolerance and limits described in the investment policy. The Committee receives periodically risk analysis reports (VaR simulation and risk scoring) and performance updates from our Treasury & Investment Department and seeks to reduce market risks by ensuring a high level of diversification both in its investment portfolio and direct investments.
The Asset-Liability Committee monitors the funding and cash budget and manages the liquidity risk in accordance with the Board risk appetite.
IV. coRpoRaTe GoVeRnance, RIsK & capITal ManaGeMenT
RepoRT of THe boaRD of DIRecToRs
2. Group Risk & capital Management
2.2 Risk Management

62
operational Risk
business continuity Risk
The Group enhanced its understanding of natural hazards, man-made hazards, political risk exposures and other emergency events (system breakdown) that could severely affect the continuity of the operations if they occur.
Through the proper implementation of Arabia’s Business Continuity Plan, and the effective role of the BCm Committee, the Group is insuring that the business in the countries of operations can continue in the event of any unexpected incident.
IV. coRpoRaTe GoVeRnance, RIsK & capITal ManaGeMenT
RepoRT of THe boaRD of DIRecToRs
2. Group Risk & capital Management
2.2 Risk Management

consolIDaTeD fInancIal sTaTeMenT anD auDIToR’s RepoRT

ARABIA INSURANCE COMPANY S.A.L.
CONSOLIDATED FINANCIAL STATEMENTS
AND INDEPENDENT AUDITOR'S REPORT
YEAR ENDED DECEMBER 31, 2014

ARABIA INSURANCE COMPANY S.A.L.
CONSOLIDATED FINANCIAL STATEMENTS AND INDEPENDENT AUDITOR'S REPORT
YEAR ENDED DECEMBER 31, 2014
TABLE OF CONTENTS
Page
Independent Auditor's Report 1-2
Consolidated Financial Statements:
Consolidated Statement of Financial Position 3-4
Consolidated Statement of Profit or Loss 5
Consolidated Statement of Profit or Loss and Other Comprehensive Income 6
Consolidated Statement of Changes in Equity 7
Consolidated Statement of Cash Flows 8
Life Division, Consolidated Statement of Assets and Liabilities -- Appendix I 9
Life Division, Consolidated Statement of Profit or Loss and Other
Comprehensive Income -- Appendix II 10
Life Division, Consolidated Statement of Cash Flows -- Appendix III 11
Notes to the Consolidated Financial Statements 12-79


ARABIA INSURANCE COMPANY S.A.L.
CONSOLIDATED STATEMENT OF FINANCIAL POSITION
FOR THE GENERAL INSURANCE DEPARTMENTS
December 31,
ASSETS Notes 2014 2013
LBP’000 LBP’000
Cash and banks 5 159,056,574 146,386,111
Financial assets at fair value through profit or loss
(“FVTPL”) 6 16,001,389 13,676,662
Insurance receivables, net 7 57,116,711 70,809,425
Due from reinsurers 8 24,168,170 25,975,774
Due from related party company 23 448,900 325,146
Financial assets at fair value through
other comprehensive income (“FVTOCI”) 9 74,464,206 100,268,178
Financial assets at amortized cost 10 10,797,293 12,245,311
Reinsurance assets 20 47,045,462 62,953,057
Deferred acquisition costs 11 13,016,522 15,242,181
Other assets 12 4,534,690 3,533,321
Property and equipment 13 20,118,727 22,957,873
Intangible assets 14 761,293 472,218
Investment property 15 5,098,759 5,203,846
Total Assets 432,628,696 480,049,103
Assets of the Life Division -- Appendix I 99,060,396 91,284,524
Combined Assets of General Insurance
Departments and Life Division 531,689,092 571,333,627
THE ACCOMPANYING NOTES FORM AN INTEGRAL PART OF THE CONSOLIDATED
FINANCIAL STATEMENTS

2
ARABIA INSURANCE COMPANY S.A.L.
CONSOLIDATED STATEMENT OF FINANCIAL POSITION
FOR THE GENERAL INSURANCE DEPARTMENTS
(Continued)
December 31,
LIABILITIES Notes 2014 2013
LBP’000 LBP’000
Due to banks 17 4,813,848 4,550,036
Insurance payables 18 26,313,563 28,688,649
Payables to insurance and reinsurance companies 13,621,431 11,675,848
Income tax payable 19 2,276,034 2,857,186
Due to life division 16 9,907,237 9,588,991
Accrued expenses and other liabilities 19 8,631,175 10,237,662
Provision for outstanding claims 20 118,695,136 133,982,610
Provision for unearned premiums 20 95,839,280 101,528,749
Unearned commission from reinsurers 2,636,576 2,582,120
Provision for employees' end-of-service indemnity 22 6,035,110 5,820,305
Provision for contingencies 22 2,968,992 3,821,724
Deferred tax liability 19 716,719 435,973
Total Liabilities 292,455,101 315,769,853
EQUITY
Share capital 24 51,000,000 51,000,000
Treasury shares 24 ( 6,460,187) ( 6,319,100)
Surplus on sale of treasury shares 24 78,541 78,541
Legal reserve 25 23,884,634 23,619,265
General reserve 19,613,572 19,613,572
Asset revaluation reserve 26 6,887,300 6,887,300
Other restricted reserve 37 3,482,140 -
Foreign currency translation reserve ( 14,810,173) ( 13,372,659)
Cumulative change in fair value of financial assets at FVTOCI 27 16,051,720 36,913,960
Retained earnings 22,841,745 27,287,355
Equity attributable to owners of the parent company 122,569,292 145,708,234
Non-controlling interests 29 17,604,303 18,571,016
Total Equity 140,173,595 164,279,250
Total Liabilities and Equity 432,628,696 480,049,103
Liabilities of the Life Division – Appendix 1 79,148,661 71,689,421
Net Assets of the Life Division – Appendix 1 19,911,735 19,595,103
Total Liabilities and Net Assets of the Life Division - Appendix I 99,060,396 91,284,524
Combined Liabilities and Equity of General Insurance
Departments and Life Division 531,689,092 571,333,627
THE ACCOMPANYING NOTES FORM AN INTEGRAL PART OF THE CONSOLIDATED
FINANCIAL STATEMENTS

3
ARABIA INSURANCE COMPANY S.A.L.
CONSOLIDATED STATEMENT OF PROFIT OR LOSS FOR THE
GENERAL INSURANCE DEPARTMENTS
Year Ended
December 31,
Notes 2014 2013
LBP’000 LBP’000
Net income/(loss) of General Insurance Departments:
Marine 3,100,002 3,574,347
Motor 2,070,457 ( 3,481,451)
Property 2,567,172 1,674,880
General accidents 3,367,572 1,124,851
Workmen's compensation ( 421,138) ( 401,552)
Medical ( 4,437,263) ( 2,394,452)
Reinsurance inwards ( 51,294) ( 388,229)
Net income/(loss) of general insurance departments
(net of allocated general and administrative expenses) 30 6,195,508 ( 291,606)
Provision for credit losses, net 7,8 ( 621,409) ( 4,188,184)
Net income/(loss) of insurance departments
(after provision for credit losses and allocated
general and administrative expenses) 5,574,099 ( 4,479,790)
Income/(loss) from Investments:
Interest on bank deposits 3,964,152 5,077,918
Interest and dividend income from investment securities at FVTOCI 1,376,872 1,230,443
Interest and dividend income from investment securities at amortized cost 781,527 840,434
Interest and dividend income from investment securities at FVTPL 464,894 549,614
Realized gain on investment securities at FVTPL 1,335,030 1,919,035
Unrealized gain on investment securities at FVTPL 6 87,898 826,347
Net gain/(loss) on disposal of investment securities 307,235 ( 58,338)
Net foreign exchange losses ( 670,618) ( 861,826)
Other income 311,198 472,115
Net loss from building ( 39,528) ( 62,254)
Net income from investments 7,918,660 9,933,488
Total income from general insurance departments and investments 13,492,759 5,453,698
General and administrative expenses unallocated to
General Insurance Departments 31 ( 10,890,958) ( 13,740,954)
Provision for contingencies 22 - ( 1,220,089)
Profit/(loss) before tax 2,601,801 ( 9,507,345)
Income tax expense 19 ( 2,509,276) ( 1,955,983)
Profit/(loss) for the year 92,525 ( 11,463,328)
Attributable to:
Owners of the parent company ( 744,976) ( 12,613,946)
Non-controlling interests 29 837,501 1,150,618
92,525 ( 11,463,328)
THE ACCOMPANYING NOTES FORM AN INTEGRAL PART OF THE CONSOLIDATED FINANCIAL
STATEMENTS

4
ARABIA INSURANCE COMPANY S.A.L.
CONSOLIDATED STATEMENT OF PROFIT OR LOSS
AND OTHER COMPREHENSIVE INCOME
FOR THE GENERAL INSURANCE DEPARTMENTS
Year Ended
December 31,
2014 2013
LBP’000 LBP’000
Profit/(loss) for the year 92,525 ( 11,463,328)
Other comprehensive income (“OCI”):
Items that will not be reclassified subsequently to profit or loss:
Net change in fair value of financial assets at FVTOCI – Note 27 ( 20,640,299) ( 11,672,214)
Items that may be reclassified subsequently to profit or loss:
Exchange difference arising from translating foreign subsidiaries ( 2,871,410) ( 11,216,582)
Total other comprehensive loss for the year ( 23,511,709) ( 22,888,796)
Total comprehensive loss for the year ( 23,419,184) ( 34,352,124)
Attributable to:
Owners of the Parent Company ( 22,782,542) ( 29,642,830)
Non-controlling interests ( 636,642) ( 4,709,294)
( 23,419,184) ( 34,352,124)
THE ACCOMPANYING NOTES FORM AN INTEGRAL PART OF THE CONSOLIDATED FINANCIAL
STATEMENTS
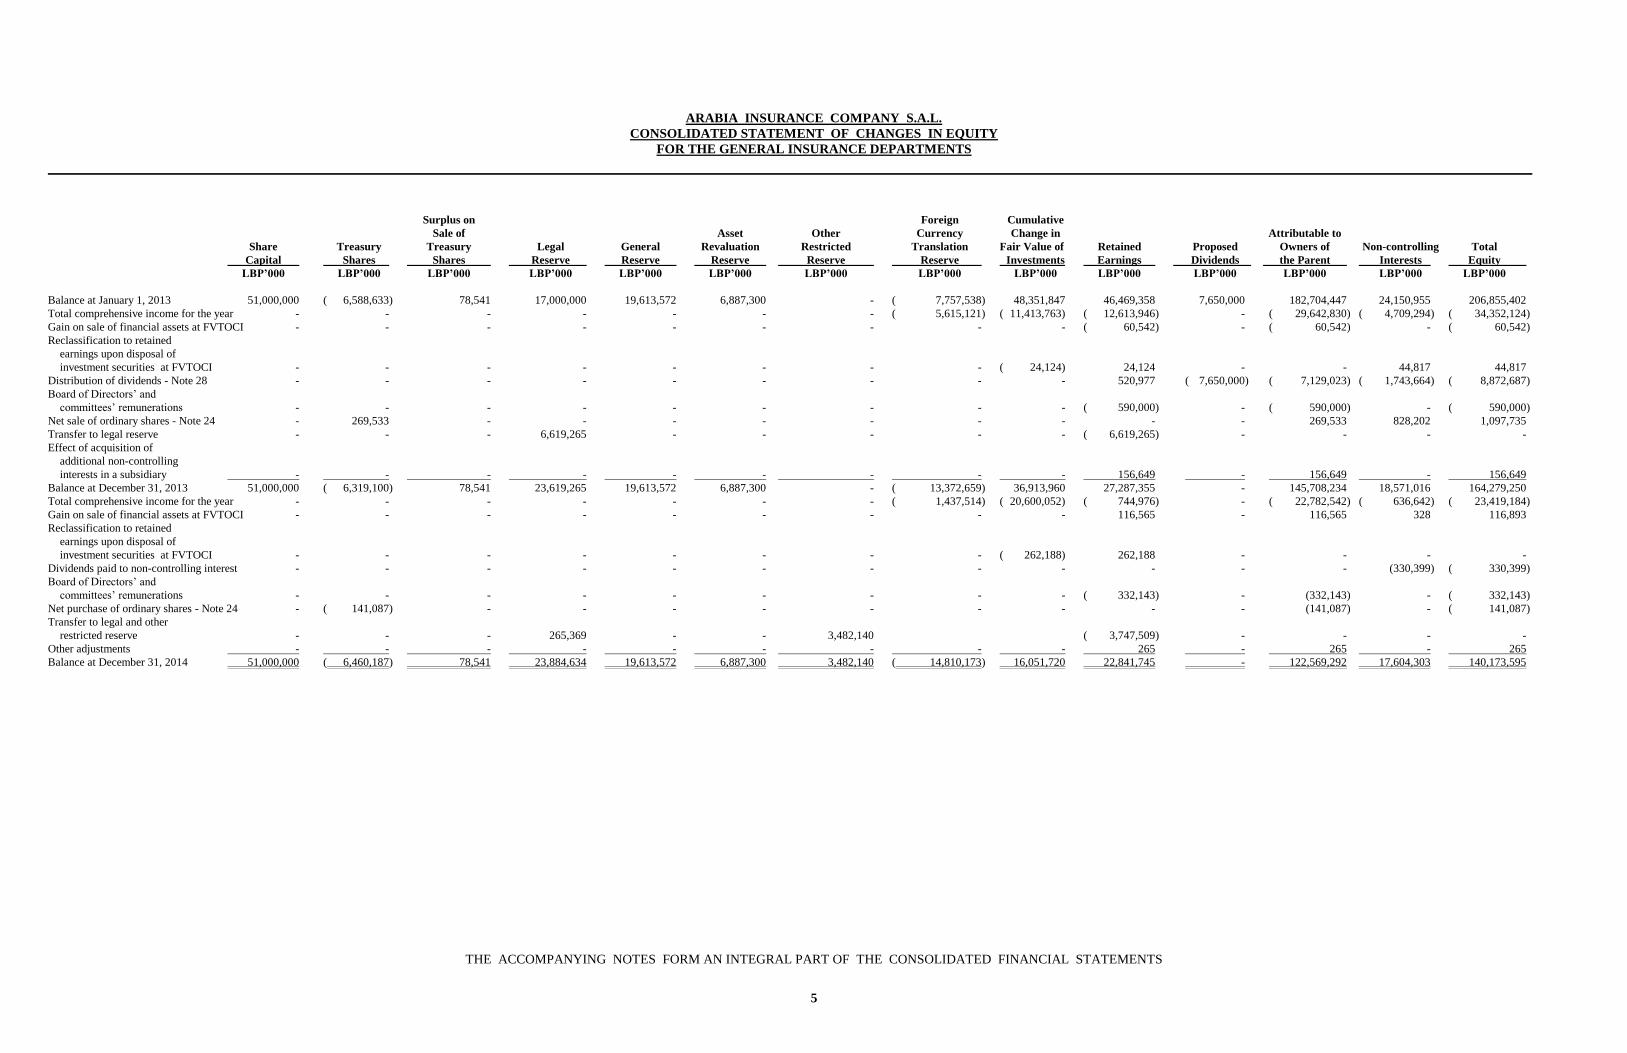
5
ARABIA INSURANCE COMPANY S.A.L.
CONSOLIDATED STATEMENT OF CHANGES IN EQUITY
FOR THE GENERAL INSURANCE DEPARTMENTS
Surplus on Foreign Cumulative
Sale of Asset Other Currency Change in Attributable to
Share Treasury Treasury Legal General Revaluation Restricted Translation Fair Value of Retained Proposed Owners of Non-controlling Total
Capital Shares Shares Reserve Reserve Reserve Reserve Reserve Investments Earnings Dividends the Parent Interests Equity
LBP’000 LBP’000 LBP’000 LBP’000 LBP’000 LBP’000 LBP’000 LBP’000 LBP’000 LBP’000 LBP’000 LBP’000 LBP’000 LBP’000
Balance at January 1, 2013 51,000,000 ( 6,588,633) 78,541 17,000,000 19,613,572 6,887,300 - ( 7,757,538) 48,351,847 46,469,358 7,650,000 182,704,447 24,150,955 206,855,402
Total comprehensive income for the year - - - - - - - ( 5,615,121) ( 11,413,763) ( 12,613,946) - ( 29,642,830) ( 4,709,294) ( 34,352,124)
Gain on sale of financial assets at FVTOCI - - - - - - - - - ( 60,542) - ( 60,542) - ( 60,542)
Reclassification to retained
earnings upon disposal of
investment securities at FVTOCI - - - - - - - - ( 24,124) 24,124 - - 44,817 44,817
Distribution of dividends - Note 28 - - - - - - - - - 520,977 ( 7,650,000) ( 7,129,023) ( 1,743,664) ( 8,872,687)
Board of Directors’ and
committees’ remunerations - - - - - - - - - ( 590,000) - ( 590,000) - ( 590,000)
Net sale of ordinary shares - Note 24 - 269,533 - - - - - - - - - 269,533 828,202 1,097,735
Transfer to legal reserve - - - 6,619,265 - - - - - ( 6,619,265) - - - -
Effect of acquisition of
additional non-controlling
interests in a subsidiary - - - - - - - - - 156,649 - 156,649 - 156,649
Balance at December 31, 2013 51,000,000 ( 6,319,100) 78,541 23,619,265 19,613,572 6,887,300 - ( 13,372,659) 36,913,960 27,287,355 - 145,708,234 18,571,016 164,279,250
Total comprehensive income for the year - - - - - - - ( 1,437,514) ( 20,600,052) ( 744,976) - ( 22,782,542) ( 636,642) ( 23,419,184)
Gain on sale of financial assets at FVTOCI - - - - - - - - - 116,565 - 116,565 328 116,893
Reclassification to retained
earnings upon disposal of
investment securities at FVTOCI - - - - - - - - ( 262,188) 262,188 - - - -
Dividends paid to non-controlling interest - - - - - - - - - - - - (330,399) ( 330,399)
Board of Directors’ and
committees’ remunerations - - - - - - - - - ( 332,143) - (332,143) - ( 332,143)
Net purchase of ordinary shares - Note 24 - ( 141,087) - - - - - - - - - (141,087) - ( 141,087)
Transfer to legal and other
restricted reserve - - - 265,369 - - 3,482,140 ( 3,747,509) - - - -
Other adjustments - - - - - - - - - 265 - 265 - 265
Balance at December 31, 2014 51,000,000 ( 6,460,187) 78,541 23,884,634 19,613,572 6,887,300 3,482,140 ( 14,810,173) 16,051,720 22,841,745 - 122,569,292 17,604,303 140,173,595
THE ACCOMPANYING NOTES FORM AN INTEGRAL PART OF THE CONSOLIDATED FINANCIAL STATEMENTS

6
ARABIA INSURANCE COMPANY S.A.L.
CONSOLIDATED STATEMENT OF CASH FLOWS
FOR THE GENERAL INSURANCE DEPARTMENTS
Year Ended December 31,
Notes 2014 2013
LBP’000 LBP’000
Cash Flows from operating activities:
Profit/loss for the year 92,525 ( 11,463,328)
Adjustments for:
Interest income on bank deposits ( 3,964,152) ( 5,077,918)
Income tax expense 2,509,276 1,955,983
Depreciation of property and equipment 13 1,119,649 913,501
Amortization of intangible assets 14 230,021 218,111
Depreciation of investment properties 15 94,594 18,594
Provision for employees' end-of-service indemnity 22 766,523 809,562
Provision for contingencies 22 - 1,220,089
Provision for credit losses 7&8 621,409 4,188,184
Net change in foreign currency translation reserve ( 921,950) ( 5,503,831)
Net change in fair value of financial assets at FVTPL 6 ( 53,944) ( 769,316)
Net change in fair value of derivative liabilities 19 293,155 ( 671,052)
Net change in deferred acquisition costs 11 2,225,659 2,590,670
Net change in reinsurance assets 15,907,595 7,593,531
Net change in provision for unearned premiums ( 5,689,469) ( 12,668,198)
Net change in provision for outstanding claims ( 15,287,474) 8,937,106
Net change in unearned commission from reinsurers 54,456 ( 202,534)
( 2,002,127) ( 7,910,846)
Decrease in insurance receivables 12,866,953 3,286,637
Decrease/(increase) in due from reinsurers 2,011,956 ( 8,751,990)
(Increase)/decrease in other assets ( 1,001,369) 1,787,939
(Decrease)/increase in insurance payables ( 2,375,086) 3,843,000
Increase/(decrease) in payables to insurance and reinsurance companies 1,945,583 ( 4,546,755)
(Decrease)/increase in accrued expenses and other liabilities ( 1,606,487) 1,077,715
Settlement of provision for contingencies 22 ( 852,732) -
Settlement of provision for employees’ end-of-service indemnity 22 ( 551,718) ( 349,227)
Income tax paid ( 2,809,682) ( 2,451,798)
Net cash generated by/(used in) operating activities 5,625,291 ( 14,015,325)
Cash flows from investing activities:
Interest received from bank deposits 4,145,229 5,739,898
Decrease/(increase) in investment securities 4,166,056 ( 1,566,193)
(Increase)/decrease in bank term deposits 5 ( 19,571,644) 25,794,811
Net increase in property and equipment 13 ( 513,889) ( 11,236,594)
Net increase in intangible assets 14 ( 235,170) -
Decrease in investment properties 15 10,493 9,655
Net cash (used in)/generated by investing activities ( 11,998,925) 18,741,577
Cash flows from financing activities:
Increase/(decrease) in due to banks 263,812 ( 32,551)
Net change in balance with the life division 193,082 7,604,105
Decrease in due to related company - ( 7,308,312)
Net (purchase)/sale of ordinary shares 24 ( 141,087) 1,254,384
Other changes to retained earnings 265 -
Dividends paid to owners of the Parent Company 28 - ( 7,129,023)
Dividends paid to non-controlling interests ( 330,399) ( 1,743,664)
Settlement of board of directors' and committees' remunerations ( 332,143) ( 590,000)
Net cash used in financing activities ( 346,470) ( 7,945,061)
Net decrease in cash and cash equivalents ( 6,720,104) ( 3,218,809)
Cash and cash equivalents at beginning of year 73,691,834 76,910,643
Cash and cash equivalents at end of year 5 66,971,730 73,691,834
THE ACCOMPANYING NOTES FORM AN INTEGRAL PART OF THE CONSOLIDATED FINANCIAL
STATEMENTS

7
ARABIA INSURANCE COMPANY S.A.L.
LIFE DIVISION
CONSOLIDATED STATEMENT OF ASSETS AND LIABILITIES
(APPENDIX I)
December 31,
ASSETS Notes 2014 2013
LBP’000 LBP’000
Cash at banks 5 26,991,323 21,846,968
Financial assets at FVTPL 6 39,301,614 33,867,193
Insurance and other receivables 7 5,884,298 6,690,636
Reinsurance receivables 8 82,396 118,423
Due from general insurance departments 16 9,907,237 9,588,991
Prepaid expenses and other assets 679,755 457,860
Financial assets at FVTOCI 9 2,361,224 2,893,565
Financial assets at amortized cost 10 10,433,905 10,534,390
Reinsurance assets 21 2,629,487 4,461,567
Furniture and equipment 13 559,978 624,519
Intangible assets 14 229,179 200,412
Total assets 99,060,396 91,284,524
LIABILITIES
Due to banks 17 1,507,500 1,507,500
Insurance payable 3,150,703 2,445,069
Income taxe payable 226,690 259,839
Accrued expenses and other credit balances 19 5,781,299 4,933,386
Life insurance contract liabilities 21 67,933,997 62,104,402
Provision for employees’ end-of-service indemnity 22 548,472 439,225
Total liabilities 79,148,661 71,689,421 NET ASSETS
Reserve for asset revaluation surplus 285,723 285,723
Cumulative change in fair value of
financial assets at FVTOCI 27 1,166,626 1,684,608
Other restricted reserve 37 213,320 186,927
Retained earnings 17,532,844 16,825,233
Net assets attributable to owners of the life division 19,198,513 18,982,491
Non-controlling interests 29 713,222 612,612
Net assets 19,911,735 19,595,103
Total liabilities and net assets 99,060,396 91,284,524
THE ACCOMPANYING NOTES FORM AN INTEGRAL PART OF THE CONSOLIDATED FINANCIAL
STATEMENTS

8
ARABIA INSURANCE COMPANY S.A.L.
LIFE DIVISION
CONSOLIDATED STATEMENT OF PROFIT OR LOSS
AND OTHER COMPREHENSIVE INCOME (APPENDIX II)
Year Ended
December 31,
Notes 2014 2013
LBP’000 LBP’000
Income:
Written premiums 36,764,867 31,683,452
Premiums allocated to insurance contract liabilities 21 ( 8,600,311) ( 7,907,029)
Insurance premiums 28,164,556 23,776,423
Reinsurers’ share of insurance premiums ( 6,561,044) ( 6,556,520)
Net insurance premiums 21,603,512 17,219,903
Fee and commission insurance income 956,886 915,180
Net insurance income 22,560,398 18,135,083
Income from investment securities 1,361,930 1,354,117
Interest income from loans on policies 13,010 15,327
Interest income from deposits with banks 5 464,242 2,022,446
Net change in fair value of financial assets at FVTPL 6 437,903 4,009,188
Other income 176,484 84,006
Total income 25,013,967 25,620,167
Expenses:
Claims paid ( 8,529,282) ( 5,723,842)
Reinsurers' share of claims paid 5,635,354 3,398,702
Change in insurance contract liabilities 21 ( 1,857,416) ( 6,893,371)
Reinsurers' share of change in insurance contract liabilities 21 ( 1,832,080) 1,931,826
Distribution of profits to policyholders - ( 1,077,755)
Fees, commissions and other acquisition expenses ( 5,491,059) ( 4,524,633)
Other operating and administrative expenses 31 ( 9,966,153) ( 9,027,534)
Contribution to head quarters’ overheads 31 ( 2,200,000) ( 2,200,000)
Net foreign exchange (losses)/gains ( 106,047) 37,850
Income tax expense ( 27,946) ( 68,174)
Total expenses ( 24,374,629) ( 24,146,931)
Profit for the year 639,338 1,473,236
Attributable to:
Owners of the life division 538,728 1,353,130
Non-controlling interests 29 100,610 120,106
639,338 1,473,236
THE ACCOMPANYING NOTES FORM AN INTEGRAL PART OF THE CONSOLIDATED FINANCIAL
STATEMENTS

9
ARABIA INSURANCE COMPANY S.A.L.
LIFE DIVISION
CONSOLIDATED STATEMENT OF CASH FLOWS
(APPENDIX III)
Year Ended
December 31,
Notes 2014 2013
LBP’000 LBP’000
Cash flows from operating activities:
Profit for the year 639,338 1,473,236
Income tax expense 27,946 87,754
Depreciation 31 109,147 110,025
Amortization of computer software 31 35,717 13,048
Provision for employees' end-of-service indemnity 22 129,901 163,009
Net change in fair value of financial assets at FVTPL 6 ( 437,903) ( 4,009,188)
Interest income from deposits with banks ( 464,242) ( 2,022,446)
Amortization of financial assets at amortized cost 10 14,727 7,329
Net change in reinsurance assets 1,832,080 ( 1,931,826)
Net change in insurance contract liabilities 21 1,857,416 6,893,371
3,744,127 784,312
Net change in financial assets at FVTPL ( 5,003,497) 21,707,579
Decrease/(increase) in insurance and other receivables 806,338 ( 333,902)
Decrease/(increase) in reinsurance receivables 36,027 ( 33,829)
Increase in prepaid expenses and other assets ( 221,895) ( 26,551)
Increase/(decrease) in insurance and other payables 705,634 ( 324,461)
Increase in accrued expenses and other credit balances 847,913 1,184,568
Increase/(decrease) in life insurance contract liabilities 3,972,179 ( 21,530,113)
Settlements of provision for employees' end of service indemnity 22 ( 20,654) ( 28,990)
Taxes paid ( 82,792) ( 51,641)
Net cash generated by operating activities 4,783,380 1,346,972
Cash flows from investing activities:
Net change in investment securities 317,114 ( 1,502,688)
Increase in bank term deposits ( 6,093,711) ( 2,469,899)
Increase in intangible assets ( 64,484) ( 59,056)
Net increase in furniture and equipment ( 44,606) ( 97,467)
Interest received 413,677 2,032,816
Net cash used in investing activities ( 5,472,010) ( 2,096,294)
Cash flows from financing activities:
Increase in due from general insurance departments ( 316,836) ( 7,929,251)
Net cash used in financing activities ( 316,836) ( 7,929,251)
Net decrease in cash and cash equivalents ( 1,005,466) ( 8,678,573)
Cash and cash equivalents at beginning of year 8,276,387 16,954,960
Cash and cash equivalents at end of year 7,270,921 8,276,387
THE ACCOMPANYING NOTES FORM AN INTEGRAL PART OF THE CONSOLIDATED FINANCIAL
STATEMENTS

10
ARABIA INSURANCE COMPANY S.A.L.
NOTES TO THE CONSOLIDATED FINANCIAL STATEMENTS
YEAR ENDED DECEMBER 31, 2014
1. GENERAL INFORMATION
Arabia Insurance Company S.A.L. (the “Parent Company”) was incorporated in 1944 registered in the
Commercial Register in Beirut under No.1889, and is subject to Lebanese laws governing joint-stock
companies and insurance companies.
The Parent Company is owned to the extent of 36.79% by Arab Bank PLC.
The main objective of the Group is to carry out direct insurance and reinsurance operations in addition
to short and long term placements and investments. The Company’s headquarters are located at
Arabia House, Ein El Mreisseh, Beirut, Lebanon.
The operations network of the Group is spread over the following areas:
Nº.
Country of Branches
1. Lebanon - Headquarters 5
2. United Arab Emirates (branch) 4
3. Sultanate of Oman (branch) 2
4. Bahrain (branch) 1
5. Kuwait (branch) 1
6. Qatar (branch) 1
7. Jordan (subsidiary) 2
8. Syria (subsidiary) 6
22

11
2. NEW AND REVISED INTERNATIONAL FINANCIAL REPORTING STANDARDS (IFRSs)
2.1 Application of New and Revised International Financial Reporting Standards (IFRSs)
In the current year, the Group has applied the following new and revised Standards issued by the
International Accounting Standards Board (IASB) that are mandatorily effective with a date of initial
application of January 1, 2014 and that are applicable to the Group:
Amendments to IFRS 10, IFRS 12, and IAS 27 Investment Entities;
The amendments to IFRS 10 define an investment entity and require a reporting entity that meets the
definition of an investment entity not to consolidate its subsidiaries but instead measure its
subsidiaries at fair value through profit or loss in its consolidated and separate financial statements.
To qualify as an investment entity, a reporting entity is required to:
Obtain funds from one or more investors for the purpose of providing them with investment
management services;
Commit to its investor(s) that its business purpose is to invest funds solely for returns from
capital appreciation, investment income, or both; and
Measure and evaluate performance of substantially all of its investments on a fair value basis.
Consequential amendments have been made to IFRS 12 and IAS 27 to introduce new disclosure
requirements for investment entities. The amendments require retrospective application.
Amendments to IAS32 Offsetting Financial Assets and Financial Liabilities
The amendments to IAS 32 clarify the requirements relating to the offset of financial assets and
financial liabilities. Specifically, the amendments clarify the meaning of “currently has a legally
enforceable right to set-off” and “simultaneous realization and settlement”. The amendments require
retrospective application.
Amendments to IAS36 Recoverable Amount Disclosures for Non-Financial Assets
The amendments to IAS 36 remove the requirement to disclose the recoverable amount of a cash-
generating unit (CGU) to which goodwill or other intangible assets with definite useful lives had been
allocated when there has been no impairment or reversal of impairment of the related CGU.
Furthermore, the amendments introduce additional disclosure requirements applicable to when the
recoverable amount of an asset or a CGU is measured at fair value less costs of disposal. These new
disclosures include the fair value hierarchy, key assumptions and valuation techniques used which are
in line with the disclosure required by IFRS 13 Fair Value Measurements. The amendments require
retrospective application. Amendments to IAS 39 Novation of Derivatives and Continuation of Hedge Accounting The amendments provide relief from the requirement to discontinue hedge accounting when a derivative designated as a hedging instrument is novated under certain circumstances. The amendments also clarify that any change to the fair value of the derivative designated as a hedging instrument arising from the novation should be included in the assessment and measurement of hedge effectiveness. The amendments require retrospective application.

12
IFRIC 21 Levies IFRIC 21 addresses the issue as to when to recognize a liability to pay a levy imposed by a government. The interpretation defines a levy, and specifies that the obligating event that gives rise to the liability is the activity that triggers the payment of the levy, as identified by legislation. The application of the above new and revised Standards did not have a material impact on the disclosures and amounts reported for the current and prior years, but may affect the accounting for future transactions or arrangements.
2.2 New and revised IFRSs in issue but not yet effective
The Group has not applied the following new and revised IFRSs that have been issued but not yet
effective:
Effective for annual periods
beginning on or after
------------------------------------------------------------------
Annual Improvements to IFRSs 2010-2012 Cycle that
include amendments to IFRS 2, IFRS 3, IFRS 8, IFRS 13,
IAS 16, IAS 38 and IAS 24.
Annual Improvements to IFRSs 2011-2013 Cycle
that include amendments to IFRS 1, IFRS 3, IFRS 13
and IAS 40.
Amendments to IAS 19 Employee Benefits clarify
the requirements that relate to how contributions from
employees of third parties that are linked to service
should be attributed to periods of service. In addition,
the amendments permit a practical expedient if the
amount of the contributions is independent of the
number of years of service, in that contributions, can,
but are not required, to be recognized as a reduction in
the service cost in the period in which the related
service is rendered.
IFRS 15 Revenue from Contracts with Customers-
establishes a single comprehensive model for entities
to use in accounting for revenue arising from contracts
with customers. IFRS 15 will supersede the current
revenue recognition guidance including IAS 18
Revenue, IAS 11 Construction Contracts and the
related interpretations when it becomes effective. The
core principle of IFRS 15 is that an entity should
recognize revenue to depict the transfer of promised
goods or services to customers in an amount that
reflects the consideration to which the entity expects to
be entitled in exchange for those goods and services.
1 July 2014
1 July 2014
1 July 2014
1 January 2017

13
Amendments to IFRS 11 Accounting for Acquisitions
of Interests in Joint Operations – provide guidance
on how to account for the acquisition of a joint
operation that constitutes a business as defined under
IFRS 3 Business Combinations.
Amendments to IAS 16 and IAS 38 Classification of
Acceptable Methods of Depreciation and
Amortization – Amendments to IAS 16 prohibit
entities from using a revenue-based depreciation
method for items of property, plant and equipment.
The amendments to IAS 38 introduce rebuttable
presumption that revenue is not an appropriate basis
for amortization of an intangible asset.
Amendments to IAS 27 Separate Financial
Statements permit investments in subsidiaries, joint
ventures and associates to be optionally accounted
for using the equity method of accounting in separate
financial statements.
Amendments to IFRS 10 and IAS 28 Sale or
Contribution of Assets between an Investor and its
Associate or Joint Venture clarify the treatment of
the sale or contribution of assets from an investor to
its associate or joint venture to (i) require full
recognition in the investor’s financial statements of
gains and losses arising on the sale or contribution of
assets that constitute a business (as defined in IFRS 3
Business Combinations), (ii) require the partial
recognition of gains and losses where the assets do
not constitute a business; i.e. a gain or loss is
recognized only to the extent of the unrelated
investors’ interests in that associate or joint venture.
These requirements apply regardless of the legal
form of the transaction, e.g. whether the sale or
contribution of assets occurs by an investor
transferring shares in a subsidiary that holds the
assets (resulting in loss of control of the subsidiary),
or by a direct sale of the assets themselves.
Amendments to IAS 1 Presentation of Financial
Statements address perceived impediments to
prepares of financial statements exercising their
judgment in presenting the financial reports.
1 January 2016
1 January 2016
1 January 2016
1 January 2016
1 January 2016
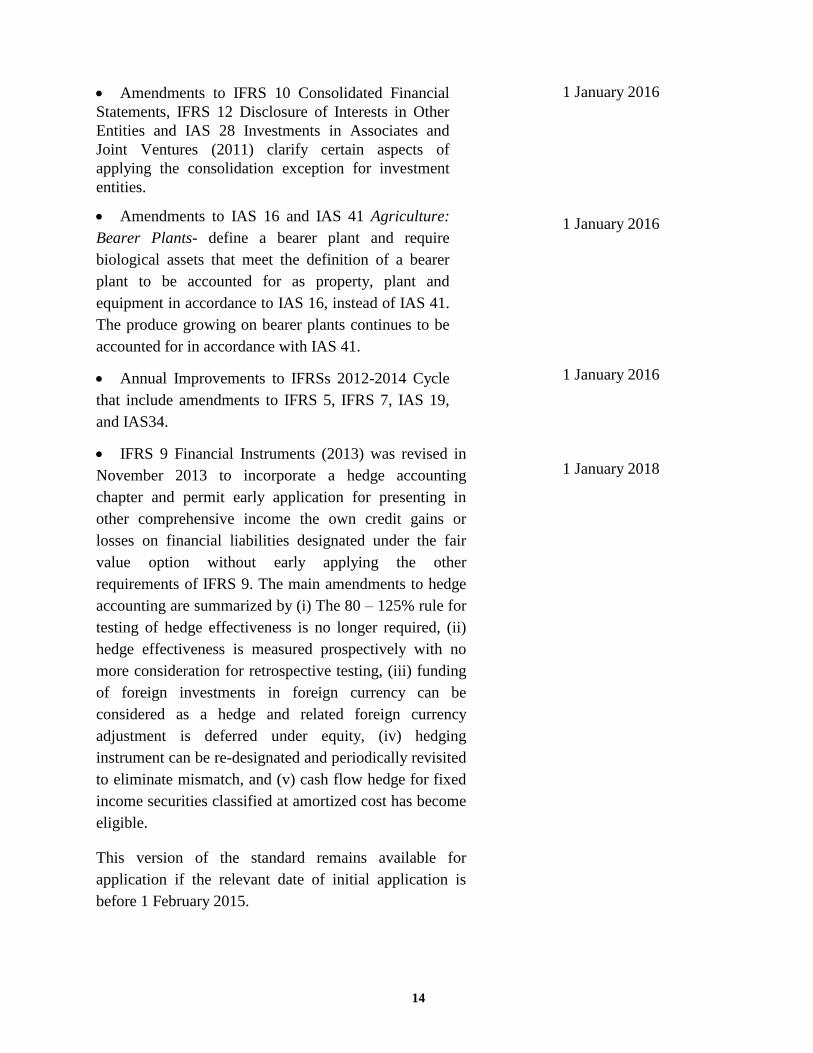
14
Amendments to IFRS 10 Consolidated Financial
Statements, IFRS 12 Disclosure of Interests in Other
Entities and IAS 28 Investments in Associates and
Joint Ventures (2011) clarify certain aspects of
applying the consolidation exception for investment
entities.
Amendments to IAS 16 and IAS 41 Agriculture:
Bearer Plants- define a bearer plant and require
biological assets that meet the definition of a bearer
plant to be accounted for as property, plant and
equipment in accordance to IAS 16, instead of IAS 41.
The produce growing on bearer plants continues to be
accounted for in accordance with IAS 41.
Annual Improvements to IFRSs 2012-2014 Cycle
that include amendments to IFRS 5, IFRS 7, IAS 19,
and IAS34.
IFRS 9 Financial Instruments (2013) was revised in
November 2013 to incorporate a hedge accounting
chapter and permit early application for presenting in
other comprehensive income the own credit gains or
losses on financial liabilities designated under the fair
value option without early applying the other
requirements of IFRS 9. The main amendments to hedge
accounting are summarized by (i) The 80 – 125% rule for
testing of hedge effectiveness is no longer required, (ii)
hedge effectiveness is measured prospectively with no
more consideration for retrospective testing, (iii) funding
of foreign investments in foreign currency can be
considered as a hedge and related foreign currency
adjustment is deferred under equity, (iv) hedging
instrument can be re-designated and periodically revisited
to eliminate mismatch, and (v) cash flow hedge for fixed
income securities classified at amortized cost has become
eligible.
This version of the standard remains available for
application if the relevant date of initial application is
before 1 February 2015.
1 January 2016
1 January 2016
1 January 2016
1 January 2018

15
The final version of IFRS 9 Financial Instruments (2014)
was issued in July 2014 to replace IAS 39: Financial
Instruments: Recognition and Measurement. IFRS 9
(2014) incorporates requirements for classification and
measurement, impairment, general hedge accounting and
derecognition. The final version of IFRS 9 introduces a)
new classification for debt instruments that are held to
collect contractual cash flows with ability to sell, and
related measurement requirement consists of “fair value
through other comprehensive income (FVTOCI), and b)
impairment of financial assets applying expected loss
model through 3 phases, starting by 12 month expected
impairment loss to be initiated on initial recognition of
the credit exposure, and life time impairment loss to be
recognized upon significant increase in credit risk prior to
the date the credit exposure is being impaired, and phase
3 when the loan is effectively impaired. On phase 1 and 2
income from time value is recognized on the gross
amount of the credit exposure and in phase 3 income is
recognized on the net exposure.
The Directors do not anticipate that the application of these amendments will have a significant effect
on the Group’s consolidated financial statements.
3. SIGNIFICANT ACCOUNTING POLICIES
Statement of Compliance:
The consolidated financial statements have been prepared in accordance with International Financial
Reporting Standards (IFRSs).
Basis of Preparation
The consolidated financial statements have been prepared on the historical cost basis except for the
following measured at fair value:
- Financial instruments designated at fair value through profit or loss.
- Investments in equities.
- Other financial assets not held in a business model whose objective is to hold assets to collect
contractual cash flows or whose contractual terms do not give rise solely to payments of
principal and interest.
- Derivative financial instruments measured at fair value.

16
Assets and liabilities are grouped according to their nature and are presented in an approximate order
that reflects their relative liquidity.
The principal accounting policies applied are set out below:
A. Basis of Consolidation:
The consolidated financial statements of Arabia Insurance Company S.A.L. incorporate the financial
statements of the Parent Company and enterprises controlled by the Parent Company (its subsidiaries).
Control is achieved when the Group:
has power over the investee;
is exposed, or has rights, to variable returns from its involvement with the investee; and
has the ability to use its power to affect its returns.
The Group reassesses whether or not it controls an investee if facts and circumstances indicate that
there are changes to one or more of the three elements of control listed above.
When the Group has less than a majority of the voting rights of an investee, it has power over the
investee when the voting rights are sufficient to give it the practical ability to direct the relevant
activities of the investee unilaterally. The Group considers all relevant facts and circumstances in
assessing whether or not the Group’s voting rights in an investee are sufficient to give it power,
including:
the size of the Group’s holding of voting rights relative to the size and dispersion of holdings of
the other vote holders;
potential voting rights held by the Group, other vote holders or other parties;
rights arising from other contractual arrangements; and
any additional facts and circumstances that indicate that the Group has, or does not have, the
current ability to direct the relevant activities at the time that decisions need to be made, including
voting patterns at previous shareholders’ meetings.
Consolidation of a subsidiary begins when the Group obtains control over the subsidiary and ceases
when the Group loses control of the subsidiary. Income and expenses of a subsidiary acquired or
disposed of during the year are included in the statement of profit or loss and other comprehensive
income from the date the Group gains control until the date the Group ceases to control the subsidiary.
Non-controlling interest represent the portion of profit or loss and net assets of subsidiaries not owned
directly or indirectly by the Group. Profit or loss and each component of other comprehensive income
(OCI) are attributed to the equity holders of the Group and to the non-controlling interests, even if this
results in the non-controlling interests having a deficit balance.
When necessary, adjustments are made to the financial statements of subsidiaries to bring their
accounting policies into line with the Group’s accounting policies.

17
All intra-group assets and liabilities, equity, income, expenses and cash flows relating to transactions
between members of the Group are eliminated in full on consolidation.
A change in the ownership interest of a subsidiary, without a loss of control, is accounted for as an
equity transaction. If the Group loses control over a subsidiary, it:
Derecognizes the assets (including goodwill) and liabilities of the subsidiary;
Derecognizes the carrying amount of any non-controlling interests;
Derecognizes the cumulative translation differences recorded in equity;
Recognizes the fair value of the consideration received;
Recognizes the fair value of any investment retained;
Recognizes any surplus or deficit in profit or loss; and
Reclassifies the parent’s share of components previously recognized in OCI to profit or loss or
retained earnings, as appropriate, as would be required if the Group had directly disposed of the
related assets or liabilities.
The consolidated subsidiaries consist of:
Legal Percentage
Location of Ownership
Name of Company of Company 2014 2013 Activities
% %
Arabia S.A.L. (Holding) Lebanon 100 100 Investment vehicle
Arabia Insurance International B.S.C. Bahrain 100 100 Service Company (Offshore)
UPI (Services) Limited Cyprus 100 100 Service Company (Offshore)
Arabia Insurance Company – Jordan Jordan 51.44 51.44 Direct insurance operations
Arabia Insurance Company – Syria Syria 50.06 50.06 Direct insurance operations
Al-Mashriq Financial
Investments Co. S.A.L. Lebanon 89.05 89.05 Investment Company
Arabia Insurance Brokers S.A.R.L. Lebanon 100 100 Insurance brokerage – Dormant
Lawrence S.A.L (Holding) Lebanon 100 100 Holding Company
B. Business Combinations:
Acquisitions of businesses are accounted for using the acquisition method. The consideration
transferred in a business combination is measured at fair value, which is calculated as the sum of the
acquisition-date fair values of the assets transferred by the Group, liabilities incurred by the Group to
the former owners of the acquiree and the equity interests issued by the Group in exchange for control
of the acquiree. Acquisition-related costs other than those associated with the issue of debt or equity
securities are generally recognized in profit or loss as incurred.
The consideration transferred does not include amounts related to the settlement of pre-existing
relationships. Such amounts are generally recognized in profit or loss.

18
Goodwill is measured as the excess of the sum of the consideration transferred, the amount of any
non-controlling interests in the acquiree, and the fair value of the acquirer's previously held equity
interest in the acquiree (if any) over the net of the acquisition-date amounts of the identifiable assets
acquired and the liabilities assumed. When the excess is negative, a bargain purchase gain is
recognized immediately in profit or loss.
Non-controlling interests that are present ownership interests and entitle their holders to a
proportionate share of the entity's net assets in the event of liquidation may be initially measured either
at fair value or at the non-controlling interests' proportionate share of the recognized amounts of the
acquiree's identifiable net assets. The choice of measurement basis is made on a transaction-by-
transaction basis. Other types of non-controlling interests are measured at fair value or, when
applicable, on the basis specified in another IFRS.
Any contingent consideration payable is recognized at fair value at the acquisition date. If the
contingent consideration is classified as equity, it is not remeasured and settlement is accounted for
within equity. Otherwise, subsequent changes to the fair value of the contingent consideration are
recognized in profit or loss.
C. Foreign Currencies:
The consolidated financial statements are presented in Lebanese Pounds (“LBP”) which is the reporting
currency of the Parent Company. The primary currency of the economic environment in which the
Parent Company operates (functional currency) is the U.S. Dollar (“USD”). The exchange rate of the
USD against the LBP has been constant since many years.
In preparing the financial statements of each individual group entity, transactions in currencies other
than the entity's functional currency (foreign currencies) are recognized at the rates of exchange
prevailing at the dates of the transactions. At the end of each reporting period, monetary items
denominated in foreign currencies are retranslated at the rates prevailing at that date. Non-monetary
items carried at fair value that are denominated in foreign currencies are retranslated at the rates
prevailing at the date when the fair value was determined. Non-monetary items that are measured in
terms of historical cost in a foreign currency are not retranslated.
Exchange differences on monetary items are recognized in profit or loss in the period in which they
arise except for exchange differences on transactions entered into in order to hedge certain foreign
currency risks, and except for exchange differences on monetary items receivable from or payable to a
foreign operation for which settlement is neither planned nor likely to occur in the foreseeable future,
which are recognized in other comprehensive income, and presented in the translation reserve in
equity. These are recognized in profit or loss on disposal of the net investment.

19
For the purposes of presenting consolidated financial statements, the assets and liabilities of the
Group's foreign operations are translated into Lebanese Pounds using exchange rates prevailing at the
end of each reporting period. Income and expense items are translated at the average exchange rates
for the period, unless exchange rates fluctuate significantly during that period, in which case the
exchange rates at the dates of the transactions are used. Exchange differences arising, if any, are
recognized in other comprehensive income and accumulated in equity (attributed to non-controlling
interests as appropriate). Such exchange differences are recognized in profit or loss in the period in
which the foreign operation is disposed of.
In addition, in relation to a partial disposal of a subsidiary that does not result in the Group losing
control over the subsidiary, the proportionate share of accumulated exchange differences are re-
attributed to non-controlling interests and are not recognized in profit or loss.
D. Recognition and Derecognition of Financial Assets and Financial Liabilities:
Financial assets and financial liabilities are initially recognized on the trade date at which the Group
becomes a party to the contractual provisions of the instrument.
Financial assets and financial liabilities are initially measured at fair value. Transaction costs that are
directly attributable to the acquisition or issue of financial assets and financial liabilities (other than
financial assets and financial liabilities at fair value through profit or loss) are added to or deducted
from the fair value of the financial assets or financial liabilities, as appropriate, on initial recognition.
Transaction costs directly attributable to the acquisition of financial assets or financial liabilities at fair
value through profit or loss are recognized immediately in profit or loss.
The Group derecognizes a financial asset only when the contractual rights to the cash flows from the
asset expire, or when it transfers the financial asset and substantially all the risks and rewards of
ownership of the asset to another entity. If the Group neither transfers nor retains substantially all the
risks and rewards of ownership and continues to control the transferred asset, the Group recognizes its
retained interest in the asset and an associated liability for amounts it may have to pay. If the Group
retains substantially all the risks and rewards of ownership of a transferred financial asset, the Group
continues to recognize the financial asset and also recognizes a collateralized borrowing for the
proceeds received.
On derecognition of a financial asset measured at amortized cost, the difference between the asset’s
carrying amount and the sum of the consideration received and receivable is recognized in profit or
loss.
Upon derecognition of a financial asset that is classified as fair value through other comprehensive
income, the cumulative gain or loss previously accumulated in the investments revaluation reserve is
not reclassified to profit or loss, but is reclassified to retained earnings.
The Group derecognizes financial liabilities when, and only when, the Group’s obligations are
discharged, cancelled or they expire. The difference between the carrying amount of the financial liability
derecognized and the consideration paid and payable, including any non-cash assets transferred or
liabilities assumed, is recognized in profit or loss

20
E. Classification of Financial Assets:
All recognized financial assets are measured in their entirety at either amortized cost or fair value,
depending on their classification.
Debt Instruments:
Non-derivative debt instruments that meet the following two conditions are subsequently measured at
amortized cost less impairment loss (except for debt investments that are designated as at fair value
through profit or loss on initial recognition):
They are held within a business model whose objective is to hold the financial assets in order to
collect the contractual cash flows, rather than to sell the instrument prior to its contractual
maturity to realize its fair value changes, and
The contractual terms of the financial asset give rise on specified dates to cash flows that are
solely payments of principal and interest on the principal amount outstanding.
Debt instruments which do not meet both of these conditions are measured at fair value through profit
or loss (“FVTPL”). In addition, debt instruments that meet the amortized cost criteria but are
designated as at FVTPL are measured at FVTPL.
Even if a debt instrument meets the two amortized cost criteria above, it may be designated as at
FVTPL upon initial recognition if such designation eliminates or significantly reduces a measurement
or recognition inconsistency that would otherwise arise from measuring assets or liabilities or
recognizing the gains and losses on them on different bases.
Equity Instruments:
Investments in equity instruments are classified as at FVTPL, unless the Group designates an investment
that is not held for trading as at fair value through other comprehensive income (“FVTOCI”) on initial
recognition (see below).
Financial assets at FVTPL are measured at fair value at the end of each reporting period, with any
gains or losses arising on re-measurement recognized in profit or loss.
On initial recognition, the Group can make an irrevocable election (on an instrument-by-instrument
basis) to designate investments in equity instruments as at fair value through other comprehensive
income (“FVTOCI”). Investments in equity instruments at FVTOCI are measured at fair value. Gains
and losses on such equity instruments are recognized in other comprehensive income, accumulated in
equity and are never reclassified to profit or loss. Only dividend income is recognized in profit or loss
unless the dividend clearly represents a recovery of part of the cost of the investment, in which case it
is recognized in other comprehensive income. Cumulative gains and losses recognized in other
comprehensive income are transferred to retained earnings on disposal of an investment.

21
Designation at FVTOCI is not permitted if the equity investment is held for trading.
A financial asset is held for trading if:
it has been acquired principally for the purpose of selling it in the near term; or
on initial recognition it is part of a portfolio of identified financial instruments that the Group
manages together and has evidence of a recent actual pattern of short-term profit-taking; or
it is a derivative that is not designated and effective as a hedging instrument or a financial
guarantee.
Reclassification:
Financial assets are reclassified between FVTPL and amortized cost or vice versa, if and only if, the
Group’s business model objective for its financial assets changes so its previous model assessment
would no longer apply. When reclassification is appropriate, it is done prospectively from the
reclassification date.
Reclassification is not allowed where:
the 'other comprehensive income' option has been exercised for a financial asset, or
the fair value option has been exercised in any circumstance for a financial instrument.
F. Financial Liabilities and Equity Instruments:
Classification as debt or equity:
Debt and equity instruments issued by a group entity are classified as either financial liabilities or as
equity in accordance with the substance of the contractual arrangements and the definitions of a
financial liability and an equity instrument.
An equity instrument is any contract that evidences a residual interest in the assets of an entity after
deducting all of its liabilities. Equity instruments issued by the Group are recognized at the proceeds
received, net of direct issue costs.
Repurchase of the Parent Company’s own equity instruments is recognized and deducted directly in
equity. No gain or loss is recognized in profit or loss on the purchase, sale, issue, or cancellation of the
Parent Company’s own equity instruments.
Financial Liabilities:
Financial Liabilities that are not held-for-trading and are not designated as at FVTPL are subsequently
measured at amortized cost.

22
Financial liabilities are classified as at FVTPL when the financial liability is either held for trading or it is
designated as at FVTPL.
A financial liability other than a financial liability held for trading may be designated as at FVTPL
upon initial recognition if:
such designation eliminates or significantly reduces a measurement or recognition
inconsistency that would otherwise arise; or
the financial liability forms part of a group of financial assets or financial liabilities or both,
which is managed and its performance is evaluated on a fair value basis, in accordance with the
Group’s documented risk management or investment strategy, and information about the
grouping is provided internally on that basis; or
it forms part of a contract containing one or more embedded derivatives, and the entire
combined contract is designated as at FVTPL in accordance with IFRS 9.
G. Offsetting:
Financial assets and liabilities are set-off and the net amount is presented in the consolidated statement of
financial position when, and only when, the Group has a legal right to set-off the amounts or intends
either to settle on a net basis or to realize the asset and settle the liability simultaneously.
H. Fair Value Measurement of Financial Instruments:
Fair value is the price that would be received to sell an asset or paid to transfer a liability in an orderly
transaction between market participants at the measurement date. The fair value measurement is based
on the presumption that the transaction to sell the asset or transfer the liability takes place either:
In the principal market for the asset or liability; or
In the absence of a principal market, in the most advantageous market for the asset or liability.
The principal or the most advantageous market must be accessible by the Group. The fair value of an
asset or a liability is measured using the assumptions that market participants would use when pricing
the asset or liability, assuming that market participants act in their economic best interest.
A fair value measurement of a non-financial asset takes into account a market participant's ability to
generate economic benefits by using the asset in its highest and best use or by selling it to another
market participant that would use the asset in its highest and best use.
The Group uses valuation techniques that are appropriate in the circumstances and for which sufficient
data are available to measure fair value, maximizing the use of relevant observable inputs and
minimizing the use of unobservable inputs.
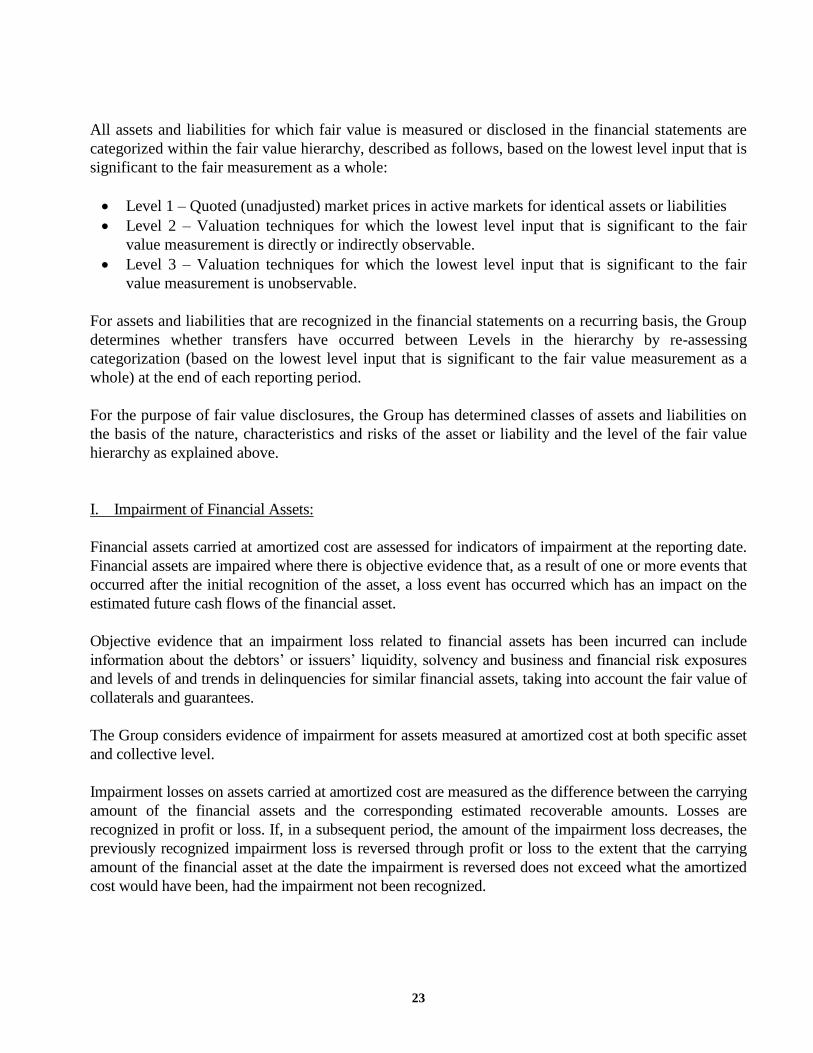
23
All assets and liabilities for which fair value is measured or disclosed in the financial statements are
categorized within the fair value hierarchy, described as follows, based on the lowest level input that is
significant to the fair measurement as a whole:
Level 1 – Quoted (unadjusted) market prices in active markets for identical assets or liabilities
Level 2 – Valuation techniques for which the lowest level input that is significant to the fair
value measurement is directly or indirectly observable.
Level 3 – Valuation techniques for which the lowest level input that is significant to the fair
value measurement is unobservable.
For assets and liabilities that are recognized in the financial statements on a recurring basis, the Group
determines whether transfers have occurred between Levels in the hierarchy by re-assessing
categorization (based on the lowest level input that is significant to the fair value measurement as a
whole) at the end of each reporting period.
For the purpose of fair value disclosures, the Group has determined classes of assets and liabilities on
the basis of the nature, characteristics and risks of the asset or liability and the level of the fair value
hierarchy as explained above.
I. Impairment of Financial Assets:
Financial assets carried at amortized cost are assessed for indicators of impairment at the reporting date.
Financial assets are impaired where there is objective evidence that, as a result of one or more events that
occurred after the initial recognition of the asset, a loss event has occurred which has an impact on the
estimated future cash flows of the financial asset.
Objective evidence that an impairment loss related to financial assets has been incurred can include
information about the debtors’ or issuers’ liquidity, solvency and business and financial risk exposures
and levels of and trends in delinquencies for similar financial assets, taking into account the fair value of
collaterals and guarantees.
The Group considers evidence of impairment for assets measured at amortized cost at both specific asset
and collective level.
Impairment losses on assets carried at amortized cost are measured as the difference between the carrying
amount of the financial assets and the corresponding estimated recoverable amounts. Losses are
recognized in profit or loss. If, in a subsequent period, the amount of the impairment loss decreases, the
previously recognized impairment loss is reversed through profit or loss to the extent that the carrying
amount of the financial asset at the date the impairment is reversed does not exceed what the amortized
cost would have been, had the impairment not been recognized.

24
J. Derivative Financial Instruments:
Derivatives are initially recognized at fair value at the date a derivative contract is entered into and are
subsequently remeasured to their fair value at each reporting date.
The resulting gain or loss is recognized in profit or loss immediately unless the derivative is designated
and effective as a hedging instrument, in which event the timing of the recognition in profit or loss
depends on the nature of the hedge relationship.
Embedded Derivatives
Derivatives embedded in other financial instruments or other host contracts with embedded derivatives
are treated as separate derivatives when their risks and characteristics are not closely related to those of
the host contracts and the host contract:
is not measured at fair value with changes in fair value recognized in profit or loss.
is not an asset within the scope of IFRS 9
K. Property and Equipment:
Property and equipment except for buildings acquired prior to 1993 are stated at historical cost, less
accumulated depreciation and impairment loss, if any. Buildings acquired prior to 1993 are stated at their
revalued historical amounts, based on market prices prevailing at the end of 1993 less accumulated
depreciation and impairment loss, if any. Resulting revaluation surplus is reflected under “Equity”.
Depreciation of property and equipment, other than land and advance payments on capital expenditures is
calculated systematically using the straight-line method over the estimated useful lives of the related
assets as follows:
Buildings 40 years
Furniture and Equipment 3 to 10 years
Properties in the course of construction for production, supply or administrative purposes are carried at
cost, less any recognized impairment loss. Cost includes professional fees and, for qualifying assets,
borrowing costs capitalized in accordance with the Group’s accounting policy. Such properties are
classified to the appropriate categories of property, plant and equipment when completed and ready for
intended use. Depreciation of these assets, on the same basis as other property assets, commences
when the assets are ready for their intended use.
L. Intangible Assets:
Intangible assets consisting of computer software are amortized over a period of five years and are
subject to impairment testing. Subsequent expenditure on software assets is capitalized only when it
increases the future economic benefits embodied in the specific asset to which it relates. All other
expenditure is expensed as incurred.

25
M. Impairment of Tangible and Intangible Assets:
At each reporting date, the Group reviews the carrying amounts of its tangible and intangible assets to
determine whether there is any indication that those assets have suffered an impairment loss. If any
such indication exists, the recoverable amount of the asset is estimated in order to determine the extent
of the impairment loss (if any).
Recoverable amount is the higher of fair value less costs to sell and value in use. In assessing value in
use, the estimated future cash flows are discounted to their present value using a pre-tax discount rate
that reflects current market assessments of the time value of money and the risks specific to the asset
for which the estimates of future cash flows have not been adjusted.
If the recoverable amount of an asset is estimated to be less than its carrying amount, the carrying
amount of the asset is reduced to its recoverable amount. An impairment loss is recognized
immediately in profit or loss, unless the relevant asset is carried at a revalued amount, in which case
the impairment loss is treated as a revaluation decrease.
Where an impairment loss subsequently reverses, the carrying amount of the asset
(cash-generating unit) is increased to the revised estimate of its recoverable amount, but so that the
increased carrying amount does not exceed the carrying amount that would have been determined had
no impairment loss been recognized for the asset (cash-generating unit) in prior years. A reversal of
an impairment loss is recognized immediately in profit or loss, unless the relevant asset is carried at a
revalued amount, in which case the reversal of the impairment loss is treated as a revaluation increase.
N. Provision for Employees' End-of-Service Indemnities:
Obligations for contributions to defined employees’ benefits are recognized as an expense on a current
basis.
The Group provides for the employees’ end-of-service indemnities in accordance with local laws and
regulations governing these indemnities in the countries where the Group operates.
Employees' End-of-Service Indemnities: (Under the Lebanese Jurisdiction)
The provision for staff termination indemnities is based on the liability that would arise if the
employment of all the staff were voluntarily terminated at the reporting date. This provision is
calculated in accordance with the directives of the Lebanese Social Security Fund and Labor laws
based on the number of years of service multiplied by the sum of the last monthly basic salary paid and
the monthly average of the last 12 months’ additional benefits paid and less contributions paid to the
Lebanese Social Security National Fund and interest accrued by the Fund.

26
O. Provisions:
Provision is recognized if, as a result of a past event, the Group has a present legal or constructive
obligation that can be estimated reliably, and it is probable that an outflow of economic benefits will
be required to settle the obligation. Provisions are determined by discounting the expected future cash
flows at a pre-tax rate that reflects current market assessments of the time value of money and, where
appropriate, the risks specific to the liability.
P. Insurance contracts:
An insurance contract is a contract under which one party (the insurer) accepts significant insurance
risks from another party (the policyholder) by agreeing to compensate the policyholder if a specified
uncertain future event (the insured event) adversely affects the policyholder. Such contracts may also
transfer financial risk.
The insurance contracts are classified in the following categories depending on the nature of the risk
insured:
- Non-life insurance contracts:
These contracts are marine, motor, property, general accidents, workmen’s compensation and medical
insurance contracts.
Provision for Outstanding Claims
The provision for outstanding claims is made for all claims reported to the Group and still unpaid at
the reporting date including the historical average cost of claims incurred but not reported (IBNR).
Unearned Premiums
Unearned premiums represent the part of written premiums, including accessories and other fees, that
is estimated to be earned in subsequent periods. Unearned premiums are calculated using the prorata
temporis method except for the marine department which is computed on the basis of 25% of written
premiums. The change in the provision is recorded in the statement of profit or loss to recognize
revenue over the period of the risk.
Premium Deficiency Reserve
Premium deficiency reserve is computed on the basis of a percentage of losses exceeding earned
premiums.

27
- Life Insurance Contracts:
The life insurance contracts are classified in the following categories
- Traditional products:
This category consists of term life (individual or group) and classic combined assurances
products (various traditional endowment plans).
- Universal Life Insurance Contracts with discretionary participation features:
These insurance contracts contain discretionary participation features (DPF) which entitle the
contract holder to receive, as a supplement to the standard guaranteed benefits, additional
bonuses:
Whose amount or timing is contractually at the discretion of the insurer; and
That are based on realized and/or unrealized investment returns on a specified pool of
assets held by the issuer.
- Contracts on behalf of life insured where the insured bear the investment risk with significant
insurance risk (Unit Linked):
These contracts transfer the financial risk to the policyholder and at the same time contain certain
significant insurance risk.
Unbundling of deposit components:
Some life insurance contracts contain both an insurance component and a deposit component.
The Group has measured the deposit component separately and presented the life insurance
contracts by applying the principle of unbundling the insurance components from the deposit
components which are recognized in the financial statements as follows:
Insurance Components:
Insurance components are reflected separately under income together with the elements of the
insurance income related to loading and charges and premiums in the technical pipeline, which
are recognized as income on accrual basis over the benefiting period.
Deposit Components:
Savings and/or deposit components of premiums are recognized as liabilities related to insurance
contracts. These liabilities, including unit-linked products, are increased or decreased by the
credit interest, either positive or negative change in the unit prices of the corresponding
underlying investment portfolio, policy administration and fund management fees, mortality and
surrender charges, withdrawals, and other factors impacting the value of the deposit component
of the insurance contracts.

28
Mathematical provision for life insurance contracts:
Provisions for traditional products are calculated as the difference between the actuarial present
value of the branch’s future liabilities and the actuarial present value of the policyholders’ future
premiums based on the tables of mortality and the actuarial interest rates as per the original
tariffs. In case losses arise from liability adequacy tests, an additional provision is raised.
The provisions for universal/unit-linked life insurance policies are calculated using the
retrospective method (i.e. based on the savings account value).
At each reporting date, an actuarial valuation of the life portfolio is carried out by a professional
independent actuary and a technical assessment is performed in respect of unearned revenues.
Moreover, outstanding liabilities of the accumulation of deposit components and profits related
are also based on an actuarial technical assessment. Prevailing laws require that such actuarial
valuation be carried out annually.
Provision for outstanding claims
The provision for outstanding claims is made for all claims reported to the Group and still unpaid
at the reporting date. Claims are recognized in the statement of profit or loss when incurred
based on estimated benefits.
Q. Revenue and Expense Recognition:
Insurance premiums and other insurance revenues are recognized as income when the insurance
policies are issued.
Interest income and expense are recognized on an accrual basis, taking into account of the principal
outstanding and the applicable interest rate.
Rental income from property which is leased under operating leases is recognized on a straight line
basis over the term of the relevant lease.
Fee and commission insurance income consists primarily of reinsurance and profit commission,
policyholder administration fees and other contract fees. Reinsurance commissions receivable are
deferred in the same way as acquisition cost. All other fee and commission income are recognized as the
services are provided.
Dividend income is recognized when the right to receive payment is established.

29
R. Income Tax:
Income tax expense represents the sum of the tax currently payable and deferred tax. Income tax is
recognized in the statement of profit or loss except to the extent that it relates to items recognized
directly in other comprehensive income, in which case it is recognized in other comprehensive
income.
Current tax is the expected tax payable on the taxable income for the year, using rates enacted at the
reporting date. Income tax payable is reflected in the consolidated statement of financial position net
of taxes previously settled in the form of withholding tax.
Deferred tax is recognized on differences between the carrying amounts of assets and liabilities in the
financial statements and the corresponding tax base used in the computation of taxable profit, and are
accounted for using the balance sheet liability method. Deferred tax liabilities are generally
recognized for all taxable temporary differences and deferred tax assets are recognized to the extent
that it is probable that taxable profits will be available against which deductible temporary differences
can be utilized.
S. Liability Adequacy Test:
Liability adequacy tests are performed to ensure the adequacy of the contract liabilities net of related
deferred acquisition costs. Any deficiency is immediately charged to profit or loss for the year initially
by writing-off the deferred acquisition costs and by subsequently establishing a provision for losses
arising from liability adequacy tests.
T. Reinsurance Contracts:
Contracts entered into by the Group with reinsurers under which the Group is compensated for losses
on one or more contracts issued by the Group and that meet the classification requirements for
insurance contracts are classified as reinsurance contracts. Insurance contracts entered into by the
Group under which the contract holder is another insurer are included with insurance contracts.
The benefits to which the Group is entitled under its reinsurance contracts are recognized as
receivables from reinsurance companies under reinsurance assets in the statement of financial position.
Reinsurance share of premiums and claims is computed on the basis of effective outwards. The
reinsurers’ portion towards the above outstanding claims, claims incurred but not reported and
unearned premiums is classified as reinsurance assets in the statement of financial position.
The Group assesses its reinsurance assets for impairment on a regular basis. If there is objective
evidence that the reinsurance asset is impaired, the Group reduces the carrying amount of the
reinsurance assets to its recoverable amount and recognizes that impairment loss in the profit or loss
for the year.

30
U. Insurance Receivables and Payables:
Receivables and payables arising under insurance contracts are recognised when due and measured at
amortised cost. A provision for impairment is established when there is objective evidence that, as a
result of one or more events that occurred after the initial recognition, the estimated future cash flows
have been impacted.
V. Deferred Acquisition Costs:
Deferred acquisition cost represents the deferred portion of the commission paid to brokers and
sponsors. Deferred acquisition costs are amortized systematically over the life of the contracts and
tested for impairment at each reporting date. Any amount not recoverable is expensed. They are
derecognized when the related contracts are settled or disposed of.
W. Treasury Shares:
Treasury shares are carried at cost and presented in the consolidated statement of financial position as
a deduction from Equity. Gains resulting from sale of treasury share are also presented in equity under
“Surplus on sale of treasury shares”.
X. Distribution of Dividends:
The appropriation of proposed dividends from retained earnings is reflected separately in the statement
of changes in equity based on the Board’s recommendation, and reversed to liability in the year it is
approved by the General Assembly of Shareholders.
Y. Consolidated Assets, Liabilities, and Net Assets of the Life Division:
Consolidated assets, liabilities, and net assets of the Life Division, comprising the life division of
Arabia Insurance Company S.A.L. and the life division of Arabia Insurance Company ltd. – Jordan,
are presented in a separate statement for the Life Division (Appendix I, II, III) and included as a line
item in the consolidated financial statements.
Z. Cash and Cash Equivalents:
Cash and cash equivalents comprise unrestricted cash on hand and demand deposits and other short term
deposits with original maturity period not exceeding three months.
AA. Investment Property:
Investment property is carried at cost less accumulated depreciation and impairment loss, if any.

31
4. CRITICAL ACCOUNTING JUDGMENTS AND KEY SOURCES OF ESTIMATION UNCERTAINTY
In the application of the Group’s accounting policies, which are described in note 3, the management
are required to make judgements, estimates and assumptions about the carrying amounts of assets and
liabilities that are not readily apparent from other sources. The estimates and associated assumptions
are based on historical experience and other factors that are considered to be relevant. Actual results
may differ from these estimates.
The estimates and underlying assumptions are reviewed on an ongoing basis. Revisions to accounting
estimates are recognised in the period in which the estimate is revised if the revision affects only that
period or in the period of the revision and future periods if the revision affects both current and future
periods.
Critical Accounting Judgments:
A. Critical accounting judgments in applying the Group’s accounting policies:
Classification of Financial Assets:
Business Model:
The business model test requires the Group to assess whether its business objective for financial
assets is to collect the contractual cash flows of the assets rather than realize their fair value change
from sale before their contractual maturity. The Group considers at which level of its business
activities such assessment should be made. Generally, a business model can be evidenced by the
way business is managed and the information provided to management. However the Group’s
business model can be to hold financial assets to collect contractual cash flows even when there are
some sales of financial assets. While IFRS 9 provides some situations where such sales may or may
not be consistent with the objective of holding assets to collect contractual cash flows, the
assessment requires the use of judgment based on facts and circumstances.
In determining whether its business model for managing financial assets is to hold assets in order to
collect contractual cash flows the Group considers:
The frequency and volume of sales;
The reasons for any sales;
How management evaluates the performance of the portfolio;
The objectives for the portfolio.

32
Characteristics of the Financial Asset:
Once the Group determines that its business model is to hold the assets to collect the contractual
cash flows, it exercises judgment to assess the contractual cash flows characteristics of a financial
asset. In making this judgment, the Group considers the contractual terms of the acquired asset to
determine that they give rise on specific dates, to cash flows that solely represent principal and
principal settlement and accordingly may qualify for amortized cost accounting.
Features considered by the Group that would be consistent with amortized cost measurement
include:
Fixed and / or floating interest rate;
Caps, floors, collars;
Prepayment options.
Features considered by the Group that would be inconsistent with amortized cost measurement
include:
Leverage (i.e. options, forwards and swaps);
Conversion options;
Inverse floaters;
Variable rate coupons that reset periodically;
Triggers that result in a significant reduction of principal, interest or both.
Key Sources of Estimation Uncertainty:
The following are the key assumptions concerning the future, and other key sources of estimation
uncertainty at the reporting date, that have a significant risk of causing a material adjustment to the
carrying amounts of assets and liabilities within the next financial year.
Impairment of insurance receivables:
The recoverable amount of insurance receivables is estimated when there is indication of incomplete
collectibility of these receivables. The determination of impairment requires management to assess the
solvency and financial liquidity of policyholders and reinsurers. Moreover, percentages of collections
are reviewed based on the historical information of the Group and the detailed studies conducted
during the year, in addition to the opinion of the legal management of the Group. The difference
between the recoverable amounts and the book value is recognized as an expense in the statement of
profit or loss. The difference between the actual amounts collected in future periods and those
previously estimated is recognized in the statement of profit or loss at the date of collection.

33
The ultimate liability arising from claims made under insurance contracts:
The estimate of ultimate liability arising from the claims made under insurance contracts is the
Group’s most critical accounting estimate. There are sources of uncertainty that need to be considered
in the estimate of the liability that the Group will eventually pay for such claims. Estimates have to be
made both for expected ultimate cost of claims reported at the reporting date and for the expected
ultimate cost of claims incurred but not reported (“IBNR”) at the reporting date. Liabilities for unpaid
reported claims are estimated using the input of assessments for individual cases reported to the Group
and the management estimates based on past claims settlement trends for the claims incurred but not
reported. Claim liabilities are also tested for adequacy as of the reporting date and the related
provisions are adjusted accordingly.
Determining Fair Values:
The determination of fair value for financial assets for which there is no observable market price requires
the use of valuation techniques as described in Note 3H. For financial instruments that trade infrequently
and have little price transparency, fair value is less objective, and requires varying degrees of judgment
depending on liquidity, concentration, uncertainly of market factors, pricing assumptions and other risks
affecting the specific instrument.
Unobservable inputs are used to measure fair value to the extent that observable inputs are not
available, thereby allowing for situations in which there is little, if any, market activity for the asset or
liability at the measurement date. However, the fair value measurement objective should remain the
same; that is, an exit price from the perspective of market participants. Unobservable inputs are
developed based on the best information available in the circumstances, which may include the
reporting entity's own data.
5. CASH AND BANKS
This caption consists of the following:
December 31, 2014
General
Insurance Life
Departments Division Total
LBP’000 LBP’000 LBP’000
Cash on hand 470,925 - 470,925
Demand deposits 23,579,641 6,157,350 29,736,991
Term deposits (original maturity less than 3 months) 42,921,164 1,113,571 44,034,735
Cash and cash equivalents 66,971,730 7,270,921 74,242,651
Term deposits 18,662,179 8,170,741 26,832,920
Deposits pledged in guarantee of insurance business 72,901,567 11,454,303 84,355,870
158,535,476 26,895,965 185,431,441
Accrued interest receivable 521,098 95,358 616,456
159,056,574 26,991,323 186,047,897

34
December 31, 2013
General
Insurance Life
Departments Division Total
LBP’000 LBP’000 LBP’000
Cash on hand 699,417 - 699,417
Checks for collection 3,615 - 3,615
Demand deposits 20,425,282 4,949,713 25,374,995
Term deposits (original maturity less than 3 months) 52,563,520 3,326,674 55,890,194
Cash and cash equivalents 73,691,834 8,276,387 81,968,221
Term deposits 20,109,949 3,627,138 23,737,087
Deposits pledged in guarantee of insurance business 51,882,153 9,904,195 61,786,348
145,683,936 21,807,720 167,491,656
Accrued interest receivable 702,175 39,248 741,423
146,386,111 21,846,968 168,233,079
Cash and banks of the general insurance departments and life division are composed of the following
currencies (excluding accrued interest receivable):
General
Insurance Departments Life Division
December 31, December 31,
2014 2013 2014 2013
LBP’000 LBP’000 LBP’000 LBP’000
Lebanese Pound 13,727,069 11,140,646 1,181,794 1,110,393
U.S Dollar 29,034,106 25,053,169 3,828,716 4,353,654
Omani Riyal 49,972,786 42,034,721 5,402,653 4,596,413
U.A.E Dirham 12,595,299 16,142,663 11,259,766 6,560,865
Euro 231,342 ( 631,329) 43,564 88,984
Kuwaiti Dinar 10,089,086 12,049,113 309,712 188,333
Bahraini Dinar 12,834,619 13,407,690 2,787,915 2,974,330
Syrian Pound 10,198,166 11,235,201 - -
Jordanian Dinar 17,883,408 13,931,714 1,505,507 1,507,797
Qatar Riyal 1,869,928 1,042,210 569,770 419,919
Other currencies 99,667 278,138 6,568 7,032
158,535,476 145,683,936 26,895,965 21,807,720
Most of the deposits in Kuwaiti Dinar, UAE Dirham, Bahraini Dinar, Omani Riyal, and Jordanian
Dinar shown above are pledged in favor of the authorities in the countries concerned, in guarantee of
the insurance business for the general insurance departments and the life division.
Term deposits and deposits pledged in guarantee of insurance business mature within one year.
Interests earned on the deposits of the general insurance departments and the life division amounting
to LBP4billion and LBP464million respectively for 2014 (LBP5.1billion and LBP2billion,
respectively for 2013) are reflected in the accompanying consolidated statement of profit or loss of the
general insurance departments and the life division.

35
6. FINANCIAL ASSETS AT FAIR VALUE THROUGH PROFIT OR LOSS (FVTPL)
(a) General Insurance Departments:
December 31, 2014 Fair Unrealized Average Value at Gain/(loss) Interest Currency Year End For the Year Rate LBP’000 LBP’000 % Foreign corporate bonds - quoted: U.S. Dollar 463,597 984 7.54 Euro 27,892 ( 3,330) 6.00 491,489 ( 2,346) Equity securities - quoted: U.S. Dollar 2,228,134 ( 331,202) Euro 2,289,817 ( 222,753) Jordanian Dinar 2,631,164 465,861 UAE Dirham 174,920 ( 23,300) Syrian Pound 208,809 ( 5,239) Franc Suisse 215,234 ( 7,632) 7,748,078 ( 124,265) Funds - quoted: U.S. Dollar 5,922,830 176,681 Euro 1,328,034 35,961 7,250,864 212,642 Funds - unquoted: Jordanian Dinar 268,155 - U.S. Dollar 242,803 1,867 510,958 1,867 16,001,389 87,898
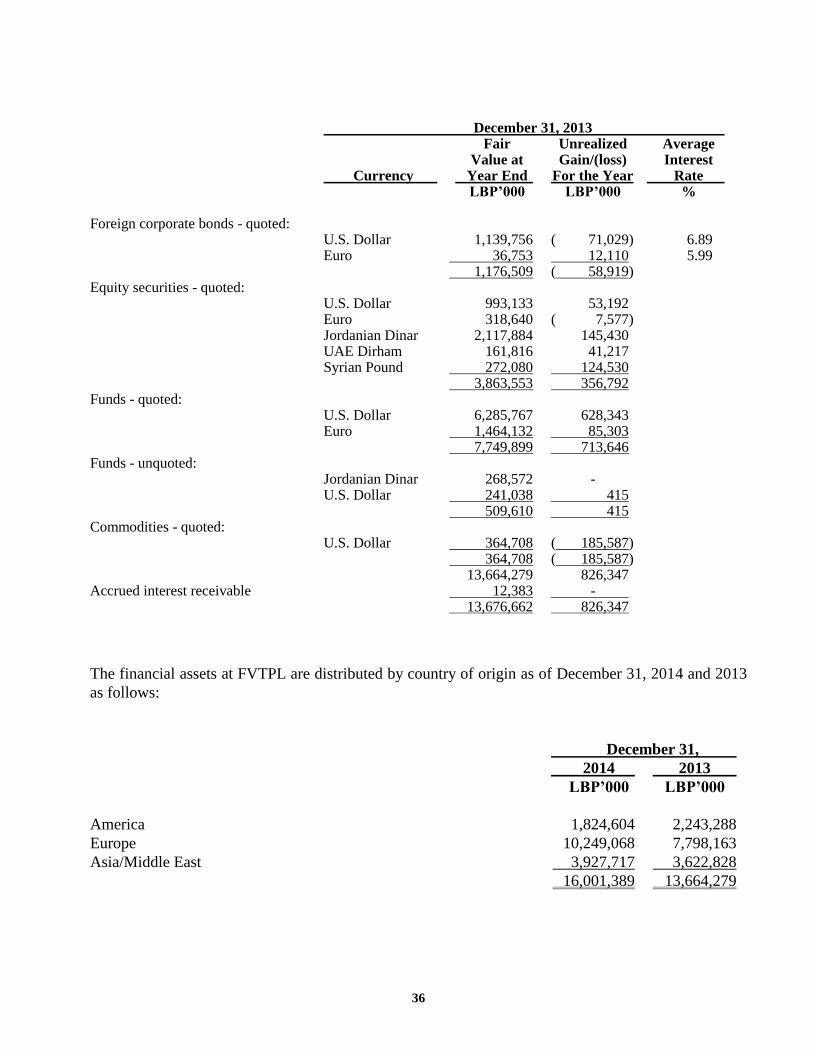
36
December 31, 2013 Fair Unrealized Average Value at Gain/(loss) Interest Currency Year End For the Year Rate LBP’000 LBP’000 % Foreign corporate bonds - quoted: U.S. Dollar 1,139,756 ( 71,029) 6.89 Euro 36,753 12,110 5.99 1,176,509 ( 58,919) Equity securities - quoted: U.S. Dollar 993,133 53,192 Euro 318,640 ( 7,577) Jordanian Dinar 2,117,884 145,430 UAE Dirham 161,816 41,217 Syrian Pound 272,080 124,530 3,863,553 356,792 Funds - quoted: U.S. Dollar 6,285,767 628,343 Euro 1,464,132 85,303 7,749,899 713,646 Funds - unquoted: Jordanian Dinar 268,572 - U.S. Dollar 241,038 415 509,610 415 Commodities - quoted: U.S. Dollar 364,708 ( 185,587) 364,708 ( 185,587) 13,664,279 826,347 Accrued interest receivable 12,383 - 13,676,662 826,347
The financial assets at FVTPL are distributed by country of origin as of December 31, 2014 and 2013
as follows:
December 31,
2014 2013
LBP’000 LBP’000
America 1,824,604 2,243,288
Europe 10,249,068 7,798,163
Asia/Middle East 3,927,717 3,622,828
16,001,389 13,664,279

37
The movement of financial assets at FVTPL during 2014 and 2013 is summarized as follows:
2014 2013
LBP’000 LBP’000
Balance at January 1 13,664,279 14,173,474
Additions 13,956,734 11,508,466
Sales ( 11,135,400) ( 12,725,774)
Change in fair value 87,898 826,347
Deferred tax ( 33,954) ( 57,031)
Effect of foreign currency fluctuations ( 538,168) ( 61,203)
Balance at December 31 16,001,389 13,664,279
(b) Life Division:
The financial assets at FVTPL of the life division consist of unit-linked and other investment securities
as follows:
December 31,
2014 2013
LBP’000 LBP’000
Unit-linked investment securities 38,651,228 33,098,282
Other investment securities 650,386 768,911
39,301,614 33,867,193
Unit-linked investment securities:
The movement of the unit-linked investment securities during 2014 and 2013 is summarized as
follows:
2014 2013
Bank Term
Funds Funds Deposits Total
LBP’000 LBP’000 LBP’000 LBP’000
Balance at January 1 33,098,282 26,228,383 24,022,537 50,250,920
Additions 5,185,516 2,927,346 - 2,927,346
Sales - - - -
Surrenders - - ( 24,022,537) ( 24,022,537)
Change in fair value 367,430 3,942,553 - 3,942,553
Balance at December 31 38,651,228 33,098,282 - 33,098,282

38
Other investment securities:
The other investment securities consist of the following:
December 31, 2014 Fair Unrealized Average Value at Gain/(loss) Interest Currency Year End For the Year Rate
LBP’000 LBP’000 % Foreign bonds - quoted: U.S. Dollar 444,069 13,061 6.53 Euro 2 - 444,071 13,061 Equity securities – quoted: Jordanian Dinar 149,765 62,789 Euro 56,550 ( 5,377) 206,315 57,412 650,386 70,473
December 31, 2013 Fair Unrealized Average Value at Gain/(loss) Interest Currency Year End For the Year Rate
LBP’000 LBP’000 % Lebanese corporate bonds – unquoted: U.S. Dollar 150,750 - 5.00 150,750 - Foreign bonds – quoted: U.S. Dollar 303,764 5,654 5.50 Euro 3 - 303,767 5,654 Equity securities – quoted: U.S. Dollar 150,382 ( 632) Jordanian Dinar 86,976 28,836 Euro 70,057 32,777 307,415 60,981 761,932 66,635 Accrued interest receivable 6,979 - 768,911 66,635

39
The other investment securities are distributed by country of origin as follows:
December 31,
2014 2013
LBP’000 LBP’000
America 56,550 70,053
Europe 444,071 454,152
Asia/Middle East 149,765 237,727
650,386 761,932
The movement of other investment securities during 2014 and 2013 is summarized as follows:
2014 2013
LBP’000 LBP’000
Balance at January 1 761,932 1,287,027
Additions 884,760 2,075,957
Sales ( 1,058,649) ( 2,669,965)
Change in fair value 70,473 66,635
Effect of foreign currency fluctuations ( 8,130) 2,278
Balance at December 31 650,386 761,932
7. INSURANCE RECEIVABLES
(a) General Insurance Departments:
Insurance receivables and premiums of the general insurance department are distributed
geographically as follows:
Insurance Receivables Premiums
December 31, Year Ended December 31,
2014 2013 2014 2013
LBP’000 LBP’000 LBP’000 LBP’000
Lebanon (Branches and Headquarters) 21,853,790 20,677,108 32,794,518 33,626,903
United Arab Emirates 19,652,982 26,215,818 71,648,693 75,014,096
Sultanate of Oman 9,674,460 8,411,229 42,448,295 39,961,666
State of Kuwait 180,566 6,888,045 13,508,193 25,480,891
State of Qatar 6,234,445 8,373,477 15,582,166 17,692,857
Kingdom of Bahrain 2,282,492 3,004,794 9,312,781 8,628,051
Kingdom of Jordan 9,740,198 9,395,935 33,283,683 29,754,365
Syria 489,269 619,514 5,929,161 7,308,761
70,108,202 83,585,920 224,507,490 237,467,590
Less: Provision for credit losses ( 12,991,491) ( 12,776,495)
57,116,711 70,809,425

40
Written premiums for the year 2014 include premiums to cover extended warranty on vehicles for the
amount of LBP19.1billion which were fully reinsured (LBP21.5billion in 2013).
The movement in the provision for credit losses consists of the following:
2014 2013
LBP’000 LBP’000
Balance at January 1 12,776,495 10,561,941
Additions 825,761 2,212,232
Write-offs ( 562,970) ( 666,725)
Reclassification - Note 12 - 789,752
Effect of foreign currency fluctuations ( 47,795) ( 120,705)
Balance at December 31 12,991,491 12,776,495
(b) Life Division:
Insurance and other receivables of the life division consist of the following:
December 31,
2014 2013
LBP’000 LBP’000
Accrued premium receivable 5,685,381 5,481,990
Loans on policies 185,845 194,492
Due from brokers and agents 13,072 1,014,154
5,884,298 6,690,636
8. DUE FROM REINSURERS
This caption consists of the following: General Insurance
Departments Life Division
December 31, December 31,
2014 2013 2014 2013
LBP’000 LBP’000 LBP’000 LBP’000
Reinsurers' current accounts - Outward 23,312,141 24,822,893 82,396 118,423
Reinsurers' current accounts - Inward 2,426,954 2,928,158 - -
25,739,095 27,751,051 82,396 118,423
Provision for credit losses ( 1,570,925) ( 1,775,277) - -
24,168,170 25,975,774 82,396 118,423

41
The movement of provision for credit losses during 2014 and 2013 was as follows:
2014 2013
LBP’000 LBP’000
Balance at January 1 1,775,277 -
Additions - 1,775,277
Write-backs ( 204,352) -
Balance at December 31 1,570,925 1,775,277
9. FINANCIAL ASSETS AT FAIR VALUE THROUGH OTHER COMPREHENSIVE INCOME (FVTOCI)
(a) General Insurance Departments:
The financial assets at FVTOCI consist of the following: December 31, 2014 Cumulative Average Fair Change in Interest Currency Value Fair Value Rate LBP’000 LBP’000 % Foreign corporate bonds - unquoted: U.S. Dollar 150,750 - 10.00 150,750 - Equity securities - quoted: U.S. Dollar 2,545,734 ( 1,151,329) Euro 425,783 ( 251,546) Saudi Riyal 37,690,877 12,576,810 Swiss Franc 162,891 ( 66,357) Jordanian Dinar 22,838,542 65,708 Omani Riyal 13,181 ( 2,004) 63,677,008 11,171,282 Equity securities - unquoted: U.S. Dollar 3,386,731 1,063,955 Lebanese Pound 6,539,955 5,191,711 Jordanian Dinar 132,464 - Tunisian Dinar 58,409 49,972 10,117,559 6,305,638 Funds – unquoted: Euro 517,172 ( 46,104) 517,172 ( 46,104) 74,462,489 17,430,816 Accrued interest receivable 1,717 - 74,464,206 17,430,816

42
December 31, 2013 Cumulative Average Fair Change in Interest Currency Value Fair Value Rate LBP’000 LBP’000 % Foreign corporate bonds – quoted: Omani Riyal 3,913,551 ( 61,328) 6.25 3,913,551 ( 61,328) Foreign corporate bonds – unquoted: U.S. Dollar 150,750 - 10.00 150,750 - Equity securities – quoted: U.S. Dollar 3,455,594 ( 1,165,994) Euro 421,744 ( 248,272) Saudi Riyal 59,576,400 34,462,333 Swiss Franc 196,486 ( 32,762) Jordanian Dinar 22,509,513 ( 201,682) Omani Riyal 11,596 ( 81,859) 86,171,333 32,731,764 Equity securities – unquoted: U.S. Dollar 2,702,427 465,331 Lebanese Pound 6,541,203 5,192,724 Jordanian Dinar 132,464 - Tunisian Dinar 64,574 56,136 9,440,668 5,714,191 Funds – unquoted: Euro 585,074 21,798 585,074 21,798 100,261,376 38,406,425 Accrued interest receivable 6,802 - 100,268,178 38,406,425
The financial assets at FVTOCI are distributed by country of origin as of December 31, 2014 and 2013
as follows:
December 31,
2014 2013
LBP’000 LBP’000
America 283,487 1,263,027
Europe 1,151,769 1,245,189
Africa 58,409 64,574
Asia/Middle East 72,968,824 97,688,586
74,462,489 100,261,376

43
The movement of financial assets at FVTOCI during 2014 and 2013 is summarized as follows:
2014 2013
LBP’000 LBP’000
Balance at January 1 100,261,376 109,662,230
Additions 92,729 3,634,239
Sales ( 5,241,912) ( 1,780,379)
Transfer from life division 445,424 -
Change in fair value ( 21,012,161) ( 11,288,900)
Effect of foreign currency fluctuations ( 82,967) 34,186
Balance at December 31 74,462,489 100,261,376
(b) Life Division:
December 31, 2014
Cumulative
Fair Change in
Currency Value Fair Value
LBP’000 LBP’000
Equity securities - quoted:
U.S. Dollar 84,269 8,894
Jordanian Dinar 365,310 59,879
449,579 68,773
Equity securities - unquoted:
Lebanese Pound 1,459,395 1,097,853
U.S. Dollar 452,250 -
1,911,645 1,097,853
2,361,224 1,166,626
December 31, 2013
Cumulative
Fair Change in
Currency Value Fair Value
LBP’000 LBP’000
Equity securities - quoted:
U.S. Dollar 83,741 8,366
Jordanian Dinar 415,537 97,264
499,278 105,630
Equity securities - unquoted:
Lebanese Pound 1,942,037 1,578,978
U.S. Dollar 452,250 -
2,394,287 1,578,978
2,893,565 1,684,608

44
The financial assets at FVTOCI are distributed by country of origin as of December 31, 2014 and 2013
as follows:
December 31,
2014 2013
LBP’000 LBP’000
Asia/Middle East 2,361,224 2,893,565
2,361,224 2,893,565
The movement of financial assets at FVTOCI during 2014 and 2013 is summarized as follows:
2014 2013
LBP’000 LBP’000
Balance at January 1 2,893,565 2,749,429
Additions - 452,250
Sales ( 151,104) ( 468,079)
Transfer to general insurance departments ( 445,424) -
Change in fair value 64,187 159,965
Balance at December 31 2,361,224 2,893,565
10. FINANCIAL ASSETS AT AMORTIZED COST
(a) General Insurance Departments:
December 31, 2014 Average Amortized Fair Interest Currency Cost Value Rate LBP’000 LBP’000 % Lebanese corporate bonds - unquoted U.S. Dollar 152,449 152,449 7.00 152,449 152,449 Lebanese government bonds - unquoted U.S. Dollar 746,784 753,750 6.00 746,784 753,750 Foreign corporate bonds - quoted U.S. Dollar 7,224,961 7,104,427 6.28 Euro 1,345,195 1,471,403 5.25 Jordanian Dinar 802,652 802,652 10.00 Turkish Lira 117,187 110,614 6.00 Australian Dollar 246,321 213,356 7.50 9,736,316 9,702,452 10,635,549 10,608,651 Accrued interest receivable 161,744 161,744 10,797,293 10,770,395

45
December 31, 2013 Average Amortized Fair Interest Currency Cost Value Rate LBP’000 LBP’000 % Lebanese corporate bonds – unquoted U.S. Dollar 378,574 378,574 7.00 378,574 378,574 Lebanese government bonds – unquoted U.S. Dollar 745,919 730,987 6.00 745,919 730,987 Foreign corporate bonds – quoted U.S. Dollar 7,991,066 8,196,995 6.17 Euro 1,729,525 1,866,256 5.39 Jordanian Dinar 802,652 802,652 10.00 Turkish Lira 127,064 114,202 5.88 Australian Dollar 267,715 286,410 7.50 10,918,022 11,266,515 12,042,515 12,376,076 Accrued interest receivable 202,796 178,527 12,245,311 12,554,603
The financial assets at amortized cost are segregated over remaining period to maturity as follows:
December 31, 2014 December 31, 2013
Average Average
Amortized Interest Amortized Interest
Remaining period to maturity Cost Rate Cost Rate
LBP’000 % LBP’000 %
Up to 1 year 671,549 7.16 2,001,430 6.49
1 to 3 years 2,458,866 6.86 2,199,995 7.25
3 to 5 years 1,697,244 7.46 1,705,403 7.52
Beyond 5 years 5,807,890 5.89 6,135,687 5.94
10,635,549 12,042,515
The financial assets at amortized cost are distributed by country of origin as follows:
December 31,
2014 2013
LBP’000 LBP’000
United States of America 603,935 1,043,377
Europe 4,066,995 3,968,135
Africa 485,157 509,567
Asia/Middle East 4,311,140 5,478,533
Australia 413,050 437,758
South America 755,272 605,145
10,635,549 12,042,515

46
The movement of financial assets at amortized cost during 2014 and 2013 is summarized as follows:
2014 2013
LBP’000 LBP’000
Balance at January 1 12,042,515 10,855,178
Additions 882,798 2,833,909
Redemptions ( 2,069,358) ( 1,640,435)
Amortization ( 4,187) ( 4,954)
Effect of foreign currency fluctuations ( 216,219) ( 1,183)
Balance at December 31 10,635,549 12,042,515
(b) Life Division: December 31, 2014 Average Amortized Fair Interest Currency Cost Value Rate LBP’000 LBP’000 % Lebanese government bonds - quoted U.S. Dollar 414,998 419,462 6.64 Lebanese corporate bonds - unquoted U.S. Dollar 753,527 755,258 6.15 1,168,525 1,174,720 Foreign bonds - quoted U.S. Dollar 7,808,741 8,174,222 6.05 Jordanian Dinar 170,098 170,098 6.75 Euro 1,104,955 1,170,702 6.54 9,083,794 9,515,022 10,252,319 10,689,742 181,586 181,586 10,433,905 10,871,328 December 31, 2013 Average Amortized Fair Interest Currency Cost Value Rate LBP’000 LBP’000 % Lebanese government bonds - unquoted U.S. Dollar 1,018,098 1,018,694 8.04 Lebanese corporate bonds - unquoted U.S. Dollar 753,451 748,097 6.15 1,771,549 1,766,791 Foreign corporate bonds - quoted U.S. Dollar 7,010,853 7,469,353 6.36 Jordanian Dinar 425,246 425,246 6.75 Euro 1,146,590 1,243,805 6.83 8,582,689 9,138,404 10,354,238 10,905,195 Accrued interest receivable 180,152 180,152 10,534,390 11,085,347

47
The financial assets at amortized cost are distributed by country of origin as of December 31, 2014 and
2013 as follows:
December 31,
2014 2013
LBP’000 LBP’000
United States of America 1,359,035 1,359,061
Europe 3,384,310 3,966,808
Asia/Middle East 4,554,254 4,509,295
South America 803,734 368,046
Africa 150,986 151,028
10,252,319 10,354,238
The remaining period to maturity of the financial assets at amortized cost is as follows:
Amortized Cost Average Interest Rate
December 31, December 31,
2014 2013 2014 2013
LBP’000 LBP’000 LBP’000 LBP’000
Up to 1 year - 1,254,300 - 7.58
1 to 3 years 1,384,303 2,078,906 7.05 7.05
3 to 5 years 4,243,000 994,810 6.00 6.80
More than 5 years 4,625,016 6,026,222 6.02 6.20
10,252,319 10,354,238
The movement of financial assets at amortized cost during 2014 and 2013 is summarized as follows:
2014 2013
LBP’000 LBP’000
Balance at January 1 10,354,238 8,893,431
Additions 2,065,386 2,406,922
Redemptions ( 2,000,599) ( 987,122)
Amortization of premiums and discounts ( 14,727) ( 7,329)
Effect of foreign currency fluctuations ( 151,979) 48,336
Balance at December 31 10,252,319 10,354,238

48
11. DEFERRED ACQUISITION COSTS
The movement of deferred acquisition costs during 2014 and 2013 was as follows:
2014 2013
LBP’000 LBP’000
Balance at January 1 15,242,181 17,832,851
Net change for the year ( 2,225,659) ( 2,590,670)
Balance at December 31 13,016,522 15,242,181
12. OTHER ASSETS
This caption consists of the following:
December 31,
2014 2013
LBP’000 LBP’000
Balances outstanding between Head Office and branches 1,182,363 -
Receivable from employees 596,731 298,470
Refundable deposits 30,296 30,303
Prepayments 1,065,033 1,031,688
Receivables from tenants 438,961 545,440
Sundry debtors 1,421,981 1,828,095
4,735,365 3,733,996
Provision for doubtful receivables from tenants ( 200,675) ( 200,675)
4,534,690 3,533,321
The movement of provision for doubtful from tenants receivables during 2014 and 2013 was as
follows:
2014 2013
LBP’000 LBP’000
Balance at January 1 200,675 789,752
Reclassification - Note 7 - ( 789,752)
Additions - 200,675
Balance at December 31 200,675 200,675

49
13. PROPERTY AND EQUIPMENT
This caption consists of the following:
General
Insurance Departments Life Division
December 31, December 31,
2014 2013 2014 2013
LBP’000 LBP’000 LBP’000 LBP’000
Property:
Land - Ain Al-Mreisseh 2,792,352 2,792,352 - -
Building – Ain Al-Mreisseh 3,345,957 3,345,957 - -
Less: Accumulated depreciation ( 1,538,291) ( 1,454,642) - -
Net building after depreciation 1,807,666 1,891,315 - -
Total land and building - Ain Al-Mreisseh 4,600,018 4,683,667 - -
Subsidiary branch offices – Syria 3,768,412 4,656,216 - -
Subsidiary office land and building – Jordan 4,939,113 4,923,315 - -
Tripoli office (at cost) 273,804 273,804 - -
Chtoura office (at cost) 87,441 87,441 - -
Saida office (at cost) 248,285 248,285 - -
9,317,055 10,189,061 - -
Less: Accumulated depreciation ( 517,355) ( 336,726) - -
Net office and subsidiary building 8,799,700 9,852,335 - -
Total Property 13,399,718 14,536,002 - -
Furniture and Equipment (at cost) 10,955,047 11,427,619 1,348,255 1,306,804
Less: Accumulated depreciation ( 7,707,811) ( 7,434,829) ( 788,277) ( 682,285)
Net Furniture and Equipment 3,247,236 3,992,790 559,978 624,519
Construction in progress:
Subsidiary branch offices – Syria 3,471,773 4,429,081 - -
Total net book value of property
and equipment 20,118,727 22,957,873 559,978 624,519

50
The movement of property and equipment during 2014 and 2013 was as follows:
Furniture Construction
and in
Lands Buildings Equipment Progress Total
LBP’000 LBP’000 LBP’000 LBP’000 LBP’000
Cost:
Balance at January 1, 2013 4,136,752 6,658,032 10,016,603 11,590,480 32,401,867
Additions - 4,661,207 773,574 5,801,864 11,236,645
Disposals - - ( 81,014) - ( 81,014)
Transfers from construction in progress - 4,251,116 1,215,872 ( 5,466,988) -
Transfers to investment properties - Note 15 ( 672,201) - - ( 4,531,981) ( 5,204,182)
Effect of foreign currency fluctuations - ( 2,707,536) ( 497,416) ( 2,964,294) ( 6,169,246)
Balance at December 31, 2013 3,464,551 12,862,819 11,427,619 4,429,081 32,184,070
Additions - 154,995 395,088 - 550,083
Disposals - - ( 395,192) - ( 395,192)
Transfer to intangible assets – Note 14 - - ( 335,544) - ( 335,544)
Effect of foreign currency fluctuations - ( 1,027,001) ( 136,924) ( 957,308) ( 2,121,233)
Balance at December 31, 2014 3,464,551 11,990,813 10,955,047 3,471,773 29,882,184
Accumulated Depreciation:
Balance at January 1, 2013 - ( 1,704,811) ( 7,246,290) - ( 8,951,101)
Charge for the year - ( 171,512) ( 741,989) - ( 913,501)
Eliminated upon disposals - - 80,963 - 80,963
Effect of foreign currency fluctuations - 84,955 472,487 - 557,442
Balance at December 31, 2013 - ( 1,791,368) ( 7,434,829) - ( 9,226,197)
Charge for the year - ( 306,925) ( 812,724) - ( 1,119,649)
Eliminated upon disposals - - 358,998 - 358,998
Transfer to intangible assets – Note 14 - - 49,627 - 49,627
Effect of foreign currency fluctuations - 42,647 131,117 - 173,764
Balance at December 31, 2014 - ( 2,055,646) ( 7,707,811) - ( 9,763,457)
Net Book Value:
At December 31, 2014 3,464,551 9,935,167 3,247,236 3,471,773 20,118,727
At December 31, 2013 3,464,551 11,071,451 3,992,790 4,429,081 22,957,873
Additions to buildings in 2013 related to the acquisition of a new building in Syria.
The depreciation expense of the building in Ain-Al Mreisseh amounting to LBP84million for the years
ended December 31, 2014 and 2013 respectively is booked under “net loss from building” in the
consolidated statement of profit or loss.
During 1994, the carrying amount of Ain Al-Mreisseh property was adjusted on the basis of net
realizable value and the new value was accounted for in the light of the requirements of the Law Nº.
282 of December 30, 1993 (See Note 26 below).
Further to the above, the Group holds title of ownership in a property in Libya, registered in the Libyan
Agency of Property’s Registry in the name of Arabia Insurance Company S.A.L. This property was
nationalized in 1970. In February 1975 the Libyan Revolution Command Council appointed a
committee for the purpose of appraising the nationalized land in order to determine the value of the
compensation. However, the value of such compensation has not yet been determined.
The construction in progress represents the building under construction for the subsidiary in Syria.

51
14. INTANGIBLE ASSETS
Computer Software
General
Insurance Life
Departments Division
LBP’000 LBP’000
Cost:
Balance at January 1, 2013 1,907,125 365,454
Additions - 59,056
Effect of foreign currency fluctuations ( 220,246) -
Balance at December 31, 2013 1,686,879 424,510
Additions 235,170 64,485
Transfer from property and equipment – Note 13 335,544 -
Effect of foreign currency fluctuations ( 197,470) -
Balance at December 31, 2014 2,060,123 488,995
Accumulated Amortization:
Balance at January 1, 2013 ( 1,116,321) ( 211,050)
Amortization expense ( 218,111) ( 13,048)
Effect of foreign currency fluctuations 119,771 -
Balance at December 31, 2013 ( 1,214,661) ( 224,098)
Amortization expense ( 230,021) ( 35,718)
Transfer from property and equipment – Note 13 ( 49,627) -
Effect of foreign currency fluctuations 195,479 -
Balance at December 31, 2014 ( 1,298,830) ( 259,816)
Net Book Value:
Balance at December 31, 2014 761,293 229,179
Balance at December 31, 2013 472,218 200,412

52
15. INVESTMENT PROPERTY
Investment property represents the available area of the new headquarters of the Jordanian subsidiary
that is not used by the Group and consists of the following:
Lands Buildings Total
LBP’000 LBP’000 LBP’000
Cost:
Balance at January 1, 2013 27,913 - 27,913
Transfer from property and equipment - Note 13 672,201 4,531,981 5,204,182
Adjustments ( 9,655) - ( 9,655)
Balance at December 31, 2013 690,459 4,531,981 5,222,440
Adjustments - ( 10,493) ( 10,493)
Balance at December 31, 2014 690,459 4,521,488 5,211,947
Accumulated depreciation:
Balance at January 1, 2013 - - -
Charge for the year - ( 18,594) ( 18,594)
Balance at December 31, 2013 - ( 18,594) ( 18,594)
Charge for the year - ( 94,594) ( 94,594)
Balance at December 31, 2014 - ( 113,188) ( 113,188)
Net Book Value:
At December 31, 2014 690,459 4,408,300 5,098,759
At December 31, 2013 690,459 4,513,387 5,203,846
16. DUE TO LIFE DIVISION
The Group keeps separate books of accounts for its life division, independent from the books of the
general insurance departments and the accounting relationship between the two divisions is
represented by an inter-company current account, the balance of which as of December 31, 2014
amounted to LBP9.9billion in favor of the life division (LBP9.59billion as of December 31, 2013).
17. DUE TO BANKS
Due to banks in the general insurance departments and the life division amounting to LBP4.8billion
(LBP4.6billion as of December 31, 2013) and LBP1.5billion (LBP1.5billion as of December 31,
2013), respectively, represent loans denominated in U.S. Dollar, subject to an annual average interest
rate of 1.43% and 1.46% (1.45% and 1.46% for 2013), respectively and mature in 2015.

53
18. INSURANCE PAYABLES
This caption consists of the following:
December 31,
2014 2013
LBP’000 LBP’000
Due to sponsors, brokers and agencies 14,457,592 16,443,051
Due to garages 9,600,423 10,748,519
Due to hospitals 1,707,846 895,538
Other insurance payables 547,702 601,541
26,313,563 28,688,649
19. ACCRUED EXPENSES AND OTHER LIABILITIES
This caption consists of the following:
General Insurance
Departments Life Division
December 31, December 31,
2014 2013 2014 2013
LBP’000 LBP’000 LBP’000 LBP’000
Accrued expenses 724,569 1,287,942 49,254 57,542
Accrued commission payable 133,113 139,181 1,078,828 1,163,741
Premiums received in advance - - 4,552,125 3,605,545
Balances outstanding between
Head Office and branches - 1,086,947 - -
Shareholders' dividends payable 809,969 887,945 - -
Municipality fees and other taxes payable 1,953,859 2,058,229 61,975 56,870
Social Security National Fund 233,337 178,670 - -
Held for trading derivative liability 648,329 355,174 - -
Other credit balances 4,127,999 4,243,574 39,117 49,688
8,631,175 10,237,662 5,781,299 4,933,386
The tax returns for Lebanese operations since 2010 remain subject to examination and final
assessment by the tax authorities.
The Group’s accounts and tax returns in the other locations where the Group operates remain subject
to examination and acceptance by the related tax authorities where applicable. The extent of the tax
contingency depends on the outcome of such tax examination. Management does not expect
additional material tax claims as a result of this examination.
Deferred tax liability is attributable to the change in fair value of financial assets at FVTOCI.

54
20. INSURANCE CONTRACT LIABILITIES – GENERAL INSURANCE DEPARTMENTS
20(a). Provision for outstanding claims
Gross Reinsurers’ Share Net
December 31, December 31, December 31,
2014 2013 2014 2013 2014 2013
LBP’000 LBP’000 LBP’000 LBP’000 LBP’000 LBP’000
Marine 3,025,639 3,288,109 ( 1,617,736) ( 1,912,061) 1,407,903 1,376,048
Motor 73,326,154 71,289,021 ( 3,240,226) ( 1,858,485) 70,085,928 69,430,536
Property 8,717,363 15,370,604 ( 7,771,085) ( 13,537,638) 946,278 1,832,966
General accidents 22,591,339 31,728,980 (17,514,416) ( 26,105,169) 5,076,923 5,623,811
Workmen’s compensation 4,896,092 4,133,156 ( 755,630) ( 579,745) 4,140,462 3,553,411
Medical 6,138,549 8,172,740 ( 561,685) ( 2,535,322) 5,576,864 5,637,418
118,695,136 133,982,610 (31,460,778) ( 46,528,420) 87,234,358 87,454,190
The balance of outstanding claims relating to the motor department as at December 31, 2014 includes
an amount of LBP8.5billion (LBP8.9billion in 2013) representing provision set up by the Group in
order to cover claims incurred but not reported (IBNR).
20(b). Provision for unearned premiums
Gross Reinsurers’ Share Net
December 31, December 31, December 31,
2014 2013 2014 2013 2014 2013
LBP’000 LBP’000 LBP’000 LBP’000 LBP’000 LBP’000
Marine 2,350,915 2,561,511 ( 1,486,251) ( 1,663,415) 864,664 898,096
Motor 65,039,202 69,008,378 ( 641,622) ( 1,032,589) 64,397,580 67,975,789
Property 5,478,139 5,104,890 ( 4,188,205) ( 3,837,590) 1,289,934 1,267,300
General accidents 10,368,797 9,919,957 ( 8,380,661) ( 7,658,004) 1,988,136 2,261,953
Workmen's compensation 2,122,056 2,521,364 ( 1,499) - 2,120,557 2,521,364
Medical 10,480,171 12,412,649 ( 886,446) ( 2,233,039) 9,593,725 10,179,610
95,839,280 101,528,749 (15,584,684) ( 16,424,637) 80,254,596 85,104,112
21. LIFE INSURANCE CONTRACT LIABILITIES
Gross Reinsurers’ Share Net
December 31, December 31, December 31,
2014 2013 2014 2013 2014 2013
LBP’000 LBP’000 LBP’000 LBP’000 LBP’000 LBP’000
Liabilities relating to the
deposit components of
life insurance contracts 57,880,647 51,645,393 - - 57,880,647 51,645,393
Provision for outstanding claims 3,968,552 4,209,639 ( 2,029,620) ( 2,926,076) 1,938,932 1,283,563
Provision for unexpired risks 5,700,132 5,750,310 ( 599,867) ( 1,535,491) 5,100,265 4,214,819
Unpaid maturities, surrenders
and profits to policyholders 384,666 499,060 - - 384,666 499,060
67,933,997 62,104,402 ( 2,629,487) ( 4,461,567) 65,304,510 57,642,835

55
The movement in the gross life insurance contract liabilities is summarized below:
2014 2013
LBP’000 LBP’000
Balance at January 1 62,104,402 76,741,144
Allocation to saving components 8,600,311 7,907,029
Change in value of insurance liabilities 2,148,681 5,036,204
Change in provision for unexpired risks ( 50,178) 4,383
Change in provision for outstanding claims ( 241,087) 1,852,784
Liabilities paid on surrenders ( 4,182,560) ( 5,011,089)
Liabilities paid on maturities ( 321,361) ( 24,337,076)
Distribution of profits on matured and surrendered
policies to policyholders ( 57,614) ( 88,962)
Effect of foreign currency fluctuations ( 66,597) ( 15)
Balance at December 31 67,933,997 62,104,402
The life insurance contract liabilities include LBP38.7billion as of December 31, 2014
(LBP33.1billion as of December 31, 2013) relating to unit-linked contracts where the Group matches
the liabilities to policyholders with the related assets in a way to eliminate price, currency, credit, or
interest risk for these contracts. The change in insurance liabilities during 2014 includes positive
change in the unit prices of LBP367million (LBP3.9billion for 2013) that relates to unit-linked
products. (See note 6)
22. PROVISION FOR CONTINGENCIES AND PROVISION FOR END-OF-SERVICE INDEMNITY
Provision for contingencies:
The movement in provision for contingencies during 2014 and 2013 was as follows:
2014 2013
LBP’000 LBP’000
Balance at January 1 3,821,724 2,601,635
Additions - 1,220,089
Settlements ( 852,732) -
Balance at December 31 2,968,992 3,821,724
This provision is intended to cover loss contingencies that may occur in view of the circumstances,
which prevail in the areas where the Group operates and includes amounts to cover the likelihood of
additional levies due to uncertainties.
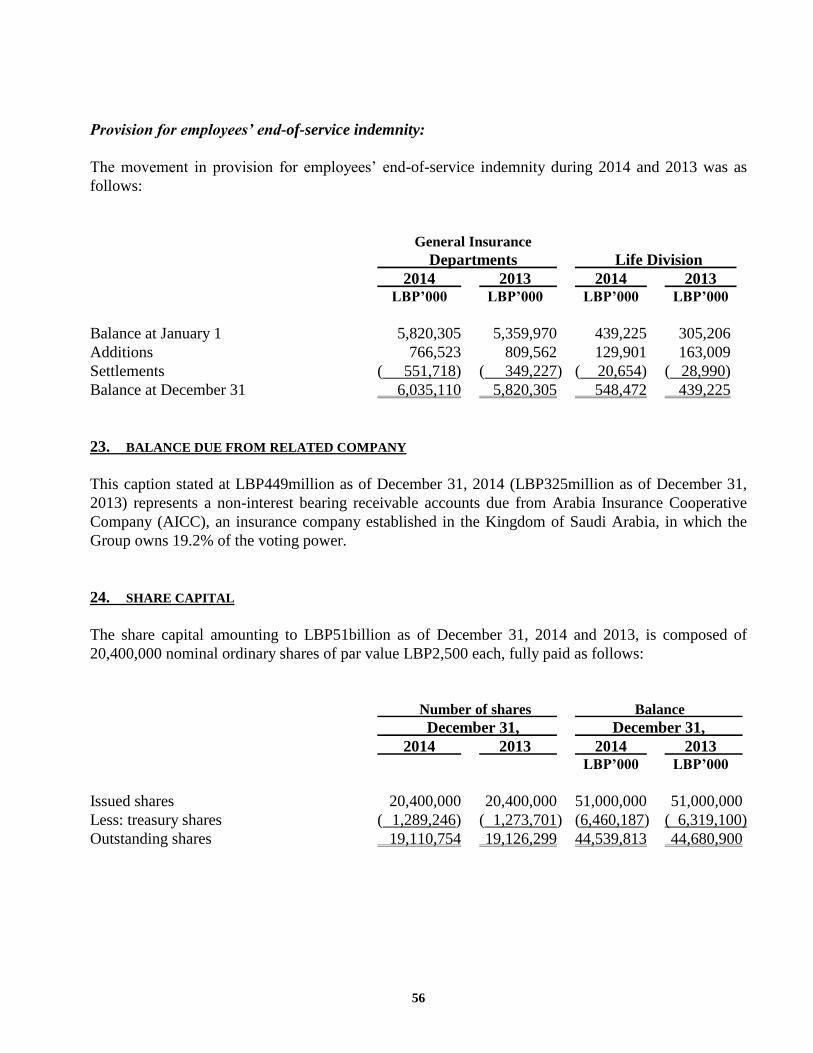
56
Provision for employees’ end-of-service indemnity:
The movement in provision for employees’ end-of-service indemnity during 2014 and 2013 was as
follows:
General Insurance
Departments Life Division
2014 2013 2014 2013
LBP’000 LBP’000 LBP’000 LBP’000
Balance at January 1 5,820,305 5,359,970 439,225 305,206
Additions 766,523 809,562 129,901 163,009
Settlements ( 551,718) ( 349,227) ( 20,654) ( 28,990)
Balance at December 31 6,035,110 5,820,305 548,472 439,225
23. BALANCE DUE FROM RELATED COMPANY
This caption stated at LBP449million as of December 31, 2014 (LBP325million as of December 31,
2013) represents a non-interest bearing receivable accounts due from Arabia Insurance Cooperative
Company (AICC), an insurance company established in the Kingdom of Saudi Arabia, in which the
Group owns 19.2% of the voting power.
24. SHARE CAPITAL
The share capital amounting to LBP51billion as of December 31, 2014 and 2013, is composed of
20,400,000 nominal ordinary shares of par value LBP2,500 each, fully paid as follows:
Number of shares Balance
December 31, December 31,
2014 2013 2014 2013
LBP’000 LBP’000
Issued shares 20,400,000 20,400,000 51,000,000 51,000,000
Less: treasury shares ( 1,289,246) ( 1,273,701) (6,460,187) ( 6,319,100)
Outstanding shares 19,110,754 19,126,299 44,539,813 44,680,900

57
The movement of the share capital during 2014 and 2013 was as follows: Surplus on Sale of Number of Share Treasury Treasury Shares Capital Shares Shares LBP’000 LBP’000 LBP’000 Balance as at January 1, 2013 19,005,147 51,000,000 ( 6,588,633) 78,541 Buy-back of ordinary shares ( 71,545) - ( 664,332) - Sale of ordinary shares 192,697 - 933,865 - Balance as at December 31, 2013 19,126,299 51,000,000 ( 6,319,100) 78,541 Buy-back of ordinary shares ( 104,060) - ( 941,705) - Sale of ordinary shares 88,515 - 800,618 - Balance as at December 31, 2014 19,110,754 51,000,000 ( 6,460,187) 78,541
25. LEGAL RESERVE
December 31,
2014 2013
LBP’000 LBP’000
Legal reserve – Parent Company 17,000,000 17,000,000
Legal reserve - Subsidiaries 6,884,634 6,619,265
23,884,634 23,619,265
In accordance with article 165 of the Lebanese Code of Commerce, the Company is required to transfer
ten percent of the annual net profit, for the years that show profit, to a reserve account until the reserve
amount equals one third of the Company’s capital. This reserve is not available for distribution.
26. ASSET REVALUATION RESERVE
During 1994, the real estate and the investments were adjusted on the basis of the net realizable value
and the new values were accounted for in accordance with the requirements of the Law Nº. 282 of
December 30, 1993. Part of this reserve was distributed to shareholders in prior years and the
remaining balance has been reflected in other comprehensive income under equity.

58
27. CUMULATIVE CHANGE IN FAIR VALUE OF FINANCIAL ASSETS AT FVOCI
The cumulative change in fair value of financial assets at FVTOCI consists of the following:
General Insurance Departments Life Division December 31, December 31, 2014 2013 2014 2013 LBP’000 LBP’000 LBP’000 LBP’000 Debt and equity securities 17,476,920 38,384,626 1,166,626 1,684,608 Funds ( 46,104) 21,798 - - 17,430,816 38,406,424 1,166,626 1,684,608 Deferred tax liabilities ( 678,194) ( 750,713) - - 16,752,622 37,655,711 1,166,626 1,684,608 Non-controlling interests - Note 29 ( 700,902) ( 741,751) - - 16,051,720 36,913,960 1,166,626 1,684,608
The movement of the cumulative change in fair value of financial assets at FVTOCI during 2014 and
2013 is summarized as follows:
(a) General Insurance Departments:
2014 2013
LBP’000 LBP’000
Balance at January 1 36,913,960 48,351,847
Net change in fair value for the year ( 21,047,865) ( 11,334,913)
Reclassified to retained earnings upon disposal
of investment securities ( 262,188) ( 24,124)
Transfer from Life division 444,014 -
Change in deferred tax 3,799 ( 78,850)
Balance at December 31 16,051,720 36,913,960
(b) Life Division:
2014 2013
LBP’000 LBP’000
Balance at January 1 1,684,608 1,540,473
Transfer to general departments ( 444,014) -
Net unrealized gain for the year 77,028 159,965
Allocation to retained earnings upon disposals ( 150,996) ( 15,830)
Balance at December 31 1,166,626 1,684,608

59
28. DISTRIBUTED / PROPOSED DIVIDENDS
The Board of Directors proposed in its meeting held on April 24, 2015 the allocation of year 2014
profit to retained earnings and the distribution of remunerations to the Board of Directors, Investment
Committee and Audit Committee of LBP537million subject to the approval of the General Assembly
of the Shareholders which will be held on May 22, 2015 to approve the Group’s consolidated financial
statements for the 2014.
In its meeting held on April 25, 2014, the General Assembly of Shareholders approved the distribution
of remunerations to the Board of Directors, Investment Committee, and Audit Committee of
LBP332million.
29. NON-CONTROLLING INTERESTS
Non-Controlling
Ownership Profit allocated to Accumulated
Interests Non-Controlling Interests Non-Controlling Interests
December 31, Year Ended December 31, December 31,
2014 2014 2013 2014 2013
% LBP’000 LBP’000 LBP’000 LBP’000
Arabia Insurance
Company – Syria 49.94 89,089 671,336 5,228,256 6,573,063
Arabia Insurance
Company – Jordan 48.56 660,156 355,699 9,725,033 9,410,157
Al-Mashriq Financial
Investment Co. S.A.L. 10.95 88,256 123,583 2,651,014 2,587,796
837,501 1,150,618 17,604,303 18,571,016
General Insurance
Departments Life Division
December 31, December 31,
2014 2013 2014 2013
LBP’000 LBP’000 LBP’000 LBP’000
Capital 25,525,657 25,185,492 - -
Fair value of Arabia Insurance
Company shares owned by
non-controlling shareholders ( 851,955) ( 851,955) - -
Cumulative change in fair value of
Arabia Insurance Company’s shares
owned by non-controlling shareholders 708,847 708,847 - -
Cumulative change in fair value of
financial assets at FVTOCI – Note 27 700,902 741,751 - -
Foreign currency translation reserve ( 14,594,823) ( 13,160,928) - -
Reserves and retained earnings 5,278,174 4,797,191 612,612 492,506
Profit for the year 837,501 1,150,618 100,610 120,106
17,604,303 18,571,016 713,222 612,612

60
Summarized financial information in respect of the Group’s subsidiaries that have material non-
controlling interests is set out below:
The summarized financial information below represents amounts before intragroup eliminations.
Arabia Insurance Company – Syria:
December 31,
2014 2013
LBP’000 LBP’000
Total assets 20,337,008 24,562,525
Total liabilities 9,867,299 11,399,809
Total equity attributable to owners of the parent company 5,241,453 6,589,653
Non-controlling interests 5,228,256 6,573,063
Year Ended
December 31,
2014 2013
LBP’000 LBP’000
Net insurance income/(loss) 63,161 ( 91,204)
Net investment income 882,806 2,538,475
Other expenses, net ( 767,565) ( 1,102,905)
Profit for the year 178,402 1,344,366
Attributable to owners of the parent company 89,313 673,030
Attributable to non-controlling interests 89,089 671,336
178,402 1,344,366

61
Arabia Insurance Company – Jordan (General Insurance Departments):
December 31,
2014 2013
LBP’000 LBP’000
Total assets 61,357,448 59,845,392
Total liabilities 41,330,609 40,466,981
Total equity attributable to owners of the parent company 10,301,806 9,968,254
Non-controlling interests 9,725,033 9,410,157
Year Ended
December 31,
2014 2013
LBP’000 LBP’000
Net insurance income 1,514,018 620,609
Net investment income 1,417,536 1,332,074
Other expenses, net ( 1,572,089) ( 1,220,189)
Profit for the year 1,359,465 732,494
Attributable to owners of the parent company 699,309 376,795
Attributable to non-controlling interests 660,156 355,699
1,359,465 732,494

62
30. CONSOLIDATED STATEMENT OF INCOME AND EXPENSES OF THE GENERAL INSURANCE DEPARTMENTS For The Year Ended December 31, 2014
General Workmen’s Reinsurance
Marine Motor Property Accidents Compensation Medical Inwards Total
LBP’000 LBP’000 LBP’000 LBP’000 LBP’000 LBP’000 LBP’000 LBP’000
Income:
Premiums 8,816,682 146,903,356 15,666,757 23,118,805 4,799,849 24,844,488 357,553 224,507,490
Reinsurers’ share ( 5,615,213) ( 22,958,025) ( 12,857,067) ( 18,659,821) ( 55,501) ( 2,983,325) - ( 63,128,952)
Group's share 3,201,469 123,945,331 2,809,690 4,458,984 4,744,348 21,861,163 357,553 161,378,538
Policy fees 185,419 2,815,071 163,645 118,515 51,601 127,058 - 3,461,309
Other fees 1,092 2,319,494 4,195 7,060 5,642 1,096,159 - 3,433,642
Total fees 186,511 5,134,565 167,840 125,575 57,243 1,223,217 - 6,894,951
Net unearned premiums at beginning of year - note 20 898,096 67,975,789 1,267,300 2,261,953 2,521,364 10,179,610 - 85,104,112
Net unearned premiums at end of year - note 20 ( 864,664) ( 64,397,580) ( 1,289,934) ( 1,988,136) ( 2,120,557) ( 9,593,725) - ( 80,254,596)
Effect of foreign currency fluctuations ( 3,966) ( 398,959) ( 244) ( 6,970) - ( 90,675) - ( 500,814)
Net change in unearned premiums 29,466 3,179,250 ( 22,878) 266,847 400,807 495,210 - 4,348,702
Commissions from reinsurers 2,051,056 72,390 3,364,822 3,324,626 1,329 182,150 - 8,996,373
Other income 302,259 - 86,969 599,800 - 246,060 - 1,235,088
Total income 5,770,761 132,331,536 6,406,443 8,775,832 5,203,727 24,007,800 357,553 182,853,652
Expenses:
Outstanding claims at beginning of year - note 20 ( 3,288,109) ( 71,289,021) ( 15,370,604) ( 31,728,980) ( 4,133,156) ( 8,172,740) - ( 133,982,610)
Reinsurers’ share - note 20 1,912,061 1,858,485 13,537,638 26,105,169 579,745 2,535,322 - 46,528,420
Effect of foreign currency fluctuations 4,421 1,120,450 36,594 ( 339,634) ( 6) 368,398 - 1,190,223
Group's share ( 1,371,627) ( 68,310,086) ( 1,796,372) ( 5,963,445) ( 3,553,417) ( 5,269,020) - ( 86,263,967)
Outstanding claims at end of year - note 20 3,025,639 73,326,154 8,717,363 22,591,339 4,896,092 6,138,549 - 118,695,136
Reinsurers’ share - note 20 ( 1,617,736) ( 3,240,226) ( 7,771,085) ( 17,514,416) ( 755,630) ( 561,685) - ( 31,460,778)
Group's share 1,407,903 70,085,928 946,278 5,076,923 4,140,462 5,576,864 - 87,234,358
Net change in outstanding claims 36,276 1,775,842 ( 850,094) ( 886,522) 587,045 307,844 - 970,391
Claims paid net of recoveries 714,569 94,725,871 7,193,955 9,982,587 3,548,861 26,618,825 292,668 143,077,336
Reinsurers' share ( 324,326) ( 5,841,455) ( 6,102,796) ( 8,190,619) ( 71,280) ( 4,644,425) - ( 25,174,901)
Group's share 390,243 88,884,416 1,091,159 1,791,968 3,477,581 21,974,400 292,668 117,902,435
Commissions paid 1,177,144 21,542,087 1,578,711 1,637,982 980,591 2,593,497 68,500 29,578,512
Direct other expenses 49,766 1,574,243 171,937 23,573 55,330 946,097 - 2,820,946
Departments’ share of general expenses - note 31 1,017,330 16,484,491 1,847,558 2,841,259 524,318 2,623,225 47,679 25,385,860
Total expenses 2,670,759 130,261,079 3,839,271 5,408,260 5,624,865 28,445,063 408,847 176,658,144
Net income of insurance departments 3,100,002 2,070,457 2,567,172 3,367,572 ( 421,138) ( 4,437,263) ( 51,294) 6,195,508

63
For The Year Ended December 31, 2013
General Workmen’s Reinsurance
Marine Motor Property Accidents Compensation Medical Inwards Total
LBP’000 LBP’000 LBP’000 LBP’000 LBP’000 LBP’000 LBP’000 LBP’000
Income:
Premiums 11,230,732 152,682,421 15,598,784 24,234,076 5,302,347 28,244,997 174,233 237,467,590
Reinsurers’ share ( 7,871,702) ( 24,820,530) ( 12,693,122) ( 19,263,295) ( 43,488) ( 5,565,714) - ( 70,257,851)
Group's share 3,359,030 127,861,891 2,905,662 4,970,781 5,258,859 22,679,283 174,233 167,209,739
Policy fees 173,257 2,659,635 174,562 122,426 63,118 109,198 - 3,302,196
Other fees 994 2,420,913 5,296 6,052 5,029 1,134,070 - 3,572,354
Total fees 174,251 5,080,548 179,858 128,478 68,147 1,243,268 - 6,874,550
Net unearned premiums at beginning of year - note 20 1,083,102 74,739,174 1,323,013 2,182,693 3,033,992 8,008,751 - 90,370,725
Net unearned premiums at end of year - note 20 ( 898,096) ( 67,975,789) ( 1,267,300) ( 2,261,953) ( 2,521,364) ( 10,179,610) - ( 85,104,112)
Effect of foreign currency fluctuations ( 7,057) ( 1,688,556) ( 47,427) 56,133 - (311,102) - ( 1,998,009)
Net change in unearned premiums 177,949 5,074,829 8,286 ( 23,127) 512,628 ( 2,481,961) - 3,268,604
Commissions from reinsurers 2,282,847 78,838 3,613,477 3,645,348 3,366 248,406 - 9,872,282
Other income 399,283 - 95,276 530,928 - 195,913 - 1,221,400
Total income 6,393,360 138,096,106 6,802,559 9,252,408 5,843,000 21,884,909 174,233 188,446,575
Expenses:
Outstanding claims at beginning of year - note 20 ( 4,598,190) ( 68,266,525) ( 18,939,665) ( 22,398,292) ( 3,566,856) ( 7,275,976) - ( 125,045,504)
Reinsurers’ share - note 20 2,696,682 3,163,539 16,990,232 18,533,898 520,971 4,815,044 - 46,720,366
Effect of foreign currency fluctuations 40,359 3,841,046 28,984 86,790 4 120,827 - 4,118,010
Group's share ( 1,861,149) ( 61,261,940) ( 1,920,449) ( 3,777,604) ( 3,045,881) ( 2,340,105) - ( 74,207,128)
Outstanding claims at end of year - note 20 3,288,109 71,289,021 15,370,604 31,728,980 4,133,156 8,172,740 - 133,982,610
Reinsurers’ share - note 20 ( 1,912,061) ( 1,858,485) ( 13,537,638) ( 26,105,169) ( 579,745) ( 2,535,322) - ( 46,528,420)
Group's share 1,376,048 69,430,536 1,832,966 5,623,811 3,553,411 5,637,418 - 87,454,190
Net change in outstanding claims ( 485,101) 8,168,596 ( 87,483) 1,846,207 507,530 3,297,313 - 13,247,062
Claims paid net of recoveries 754,240 101,377,232 11,385,428 5,303,917 3,987,342 27,545,135 404,022 150,757,316
Reinsurers' share ( 43,175) ( 7,017,762) ( 10,009,703) ( 3,726,657) ( 45,381) ( 14,191,507) - ( 35,034,185)
Group's share 711,065 94,359,470 1,375,725 1,577,260 3,941,961 13,353,628 404,022 115,723,131
Commissions paid 1,095,597 22,184,480 1,662,301 1,549,947 1,132,725 3,085,292 151,350 30,861,692
Direct other expenses 56,615 1,465,062 183,082 1,309 62,923 1,160,117 - 2,929,108
Departments’ share of general and
administrative expenses - note 31 1,440,837 15,399,949 1,994,054 3,152,834 599,413 3,383,011 7,090 25,977,188
Total expenses 2,819,013 141,577,557 5,127,679 8,127,557 6,244,552 24,279,361 562,462 188,738,181
Net income of insurance departments 3,574,347 ( 3,481,451) 1,674,880 1,124,851 ( 401,552) ( 2,394,452) ( 388,229) ( 291,606)

64
31. GENERAL AND ADMINISTRATIVE EXPENSES
a) General Insurance Departments:
Total general and administrative expenses of general insurance departments amounting to
LBP38.5billion and LBP42billion for the years ended December 31, 2014 and 2013, respectively are
allocated as follows:
2014 2013
LBP’000 LBP’000
Allocated to general insurance departments - Note 30 25,385,860 25,977,188
Unallocated share of the head office 10,890,958 13,740,954
Life division share 2,200,000 2,200,000
38,476,818 41,918,142
Total general and administrative expenses in 2014 and 2013 consist of the following:
2014 2013
LBP’000 LBP’000
Salaries and related charges 23,528,219 23,438,440
General operating expenses 13,682,578 17,413,145
Depreciation and amortization expense 1,266,021 1,066,557
38,476,818 41,918,142
The expenses allocated to the general insurance departments are made on the basis of the ratio of the
net premiums of each department to the total net premiums.
Depreciation expense of Ain Al Mreisseh building in the amount of LBP84million in 2014 and 2013 is
recognized under “net loss from building” in the consolidated statement of profit or loss.
(b) Life Division:
Total general and administrative expenses of the life division are distributed as follows:
2014 2013
LBP’000 LBP’000
Salaries and related charges 7,107,855 6,052,219
General operating expenses 2,713,434 2,852,242
Depreciation of furniture and equipment 109,147 110,025
Amortization of computer software 35,717 13,048
9,966,153 9,027,534

65
32. FAIR VALUE OF FINANCIAL INSTRUMENTS
The following table shows the fair values of financial assets recognized in the financial statements, including their levels in the fair value hierarchy. It
does not include financial assets and financial liabilities which are not measured at fair value and where the directors consider that the carrying
amounts of these financial assets and liabilities are reasonable approximations of their fair value:
General Insurance Departments
December 31, 2014
Level 1 Level 2 Level 3 Total Valuation Technique and Key Inputs
LBP’000 LBP’000 LBP’000 LBP’000
Financial assets at fair value through profit of loss:
Foreign corporate bonds - quoted 491,489 - - 491,489 Quoted prices in an active market
Equity securities - quoted 7,748,078 - - 7,748,078 Quoted prices in an active market
Funds - quoted 7,250,864 - - 7,250,864 Quoted prices in an active market
Funds - unquoted - - 510,958 510,958 Net asset value
15,490,431 - 510,958 16,001,389
Financial assets at fair value through
other comprehensive income:
Foreign corporate bonds - unquoted - - 150,750 150,750 Management estimate based on unobservable input related to
market volatility and liquidity
Equity securities - quoted 63,677,008 - - 63,677,008 Quoted prices in an active market
Equity securities - unquoted - - 10,117,559 10,117,559 Net book value
Funds - unquoted - 517,172 - 517,172 Net asset value
63,677,008 517,172 10,268,309 74,462,489
Financial assets at amortized cost:
Lebanese corporate bonds - unquoted - - 152,449 152,449 Management estimate based on unobservable input related to
market volatility and liquidity
Lebanese government bonds - unquoted - 753,750 - 753,750 DCF at a discount rate determined based on the yield on USA
treasury bills and the Credit Default Swap applicable to
Lebanon subject to illiquidity factor
Foreign corporate bonds - quoted 9,702,452 - - 9,702,452 Quoted prices in an active market
9,702,452 753,750 152,449 10,608,651

66
General Insurance Departments
December 31, 2013
Level 1 Level 2 Level 3 Total Valuation Technique and Key Inputs
LBP’000 LBP’000 LBP’000 LBP’000
Financial assets at fair value through profit of loss:
Foreign corporate bonds - quoted 1,176,509 - - 1,176,509 Quoted prices in an active market
Equity securities - quoted 3,863,553 - - 3,863,553 Quoted prices in an active market
Funds - quoted 7,749,899 - - 7,749,899 Quoted prices in an active market
Funds - unquoted - - 509,610 509,610 Net asset value
Commodities - quoted 364,708 - - 364,708 Quoted prices in an active market
13,154,669 - 509,610 13,664,279
Financial assets at fair value through
other comprehensive income:
Foreign corporate bonds - quoted 3,913,551 - - 3,913,551 Quoted prices in an active market
Foreign corporate bonds - unquoted - - 150,750 150,750 Management estimate based on unobservable input related to
market volatility and liquidity
Equity securities - quoted 86,171,333 - - 86,171,333 Quoted prices in an active market
Equity securities - unquoted - 9,440,668 9,440,668 Net book value
Funds - unquoted - 585,074 - 585,074 Net asset value
90,084,884 585,074 9,591,418 100,261,376
Financial assets at amortized cost:
Lebanese corporate bonds - unquoted - - 378,574 378,574 Management estimate based on unobservable input related to
market volatility and liquidity
Lebanese government bonds - unquoted - 730,987 - 730,987 DCF at a discount rate determined based on the yield on USA
treasury bills and the Credit Default Swap applicable
to Lebanon subject to illiquidity factor
Foreign corporate bonds - quoted 11,266,515 - - 11,266,515 Quoted prices in an active market
11,266,515 730,987 378,574 12,376,076

67
Life Division
December 31, 2014
Level 1 Level 2 Level 3 Total Valuation Technique and Key Inputs
LBP’000 LBP’000 LBP’000 LBP’000
Financial assets at fair value through profit of loss:
Foreign bonds - quoted 444,072 - - 444,072 Quoted prices in an active market
Equity securities - quoted 206,315 - - 206,315 Quoted prices in an active market
Unit-linked funds - quoted 38,651,227 - - 38,651,227 Quoted prices in an active market
39,301,614 - - 39,301,614
Financial assets at fair value through
other comprehensive income:
Equity securities - quoted 449,579 - - 449,579 Quoted prices in an active market
Equity securities - unquoted - - 1,911,645 1,911,645 Management estimate based on unobservable input related to
449,579 - 1,911,645 2,361,224 market volatility and liquidity
Financial assets at amortized cost:
Lebanese corporate bonds - unquoted - - 748,097 748,097 Management estimate based on unobservable input related
to market volatility and liquidity
Lebanese government bonds - unquoted - 1,018,694 - 1,018,694 DCF at a discount rate determined based on the yield on USA
treasury bills and the Credit Default Swap applicable to
Lebanon subject to illiquidity factor
Foreign corporate bonds - quoted 9,138,404 - - 9,138,404 Quoted prices in an active market
9,138,404 1,018,694 748,097 10,905,195

68
Life Division
December 31, 2013
Level 1 Level 2 Level 3 Total Valuation Technique and Key Inputs
LBP’000 LBP’000 LBP’000 LBP’000
Financial assets at fair value through profit of loss:
Lebanese corporate bonds - unquoted - - 150,750 150,750 Management estimate based on unobservable input related
to market volatility and liquidity
Foreign bonds - quoted 303,767 - - 303,767 Quoted prices in an active market
Equity securities - quoted 307,415 - - 307,415 Quoted prices in an active market
Unit-linked funds - quoted 33,098,282 - - 33,098,282 Quoted prices in an active market
33,709,464 - 150,750 33,860,214
Financial assets at fair value through
other comprehensive income:
Equity securities - quoted 499,278 - - 499,278 Quoted prices in an active market
Equity securities - unquoted - - 2,394,287 2,394,287 Management estimate based on unobservable input related
to market volatility and liquidity
499,278 - 2,394,287 2,893,565
Financial assets at amortized cost:
Lebanese corporate bonds - unquoted - - 754,006 754,006 Management estimate based on unobservable input related
to market volatility and liquidity
Lebanese government bonds - unquoted - 934,273 - 934,273 DCF at a discount rate determined based on the yield on USA
treasury bills and the Credit Default Swap applicable
to Lebanon subject to illiquidity factor
Foreign corporate bonds - quoted 7,921,765 - - 7,921,765 Quoted prices in an active market
7,921,765 934,273 754,006 9,610,044
There have been no transfers between Level 1, Level 2 and Level 3 during the year.

69
33. INSURANCE AND FINANCIAL RISK MANAGEMENT
(A) Insurance Risk for General Departments:
The risk under any one insurance contract is the possibility that the insured event occurs and the
uncertainty of the amount of the resulting claim. By the nature of an insurance contract, this risk is
random and therefore unpredictable.
The principal risk that the Group faces under its insurance contracts is that the actual claims and
benefit payments exceed the carrying amount of the insurance liabilities, in addition to probability of
underpricing of risks, imposing inadequate terms or selecting low quality or uninsurable risks. Thus
the frequency or severity of claims and benefits become greater than estimated. Insurance events are
random and the actual number and amount of claims and benefits will vary from year to year from the
estimate established.
Experience shows that the larger the portfolio of similar insurance contracts, the smaller the relative
variability about the expected outcome will be. In addition, a more diversified portfolio is less likely to
be affected across the board by a change in any subset of the portfolio. The Group has developed its
insurance underwriting strategy to diversify the type of insurance risks accepted and within each of
these categories to achieve a sufficiently large population of risks to reduce the variability of the
expected outcome.
The Group manages risks through its underwriting strategy, adequate reinsurance arrangements and
proactive claims handling. The underwriting strategy attempts to ensure that the underwritten risks are
well diversified in terms of type and amount of risk, industry and geography. Underwriting limits are
in place to enforce appropriate risk selection criteria.
(B) Life Insurance Risk
In the life insurance business a distinction is drawn between three types of underwriting risk: -
longevity, death and disability. The Group conducts an annual review and analysis of its customers
portfolios with regard to mortality, cancellation and reactivation. To manage disability risk and
improve risk performance, individual evaluations are used along the portfolio analyses for disability
risk to allow a better assessment of the exposure structure. The information gained is used in setting
appropriate prices and rates as well as ensuring that reserves are sufficient for future insurance
obligations to be met at all times. It also forms the basis for determining the risk capital that will be
required to offset unexpected deviations in the actuarial reserves.
(C) Reinsurance Risk
In common with other insurance companies, in order to minimize financial exposure arising from large
insurance claims, the Group, in the normal course of business, enters into arrangements with other
parties for reinsurance purposes.
70
To minimize its exposure to significant losses from reinsurer insolvencies, the Group evaluates the
financial condition of its reinsurers and monitors concentrations of credit risk arising from similar
geographic regions, activities or economic characteristics of the reinsurers.
The Group enters into reinsurance treaties that provide for the required capacities that fit its risk
profiles at competitive costs, while optimizing its retention levels through yearly as if exercises, taking
into consideration financial resources such as equity capital and free reserves, portfolio size and liquid
assets. Its retention levels fit the empirical rules and general benchmarks, and, most importantly,
ensure that the Group's solvency ratio remains high.
Reinsurance ceded contracts do not relieve the Group from its obligations to policyholders. The
Group remains liable to its policyholders for the portion reinsured to the extent that any reinsurer does
not meet the obligations assumed under the reinsurance agreements.
(D) Sensitivity of underwriting profit and losses
The Group does not foresee any significant reduction in the profit contributed by the insurance
operations to the total profit of the Group due to the following reasons:
The Group has an overall retained premiums level of 72% (70% for 2013) of the gross written
premiums, and is mainly contributed by one class of business (i.e., Motor line) wherein the retention
level is 84% (84% for 2013). However, in this class the risk is adequately covered by excess of loss
reinsurance programs to guard against major financial impact.
The gross written premiums of the Motor lines decreased by around 3.6% in 2014 compared to 2013
(0.2% in 2013 compared to 2012), and the corresponding retained premiums decreased by 3.1% for the
same period (4.8% for the previous year period).
The Group's reinsurance commission earnings decreased by around 8.9% in 2014 compared to 2013
(6% in 2013 compared to 2012). These earnings remain a comfortable source of technical revenues.
The Group's policy is balancing its insurance portfolio through increasing its non-motor lines which
have higher returns on premiums than motor, and which have a lower retained premiums level than
motor, due to the fact that they are reinsured by treaties that keep their retained exposure at a safe level
to protect the results from random fluctuations, while at the same time improving the profitability of
its motor lines through a combination of underwriting measures and excess of loss treaties that would
protect the motor lines from peak losses. Hence, the Group is comfortable to maintain acceptable net
loss ratios and does not foresee any serious financial impact in the insurance net profit.
71
(E) Dealing with the accumulation of insurance risk
Concentration or accumulation of insurance risk is dealt with by the Group depending on the
concerned line of business:
(a) Marine Cargo, and for known accumulation of policies/declarations on one vessel, an
arrangement is usually made with reinsurers to reinsure the said vessel exceptionally on a
"per bottom basis" (as opposed to the normal arrangement of a "per policy basis").
(b) For Property business (Fire and Burglary):
1. In respect of small accumulation of insured risks, the group limits retained exposure by
not taking 1 retention for every risk when there are 2 or more insured adjacent risks,
whereby is reduced.
2. In respect of large accumulated or catastrophic exposures under Property, especially
from natural hazards such as earthquake, our Property reinsurers cover the group for
their shares of same.
3. In respect of accumulation of the retentions under our Property business, this is covered
by a per event non-proportional treaty.
(c) Motor business is covered by per occurrence excess of loss treaties that also cover
involvement of more than one vehicle in one accident.
(d) For the Liability adequacy test, the Group has built up over the years reserves for
contingencies which would serve as well to offset any large event affected by a concentration
of insured risks, either in the same line of insurance or across the different lines of insurance
covered by the Group.
(F) Market Risk
Market risk is the risk that arises from fluctuations in the value of, or income from, assets or in interest
or foreign exchange rates, including the risks arising from the mismatching of assets and liabilities.
Life insurers are also exposed to market risks on the liabilities side of their statement of financial
positions, especially interest rate risks stemming from the sale of long-term insurance policies with
interest guarantees. Because the clients often take on long-term commitments, in addition to the
guarantees they expect to profit from up trends on the financial markets in the form of bonuses.
Options embedded in the insurance policies afford clients the necessary flexibility for long-term
agreement. These three elements; guarantee, bonuses and options, essentially determine the financial
risk of classical, life insurance and policies. The Group seeks to reduce market risks by ensuring a
high level of diversification both in its investment portfolio and direct investments, hence, most of the
branch assets are invested in bank deposits with low market risk involved.

72
Interest Rate Risk
The Group's interest rate risk arises from the possibility that changes in market interest rates will affect
the value of interest earning assets and interest bearing liabilities. The financial assets of the Group are
subject to fixed and floating interest rates and thus there is significant risk on the Group. Most of
financial liabilities of the Group are non-interest bearing.
Currency Risk:
Currency risk arises from the possibility that changes in foreign exchange rates will affect the value of
financial assets and liabilities stated in foreign currencies, whereby, the Group does not hedge its
currency exposure by means of hedging instruments.

73
Monetary assets and monetary liabilities of the general insurance departments are distributed between Lebanese Pound and other major foreign
currencies as follow:
December 31, 2014
Lebanese U.S. Syrian Arab Currencies Other
Pound Dollar Pound Linked to USD Currencies Total
LBP’000 LBP’000 LBP’000 LBP’000 LBP’000 LBP’000
MONETARY ASSETS
Cash and banks 13,727,069 29,034,106 10,198,166 105,766,224 331,009 159,056,574
Financial assets at fair value through profit or loss - 8,857,364 208,809 3,074,239 3,860,977 16,001,389
Insurance receivables - 9,930,325 297,602 46,888,784 - 57,116,711
Due from reinsurers - 24,168,170 - - - 24,168,170
Financial assets at fair value through other
comprehensive income 6,539,955 6,084,932 - 60,733,473 1,105,846 74,464,206
Financial assets at amortized cost - 8,285,938 - 802,652 1,708,703 10,797,293
Reinsurance assets 7,199,034 - 1,682,235 38,164,193 - 47,045,462
Deferred acquisition costs 5,737,694 - - 7,278,828 - 13,016,522
Other assets 2,096,755 163,525 623,362 1,651,048 - 4,534,690
Due from related company - - - 448,900 - 448,900
Total monetary assets 35,300,507 86,524,360 13,010,174 264,808,341 7,006,535 406,649,917
MONETARY LIABILITIES
Due to banks - 4,813,848 - - - 4,813,848
Insurance payables - 1,220,782 112,536 24,980,245 - 26,313,563
Payables to insurance and reinsurance companies - 13,621,431 - - - 13,621,431
Income tax payable 2,124,129 - 151,905 - - 2,276,034
Accrued expenses and other liabilities 7,063,024 964,335 224,611 379,205 - 8,631,175
Provision for outstanding claims 20,466,353 - 5,935,538 92,293,245 - 118,695,136
Provision for unearned premiums 19,502,187 - 2,098,920 74,238,173 - 95,839,280
Unearned commission from reinsurers 499,366 - - 2,137,210 - 2,636,576
Provision for employees' end-of-service indemnity 2,360,160 - - 3,674,950 - 6,035,110
Provision for contingencies 1,176,930 - - 1,792,062 - 2,968,992
Deferred tax liability 716,719 - - - - 716,719
Due to Life division 9,907,237 - - - - 9,907,237
Total monetary liabilities 63,816,105 20,620,396 8,523,510 199,495,090 - 292,455,101
Net position ( 28,515,598) 65,903,964 4,486,664 65,313,251 7,006,535 114,194,816

74
December 31, 2013
Lebanese U.S. Syrian Arab Currencies Other
Pound Dollar Pound Linked to USD Currencies Total
LBP’000 LBP’000 LBP’000 LBP’000 LBP’000 LBP’000
MONETARY ASSETS
Cash and banks 11,140,646 25,053,169 11,235,201 99,310,286 ( 353,191) 146,386,111
Financial assets at fair value through profit or loss - 9,036,785 272,080 2,469,864 1,897,933 13,676,662
Insurance receivables - 14,909,199 469,954 55,423,363 6,909 70,809,425
Due from reinsurers - 25,975,774 - - - 25,975,774
Financial assets at fair value through other comprehensive
income 6,541,203 6,315,573 - 86,208,098 1,203,304 100,268,178
Financial assets at amortized cost - 9,318,355 - 802,652 2,124,304 12,245,311
Reinsurance assets 12,192,675 - 1,934,065 48,826,317 - 62,953,057
Deferred acquisition costs 7,228,189 - - 8,013,992 - 15,242,181
Other assets 350,460 354,996 1,088,682 1,670,986 68,197 3,533,321
Due from related company - - - 325,146 - 325,146
Total monetary assets 37,453,173 90,963,851 14,999,982 303,050,704 4,947,456 451,415,166
MONETARY LIABILITIES
Due to banks - 4,550,036 - - - 4,550,036
Insurance payables 50,040 618,657 79,534 27,939,401 1,017 28,688,649
Payables to reinsurance companies - 11,675,848 - - - 11,675,848
Income tax payable 1,494,039 - 159,645 1,203,502 - 2,857,186
Accrued expenses and other liabilities ( 6,232,916) 1,796,706 304,206 14,279,782 89,884 10,237,662
Provision for outstanding claims 23,784,175 - 7,181,450 103,016,985 - 133,982,610
Provision for unearned premiums 23,761,686 - 2,104,634 75,662,429 - 101,528,749
Unearned commission from reinsurers 647,593 - - 1,934,527 - 2,582,120
Provision for employees' end-of-service indemnity 1,688,074 - - 4,132,231 - 5,820,305
Provision for contingencies 1,176,930 - - 2,644,794 - 3,821,724
Deferred tax liability 1,341,481 - - ( 905,508) - 435,973
Due to Life division 9,588,991 - - - - 9,588,991
Total monetary liabilities 57,300,093 18,641,247 9,829,469 229,908,143 90,901 315,769,853
Net position ( 19,846,920) 72,322,604 5,170,513 73,142,561 4,856,555 135,645,313

75
(G) Liquidity risk
Liquidity risk is the risk that cash may not be available to pay obligations when due to a reasonable
cost.
The credit risk on liquid funds is limited because the counter-parties are banks with high credit ratings
assigned by international credit rating agencies. All the fixed deposits mature within different periods
not exceeding one year from the reporting date.
In addition, the Group's reinsurance contracts comprise, in addition to quarterly settlements of
balances, cash loss provisions that warrant the immediate settlement of the reinsurers of their shares of
a claim when same reach a certain amount.
(H) Credit Risk:
Credit risk concerns the possibility that debtors may no longer be able to meet their obligations.
Responsibility for monitoring credit risks lies with the individual companies, which follow stringent
Group-wide guidelines with regard to minimum borrower ratings and the diversification of credit risks
across all areas in which the Group is exposed to such risks, in particular the investment and
reinsurance segments.
The Group's principal financial assets that are subject to credit risks are bank balances, insurance and
other receivables, reinsurance receivables and investment portfolio.
The Group's credit risk is primarily attributable to its insurance receivables. The amounts presented in
the statement of financial position are net of allowances for doubtful receivables. An allowance for
impairment is made where there is an identified loss event which, based on previous experience, is
evidence of a reduction in the recoverability of the cash flows.
The Group has no significant concentration of credit risk, with exposure spread over a large number of
counterparties and customers.
34. CAPITAL MANAGEMENT
The Group manages its capital to ensure the Group’s ability to continue as a going concern, while
maximizing the return through the optimization of the liabilities and equity balance.
The Group manages the capital structure and makes the necessary revisions, in light of changes in the
economics of the business and the market conditions, and the risk characteristics of operations and
underlying assets. The Group’s overall strategy remains unchanged from prior year.
The capital structure of the Group consists of liabilities (excluding provision for contingencies and
offset by cash and cash equivalents) and equity of the Group.

76
The Group monitors the capital risk on the basis of the ratio of net liabilities to equity. The ratio as at
December 31, 2014 and 2013 was as follows:
December 31,
2014 2013
LBP’000 LBP’000
Liabilities (excluding provision for contingencies) 289,486,109 311,948,129
Less: Cash and cash equivalents ( 66,971,730) ( 73,691,834)
Net liabilities 222,514,379 238,256,295
Total equity 140,173,595 164,279,250
Gearing Ratio 1.59 1.45
35. CONTINGENT LIABILITIES
The Group is contingently liable as at December 31, 2014 and 2013 in respect of guarantees
aggregating LBP27.3billion and LBP24.2billion respectively, issued in accordance with legal
requirements as security to policies issued (general branches and life branch). The majority of these
guarantees are covered by pledged funds deposited by the Group with the banks issuing these
guarantees.
36. NON CASH TRANSACTIONS
The following non cash transactions relating to investing and financing activities were excluded from
the statement of cash flows of the general insurance and the life division for 2014 and 2013:
General Insurance Departments:
- The net change in fair value of financial assets at fair value through other comprehensive income
amounted to LBP20.6billion during 2014 (LBP11.45billion for 2013) of which fair value gain of
LBP40million (fair value loss of LBP214million in 2013) related to non-controlling interests against
investment securities.
- Transfer of investment securities at FVTOCI along with related cumulative change in fair value in
the amount of LBP445million and LBP444million respectively, from the life division during 2014.
- Transfer of computer software with a net carrying value of LBP286million from property and
equipment to intangible assets during 2014.
- Transfer of lands and buildings under construction in the amount of LBP5.2billion during 2013 to
investment properties.
Life Division:
- The net change in fair value of financial assets at fair value through other comprehensive income
amounted to LBP74million during 2014 (LBP144million in 2013) against investment securities.
- Transfer of investment securities at FVTOCI along with related cumulative change in fair value in
the amount of LBP445million and LBP444million respectively to the general insurance departments
during 2014.

77
37. OTHER RESTRICTED RESERVE
General insurance departments:
In accordance with Article 10(bis) (b) amended by Capital Market Authority decision No. 19/2007 of
the Oman Insurance Companies executive regulation, 10% of the outstanding claims as of year-end, if
reporting profits, is transferred to a contingency reserve, until such reserve becomes equal to RO
5,000,000.
Life division:
In accordance with Article 10(bis) (c) amended by Capital Market Authority decision No. 19/2007 of
the Oman Insurance Companies executive regulation, 1% of the annual life premiums, if reporting
profits, is transferred to a contingency reserve, until such reserve becomes equal to RO 5,000,000. This
contingency reserve shall be allocated to meet any underwriting loss that might occur in the life
assurance division in any one year.
The other restricted reserve under the general insurance departments and the life division is not
available for dividend distribution.
38. PARTICIPATION IN SYNDICATES AND INSURANCE POOLS
The group participates in the Arab War Risk Insurance Syndicate (AWRIS), an insurance syndicate
registered in Bahrain, specializing in War Risk Insurance and composed of group of insurance
companies that share profits proportionally in accordance with each company’s ceded premiums’ share
to the total premiums of the syndicate.
The Group also participates in the accumulated “Syndicate” and “Contingency” reserves of “AWRIS”,
noting that this participation in reserves is only due to the Group upon its withdrawal from the
Syndicate or upon the liquidation of the Syndicate, after recalculating the value of participation at that
date and based on certain contractual conditions.
In addition to above, the Group participates in other syndicates and insurance pools, the most
important of which are:
- The Lebanese Insurance Pool of The Orange Card
- The Lebanese Insurance Pool of Engineering Risks
- Bankers Blanket Bond Pool
The profits of these participations are recorded in the related insurance branches.
39. COMPARATIVE INFORMATION
Certain prior year figures were reclassified to confirm with current year presentation in particular the
reclassification of LBP6.62billion from retained earnings to legal reserve.
40. APPROVAL OF THE FINANCIAL STATEMENTS
The consolidated financial statements for the year ended December 31, 2014 were approved by the
Board of Directors on April 24, 2015.

Form 2201.00
78