about 2° investing initiative
TRANSCRIPT

1

2
ABOUT 2° INVESTING INITIATIVE
2° Investing Initiative (2°ii) is a not-for-profit think tank working to align the financial sector with the
2°C climate goal and long-term investing needs. With offices in Paris, London, Berlin and New York,
the Initiative engages a global network, including financial institutions, investment researchers, asset
managers, policymakers, financial supervisors, research institutions, academics and NGOs. Our work
primarily focuses on three pillars of finance - metrics and tools, investment processes, and financial
regulation.
The project was executed in coordination with the EU-funded LIFE Paris Agreement Capital Transition
Assessment Project (LIFE PACTA) involving regulatory partnerships across European governments and
financial supervisory authorities. The project benefited from the financial support of the LIFE NGO
operating grant.
Contact:
Email: [email protected]
Website: www.2degrees-investing.org
www.transitionmonitor.ch
New York: 205 E 42nd Street, 10017 NY
London: 40 Bermondsey Street, SE1 3UD
Paris: 97 rue La Fayette, 75010
Berlin: Am Kufergraben 6A, 10117
Authors: Jakob Thomä (2° Investing Initiative / CNAM), Clare Murray (2° Investing Initiative), Michael
Hayne (2° Investing Initiative), Klaus Hagedorn (2° Investing Initiative)
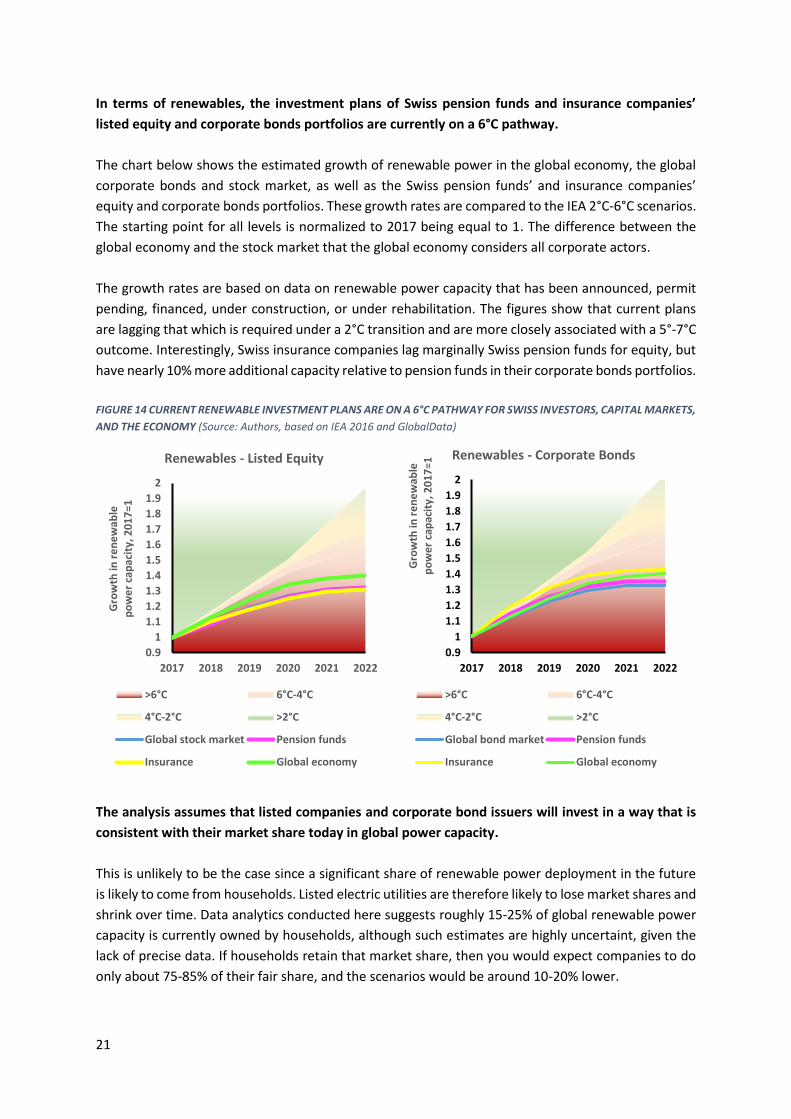
Support: Silvia Ruprecht (FOEN, project lead), Andrea Burkhardt (FOEN), Stefan Schwager (FOEN),
Roger Ramer (FOEN), Laurence Roth (SIF)
Published October 2017. The views expressed in this report are the sole responsibilities of the authors
and do not necessarily reflect those of the sponsors.
Supported by:

3
Table of Contents SUMMARY ............................................................................................................................................... 4
I. INTRODUCTION ............................................................................................................................. 12
II. PARTICIPATION IN THE PILOT TESTS ............................................................................................. 14
III. RESULTS OF THE 2°C SCENARIO ANALYSIS ................................................................................ 17
Overview ........................................................................................................................................... 17
2°C scenario analysis for the electric power sector .......................................................................... 19
2°C scenario analysis for the automotive sector .............................................................................. 26
2°C scenario analysis for the fossil fuel sector .................................................................................. 32
2°C scenario analysis for non-road transport and industry .............................................................. 36
IV. IMPLICATIONS FOR FINANCIAL RISK ......................................................................................... 39
V. OPTIONS FOR ACTION ................................................................................................................... 43
VI. CONCLUSION ............................................................................................................................. 47
VII. REFERENCES .............................................................................................................................. 49
4
SUMMARY
BACKGROUND
The Paris Agreement commits the international community to aligning financial flows with climate
goals (Art. 2.1c1).
This commitment constitutes one of the three pillars of the agreement, together with the target to
“limit global warming to well below 2°C above pre-industrial levels” (‘2°C climate goal’, Art. 2.1a) and
to “adapt to the adverse impacts of climate change” (Art. 2.1b). Recognizing finance as the third pillar
reflects the critical role of the financial sector in the context of the transition to a low-carbon economy.
Responding to this political mandate, the Swiss Federal Office for the Environment (FOEN) and the
State Secretariat for International Financial Matters (SIF) initiated a voluntary assessment of the
alignment of Swiss pension funds and insurance portfolios with the 2°C climate goal.
The pilot was supported by both the Swiss Insurance Association (SVV) and the Swiss Pension Fund
Association (ASIP), with voluntary, free participation for any interested Swiss pension fund or
insurance. In line with the Paris Agreement objective to mobilize non-state actors, it focused its
assessment on financial flows to companies, notably listed equity and corporate bonds portfolios.
According to McKinsey, these markets represent roughly 52% of global financial assets.2 When
excluding non-securitized loans, which generally do not constitute a part of an insurance companies’
or pension fund’s portfolio, that number increases to 70%. These asset classes make up around 42%
of Swiss pension funds and 15% of Swiss insurance companies portfolios. Although critical from a
climate perspective and significant in Swiss portfolios, real estate and infrastructure were excluded
from this analysis given current data gaps.
This report presents the anonymized analysis of the 79 investors who participated on a voluntary
basis and cover a representative sample of around two thirds of the listed equity and corporate
bonds held by Swiss pension funds and insurances.
Of the 79 investors, 3 explicitly provided pension funds and insurance portfolios, leading to a total of
82 participants if these are counted separately. 66 pension funds submitted CHF177 billion in assets
under management, 16 insurance companies submitted CHF 120 billion for the test – representing
large, medium and small companies. Roughly 61% of Swiss pension funds and 70% of Swiss insurances
participated in the assessment, in terms of the share of assets under management in the tested asset
classes.3 The results can be seen as representative for the Swiss pension fund and insurance market.
In total, over 131 portfolios were submitted, containing over 2,000 funds.4 Participating investors
received their reports in either English, French or German, based on their request.
1 The Paris Agreements sets in Art. 2.1c the goal of “making finance flows consistent with a pathway towards low greenhouse gas emissions and climate-resilient development.” 2 Excluded from the universe of financial assets are financial derivatives, as well as non-financial assets (e.g. real estate or private equity). 3 Measured in terms of the share of the participating investors in the total listed equity and corporate bonds portfolio size of Swiss pension funds and insurances. 4 In addition, two Swiss endowments and one pension fund from Liechtenstein participated in the pilot. The results for their analysis are not included in the meta-analysis however. The funds were analysed with MORNINGSTAR data.

5
FIGURE 1 NEARLY TWO-THIRDS OF THE SWISS PENSION FUNDS AND INSURANCE COMPANIES IN THE COVERED ASSET
CLASSES PARTICIPATED IN THE PILOT (Source: Authors)
In modelling the alignment of these instruments with the climate goals of the Paris Agreement, the
project relied on the open-source Paris Agreement Capital Transition Assessment (PACTA) model.
The model was developed by an international consortium involving 10 research organizations led by
the 2° Investing Initiative as part of the Sustainable Energy Investing Metrics (SEIM) project.5 The
model calculation rules and software will be available online IP-rights free by the end of 2017. Prior to
its application in the Swiss pilot in April 2017, it has been used by over 100 financial institutions. This
model provides a direct and forward-looking assessment of the alignment of production and
investment plans with 2°C scenarios. The pilot thus supports the implementation of the
recommendations of the Task Force on Climate-Related Financial Disclosure, mandated by the
Financial Stability Board. These recommendations specifically call for 2°C scenario analysis. As an
open-source model, it can be freely replicated by commercial and non-commercial actors, avoiding
commercial biases, although it will require access to the underlying data (scenarios, portfolio data,
asset data). The model is also currently applied by two European financial supervisory authorities,
ensuring the opportunities for international coordination on this type of assessment.
The model focuses on the most climate relevant sectors in the portfolios: energy, electric power,
and transportation (automobile, aviation, shipping), as well as on cement and steel.
These sectors are the most important sectors in the portfolio in terms of GHG emissions, representing
roughly 70-90% of the indirect GHG emissions in capital markets. They are also the core sectors in
standard 2°C transition scenarios. For this project, the model uses the 2°C scenarios of the
International Energy Agency (IEA) as a 2°C benchmark, translated into asset class specific benchmarks
for portfolios. The scenarios are associated with a 50% probability of limiting global warming to 2°C
above pre-industrial levels. Thus, it represents a ‘lower ambition’ 2°C scenario, relative to other
scenarios that have been developed. Specifically, the model compares investment and production
plans in the portfolio relative to the 2°C benchmark. Further details on the calculation rules can be
found under www.transitionmonitor.org.
5 The SEIM project was funded by the EU Horizon 2020 research programme.
0%
10%
20%
30%
40%
50%
60%
70%
80%
0
50
100
150
200
250
300
350
400
450
500
Insurance Pension funds Total % s
har
e in
th
e a
nal
yze
d a
sse
t cl
asse
s
CH
F b
illio
n
Listed equity Corporate bonds
Non-participating investors Est. % share in the analyzed asset classes (Rhs)

6
RESULTS OF THE 2°C SCENARIO ANALYSIS
The assessment presented in this report seeks to answer two related questions:
1. Are the financial portfolios – specifically the portfolios invested in equity and corporate bonds
markets – of Swiss pension funds and insurance companies consistent with the 2°C climate
goal?
2. If a disruptive transition should occur, what is the scale of exposure (in terms of share in the
portfolio) of Swiss pension funds and insurance companies to potential financial risks
associated with the transition to a low-carbon economy?
Collectively, the financial flows underlying the corporate bonds and listed equity portfolios of Swiss
pension funds are currently on a 6°C pathway, with the exception of fossil fuels where – at least for
now – investment in expanding production has been reduced due to macroeconomic factors.
The companies in these portfolios are currently investing to increase production across all high-carbon
technologies analysed for this project, notably coal power, gas power, oil production, gas production,
and petrol / diesel vehicles (referred to here as internal combustion engine vehicles or ICEs). At the
same time, investment in low-carbon alternatives (renewable power, electric power, hybrid vehicles)
is lacking. Similarly, further investment is required in decarbonizing other transport (aviation,
shipping) and industry (cement, steel).
While there is a collective gap, investment trends have been evolving, suggesting that alignment of
financial markets with the 2°C climate goal is still feasible.
Renewable energy investment across most geographies has been increasing in the past years. A
moderate increase of investment trends in the analysed portfolios, coupled with renewable energy
investment from other actors (e.g. households) will bring financial markets significantly closer to the
2°C goal. Similarly, while in absolute terms the gap for electric vehicles for example is significant, this
gap has already started to close when compared to 2015 projections. If oil & gas companies continue
to constrain their capital expenditure, production will drop by the early 2020s, consistent with 2°C
scenario and the objectives defined by international actors such as Mission 2020.
Moreover, there are significant differences across both asset classes and the portfolios of individual
pension funds and insurances.
Portfolios differ both in terms of their aggregate exposure and misalignment to the 2°C benchmark as
well as with regard to the capital transition i.e. changes in production and investment plans required
under the Paris Agreement. Some portfolios may already be consistent with the Paris Agreement,
whereas others are lacking for some technologies and sectors. The share of renewables in planned
investment ranges from 3% to 91%, for electric and hybrid vehicles the range is 3% to 100%.

7
Figure 2 TRENDS IN INDIVIDUAL PORTFOLIOS IN TERMS OF THE THE SHARE OF LOW-CARBON TECHNOLOGIES IN
INVESTMENT PLANS DIFFER WIDELY (SOURCE: Authors, based on GlobalData, WardsAuto /AutoForecastSolutions, and IEA
2016)
The following provides further detailed breakdown of technology specific trends:
• Renewable power. The figures below show the aggregated listed equity and corporate bonds
portfolios’ renewable power investment plans over the next 5 years, compared to the
corporate bonds and stock markets (listed companies), and the economy (covering both listed
and non-listed companies). These are presented in relation to the 2°C, 4°C and 6°C scenario
of the IEA. Without further actions, financial and investment flows in these sectors will not be
consistent over the next 5 years with the Paris Agreement.
FIGURE 3 CURRENT RENEWABLE INVESTMENT PLANS ARE ON A 6°C PATHWAY FOR SWISS INVESTORS, CAPITAL MARKETS,
AND THE ECONOMY (Source: Authors, based on IEA 2016 and GlobalData)
0%
10%
20%
30%
40%
50%
60%
70%
80%
90%
100%
% s
har
e r
en
ew
able
s in
to
tal p
lan
ne
d c
apac
ity
add
itio
ns
20
17
-20
22
Swiss pension funds and insurance' listed equity portfolio
Renewable power - Listed equity portfolios
0%
10%
20%
30%
40%
50%
60%
70%
80%
90%
100%
% H
ybri
d-
and
ele
ctri
c ve
hic
les
pro
du
ctio
n
gro
wth
in t
ota
l pro
du
ctio
n g
row
th,
20
17
–20
22
Swiss pension funds and insurance' listed equity portfolio
Hybrid and Electric vehicles - Listed equity portfolio
0.91
1.11.21.31.41.51.61.71.81.9
2
2017 2018 2019 2020 2021 2022
Gro
wth
in r
en
ew
able
po
we
r, 2
01
7=1
Renewables - Listed equity
>6°C 6°C-4°C
4°C-2°C >2°C
Global stock market Pension funds
Insurance Global economy
0.91
1.11.21.31.41.51.61.71.81.9
2
2017 2018 2019 2020 2021 2022Gro
wth
in r
en
ew
able
po
we
r, 2
01
7=1
Renewables - Corporate Bonds
>6°C 6°C-4°C
4°C-2°C >2°C
Global bond market Pension funds
Insurance Global economy

8
• Coal-fired power. While coal-fired power is set to decline under a 2°C scenario, coal-fired
power capacity in the portfolios increase by 5-15% over the next 5 years in terms of planned
capacity additions. This is primarily driven by investments in Non-OECD countries with
increases in the portfolio capacity by around 20% over the next 5 years, assuming no
retirements. This then is also reflected in different portfolio exposures of different investors.
FIGURE 4 SWISS PENSION FUNDS AND INSURANCE COMPANIES NEED TO REDUCE COAL EXPOSURE BY AROUND 20-30%
TO REACH 2°C (Source: Authors, based on GlobalData and IEA 2016)
FIGURE 5 SWISS PENSION FUNDS AND INSURANCE COMPANIES ARE INDIRECTLY SUPPORTING THE EXPANSION OF COAL-
FIRED POWER PLANTS IN NON-OECD COUNTRIES IN THEIR EQUITY PORTFOLIOS (Source: Authors, based on GlobalData
and IEA 2016)
0.9
1
1.1
1.2
2017 2018 2019 2020 2021 2022
Gro
wth
in c
oal
po
we
r ca
pac
ity
(no
t co
nsi
de
rin
g re
tire
me
nts
), 2
01
7=1
Coal power - Listed equity
>2°C 2°-4°C
4°C-6°C >6°C
Global stock market Pension funds
Insurance Global economy
0.9
1
1.1
1.2
2017 2018 2019 2020 2021 2022
Gro
wth
in c
oal
po
we
r ca
pac
ity
(no
t co
nsi
de
rin
g re
tire
me
nts
), 2
01
7=1 Coal power - Corporate bonds
>2°C 2°-4°C
4°C-6°C >6°C
Global bond market Pension funds
Insurance Global economy
0.8
0.9
1
1.1
1.2
1.3
2017 2018 2019 2020 2021 2022
Gro
wth
in c
oal
po
we
r ca
pac
ity
(no
t co
nsi
de
rin
g re
tire
me
nts
), 2
01
7=1
Coal power - OECD
>6*C
4°C-6°C
2°-4°C
>2°C
Global stock market
Insurance & pension funds
Global economy
0.8
0.9
1
1.1
1.2
1.3
2017 2018 2019 2020 2021 2022
Gro
wth
in c
oal
po
we
r ca
pac
ity
(no
t co
nsi
de
rin
g re
itre
me
nts
), 2
01
7=1
Coal power - Non-OECD
>6°C
4°C-6°C
2°-4°C
>2°C
Global stock market
Insurance & pension funds
Global economy

9
• Automobile. The chart below summarizes the results for internal combustion engine vehicles
(ICE e.g. petrol & diesel). Here, the portfolios are currently on investment pathways set to
increase production over the next 5 years, whereas production is meant to decrease. These
trends are mirrored in lower than required investment in electric and hybrid vehicle
deployment.
FIGURE 6 PRODUCTION UNDER A 2°C TRANSITION SHOULD DECREASE, BUT INCREASES IN BOTH STOCK AND BOND
MARKETS FOR SWISS INVESTORS (Source: Authors, based on WardsAuto / AutoForecastSolutions and IEA 2016)
• Oil and gas production. The trends here in turn are closer to the 3°C trend, with gas
production growth in the Swiss corporate bonds portfolios set to roughly align with the 2°C
goal by 2022. While the forecast of the gas production of the global economy decreases again
slightly by 2022, this is at least in part potentially due to a question of time horizons. The
current pipeline of production decreases after a 3 years forecast period. This will only be
sustained, however, if no further investment that continues to lead to increased production
levels materializes.
FIGURE 7 GAS PRODUCTION FOR SWISS PENSION FUNDS AND INSURANCE COMPANIES IS CURRENTLY CONSISTENT WITH
THE 2°C SCENARIO (Source: Authors, based on GlobalData and IEA 2016)
0.9
1
1.1
1.2
2017 2018 2019 2020 2021 2022
Gro
wth
in p
etr
ol a
nd
die
sel v
eh
icle
p
rod
uct
ion
(IC
E), 2
01
7=1
ICE - Listed equity
>6°C 4°C-6°C2°-4°C >2°CGlobal stock market Pension fundsInsurance Global economy
0.9
1
1.1
1.2
2017 2018 2019 2020 2021 2022
Gro
wth
in p
etr
ol a
nd
die
sel v
eh
icle
p
rod
uct
ion
(IC
E), 2
01
7=1
ICE - Corporate bonds
>2°C 2°-4°C
4°C-6°C >6°C
Global bond market Pension funds
Insurance Global economy
0.9
1
1.1
1.2
2017 2018 2019 2020 2021 2022Gro
wth
in g
as p
rod
uct
ion
, 2
01
7=1
Gas production - Listed equity
>6C 4°C-6°C2°-4°C >2°CGlobal stock market Pension fundsInsurance Global economy
0.9
1
1.1
1.2
2017 2018 2019 2020 2021 2022
Gro
wth
in g
as p
rod
uct
ion
, 2
01
7=1
Gas production - Corporate bonds
>2°C 2°-4°C4°C-6°C >6CGlobal bond market Pension fundsInsurance Global economy

10
IMPLICATIONS FOR TRANSITION RISK
While the focus in this pilot is on the climate outcome, the transition to a 2°C aligned economy might
also create financial risk for Swiss pension funds and insurances, if they are not properly anticipated.
While the 2°C scenario analysis provided in this report is not directly a risk assessment, it can help
inform the understanding of the financial transition risk exposure of Swiss pension funds and
insurance companies. In particular in terms of anticipating whether the transition is likely to be smooth
– when production and investment plans are well aligned with the 2°C scenario – or more disruptive
with a misalignment in the short-term, followed by sudden and rapid adjustment. Around one-third
of corporate bonds portfolios among Swiss investors have more than 20% of their funds exposed to
transition and environmental risk sectors, based on a taxonomy developed by Moody’s. The
taxonomy, which is specific to corporate bonds, cannot be transposed to listed equity portfolios.
However, a top-down sector analysis for listed equity portfolios provides similar results.
FIGURE 8 AROUND ONE-THIRD OF ANALYSED FUNDS HAVE MORE THAN 20% OF THEIR PORTFOLIO EXPOSED TO
TRANSITION RISK SECTORS (Source: Authors, based on Moody’s 2016 and own calculations)
The materialization of these risks then of course are subject to the nature of the decarbonization
pathway undertaken.
All strategies – whether ‘6°C’ or ‘2°C’ are thus associated with some form of risk, suggesting that a
conscious risk management strategy is required. Doing nothing is not the equivalent of minimizing
risk. At the same time, asset prices – shaped by the assumptions of market participants about the
future risk-return profile of individual financial instruments – do not necessarily reflect the economic
risks of a company. This potential divergence means that asset prices and their risk are not
automatically reflective of underlying risks of stranded assets at company level. Thus, financial
markets may have already ‘correctly’ priced the risks to a company in the automotive sector, even as
that company still pursues investment strategies inconsistent with the 2°C goal. It should be noted
that the profit potential is maximized when capital allocation is as efficient as possible. Signals from
the financial market in the form of portfolio management and engagement can help to optimize
capital allocation in the real economy and maximize profits under an ambitious climate transition.
0%
10%
20%
30%
40%
50%
% o
f th
e p
ort
folio
ass
ets
un
de
r m
anag
em
en
t at
ris
k o
f d
ow
ngr
ade
by
risk
leve
l
Corporate bonds funds
Immediate elevated risk Emerging elevated risk Emerging moderate risk

11
CONCLUSION
The results indicate a greater need for the Swiss financial market actors to develop climate
strategies in response to the Paris Agreement. The broad voluntary participation suggests a first
hopeful step in the right direction.
Despite being voluntary, this pilot saw significant participation among Swiss pension funds and
insurance companies, both in absolute numbers and in market share. Anecdotal evidence suggests
that participation rate in this project is higher than compliance with mandatory disclosure regimes in
other jurisdictions around 2°C scenario analysis. However, it remains to be seen to what extent market
actors will publicly disclose this information or just use it for internal processes.
In terms of future actions by financial market actors, it helps define the point of departure for these
actors in terms of potential strategies to align their portfolios with climate goals, should they desire
to pursue this strategy. In terms of strategies, this analysis can pave the way for actions related to
active portfolio management, passive index strategies or funds strategies, as well as potentially
engagement with companies. It is critical here to highlight however that actions in financial markets
do not equate necessarily to impact on the ground. For example, if a pension fund sells a share of a
oil & gas company, this does not translate directly into reduced investment or production in oil & gas.
Similarly, buying ‘green bonds’ is not the equivalent of increasing ‘green investment’, but may just
relate to the financing of existing investment (although there may of course be positive externalities).
Moving forward, this work can inform the international standardization discussion on measuring
climate alignment of financial portfolios (ISO 14097) and on a comparable implementation of the
FSB TCFD recommendations.
At the international level, the need for standardized and comparable reporting and disclosures of the
indirect climate impact of financial portfolios has been flagged in several fora (e.g. FSB TCFD, EU High
Level Expert Group on sustainable finance). As one response, an international standardization
initiative, ISO 14097, has been initiated, designed to help financial institutions design, define, and
implement targets related to the 2°C climate goal and manage the possible risk associated with the
transition to a low-carbon economy. The experience of this pilot can feed into this process.
By having created a benchmark indicating where Swiss pension funds and insurance companies
stand today, this dataset could in the future be used to track progress on the implementation of the
climate alignment of financial flows (Art. 2.1c).
The analysis could also help to move forward the discussion on reporting under Art. 2.1c of the Paris
Agreement, creating the capacity to track progress among financial market actors over time. It can
also help identify whether, ultimately, investment and production plans evolved to align with the 2°C
climate goal – setting the basis for a global capital transition consistent with the Paris Agreement. It
also provides a first indication of the overall exposure to transition risks in these portfolios. Further
analysis can be developed to complement the measurement framework of the climate alignment of
all financial flows addressed in the Paris Agreement, extending the analysis to other asset classes (e.g.
real estate) and fine-tune the analysis for different sectors and types of investments (e.g. R&D).

12
I. INTRODUCTION
As part of the Paris Agreement in 2015, the international community committed to aligning financial
flows with climate goals (Art. 2.1c). Switzerland will be a formal Party to the Agreement as of
November 5th 2017.
This commitment constitutes one of the three pillars of the Paris Agreement, together with the
commitment to “limit global warming to well below 2°C above pre-industrial levels” (Art. 2.1a) and
“adapt to the adverse impacts of climate change” (Art. 2.1b). The specific commitment on finance
recognizes the critical role of the financial sector in the context of climate goals.
Aligning financial flows with climate goals today contributes to mitigating global warming, and thus
minimizing the significant costs associated with climate change, both for the economy and financial
markets. It also helps ensure a smooth, ambitious transition that minimizes the economic and financial
disruption associated with the decarbonization of the economy (OECD 2017).
Responding to this political mandate, the Swiss Federal Office for the Environment (FOEN) and the
State Secretariat for International Financial Matters (SIF) initiated a voluntary assessment of the
alignment of Swiss pension funds and insurance companies with climate goals.
The pilot project provides for a free, voluntary and confidential analysis in partnership with interested
Swiss pension funds and insurance companies. Both the Swiss Insurance Association SVV and the
Pension Fund Association ASIP supported the project. The support ensured an industry-led nature of
the initiative, consistent with the spirit of the Paris Agreement to mobilize the leadership of non-state
actors. It is also consistent with of the vision of the industry-led Financial Stability Board Task Force on
Climate-related Financial Disclosures (FSB TCFD).
By creating a comparable, consistent, and publicly available source for 2°C scenario analysis, it aims to
significantly reduce the search and transaction costs for Swiss pension funds and insurance
companies. The project thus responds to the unique challenge in a fragmented Swiss pension funds
market,6 where smaller investors may lack resources to conduct this type of analysis. In this way, the
project also supports the implementation of the recommendations of the FSB TCFD for financial
institutions to conduct 2°C scenario analysis relative to the internationally agreed climate goals.
The results can help mobilize voluntary climate-related actions and target-setting by Swiss financial
institutions, complementing public finance and contributing to a smooth transition, and creating
awareness among the Swiss financial sector around the Paris Agreement.
6 In 2016 1690 pension fund were registered, see https://www.bfs.admin.ch/bfs/de/home/statistiken/soziale-sicherheit.gnpdetail.2017-0188.html.

13
This pilot focused on capital market instruments associated with companies directly (i.e. corporate
bonds and listed equities).
Given the project’s focus on private sector finance and investment, it excluded government-related
financing (sovereign bonds). It also excluded non-financial assets (e.g. direct real estate ownership or
ownership of companies), although research is under way to analyse the climate contribution and
alignment related to these asset classes. Thus, insurance companies and pension funds were asked
only to submit portfolios in the covered asset classes. The asset classes covered in this project account
for around 50% of global financial assets.7 We estimate that the listed equity and corporate bonds
portfolio constitute around 35-40% of pension funds’ total portfolios and 20-25% of insurance
companies total portfolios.8
In modelling the alignment of these instruments with the Paris Agreement, the project relied on the
open-source Paris Agreement Capital Transition Assessment (PACTA) model.
The model was developed by an international consortium involving 10 research organizations led by
the 2° Investing Initiative as part of the EU H2020-funded Sustainable Energy Investing metrics (SEIM)
project.9 The model was further elaborated and adapted to serve the purpose of this project and will
be available online in full when finally developed (expected by 2018).10 Prior to its application in the
Swiss pilot in April 2017, it has been used by over 100 financial institutions.
This model was chosen for the following reasons. It provides a direct and forward-looking assessment
of the alignment of sector-specific production and investment plans with 2°C scenarios, also ensuring
consistency with the internationally recognized FSB TCFD recommendations. This approach
distinguishes itself from backward-looking approaches. As an open-source model, it can be freely
replicated by commercial and non-commercial actors, avoiding commercial biases. The model is also
currently applied by two European financial supervisory authorities, ensuring the opportunities for
international coordination and linkages on this type of assessment.
The aggregated outcomes of this analysis can help to inform the Swiss government on standardized
measurement around tracking progress towards achieving the Paris Agreement.
Designed as a pilot, it also acts as a learning experience moving forward on supporting private sector
actors and measuring approaches on Art. 2.1c of the Paris Agreement. It also forms the basis for
opportunities for international standardization efforts on the measurement of climate aligned
financial portfolios (e.g. ISO standard 14097 under development). This relates in particular to target
setting by Non-State Actors under the Paris Agreement. In this context, the results can inform
engagement with other European and international actors on implementing Art. 2.1c of the Paris
Agreement, in particular with regard to future potential reporting frameworks towards the United
Nations Framework Convention on Climate Change (UNFCCC), which governs the Paris Agreement.
7 Estimates based on McKinsey 2014 and BfS / Finma. 8 These figures are based on a combination of top-down Finma and BfS estimates and bottom-up analysis of individual asset classes, as well as portfolio composition information from the sample portfolios submitted for this pilot. 9 Notably University of Zurich, Frankfurt School of Finance, Cired, Climate Bonds Initiative, Kepler-Cheuvreux, CDP, WWF European Policy Office, and WWF Germany. 10 Source code and documentation can already be accessed at www.transitionmonitor.ch.

14
II. PARTICIPATION IN THE PILOT TESTS
The pilot was by design voluntary, providing all Swiss pension funds and insurance companies the
choice of whether to engage or not. Participation was free of charge.
This approach was chosen following an analysis of the different regulatory options to support climate
transparency in financial markets, published in December 2016 (2ii 2016). The market analysis ensured
a cost-effective and impact-oriented policy solution tailored to the Swiss financial market. Each
investor has the possibility to publish their results, combine them with other types of assessment, or
only use the results internally. The Swiss government only received an anonymized meta-analysis of
the results.
The deadline for the submission of the portfolios was June 15th 2017, although extensions were
granted upon request. The final results for Swiss pension funds and insurance companies on their
specific results were sent on the week of October 9th 2017. Participating investors received their
individual results in their respective language (German or French)11 as well as their ranking compared
to all participants. If requested, they also received the results for funds they are invested in. All results
of other investors (e.g. ranking) were anonymized.
In total, 79 Swiss insurance companies and pension funds, constituting a representative cross-
section across both large and small investors, participated in the pilot.
3 of these institutions sent separate portfolios for their insurance and pension business. In total, the
test thus covered the portfolios of 66 pension funds and 16 insurance companies.12 Over 131 portfolios
were submitted, containing over 2,000 funds,13 analysed with the data from Morningstar. Data
limitations however constrained the analysis, and thus it was not possible to analyse 100% of the funds
submitted.
23 investors submitted portfolios worth under CHF 500 million in assets under management (AUM),
and 36 investors submitted portfolios under CHF 1 billion in AUM. In terms of large actors, 16 investors
submitted portfolios worth over CHF 5 billion in AUM. Indeed, this was a key objective of the project,
so as to create the opportunity for smaller pension funds and insurance companies to access 2°C
scenario analysis. Given the fragmented nature of the Swiss pension system, this element is
particularly relevant. Around 75% of participating investors were headquartered in the German-
speaking part of Switzerland.
In addition, two financial institutions from Liechtenstein and two Swiss endowments participated in
the pilot. They were not included however in the meta analysis presented in this report.
11 With investors from the Italian speaking part of Switzerland having the opportunity to choose their individual report either in English, German or French. 12 The number of pension funds may be even higher, since almost all participating insurance companies also have pension funds. However, additional information as to the breakdown between pension funds and insurance assets was not explicitly requested and thus is not available. 13 In addition, two Swiss endowments and one pension fund from Liechtenstein participated in the pilot. The results for their analysis are not included in the meta-analysis however.

15
In total, Swiss pension funds and insurance companies sent around CHF 376 billion in AUM, of which
CHF 297 billion in AUM were identified as corporate bonds or listed equity.
Pension funds and insurance companies collectively sent around CHF 82 billion in AUM that were
outside of the asset classes covered in the assessment or related to funds for which no look-through
to the underlying exposures were possible. Given the mixed nature of some participating insurance
companies as both pension funds and insurance companies, these figures are likely to collectively
understate the relative weight and portfolio size of pension funds. Where possible, the breakdown by
type of investors was estimated.
Swiss pension funds thus sent an estimated CHF 177 billion in AUM (CHF 109 billion in listed equity,
and CHF 68 billion in corporate bonds). Swiss insurance companies sent an estimated CHF 120 billion
(CHF 25 billion in listed equity, CHF 95 billion in corporate bonds). The figure below summarizes the
breakdown. Crucially, it is not possible to ‘validate’ or verify the data submissions. While some
forensics on the data was conducted, these forensics obviously could only verify potential mistakes in
data submissions in the case of outliers. For example, data forensics were able to identify one
submission where the entire fund value was included, and not just the investors share in the fund.
Similarly, portfolios were filtered based on assets that could be identified as either listed equity or
corporate bonds. At the same time, no complete verification of the data is possible and thus all
estimates presented here rely on the accuracy of the underlying data and exposures submitted for
this pilot.
Figure 9 CHF 376 BILLION IN PORTFOLIO VALUE WAS SENT AS PART OF THE PILOT OF WHICH CHF 297 BILLION WAS
ASSESSED (Source: Authors)

16
One key challenge in this project involved estimating the share of submitted portfolios in the
analyzed asset classes and by extension the overall participation rate, measured in share of AUM.
The total portfolio market size was derived from macro statistics taken from the Swiss Financial
Market Supervisory Authority FINMA and the Federal Statistical Office BfS. These macro estimates
however do not distinguish corporate bonds and other bond instruments (e.g. sovereign, asset-backed
securities).14 The share of the corporate bonds exposures was estimated based on the share of
corporate bonds (Industrial, Utility, and Financial) in the Barclays Global Aggregate Bond Index, which
represents a proxy for the global bond market. At time of writing, this share is 18.93%. Given the
uncertainty as to the extent to which Swiss insurance companies and pension funds accurately reflect
this index, we took a more conservative estimate of 25% share for defining the market size.
These top-down estimates were then compared with the bottom-up portfolio data received across
the 82 portfolios, complemented with publicly available information used to estimate the relative
share of the pension fund exposure for those insurance companies that did not provide it directly, but
for which we knew the portfolio represented both exposures.15 Publicly available information was also
used for data forensics on the portfolios, as well as estimates of the market size of non-participating
investors. These top-down estimates led to a slight reduction of around 9% in the estimated market
size for Swiss pension funds and an increase in the market size for Swiss insurance companies of
around 25%. These adjustments led to a slight increase in the overall market size in our estimate,
albeit with no material impact on the overall market share.
Based on this analysis, we estimate that in the asset classes analyzed, the pilot participants
represent around 72% of Swiss insurance companies and 62% of Swiss pension funds, for an
estimated total of 66% of the Swiss market.
FIGURE 10 TWO-THIRDS OF SWISS PENSION FUNDS AND INSURANCE COMPANIES PARTICIPATED (Source: Authors)
14 For insurance companies, collective investments not specifically linked to listed equity and corporate bonds were presented as a separate line, with some uncertainty as to the exact exposure within these collective investments to listed equity and corporate bonds. While not 100% clear from the data, collective investments in the data provided on Swiss pension funds appear to relate only to those collective investments not related to listed equity and corporate bonds. 15 Note that this additional analysis was only done for three insurance companies.
0%
10%
20%
30%
40%
50%
60%
70%
80%
0
50
100
150
200
250
300
350
400
450
500
Insurance Pension funds Total
% s
har
e in
th
e a
nal
yze
d a
sse
t cl
asse
s
CH
F b
illio
n
Listed equity Corporate bonds
Non-participating investors Est. % share in the analyzed asset classes (Rhs)

17
III. RESULTS OF THE 2°C SCENARIO ANALYSIS
Overview
The assessment presented in this report seeks to answer two related questions:
1. Are the financial portfolios – specifically the portfolios invested in equity and corporate
bonds markets - of Swiss pension funds and insurance companies consistent with the 2°C
climate goal?
This analysis was conducted for key transition sectors, notably energy (oil & gas, coal), electric power
and automobile. It also explored investment needs for aviation, shipping, cement, and steel, for which
forward-looking data currently lacks more granular visibility on GHG emissions. The exposure and
trends for this assessment rely on physical asset-level data (e.g. power plants, oil fields), updated at
least quarterly, creating the capacity to cover a global universe of financial instruments independent
of the quality of reporting of individual companies. This allows for regional-specific comparisons
between the 2°C scenario and the portfolios and mobilize forward-looking data on investment trends
and production plans. The relevant sectors cover an estimated 70-90% of GHG emissions in the
investor portfolios. 16 In the interest of space, this report limits the description of the results to a few
select technologies in each sector, notably coal power and renewables (electric power), internal
combustion engine and electric vehicles (automobile), and oil and gas (energy). A complete analysis
of the aggregated Swiss pension funds and insurance companies’ listed equity and corporate bonds
portfolios will be made publicly available at www.transitionmonitor.ch.
2. If a disruptive transition should occur, what is the scale of exposure to financial risks
associated with the transition to a low-carbon economy?
A disruptive transition to a low-carbon economy can possibly create financial risks for Swiss pension
funds and insurance companies. This disruptive transition was defined by the European Systemic Risk
Board (2016) as a ‘too late, too sudden’ scenario, where the transition to a 2°C world is delayed by 5-
10 years and then – in response potentially to a sudden climate event – is accelerated abruptly with
potential significant downwriting of both economic and financial assets. The transition is thus likely to
be particularly disruptive if the investments required to meet the 2°C goal are delayed (ESRB 2016,
OECD 2017). Through this analysis, we demonstrate both the overall exposures to high-carbon and
low-carbon technologies under review in Question 1, as well as the sectoral exposures and portfolio
weights of the listed equity and corporate bonds portfolios of Swiss pension funds and insurance
companies.
The analysis generally aggregates the results of Swiss pension funds and insurance companies,
although distribution of results are shown for Question 2. It is important to highlight that the analysis
under Question 2 is not a complete risk analysis, but rather assesses the scale of the potential
exposure should risks materialize.
16 The assessment cover most scope 1 emissions (power, cement, steel, airlines) but also most scope 3 emissions (use of cars, oil, gas and coal) usually included in scope 3 assessment. The main sources of emissions out of scope are: chemicals, real estate, and food/agriculture.

18
The analysis in this report is based on the 2°C scenarios of the International Energy Agency (IEA). The
2°C climate goal is translated into technology and decarbonization paths for particularly climate-
relevant sectors. The scenarios are associated with a 50% probability of limiting global warming to 2°C
above pre-industrial levels. The IEA scenario is a 2°C scenario of moderate ambition. It is based on
assumptions that diverge significantly from Switzerland's climate policy, regarding nuclear
deployment and carbon capture and storage. However, due to its global reputation and broad sector
coverage, it has been chosen as a benchmark. In the years to come, the development of alternative
scenarios should provide better options for conducting the analysis.
The 2°C scenarios of the IEA focus on the energy, power generation and transportation sectors, as well
as on certain industrial sectors (e.g. cement and steel). The necessary decarbonization within these
sectors will be achieved in the coming decades by the increased shift from fossil to renewable energy
generation, or to alternative mobility drives. In addition, efficiency increases and associated CO2
reductions are projected across all sectors and new technological alternatives are expected.
The analysis is therefore divided into two parts: the first part covers the sectors in which concrete
technology alternatives are available, for example, renewable energy sources. The second part covers
the sectors in which there is currently no carbon neutral alternative, for example steel production, air
transport, and therefore where only the CO2 intensity (with its associated measurement
uncertainties) can be measured.
The trends in the 2°C scenarios are compared to the trends in the portfolios. Portfolio trends are
identified based on forward-looking asset level data including power plants, car production plants, oil
and gas fields, which are then associated to their ownership companies, their parents, and securities.
In comparing these trends, the economy scenarios are adjusted to the asset class (listed equity and
corporate bonds) and the specific portfolio, according to regional exposure and portfolio size. This is
necessary to compare the same parameters and to consider regional differences in the 2°C scenarios.
FIGURE 11 THE MODEL MATCHES PORTFOLIO EXPOSURE TO INVESTMENT AND PRODUCTION PLANS, AS WELL AS EXISTING
ASSETS, TO THE 2°C BENCHMARK (Source: Authors)

19
2°C scenario analysis for the electric power sector
~50-60% of Swiss pension funds’ and insurance companies’ power exposure relates to coal- and gas-
fired power plants, versus only around ~10-15% for renewables, with the remaining share related
to nuclear, hydro, oil, and gas power.
When comparing this exposure to the global stock and corporate bonds markets respectively, the
primary difference exists for corporate bonds where Swiss portfolios are more exposed to nuclear
power and less exposed to renewables.
At the same time, stock markets under-weigh renewables more generally relative to the real economy.
This is primarily related to the fact that non-listed actors, notably households, tend to have a higher
exposure to renewables, thus creating an economy-wide analysis that has a higher exposure to
renewables.
This exposure will likely need to change fundamentally over the next decades. According to the
International Energy Agency (IEA), coal power is set to decline globally by around 40% over the next
25 years, even when considering additions in emerging markets. Similarly, there is a significant
increase in renewable power predicted, growing by a factor of 5 globally by 2040. Globally, the IEA
also anticipates a growth, albeit a more muted one, in hydropower, nuclear power and gas power.
The figure below summarizes the relative exposures at different levels for 2017.17
FIGURE 12 AROUND 60% OF SWISS PENSION FUNDS AND INSURANCE COMPANIES EXPOSURE IS IN COAL AND GAS, VERSUS
ONLY 10% FOR RENEWABLES (Source: Authors, own calculations based on GlobalData)
17 These results will differ slightly from the results in the investor briefings due to the inclusion of oil power in the macro analysis and the different year of analysis (2017 in this report, 2022 in the investor briefing).
0%
10%
20%
30%
40%
50%
60%
70%
80%
90%
100%
Swiss Insurance &pension funds(Listed equity)
Stock market -Global
Swiss insurance &pension funds
(Corporate bonds)
Corporate bondsmarket (Global)
Economy - Global
% w
eig
ht
of
eac
h f
ue
l in
th
e p
ow
er
cap
acit
y 2
01
7
Coal capacity Gas capacity Hydropower Nuclear capacity Oil capacity Renewable capacity

20
Around 78% of Swiss pension funds’ and insurance companies’ power exposure is in the OECD
countries.
This is similar to the weight in the stock market overall, which has a power exposure in OECD countries
at around 75%. For the economy as a whole (including private companies, municipalities, households),
the share of OECD power globally is around 45%. By extension, the 2°C scenario trends for the OECD
are of particular importance for Swiss investors.
Swiss pension funds’ and insurance companies’ exposure to power capacity comes primarily from
companies listed in Europe and the United States, whose power capacity in turn is primarily located
in the EU and the United States.
At the same time, the exposure is truly global. As highlighted by the Figure below, power exposure
can be found in all geographies, with significant exposures related to ownership of companies in
emerging markets. The geography of ownership is critical to understanding both the ‘source’ of the
exposure, as well as the regional decarbonization pathways for electric power. This is critical since
regional trends across power technologies differ widely.
FIGURE 13 SWISS PENSION FUNDS OWN POWER PRIMARILY THROUGH COMPANIES DOMICILED IN EUROPE AND THE US,
WITH POWER CAPACITY THEN PRIMARILY LOCATED IN THE EU AND USA (Source: Authors, based on IEA 2016 and
GlobalData)
21
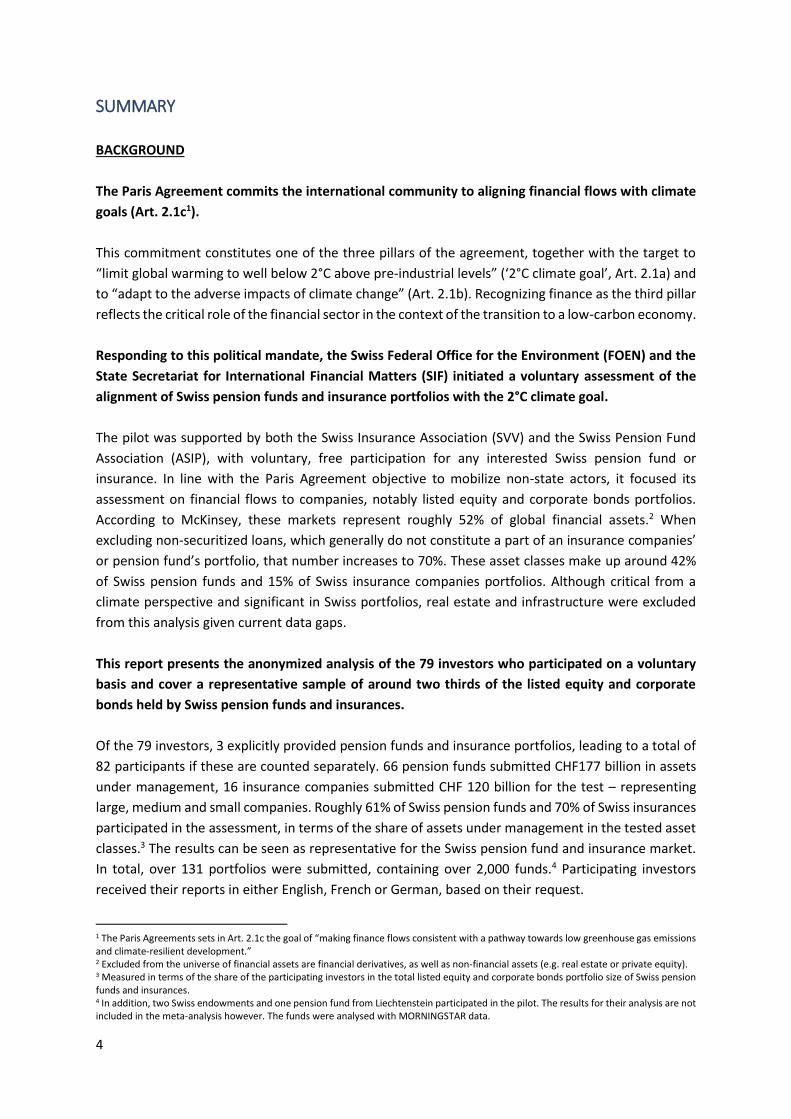
In terms of renewables, the investment plans of Swiss pension funds and insurance companies’
listed equity and corporate bonds portfolios are currently on a 6°C pathway.
The chart below shows the estimated growth of renewable power in the global economy, the global
corporate bonds and stock market, as well as the Swiss pension funds’ and insurance companies’
equity and corporate bonds portfolios. These growth rates are compared to the IEA 2°C-6°C scenarios.
The starting point for all levels is normalized to 2017 being equal to 1. The difference between the
global economy and the stock market that the global economy considers all corporate actors.
The growth rates are based on data on renewable power capacity that has been announced, permit
pending, financed, under construction, or under rehabilitation. The figures show that current plans
are lagging that which is required under a 2°C transition and are more closely associated with a 5°-7°C
outcome. Interestingly, Swiss insurance companies lag marginally Swiss pension funds for equity, but
have nearly 10% more additional capacity relative to pension funds in their corporate bonds portfolios.
FIGURE 14 CURRENT RENEWABLE INVESTMENT PLANS ARE ON A 6°C PATHWAY FOR SWISS INVESTORS, CAPITAL MARKETS,
AND THE ECONOMY (Source: Authors, based on IEA 2016 and GlobalData)
The analysis assumes that listed companies and corporate bond issuers will invest in a way that is
consistent with their market share today in global power capacity.
This is unlikely to be the case since a significant share of renewable power deployment in the future
is likely to come from households. Listed electric utilities are therefore likely to lose market shares and
shrink over time. Data analytics conducted here suggests roughly 15-25% of global renewable power
capacity is currently owned by households, although such estimates are highly uncertaint, given the
lack of precise data. If households retain that market share, then you would expect companies to do
only about 75-85% of their fair share, and the scenarios would be around 10-20% lower.
0.9
1
1.1
1.2
1.3
1.4
1.5
1.6
1.7
1.8
1.9
2
2017 2018 2019 2020 2021 2022
Gro
wth
in r
en
ew
able
p
ow
er
cap
acit
y, 2
01
7=1
Renewables - Listed Equity
>6°C 6°C-4°C
4°C-2°C >2°C
Global stock market Pension funds
Insurance Global economy
0.9
1
1.1
1.2
1.3
1.4
1.5
1.6
1.7
1.8
1.9
2
2017 2018 2019 2020 2021 2022
Gro
wth
in r
en
ew
able
p
ow
er
cap
acit
y, 2
01
7=1
Renewables - Corporate Bonds
>6°C 6°C-4°C
4°C-2°C >2°C
Global bond market Pension funds
Insurance Global economy

22
Under alternative assumptions (related to households and investment plans), the gap closes to a
~4°C pathway, but still doesn’t achieve the 2°C outcome.
There are two alternative assumptions that are possible in the analysis.
• First, it can be assumed that households continue to take away market share from companies
in the renewable power and by extension overall power market. While this assumption is likely
more consistent with reality, it also requires assuming that listed companies lose market
share, which may be relevant from a risk perspective (see Chapter 4).
• Second, while investment data goes out to 5 years, the investment plans for renewable power
after 2-3 years get more uncertain. This is because of the sometimes more short-term
planning periods associated with renewable power (this distinguishes itself notably from
nuclear power for example, where planning periods are much more long-term, particularly in
the OECD). Instead of relying on the actual data, investment plans could be extrapolated after
2-3 years to account for this uncertainty.
The figure below highlights the impact of allocating 20% of future capacity additions to households
and extrapolating the global economy growth rate based on 2017-2019 growth rates. When adjusting
for these two factors, the projections are slightly better than the 4°C scenario, which is more or less
consistent with the current estimates as to the temperature outcome associated with the Nationally
Determined Contributions announced by Parties to the Paris Agreement. The gap to 2°C however
remains at global level.
FIGURE 15 THE GLOBAL ECONOMY IS ON A 4°C PATHWAY ASSUMING HOUSEHOLDS BUILD OUT RENEWABLES AND
CURRENT INVESTMENT GROWTH IS KEPT AFTER 2019 (Source: Authors, based on IEA 2016 and GlobalData)
1
1.1
1.2
1.3
1.4
1.5
1.6
1.7
1.8
1.9
2
2017 2018 2019 2020 2021 2022
20
17
=1
>6°C 6°C-4°C 4°C-2°C >2°C Global economy

23
When it comes to coal-fired power, the conclusions are similar, with the portfolios needing to retire
roughly 20-30% of the coal-fired power plants over the next 5 years.
The significant decline is required given the coal-fired power plant investment in the portfolios. While
coal-fired power is set to decline under the 2°C scenario, without retirements, coal-fired power
capacity is set to increase by 5-15% over the next 5 years.
The figure below summarizes the trend in additions in coal power capacity relative to the IEA scenarios
for Swiss pension funds’ and insurance companies’ equity and corporate bond portfolios, the global
bond and stock market, as well as the economy wide trends as identified by the data. Interestingly,
performance diverges significantly between asset classes. Thus, the difference between the global
economy coal power additions and the insurance companies listed equity coal power additions is
around 15% (difference between the yellow and green line in the equity chart below).
One important issue to flag in the analysis for coal-fired power capacity is that retirements are not
forecasted in this analysis. This is done intentionally in order to demonstrate the size of the required
‘rate of change’ rather than already integrating announcements on retirements.
Of course, the analysis can also be conducted by integrating retirement assumptions. The data here
however tends to be incomplete as not all companies announce when they plan to retire an asset (as
opposed to when they plan to build it). In the context of a necessary overall decline in coal-fired power
capacity globally by about 40% in the next 25 years and 70% for OECD Europe for reaching the 2°C
benchmark, these investments in additions make such targets more difficult to achieve.
FIGURE 16 SWISS PENSION FUNDS AND INSURANCE COMPANIES NEED TO REDUCE COAL EXPOSURE BY AROUND 20-30%
TO REACH 2°C (Source: Authors, based on GlobalData and IEA 2016)
0.9
1
1.1
1.2
2017 2018 2019 2020 2021 2022
Gro
wth
in c
oal
po
we
r ca
pac
ity
(no
t co
nsi
de
rin
g re
tire
me
nts
), 2
01
7=1
Coal capacity - Listed Equity
>2°C 2°-4°C
4°C-6°C >6C
Global stock market Pension funds
Insurance Global economy
0.9
1
1.1
1.2
2017 2018 2019 2020 2021 2022
Gro
wth
in c
oal
po
we
r ca
pac
ity
(no
t co
nsi
de
rin
g re
tire
me
nts
), 2
01
7=1
Coal capacity - Corporate Bonds
>2°C 2°-4°C
4°C-6°C >6C
Global bond market Pension funds
Insurance Global economy

24
The trends for coal power are highly region-specific, diverging significantly between the OECD and
the non-OECD countries. This difference can also be seen in the Swiss portfolios.
Thus, the 2°C scenario for the OECD countries sees a decline in capacity of around 15% over the next
5 years, whereas for the Non-OECD region an increase in capacity is expected. The global aggregate
analysis from above hides this difference. As a reminder, the aggregate scenario benchmarks for
power are calculated based on the weight of the regional power exposures of the portfolio. The figure
below shows the breakdown for the listed equity portfolios of insurance companies and pension
funds, aggregated as one portfolio for simplicity. They largely mirror both the global stock market and
the global economy. They also show that a significant part of the coal-fired power investment in the
portfolio takes place in the Non-OECD region, involving growth rates of around 20% over the next 5
years. Growth rates in the OECD in turn are only around 4%.
FIGURE 17 SWISS PENSION FUNDS AND INSURANCE COMPANIES ARE INDIRECTLY SUPPORTING THE EXPANSION OF
COAL-FIRED POWER PLANTS IN NON-OECD COUNTRIES (Source: Authors, based on GlobalData and IEA 2016)
From a climate perspective, it is also relevant to highlight that for coal-fired power plants (as for gas
power), efficiency and utilization rates plays a major role.
An inefficient, sub-critical coal-fired power plant can have twice as many GHG emissions / MWh as an
efficient super-critical coal-fired power plant. Moreover, a growing number of coal-fired power plants,
particularly in Europe, are seeing declining utilization rates. These declining rates similarly imply
significant differences in different power plants. However, the critical issue in terms of alignment of
financial markets with the climate goal is not just the actual ‘economic activity’, but also the
investments in physical assets – since the investment decision relates to production capacity and not
the actual governance of production (something financial institutions may be able to influence
through engagement however).
0.8
0.9
1
1.1
1.2
1.3
2017 2018 2019 2020 2021 2022
20
17
=1
Coal power - OECD
>6*C
4°C-6°C
2°-4°C
>2°C
Global stock market
Insurance & pension funds
Global economy
0.9
1
1.1
1.2
1.3
2017 2018 2019 2020 2021 2022
20
17
=1Coal power - Non-OECD
>6C
4°C-6°C
2°-4°C
>2°C
Global stock market
Insurance & pension funds
Global economy

25
Although the focus of this report is on the 2°C scenario analysis, it is also interesting to break down
the relative capital allocation in terms of investments in different technologies.
The figure below shows the planned capacity additions by fuel for the power sector collectively,
comparing the Swiss pension funds and insurance companies corporate bonds and listed equity
portfolio respectively with the global corporate bonds and stock market. The results suggest that the
investment plans in the corporate bonds portfolios of pension funds and insurance companies is
significantly more renewables heavy than for the listed equity portfolio, exceeding 50% of total
capacity additions. Given that the IEA does not directly forecast capacity additions, it is no possible to
directly quantify a 2°C benchmark in this analysis. Given this uncertainty, the relative 2°C scenarios as
benchmarks are only loosely shaded and not specifically marked.
This profile is significantly more renewables heavy than the global corporate bonds market, driven
primarily by a different geographic exposure, with a higher emphasis on OECD countries where, as
highlighted above, coal-fired power plant build-out is set to be more muted. In stock markets however,
the pension fund and insurance companies appear to mirror the global stock market more closely.
One element that is striking in that regard is the differences across portfolios. For listed equity
portfolios for example, the results fluctuate between 5% renewable power in total planned capacity
additions to 92%, with significant variation in-between. Indeed, this distribution of exposures can be
seen across all the indicators measured in the power sector, notably the relative technology weights,
the relative weights of different fuels in capacity additions (below), and the alignment of the
investment profile with the 2°C scenario of the IEA.
FIGURE 18 RENEWABLES NOW MAKE UP OVER 50% OF SWISS PENSION FUNDS AND INSURANCE INVESTMENTS IN THEIR
BOND PORTFOLIOS, BUT STILL UNDER 40% IN THE LISTED EQUITY PORTFOLIO. THESE RESULTS DIFFER WIDELY ACROSS
PORTFOLIOS (Source: Authors, based on GlobalData)
0%10%20%30%40%50%60%70%80%90%
100%
Glo
bal
sto
ck m
arke
t
Pe
nsi
on
fu
nd
s (E
qu
ity)
Insu
ran
ce (
Equ
ity)
Glo
bal
bo
nd
mar
ket
Pe
nsi
on
fu
nd
s (B
on
ds)
Insu
ran
ce (
Bo
nd
s)
% s
har
e in
to
tal p
lan
ne
d c
apac
ity
add
itio
ns
20
17
-20
22
Coal capacity Gas capacity
Hydropower Nuclear power
Oil power Renewable power
0%
10%
20%
30%
40%
50%
60%
70%
80%
90%
100%
% s
har
e in
to
tal p
lan
ne
d c
apac
ity
add
itio
ns
20
17
-20
22
Swiss pension funds' and insurance' listed equity portfolios
Renewable power - Listed equity

26
2°C scenario analysis for the automotive sector
The automobile sector is dominated by petrol and diesel vehicles. Hybrid and electric alternatives
make up less than 5% of Swiss pension funds’ and insurance companies’ portfolios, consistent with
capital markets and the economy more generally.
The automotive sector faces a fundamental technological revolution in the transition away from
internal combustion engines (i.e. diesel and petrol cars) to alternative drivetrains e.g. hybrid and
electric vehicles (EVs), as well as potentially in the medium-term fuel cells. While it is clear from the
scenarios that electric and hybrid vehicles will dominate under a 2°C transition in the long run (20-30
years), the exact scale of change is not clear. Thus, the IEA WEO 2016 forecasts 715 million EVs on the
road by 2040. The IEA ETP 2017 report however only assumes around 405 million EVs on the road out
of 1780 vehicles.
While these aspects create challenges, they are not fundamental barriers to the analysis. Some of the
long-term, apparent inconsistencies are less material over the 5 year time horizon under review here.
While a global analysis may be less precise, local production is more globally integrated than for
power, where sales are primarily domestic or at best regional. China does not buy electric power from
Germany, but they may buy cars built in Germany.
The figure below shows the share of electric and hybrid vehicle production in 2017 for the aggregated
Swiss pension funds’ and insurance companies listed equity portfolio, the stock market, and the
economy. The ratios for the corporate bonds portfolio of Swiss pension funds and insurance
companies mirror these results. The results suggest that the aggregated Swiss listed equity portfolio
slightly underweights both hybrid and electric vehicle production relative to the stock market and the
economy. This may be a function of a more European exposure that doesn’t include significant actors
in the hybrid (Toyota) and electric vehicle market (Tesla).
FIGURE 19 ELECTRIC AND HYBRID VEHICLES MAKE UP LESS THAN 5% OF GLOBAL PRODUCTION (Source: Authors, based on
WardsAuto / AutoForecast Solutions)
0%
1%
1%
2%
2%
3%
3%
4%
4%
5%
5%
Stock market(Global)
Swiss pension fundsand insurance
company - Listedequity portfolio
Corporate bondsmarket (Global)
Swiss pension fund& insurance -
Corporate bondsportfolio
Economy (Global)
Titl
e
Electric Hybrid

27
Investment in expanding electric vehicle production in Swiss pension funds’ and insurance
companies’ portfolios is on a 4°C pathway.
The portfolios, and capital markets and the economy more generally, significantly lag the required
growth rate for electric vehicles under a 2°C transition. Current investments in expansion of electric
vehicle production still leave equity portfolios in 2022 at only around 30-40% of the required level
under a 2°C scenario. This is similar to the market more generally and ahead of the overall economic
trend. The trends for the corporate bond market mirror more closely those of the economy.
Generally, one would expect the corporate bond market to be closer to the economic trend since the
stock market only includes listed car manufacturers and for listed companies only the listed part of
the company. Thus, only 68% of the electric vehicle production of Tesla is integrated into the global
stock market trend, since only 68% of Tesla is free-float traded on stock markets, but 100% of Tesla is
considered in the corporate bonds market.
Noticeable is the very ambitious growth rate in the IEA scenarios by a factor of around 10-11 over the
next 5 years, roughly 5 times as high as the 2°C growth rate for renewables. This is partly a function of
the relatively marginal market for electric vehicles to date, where annual sales of electric vehicles
currently only make up around 1% of global car sales. Growth rates here would be expected to be
similarly higher than for relatively more mature technologies like renewables. It is also worth
highlighting that even given the uncertainty in the scenarios described above, marginal changes to the
growth rates assumption wouldn’t fundamentally alter the results of the analysis.
FIGURE 20 GROWTH IN ELECTRIC VEHICLE PRODUCTION IS LARGELY CONSISTENT WITH A 4°C OUTCOME (Source: Authors,
based on WardsAuto / AutoForecastSolutions and IEA 2016)18
18 Given that the IEA does not provide estimates for a 6°C scenario in terms of electric vehicle production, the cut-off point between the 4°C-6°C scenario and the 6°C scenario itself is given as a flat line in the charts.
0
2
4
6
8
10
12
2017 2018 2019 2020 2021 2022
Gro
wth
in e
lect
ric
veh
icle
pro
du
ctio
n,
20
17
=1
Electric vehicles - Listed equity
>6°C 6°C-4°C
4°C-2°C >2°C
Global bond market Pension funds
Insurance Global economy
0
2
4
6
8
10
12
2017 2018 2019 2020 2021 2022
Gro
wth
in e
lect
ric
veh
icle
pro
du
ctio
n,
20
17
=1
Electric vehicles - Corporate bonds
>6°C 6°C-4°C
4°C-2°C >2°C
Global stock market Pension funds
Insurance company Global economy

28
One important element when considering these trends is both the relatively rapid change in
forward-looking production estimates, as well as top-down corporate announcements.
Since 2015, forward-looking production estimates of electric vehicles in 2020 for a sample of 6
companies have increased by 250%. The projections have increased by around 15% in the past two
quarters alone. It seems likely that actual production in 2020 of electric vehicles will be higher than
currently projected.
The IEA estimates that if companies realize the upper end of their corporate targets by 2025, electric
vehicle sales will be roughly consistent with the IEA 2°C scenario. The lower end of the target spectrum
however is lower than that required to meet the Paris Agreement, suggesting significant volatility in
outcomes over the next 10 years in this market. Of course, without the right market, financing, and
policy conditions, these targets will not be met. The individual, publicly announed production targets
significantly exceed the bottom-up projections, suggesting that car markets may shift rapidly to
approach the 2°C target in the charts highlighted above.
FIGURE 21 PROJECTED ELECTRIC VEHICLE PRODUCTION IN 2020 FROM 2015, 2016, 2017 (Q1), 2017 (Q3) FORECASTS FOR 6
CAR MANUFACTURERS, COMPARED TO CORPORATE TARGETS OF INDIVIDUAL COMPANIES (Source: Authors, based on
WardsAuto / AutoForecast Solutions) and 2020 electric vehicle production targets for Daimler, Tesla, and Volkswagen
(Source: Authors, based on company announcements)
Although not specifically presented in this report, trends for hybrid vehicles largely reflect those for
electric vehicles. Other key aspects of road transport were not explored however.
There are three elements with regards to low-carbon alternatives that were not explored in further
detail. The first is heavy-duty vehicles, notably trucks and buses, which make up around 50% of the
GHG emissions in road transport. Given improvements in scenario granularity and data, this sector is
expected to be covered should the exercise be repeated. Similarly, fuel cells were not considered given
their marginal role over the next 5 years. A future analysis may consider them, given their role in the
2°C scenario in the medium term.
0
100,000
200,000
300,000
400,000
500,000
600,000
Ele
ctri
c ve
hic
le p
rod
uct
ion
in 2
02
0
0
200,000
400,000
600,000
800,000
1,000,000
1,200,000
20
20
ele
ctri
c ve
hic
le p
rod
uct
ion
tar
get

29
As growth of electric vehicle production increases, petrol and diesel vehicle production is set to
decrease. In Swiss pension funds and insurance companies however, this production increases.
The other side of the equation for low-carbon road transport are internal combustion engine (ICE)
vehicles e.g. petrol and diesel vehicles. The figures below show the global growth rates for ICE
production for Swiss insurance companies and pension funds’ listed equity and corporate bonds
portfolios, the global corporate bonds and stock market, and the global economy, relative to the IEA
2°C, 4°C, and 6°C scenario. As highlighted above, the benchmarks presented here are associated with
some uncertainty, given the relative inconsistency across IEA scenarios and differences in the
scenarios around total demand for cars. The gap may thus be smaller than estimated under different
growth assumptions for the total car market and retirement assumptions related to the existing
vehicle stock.
The results show that current trends run directly counter to the 2°C scenario. Whereas production is
meant to decrease, it currently increases. The results translate into a gap of around 15% for stock
markets and around 10% for bonds market, where the misalignment is somewhat less pronounced. In
real terms, global car manufacturers plan to increase annual production of petrol and diesel vehicles
by around 7 million cars annually over the next 5 years. The trends identified here relate not just to
the relative ratios of electric vehicles (and other low-carbon alternatives) to ICEs, but also to the
overall volume of production. Thus, the decline in ICE production at least partly relates to overall lower
car sales under a 2°C scenario relative to a more high-carbon scenario. Total car sales under the 2°C
or below 2°C scenarios of the IEA ETP 2017 are around 20% lower than the ‘RTS scenario’ designed to
reflect current limited climate ambition.
FIGURE 22 PRODUCTION UNDER A 2°C TRANSITION SHOULD DECREASE, BUT INCREASES IN BOTH STOCK AND BOND
MARKETS FOR SWISS INVESTORS (Source: Authors, based on WardsAuto / AutoForecastSolutions and IEA 2016)19
19 As for electric vehicles, given that the IEA does not publish a 6°C scenario specifically, the 6°C scenario is assumed to be flat production at current levels.
0.9
1
1.1
1.2
2017 2018 2019 2020 2021 2022
Gro
wth
in p
etr
ol a
nd
die
sel v
eh
icle
pro
du
ctio
n (
ICE)
, 2
01
7=1
ICE - Listed equity
>6°C 4°C-6°C
2°-4°C >2°C
Global stock market Pension funds
Insurance Global economy
0.9
1
1.1
1.2
2017 2018 2019 2020 2021 2022
Gro
wth
in p
etr
ol a
nd
die
sel v
eh
icle
pro
du
ctio
n (
ICE)
, 2
01
7=1
ICE - Corporate bonds
>2°C 2°-4°C
4°C-6°C >6°C
Global bond market Pension funds
Insurance Global economy

30
In addition to alternative low-carbon drivetrains, decarbonization under a 2°C transition in the road
transport sector is also to a significant degree driven by fuel efficiency.
Under a 2°C transition, fuel efficiency needs to improve by about 3.7% annually until 2030. As part of
the Paris Agreement Capital Transition Assessment model piloted and pioneered in this project, fuel
efficiency assessments are possible of financial portfolios. Indeed, as shown in the figure below, the
distribution of fuel efficiency across different vehicles is significant with differences of a factor of 3-4
between the most efficient ICEs to the least efficient.
The challenge with this type of assessment however is that it relies on reported fuel efficiency from
the European Environment Agency and Environmental Protection Agency (EPA) in the United States.
The scandals of the past years have thrown considerable doubt on the reliability of these figures,
despite the fact that they are officially certified. Moreover, the actual climate impact of individual
vehicles is highly contingent on its use. Another challenge is that while forward-looking projections by
model and drivetrain exist, the exact efficiency of individual models is contingent on its specific sale
and will – even for the same model – change over time.
Given this uncertainty, although technically feasible, scenario analysis on fuel efficiency was not
integrated into the overall assessment for this pilot for investors. However, investors can pursue such
an analysis, linking this to regional fuel efficiency standards and related policies. Similarly,
governments can explore fuel efficiency trends in financial markets and the real economy through this
data.
FIGURE 23 INEFFICIENT CARS ARE UP TO 4-5X AS INEFFICIENT AS THE MOST EFFICIENT CARS ON THE ROAD (Source: Authors,
based on EPA, EEA, and WardsAuto / Autoforecast Solutions)
0
100
200
300
400
500
600
gCO
2/k
m a
cro
ss 5
,00
0 d
iffe
ren
t ca
r m
od
els
Individual car models

31
Similar for power, investment plans can also be compared in terms of the fuel mix of planned car
production increases.
The figure below shows the breakdown of planned car production increase 2017-2022 by drivetrain
(electric, hybrid, ICE) for the global stock and bond market, as well as Swiss pension funds’ and
insurance companies’ listed equity and corporate bonds portfolios. The results demonstrate that low-
carbon alternatives in this sector still make up a smaller share of planned increases than renewables
do for the power sector.20
Similarly, a look on individual funds shows significant divergence, albeit at lower aggregate levels than
for renewables. Thus, the fund with the highest share of hybrid and electric vehicle build out barely
reaches 50%, with some portfolios’ investment profile still dominated by 97% of additions in petrol
and diesel vehicles. These results also contextualize that although the gap to the 2°C scenario for ICEs
and electric vehicles highlighted above is significant, the relative performance in terms of investment
plans between funds still differs widely. The wider gap in the scenario shading on the figure on the
right is driven by the uncertainty around the overall growth of non-hybrid and electric vehicles under
a 2°C transition in the scenarios themselves.
FIGURE 24 HYBRID AND ELECTRIC VEHICLES STILL MAKE UP LESS THAN 50% OF PLANNED PRODUCTION INCREASE
INVESTMENTS 2017-2022, WITH ONLY PORTFOLIO CRACKING THE 50% (Source: Authors, based on WardsAuto /
Autoforecast Solutions)
20 It should be noted that these results are slightly biased by a small sample of portfolios where ICE production actually decreases. This does not have a material impact on the overall results however.
0%
10%
20%
30%
40%
50%
60%
70%
80%
90%
100%
% s
har
e o
f d
rive
trai
n in
pla
nn
ed
car
pro
du
ctio
n in
cre
ase
e 2
01
7-
20
22
Electric vehicles Hybrid vehicles ICEs
0%
10%
20%
30%
40%
50%
60%
70%
80%
90%
100%
% H
ybri
d-
and
ele
ctri
c ve
hic
les
pro
du
ctio
n g
row
th in
to
tal
pro
du
ctio
n g
row
th,
20
17
–20
22
Swiss pension funds and insurance' listed equity portfolio
Hybrid and Electric vehicles - Listed equity portfolio
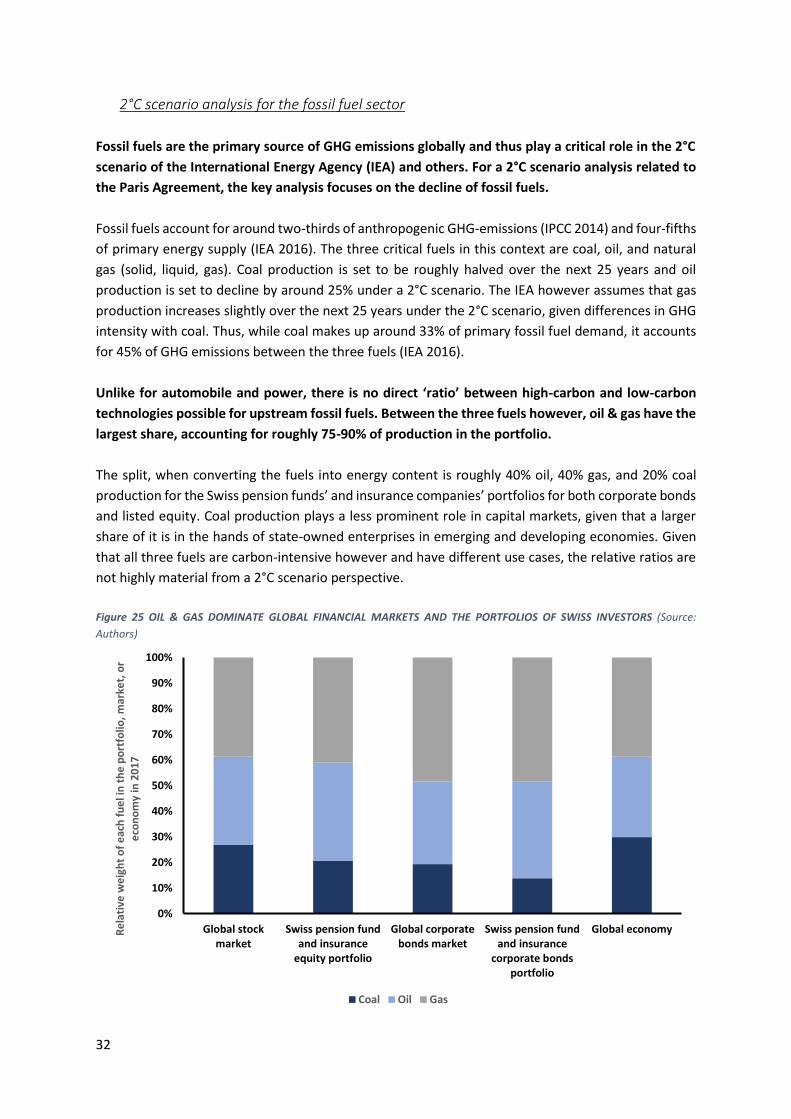
32
2°C scenario analysis for the fossil fuel sector
Fossil fuels are the primary source of GHG emissions globally and thus play a critical role in the 2°C
scenario of the International Energy Agency (IEA) and others. For a 2°C scenario analysis related to
the Paris Agreement, the key analysis focuses on the decline of fossil fuels.
Fossil fuels account for around two-thirds of anthropogenic GHG-emissions (IPCC 2014) and four-fifths
of primary energy supply (IEA 2016). The three critical fuels in this context are coal, oil, and natural
gas (solid, liquid, gas). Coal production is set to be roughly halved over the next 25 years and oil
production is set to decline by around 25% under a 2°C scenario. The IEA however assumes that gas
production increases slightly over the next 25 years under the 2°C scenario, given differences in GHG
intensity with coal. Thus, while coal makes up around 33% of primary fossil fuel demand, it accounts
for 45% of GHG emissions between the three fuels (IEA 2016).
Unlike for automobile and power, there is no direct ‘ratio’ between high-carbon and low-carbon
technologies possible for upstream fossil fuels. Between the three fuels however, oil & gas have the
largest share, accounting for roughly 75-90% of production in the portfolio.
The split, when converting the fuels into energy content is roughly 40% oil, 40% gas, and 20% coal
production for the Swiss pension funds’ and insurance companies’ portfolios for both corporate bonds
and listed equity. Coal production plays a less prominent role in capital markets, given that a larger
share of it is in the hands of state-owned enterprises in emerging and developing economies. Given
that all three fuels are carbon-intensive however and have different use cases, the relative ratios are
not highly material from a 2°C scenario perspective.
Figure 25 OIL & GAS DOMINATE GLOBAL FINANCIAL MARKETS AND THE PORTFOLIOS OF SWISS INVESTORS (Source:
Authors)
0%
10%
20%
30%
40%
50%
60%
70%
80%
90%
100%
Global stockmarket
Swiss pension fundand insurance
equity portfolio
Global corporatebonds market
Swiss pension fundand insurance
corporate bondsportfolio
Global economyRe
lati
ve w
eig
ht
of
eac
h f
ue
l in
th
e p
ort
folio
, m
arke
t, o
r e
con
om
y in
20
17
Coal Oil Gas
33
Oil production growth by 2022 is in the 2°C-4°C scenario range, albeit with some short-term
production growth above the 2°C target in between.
The results show that growth trends are largely identical across all levels, growing slightly in the short-
term and then levelling off at current levels, roughly in the 2°C-4°C range. It is worth highlighting a few
aspects in further detail. While the growth rates shown here are largely flat, production plans in 2015
were still significantly steeper, following what had been an investment boom in the context of high oil
prices. Thus, similar for the growth of electric vehicles, it appears that companies are starting to adapt
to a more carbon-constrained world, even if not yet aligned with 2°C. As for all technologies however,
companies still have the chance to ‘revert course’ again. Should they sustain significant capital
expenditure in the next 2-3 years, production is likely to increase above what is currently identified.
An alternative approach – pioneered by the Carbon Tracker Initiative and Energy Transition Advisors
– is to allocate future growth based on the cost of production for different companies.
This approach considers that least cost oil should get produced first. Thus, even if you own 1% of the
global market, if 100% of your oil is high-cost oil, then you have a different production curve than a
company that owns 1% of the global market, but where all of their oil is low-cost. The advantage of
that approach is that it considers economic efficiencies in allocating future production. The
disadvantage of that approach is that in the short-term, it creates a hierarchy of GHG emissions
independent of a ‘pure’ climate perspective. Moreover, companies may not pursue a least cost
approach for a range of non-economic reasons (including the fear of not being able to sell oil in the
future in a 2°C world). Investors were provided with both types of analyses, building on the work of
the Carbon Tracker Initiative and UN Principles for Responsible Investments (PRI), in order to ensure
a more holistic picture in analysing and acting on exposures in the oil & gas sector.
FIGURE 26 THE GROWTH RATES FOR GLOBAL OIL PRODUCTION OF SWISS INSURANCE AND PENSION FUNDS LISTED
EQUITY AND CORPORATE BONDS PORTFOLIOS, THE GLOBAL CORPORATE BOND AND STOCK MARKET, AND THE GLOBAL
ECONOMY, RELATIVE TO THE IEA SCENARIOS (Source: Authors, based on GlobalData and IEA 2016)
0.9
1
1.1
1.2
2017 2018 2019 2020 2021 2022
Gro
wth
in o
il p
rod
uct
ion
, 2
01
7=1
Oil production - Listed equity
>6C 4°C-6°C
2°-4°C >2°C
Global stock market Pension funds
Insurance Global economy
0.9
1
1.1
1.2
2017 2018 2019 2020 2021 2022
Gro
wth
in o
il p
rod
uct
ion
, 2
01
7=1
Oil production - Corporate bonds
>2°C 2°-4°C
4°C-6°C >6C
Global bond market Pension funds
Insurance Global economy

34
Gas production in the portfolios of Swiss pension funds and insurance companies aligns with the 2°C
scenario, making it the part of the portfolio that is most consistent with the Paris Agreement today.
Interestingly, the growth trends here differ to a larger degree than for oil production. Again, growth
trends are not consistent for Swiss insurance companies across their listed equity and corporate bonds
portfolios, creating a 2°C-4°C outcome for their listed equity portfolio and a <2°C outcome for their
corporate bonds portfolio. For bonds markets, despite the deviation of the growth rate over time, all
levels end up close to each other by 2021.
While production decreases again slightly by 2022, this is at least in part potentially due to a question
of time horizons. The current pipeline of production decreases by around 2020. This will only be
sustained however if no further investment materializes that continues to lead to increased
production levels, thus creating an outcome where the lines of the relative portfolios and markets in
the chart continue to trend upward.
In terms of regional breakdown, oil and gas exposures for both the Swiss portfolios (across both asset
classes) and the global corporate bonds and stock markets tilt slightly more to OECD production than
the economy, with around 40-50% of gas production in the OECD and 30-40% of oil production in the
OECD.
FIGURE 27 GAS PRODUCTION FOR SWISS PENSION FUNDS AND INSURANCE COMPANIES IS CURRENTLY CONSISTENT
WITH THE 2°C SCENARIO (Source: Authors, based on GlobalData and IEA 2016)
0.9
1
1.1
1.2
2017 2018 2019 2020 2021 2022
Gro
wth
in g
as p
rod
uct
ion
, 2
01
7=1
Gas production - Listed equity
>6C 4°C-6°C
2°-4°C >2°C
Global stock market Pension funds
Insurance Global economy
0.9
1
1.1
1.2
2017 2018 2019 2020 2021 2022
Gro
wth
in g
as p
rod
uct
ion
, 2
01
7=1
Gas production - Corporate bonds
>2°C 2°-4°C
4°C-6°C >6C
Global bond market Pension funds
Insurance Global economy

35
As highlighted above, one key challenge in analyzing the alignment of financial portfolios with the
Paris Agreement relates to the underlying scenario.
Given its market acceptance and broad coverage, as well as its reliable annual updates, the scenarios
of the IEA were chosen for this pilot. However, there are alternatives with sometimes dramatically
different results, not just in the level of ambition, but also in technology choice. The figure below
highlights the relative evolution of the 5 current sources of primary energy demand (coal, natural gas,
nuclear, renewables) until 2040 in the IEA World Energy Outlook 2016 and the Greenpeace Advanced
Energy Revolution scenario 2015.
This assumption is at least in part driven by assumptions around the capacity for carbon capture and
storage (CCS), set to save around 2-2.5 GT of GHG emissions in the power sector by 2040 in both the
2°C and Below 2°C scenario of the IEA. Without that assumption, the production decline for fossil fuels
is likely to be more pronounced.
The results show that not only is Greenpeace less optimistic about the future of fossil fuel, unlike for
the IEA it actually sees a decline in nuclear power. For the fossil fuels analysis, as well for the analysis
in the other sectors, using the Greenpeace scenario would have likely amplified the level of ambition
in terms of the required increase or decrease of the respective technologies. At the same time, given
that the assessmnet period was constrained to 5 years, these differences would be more limited than
over a more long-term time horizon (e.g. until 2040).
FIGURE 28 FOSSIL FUELS AND NUCLEAR FACE A SIGNIFICANTLY MORE DRAMATIC SHOCK TO PRODUCTION BY 2040
UNDER THE GREENPEACE ADVANCED ENERGY REVOLUTION SCENARIO RELATIVE TO THE IEA (Source: Authors, based on
IEA 2016 and Greenpeace 2015)
0
0.5
1
1.5
2
2.5
3
3.5
4
4.5
Coal Natural gas Crude oil Nuclear Renwables
20
40
to
tal p
rim
ary
en
erg
y d
em
and
re
lati
ve t
o 2
02
0 le
vels
, 2
02
0=1
Greenpeace IEA

36
2°C scenario analysis for non-road transport and industry
As mentioned in the introduction to this report, there are a number of sectors where no
commercially available CO2-neutral technology has yet been identified in the 2°C scenarios of the
IEA (not taking into account partial substitutes, such as wood for cement).
Of focus in this section are four of these sectors: steel, shipping, aviation, and cement. For these
sectors, decarbonisation efforts will be confined to the increasing efficiency in production and use, as
well as investment in research and development in the next 5-10 years, in order to bring CO2-neutral
alternatives to market maturity in the medium term. As a result, both the scenarios and the data
situation are relatively imprecise.
The figures presented here are based on external CO2 intensity estimates based on a publicly available
emission estimation model developed by the 2° Investing Initiative together with the consulting
company EY. Since this model estimates externally and top down, it is associated with some
uncertainties. The results are therefore to be regarded as estimates. The discussion will focus first on
cement and steel and then shipping and aviation.
It should be noted that while all of the analysis presented here focuses on intensities, another driver
of decarbonization is the actual volume of production. While this is not an explicit driver in the IEA
scenario for cement, production of secondary crude steel is around 30% lower in the Below 2 Degrees
scenario of the IEA relative to the baseline by 2060. In aviation, passenger km are around 20-35%
lower by 2060.
Swiss companies have exposure to companies responsible for roughly 40% of global cement
production and 26% of global steel production through their portfolios.
The iron and steel sector is the largest CO2 emitter in industry, accounting for 28% of industrial
emissions, with the cement sector taking the second-largest share of CO2 emissions from industry, at
27% (2,230 MtCO2/year) in 2014 (IEA 2017). The three most notable sectors missing from this analysis
are aluminium, pulp and paper, and chemicals and petrochemicals, which are also linked to fossil fuels.
While there are key long-term drivers for decarbonization in both sectors related to technologies and
processes currently not commercially available and potentially controversial (e.g. carbon capture and
storage, geo-mimicry), the primary short-term driver are efficiency measures and the implementation
of technologies in the production process more generally designed to reduce CO2 emissions. Especially
important for the steel sector for example is the use of electric arc furnace as a considerably more
climate friendly alternative to conventional methods.
The benchmarking of the required reductions are expressed in real economic units – tons of CO2
emissions divided by tons of cement and tons of steel respectively. The required trajectories are based
on the Science-Based Targets (SBT) Initiative Sectoral Decarbonization Pathways, developed by WWF,
WRI, and CDP. It should be noted that the publicly available SBTs are from 2014, so slightly outdated.
While more up-to-date estimates can be derived from the IEA scenarios, these were not used here in
order to ensure consistency with existing market practice

37
The figure below summarizes the results for the steel and cement sector respectively and the
aggregated Swiss pension funds’ and insurance companies’ listed equity and corporate bonds
portfolios.
The decarbonization curves are mapped specifically to each starting point of the respective portfolios.
As can be seen, the sectoral decarbonization pathways show limited action over a 5 year time horizon,
with limited overall CO2 reductions by 2022. Indeed, this shows the need for exploring other elements
in the analysis, notably the deployment of R&D in the service of developing zero-carbon alternatives.
FIGURE 29 LIMITED AMBITION IN THE IEA SCENARIO IMPLIES LIMITED DECARBONIZATION REQUIREMENT FOR SWISS
CEMENT AND STEEL EXPOSURE (Source: Authors, based on Plantfacts / Cemnet, 2ii / EY and own calculations)
For the shipping and aviation industries, the same focus is on CO2 intensity as for steel on the
previous page.
For the aviation sector, the analysis used the Sectoral Decarbonization Approach (SDA) of the Science-
Based Target (SBT) project: the curve of the 2°C trajectory takes as a starting point the current
portfolio situation, the sector average. Converting aircraft fleets into CO2 emissions required defining
assumptions on aircraft utilization rates, which again are linked to some uncertainty when converted
into passenger-km. The intensity for an airplane (in terms of passenger-km) with exclusively business
class seats will obviously be fundamentally different than for an airplane that only services an
economy class cabin.
0.55
0.56
0.57
0.58
0.59
0.60
0.61
0.62
0.63
0.64
0.65
0.66
2017 2019 2021
t o
f C
O2
/ t
of
cem
en
t
Cement - Listed equity and corporate bonds portfolio
Pension funds & insurance - Listed equity
Listed equity - 2°C target
Pension funds & insurance - Corporate bonds
Corporate bonds - 2°C target
0.9
1.0
1.1
1.2
1.3
1.4
1.5
2017 2019 2021
t o
f C
O2
/ t
of
ste
el
Steel - Listed equity and corporate bonds portfolio
Pension funds & insurance - Listed equity
Listed equity - 2°C target
Pension funds & insurance - Corporate bonds
Corporate bonds - 2°C target

38
Another factor, not further explored here, is the question around creating a hierarchy of uses in terms
of partial substitutes. Thus, high-speed rail can be considered a substitute or technology alternative
for the London-Paris travel route, but not for London-New York City. While these questions are not
further explored in the 2°C scenarios of the International Energy Agency, they can be relevant in
thinking about the climate-friendliness of the sector more generally, and, moving forward, relative to
risks to air travel from technology competition across specific routes.
For the maritime sector, the project did not develop a 2°C target. The IEA scenario provides only an
indication for the emissions trajectory of the sector as a whole. However, given the differences
between uses (oil tanker, cargo, etc.), it can be misleading to compare different companies to a global
target. As a result, a rating methodology specific to ship type was applied. This rating by Carbon
Efficiency Level, developed by Carbon War Room and Rightship, labels each ship from A to G under a
normal distribution, where A is the best rating. The ranking is dynamically calculated to account for
annual improvements in efficiency and variations in the mean, so that "A" ships always represent the
top percentage shares (measured in terms of CO2 intensity).
For the shipping sector, Swiss pension funds and insurance companies only had exposures to two
companies, whereas the exposure in listed equity was more diverse. This led to a lower exposure to A
and B rated ships, but equally a lower exposure to G rated ships. For aviation, the results show a
significant difference in the relative starting point of the CO2-intensity, although the actual ambition
in terms of reduction is limited.
FIGURE 30 THE CORPORATE BONDS PORTFOLIOS ARE LESS CO2-INTENSIVE FOR SHIPPING AND MORE CO2-INTENSIVE FOR
AVIATION (Source: Authors)
0.02
0.03
0.03
0.04
0.04
0.05
0.05
2017 2018 2019 2020 2021 2022
ton
CO
2 /
km
Aviation
Swiss pension funds and insurance - Listed equity
Listed equity - 2°C target
Swiss pension funds and insurance - Corporate bonds
Corporate bonds - 2°C target

39
IV. IMPLICATIONS FOR FINANCIAL RISK
While the focus in this paper is on the climate outcome, the objectives defined in the Paris
Agreement and those related to climate change more generally can potentially also create financial
risk for Swiss pension funds and insurance companies, if not properly anticipated.
The most significant risk to Swiss pension funds and insurance companies could arise if the 2°C goal is
not met. These risks relate to the physical risks associated with significant global warming on a +4°C
or even +6°C pathway. Analysis by Aviva and the Economist Intelligence Unit (ECIU) estimates the net
present value of losses to current manageable assets associated with climate change under a 6°C
pathway at roughly $60 trillion (Aviva 2015). The associated depressed returns may put further burden
on institutional investors facing a low-interest rate environment. In GDP terms, a high-carbon
outcome can reduce GDP by 20% or more relative to a low-carbon baseline by 2050 (CISL 2016). The
Financial Stability Board Task Force on Climate-related Financial Disclosures (FSB TCFD) defines these
risks as physical risks.
Mitigating physical risks by achieving the 2°C climate goal could significantly reduce these financial
risks. Physical risks cost would fall to below $10 trillion under a <3°C outcome according to the same
Aviva / ECIU estimates. Macroeconomic GDP effects are negligible and may even be slightly positive
given increased investment and other efficiency and productivity gains, in particular for fossil fuel
importing countries. Nevertheless, financial portfolios may potentially be exposed to what the FSB
TCFD calls transition risks that is the economic and financial risk associated with the transition to a
low-carbon economy. Transition risks are likely to be particularly pronounced for those sectors that
need to decarbonize i.e. the majority of sectors covered in the previous sections, and the financial
institutions invested in these companies i.e. banks and institutional investors.
According to the European Systemic Risk Board, these risks are likely to be higher if a transition is
delayed and by extension becomes disruptive (ESRB 2016). Similarly, a delayed transition implies
lower GDP growth than a smooth, rapid transition, according to recent estimates by the OECD (OECD
2017).
FIGURE 31 STYLIZED REPRESENTATION OF PHYSICAL AND TRANSITION RISKS (Source: Authors)

40
While the 2°C scenario analysis provided in this report is not directly a risk assessment, it can help
inform the understanding of the financial transition risk exposure of Swiss pension funds and
insurance companies, in particular in terms of anticipating whether the transition is likely to be smooth
(production & investment plans aligning with the 2°C scenario) or more disruptive (misalignment in
the short-term, followed by sudden and rapid adjustment).
The analysis can demonstrate the scale of the exposure should these risks materialize. From a
transition risk management perspective, the following three questions should guide the analysis :
1) Is my portfolio building up potential 2°C transition risks by deviating from the 2°C benchmark?
2) If this is the case, what is the scale of my exposure to these risks in % of portfolio?
3) Should these risks then materialize, what are potential losses?
The first question is answered through the 2°C scenario analysis of the kind highlighted on the previous
pages. Of course, the results will be highly specific for each portfolio.
One way to quantify transition risk is to measure the deviation from the market in terms of overall
exposure.
The figure below shows the extent to which Swiss investor portfolios over-weight or under-weight
coal power and oil production relative to the global stock market portfolio in 2017. They suggest that
collectively, Swiss pension funds and insurance companies tend to under-weight these technologies
in terms of absolute ownership. However, this under-weight may be driven more by regional
differences in portfolio exposure. It is also worth highlighting that this under-weight does not
comment on the actual misalignment in the investment plans of companies within these portfolios.
Thus, the under-exposure to renewables for examples may be even higher for these investors,
suggesting in relative terms a misalignment
FIGURE 32 THE MAJORITY OF SWISS PENSION FUNDS AND INSURANCE COMPANIES HAVE LOWER EXPOSURE TO OIL
PRODUCTION AND COAL-FIRED POWER CAPACITY IN THEIR LISTED EQUITY PORTFOLIO IN 2017 RELATIVE TO THE GLOBAL
STOCK MARKET (Source: Authors, own calculations based on GlobalData)
-100%
0%
100%
200%
300%
400%
500%
600%
% d
evi
atio
n f
rom
th
e g
lob
al s
tock
mar
ket
in
20
17
Coal power - Listed equity
-100%
-50%
0%
50%
100%
150%
% d
evi
atio
n f
rom
th
e g
lob
al s
tock
mar
ket
in
20
17
Oil production - Listed equity

41
In terms of the scale of exposure, the answer is highly investor specific.
There are different approaches to quantifying the scale of the exposure. Moody’s in 2016 developed
a methodology to classify different sectors in their corporate bonds universe by environmental risk
category. Thus, even though not specific to just the 2°C scenario, it provides a proxy for these types of
risks more generally.
These categories involved companies in sectors with “immediate elevated risk of downgrade”,
“emerging elevated risk of downgrade”, and “emerging moderate risk of downgrade”. While this
classification system is an excellent resource, it takes a broader view of transition risks beyond just
the 2°C transition. Moreover, it cannot be applied for listed equity since it relates to the corporate
bonds rated universe.
The figure below applies the Moody’s classification system to the Swiss investors’ corporate bonds
funds and a simple sector taxonomy of high-carbon sectors for listed equity, where the Moody’s
taxonomy – designed for corporate bonds – cannot easily be transposed. The results show a significant
divergence in risks exposure of anywhere in the low single-digits percentage of portfolio to upwards
of 40% of the portfolio at risk. The figure also shows the sectoral exposures to the sectors highlighted
in this pilot project, in terms of relative weight in the portfolio, applying a more simple sectoral lens
without further exploration of the risks, given the lack of equivalent risk taxonomies as the Moody’s
analysis for corporate bonds.
FIGURE 33 AROUND ONE-THIRD OF ANALYSED FUNDS HAVE MORE THAN 20% OF THEIR PORTFOLIO EXPOSED TO
TRANSITION RISK SECTORS (Source: Authors, based on Moody’s 2016 and own calculations)
The question then becomes what is the potential value at risk to this part of the portfolio should a 2°C
outcome materialize. This requires additional financial analysis and assumptions around the extent to
which this outcome is already integrated into current asset prices. A range of equity and credit
research analysts have attempted this type of analysis, as well as consultancies and NGOs (2ii 2017).
0%
5%
10%
15%
20%
25%
30%
35%
40%
45%
50%
% o
f th
e f
un
ds'
ass
ets
un
de
r m
anag
em
en
t at
ris
k o
f d
ow
ngr
ade
by
risk
leve
l
Corporate bonds funds
Immediate elevated risk Emerging elevated risk
Emerging moderate risk
0%
5%
10%
15%
20%
25%
30%
35%
40%
45%
50%
% o
f th
e f
un
ds'
ass
ets
un
de
r m
anag
em
en
t
Listed equity funds
Fossil fuels Transportation
High-carbon industry
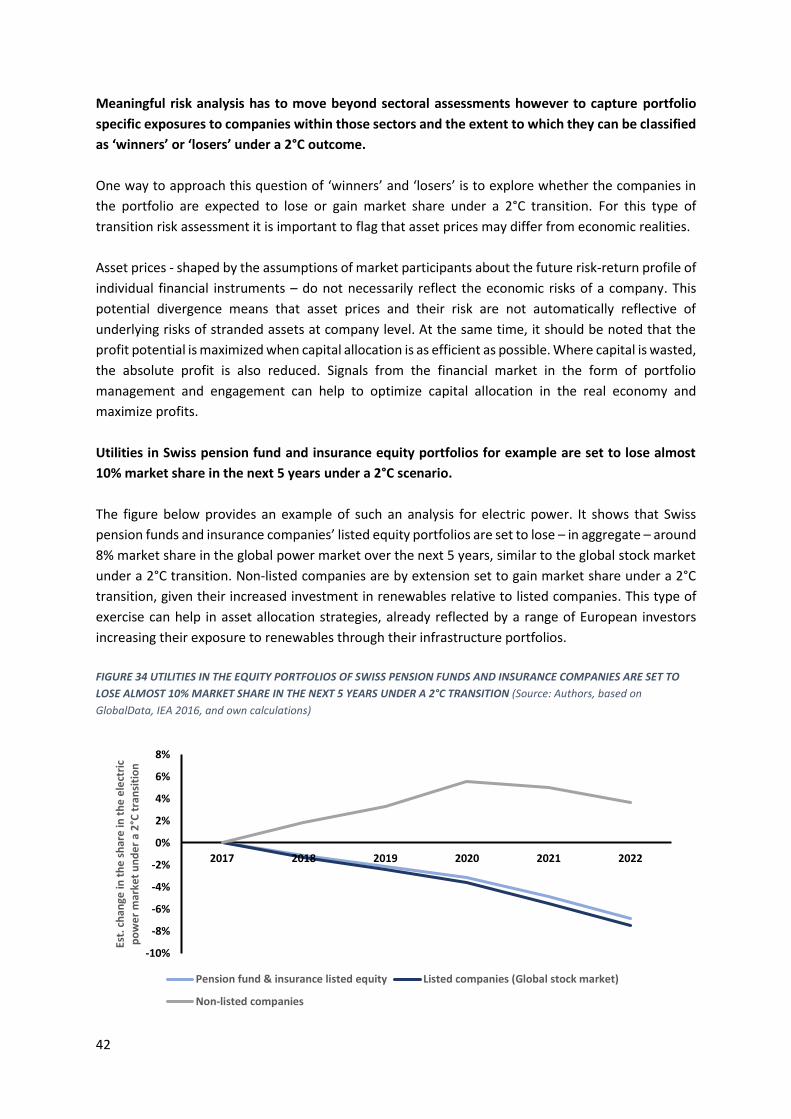
42
Meaningful risk analysis has to move beyond sectoral assessments however to capture portfolio
specific exposures to companies within those sectors and the extent to which they can be classified
as ‘winners’ or ‘losers’ under a 2°C outcome.
One way to approach this question of ‘winners’ and ‘losers’ is to explore whether the companies in
the portfolio are expected to lose or gain market share under a 2°C transition. For this type of
transition risk assessment it is important to flag that asset prices may differ from economic realities.
Asset prices - shaped by the assumptions of market participants about the future risk-return profile of
individual financial instruments – do not necessarily reflect the economic risks of a company. This
potential divergence means that asset prices and their risk are not automatically reflective of
underlying risks of stranded assets at company level. At the same time, it should be noted that the
profit potential is maximized when capital allocation is as efficient as possible. Where capital is wasted,
the absolute profit is also reduced. Signals from the financial market in the form of portfolio
management and engagement can help to optimize capital allocation in the real economy and
maximize profits.
Utilities in Swiss pension fund and insurance equity portfolios for example are set to lose almost
10% market share in the next 5 years under a 2°C scenario.
The figure below provides an example of such an analysis for electric power. It shows that Swiss
pension funds and insurance companies’ listed equity portfolios are set to lose – in aggregate – around
8% market share in the global power market over the next 5 years, similar to the global stock market
under a 2°C transition. Non-listed companies are by extension set to gain market share under a 2°C
transition, given their increased investment in renewables relative to listed companies. This type of
exercise can help in asset allocation strategies, already reflected by a range of European investors
increasing their exposure to renewables through their infrastructure portfolios.
FIGURE 34 UTILITIES IN THE EQUITY PORTFOLIOS OF SWISS PENSION FUNDS AND INSURANCE COMPANIES ARE SET TO
LOSE ALMOST 10% MARKET SHARE IN THE NEXT 5 YEARS UNDER A 2°C TRANSITION (Source: Authors, based on
GlobalData, IEA 2016, and own calculations)
-10%
-8%
-6%
-4%
-2%
0%
2%
4%
6%
8%
2017 2018 2019 2020 2021 2022
Est.
ch
ange
in t
he
sh
are
in t
he
ele
ctri
c p
ow
er
mar
ket
un
de
r a
2°C
tra
nsi
tio
n
Pension fund & insurance listed equity Listed companies (Global stock market)
Non-listed companies
43
V. OPTIONS FOR ACTION
The results demonstrate that the listed equity and corporate bonds portfolios of Swiss pension
funds and insurance companies exhibit significant differences across different actors.
Portfolios differ both in terms of their aggregate exposure and misalignment to the 2°C benchmark as
well as with regard to the capital transition i.e. changes in production and investment plans required
under the Paris Agreement. Some portfolios may already be consistent with the Paris Agreement,
whereas others are lacking for some technologies and sectors.
There is no one size fits all conclusion. Depending on the investor’s views, a number of different
actions may be relevant:
• Investors may find that their portfolio appears to be consistent with the Paris Agreement for
the asset class and technologies analysed and are happy with this outcome. No specific action
may be required.
• Investors may find that their portfolio appears to be consistent with the Paris Agreement for
the asset class and technologies analysed, but beyond consistency are looking to have a
concrete impact on the achievement of climate goals. This may be driven by the desire to limit
long-term risks to their assets under management associated with a 6°C global warming and
associated physical risks (see introduction). Further action may be required.
• Investors may find that their portfolio is consistent with a high-carbon, ‘4-6°C scenario’, but
see this as the most likely and least-risk outcome and thus choose to do nothing.
• Investors may find that their portfolio is consistent with a high-carbon, ‘4-6°C scenario’, but
believe that the global economy will shift. In this case, strategies may involve either switching
to alternative passive index funds that may potentially reflect transition risks, engagement
with companies, or active management, depending on the particular profile of the investor.
• In terms of specific portfolio actions for investors, Swiss Sustainable Finance has developed a
toolbox of potential actions for investors. These include notably exclusion criteria, best-in
class approaches, ESG integration, active voting at shareholder AGMs, shareholder
engagement in direct dialogue with companies, sustainable thematic investments, as well as
various sustainable investment strategies across asset classes (e.g. infrastructure) (SSF 2017).
The over-arching themes across these tools relevant from the perspective of this pilot are portfolio
management (active or passive) and engagement with companies.
Active investment strategies can build on 2°C scenario analysis.
In this case, companies can be excluded from the portfolios or their shares weighted less if their
technology exposure, energy / CO2 efficiency, and / or the evolution of these indicators are not
compatible with a 2°C path over time. In turn, companies can be identified that develop new green
technologies. Active portfolio management with regard to the Paris Agreement generally goes beyond
the scope of the analysis presented in this report.

44
For example, many 'green funds' are not broadly diversified and focus only on certain companies
identified as sustainable or 2°C compatible. These strategies can, for example, be part of a smaller
mandate within a broadly diversified mandate. When selecting the companies, both current exposures
and forward-looking elements can be considered for production plans.
In addition to direct, active management, portfolio strategies can also be implemented with funds
that explicitly pursue a 2°C compatible strategy.
There are also funds that do not explicitly implement a 2°C compatible strategy, but perform well
relative to the 2°C scenario analysis. Some of the funds analysed in this pilot did not specifically suggest
a 2°C strategy, but nevertheless were largely consistent with the 2°C benchmark for example.
The following summarizes the main strategies that currently exist in the market for choosing more
climate friendly strategies relative to mainstream benchmarks, some of which are applied in
combination with each other:
• 'Low-carbon' strategies try to reduce the carbon footprint of the portfolio by either
underweighting or directly excluding CO2-intensive firms. In general, this affects, in particular,
coal-intensive power suppliers, as well as companies in certain industries (for example
cement). However, these strategies take into account only direct emissions (Scope 1) and
emissions associated with electricity consumption (Scope 2), rather than emissions generated
indirectly in the supply chain or in the product use. Therefore, automotive companies are
often not considered. Similarly, when looking at energy companies (coal, oil and gas) the
challenge is that the analysis does not consider the emissions of the products (> 90% of the
total emissions). Moreover, estimated data are used for the majority of companies in the
equity market, given reporting gaps, which can give rise to significant uncertainty around the
results. Finally, carbon intensity analysis is frequently based on normalization factors related
to market capitalization or revenues, which can create biases.
• 'Fossil-free' strategies focus on companies with fossil fuel reserves. Almost exclusively
companies in the coal, oil and gas sectors are affected by this. These strategies do not take
into account directly the energy production or associated emissions. They are often linked to
the first strategy and can therefore in combination offset some of their respective
weaknesses.
• 'Green investment strategies' focus on the alternatives to CO2-intensive products. Here,
either certain technologies are analysed (for example renewable energies, electric cars) or
'green’ products and services more generally through a classification system. The challenge
here is to mix different 'green' categories (such as green products for the transport and
electricity sectors, or other industries). Active strategies involving very concentrated
portfolios often have an advantage here thanks to specific expertise in individual companies
and more flexibility. This strategy is increasingly mixed with the first two strategies.

45
A recommendation for specific funds or strategies is not given in the context of this project. It should
be noted that the market is rapidly developing.
It can be assumed that the product range will continue to grow in the coming years. In addition, some
market players have begun developing climate ratings related to these fund strategies. The challenge
here relates to the reliability of these ratings, as well as broader challenges around taking a ‘top-down’
rating or scoring system as an individual figure for the overall climate performance of a fund. The
ratings developed to date don’t specifically reference the global climate objective and may subsume
a range of different technology exposures in one category. Fund strategies may desire to move beyond
ratings to more granular passive strategies related to sectors.
While the emphasis is on climate alternatives, many mainstream funds may also (either be design
or otherwise) integrate some form of a ‘climate strategy’.
An analysis of the top 100 largest funds in Europe, derived from the Morningstar database, suggests
that these funds show significant divergences in terms of strategies and exposures. Thus, nearly 40%
of the top 100 funds don’t have coal production in their portfolio, and roughly the same amount have
a share of more than 40% of low-carbon power. On the flipside, only around 15% have no fossil fuel
production entirely and only 10 boast more than 10% of car production in lower carbon vehicles
(hybrid, electric).
FIGURE 35 THE TOP 100 EUROPEAN FUNDS DIFFER SIGNIFICANTLY IN TERMS OF THEIR TECHNOLOGY EXPOSURES
(Source: Authors, based on GlobalData, WardsAuto / AutoForecastSolutions, Morningstar, and own calculations)
0
5
10
15
20
25
30
35
40
>10% low-carbon cars
No coalproduction
No oil & gasproduction
No oil, gas,and coal
production
>30%renewables in
powercapacity
>40% low-carbon powerin total power
capacity
<15% coalpower in total
capacity
AutomotiveSector
Fossil Fuels Sector Power Sector
# o
f fu
nd
s in
th
e r
ele
van
t ca
tego
ry (
n=1
00
)

46
In addition to portfolio management, the investor’s engagement with companies is another
potential option.
This engagement strategy by investors focuses in particular on influencing the company strategy in
the interest of increased resilience relative to the 2°C scenario and keeping the company’s market
share. On the basis of the forward-looking data, investors can discuss information about investment
plans with portfolio companies. It should be taken into account that the investment plans of the
companies can still change significantly - including for the time horizon shown in this analysis. Indeed,
this is the key point of engagement in some sense.
Engagement can be driven by both a ‘climate goal’ objective and / or a ‘transition risk’ objective,
objectives which may overlap.
Engagement with oil & gas companies for example may simply focus on reducing production, but may
also take a broader view and address questions of least cost production, as highlighted by the research
of the UN PRI and Carbon Tracker Initiative. In terms of climate goals, engagement with individual
companies may be successful at company level, but negative from a macroeconomic view.
For example, a company may choose to divest certain high-carbon assets following engagement, but
these assets are then sold to another company, which may be less susceptible to public pressure and
choose to bring these assets to market, potentially even more cost effective than the original
company. One potential example for this strategy is the sale by ConocoPhilips of tar sands to Canadian
oil & gas company Cenovus, which is now seeking to rapidly develop these assets.
On the other hand, other oil & gas companies have recently decided to exit the Arctic with no
associated ‘offsetting’ actor in the short-term. Although this decision had a range of drivers, just the
decision of ConocoPhilips had, it was preceded by significant engagement among a range of European
investors with Shell on arctic drilling, coupled with public campaigns.
Finally, while the 2°C scenario analysis focused on capital expenditure, R&D is a key part of the
transition. Given its relatively small share in expenditure budgets for most companies (<5% of sales
and in some sectors less than <1%), engaging on R&D may be more effective for reaching a significant
climate impact. Especially for the sectors where zero-carbon alternatives are lacking – shipping,
aviation, cement, steel – this strategy seems to be more impactful.
The challenge in terms of engagement on R&D is defining what R&D levels should look like. Another
factor is that it is not just the ‘quantity’ but also the ‘quality’ of R&D that matters. However, one way
to approach this topic is in terms of R&D intensity. Companies in the construction & materials sector
for example (e.g. cement, steel) only spend around $1 for every $100 in sales on R&D, compared to
$4 for the automobile sector and $11 for the software and computer services industry. To put that
number into context: the sum total R&D – climate related or otherwise – of the 69 largest construction
& materials companies in the world in 2015 was only around $11 billion. If the construction & materials
sector will require a similar technological revolution as the software industry (replacing its core
‘product’ over perhaps 5-7 product cycles), those figures are off by a factor of at least 10 (keeping in
mind that only a fraction of that $11 billion is likely climate relevant).
47
VI. CONCLUSION
This project developed a new type of public-private partnership between Swiss insurance
companies, pension funds, and the Swiss government on implementing the Paris Agreement.
79 Swiss pension funds and insurance companies took the opportunity to analyse their portfolios as
part of a pilot on monitoring progress towards achieving Art. 2.1c of the Paris Agreement – aligning
financial flows with climate goals. The results of the analysis suggest that there is some way to go
before this objective is achieved, but actions today mean alignment with the scenario over time is in
reach for Swiss financial markets. Moreover, given current growth trends of individual companies,
financial markets can if they begin to shift capital expenditure plans today ensure a smooth transition
that minimizes economic and financial costs of the transition and achieves the well below 2°C goal.
The project joins the ranks of a range of initiatives on monitoring climate goal alignment in financial
markets.
Two European supervisory authorities have analysed the alignment of insurance companies with the
2°C scenario in parallel with this Swiss analysis 2017. In 2015, France implemented regulation
mandating disclosure on the alignment of French institutional investors with 2°C climate goals (Art.
173 of the French Energy Transition Law).
While internationally lauded, anecdotal evidence suggests that the implementation in the first year of
application (2017) has not necessarily been a full success. Many investors either struggled to identify
solutions to comply with the legislation, or failed to report 2°C scenario analysis entirely. Of course, as
French investors get accustomed to the new regulatory constraints, this number would be expected
to increase over time.
While Switzerland adopted a voluntary pathway, 65% participation rate – measured as AUM - can
be seen as a success, involving both large and small Swiss investors.
Similarly, while individual investors are not required to report, this project equips these investors with
the tools and information to develop portfolio strategies in response to the global Paris Agreement.
The common approach also ensured that the project provides a response to Art. 2.1c that is more
cost-efficient, while ensuring comparability. This cost efficiency is achieved through the centralization
and automation of the analysis, as well as the reduction in search costs.
One critical caveat in this context is the exclusion of other types of climate actions, notably R&D,
qualitative actions related to company strategies, influence on the supply chain, etc. Especially for
R&D, which is a key solution for the 2°C goal, both data and more specific scenarios are missing. This
type of assessment can be obtained through ESG scoring providers.

48
The results presented here can form a point of departure for further analysis and action on
implementing the Paris Agreement. It can also help move forward form part of the framework of
UNFCCC reporting on Art. 2.1c. The analysis can also be used to track the impact of climate friendly
measurements of financial market actors.
The analysis presented here can also potentially in the future be used by the Swiss government to
report on Art. 2.1c of the Paris Agreement. As a pilot project, it can help inform international
standardization initiatives, notably ISO 14097.
By having created a benchmark for where Swiss pension funds and insurance companies are today,
this dataset can in the future be used to track progress on Art. 2.1c relative to current levels. It can
also help identify whether ultimately investment and production plans evolved to align with the 2°C
climate goal - setting the basis for a global capital transition consistent with the Paris Agreement.
Further analysis can be developed to complement this work for measuring the climate alignment of
financial flows and portfolios comprehensively.
The model applied here will be made publicly available for free and without licensing restrictions,
reducing transaction costs for financial institutions and helping to contribute to a standardization of
approaches. At the same time, the model and analysis here still leave gaps.
Future research in particular should focus on questions of impact of different strategies and ultimately
of financial markets actions more generally on achieving climate goals. Methodological development
is also needed in terms of expanding the scope of sectors (e.g. to real estate, forestry & agriculture).
Of course, such an extension has to go hand in hand in more granular and technology-specific
scenarios that can form the basis of these scenarios. The EU-funded project SENSES can be a step in
the right direction in this regard. Finally, a key missing area of analysis is the question of R&D required
to develop the next generation of zero-carbon technologies for those sectors for which they currently
do not exist, notably those covered in this report on the efficiency side (e.g. aviation, shipping, cement,
steel).
49
VII. REFERENCES
2ii (2015) “2°C Portfolio Assessment Documentation”
2ii (2016) “Trails for Climate Disclosure”
2ii (2017) “Energy Transition Risk Toolbox: Scenarios, Data, Models”
2ii (2017b, forthcoming) “Right Direction, Wrong Equipment: Integrating transition risks into
supervisory stress-tests”
Aviva / ECIU (2015) “The Cost of Inaction: Recognising the Value at Risk from Climate Change”
Bundesamt für Statistik BfS (2017) “Pensionskassenstatistik: Provisorische Werte 2016“
Carbon War Room (2017) “Shipping Efficiency”
CISL (2015) “Unhedgeable Risk: How Climate Change Sentiments Impact Investment”
ESRB (2016) “Too Late, too sudden: Transition to a Low-Carbon Economy”
FSB TCFD (2016) “Recommendations of the Task Force on Climate-related Financial Disclosures”
Finma (2017) “Insurance Market Report 2016”
Greenpeace (2015) “Energy Revolution”
IEA (2016) “World Energy Outlook”
IEA (2017) “Energy Technology Perspectives”
Moody’s (2015) “Approach to Assessing the Credit Impacts of Environmental Risk”
OECD (2017) “Investing in Climate, Investing in Growth”
State Street (2017) “State Street Global Aggregate Bond Index Fund”
SSF (Swiss Sustainable Finance) (2017) “Handbook on Sustainable Finance”
UNFCCC (2015) “Paris Agreement”
50