about 2° investing initiative. · conclusion and potential for action ... settlements, bloomberg,...
TRANSCRIPT

1

2
ABOUT 2° INVESTING INITIATIVE. The 2° Investing Initiative (2°ii) is a not-for-profit think tank working
to align the financial sector with the 2°C climate goal and long-term investing needs. With offices in
Paris, London, Berlin and New York, the Initiative engages a global network of over 100 partners and
members, including 100+ financial institutions, investment consultants, asset managers,
policymakers, research institutions, academics and NGOs. Our work primarily focuses on three pillars
of finance - metrics and tools, investment processes, and financial regulation. Since launching in 2012,
2°ii has advanced the state-of-the-art across both technical and policy issues, notably through:
• Co-initiating the first climate disclosure regulation for institutional investors in France (Art. 173 in 2015), as well as partnering with two European financial supervisory authorities on 2°C scenario analysis and stress-testing of their regulated entities;
• Developing an open-source, IP-rights free 2°C scenario analysis tool for equity and bond investors, applied by over 200 institutional investors to date, and supported by the Swiss government;
• Launching an ISO standardization process around financial institutions’ climate disclosure;
Authors: Jakob Thomä, Michael Hayne, and Vitaliy Komar, with the editorial support of WWF
Cover page: David Blackwell (https://www.flickr.com/photos/mobilestreetlife/4179063482) .
Licensed under Creative Commons
The project benefited from the financial support of WWF-Sweden and the LIFE NGO Operating Grant
The views expressed in this report are the sole responsibility of the authors and do not necessarily
reflect the views of the sponsors.

3
Contents
1. An overview of the global bonds market ...................................................................................... 8
a. Market overview ......................................................................................................................... 8
b. Distinguishing features ............................................................................................................... 9
c. The role of bonds in financing the transition to a low-carbon economy .................................. 11
2. Bond by bond, issuer by issuer .................................................................................................... 13
a. Government bonds .................................................................................................................... 13
b. Asset-backed securities ............................................................................................................. 15
c. Corporate bonds (financial and non-financial) ......................................................................... 16
3. Climate goal alignment and corporate bonds transition risk ..................................................... 18
a. Climate goal alignment of financial portfolios .......................................................................... 18
d. Transition risk in corporate bonds markets .............................................................................. 22
4. Challenges ..................................................................................................................................... 24
5. Conclusion and potential for action ............................................................................................ 25
4
EXECUTIVE SUMMARY
Bond markets – representing the largest asset class in capital markets – are critical in the context of
achieving the Paris Agreement.
The global bond market is roughly $100 trillion globally – roughly three times the size of the EU and
United States GDP combined – and it’s been growing by a factor of ten since the early 1990s. Bond
markets are a critical source of capital for governments, companies, and financial institutions. Their
advantage is lies in the relatively long-term tenor of the debt instrument, as well as the market’s
liquidity, reducing financing costs. For securitized instruments, they help institutional investors be
exposed to household credit (e.g. through mortgage-backed securities) and banks refinance
themselves in the context of providing this credit. In its role as a core pillar of capital markets, bond
markets can also play a key role in financing the transition to a low-carbon economy.
Despite their importance, the discussion of bond markets has largely focused on the green bond
space, which currently represents a marginal share(<0.5%) of outstanding bonds. This paper focuses
on creating a broader understanding of the interface between climate goals and bonds.
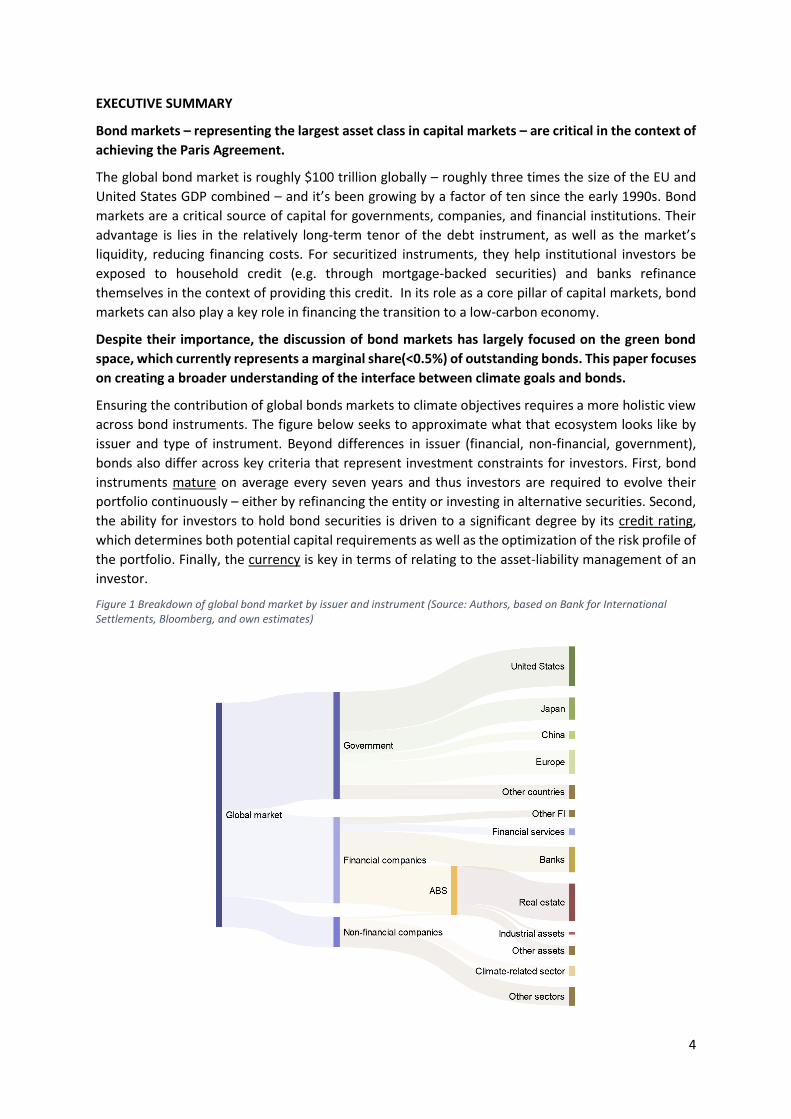
Ensuring the contribution of global bonds markets to climate objectives requires a more holistic view
across bond instruments. The figure below seeks to approximate what that ecosystem looks like by
issuer and type of instrument. Beyond differences in issuer (financial, non-financial, government),
bonds also differ across key criteria that represent investment constraints for investors. First, bond
instruments mature on average every seven years and thus investors are required to evolve their
portfolio continuously – either by refinancing the entity or investing in alternative securities. Second,
the ability for investors to hold bond securities is driven to a significant degree by its credit rating,
which determines both potential capital requirements as well as the optimization of the risk profile of
the portfolio. Finally, the currency is key in terms of relating to the asset-liability management of an
investor.
Figure 1 Breakdown of global bond market by issuer and instrument (Source: Authors, based on Bank for International Settlements, Bloomberg, and own estimates)

5
Different types of bonds serve different functions in the bond ecosystem:
Government. Governments represent the largest issuers of bonds, but also the most ‘diffuse’. To date,
the interface between climate impact and sovereign bonds is still relatively confused. Sovereign debt
issuance is dominated by developed market economies. The 10 largest issuers of governmental debt
(at national level) account for over 90% of the sovereign bond market, with Japan and the United
States by themselves taking up 50% of the share. While markets are liquid, the number of issuers for
all intents and purposes is relatively constrained to developed market economies. From a financing
perspective, despite the size of the bond market, bonds actually make up a relatively small part of the
financing source for most governments, in particular in normal economic conditions. Currently, three
types of approaches exist for climate assessments of sovereign bonds: The carbon footprint of a
country, the climate policy of a country, and the investment footprint of the state.
Asset-backed securities. Asset-backed securities are a critical source of financing for two key high-
emission sectors: real estate and automobile. The asset-backed security (ABS) market is dominated by
real estate, representing more than 95% of the market. Other types of prominent assets in this market
include automobile loans, credit card debt, and student loans (2° Investing Initiative 2018). Asset-
backed securities – given their links with real assets – allows (in theory) for a high degree of
transparency. Moreover, the use of proceeds are clear in this asset class, at least with regards to the
assets being refinanced. Climate assessments for ABS are still limited, but have significant future
potential. The Climate Bonds Initiative has just issued its guidance on real estate green bonds (CBI
2018). While this guidance focuses on green bonds, it can also be adapted to analysing financial
instruments more generally.
Corporate bonds (financial and non-financial). Corporate bonds are the universe of bonds issued by
financial and non-financial companies that are linked to their balance sheet (thus not asset-backed
securities or project bonds). In terms of breakdown, nearly half of all corporate bonds are issued by
financial institutions. For corporate issuers, the challenge is penetrating the sectoral level. Similar for
equity, sectoral estimates can be used as a proxy for overall exposure to economic activities covered
in 2°C scenarios, however they fail to reflect on whether these activities are high-carbon or low-
carbon. A more specific analysis is thus needed, penetrating the sectoral level and providing
information on both the company and asset level, based on asset-level data. The figures below show
the fuel mix of the power and automotive sectors. More detailed forward-looking alignment analysis
is also provided in this report.
Figure 2 The fuel mix of the power sector and the automobile sector of the global corporate bonds market in 2018 (Source: Authors)
Coal capacity Gas capacity
Hydopower Nuclear capacity
Oil capacity Renewable capacity Hybrid + Electric Internal combustion engine

6
Beyond aligning financial markets with climate goals, the transition to a low-carbon economy may
also constitute a financial risk.
As outlined above, bonds may be less exposed to these risks in the short-term, given their maturities
and position in the capital stack. Nevertheless, exposures to these trends exist. The figure below
highlights the share of the corporate bonds portfolios of Swiss pension funds that, according to
analysis by Moody’s, is exposed to sectors with immediate elevated, emerging elevated, or emerging
moderate risk of downgrade. This analysis, it should be noted, extends to a broader suite of
environmental risks, not just limited to climate.
Figure 3 The share of environmental risk sectors in the portfolios of Swiss pension funds
Three key accounting challenges remain in the market
• Use of proceeds information. As outlined above, the concept of use of proceeds is largely
missing in the sovereign bonds space and limited to refinancing in the case of asset-backed
securities (with uncertainties as to what the refinancing proceeds will be invested in in the
future). For corporate bonds, uncertainty remains given the high-level information and the
uncertainty around the concept of ‘ringfencing’.
• ‘Missing sectors’. Asset-level data helps expand the universe of assessable assets. At the same
time, the scope of assessment focuses on the asset activities only and don’t extend to issues
like R&D and energy efficiency. It also currently doesn’t extend to other climate-relevant
sectors like agriculture and forestry, chemicals, and glass.
• Allocating economic activity to financial assets. The question of how to allocate economic
activity to financial assets remains open with two options starting to crystallize – the ‘balance
sheet’ or ‘portfolio-weight’ approach
The report concludes with a discussion of potential actions, including providing / withholding
capital, influencing pricing, and engagement.
It highlights the potential approaches and case studies for each of the three examples. The key
challenge is the limited evidence as to the relative impact of these actions to each other, creating
uncertainty as to the right step for investors to take. Building that evidence-base is crucial as part of a
period of data-driven and evidence-building experimentation in order to mobilize the power of global
bond markets in the service of climate objectives.
0%
10%
20%
30%
40%
50%
% o
f th
e p
ort
folio
ass
ets
un
de
r m
anag
em
en
t at
ris
k o
f d
ow
ngr
ade
by
risk
leve
l
Corporate bonds funds
Immediate elevated risk Emerging elevated risk Emerging moderate risk
7
I. Introduction
Bond markets represent the largest asset class in capital markets.
While fluctuating in value, the size of the global bond market is roughly $100 trillion globally and it’s
been growing by a factor of ten since the early 1990s. By comparison, the global stock market
capitalization in 2015 was $67 trillion.1 Bond markets are a critical source of capital for governments,
companies, and financial institutions. Their advantage is lies in the relatively long-term tenor of the
debt instrument, as well as the market’s liquidity, reducing financing costs. For securitized
instruments, they help institutional investors be exposed to household credit (e.g. through mortgage-
backed securities) and banks refinance themselves in the context of providing this credit.
They are critical in the context of Art. 2.1c, given their prominence in financial assets.
In its role as a core pillar of capital markets, bond markets can also play a key role in financing the
transition to a low-carbon economy. The market size suggests the potential in mobilizing the deep
capital pool of asset owners for transition financing. At the same time, the prominence also suggests
bond markets warrant a particular focus in the context of delivering Art. 2.1c of the Paris Agreement,
specifically to align global financial flows with the Paris Agreement climate goal. Finally, bond markets
may also harbour transition risks related to the decarbonization of the economy.
“…we hope to highlight how fixed income investors can support the broader
responsible investing agenda and, ultimately, help move us towards the common
goal of unlocking the multi-trillion-dollar universe of core fixed income capital to
influence positive change.” Scott Mather, CIO, Core Strategies, PIMCO 2
Despite their importance, the discussion of bond markets has largely focused on the green bond
space, which currently represents a marginal share(<0.5%) of outstanding bonds and will remain a
minor segment of the bond market in the foreseeable future.3
The conversation in equity markets has focused on developing a more holistic portfolio view on
aligning portfolios with climate goals and potential financial risk associated with the transition to a
low-carbon economy. The equivalent conversation in bond markets has taken a different turn.
This paper seeks to expand the discourse by exploring the interface between the transition to a low-
carbon economy and bond markets more broadly.
New data sources, notably asset-level data, and access to broad market data on the global bonds
markets, as well as developments in research on climate accounting issues, have started opening up
this space. The Swiss government pilot project on 2°C scenario analysis, conducted in 2017 with two-
thirds of the Swiss pension funds and insurance market for example – provided the first government-
led initiative on corporate bonds assessment.
AXA IM pioneered the first corporate bonds 2°C scenario analysis reporting in 2016, recognized by the
French government-led Award on Climate-related Disclosures. This new focus provides an opportunity
for a broader integration of climate issues in corporate bonds markets and portfolio management. It
is this focus that is at the heart of the discussion in this paper.
1 WFE statistics http://www.world-exchanges.org/home/index.php/news/world-exchange-news/wfe-full-year-statistics-show-2015-global-equity-trading-volumes-rise-55-as-volatility-boosts-activity 2 “ESG engagement for fixed income investors”, PRI (2018) 3 “… by 2035 in a 2DS, bonds for low-carbon energy investments have the potential to scale to as much as USD 4.7-5.6 trillion in outstanding securities globally and USD 620-720 billion in annual issuance in the markets studied. While these figures may seem large on an absolute basis, they are small (approximately 4%) relative to the scale of issuance in debt securities markets generally.” (OECD 2016).
8
1. An overview of the global bonds market
a. Market overview
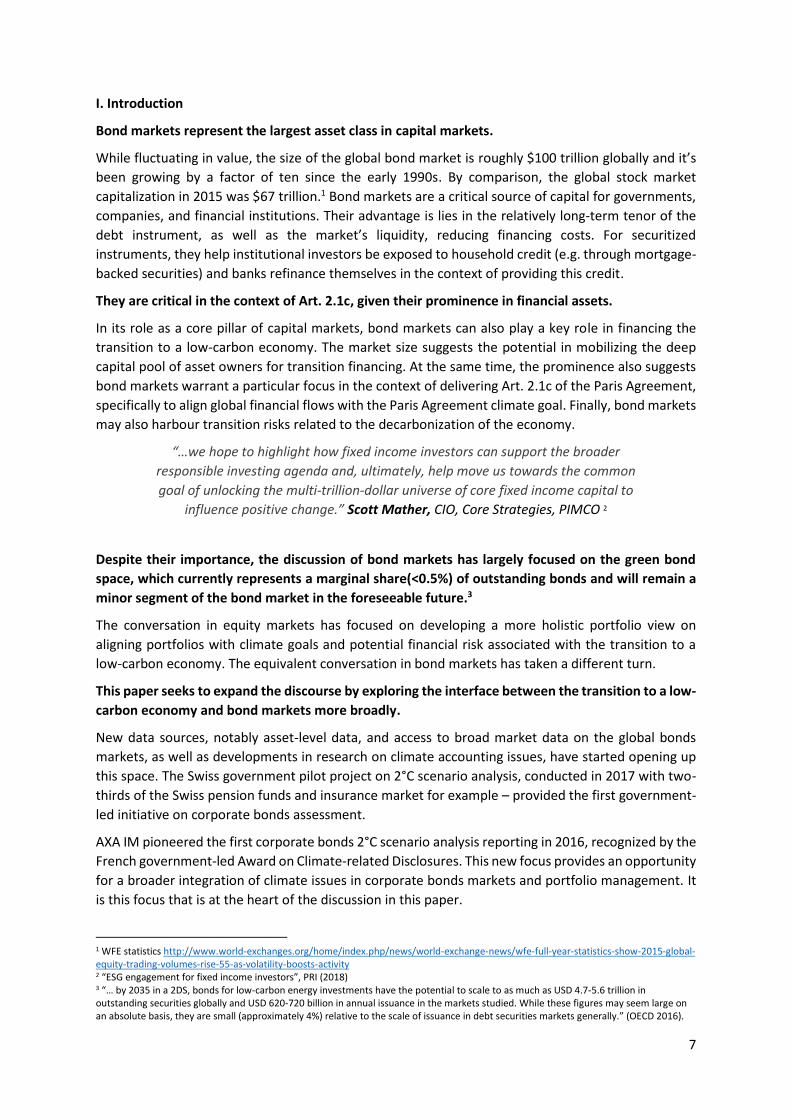
What can be called the global bond market is in fact a an ecosystem of fundamentally different
instruments, serving very different functions.
This ecosystem is a function of both the range of issuers operating in bond markets (government,
state-owned enterprises, non-financial companies, financial institutions) and differences in the
contract structure underlying bonds (e.g. general purpose bonds, covered bonds, asset-backed
securities), as well as their use of proceeds.
This implies by extension that there isn’t necessarily one global narrative or thread tying all of these
instruments together. Indeed, in some respect each of these instruments should be considered their
own asset class, each playing a distinct role on the question of climate and bonds markets.
The figure below seeks to approximate what that ecosystem looks like by issuer and type of
instrument, based on a combination of data from Bloomberg, Bank for International Settlements,
and analysis of the authors.
The next pages will discuss each of these instruments in further detail. The figure shows that the bond
market is dominated by government and financial companies issuance, with only a small share (~20%)
related to non-financial issuers.
Figure 4 Breakdown of global bond market by issuer and instrument (Source: Authors, based on Bank for International Settlements, Bloomberg, and own estimates)

9
b. Distinguishing features
A discussion of bonds needs to highlight a few characteristics and constraints that investors face
when investing in these instruments.
For bond investors, there are a number of key constraints
when investing in different instruments. First, bond
instruments mature on average every seven years and
thus investors are required to evolve their portfolio
continuously – either by refinancing the entity or investing
in alternative securities. Second, the ability for investors to
hold bond securities is driven to a significant degree by its
credit rating, which determines both potential capital
requirements as well as the optimization of the risk profile
of the portfolio. Finally, the currency is key in terms of
relating to the asset-liability management of an investor.
Each of these aspects will be discussed in turn.
• Maturity. Debt instruments are based on contractual time frames. Bond portfolios thus by
design face a natural wind-down of asset exposures that require the portfolio manager to
purchase new bonds. This stands in contrast to listed equity portfolios that hypothetically
could be held until eternity. Depending on the portfolio and the maturity of the instruments,
the natural wind-down of exposures differs. An illustrative analysis of a corporate bonds
portfolio suggests that exposures may drop by around 50% to gas production for example
within the span of just 10 years, simply by not ‘refinancing’ the bonds that mature naturally.
Maturity of exposures also has implications for the discussion of risk and the financing
footprint.
Figure 5 The exposure of an illustrative portfolio to gas production assuming constant and changing portfolio weights based on a typical maturity profile (2° Investing Initiative 2018)
0
1,000,000,000
2,000,000,000
3,000,000,000
4,000,000,000
5,000,000,000
6,000,000,000
7,000,000,000
2015 2017 2019 2021 2023 2025
An
nu
al g
as p
rod
uct
ion
(m
3/y
r)
Constant Ptf weight approach Ptf weight approach with maturing bonds

10
• Currency. Each debt instrument is linked to a specific currency. This makes the value of the
repayment directly linked to the value of the currency. If a European pension fund invests in
a US-Dollar denominated bond in a context where the US-Dollar loses 20% of value, the value
of the repayment (in Euro terms) drops as well.4 In practice, upwards of 90% of outstanding
debt is issued in US-Dollars, Euro, Pounds, Yen, or Canadian Dollars. Chinese-Reminbi
denominated debt meanwhile is quickly gaining market share. The implication of this however
is that certain low-carbon or high-carbon debt exposures may be associated with currencies
that do not fit into the investment mandate of the investor and / or the liability profile.
• Use of proceeds. In bond markets, various bond instruments may be associated with specific
use of proceeds. Analysis of Bloomberg data in this respect suggests that a little over 50% of
bonds issued by financial institutions and companies5 were tagged with use cases, with the
largest shares related to ‘refinancing’, ‘investment’, and ‘financial’ (e.g. stock buyback) uses.
One specific use of proceed that has grown in terms of labelling is the ‘green bond’ market.
While they face specific use cases, they are not strictly speaking ‘ring-fenced’ that is to say the
bond issuance is associated with a certain objective that is however not legally enforceable,
nor from an accounting perspective technically constrained. Bonds tagged as being issued for
‘refinancing’ thus provide capital to a company the same way a general purpose bond would.
A small sub-section of bonds however will actually be technically ring-fenced, where the
proceeds are ‘fenced off’ from the rest of the balance sheet. In the case of ‘green bonds’ for
example, this figure is about 5%.6
• Ratings. One final key aspect when thinking about the bond market is the prominence of
ratings. Bond ratings are the lighthouse in terms of orienting capital flows in bond markets.
They are used as a supervisory tool in capital reserve requirements, the constrain the universe
of assets in which a bond investor can invest (investment grade vs. non-investment grade) and
the cost of capital a company faces when issuing bonds.
4 Obviously, financial institutions can seek to hedge some of this risk through derivative markets or even through the fact that the value of debt in other currencies goes up. 5 Excluding asset-backed securities. 6 2° Investing Initiative (2018) “Shooting to the Moon in a Hot Air Balloon: Measuring how green bonds contribute to scaling up green investment”
Box 1: What does ringfencing actually mean in practice?
One challenge with proper ringfencing is the extent to which it requires companies to ‘trap’ cash
in certain structures, thus reducing flexibility. Depending on the guarantees of the bond, project
bonds may have a higher risk and thus increase the cost of capital for issuers relative to general
purpose bonds that sit on the balance sheet of a company. This conflict between ‘ringfencing’ may
be a challenge. In some cases, bonds ‘virtually’ ringfence use of proceeds in terms of targeted use,
while still using the full corporate balance sheet. This is described as virtual since there is no legal
ringfencing. This is the case even if the volume of proceeds is committed to be equivalent to the
volume of investment in green on the other side of the balance sheet. By extension, ‘virtual
ringfencing’ of bonds, where there is merely a commitment to invest the proceeds, even as the
bond finances the whole entity, exposes the buyer of the bond to the risks of the entire balance
sheet of the issuer. Any benefits with regard to costs of capital thus accrue to the company as a
whole.

11
c. The role of bonds in financing the transition to a low-carbon economy
Bonds can play a role both in primary and secondary financing in the context of the transition to a
low-carbon economy.
Understanding the role of bonds in financing the transition to a low-carbon economy requires an
understanding of the use of proceeds associated with bonds financing. For asset-backed securities,
bonds represent a pure refinancing instrument (intuitively, since the transaction needs to have been
concluded to count as collateral). On the flipside, government-financing in bonds market is almost
exclusively a debt-raising mechanism designed to cover running deficits in government budgets. Green
bonds issued by municipalities and governments represent notable exceptions to this rule.
For corporate bonds, the use of proceeds picture is somewhat more nuanced. The figure below
highlights the different proceeds to which bonds are earmarked, almost half of which are simply
tagged as ‘general’. It should be noted that around a quarter of bond financing is focused on financing
or financial use of proceeds. Use of proceeds related to acquisitions arguably have a different footprint
than investment because they primarily focus on shifting ownership structure, rather than adding to
the capital stock. In turn, the data also highlights the prominent role of refinancing in bond markets.
The challenge here is that roughly 50% are labelled as general financing without specific information
associated with these instruments.
Figure 6 Use of proceeds of bonds, excluding sovereign and asset-backed securities (Source: Authors, based on Bloomberg data on corporate bonds)
The impact of bonds can articulate itself on both primary and secondary markets:
• Role in primary financing. When discussing the role of bond financing in the transition
towards climate stabilization, it is critical to disentangle primary and secondary financing. The
limited analyses that seek to map financing needs related to a 2°C scenario (“financing
roadmaps”) suggest bond markets only play a limited, albeit increasing, role for power
investment for example. Thus, Accenture estimates that bond financing only represents
around 5% of the financing source of power investment by 2020, looking at the European
market (Accenture 2012). The OECD, taking a global view, and being the most optimistic in the
literature, still sees that number peak at around 20% by 2035, with research by BNEF / Ceres
for the US power market at around 10-15%. Analysis by the International Energy Agency in
the World Investment Report (2016) – again with a global scope - similarly finds only a limited
role for bonds, although the analysis is not forward-looking. Another factor here is that bond
investors are generally at the bottom of the capital stack,
General
Refinance
Investment
Green bond
Financing (Acquisition, LBO)
Financial (Stock buyback, capital, pension funds,etc.)

12
Figure 7 Breakdown of power financing by financing roadmap (2° Investing Initiative 2017)
• Role in secondary financing. At the same time, bond markets can play a key role in the context
of refinancing. Asset-backed securities related to automobile loans for example represent a
significant share of the securitization market. Financial institutions, responsible for around
50% of the financing source for power investments through their lending activities, tap into
bond markets as a primary source of refinancing. Companies involved in significant
infrastructure investments may do the same. On the high-carbon side, oil and gas companies
have also increasingly tapped into bond markets, which increases the exposure in bond
markets to these companies.
Beyond the role of bonds in contributing to the transition, they also interface with climate change
from a risk perspective.
In this perspective, bonds may face transition risks. As a rule however, given the position of bonds at
the bottom of the capital stack, they are less exposed than equity instruments to these types of risks.
Moreover, bonds have a fixed maturity, which is frequently more short-term than for equity,
suggesting that the cash flow underpinning current securities is less long-term than for equity
investors.7 This point may be counter-intuitive. To be clear, it doesn’t relate to the actual trading
frequency of the instrument, but rather the maturity of the cash flows that represent the store of
value underpinning the asset price.
One relevant risk to highlight however is not just the risk of default, but potentially the risk of a rating
downgrades, which will impact credit spreads and to which degree the downgraded bond is accepted
as collateral in other financing transactions, notably in relation with central banks.
7 See for example 2° Investing Initiative (2017) “All Swans are black in the dark”
11%17%
25% 21% 34% 22%3%
13%
13% 22%6%
7%30%
29%
62% 57%
5% 20%
54%38%
55%52%
0%
10%
20%
30%
40%
50%
60%
70%
80%
90%
100%
Balance Sheet Equity (not financed directly) Total bonds Non-Balance Sheet Equity Total Loans
13
2. Bond by bond, issuer by issuer
a. Government bonds
Governmental issuers play the most prominent role in bonds markets, accounting for nearly 50% of
all outstanding bonds.
They are represented both directly through the issuance of sovereign debt, as well as debt issued by
federal states, municipalities, and cities, as well as indirectly through their ownership of entities that
issue their own bonds (e.g. state-owned enterprises, banks, agencies), although in that case the
instruments may be classified as a financial or non-financial company, depending on classification
system. Governmental issuers in turn may operate at federal, state, or even municipal level.
To date, the interface between climate impact and sovereign bonds is still relatively confused.
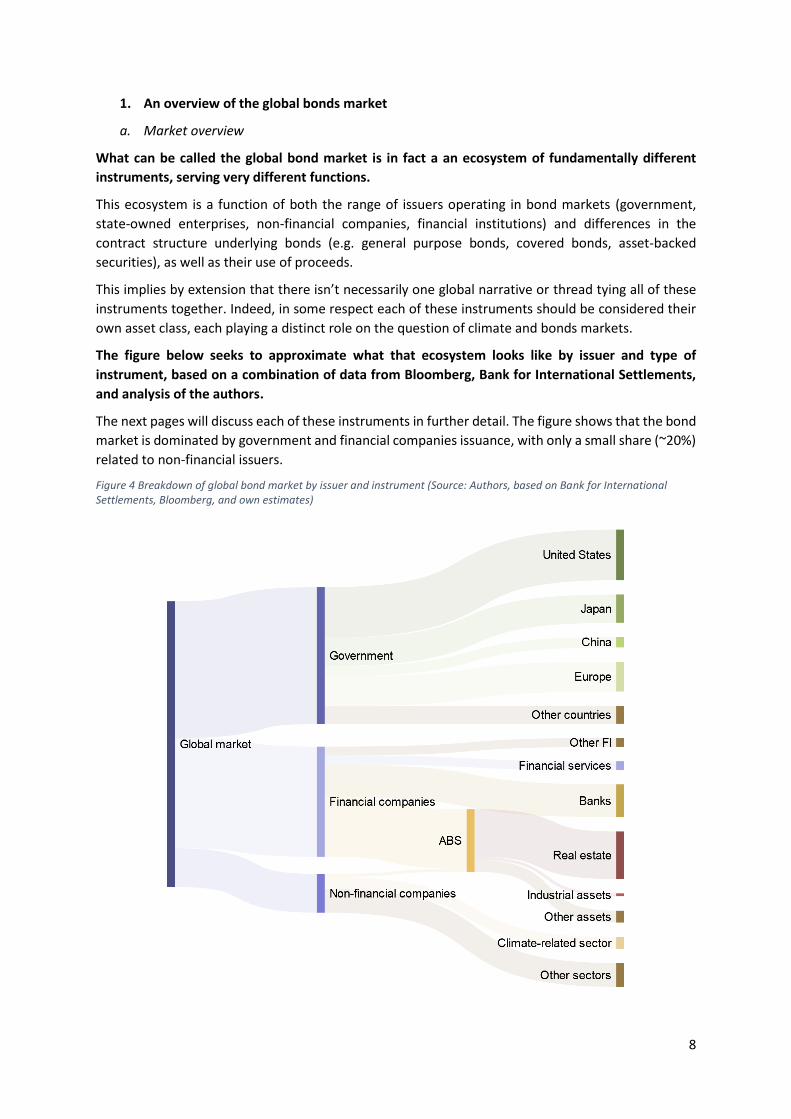
Sovereign debt issuance is dominated by developed market economies. The 10 largest issuers of
governmental debt (at national level) account for over 90% of the sovereign bond market, with Japan
and the United States by themselves taking up 50% of the share (see Fig. below). While markets are
liquid, the number of issuers for all intents and purposes is relatively constrained to developed market
economies.
Figure 8 Breakdown of governmental issuer by country (Source: Authors, based on Bloomberg)
From a financing perspective, despite the size of the bond market, bonds actually make up a
relatively small part of the financing source for most governments, in particular in normal economic
conditions.
Government debt may be in the order of its country’s total GDP, and in the case of Japan over 200%
of GDP, but the annual deficit – that is the part of the government spending that needs to be filled
through bond issuance – tends to hover at less than 3%. Of course, the higher the deficit, the larger
the dependence on stock markets. Indeed, this 3% debt limit is part of the Maastricht Treaty for EU
member countries, admittedly a constraint not always respected. On the flipside, the need to
‘refinance’ the bonds over time creates a significant susceptibility of governments to bond markets.
In terms of climate assessments, as issuance of government bonds is largely constrained to refinancing
past capital provision. Without clear accounting as to which capital provisions are still being refinanced
by new bonds issuance, the explanatory power of assessment frameworks is limited.
$0
$2,000
$4,000
$6,000
$8,000
$10,000
$12,000
$14,000
$16,000
$18,000
U
nit
ed
Sta
tes
J
apan
C
hin
a
U
nit
ed
Kin
gdo
m
I
taly
F
ran
ce
Ge
rman
y
C
anad
a
S
pai
n
Au
stra
lia
Oth
er
In $
mill
ion

14
Three types of approaches in the literature or in
practice can be identified to date:
Carbon footprint of the country: This approach
simply considers a sovereign bond an investment
in the country and thus takes the country’s carbon
footprint (including or excluding trade balance) or
carbon intensity / GDP as a climate metric. This
choice conflates the government with the country
itself, thus double-counting the responsibility.
This ignores the actual climate policy
underpinning the government’s balance sheet and
its role in international and national climate
diplomacy. The figure on the right provides an
example for the application of this approach on
the Blackrock Global Allocation Fund.
Climate policy of the state: This approach ignores
the balance sheet of the country and seeks to
discriminate countries based on their climate
policies. It thus suggests that the footprint of a
bond is expressed in the policy framework it
endorses and that this aspect of a governmental
issuer is the most important. Such a framework
obviously requires a qualitative assessment
system and ranking of different governmental
climate policies, such as those developed by the
Germanwatch / NewClimate Institute (see Fig. on
right).8
Investment footprint of the state. The third
approach identified in the literature takes the
original principle of Art. 2.1c and seeks to focus
on the actual ‘use-of-proceeds’ of the sovereign
bond as it is reflected in the capital allocation
decisions of the issuer. Undoubtedly, this is
technically the most complex approach, since it
requires an analysis of a governments balance
sheet, a breakdown of its public spending and
the identification of ‘investments’ among those
expenses. It has previously been applied by CAF
and Ecofys (Dupré et al. 2013).
While the overall complexity may raise questions as to its general applicability, certain core indicators
may be isolated that play a prominent role. Thus, the government’s spending for example is a key
potential source of fundamental R&D for breakthrough technology. Sovereign bonds analysis could
compare governmental R&D expenditure for example with emissions reduction needs.9
8 Add reference end preferably link to a website for easy access to explore further. 9 Direct R&D scenarios unfortunately are no longer produced by the International Energy Agency.
01020304050607080
$0 $5,000 $10,000 $15,000 $20,000
Clim
ate
po
licy
sco
re (
0-1
00
)
Outstanding issuance (in $ billion)
Figure 10 Climate policy score of a country and outstanding issuance (Source: Authors
based on CCCPi and BIS data)
Figure 9 Country portfolio weights and portfolio carbon intensity (in %) for the BlackRock Global Allocation Fund
Figure 11 France 2013 government R&D spending by sector versus CO2 reduction needs in IEA 2D Scenario (Source: Beyond Ratings 2016)

15
b. Asset-backed securities
Asset-backed securities are a critical source of financing for two key high-emission sectors: real
estate and automobile.
The asset-backed security (ABS) market is dominated by real estate, representing more than 95% of
the market. The real estate sector in turn plays a prominent role in GHG emissions accounting,
representing around 6-7% of direct annual GHG emissions and another 12% when considering indirect
CO2 emissions. Other types of prominent assets in this market include automobile loans, credit card
debt, and student loans (2° Investing Initiative 2018).
Given both the relative transparency of the instruments underlying asset back securities, as well as
the known use of proceeds, ABS’s can lend themselves in two ways:
• The contract structure allows for a high degree of transparency on what is being refinanced.
Mortgage-backed securities for example provide relatively detailed information at zip code /
post code level on the underlying mortgages. Similar detail is available for automobile loans
for example. With new data techniques like document scrapping, information on each
individual building or car behind each mortgage can be collected for each instrument. The
challenge here is that while the information on the mortgage may be available, related
information on the climate impact may be missing. One potential area of further exploration
is using post code / zip code information to assess the public transport access and related
emissions profile of homeowners, as well as using new big data platforms like Geophy to
match buildings with their GHG emissions data.
• The use of proceeds are known for this asset class, given that here the asset is linked. As will
be discussed later, this provides a key upside relative to corporate bonds and sovereign bonds
Climate assessments for ABS are still limited, but have significant future potential.
The Climate Bonds Initiative has just issued its guidance on real estate green bonds (CBI 2018). While
this guidance focuses on green bonds, it can also be adapted to analysing financial instruments more
generally. For example, for automobile ABS issuance, an analysis of underlying instruments using e.g.
the breakdown of electric / hybrid vehicles or fuel efficiency metrics can be explored.
Of course, these types of assessments may also over time become relevant from a risk perspective, in
line with a growing body of evidence around the ‘out-performance’ of energy-efficient buildings (see
Figure below).
Figure 12 The financial out-performance of energy efficient buildings in the United States across indicators (EEBI)
0%
5%
10%
15%
20%
25%
30%
35%
40%
Rental rates Resale value Occupancy rate Net operatingincome
Productivity gain
% c
han
ge in
pe
rfo
rman
ce
Performance change for energy-efficient buildings

16
c. Corporate bonds (financial and non-financial)
The corporate bonds universe is arguably the one most directly linked to its equity counterpart, but
also one not always clearly defined.
Corporate bonds are the universe of bonds issued by financial and non-financial companies that are
linked to their balance sheet (thus not asset-backed securities or project bonds). Within this universe,
a distinction is frequently made between financial institutions as issuers and non-financial institutions,
given the prevalence of the former in overall issuance and the distinction in terms of use of proceeds.
For financial institutions, the bond markets are primarily a source of refinancing, whereas corporate
bond issues by non-financial institutions serves a much broader array of needs.
In terms of breakdown, nearly half of all corporate bonds are issued by financial institutions.
The Figure below provides a breakdown of the weight of different sectors in the corporate bonds
universe (excluding governmental issuers and asset-backed securities, which may also be issued by
financial institutions). It reflects the important role of financial institutions, which of course – as
outlined above – play a critical role in providing the capital required to finance the transition to a low-
carbon economy. At the same time, the breakdown also demonstrates the outsized role of high-
carbon sectors in the bonds market, with industrial, utilities, and the energy sector jointly accounting
for nearly 25% of corporate bonds.
Figure 13 Breakdown of total bonds issuance 2009-2018 by sector (excluding financials) in $ billions (Source: Authors, based on Bloomberg)
For financial issuers, the climate impact considerations are largely a function of their loan portfolios,
where transparency is limited to date.
Currently only a limited number of financial institutions are conducting climate assessments on their
loan books and an even smaller number have started reporting related indicators. Data on Bloomberg
(based on publicly available data from loan factsheets) suggests for example that around 1% of loans
currently go to ‘renewable energy’ and 4% to utilities more generally. Relevant to note however that
about a third of loans in the data are unidentified. Given the lack of information on banks’ corporate
loanbooks, this analysis is tricky for investors to execute. Financial supervisors however – notably
those in Europe that collect loan level information – may be in a better position to assess the dynamic.
1,945
2,817
1,512
2,5021,408
3,013
1,061
2,242
Communications Consumer Discretionary Consumer Staples
Energy Health Care Industrials
Technology Utilities

17
For corporate issuers, the challenge is penetrating the sectoral level.
Similar for equity, sectoral estimates can be used as a proxy for overall exposure to economic activities
covered in 2°C scenarios, however they fail to reflect on whether these activities are high-carbon or
low-carbon. A more specific analysis is thus needed, penetrating the sectoral level and providing
information on both the company and asset level.
The challenge in this regard is that traditionally climate-related information of all issuers of corporate
bonds has largely been a black box. Corporate climate reporting has largely focused on listed
companies, many if not all of which issue bonds. However, there is a large universe of companies that
issue bonds, but are not listed. Moreover, the reporting that does exist – in terms of absolute carbon
footprints – faces a number of data challenges, given the lack of integration of Scope 3 GHG emissions
and the failure to link this information to economic activity (Hoepner 2016).
Asset-level data can act as one solution to this problem.
Asset-level data – that is data on physical production assets sourced from business intelligence
databases and publicly available databases – collected for key high-carbon sectors can help to
overcome this challenge.10 Asset-level data distinguishes itself from corporate reporting insofar as the
data point is the actual economic asset (the power plant, the oil field) rather than the company as a
whole. They are collected by a range of different data providers across key climate-related sectors
using a range of sources (governmental filings, press releases) and techniques (surveys, web-scrapping
techniques).
This data, given its near global coverage of high-carbon sectors, addresses the concerns of the ‘large
cap’ listed bias intrinsic to corporate reporting frameworks. It also directly links to economic activity,
allowing for a meaningful link to climate scenarios (Weber et al. 2017). While one solution, it should
not be treated as a panacea. Asset-level data addresses one part of the climate challenge, but of
course fails to account for issues like R&D, and a large part of efficiency opportunities related to
operational GHG emissions.
The next section will apply the asset-level data 2°C scenario approach pioneered by the 2° Investing
Initiative in the context of the Sustainable Energy Investing metrics project (financed by the EU H2020
programme) to the corporate bonds universe.
10 Visit https://assetleveldata.org/ to learn more.

18
3. Climate goal alignment and corporate bonds transition risk
a. Climate goal alignment of financial portfolios
The question of portfolio alignment with the 2°C or well-below 2°C goal can be seen from different
perspectives.
In the context of listed equity markets, portfolio alignment to date has largely been considered from
the perspective of the absolute, relative, or forward-looking exposures to high-carbon and low-carbon
technologies and assets.
• Absolute exposure for example reflects on the absolute weight of the portfolio or the market
vis-à-vis one or the other technology. This intensity can then be taken as the starting point for
what the future intensity should look like under a 2°C transition;
• Relative exposure compares the relative weights of different technologies in the portfolio to
each other and how that weight in turn is meant to evolve over time. Generally, this approach
is only intuitively applicable for technologies within a sector and where there is meaningful
low-carbon alternatives (e.g. power, automobile). For fossil fuels for example, the ratio of oil
& gas is not necessarily a powerful indicator of 2°C alignment, even if that ratio is set to change
over time in the scenarios;
• Forward-looking exposure relates to the rate of change of the weights over time and the
extent to which this rate of change (e.g. retirement of coal, build-out of renewables) is
consistent with the 2°C transition.
The analysis of corporate bonds provided here uses the portfolio-weight allocation rules
recommended by Thomä et al. (2018) for corporate credit, comparing fuel mix intensities.
For the automobile and power sector, high-carbon technologies continue to dominate the market.
In the power sector, over 50% of the installed capacity is coal- or gas-fired power. Renewables in turn
only make up around 13% of installed power capacity. For the automobile sector, the low-carbon
alternatives still have less than 5% market share. Of course, in some ways, it is not the past, but the
future counts, specifically the alignment of the investment with the 2°C transition.
Figure 14: The fuel mix of the power sector and the automobile sector of the global corporate bonds market in 2018
(Source: Authors)
Coal capacity Gas capacity
Hydopower Nuclear capacity
Oil capacity Renewable capacity Hybrid + Electric Internal combustion engine

19
The subsequent discussion will identify the investment trends across the power, automobile, and
oil & gas sector, relative to the IEA scenarios.
The analysis is based on a mapping of outstanding corporate bonds and the aggregate investment
profile of their issuers, weighted by the size of the outstanding bonds.11 The forward-looking
production capacity / production profile is then compared to the IEA scenario range from below 2°C
to above 6°C in order to identify the alignment of the market with climate goals. The key modelling
assumption here is the proportionate share logic, which allocates the scenario to the global bond
market based on the market share in the global economy. Thus, a bond issuer that owns 1% of power
assets has to build out 1% of required renewable power capacity additions. A 5 year time horizon
reflecting investment horizons was chosen for this model.
In the power sector, corporate investment is not enough to reach the 2°C goal, and is in fact on an
above 6°C trajectory.
The figure below is based on asset-level data sourced by GlobalData and shows the trajectory of the
renewable power and coal-fired power capacity growth of the current issuers of corporate bonds in
aggregate. It shows that corporate bond issuers investment profile is currently significantly misaligned
with the IEA Sustainable Development Scenario.12 This implies that they are both less high-carbon and
less low-carbon in terms of the investment profile. The difference is likely driven by the ‘bias’ in bonds
markets in favour of developed markets where generally power markets require less investment.
Figure 15 The global bond markets’ capacity growth profile in renewable power and coal power capacity additions relative
to IEA scenarios (Source: Authors)
In the automobile sector, bond markets outperform the real economy.
Corporate bond issuers invest more in electric vehicles and less in internal combustion engines than
the corporate economy as a whole. At the same time, overall investment levels still lag significantly
that which is required to meet the 2°C goal as defined in the 450scenario from the International
Energy Agency (a scenario that is only associated with a 50% probability).
11 The analysis here thus relies on the ‘portfolio weight’ approach to allocate economic activity to financial assets. An alternative approach sometimes used is the ‘balance sheet approach’, which however can create biases in the analysis of bond portfolios. 12 It thus excludes for examples assets owned by households.
0%
20%
40%
60%
80%
100%
120%
140%
160%
180%
2018 2019 2020 2021 2022 2023
Cap
acit
y gr
ow
th (
fro
m 2
01
8)
Renewable power capacity
SDS NPSRTS
CPS Bond Market
-1%
1%
3%
5%
7%
9%
2018 2019 2020 2021 2022 2023
Cap
acit
y gr
ow
th (
fro
m 2
01
8)
Coal power capacity
CPS NPSRTS
SDS Bond Market

20
Despite this gap, there are two important things to highlight. The market is dramatically shifting.
Between May 2016 and January 2018, the estimates for electric vehicle production in 2020 have
jumped from around 650,000 to nearly 1.8 million (source). To put this latter number into context,
this estimate would have been consistent with the IEA 2015 2°C scenario for electric vehicle
production. Secondly, while in relative terms the gap is significant, the absolute shift required for
example for electric vehicles is only about 1% of global sales in the short-term, a relatively ‘benign’
shift in the overall automobile car market. Of course, this number increases to 40-50% and more in
the medium- to long-term.
Figure 16 The global bond markets’ capacity growth profile in electric vehicle and internal combustion engine (ICE)
production relative to IEA scenarios (Source: Authors)
Fossil fuels show a much more positive picture, suggesting that price signals are being integrated
by companies. At the same time, the results are largely driven by investment cycles and thus may
still shift rapidly if oil and gas prices creep upwards.
The figures below show the estimated evolution of production capacity for oil production in the global
corporate bonds market. The results suggest that while there is some volatility, the trends are
approaching the IEA 2°C scenario by 2022. This is largely driven by a shift in capital expenditure
strategy by oil and gas companies following the shift in prices. A similar analysis conducted in 2015
would have shown explosive growth following the investment boom of the early 2010s. By extension,
the figure may still change moving forward in response to changes in relative prices – which in turn
will also have impact on climate goals. Of course, these results are a function of the relatively limited
ambition of the 2D scenario for oil relative to other scenarios, notably those by Greenpeace.
0%
50%
100%
150%
200%
250%
300%
350%
400%
450%
2018 2019 2020 2021 2022 2023
Pro
du
ctio
n g
row
th (
fro
m 2
01
8)
Electric vehicle production
SDS NPSRTS
CPS Bond Market
-8%
-5%
-2%
1%
4%
7%
10%
2018 2019 2020 2021 2022 2023
Pro
ud
ctio
n g
row
th (
fro
m 2
01
8)
ICE vehicle production
CPS NPSRTS
SDS Bond Market

21
Fig. 17: The global bond markets’ capacity growth profile in oil production relative to IEA scenarios (Source: Authors)
Crucially, the aggregate results presented here hide the universe of choices that institutional
investors can make in their corporate bonds portfolios.
Corporate bond funds exhibit significant variations in their exposure both to transition sectors as well
as the underlying high-carbon and low-carbon technologies deployed in these sectors. In terms of
corporate bonds issuers, predictably, there is also a wide divergence in strategy. Interestingly, this
divergence appears to be polarized. In a sample of 150 corporate bond issuers with at least 1 GW of
installed capacity, around 50% of issuers either invest 0% in renewable power (with respect to their
total power investment) or 100% in renewable power – with the other half in between these two
poles. The results suggest both at mandate design level, and in the allocation of capital to different
issuers in the context of daily portfolio management, significant lee-way.
Figure 18 Breakdown of type of capacity additions of the top 150 corporate debt networks (issuers) by technology in the power sector (Green = renewables; Brown = coal, oil, gas; other technologies = nuclear, hydro) (Source: Authors)
-3%
-1%
1%
3%
5%
7%
9%
2018 2019 2020 2021 2022 2023Cap
acit
y gr
ow
th (
fro
m 2
01
8)
Oil production
CPS NPSRTS SDS Bond Market
0%
10%
20%
30%
40%
50%
60%
70%
80%
90%
100%
Per
cen
t o
f ca
pac
ity
add
tio
ns
Top 150 Corporate Debt Networks
Green Brown Other Technologies
131 GW35 GW

22
d. Transition risk in corporate bonds markets
Beyond aligning financial markets with climate goals, the transition to a low-carbon economy may
also constitute a financial risk.
As outlined above, bonds may be less exposed to these risks in the short-term, given their maturities
and position in the capital stack. Nevertheless, exposures to these trends exist. The figure below
highlights the share of the corporate bonds portfolios of Swiss pension funds that, according to
analysis by Moody’s, is exposed to sectors with immediate elevated, emerging elevated, or emerging
moderate risk of downgrade. This analysis, it should be noted, extends to a broader suite of
environmental risks, not just limited to climate.
Figure 19 The share of environmental risk sectors in the portfolios of Swiss pension funds
Transition risk assessment is obviously equally relevant at sub-sector / security level.
One approach to transition risk analysis is identifying the exposures to high-cost or stranded ‘oil’ under
a 2°C scenario. The Figure below shows – for 35 US insurance companies – the percent of their
portfolio exposed to oil & gas production and the percent of the associated oil production ‘stranded’
under a 2°C scenario. Again, it highlights the significant distribution of exposures across insurance
companies bond holdings.
Figure 20 Share of portfolio in oil and gas production and percent ‘stranded’ under a 2°C scenario of 35 US insurance companies (Source: Authors)
0%
10%
20%
30%
40%
50%
% o
f th
e p
ort
folio
ass
ets
un
de
r m
anag
em
en
t at
ris
k o
f d
ow
ngr
ade
by
risk
leve
l
Corporate bonds funds
Immediate elevated risk Emerging elevated risk Emerging moderate risk
0%
5%
10%
15%
20%
25%
30%
35%
0.0% 2.0% 4.0% 6.0% 8.0%
Frac
tio
n o
f O
il 'S
tran
de
d' u
nd
er
2°C
sc
en
ario
Fraction of total portfolio in Oil & Gas production

23
As highlighted above, the question of time horizon is key.
In the short-term, exposure to environmental risks and transition risks will be less material for
instruments with short-term maturities. The figure below highlights the exposure for 35 US insurance
companies. The figure shows that while some insurance companies have significant exposures, they
may mature in the short-term and thus be less exposed to long-term transition risk trends whereas
portfolios with lower exposures, but long-term maturities may be more exposed.
Figure 21 The share of US insurance companies (n=35) exposed to emerging / elevated risk sectors and the percent of maturities in these sectors beyond 2025.
Transition risks will also evolve over time.
Transition risks may increase or decrease as a function of issuance. Tracking this over time may be a
key tool to monitor the health of the industry. Bond issuance for the utility sector for example has
increased significantly since 2015. This could be a function of higher investment levels (perhaps in the
direction of renewables) or offsetting lower revenues. While the energy bond issuance annually has
staid flat in turn, for individual companies like ExxonMobil, a significant spike can be seen in the past
years.
Figure 22 Annual bond issuance by sector (left-hand side) and Exxon annual bond issuance (right-hand side) (Source: Authors, based on Bloomberg)
0%
10%
20%
30%
40%
50%
60%
70%
80%
0% 5% 10% 15% 20% 25% 30% 35%
Frac
tio
n w
ith
mat
uri
ty >
20
25
Fraction of Corporate AUM in Emerging/Elevated Risk Sectors
$0
$2
$4
$6
$8
$10
$12
$14
197519801985199019952000200520102015
Am
ou
nt
Issu
ed (
bill
ion
USD
)
Year
Exxon annual bond issuance
$0
$200
$400
$600
2009 2011 2013 2015 2017
An
nu
al I
ssu
ance
(B
illio
n U
SD)
YearEnergy CommunicationsConsumer Staples Consumer DiscretionaryIndustrials TechnologyMaterials Health CareUtilities

24
4. Challenges
Three key challenges exist in graduating our understanding of bond markets.
Use of proceeds information. As outlined above, the concept of use of proceeds is largely missing in
the sovereign bonds space and limited to refinancing in the case of asset-backed securities (with
uncertainties as to what the refinancing proceeds will be invested in in the future). For corporate
bonds, the issue with use of proceeds is two-fold. First, technically use of proceed bonds have knock-
on effects on the ‘general purpose bonds’. For example, if a utility issues a bond to finance renewable
power investment, technically the associated investment should be excluded from the assessment of
the other bonds that the utility issues. This is obviously difficult to track however. Secondly, as outlined
above, use of proceed claims are somewhat artificial since corporate bonds in the over-whelming
majority of cases are still balance-sheet financing.
‘Missing sectors’. Asset-level data helps expand the
universe of assessable assets from green bonds (<0.5%
of the market, according to the Climate Bonds Initiative)
to somewhere closer to 5-10% of the market, based on
an analysis of the Bloomberg universe and the portfolios
for Swiss pension funds and insurance companies. At the
same time, the scope of assessment focuses on the asset
activities only and don’t extend to issues like R&D and
energy efficiency. It also currently doesn’t extend to
other climate-relevant sectors like agriculture and
forestry, chemicals, and glass.
Allocating economic activity to financial assets. The
question of how to allocate economic activity to financial
assets bedevils analysis in both equity and credit
portfolios. In equity portfolios, one neat solution is the
allocation of ownership based on ownership shares. For
corporate bonds portfolios, where the concept of
ownership share does not exist intuitively and may be
subject to price biases, this strategy is not directly
applicable. For example, allocating economic activity over
all outstanding debt in the case of oil & gas companies
would penalize those debt holders of companies with
relatively low levels of debt, even though such exposure
may theoretically be less risky, given lower leverage. On
the other hand, using a broader metric like enterprise
value introduces price biases again.
An alternative approach – applied for example in fund ratings13 – uses the portfolio weight of
instruments to allocate economic activity. This approach, while not speaking to absolute exposures,
can help allocate relative exposures. As an example, Erlandsson (2017) introduced the ECOBAR model
for scoring carbon exposures across complex credit portfolios using a relative portfolio-weight
approach.14
13 See for example MSCI ESG Ratings Methodology, example 14 Erlandsson, Ulf, Credit Alpha and CO2 Reduction: A Portfolio Manager Perspective (April 19, 2017). Available at SSRN: https://ssrn.com/abstract=2987772 or http://dx.doi.org/10.2139/ssrn.2987772
Power
Transport
Iron and steel
Cement
Other industry
Agriculture
Buildings
Figure 14 The sensitivity of a portfolio’s fuel mix to different allocation rules (Source: 2°ii 2018)
Figure 23 Breakdown of CO2 emissions by sector; Blue = Covered by 2°C alignment tools (Source: Authors, based on Bloomberg data)
25
5. Conclusion and potential for action
Investors have a range of tools at their disposal to develop climate strategies for bond markets.
These are the same types of tools also available for equity investors:
• Providing capital / removing capital. Intuitively, the first type of action available to investors
is to provide / remove capital by adjusting their portfolio strategy. This could relate to targets
around investing in companies that align their business plan with a 2°C scenario or set a
science-based targets. It can also involve implementing a strategy to no longer finance
companies that are misaligned with a 2°C scenario. At macro level, this strategy could
obviously also extend to a more holistic portfolio view where the net capital exposure is
consistent with a 2°C outcome at global level. The key question here is impact. Virtual
ringfencing may reduce the extent to which investments are targeted. On the other hand, the
authors are not aware of direct evidence in terms of the impact of divestment in bonds market
in terms of company business plans. There is evidence that divestment strategies so far have
not influenced the pricing of assets (see box below). Equally, advocates of the divestment
movement do not see asset pricing as the primary impact channel.
• Influencing pricing. A related approach focuses on adjusting the pricing of bonds in terms of
investors changing the terms under which they provide capital – either preferential terms or
increasing the risk premium. It should be noted that public bond market’s place in the financial
system is to provide unconditional financing to issuers. In exchange, investors get much better
security and recourse over the issuers’ total assets than equity investors. The improved
security together with the lower lack of visibility and direct company influence is constantly
being priced in the bond market. It is only in the higher risk segment of the market, the high-
yield/junk bond market, that bond contracts tend to impose conditionality such as financial
covenants. Attempting to impose too much structure in the bond-contract itself is unlikely to
be met with great support from the market place.
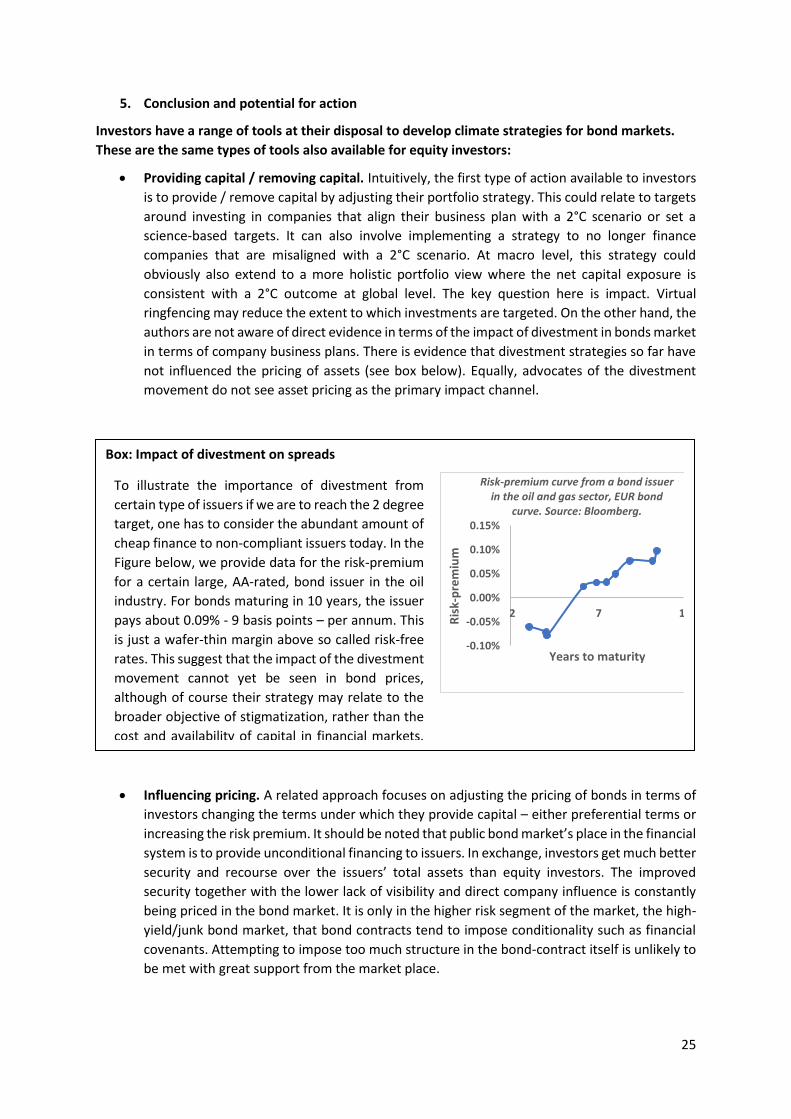
Box: Impact of divestment on spreads
-0.10%
-0.05%
0.00%
0.05%
0.10%
0.15%
2 7 12
Ris
k-p
rem
ium
Years to maturity
Risk-premium curve from a bond issuer in the oil and gas sector, EUR bond
curve. Source: Bloomberg.
To illustrate the importance of divestment from
certain type of issuers if we are to reach the 2 degree
target, one has to consider the abundant amount of
cheap finance to non-compliant issuers today. In the
Figure below, we provide data for the risk-premium
for a certain large, AA-rated, bond issuer in the oil
industry. For bonds maturing in 10 years, the issuer
pays about 0.09% - 9 basis points – per annum. This
is just a wafer-thin margin above so called risk-free
rates. This suggest that the impact of the divestment
movement cannot yet be seen in bond prices,
although of course their strategy may relate to the
broader objective of stigmatization, rather than the
cost and availability of capital in financial markets.
By extension, measuring the impact of divestment
on spreads is likely to be the wrong metric with
regard to the theory of change espoused by the
divest movements.

26
• Engaging with issuers. Finally, an emerging conversation in bond markets around climate
change issues is the question of engagement. Bond investors are increasingly considering their
potential influence on companies independent of their ‘equity ownership’. Large bond
investors like PIMCO are starting to develop engagement strategies around climate change.
While relatively recent, this channel may ultimately be a complement to engagement by
equity investors. It can also complement the strategies around influencing pricing and / or
withdrawing capital, as suggested by Hoepner and Erlandsson
“Despite the obvious benefits and increasing investor commitment to
engagement among equity investors, ESG engagement remains less common
among fixed income investors …”
Kris Douma, Director of Investment Practice & Engagements, PRI15
15 “ESG engagement for fixed income investors”, PRI (2018)
Box: Case studies on bond engagement on ESG
A recent publication from PRI and their bondholder engagement working group states finds that
“a growing number of PRI signatories engage in relation to at least some of their total fixed income
holdings, with 66% of those investing directly in fixed income markets engaging with at least one
type of issuer. A much smaller number of signatories engage systematically across a large
proportion of their fixed income portfolios. Among European investors, for example, 23% engage
on more than one quarter of their non-financial corporate bond holdings.” Some examples of
bondholder engagement presented in the PRI report include:
o Determining materiality before buying corporate and municipal bonds based on external
standards such as those provided by SASB, coupled with its internal sector-level and issuer-
level materiality assessment (Breckinridge Capital Advisors, Investment Manager, US)
o Prioritization of engagement with utilities based on understanding firms’ planning around two
degree policies; and assessment of stranded asset risk in their planning assumptions; (PIMCO,
Investment Manager, US)
o Declining investing in corporate bond after assessment of product carbon footprinting
performance, management of labour disputes, and poor governance profile (QIC, Investment
Manager, Australia)
Box: Conditional financing in credit
While the concept of conditional financing or price influencing currently has not been applied in
bonds markets, first pilots have sprung up with regard to conditional financing in corporate lending
portfolios. These pilots have largely focused on sustainability criteria more generally, rather than
climate change specifically. One example in this regard is the partnership between ING and Philips
on a EUR 1 billion loan with an interest rate that’s coupled to the copmany’s sustainability
performance and rating. ING is coordinating the facility as part of a syndicate of 16 banks. The
sustainability rating is benchmarked by Sustainalytics.

27
Additional options for action to be considered by other stakeholders
Based on the structure and dynamics of the bond market, there additional options that can be
explored to support the alignment of bond markets with climate goals beyond the actions of
institutional investors. For example, given the dependency on benchmarks in the fixed income market,
a revaluation of the benchmark integrated in portfolio mandates could be explored. A related
approach would be to use credit rating to set a bottom line for investable assets, based on the
alignment of companies and projects with 2C scenarios, i.e. introducing a climate-related investment
grade for bonds. The benchmarks as well as the rating approach can de driven by demand from asset
owners and managers who currently lack instruments to operationalize Paris commitments in their
bond portfolios.
The rationale behind the rating approach is to increase the cost of capital for non-aligned projects and
companies. Some investors may also choose to contribute to the price correction by applying a
hedging strategy, thereby leveraging a key feature of bonds: risk adjusted pricing. This approach can
be highly effective for a focused mandate, while less applicable to the bond market in general.
However, such ‘betting’ against carbon intensive assets could send important signals to market
participants and contribute to adjusted market pricing, too, if only indirectly.
Finally, in addition to investors and rating agencies, financial regulators and supervisors can consider
monitoring climate-related risks and how they are managed for the bond market, too, in order to
maintain financial stability and an efficient allocation of capital. One example for this initiative is the
California Insurance Commissioner’s work on corporate bonds scenario analysis for insurance
companies operating in California.
The key challenge is the lack of evidence regarding impact on which climate strategies work and
which ones don’t.
While a groundswell of announcements around engagement, divestment, green bonds, etc. has
captured financial markets in the past years, scientific evidence as to the relative impact of each of
these trends is lacking. Most of the analysis to date identifies ‘soft’ effects, like increased disclosure,
awareness raising and cultural shifts – elements which do not speak directly to questions of GHG
emissions reduction. Similarly, advocates of different strategies suggest that signalling effects – in the
case of divestment – and the development of national infrastructure plans – in the case of green bonds
– are the real desired ‘impacts’, as opposed to a narrow view of the actual business plan of a company.
While this may be the case, it is still at the end of the day investment decisions by households,
governments, and companies, all represented in bond markets, that will enable the ultimate climate
outcome. And it will be to a significant degree bonds markets that will be expected to deliver the
capital to realize these outcomes, ideally in a way that is consistent with global climate goals.
Delivering this outcome then is the challenge that bond markets face, across the entire bond portfolio,
if they are to manage the elephant in the room that this market represents.

28
Bibliography
AXA GROUP (2016) ‘Award on Investor Climamte-related Disclosures’, < https://cdn.axa.com/www-
axa-com%2Fcb46e9f7-8b1d-4418-a8a7-a68fba088db8_axa_investor_climate_report.pdf>
accessed 19 June 2018.
BURCK, J.; MARTEN, F.; BALS, C. & HÖHNE, N. (2017) ‚Climate Change Performance Index – Results 2018’,
Germanwatch, NewClimate Institute & Climate Action Network International
<http://germanwatch.org/de/download/20503.pdf> accessed 19 June 2018.
[Unsicher: Climate policy score Germanwatch NewClimate Institute?]
BURNS, S.; ALEXEYEV, A.; KELLY, R. & LIN, D. (2016) ‘Carbon Disclosure and Climate Risk in Sovereign
Bonds’, The Global Footprint Network
<https://www.footprintnetwork.org/content/documents/2016-Carbon_Sovereign_Bonds.pdf>
accessed 19 June 2018.
CALDECOTT, B.; DERICKS, G.; BOUVERET, G.; SCHUMACHER, K.; PFEIFFER, A.; TULLOCH, D. J.; KRUITWAGEN, L.;
MCCARTEN, M. (2018) ‘Asset-level data and the Energy Transition: Findings from ET Risk Work
Package 2’, University of Oxford, Sustainable Finance Programme
<http://www.smithschool.ox.ac.uk/research/sustainable-finance/publications/Asset-level-data-
and-the-Energy-Transition-Findings-from-ET-Risk-Work-Package2.pdf> accessed 19 June 2018.
EHLERS, T. & PACKER, F. (2017) ‘Green bond finance and certification’, BIS Quarterly Review,
September 2017 <https://www.bis.org/publ/qtrpdf/r_qt1709h.pdf> accessed 19 June 2018.
ERLANDSSON, U. (2017) ‘Credit Alpha and CO2 Reduction: A Portfolio Manager Perspective’, SSRN
Electronic Journal <http://dx.doi.org/10.2139/ssrn.2987772> accessed 19 June 2018.
HOEPNER, A. & YU, P.S. (2016) ‘Science Based Targets Without Science Based Disclosure? Towards a
Complete Carbon Data Science.’ SSRN Electronic Journal
<http://dx.doi.org/10.2139/ssrn.2715101>
INSTITUTE FOR BUILDING EFFICIENCY (2014) ‘Assessing the value of green buildings’,
<https://buildingefficiencyinitiative.org/resources/fact-sheet-assessing-value-green-buildings>
accessed 19 June 2018.
INTERNATIONAL ENERGY AGENCY (2017) ‘Energy Technology Perspectives’
JAKOB, M. & THOMÄ, J. (2018) ‘It’s on you! Bringing climate assessment for household credit into the
21st century’, 2° Investing Intiative <https://2degrees-investing.org/wp-
content/uploads/2018/03/2ii_Householdfinance_v1.pdf> accessed 19 June 2018.
MSCI ESG RESEARCH LLC (2017) ‘MSCI ESG Fund Metrics – Methodology’
<https://www.msci.com/documents/10199/255936/MSCI_ESG_Fund_Metrics_Exec_Summary_
Methodology_May2017.pdf/01a4aa33-ebfb-4a53-9c49-04acbd140485> accessed 19 June 2018.
NAQVI, M.; BURKE, B.; HECTOR, S.; JAMISON, T. & DUPRÉ, S. (2017) ‘All Swans are Black in the dark – How
the short-term focus of financial analysis does not shet light on long term risks’, 2° Investing
Initiative <http://www.transitionmonitor.com/wp-content/uploads/2017/04/All-Swans-Are-
Black-in-the-Dark.pdf> accessed 19 June 2018.

29
OECD (2016) ‘A quantitative framework for analysing potential bond contributions in a low-carbon
transition’ <http://unepinquiry.org/wp-
content/uploads/2016/10/8_Analysing_Potential_Bond_Contributions_in_a_Low-
carbon_Transition.pdf> accessed 19 June 2018.
THOMÄ, J.; HAYNE, M. & HAGEDORN, K. (2017) ‘Out of the fog: Quantifying the alignment of Swiss
pension funds and insurances with the Paris Agreement’ 2° Investing Initiative
<http://degreesilz.cluster023.hosting.ovh.net/wp-content/uploads/2017/12/2ii_Fog_v0.pdf>
accessed 19 June 2018.
STATE STREET GLOBAL ADVISORS (2018) ‘State Street Global Aggregate Bond Index Fund’, Factsheet
<https://www.ssga.com/doc/factsheets/FS3462_English.pdf> accessed 19 June 2018.
THE PRINCIPLES OF RESPONSIBLE INVESTING (2018) ‘ESG Engagement for Fixed Income Investors –
Managing risks, enhancing returns’ <https://www.unpri.org/download?ac=4449> accessed 19
June 2018.
THOMÄ, J.; DUPRÉ, S. & HAYNE, M. (2018) ‘A Taxonomy of Climate Accounting Principles for Financial
Portfolios’; Sustainability 2018, 10(2), 328; <https://doi.org/10.3390/su10020328>
WEBER, C.; THOMÄ, J. & DUPRÉ, S. (2017) ‘Yellow Brick Road – From climate investment roadmaps to
science-based financing roadmaps’ 2° Investing Initiative
<http://degreesilz.cluster023.hosting.ovh.net/wp-
content/uploads/2018/02/science_based_financing_roadmaps.pdf> accessed 19 June 2018.
WEBER, C.; THOMÄ, J.; DUPRÉ, S.; EMIN, G. & BOCQUET, R. (2016) ‘Measuring the alignment of sovereign
bond portfolio with climate goals’, 2° Investing Initiative <http://seimetrics.org/wp-
content/uploads/2017/10/2ii_BR_Sovereignbonds.pdf> accessed 19 June 2018.
WHILEY, A. (2017) ‘Bonds and Climate Change: the state of the market in 2017’, Climate Bonds
Initiative, commissioned by HSBC <https://www.climatebonds.net/files/reports/cbi-sotm_2017-
bondsclimatechange.pdf> accessed 19 June 2018.

30