abb automation & power world: april 18-21, 2011 wcs … · supports capital investment projects...
TRANSCRIPT

© ABB Inc.April 20, 2011 | Slide 1
WCS-118-1Implementing Fault Detection Isolation Restoration & Incipient Fault Detection in Distribution Systems
ABB Automation & Power World: April 18-21, 2011

© ABB Inc. April 20, 2011 | Slide 2
WCS-120-1 (presentation code)Title of presentation
Speaker name: Dennis Stephens
Speaker title: Director, Strategic Technologies
Company name: Xcel Energy
Location: Denver, CO
Co-presenter
Speaker name: John McGowan / Doug Voda
Speaker title: Product Manager / Global
Segment Leader Smart Grid
Company name: ABB Inc.
Location: Bethlehem, PA / Lake Mary, FL

© ABB Inc.April 20, 2011 | Slide 3
Your safety is important to usPlease be aware of these emergency procedures
In the event of an emergency please dial ext. 55555
from any house phone. Do not dial 9-1-1.
In the event of an alarm, please proceed carefully to the
nearest exit. Emergency exits are clearly marked
throughout the hotel and convention center.
Use the stairwells to evacuate the building and do not
attempt to use the elevators.
Hotel associates will be located throughout the public
space to assist in directing guests toward the closest exit.
Any guest requiring assistance during an evacuation
should dial “0” from any house phone and notify the
operator of their location.
Do not re-enter the building until advised by hotel
personnel or an “all clear” announcement is made.

© ABB Inc.April 20, 2011 | Slide 4
Your safety is important to usConvention Center exits in case of an emergency

© ABB Group April 20, 2011 | Slide 5
Workshop Takeaways
Rapid detection, analysis and notification of distribution feeder events
enables utilities to deliver more reliable power to their customers
Replacement strategies of aged underground feeder cables take too
long; insufficient as a complete strategy of managing that asset
Aggressive, proactive cable failure monitoring using non-intrusive
equipment is a viable addition to asset management techniques

Xcel Energy
Provides energy-related products and services to 3.4 million electricity customers and 1.9 million natural gas customers.
Have regulated operations in Colorado, Michigan, Minnesota, New Mexico, North Dakota, South Dakota, Texas, and Wisconsin.
Operates 16,427 MW distribution and generation assets
Annual revenues of $10.3 billion
Over 12,000 employees
No. 1 wind power provider in the nation
No. 5 in solar power capacity
Member of Dow Jones Sustainability Index
2010 Power Company of the Year (Platts)
2011 Energy Star Partner of the Year (U.S. EPA)

Xcel Energy Underground Cable Fault History
First large-scale installations in 1970‟s
500 MCM unjacketed, exposed concentric neutral cables
Direct buried
South-central Metro Denver
10,000 miles of underground cable entire system
2000 miles of 500 MCM cable
Annual cable failures
3100 – underground residential distribution (URD)
135 – main line failures
60 – 500 MCM cables
Activity follows seasons
Highest activity from May to August
Xcel Energy Underground Cable Fault PainsLocation is Key
Main-line faults
SCADA-EMS receives breaker operation indication
Dispatches crew
Re-closing attempts made to isolate fault location
Indirect degradation of assets, e.g., transformer and breaker
Restoration can take hours
Lateral faults
No SCADA-EMS information
Dispatcher learns of outage from customer calls
Dispatcher sends either one or two Troubleman
If knowledge of fault in UG or OH section, know exactly how many to send
Refusing attempts made to isolate fault location
OK on arrival
40 percent of time dispatched crews find nothing

Asset Management Justification Example
Example value estimation
Utility with 3,300,000 customers
SAIDI – 90 minutes
300,000,000 customer minutes out (CMOs) annually
Average Customer Minutes Out (CMO) costs $0.20 (estimate)
Outage duration reduced four minutes saves 3.0MUSD
($0.20/CMO)*(3,300,000 C)*(4 MO) = 2.64 MUSD
$ Savings = ($ / CMO)*(# of customers)*(# minutes saved)
Qualitative value also beneficial and included in estimate
Limits negative news coverage from outages
Supports capital investment projects with PUC
Xcel Energy‟s Strategic Technologies Group
Strategic Technologies uses the power of
partnership and collaboration to enable
new ways of doing business. We are
focused on integrating technology to
provide clean, reliable and safe energy at
a reasonable cost today and into the
future.
Build technology frameworks to support
business in the short- and long-term
Assess commercial viability of emerging
technologies
Help accelerate adoption of promising
technologies

Xcel Energy-ABB „Feeder Monitoring‟ Project
What is it?
PPMV/DA
USCRC
q Provides real test bed for data collection,
validation ,and design work
q Contributes HW, Labor, and Communications
service
q Provides operational and outage data
(confidential)
q Responsible for technical developments
q Provides weekly status reports- These
reports are part of the research work
whether shared with the utility or not.
q Contributes HW and Labor
q Contributes HW and Labor
q Responsible for business aspects
q Responsible for productization

Captured dozens of U/G cable faults
Self-clearing U/G cable faults
Permanent (fuse-cleared) cable faults
Underground and overhead faults
Captured information on adjacent faults
Captured information on upstream faults
Validated ABB detection algorithm (offline)
Captured numerous non-fault feeder events
0 0.05 0.1 0.15 0.2 0.25 0.3 0.35 0.4 0.45 0.5
-5000
0
5000
Recorded Waveforms in [TOLL1765-LS2] DPU-LS2-071201-015559026.cfg
A
a
b
c
0 0.05 0.1 0.15 0.2 0.25 0.3 0.35 0.4 0.45 0.5
-10
0
10
kV
0 0.1 0.2 0.3 0.4 0.50
5000
Current Phasor Analysis
A
a
b
c
0 0.1 0.2 0.3 0.4 0.50
5
10
Voltage Phasor Analysis
kV
Filename: DPU-LS2-071201-015559026.cfgTrigger Date: 12/01/07Trigger Time: 01:55:59.260000Faulted Phase: aPeak Phasor Fault Current (A RMS): 4641Peak Inst. Fault Current (A): 7736.6Fault Duration (cycles): 0.969Load Change (kW): -62
Prefault Loading Phase: A; B; C: Current (A): 306; 257; 290 Power (kW): 2390; 1978; 2216 Power Factor: 0.967; 0.947; 0.955 Voltage (kV RMS): 8.07Postfault Loading Phase: A; B; C: Current (A): 295; 254; 290 Power (kW): 2328; 1951; 2213 Power Factor: 0.974; 0.946; 0.954 Voltage (kV RMS): 8.07
Phase I: Results and Conclusions (1/2)
Feeder Event
Breaker failure
Cable fault on adjacent feeder
Cable fault on monitored feeder
Load pickup
Load shed
Switching transient
Transformer failure
Transformer inrush

© ABB Inc. April 20, 2011 | Slide 13
Phase I: Results and Conclusions (2/2)
Actual cable fault
Potential „false positives‟ – a good thing
A: Reclose into fault
B: Inrush
A B

© ABB Group April 20, 2011 | Slide 14
Phase II: Results and Conclusions
More fault and non-fault feeder events captured
> 400 cable faults
> 19,000 feeder disturbances
Information collected enabled research and
development of more comprehensive feeder event
analysis algorithms
Classification of feeder event
Non-fault – Cold load pickup, capacitor
bank switching, etc.
Fault – short or long duration; upstream,
primary or adjacent feeder
Identification of clearing device
Substation breaker, recloser or fuse
Fuse size
Value realization for Xcel Energy requires real-time
detection and notification of these feeder events
Feeder Event
Breaker failure
Breaker trip
Cable fault on adjacent feeder
Cable fault on monitored feeder
Capacitor bank switching
Load pickup
Load shed
Other faults
Other PQ events
PQ: sags, swells, interruptions
Reclose into fault
Switching transient
Transformer failure
Transfomrer inrush

SCFDAnalysis (SRC
Core)
SCFDDecision (SRC
Core)
sc_
a
sc_
b
sc_
c
Ia Ib Ic
SC
FD
De
tect
Eve
ntD
ete
ct_
3p
h
block
ph_pu
cycleMultipler
Adaptive_ph_pu
SCFD
Phase III: Cable Fault Detection (CFD) Integration
ABB‟s Relion® 615 series product

B
R Regulator
B
Relay (IED)
B
B
B
CFD Monitoring Unit Installation
ABB/Xcel Energy
e-mail recipients
Sprint/
Nextel WAN
Sprint/Nextel Modem
for Wireless remote
dial up
Four substations
Eight feeders
Test plugs –
Metering circuits

Network Operations and Control Center
Substation
Computer/Gateway
Information Flow
Power Flow
G
Integrated Event Detection, Analysis, and NotificationEnhancing Outage Management, Situation Awareness

Phase III: Results and Conclusions
Real-time detections and notifications
Historical recording
COM600 Web-server demonstration

Starting DOE „Feeder Management‟ ProjectBasics in a Nutshell
Responded to DOE‟s FOA-0000313 for Area of Interest II, Jun 24, 2010
This area calls for RDD projects addressing “Prognostic Health
Management” and “Distribution System Sensing” Needs
Proposal selected for an award on Nov 17, 2010 and entitled “Real-time
Distribution Feeder Performance Monitoring, Advisory Control, and Health
Management System” (1 of 5 awarded proposals out of >100 applications)
A three-year project with two Phases of Exploration & Development and
Demonstration

Operator Message:
A Cable Fault
event on B phase
has just been
detected on
Primary feeder
1765 out of XYZ
substation on Dec
13, at 7:44AM
that could have
been cleared by a
40A fuse (Rel.
probability: High).
Integrated Event Detection, Analysis, and NotificationConcept of What „Done‟ Might Look Like
© ABB Inc.April 20, 2011 | Slide 21
WCS-118-1Implementing Fault Detection Isolation Restoration & Incipient Fault Detection in Distribution Systems
ABB Automation & Power World: April 18-21, 2011
FDIR Objectives
Safety
Reliability
Security from intrusion
(NERC/CIP)
Predictability
Fully interoperable (DNP/61850)
Easy deployment
Expandable

© ABB Group April 20, 2011 | Slide 23© ABB Group April 20, 2011 | Slide 23
Distribution Smart Grid Landscape
Customer
Generation
& Energy
Storage
Revenue
Meters
Neighborhood
Area Network
(NAN)
Building
Automation
System
FeederProtection
Line
RecloserSwitch
Control
Gateway
Switch
Control
Voltage
Regulator
Control
Capacitor
Control
LTC,
Voltage
Regulator,
and/or
Capacitor
Control
Meter &
Billing GISCISAMI Head-
end
Mobile Data
System
SCADA/DMS
Communications
SubstationSubstation
Control Center
Communications
Communications
Feeder
Monitor
Feeder
Automation
Network
(FAN)
Wide Area
Network
(WAN)
© ABB Group April 20, 2011 | Slide 24
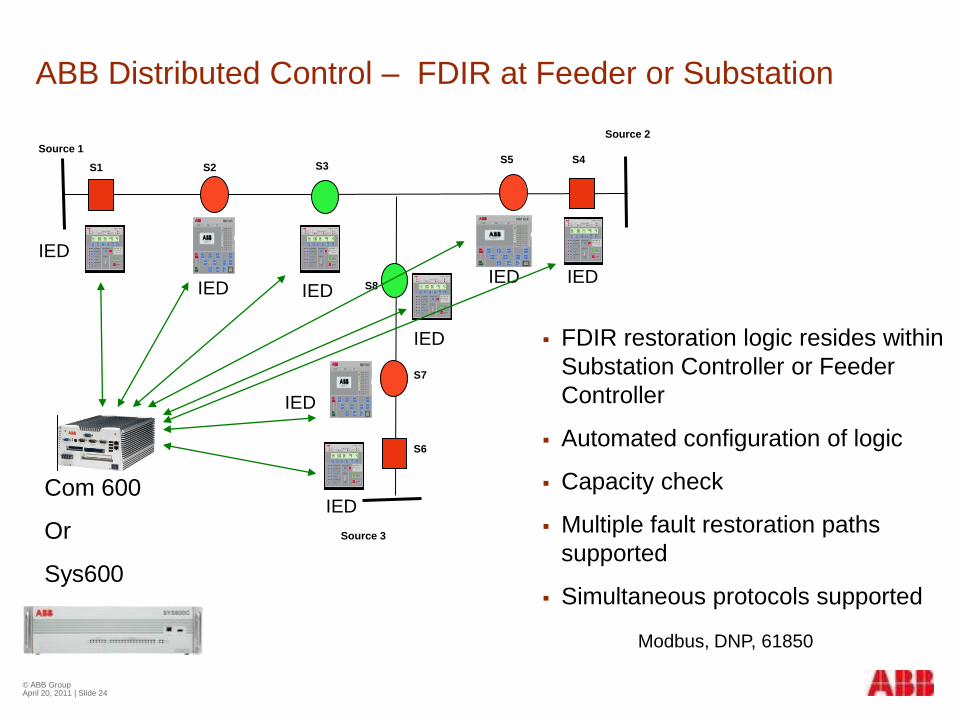
ABB Distributed Control – FDIR at Feeder or Substation
FDIR restoration logic resides within
Substation Controller or Feeder
Controller
Automated configuration of logic
Capacity check
Multiple fault restoration paths
supported
Simultaneous protocols supported
Modbus, DNP, 61850
S1 S2 S3S5 S4
Source 1
Source 3
S6
S7
S8
Source 2
IED
IED
Com 600
Or
Sys600
IED
IEDIED
IED
IEDIED

© ABB Group April 20, 2011 | Slide 25
Auto-Configuration of Logic
System topology transferred to single line diagram of COM600 config tool (SAB600)
Connectivity and IED data points/ commands (Cross References) automatically configured in Active Logic program using Feeder Automation Configuration Tool
Isolation and restoration logic automatically configured based on connectivity and device statuses
Active Logic ProgramSAB600 Cross References Tool
SAB600 Single Line Diagram
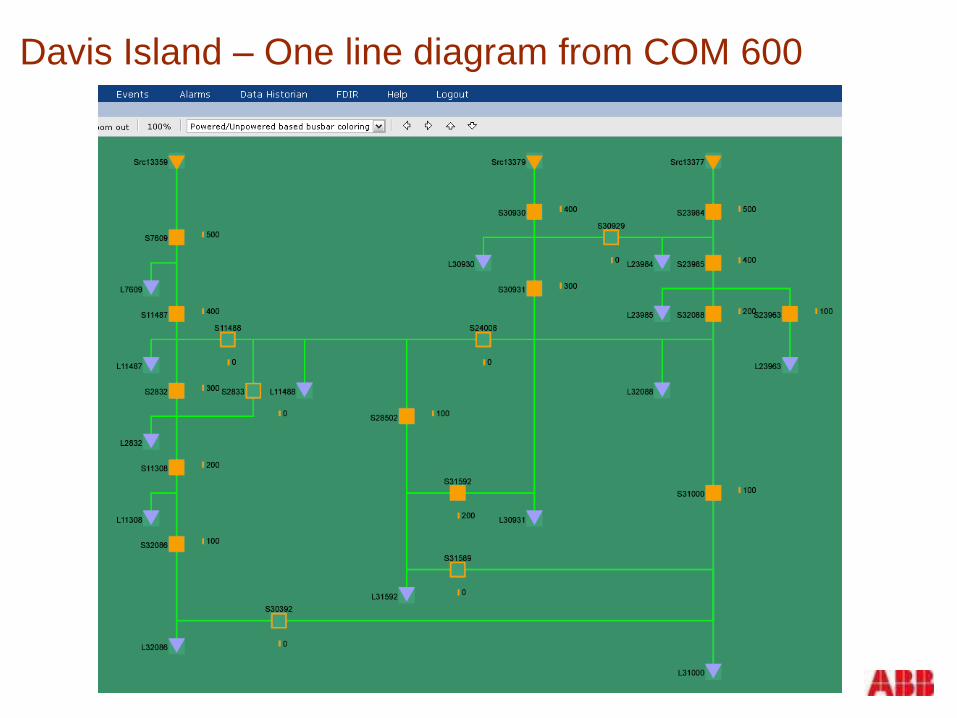
Davis Island – One line diagram from COM 600
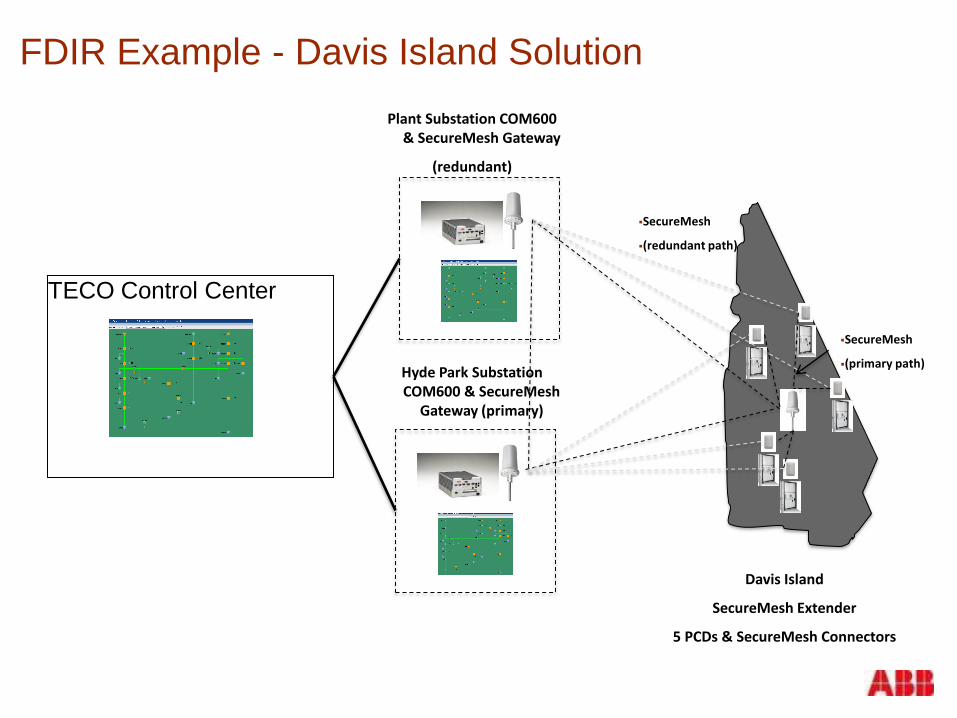
FDIR Example - Davis Island Solution
TECO Control Center
Hyde Park Substation COM600 & SecureMesh
Gateway (primary)
Plant Substation COM600 & SecureMesh Gateway
(redundant)
Davis Island
SecureMesh Extender
5 PCDs & SecureMesh Connectors
SecureMesh
(redundant path)
SecureMesh
(primary path)

© ABB Group April 20, 2011 | Slide 28
Recloser Portfolio – GridShield™ family
GridShield Recloser
Similar high voltage design as OVR
Utilizes the RER620 Control with new advanced features

© ABB Inc.April 20, 2011 | Slide 29
RemindersAutomation & Power World 2011
Please be sure to complete the workshop evaluation
Professional Development Hours (PDHs) and
Continuing Education Credits (CEUs):
You will receive a link via e-mail to print
certificates for all the workshops you have attended
during Automation & Power World 2011.
BE SURE YOU HAVE YOUR BADGE SCANNED
for each workshop you attend. If you do not have
your badge scanned you will not be able to obtain
PDHs or CEUs.

© ABB Group April 20, 2011 | Slide 30