ab initio study of the diffusion and decomposition ... · ab initio study of the diffusion and...
TRANSCRIPT

Ab initio study of the diffusion and decomposition pathways of SiHx species on Si(100)
Michele Ceriotti,* Silvia Cereda, Francesco Montalenti, Leo Miglio, and Marco BernasconiDipartimento di Scienza dei Materiali, Università di Milano-Bicocca, Via R. Cozzi 53, I-20125, Milano, Italy
�Received 5 November 2008; revised manuscript received 24 February 2009; published 28 April 2009�
Diffusion and decomposition of SiHx species adsorbed on the clean Si�100� surface are processes of rel-evance for the growth of crystalline silicon by plasma-enhanced chemical vapor deposition. In this work, wereport an extensive search of diffusion and decomposition pathways for SiH3, SiH2, and SiH by means ofcombined ab initio metadynamics simulations and optimization of minimum-energy reactions paths. We findthat on the clean surface SiH3 undergoes stepwise decompositions into Si and H adatoms according to SiH3
→SiH2+H→SiH+2H→Si+3H with an overall reaction barrier of the order of 0.8 eV, consistent with thescenario inferred from secondary ion mass spectroscopy data. The lifetime of SiH3 at room temperaturecalculated within transition state theory in the harmonic approximation is in agreement with experiments. Thelifetime of SiH2 turns out to be similar to that of SiH3. Possible trap states for SiH2 are proposed, based onenergetics and by comparing calculated scanning tunneling microscope images with experimental data.
DOI: 10.1103/PhysRevB.79.165437 PACS number�s�: 81.15.Gh, 68.47.Fg, 68.43.Bc
I. INTRODUCTION
Plasma-enhanced chemical vapor deposition �PECVD�from silane �or disilane� is a widespread technique for fastgrowth of silicon films.1 In PECVD, high deposition rates areguaranteed by the creation of reactive radicals in the gasphase. Among them, SiH3 is believed to be the most abun-dant under most experimental conditions.2,3 Since, at vari-ance with conventional chemical vapor deposition �CVD�,thermal cracking of neutral molecules at the film surface isnot needed,4–6 reactors can also operate at low temperature�T�. Low-T �below 300 °C� PECVD is commonly used togrow amorphous, microcrystalline, or nanocrystalline films.At higher temperatures epitaxial films can also be obtained,provided that the ions’ energy is carefully controlled so thatdamage is avoided. In fact, the closely related low-energyplasma-enhanced chemical vapor deposition �LEPECVD�technique, where large amount of reactants are created whilekeeping the kinetic energy of the impinging ions below�15 eV, was used to grow device-quality Si or SiGefilms.7,8 Understanding the elementary processes leading tosilicon growth from radicals is thus relevant for applicationsof amorphous thin-films and for the development of elec-tronic and optoelectronic devices grown on crystallineSi�100� substrates.2,4
Unfortunately, film growth in plasma reactors is verycomplex both to investigate experimentally and to model atthe molecular level. Information on elementary reactionsteps of radicals on Si�100� has been obtained under morecontrolled experimental conditions.9 Surface analysis tech-niques, such as secondary-ions mass spectroscopy �SIMS�,temperature programmed desorption �TPD� �Refs. 10–13�and scanning tunneling microscopy �STM� �Refs. 14 and 15�have been applied to study the fate of SiH3 radicals adsorbedon Si�100�. Measurements at room temperature allow one toobtain time-resolved information on the evolution of the ad-sorbed species. SiH3 radicals result from the exposure of thesurface to silane �SiH4� and disilane �Si2H6� at low tempera-ture and at different partial pressures. Submonolayer cover-ages have been explored to investigate the behavior of nearly
isolated adsorbed species on the otherwise clean surface. Si-lane is believed to decompose into SiH3 and hydrogen whiledisilane is supposed to decompose into two adsorbed silylradicals,11,16 although different decomposition pathwayshave also been proposed for the latter.17–19
In a seminal paper, Gates et al.10 proposed the followingscenario for SiH3 decomposition at the Si�100� surface,based on SIMS and TPD data. SiH3 decomposes readily at300 K according to
SiH3 + db → SiH2 + H, �1�
where db indicates a dangling bond belonging to a cleanSi-Si surface dimer. All SiHx species in reaction �1� and here-after have to be considered adsorbed species if not otherwisespecified. Then, at low hydrogen coverage �low silyl cover-age on a nearly clean surface� SiH2 can further decomposeinto adsorbed SiH and eventually into silicon adatoms ac-cording to
SiH2 + 2db → SiH + H + db → Si + 2H. �2�
At higher hydrogen coverage, when there is not a sufficientdensity of dangling bonds to receive hydrogen from the de-composing radicals, SiH2 is stable: only at higher tempera-tures �over 200 °C� does it start diffusing on the surface, andeventually it releases hydrogen according to the recombina-tion reaction,
2SiH2 → HSi − SiH + H2�gas� , �3�
producing a hydrogenated dimer. Reaction �3� is responsiblefor the �2 peak of H2 release measured in TPDexperiments.10 The barrier for silyl decomposition estimatedfrom SIMS data is very low, ranging from 80 to 100 meV,depending on silane dosage. The corresponding pre-exponential factors are, however, anomalously low �0.7 and4.0 s−1, respectively�. It has been proposed that these lowactivation energies are related to processes occurring at stepsand defects, at which silane precursors would preferentiallyadsorb. Adsorbed SiH3 and SiH2 species have also beenidentified by STM measurements at and above roomtemperature.14,15 STM and SIMS agree on a lifetime of sev-
PHYSICAL REVIEW B 79, 165437 �2009�
1098-0121/2009/79�16�/165437�13� ©2009 The American Physical Society165437-1

eral minutes for SiH3 at room temperature. However, reac-tion path �2� inferred from SIMS data has been questionedby STM based on the measurement of a very precise corre-spondence between the number of adsorbed SiH2 and H,which has been interpreted as resulting from the decomposi-tion of silyl only. Moreover, no evidence of the intermediatespecies SiH has been detected by STM, which may be due tothe very short lifetime of SiH. Nevertheless, recent TPD�Ref. 16� and modulated beam mass spectroscopy20 measure-ments on Si�100� dosed with disilane are consistent with thedecomposition of SiH2 according to reaction �2�.
From the theoretical side, several works are devoted toreactions leading to SiH2 from SiH3 in the framework ofdensity-functional theory �DFT�.21,22 DFT slab calculations�Perdew-Burke-Ernzerhof �PBE� functional23� by Lim etal.22 reported activation barriers of 1.12 and 1.34 eV forreaction �1�, with the SiH2 ending up in on-dimer and in-trarow geometries, respectively. These activation energiesare much lower than the results �2 and 2.5 eV� of Srivastavaet al.,24 possibly because of inaccuracies in the location ofthe transition state in the latter work. Earlier DFT calcula-tions on cluster models predicted a barrier of 1.43 eV for thesame reaction, the final configuration being the silylenetrapped in a broken-dimer geometry, with the hydrogenbound to one of the Si of the broken dimer.21 This configu-ration, however, is not seen in STM experiments, and thecalculated barrier is incompatible with the measured lifetimeof SiH3. Other decomposition pathways of SiH2 on the cleanSi�100� surface have not been addressed yet by ab initiocalculations. Moreover, beside possible inaccuracies due tothe method used to locate the saddle point, previous theoret-ical works suffer from limitations stemming from the a pri-ori selection of reaction pathways, a procedure which mightoverlook unexpected mechanisms for the reaction of the ad-sorbed species.
In this paper we investigate further the fate of SiHx onSi�100�, by making use of the ab initio metadynamicstechnique,25,26 a simulation tool which allows for extensivesearch of diffusion and reaction pathways. As a first steptoward the modeling of the growing surface, we will con-sider here radicals adsorbed on the clean Si�100� surfacewhich can be compared with experimental data at low silyl�and then hydrogen� coverage. Local minima visited during�or inspired by� metadynamics trajectories have been opti-mized, and activation energies between different minimahave been further refined by the nudged elastic band �NEB��Ref. 27� method.
After a description of our theoretical framework in Sec.II, we present in Sec. III A the results of metadynamicssimulations of an isolated SiH3 on the clean Si�100� surface.In Sec. III B we discuss the outcome of the NEB calculationson the diffusion of silyl, on the decomposition of SiH3 intoSiH2, on the diffusion of SiH2 and its decomposition intoSiH, and finally on the diffusion of SiH and its decomposi-tion pathways in adatoms. In Sec. IV we report and discusscalculated STM images of relevant intermediates in compari-son with experimental STM data. Section V is devoted to ourconclusions.
II. COMPUTATIONAL DETAILS
The calculation scheme adopted throughout this work isbased on density-functional theory, using an energy func-tional with generalized-gradient corrections �PBE�,23 andplane-wave expansion of the Kohn-Sham orbitals up to akinetic-energy cutoff of 25 Ry. We have used the PWSCF
�Ref. 28� code for static calculations, and CPMD �Ref. 29�for Car-Parrinello30 metadynamics simulations. Norm-conserving31 and ultrasoft32 pseudopotentials have beenused, respectively, for silicon and hydrogen. In previouswork on diffusion of SiH3 on H:Si�100�-2�1, we have per-formed tests on the accuracy of our framework, by comput-ing reaction enthalpies for some gas-phase decompositionchannels of disilane.33 As discussed in Ref. 33 and 34, spin-unrestricted calculations are mandatory to reproduce the cor-rect reaction enthalpy of radical species. Therefore, all thecalculations reported here have been performed in a spin-unrestricted framework �local spin-density approximation,LSD-PBE�. The Si�100� surface is reconstructed with buck-led dimers in the c�4�2� geometry. The surface is modeledby a slab, six silicon layers thick, with three-dimensionalperiodic boundary conditions and a vacuum gap 11 Å wide.The simulation cell contains eight surface dimers, corre-sponding to four c�4�2� surface unit cells �Fig. 1�. Thebottom surface is saturated by symmetric SiH2 groups, whichare kept fixed at the ideal bulk positions, together with theunderlying silicon layer. The supercell contains a total num-ber of 128 atoms. The theoretical equilibrium lattice param-eter obtained from a bulk calculation with the k-point sam-pling corresponding to the supercell � point is 0.7% largerthan the experimental one, while the theoretical value at fullconvergence in Brillouin-zone �BZ� integration is 0.6%shorter than the experimental one. Thus, in the slab calcula-
01��
1 �x�
011�y�
FIG. 1. �Color online� Simulation supercell adopted in this workcontaining eight dimers, viewed along the �100� �z� direction. Theunit cell of the c�2�4� reconstruction is marked with a dashed line.Throughout this paper, the up atoms of the buckled dimers arehighlighted with a thicker border to serve as a reference, regardlessof the actual buckling state in a given geometry.
CERIOTTI et al. PHYSICAL REVIEW B 79, 165437 �2009�
165437-2

tion we chose the experimental lattice parameter �5.43 �Ref. 35��. In previous work,33 we found that the adsorptionenergy of the silyl radical on the clean Si�100�-2�1 surface�0.5 eV� changes by less than 10 meV by changing the latticeparameter by 0.7%,.
In molecular-dynamics simulations only the � point hasbeen considered in the BZ sampling, whereas two specialk-points �� 1
4 , �14 � in crystal coordinates� have been used in
geometry optimizations and NEB calculations, as discussedlater on.
We have made use of metadynamics as a tool to uncoverreaction and diffusion pathways. Metadynamics allows oneto overcome large barriers in a simulation time �few picosec-onds� affordable in ab initio molecular dynamics.25,36,37 Themethod is based on a coarse-grained, non-Markovian dynam-ics in the manifold spanned by a few reaction coordinatesbiased by a history-dependent potential which drives the sys-tem toward the lowest saddle point. The main assumption isthat the reaction path can be described on the manifold offew collective variables �CV� S���RI��, which are a functionof the ionic coordinates RI. The Lagrangian L0 of the systemis then modified, by introducing a history-dependent biasingpotential, which pushes the system out of the region it hasalready visited, and allows it to overcome the lowest energybarrier and move toward a new equilibrium basin. Manyvariations over these basic principles have been explored; inthis paper we use the direct metadynamics approach,37 whichsimply introduces a repulsive potential �L=L0−g��RI� , t��built from the superposition of Gaussians centered at pointspreviously visited by the trajectory in CV space, which actsdirectly on the ionic coordinates RI as
g��RI�,t� = w�tj�t
exp−��=1
n�S��RI�t�� − S��RI�tj���2
2�s2 .
�4�
The height w and width �s of the Gaussians are chosen insuch a way as to uniformly fill the free-energy wells. Wehave performed metadynamics simulations of diffusion anddecomposition of a single silyl and a single SiH on the cleansurface. To this aim, we have chosen in both cases the �x ,y�surface position of the silicon atom of the radical to be usedas collective variables. This choice for the collective vari-ables is clearly well suited to the study of diffusion, and itturned out to be sufficient to study decomposition reactionsas well, since diffusion and decomposition are competitiveprocesses, with similar activation barriers. The underlying abinitio dynamics is based on the Car-Parrinello method30 witha time-step of 6 a.u., an electron fictitious mass of 600 a.u.,and deuterium mass for hydrogen. We have usednorm-conserving31 pseudopotentials and a plane-waves cut-off of 18 Ry, as these simulations are only aimed at a pre-liminary exploration of the potential-energy surface. Con-stant temperature �300 K� on ions is enforced by a Nosé-Hoover thermostat.38,39 The hills parameters �Eq. �4�� arechosen as �s=0.26 Å and w=0.22 eV; a new hill is addedeach time the trajectory reaches a point 2�s far from theprevious Gaussian centers in CV space, or at worst every 300
time steps. In principle, metadynamics allows one to com-pute activation free energies from a finite temperature simu-lation. However, long simulations with a small Gaussianheight w are needed to obtain accurate estimates of activationfree energies. Once we have obtained a good starting guessfor the transformation path out of the metadynamics trajec-tory, the geometry and activation energy of the transitionstate have been further refined by optimizing the minimumenergy path �MEP� with the NEB method.27 Climbing imageand variable springs40 have been used, with kmax=0.6 a.u.and kmin=0.3 a.u. A minimization scheme has been applieduntil the residual total forces acting on each image in thedirection perpendicular to the path were less than 0.05eV/Å.
In previous work on the diffusion of SiH3 on hydrogen-ated Si�100� it turned out that good accuracy is obtained byperforming geometry optimizations of minima and transi-tions states �TS� with � point-only sampling of the Brillouinzone, followed by a self-consistent energy calculation usinga special k point.33 This is also true for most of the configu-rations studied in the present work. However, for a few oneswhere diradical electronic states are present, �-only and mul-tiple k-points calculations result in qualitatively differentelectronic configurations, and the error on energy differencesdue to the use of �-optimized geometries is as high as 0.3eV. A more thorough discussion of this rather technical issueis deferred to the supplementary materials.41 Although only afew configurations suffered from this problem, for the sakeof consistency all the local minima and TS geometries havebeen fully optimized using the aforementioned two special kpoints. To speed up the optimization of TS geometries, wehave applied the dimer method,42 starting from the saddle-point geometry and the tangent to the reaction path as ob-tained from �-only NEB calculations.
III. RESULTS
A. Preliminary metadynamics simulations
The starting geometry for our metadynamics simulationcorresponds to a SiH3 radical adsorbed on a dangling bond ofa surface dimer �panel A in Fig. 2�. An SiH3 radical imping-ing on the clean Si�100� surface would bind to a surfacedangling bond with a nearly unitary sticking coefficient asdemonstrated by previous theoretical investigation.3 As dis-cussed in Sec. II, we used as collective variables the �x ,y�coordinates which locate the position of the Si atom of theadsorbed radical.
We observed a few hops of the SiH3 radicals among thetwo dangling bonds of the dimer on which it was initiallyadsorbed, but once the added Gaussians pushed the silylaway from the dimer, instead of hopping onto the adjacentdimer, the SiH3 decomposed into SiH2 and H, as shown inFig. 2�C�. This outcome suggests that decomposition intosilylene is more favorable than diffusion. Subsequently, theintradimer SiH2 is forced to jump in the nearby location�Fig. 2�D��. Then, instead of further diffusing away under theaction of the history-dependent potential, the silylene decom-posed into SiH, as shown in panel E, finally reaching a trapstate �which will be discussed below�. The whole trajectory
AB INITIO STUDY OF THE DIFFUSION AND… PHYSICAL REVIEW B 79, 165437 �2009�
165437-3

lasts 20 ps. A sketch of the full trajectory in CV space isshown in the upper panel of Fig. 2.
The SiH2→SiH+H pathway is interesting, since it seemsto have an activation energy comparable or lower than thebarrier for SiH2 diffusion. These results support the predomi-nance of reaction path �2�, as inferred from earlier SIMS andTPD measurements10 and by later experiments.16
To reliably assess the predominance of one reaction chan-nel over the many others conceivable, we have undertakenextensive NEB calculations to assign activation and reactionenergies among local minima identified in the metadynamicsrun, and several others starting from an adsorbed SiH2 orSiH from an otherwise clean surface. Additional minima andtransformation paths previously proposed in literature havealso been considered. Furthermore, we also explored path-ways that seemed likely to be viable in the light of the be-havior observed in the metadynamics simulations. The out-
come of the NEB calculations is discussed in Sec. III B. Tosimplify the discussion, we introduce here a notation to clas-sify the very many configurations we are going to considerlater on. Since all configurations correspond to a cleanSi�100� surface plus one additional silicon atom and a vari-able number of hydrogen atoms, we will label local minimaaccording to the scheme N�
m, where N indicates the totalnumber of H atoms present, m is the number of hydrogenatoms which are bound to the adsorbed silicon atom, and � isa label to distinguish configurations with identical N and m.For instance, the local minima corresponding to configura-tions in Fig. 2, panels A, C, and F will be labeled in thefollowing as 3a
3, 3a2, and 3e
1 respectively. Configurations N�m
and N��m differ only because of the buckling state of nearby
dimers. Configurations N�m and N�
m have the same energy andthey can be converted one into the other by a symmetryoperation.
B. Local minima and activation energies
Energies �eV� of local minima and transition states arereported in four synoptic figures �Figs. 3–5 and 8�. A refer-ence state is chosen for each figure, and its energy is set tozero. Absolute energies can be compared within the samefigure, but not between different ones. Activation barriers canbe obtained as a difference in energy between the transitionand initial states. For a few, selected reaction pathways wehave computed harmonic vibrational frequencies � by finitedisplacements of the atoms ��-only calculations� and ob-tained zero-point energy �ZPE� corrections, and the prefac-tors �� for reaction rates within harmonic transition statetheory. In the classical limit, ��=� j� j
�R� /� j� j�TS� where � j
�R�
and � j�TS� are the positive eigenvalues of the Hessian matrix
for reactant and transition states, respectively. Reaction ratesand ZPE corrected energies are reported in the synoptic fig-ures, when available, together with the energies without ZPEcorrections.
At room temperature the flipping of the buckled dimers isvery fast, its barrier being around 0.1 eV.43 Therefore, only infew cases have we considered pathways differing only by thebuckling of dimers on which the different species are ad-sorbed. In all the cases considered, the resulting difference inenergy is below 0.1 eV. The synoptic figures contain all theinformation about decomposition pathways that emergedfrom the ab initio calculations. In brief, Fig. 3 reports diffu-sion and decomposition pathways for an adsorbed SiH3, andalso considers further decomposition events which ultimatelylead to an adsorbed silicon adatom. Figure 4 displays similarprocesses in the presence of an additional adsorbed H. Figure5 collects the diffusion and decomposition pathways of anisolated SiH2, which might be produced by the intermediatesilylene diffusing away from the initial adsorption site of thesilyl. Finally, Fig. 8 displays diffusion and decompositionpathways of an isolated SiH, which we found to be an inter-mediate step in our decomposition pathways, and which re-ceived scarce attention so far. The reader can refer to Fig. 3for all structures of the form 3�
m, to Fig. 4 for 4�m, to Fig. 5 for
2�m, and to Fig. 8 for 1�
m minima.
FIG. 2. �Color online� Trajectory of the �x ,y� coordinates of thesilicon atom of the silyl during the metadynamics simulation, su-perimposed to our simulation box. A series of snapshots taken alongthe trajectory are reported below. Only the relevant part of the box,highlighted with a thick line, is drawn. Along the path one wit-nesses the intradimer diffusion, the decomposition into SiH2 andeventually into SiH; a movie of the complete trajectory is availableas additional material �Ref. 41�.
CERIOTTI et al. PHYSICAL REVIEW B 79, 165437 �2009�
165437-4

FIG. 3. �Color online� Synoptic scheme of the diffusion and decomposition pathways of SiH3 on the clean Si�100� surface. The different configurations are labeled as 3�m where the
number indicates that there are three H atoms of which m are bound to the silicon adatom; � labels different configurations with the same m. Configurations 3�m and 3��
m differ only becauseof the buckling state of the dimers. Energies �eV� with respect to a reference state �3a
3� are given for the local minima in rounded boxes. Energies of the transition states �with the samezero energy reference� are given above the arrows connecting two local minima. Energies corrected by ZPE and frequency prefactor �terahertz� in reaction rates �see text� are given insquared boxes for selected local minima and reactions. The reference of energy is again the state �3a
3� also with ZPE correction. Reaction energies are obtained as energy difference betweenthe local minima, while activation energies for reactions are obtained as energy differences of transition and initial state.
AB
INIT
IOST
UD
YO
FT
HE
DIFFU
SION
AN
D…
PHY
SICA
LR
EV
IEW
B79,
165437�2009�
165437-5
1. Diffusion and decomposition of SiH3
In its most stable adsorption configuration, SiH3 �Refs. 44and 45� is bound to one of the silicon atoms of a surfacedimer �structure 3a
3�. The difference in energy that resultsfrom the buckling of nearby dimers is less than 10 meV, andthe activation energy for jumping between the two atoms ofthe same dimer is 0.94 eV �3a
3→3a�3 �. To diffuse along the
dimer row �3a3→3a�
3 � a barrier of 1.37 eV must be overcome.Diffusion of silyl is pre-empted by decomposition �SiH3→SiH2+H�, through competitive channels with barriers inthe 0.8–1.0 eV range, i.e., pathways 3a
3→3b2, 3a
3→3c2→3b
2,3a
3→3d2→3a
2 �cf. Fig. 3�. The intrarow configuration of SiH2in the presence of the extra H atom �3a
2�, is 0.10 eV morestable than the on-dimer structure �3b
2�, in agreement withprevious theoretical results.46 Conversely, on the clean sur-face the relative stability of the corresponding configurations�2b
2 and 2a2 in Fig. 5� is reversed, the on dimer being 0.17 eV
more stable than the intrarow.47,48 The lowest energy barrierwe found is 0.84 eV, for the 3a
3→3d2 reaction, which is fur-
ther lowered to 0.77 eV when ZPE corrections are taken intoaccount. The intermediate 3d
2 can then evolve to the morestable 3a
2 or 3e2 structures.
We can estimate the average lifetime of an SiH3 withintransition state theory, −1=�� exp�−�E /kBT�, by choosingfor the activation energy and frequency prefactor the calcu-lated values �E=0.8 eV and ��=0.5 THz �cf. Fig. 3�. Theresulting lifetime is �48 s, which is compatible with thelifetime of few minutes measured by STM �Refs. 14 and 15�and SIMS.10 Although theoretical and experimental lifetimes
are similar, barriers and prefactors computed from SIMS dataare anomalously low ��0.1 eV and �1 Hz, respectively�. Ithas been proposed that the low activation energy for decom-position might be related to preferential adsorption of silaneat surface defects.15 Moreover, activation energy measuredfrom SIMS data seems to depend on the type of precursor�0.1 eV for SiH4, and 0.27 eV for disilane10�. That said, STMmeasurements report similar decomposition rates due to pro-cesses occurring on a flat, defectless surface. Our results sug-gest that decomposition of SiH3 can indeed take place on aclean terrace, with a lifetime on the order of minutes, andwith prefactors compatible with the values generally ob-served for similar simple surface reactions. The activationenergies for decomposition according to the 3a
3→3a2 and 3a
3
→3b2 pathways had previously been computed within a simi-
lar DFT framework by Lim et al.,22 who found the values1.12 and 1.34 eV, respectively, as opposed to our values of0.84 and 0.99 eV. An overestimation of the activation barri-ers is expected due to the use of a scheme for MEP optimi-zation which is less reliable than the NEB method used here.Actually, the intermediate state 3d
3 along the 3a3→3a
2 decom-position channel is not found in Ref. 22.
In short, our results support the picture in which SiH3does not diffuse on the clean surface, but readily decomposesinto SiH2 at room temperature.
2. Decomposition of SiH2
SiH2 is not stable in configurations 3b2 and 3a
2 as the barrierfor decomposition according to SiH2→SiH+H, via one of
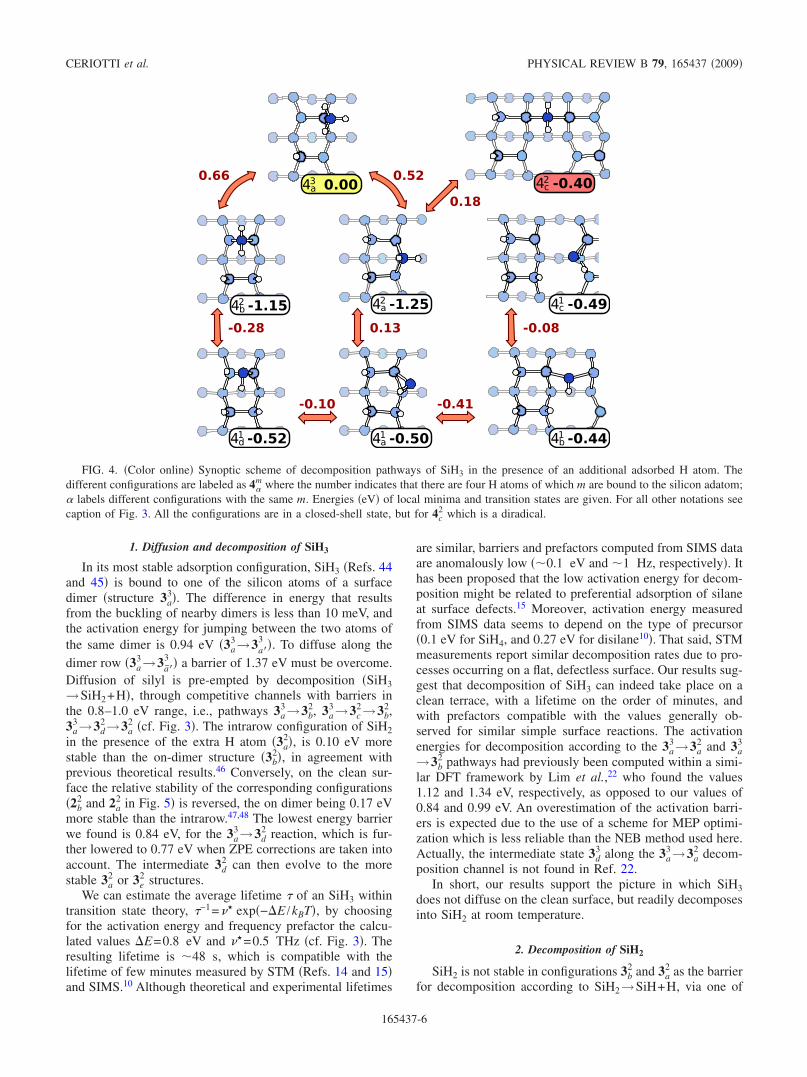
FIG. 4. �Color online� Synoptic scheme of decomposition pathways of SiH3 in the presence of an additional adsorbed H atom. Thedifferent configurations are labeled as 4�
m where the number indicates that there are four H atoms of which m are bound to the silicon adatom;� labels different configurations with the same m. Energies �eV� of local minima and transition states are given. For all other notations seecaption of Fig. 3. All the configurations are in a closed-shell state, but for 4c
2 which is a diradical.
CERIOTTI et al. PHYSICAL REVIEW B 79, 165437 �2009�
165437-6
the channels 3b2→3a
1, 3a2→3c
1→3b1, or 3a
2→3c1→3e
1, is com-parable to the barrier for decomposition of SiH3 into SiH2.This further decomposition step is facilitated by the presenceof the additional hydrogen atom bound to the nearby dimer.In the absence of this additional H atom, the activation en-ergies rise to 1.0 eV along the pathways 2a
2→2c1 and 2a
2
→2b2→2c
1 �cf. Fig. 5�. The resulting adsorbed SiH can thenreach the trap state 2a
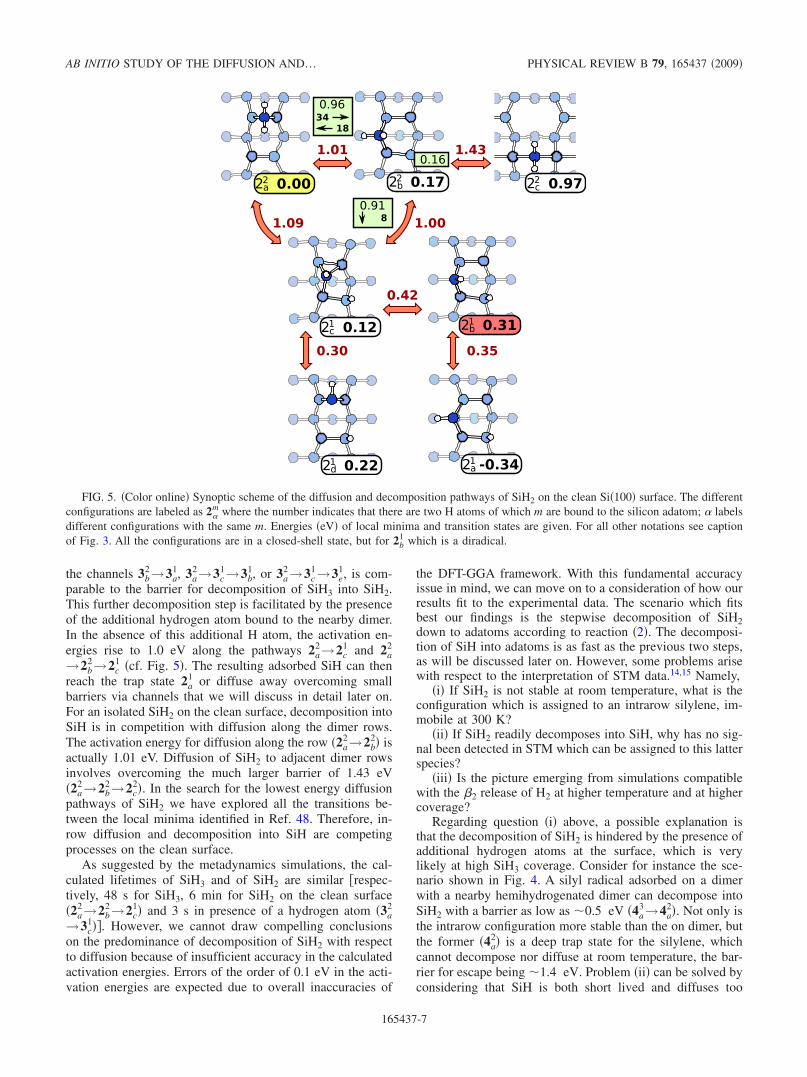
1 or diffuse away overcoming smallbarriers via channels that we will discuss in detail later on.For an isolated SiH2 on the clean surface, decomposition intoSiH is in competition with diffusion along the dimer rows.The activation energy for diffusion along the row �2a
2→2b2� is
actually 1.01 eV. Diffusion of SiH2 to adjacent dimer rowsinvolves overcoming the much larger barrier of 1.43 eV�2a
2→2b2→2c
2�. In the search for the lowest energy diffusionpathways of SiH2 we have explored all the transitions be-tween the local minima identified in Ref. 48. Therefore, in-row diffusion and decomposition into SiH are competingprocesses on the clean surface.
As suggested by the metadynamics simulations, the cal-culated lifetimes of SiH3 and of SiH2 are similar �respec-tively, 48 s for SiH3, 6 min for SiH2 on the clean surface�2a
2→2b2→2c
1� and 3 s in presence of a hydrogen atom �3a2
→3c1��. However, we cannot draw compelling conclusions
on the predominance of decomposition of SiH2 with respectto diffusion because of insufficient accuracy in the calculatedactivation energies. Errors of the order of 0.1 eV in the acti-vation energies are expected due to overall inaccuracies of
the DFT-GGA framework. With this fundamental accuracyissue in mind, we can move on to a consideration of how ourresults fit to the experimental data. The scenario which fitsbest our findings is the stepwise decomposition of SiH2down to adatoms according to reaction �2�. The decomposi-tion of SiH into adatoms is as fast as the previous two steps,as will be discussed later on. However, some problems arisewith respect to the interpretation of STM data.14,15 Namely,
�i� If SiH2 is not stable at room temperature, what is theconfiguration which is assigned to an intrarow silylene, im-mobile at 300 K?
�ii� If SiH2 readily decomposes into SiH, why has no sig-nal been detected in STM which can be assigned to this latterspecies?
�iii� Is the picture emerging from simulations compatiblewith the �2 release of H2 at higher temperature and at highercoverage?
Regarding question �i� above, a possible explanation isthat the decomposition of SiH2 is hindered by the presence ofadditional hydrogen atoms at the surface, which is verylikely at high SiH3 coverage. Consider for instance the sce-nario shown in Fig. 4. A silyl radical adsorbed on a dimerwith a nearby hemihydrogenated dimer can decompose intoSiH2 with a barrier as low as �0.5 eV �4a
3→4a2�. Not only is
the intrarow configuration more stable than the on dimer, butthe former �4a
2� is a deep trap state for the silylene, whichcannot decompose nor diffuse at room temperature, the bar-rier for escape being �1.4 eV. Problem �ii� can be solved byconsidering that SiH is both short lived and diffuses too
FIG. 5. �Color online� Synoptic scheme of the diffusion and decomposition pathways of SiH2 on the clean Si�100� surface. The differentconfigurations are labeled as 2�
m where the number indicates that there are two H atoms of which m are bound to the silicon adatom; � labelsdifferent configurations with the same m. Energies �eV� of local minima and transition states are given. For all other notations see captionof Fig. 3. All the configurations are in a closed-shell state, but for 2b
1 which is a diradical.
AB INITIO STUDY OF THE DIFFUSION AND… PHYSICAL REVIEW B 79, 165437 �2009�
165437-7
quickly to be detected in a fixed configuration by STM mea-surements as we will discuss below.
Concerning question �iii� on the H2 release observed athigh temperature ��650 K �Ref. 10��, we recall that the �2peak in TPD, assigned to reaction �3�, is observed at highcoverage �high dose of silane or disilane precursor�. Underthese conditions the hydrogen coverage is expected to behigh and the fully hydrogenated SiH2 intrarow configuration�4a
2� might be seen as a silicon adatom on a �locally� hydro-genated Si�100�-2�1 surface. It is known49,50 that such anadatom can diffuse along the rows with an activation energyof 1.4 eV, which would corresponds to a diffusion of silylenevia concerted hydrogens exchange. Once two SiH2 meet inconfiguration 4a
2, they could give rise to the �2-H2 releaseobserved in Ref. 10. Such a channel for silylene diffusion onfully hydrogenated surface would be viable at temperatureshigh enough for the experimental �2 activation barrier �1.87eV� �Ref. 51� to be overcome. Two theoretical estimates areavailable at present for the barrier to this reaction. The first islower than the experimental value �1.45 eV �Ref. 52��, whichis probably due to the use of the simple DFT-LDA functionalwhich usually underestimates activation energies. The sec-ond �2.32 eV �Ref. 21�� is higher, and corresponds to a dif-ferent process, which involves two on-dimer SiH2, and re-sults in a different configuration than the experimentallyobserved nonrotated monohydrogenated �NRMH� dimer.52
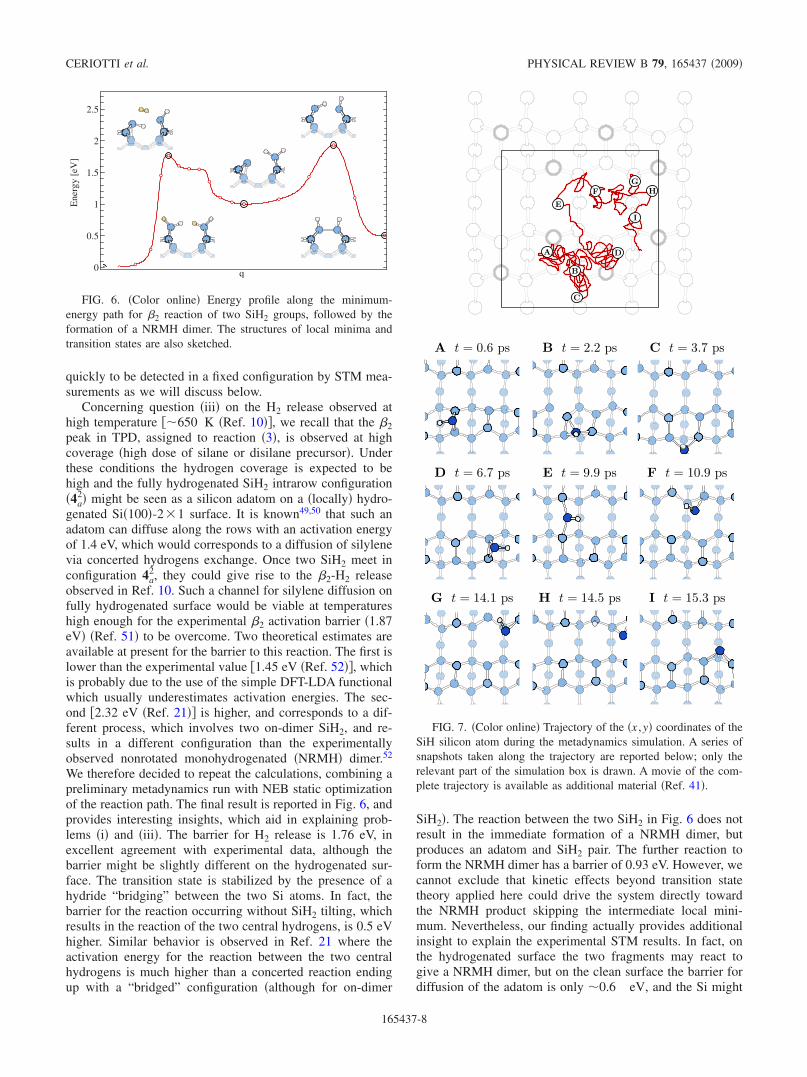
We therefore decided to repeat the calculations, combining apreliminary metadynamics run with NEB static optimizationof the reaction path. The final result is reported in Fig. 6, andprovides interesting insights, which aid in explaining prob-lems �i� and �iii�. The barrier for H2 release is 1.76 eV, inexcellent agreement with experimental data, although thebarrier might be slightly different on the hydrogenated sur-face. The transition state is stabilized by the presence of ahydride “bridging” between the two Si atoms. In fact, thebarrier for the reaction occurring without SiH2 tilting, whichresults in the reaction of the two central hydrogens, is 0.5 eVhigher. Similar behavior is observed in Ref. 21 where theactivation energy for the reaction between the two centralhydrogens is much higher than a concerted reaction endingup with a “bridged” configuration �although for on-dimer
SiH2�. The reaction between the two SiH2 in Fig. 6 does notresult in the immediate formation of a NRMH dimer, butproduces an adatom and SiH2 pair. The further reaction toform the NRMH dimer has a barrier of 0.93 eV. However, wecannot exclude that kinetic effects beyond transition statetheory applied here could drive the system directly towardthe NRMH product skipping the intermediate local mini-mum. Nevertheless, our finding actually provides additionalinsight to explain the experimental STM results. In fact, onthe hydrogenated surface the two fragments may react togive a NRMH dimer, but on the clean surface the barrier fordiffusion of the adatom is only �0.6 eV, and the Si might
q0
0.5
1
1.5
2
2.5
Ene
rgy�e
V�
FIG. 6. �Color online� Energy profile along the minimum-energy path for �2 reaction of two SiH2 groups, followed by theformation of a NRMH dimer. The structures of local minima andtransition states are also sketched.
FIG. 7. �Color online� Trajectory of the �x ,y� coordinates of theSiH silicon atom during the metadynamics simulation. A series ofsnapshots taken along the trajectory are reported below; only therelevant part of the simulation box is drawn. A movie of the com-plete trajectory is available as additional material �Ref. 41�.
CERIOTTI et al. PHYSICAL REVIEW B 79, 165437 �2009�
165437-8

diffuse away before reacting. Then we speculate that NRMHdimers observed by STM at low coverage might not be thedirect result of �2 reaction of two SiH2, but of the reaction ofan SiH2 trapped in configuration 4a
2 and of an adatom wan-dering along the adjacent dimer row, produced from the com-plete dehydrogenation of another radical �see also Sec.III B 3�. Moreover, we found that two nearby SiH2 are 0.16eV higher in energy than when far away from each other.This is easy to understand in terms of steric hindrance be-tween the hydrides. Even at 450 K, simple statistical consid-erations suggest that the probability of finding one such apair is as low as 1%, which is lowered further if one takesinto account configurational entropy at low coverage. Thisscenario also fits better the evidence of NRMH formation at470 K, a temperature sizably lower than the TPD peak at 670K assigned to the �2 process �with an experimental activa-tion energy of 1.87 eV�. The �2 reaction of Fig. 6 still takesplace at high coverage when adatoms diffuse on the hydro-genated surface as discussed previously.
In short, our calculations suggest that the picture of a SiH2diffusing intact on the surface at low coverage must be re-vised, because the lifetime of silylene is similar to that ofSiH3 due to decomposition into SiH and then into Si and H�see Sec. III B 3�. On the clean surface competitive channelsexist for SiH2 diffusion and decomposition, but SiH2 is stableat room temperature once bound to two hemihydrateddimers. This latter configuration might arise from the decom-position of the silyl radical in the presence of a hemihydrateddimer.
3. Diffusion and decomposition of SiH
In order to achieve a better understanding of the behaviorof a SiH radical on the clean surface we have performed anin-depth analysis. First, we have performed a metadynamicsrun starting from the on-dimer configuration �1a
1, cf. panel Aof Fig. 7�, and using the collective variables and parameterswe used for SiH3 �cf. Sec. II�. In the time span of 16 ps, theSiH group diffuses along the dimer row �panels A–D�, jumpsonto the adjacent row �panels E–G� and eventually decom-poses into an adsorbed hydrogen and a Si adatom. The tra-jectory in CV space is sketched in the upper panel of Fig. 7.Local minima observed along the trajectories and few othersare reported in Fig. 8. The diffusion of SiH along the dimerrow takes place via the path 1a
1→1d�1 →1
d
1→1a1 with an over-
all barrier of 0.43 eV. To diffuse to an adjacent row the
FIG. 8. �Color online� Synoptic scheme of the diffusion and decomposition pathways of SiH on the clean Si�100� surface. The differentconfigurations are labeled as 1�
m where the number indicates that there is one H atom bound �m=1� or unbound �m=0� to the silicon adatom;� labels different configurations with the same m. Energies �eV� of local minima and transition states are given. For all other notations seecaption of Fig. 3.
�a� �b�
FIG. 9. �Color online� Hydrogenated dimers obtained by barri-erless reaction of two SiH fragments: �a� an “on-channel” dimer,obtained from 1c
1 configuration, and b� an “on-row” dimer, obtainedfrom 1a
1 configuration.
AB INITIO STUDY OF THE DIFFUSION AND… PHYSICAL REVIEW B 79, 165437 �2009�
165437-9
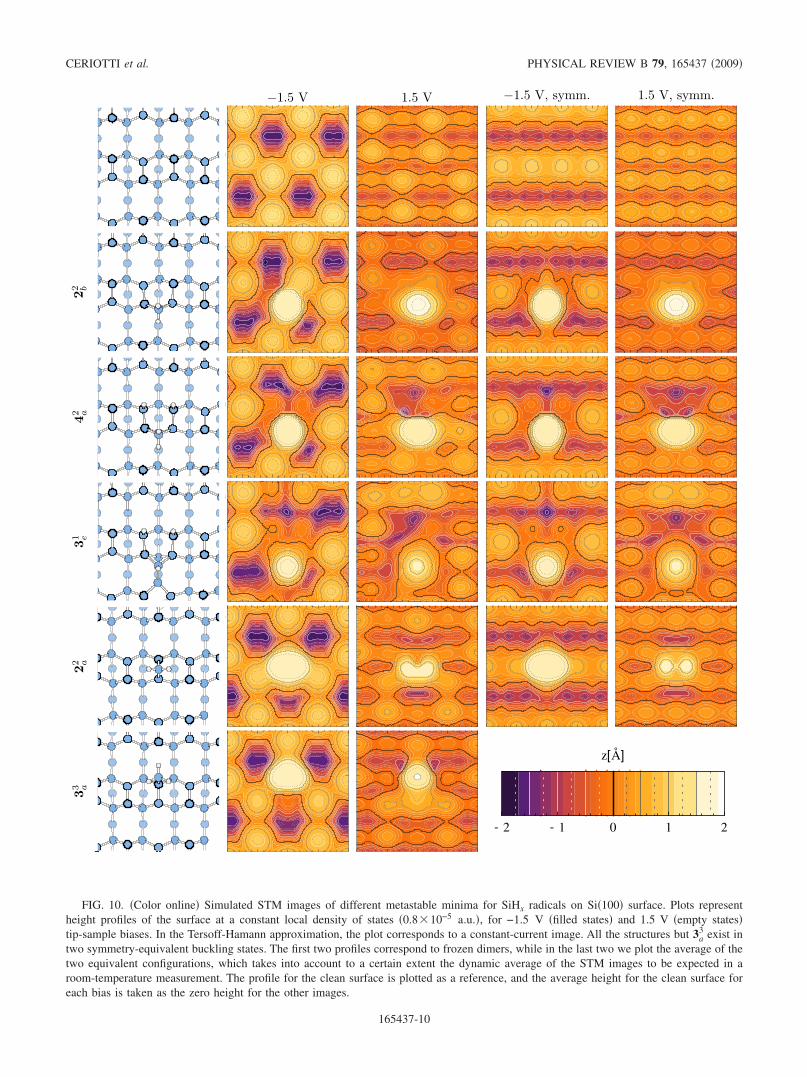
FIG. 10. �Color online� Simulated STM images of different metastable minima for SiHx radicals on Si�100� surface. Plots representheight profiles of the surface at a constant local density of states �0.8�10−5 a.u.�, for −1.5 V �filled states� and 1.5 V �empty states�tip-sample biases. In the Tersoff-Hamann approximation, the plot corresponds to a constant-current image. All the structures but 3a
3 exist intwo symmetry-equivalent buckling states. The first two profiles correspond to frozen dimers, while in the last two we plot the average of thetwo equivalent configurations, which takes into account to a certain extent the dynamic average of the STM images to be expected in aroom-temperature measurement. The profile for the clean surface is plotted as a reference, and the average height for the clean surface foreach bias is taken as the zero height for the other images.
CERIOTTI et al. PHYSICAL REVIEW B 79, 165437 �2009�
165437-10

activation barrier is instead as high as 1 eV �via 1c1→1 f
1�.From configuration 1d�
1 , SiH can move to the �shallow� trapstate 1b
1 or decompose into Si and H adatoms �via 1d�1 →1c
1
→1g1→1a
0→1b0� with an activation energy of 0.45 eV. By
using a frequency prefactor of 0.5 THz and an activationenergy of 0.43 eV, we obtain a jump rate at room temperatureof 33 kHz which is too high for SiH to be seen in STM, atleast in 1994 when the latest measurements on this systemhave been made.15 Therefore, either SiH moves or decom-poses too fast on the clean surface to be detected by STM.However, we have also identified a trap state for SiH in thepresence of additional H atoms. In fact, in configuration 3e
1
produced by a stepwise decomposition �reactions �1� and�2��, detrapping of SiH and decomposition into adatoms re-quires overcoming an activation barrier of 0.92 eV �via 3e
1
→3c1→3d
1→ . . . →3d0�. This trap state for SiH is expected to
be as long lived as the SiH3 and SiH2 precursors on the cleansurface �i.e., with a life time of minutes�. Structures 3e
1 and4a
2 both have the correct symmetry to produce an STM imagesimilar to that recorded in experiments and assigned to anSiH2 group, as we will discuss in more detail in Sec. IV.
We would also like to mention that SiH diffusion offersanother scenario for the formation of monohydride dimers�H-Si-Si-H� at room temperature. As shown in Fig. 9 twoSiH can react in configuration 1c
1 on adjacent dimer rows,giving rise to a NRMH dimer, or in configuration 1a
1 on thesame row, the “on-row” configuration being �0.9 eV morestable than the “on-channel” one. Both reaction pathways arebarrierless.
At low H coverage the decomposition of SiH3 down tomobile silicon adatom and adsorbed hydrogen would alsolead to the formation of Si-Si ad-dimers, once two adatomscome close. The barriers for adatom diffusion on cleanSi�100� are on the order of 0.6 eV along the dimer rows, andof 1.0 eV in the perpendicular direction.53 In this scenario,ad-dimers can form directly from adatoms, and not necessar-ily from hydrogenated or monohydrogenated dimers, whichwould be produced from the reaction of two SiH or SiH2.
Finally we remark that all the individual decompositionreactions SiH3→SiH2+H, SiH2→SiH+H, and SiH→Si+H are exothermic. The overall energy gain in the full de-composition of the silyl into Si and H adatoms depends onthe final positions of the H atoms, but it is at most of theorder of 1.5 eV �3c
0�, a value much lower than the roughestimate of 3.8 eV for the full decomposition of SiH2 givenin Ref. 10 on the basis of a bond-count argument.
IV. STM IMAGES
The adsorption geometry of SiH3 and SiH2 has been in-ferred experimentally from STM data.14,15 SiH3 appears as abright spot by imaging occupied electronic states �negativebias�. The STM image is consistent with the adsorption ge-ometry 3a
3. The adsorption geometry of SiH2 has been as-signed instead to the intradimer configuration 2b
2 on the basisof the symmetry of the image and of the location of theprotrusion detected at negative bias. However, it is not pos-sible to discriminate between configurations 2b
2 and 4a2, the
latter with SiH2 bound to hemihydrogenated dimers �cf. Figs.5 and 4�.
In Fig. 10 we report the calculated STM images for dif-ferent configurations at negative �occupied states� and posi-tive �empty states� biases. In the spirit of the Tersoff andHamann54 approximation, we assume the tunneling currentto be proportional to the local density of states �LDOS�, in-tegrating the contributions from the states in an energy win-dow above or below the Fermi energy as dictated by the biaspotential. The images correspond to the surface topographyat constant current, computed as a surface at constant LDOS.We have verified that the energy cutoff and the vacuum spac-ing are large enough to guarantee an exponentially decreasein the LDOS up to �5 Å from the surface, whereas theisodensity surface we plot lies typically at �4 Å from theunderlying surface atoms.
The STM images of the configurations of SiH2 bound toclean or hemihydrogenated dimers �2b
2 and 4a2� are indeed
very similar at both positive and negative bias. Moreover,they are also similar to the STM image of the configurationof SiH bound to hemihydrogenated dimers �the trap state 3e
1,Fig. 3�. Since, as discussed in Sec. III, configuration 4a
2 sur-vives long enough at normal conditions, while configurations2b
2 and 3e1 do not, we propose that the geometry seen in STM
is actually the former. Note that all configurations 2b2, 4a
2, and3e
1 appear as a protrusion in the theoretical STM images atboth positive and negative bias, while the experimental STMimage �assigned in the experimental papers to 2b
2� is reportedin Ref. 15 �but not in the previous work14� to appear as aprotrusion at negative voltage, but as a depression at positivevoltage. The reasons for these discrepancies remain to beseen. For sake of comparison, we also report in Fig. 10 thecalculated STM images of the adsorbed SiH3, of SiH2 in theon-dimer configuration and of the clean surface.
V. CONCLUSIONS
In summary, we have performed an extensive search fordiffusion and decomposition pathways of SiHx species on theclean Si�100� surface aiming at interpreting the experimentaldata on Si�100� at very low coverage. Activation energies fordifferent reaction channels have been refined by NEB opti-mization of the minimum-energy paths. All the results pointto the conclusion that at room temperature SiH3 fully decom-poses on the clean surface down to Si and H adatoms�SiH3→SiH2+H→SiH+2H→Si+3H� in agreement withthe scenario inferred from SIMS, TPD, and modulated beammass spectroscopy data.10,16,20 The activation energy and fre-quency prefactor �within harmonic transition state theory� forSiH3 decomposition into SiH2 are 0.8 eV and 0.5 THz, re-spectively, which provide a theoretical lifetime �48 s� closeto experimental SIMS and STM data �few minutes�. TheSiH2 product has a lifetime similar to that of SiH3 due todecomposition into SiH. Diffusion and decomposition arecompetitive channels for SiH2 on the clean surface withsimilar activation energy �1.0 eV�. The SiH intermediate canalso diffuse very fast or decompose into adatoms with acti-vation energies sufficiently low �0.4 or 0.5 eV, respectively�to prevent its identification by STM at room temperature.
AB INITIO STUDY OF THE DIFFUSION AND… PHYSICAL REVIEW B 79, 165437 �2009�
165437-11

SiH3 adsorbed nearby a hemihydrogenated dimer can de-compose even faster �Ea=0.5 eV� into SiH2 bridging twohemihydrogenated dimers. This latter species has a longerlifetime than other SiHx configurations, the barrier for escap-ing or decomposing being as large as 1.4 eV. Based on cal-culated lifetimes and STM images, we propose that the latterspecies can be identified with the structure seen experimen-tally by STM and previously assigned to SiH2 bridging twoclean dimers.14,15 Overall, the simulations revealed a com-plex scenario with very many competitive channels for dif-fusion and decompositions of SiHx on the clean Si�100� sur-face. These results complement our previous works on thebehavior of adsorbed SiHx species at the opposite limit of afully hydrogenated H:Si�100�-2�1 surface.33,34,50 In orderto perform a direct comparison with experiments at growthconditions, it would be necessary to investigate diffusion anddecomposition channels on a partially hydrogenated surface.To this aim additional calculations may be necessary, which
are left for future works. Provided with a complete databaseof reaction rates at intermediate H coverages, one might at-tempt kinetic Monte Carlo �KMC� simulations of the grow-ing surface under PECVD conditions along the lines outlinedin recent KMC simulations55 of the fully hydrogenated sur-face, which is based on the ab initio reaction rates obtainedin our previous works.33,34,50
ACKNOWLEDGMENTS
This work is partially supported by the Cariplo Founda-tion �SIMBAD project� and by European STREP ProjectNANOPHOTO. Computational resources have been pro-vided by CILEA and by CINECA through CNR-INFM-CNISM “Iniziativa Calcolo Parallelo 2006.” Discussionswith G. Isella and C. Cavallotti are gratefully acknowledged.We thank G. Tribello for reading the paper.
*Present address: Computational Science, Department of Chemistryand Applied Biosciences, ETH Zürich, USI Campus, ViaGiuseppe Buffi 13, CH-6900 Lugano, Switzerland;[email protected] T. J. Donahue and R. Reif, J. Appl. Phys. 57, 2757 �1985�.2 N. Yamauchi and R. Reif, J. Appl. Phys. 75, 3235 �1994�.3 S. Ramalingam, D. Maroudas, and E. S. Aydil, J. Appl. Phys. 86,
2872 �1999�.4 A. Matsuda, Jpn. J. Appl. Phys., Part 1 43, 7909 �2004�.5 D. Maroudas, Adv. Chem. Eng. 28, 251 �2001�.6 C. Cavallotti, M. Di Stanislao, and S. Carrà, Prog. Cryst. Growth
Charact. Mater. 48-49, 123 �2004�.7 C. Rosenblad, H. R. Deller, A. Dommann, T. Meyer, P. Scroeter,
and H. von Känel, J. Vac. Sci. Technol. A 16, 2785 �1998�.8 C. Rosenblad, T. Graf, J. Stangl, Y. Zhuang, G. Bauer, J.
Schulze, and H. von Känel, Thin Solid Films 336, 89 �1998�.9 H. Rauscher, Surf. Sci. Rep. 42, 207 �2001�.
10 S. M. Gates, C. M. Greenlief, and D. B. Beach, J. Chem. Phys.93, 7493 �1990�.
11 S. M. Gates, C. M. Greenlief, D. B. Beach, and P. A. Holbert, J.Chem. Phys. 92, 3144 �1990�.
12 S. M. Gates, C. M. Greenlief, S. K. Kulkarni, and H. H. Sawin,J. Vac. Sci. Technol. A 8, 2965 �1990�.
13 C. M. Greenlief, S. M. Gates, and P. A. Holbert, J. Vac. Sci.Technol. A 7, 1845 �1989�.
14 M. J. Bronikowski, Y. Wang, M. T. McEllistrem, and R. J. Ham-ers, Surf. Sci. 298, 50 �1993�.
15 Y. Wang, M. J. Bronikowski, and R. J. Hamers, Surf. Sci. 311,64 �1994�.
16 C. Lutterloh, M. Wickleinb, A. Dingerb, J. Bienera, and J. Küp-pers, Surf. Sci. 498, 123 �2002�.
17 S. Kulkarni, S. Gates, B. Scott, and H. Sawiri, Surf. Sci. 239, 13�1990�.
18 L. Q. Xia, M. E. Jones, N. Maity, and J. R. Engstrom, J. Chem.Phys. 103, 1691 �1995�.
19 J. Shi, E. S. Tok, and H. C. Kang, J. Chem. Phys. 127, 164713�2007�.
20 R. W. Price, E. S. Tok, and J. Zhang, Phys. Rev. B 59, R5292�1999�.
21 J. Ku Kang and C. B. Musgrave, Phys. Rev. B 64, 245330�2001�.
22 F. C. H. Lim, E. S. Tok, and H. C. Kang, Phys. Rev. B 74,205333 �2006�.
23 J. P. Perdew, K. Burke, and M. Ernzerhof, Phys. Rev. Lett. 77,3865 �1996�.
24 R. D. Smardon and G. P. Srivastava, J. Chem. Phys. 123,174703 �2005�.
25 M. Iannuzzi, A. Laio, and M. Parrinello, Phys. Rev. Lett. 90,238302 �2003�.
26 A. Laio, A. Rodriguez-Fortea, F. L. Gervasio, M. Ceccarelli, andM. Parrinello, J. Phys. Chem. B 109, 6714 �2005�.
27 G. Henkelman and H. Jónsson, J. Chem. Phys. 113, 9978�2000�.
28 P. Giannozzi et al., http://www.quantum-expresso.org.29 CPMD, Copyright IBM Corp 1990–2008, Copyright MPI für
Festkörperforschung Stuttgart 1997–2001, http://www.cpmd.org/.
30 R. Car and M. Parrinello, Phys. Rev. Lett. 55, 2471 �1985�.31 N. Troullier and J. L. Martins, Phys. Rev. B 43, 1993 �1991�.32 D. Vanderbilt, Phys. Rev. B 41, 7892 �1990�.33 M. Ceriotti and M. Bernasconi, Phys. Rev. B 76, 245309 �2007�.34 S. Cereda, M. Ceriotti, F. Montalenti, M. Bernasconi, and L.
Miglio, Phys. Rev. B 75, 235311 �2007�.35 Y. Okada and Y. Tokumaru, J. Appl. Phys. 56, 314 �1984�.36 A. Laio and M. Parrinello, Proc. Natl. Acad. Sci. U.S.A. 99,
12562 �2002�.37 A. Laio and F. L. Gervasio, Rep. Prog. Phys. 71, 126601 �2008�.38 W. G. Hoover, Phys. Rev. A 31, 1695 �1985�.39 G. J. Martyna, M. L. Klein, and M. Tuckerman, J. Chem. Phys.
97, 2635 �1992�.40 G. Henkelman, B. P. Uberuaga, and H. Jónsson, J. Chem. Phys.
113, 9901 �2000�.41 See EPAPS Document No. E-PRBMDO-79-026916 for a movie
of metadynamics trajectory, and a discussion of Brillouin-zone
CERIOTTI et al. PHYSICAL REVIEW B 79, 165437 �2009�
165437-12

sampling issues. For more information on EPAPS, seehttp://www.aip.org/pubservs/epaps.html.
42 G. Henkelman and H. Jónsson, J. Chem. Phys. 111, 7010 �1999�.43 G. S. Hwang, Surf. Sci. 465, L789 �2000�.44 A. Robinson Brown and D. J. Doren, J. Chem. Phys. 109, 2442
�1998�.45 S. P. Walch, S. Ramalingam, S. Sriraman, E. S. Aydil, and D.
Maroudas, Chem. Phys. Lett. 344, 249 �2001�.46 D. R. Bowler and C. M. Goringe, Surf. Sci. 360, L489 �1996�.47 S. Hong and M. Y. Chou, Phys. Rev. B 58, R13363 �1998�.48 S. Cereda, F. Montalenti, M. Cogoni, D. Branduardi, M. W.
Radny, P. V. Smith, and L. Miglio, Surf. Sci. 600, 4445 �2006�.
49 T. Hashizume, H. Kajiyama, Y. Suwa, S. Heike, S. Matsuura, J.Nara, and T. Ohno, Appl. Surf. Sci. 216, 15 �2003�.
50 S. Cereda, F. Zipoli, M. Bernasconi, L. Miglio, and F. Montal-enti, Phys. Rev. Lett. 100, 046105 �2008�.
51 P. Gupta, V. L. Colvin, and S. M. George, Phys. Rev. B 37, 8234�1988�.
52 J. H. G. Owen, K. Miki, D. R. Bowler, C. M. Goringe, I. Gold-farb, and G. A. D. Briggs, Surf. Sci. 394, 79 �1997�.
53 A. P. Smith, J. K. Wiggs, H. Jónsson, H. Yan, L. R. Corrales, P.Nachtigall, and K. D. Jordan, J. Chem. Phys. 102, 1044 �1995�.
54 J. Tersoff and D. R. Hamann, Phys. Rev. B 31, 805 �1985�.55 X. Tan and G. W. Yang, Appl. Phys. Lett. 93, 061902 �2008�.
AB INITIO STUDY OF THE DIFFUSION AND… PHYSICAL REVIEW B 79, 165437 �2009�
165437-13