aarti industries investor presentation - june...
TRANSCRIPT


Investor PresentationJune - 2017

Disclaimer
AARTI INDUSTRIES LIMITED may, from time to time, make additional written and oral
forward looking statements, including statements contained in the company's filings with Bombay
Stock Exchange and National Stock Exchange, and our reports to shareholders. The company does
not undertake to update any forward-looking statements that may be made from time to time by or
on behalf of the AARTI INDUSTRIES LIMITED.
All information contained in this presentation has been prepared solely by AARTI INDUSTRIES
LIMITED. AARTI INDUSTRIES LIMITED does not accept any liability whatsoever for any loss,
howsoever, arising from any use or reliance on this presentation or its contents or otherwise arising
in connection therewith.
2
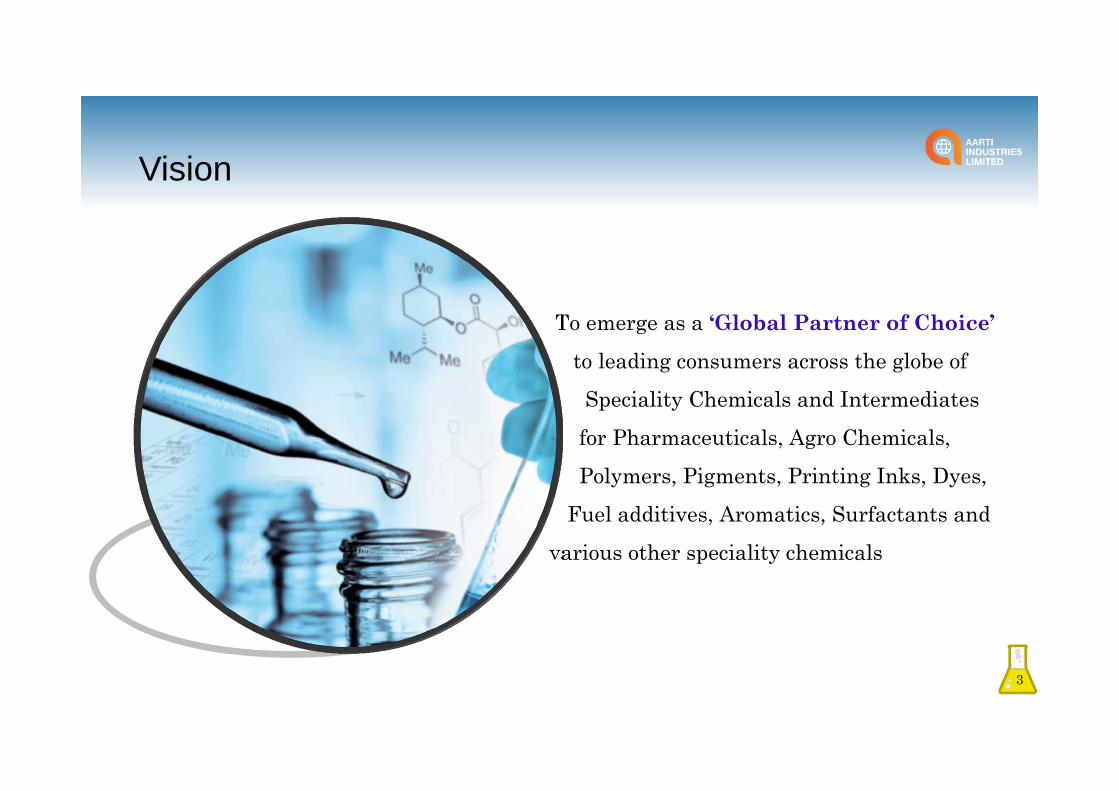
To emerge as a ‘Global Partner of Choice’
to leading consumers across the globe of
Speciality Chemicals and Intermediates
for Pharmaceuticals, Agro Chemicals,
Polymers, Pigments, Printing Inks, Dyes,
Fuel additives, Aromatics, Surfactants and
various other speciality chemicals
Vision
3
Profile
4
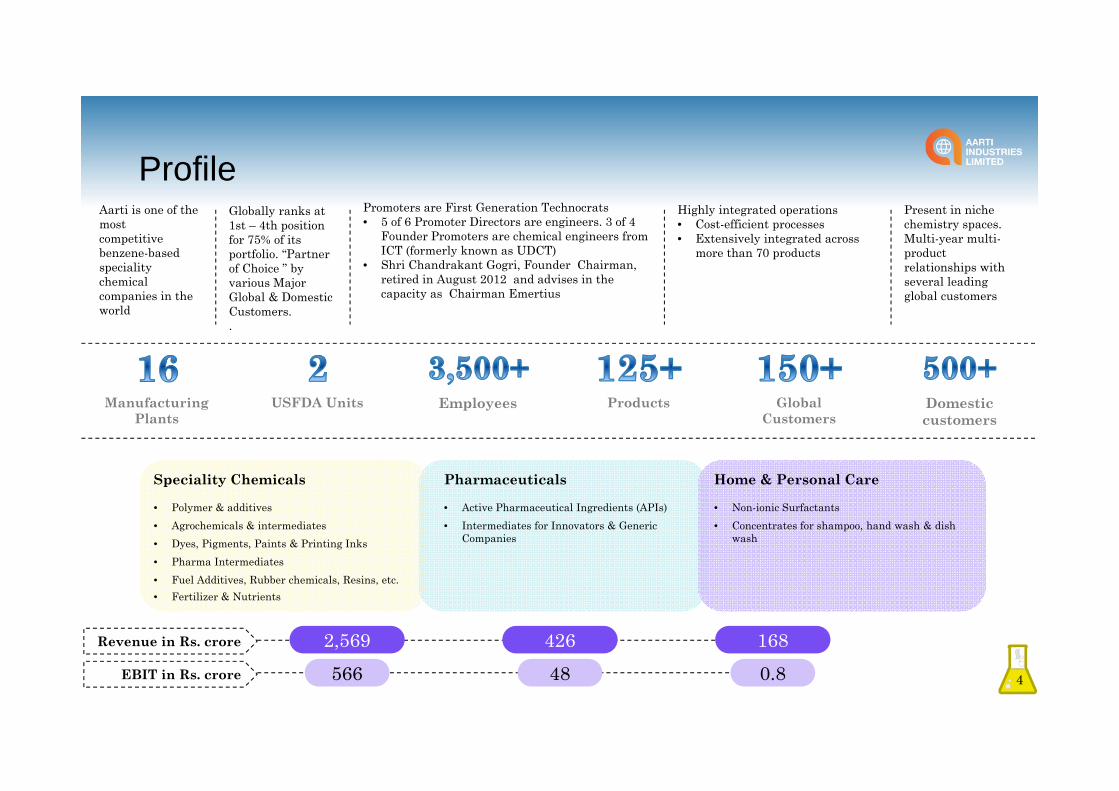
Highly integrated operations• Cost-efficient processes • Extensively integrated across
more than 70 products
Promoters are First Generation Technocrats • 5 of 6 Promoter Directors are engineers. 3 of 4
Founder Promoters are chemical engineers from ICT (formerly known as UDCT)
• Shri Chandrakant Gogri, Founder Chairman, retired in August 2012 and advises in the capacity as Chairman Emertius
Globally ranks at 1st – 4th position for 75% of its portfolio. “Partner of Choice ” by various Major Global & Domestic Customers. .
Aarti is one of the mostcompetitive benzene-based specialitychemical companies in the world
Present in niche chemistry spaces. Multi-year multi-product relationships with several leading global customers
Speciality Chemicals
• Polymer & additives• Agrochemicals & intermediates• Dyes, Pigments, Paints & Printing Inks• Pharma Intermediates• Fuel Additives, Rubber chemicals, Resins, etc.• Fertilizer & Nutrients
Pharmaceuticals
• Active Pharmaceutical Ingredients (APIs)• Intermediates for Innovators & Generic
Companies
Home & Personal Care
• Non-ionic Surfactants • Concentrates for shampoo, hand wash & dish
wash
USFDA Units Employees
1684262,569566 48 0.8
Revenue in Rs. crore
EBIT in Rs. crore
Manufacturing Plants
Global Customers
Domestic customers
Products

Transformation Journey
5
1984
Aarti Organics Pvt
Ltdincorporated
1986Commenced 1,200 TPA
Unit forNitro Chloro
Benzenes(NCB) in Sarigram, Gujarat
1990
Set up additionalunit at Vapi tomanufacture
NCB withcapacity of4,500 TPA
1992Public issue of8,70,000 equity
shares at a premium
of Rs.36 per share
1995Bonus issue
of equityshares (1:1)
2001• Commenced
production in Jhagadia.
• Pioneered hydrogenation process based on Swiss technology
2004Crossed Rs.500
cr in total income
1994
• Merged Salvigor Labs, producers of DMS and Sulphuric Acid and their downstream products into Aarti.
• Change of name from Aarti Organics Ltd to Aarti Industries Ltd.
1998
Set up Alchemie(Europe) Ltd. a
subsidiary in UKfor marketing
and distribution
2002
Merged Alchemie
Organics Ltd into Aarti
Industries Ltd
Hitting right milestones at right time
Transformation Journey
6
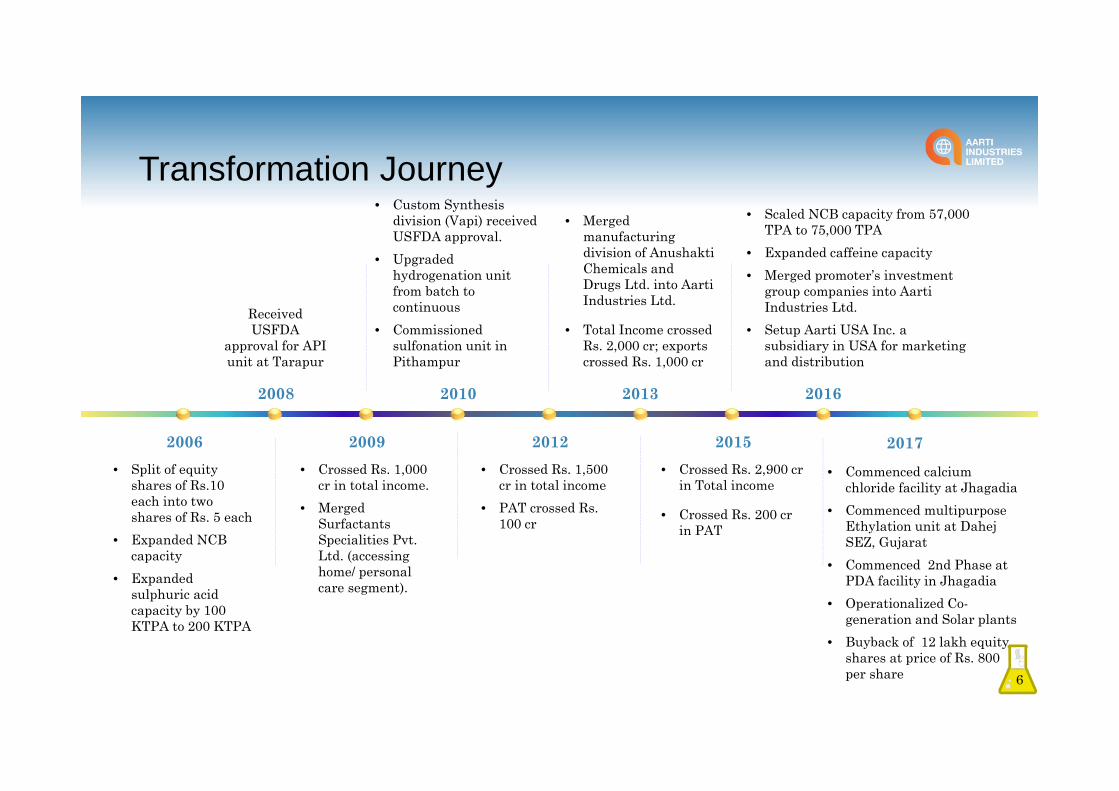
2006• Split of equity
shares of Rs.10 each into two shares of Rs. 5 each
• Expanded NCB capacity
• Expanded sulphuric acid capacity by 100 KTPA to 200 KTPA
2008
Received USFDA
approval for APIunit at Tarapur
2009• Crossed Rs. 1,000
cr in total income.• Merged
Surfactants Specialities Pvt. Ltd. (accessing home/ personal care segment).
2012• Crossed Rs. 1,500
cr in total income• PAT crossed Rs.
100 cr
2015• Crossed Rs. 2,900 cr
in Total income
• Crossed Rs. 200 crin PAT
2010
• Custom Synthesis division (Vapi) received USFDA approval.
• Upgraded hydrogenation unit from batch to continuous
• Commissioned sulfonation unit in Pithampur
2013
• Merged manufacturing division of AnushaktiChemicals and Drugs Ltd. into AartiIndustries Ltd.
• Total Income crossed Rs. 2,000 cr; exports crossed Rs. 1,000 cr
2016
• Scaled NCB capacity from 57,000 TPA to 75,000 TPA
• Expanded caffeine capacity• Merged promoter’s investment
group companies into AartiIndustries Ltd.
• Setup Aarti USA Inc. a subsidiary in USA for marketing and distribution
• Commenced calcium chloride facility at Jhagadia
• Commenced multipurpose Ethylation unit at DahejSEZ, Gujarat
• Commenced 2nd Phase at PDA facility in Jhagadia
• Operationalized Co-generation and Solar plants
• Buyback of 12 lakh equity shares at price of Rs. 800 per share
2017

We have selected to be present in niche chemistry spaces with relatively low competition
We are seamlessly backward integrated for precursor materials
We have global capacities & are better placed for scale-up
We have focused on the manufacture of integrated derivatives
What differentiates us
7
We have been engaged in multiyear relationships with a large number of leading global downstream customers
Most chemical companies seek to work with small global companies as a market-entry strategy
Most chemical companies select to be present in large spaces marked by extensive competition
Most chemical companies are completely dependent on external resource supplies
Most chemical companies focus on a fragmented standalone product mix
Most chemical companies serve local markets
Our product mix comprises more than 125 research-led products
Most chemical companies focus on a handful of products
We have selected to focus on customers across continents
Most chemical companies do not have a diversified geographic mix

Global Partner of Choice
8
Aarti Industries is a rare instance of a global speciality chemicals company that combines process chemistry competence with scale-up engineering competence
Product innovation aligned to customer’s
future growth
Capex scale synched to customer expansion objectives
Multiproduct, multi-year
relationship • >80% of FY16
revenues from 5+ yrscustomers
• Growth across all customers
Committed to SH & E
• Invested >Rs. 200 cr in last 5 yrs
• 4 Zero Discharge units
• Reduce-Reuse-Recover
Our business
model complem-ents that
of our global
customers
Transform from
Make-to-stock to robust Make-to-order
Vendor servicing to Partner of Choice

People Connect
Polymer and additives: Our products
are used in aircrafts, automobiles, cruise
Liners, electro-static precipitators, bullet-
proof jackets, electronic gadgets and
various other applications. |
Agrochemicals and intermediates:
Our products find use in pesticides,
insecticides, fungicides, herbicides,
fertilizers, nutrients, etc. | Dyes,
pigments, paints and printing inks |
Pharma intermediates| Fuel
additives | Rubber chemicals, etc.9
Speciality Chemicals
Though we are a B2B Company, our products touch people in various ways in their everyday lives

People Connect
Active Pharmaceutical Ingredients: Intermediates
for innovators and generic companies | Our products
are used in anticancer, anti-asthma and anti-
hypertensive drugs as well as oncology therapies and
steroids, etc.
10
Pharmaceuticals
Though we are a B2B Company, our products touch people in various ways in their everyday lives
Non-ionic surfactants: Concentrates for shampoo,
hand wash, dish wash, oral care, etc.
Home and Personal Care Chemicals

Aarti’s esteemed Customer list includes Leading Multinationals and Global GiantsAarti’s has a marketing & distribution subsidiary in US and UK
Global presence – Exports by geography
11
America 28% China
16%
Japan 10%
Europe 25%
Rest of the
World 21%
50% of revenue coming from global markets, and the number is expected to increase

Speciality Chemicals – Major Customers
12
• Diversified customer base – 150+ export customers & 500+ domestic customers• Customers spread across the globe in 60 countries with major presence in USA, Europe, Japan & India
Agro Intermediates & Fertiliser
20-25% of revenues
Polymer & Additives
15-20% of revenues

Speciality Chemicals – Major Customers
13
Pharmaceuticals & Other Speciality Chemicals
15-20% of revenues
Pigments, Paints, Printing Inks, Dyes
15-20% of revenues
Other Speciality Chemicals include fuel additives, Oil extraction, Rubber chemicals, Optical brighteners, UV absorbers and FMCG
Industry Accreditation for Exports
14
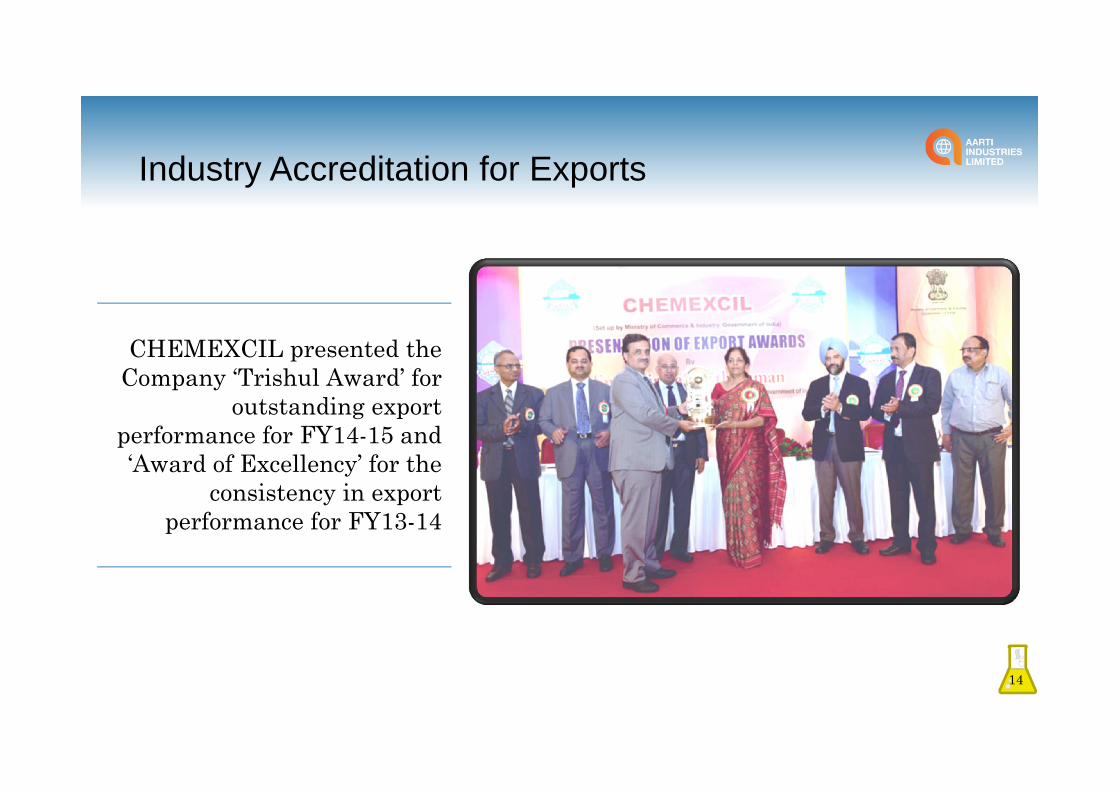
CHEMEXCIL presented the Company ‘Trishul Award’ for
outstanding export performance for FY14-15 and ‘Award of Excellency’ for the
consistency in export performance for FY13-14
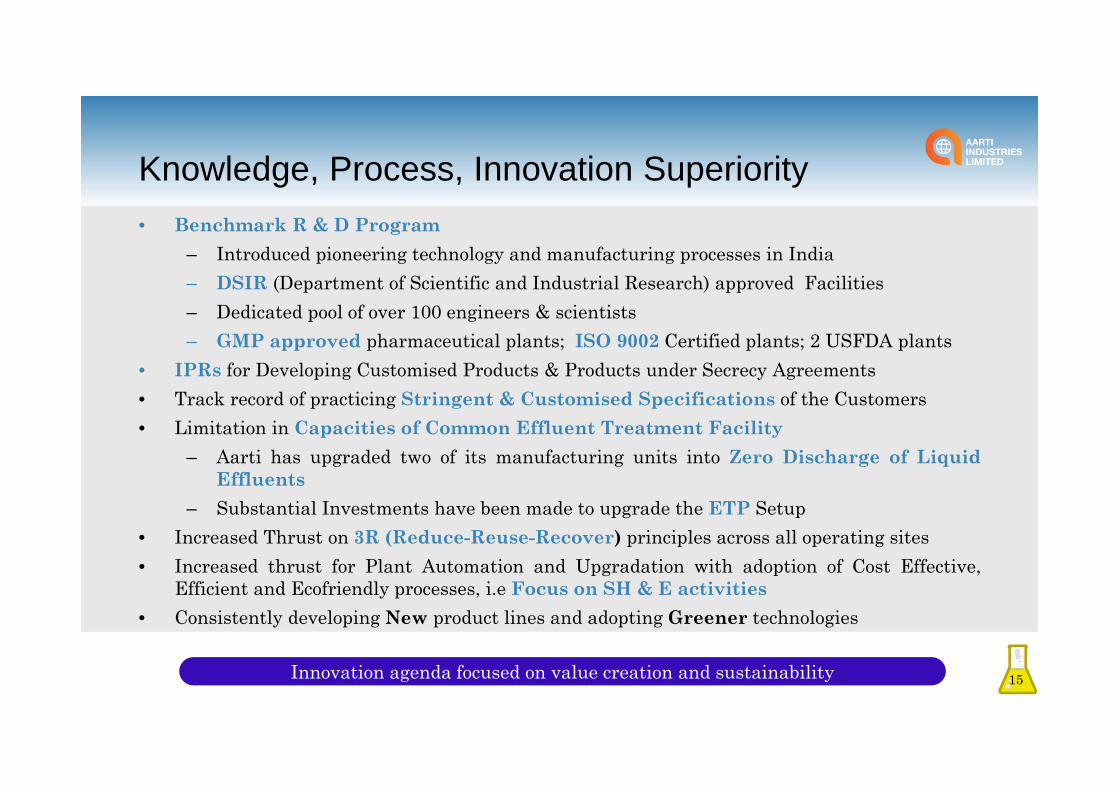
Knowledge, Process, Innovation Superiority• Benchmark R & D Program
– Introduced pioneering technology and manufacturing processes in India– DSIR (Department of Scientific and Industrial Research) approved Facilities– Dedicated pool of over 100 engineers & scientists– GMP approved pharmaceutical plants; ISO 9002 Certified plants; 2 USFDA plants
• IPRs for Developing Customised Products & Products under Secrecy Agreements• Track record of practicing Stringent & Customised Specifications of the Customers• Limitation in Capacities of Common Effluent Treatment Facility
– Aarti has upgraded two of its manufacturing units into Zero Discharge of LiquidEffluents
– Substantial Investments have been made to upgrade the ETP Setup• Increased Thrust on 3R (Reduce-Reuse-Recover) principles across all operating sites• Increased thrust for Plant Automation and Upgradation with adoption of Cost Effective,
Efficient and Ecofriendly processes, i.e Focus on SH & E activities• Consistently developing New product lines and adopting Greener technologies
15Innovation agenda focused on value creation and sustainability
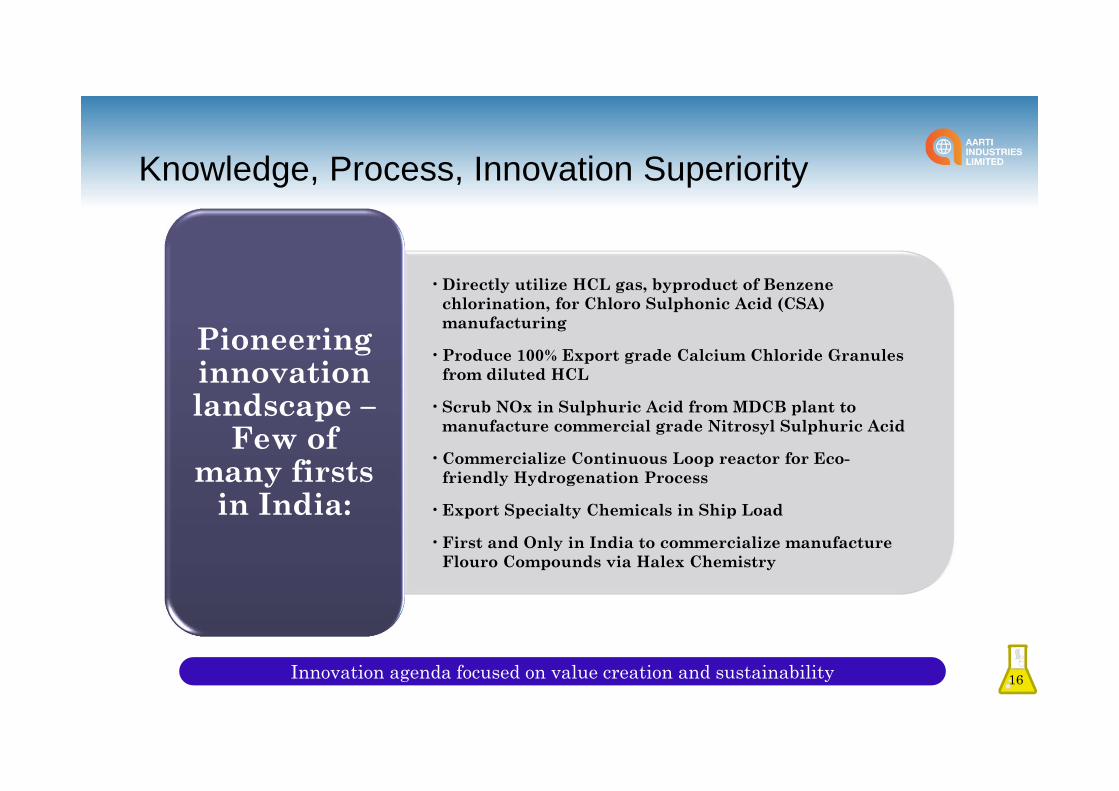
Knowledge, Process, Innovation Superiority
• Directly utilize HCL gas, byproduct of Benzene chlorination, for Chloro Sulphonic Acid (CSA) manufacturing
• Produce 100% Export grade Calcium Chloride Granules from diluted HCL
• Scrub NOx in Sulphuric Acid from MDCB plant to manufacture commercial grade Nitrosyl Sulphuric Acid
• Commercialize Continuous Loop reactor for Eco-friendly Hydrogenation Process
• Export Specialty Chemicals in Ship Load
• First and Only in India to commercialize manufacture Flouro Compounds via Halex Chemistry
Pioneering innovation landscape –
Few of many firsts
in India:
16Innovation agenda focused on value creation and sustainability

Industry Accreditation for Innovation
17
In recognition of outstanding achievements, the Indian Institute of Chemical Engineers bestowed the prestigious Lala Shriram National Award for
“Leadership in Chemical Industry“ to our Chairman Emeritus and founder Shri Chandrakant V. Gogri.
CHEMTECH Foundation accorded Aarti Industries with the ‘Outstanding Achievement for Innovation’
award for the company’s commendable efforts in conserving the environments as well as ensuring
sustainable growth through path breaking innovation.

Manufacturing Facilities
HEAD OFFICE - MUMBAI
PRODUCTION SITESMaharashtra
Madhya PradeshGujaratPithampur
Tarapur
DombivaliMumbai
Bhachau, Kutch
JhagadiaDahejSarigam
VapiSilvassa
INDIA
18
16manufacturing units

Manufacturing Facilities
19
PDA Facility, Jhagadia
Zero Discharge Setup, Jhagadia
R&D Centre
Section of Jhagadia Unit

Pharma Units
20
USFDA Unit, Tarapur
Section of USFDA Plant, Tarapur Section of USFDA Plant, Tarapur

Management Profile
21
Driving a transformational enterprise - hitting the right milestones at the right juncture
Nurtured into a globally leading company in core products
Established track record of execution where returns have improved with growing capex
Pushing innovation agenda – introducing high value products and pioneering technologies, thereby changing the industry landscape
Focused on creating value for shareholders
Mr. Rajendra Gogri – Chairman & M.D.Founder DirectorChemical Engineer-UDCT, Masters-Chem. Engg(IOWA State USA) Portfolios – Speciality Chemicals, Strategic Planning, Financial Management
Mr. Rashesh Gogri – Vice Chairman & M.D.Production Engineer
Portfolios –Speciality Chemicals, Head – Pharma,
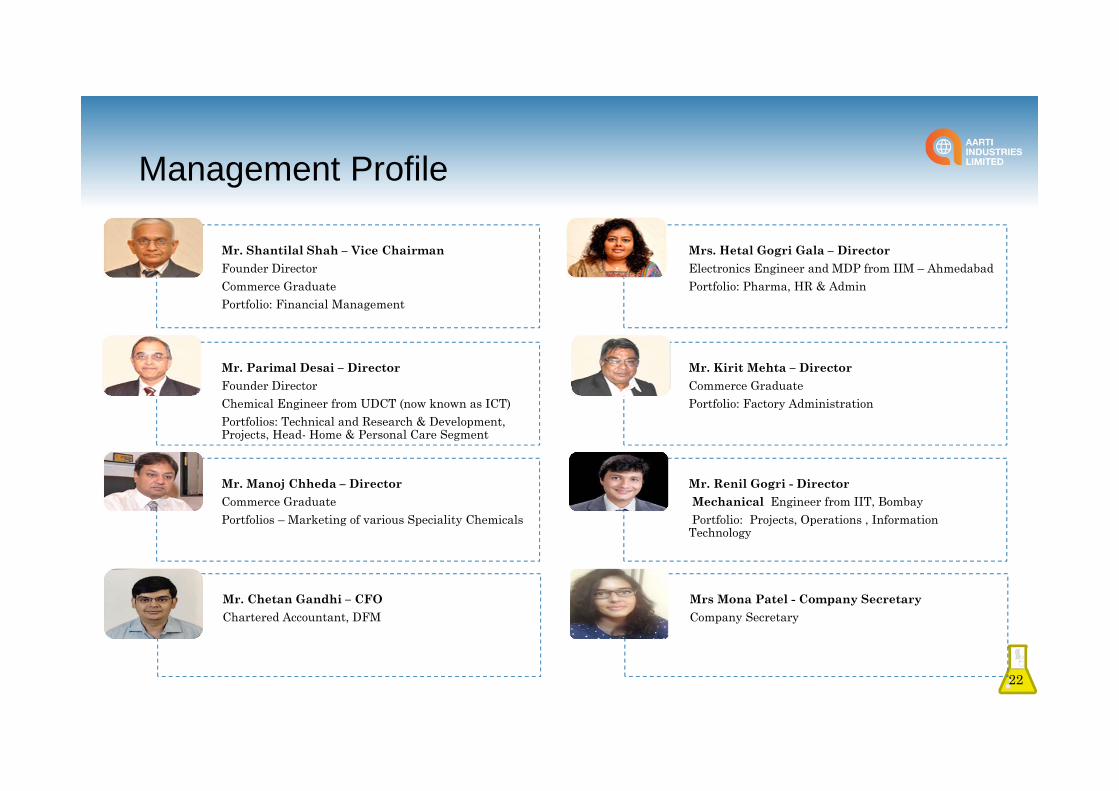
Management Profile
22
Mr. Shantilal Shah – Vice ChairmanFounder DirectorCommerce GraduatePortfolio: Financial Management
Mr. Parimal Desai – DirectorFounder DirectorChemical Engineer from UDCT (now known as ICT) Portfolios: Technical and Research & Development, Projects, Head- Home & Personal Care Segment
Mr. Manoj Chheda – DirectorCommerce GraduatePortfolios – Marketing of various Speciality Chemicals
Mr. Kirit Mehta – DirectorCommerce GraduatePortfolio: Factory Administration
Mr. Renil Gogri - Director Mechanical Engineer from IIT, BombayPortfolio: Projects, Operations , Information
Technology
Mrs. Hetal Gogri Gala – DirectorElectronics Engineer and MDP from IIM – AhmedabadPortfolio: Pharma, HR & Admin
Mr. Chetan Gandhi – CFOChartered Accountant, DFM
Mrs Mona Patel - Company SecretaryCompany Secretary

Key Financials
23

FY17 Highlights
24
Financial• FY17 Consolidated EBITDA up by 14% YoY to Rs. 653 crore with an EBITDA margin of 22%
• FY17 Consolidated PAT up by 23% YoY to Rs. 316 crore
• CRISIL has upgraded its ratings on our bank facilities and debt instruments to 'CRISIL AA-/Stable/CRISIL A1+' from 'CRISIL A+/Positive/CRISIL A1
Capex• Commercialized calcium chloride facility at Jhagadia (Gujarat) in Q1FY17
• In Q2FY17 Commenced commercial production at multipurpose Ethylation unit at Dahej SEZ, Gujarat.The Greenfield Ethylation unit is first of its kind to be set up in India and has adopted Swiss Technologywith a capacity to manufacture about 8,000-10,000 tpa of Ethylene derivatives
• In Q2FY17, Commenced commercial production of its 2nd Phase at PDA facility in Jhagadia, from 450 tpmto 1,000 tpm

FY17 Highlights
25
• In Q4FY17, operationalized captive co-generation power plant at Jhagadia, Kutch and Vapi. AIL now has atotal of five power plants – two at Vapi and one each at Jhagadia, Kutch and Tarapur; which would helpreduce power costs significantly
• Operationalized Solar plants with aggregate capacity of 697 KW across five locations
Pharmaceuticals
• Successfully closed USFDA facility inspection at Tarapur initiated in Q3
Corporate
• Effected share buyback of 12 lakh equity shares of face value of Rs. 5 each at a price of Rs. 800 per share onDec 07, 2016. program highlighting the Company’s belief in its long-term growth prospects and commitmentto efficient capital allocation
• AIL’s Board recommended a final dividend of Rs. 1 (20%) per equity share for FY17
• AIL’s Board gave in-principle approval for demerger of Home & Personal Care business. The Board hasdirected the Company to initiate discussions with merchant bankers and other agencies to take the processforward
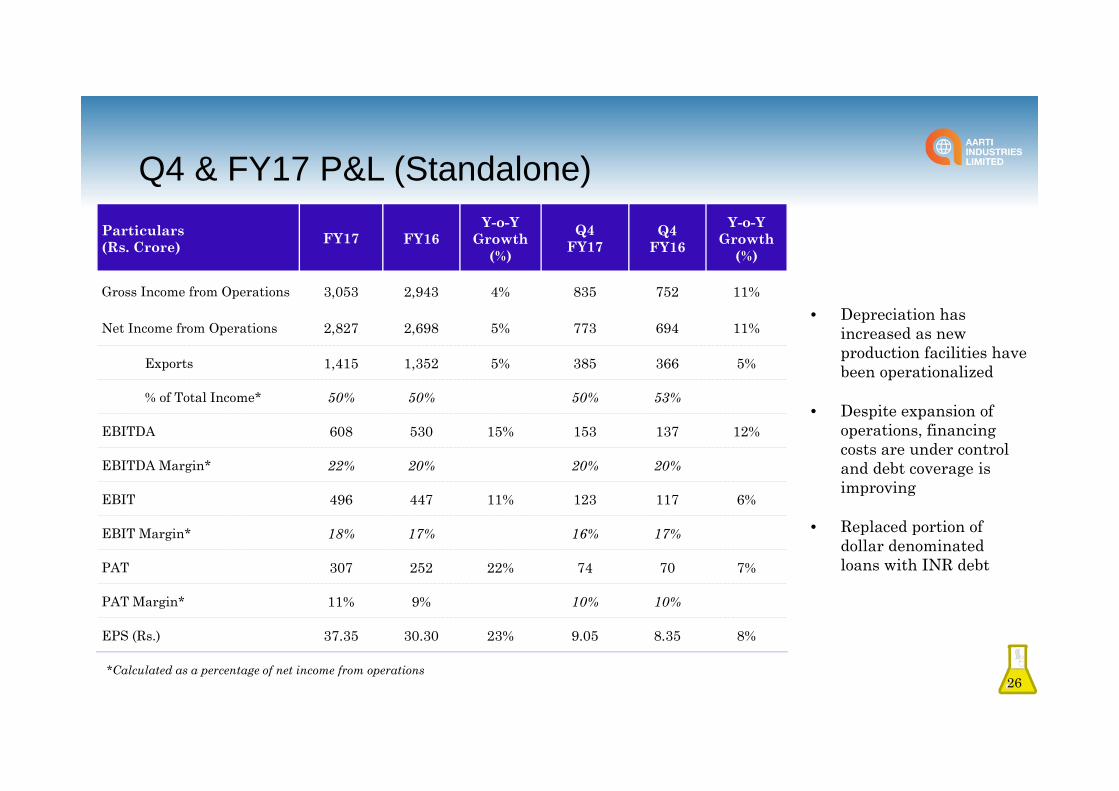
Q4 & FY17 P&L (Standalone)
26
Particulars(Rs. Crore) FY17 FY16
Y-o-Y Growth
(%)
Q4 FY17
Q4 FY16
Y-o-Y Growth
(%)
Gross Income from Operations 3,053 2,943 4% 835 752 11%
Net Income from Operations 2,827 2,698 5% 773 694 11%
Exports 1,415 1,352 5% 385 366 5%
% of Total Income* 50% 50% 50% 53%
EBITDA 608 530 15% 153 137 12%
EBITDA Margin* 22% 20% 20% 20%
EBIT 496 447 11% 123 117 6%
EBIT Margin* 18% 17% 16% 17%
PAT 307 252 22% 74 70 7%
PAT Margin* 11% 9% 10% 10%
EPS (Rs.) 37.35 30.30 23% 9.05 8.35 8%
• Depreciation has increased as new production facilities have been operationalized
• Despite expansion of operations, financing costs are under control and debt coverage is improving
• Replaced portion of dollar denominated loans with INR debt
*Calculated as a percentage of net income from operations

Q4 & FY17 – Speciality Chemicals (Standalone)
• Speciality Chemicals volume growth increased by 10% YoYin Q4 and 8% YoY in FY17
• Revenues are linked to pass through of key raw-materialprices
• FY17 EBIT expanded by 10% as value addition component ofrevenues continues to increase by leveraging wide range ofproducts
27
573 664
2,357 2,456
Q4FY16
Q4FY17
FY16 FY17
Revenue
(Rs. Crore)
121 123
469 517
Q4FY16
Q4FY17
FY16 FY17
EBIT

Q4 & FY17 – Other Businesses (Standalone)• Debottlenecking and expansion activities have facilitated
growth in pharma volumes• Since major fixed costs already built-in, incremental volumes
will result in significant increase in segmental profits• Focusing on off‐patented generics to be supplied in regulated
markets• cGMP compliant plants meeting ICH Q7 standards enabling
buyers to use API in all regulated markets• 48 commercial APIs with 33 EDMF, 28 USDMF and 16 CEP.
12 new APIs under development• 60% exports coming from US and EU with 4 commercial
products in US and several other awaiting partners approval• Distinct advantage having dedicated USA, Japan and EU
approval for steroids and anti-cancer products• Own Backward integrated facilities for most APIs
28
129 120
426 426
Q4FY16
Q4FY17
FY16 FY17
Pharmaceuticals Revenue
14 15
3948
Q4FY16
Q4FY17
FY16 FY17
Pharmaceuticals EBIT
42 51
150 168
Q4FY16
Q4FY17
FY16 FY17
Home & Personal Care Revenue
-0.4
2.5
-0.2
0.8
Q4FY16
Q4FY17
FY16 FY17
Home & Personal Care EBIT
• Non‐ionic surfactants, shampoo, hand wash, dish wash• Recently debottlenecked some operations to expand capacities• Focus on export‐oriented products
(Rs. Crore)

FY17 P&L (Consolidated)
29
Particulars(Rs. Crore) FY17 FY16
Y-o-Y Growth
(%)
Gross Income from Operations 3,165 3,013 5%
Net Income from Operations 2,978 2,760 8%
Exports 1,523 1,352 13%
% of Total Income* 51% 49%
EBITDA 653 572 14%
EBITDA Margin* 22% 21%
EBIT 533 480 11%
EBIT Margin* 18% 17%
PAT 316 257 23%
PAT Margin* 11% 9%
EPS (Rs.) 38.45 30.83 25%
*Calculated as a percentage of net income from operations
426 426
FY16 FY17
Pharmaceuticals Revenue
2,430 2,569
FY16 FY17
SpecialityRevenue
39 48
FY16 FY17
Pharmaceuticals EBIT
504 566
FY16 FY17
Speciality EBIT
150 168
FY16 FY17
Home & Personal Care Revenue
-0.2
0.8
FY16 FY17
Home & Personal Care EBIT
(Rs. Crore)

Balance Sheet (Consolidated)
30
Particulars(Rs. Crore)
As on Mar 31, 2016
As on Mar 31, 2017
Shareholders Funds 1,189 1,426
Net Debt 1,290 1,561
Tangible Fixed Assets 1,246 1,695
Net Current Assets 876 964
Debt/Equity 1.16x 1.17x
Fixed Asset Turnover 1.2x 1.2x
Avg. ROE 24.1% 25.9%
Avg. ROCE 23.8% 23.4%
• Strong execution of growth-oriented investments resulted in positive impact on returns on capital
• Efficient working Capital management

Operating revenues have grown on the back of strong volume growth in key business segments and better product mix. Top line is a function of variations in raw material prices especially crude
Revenue Performance (Consolidated)
31
2,096 2,632 2,908 2,780 2,927
1,060 1,281 1,449 1,352 1,523
0
1000
2000
3000
0
1,000
2,000
3,000
4,000
FY13 FY14 FY15 FY16 FY17
Revenue Export
CAGR: 8.7%
(Rs. Crore)
Deep engagement with global customers in Speciality chemicals and pharma. In addition, part of domestic revenues are indirect exports.
187249
303383 395
FY13 FY14 FY15 FY16 FY17
PharmacuticalsCAGR: 20.6%
152 167 207
132 149
FY13 FY14 FY15 FY16 FY17
Home & Personal Care
17582217 2398 2246 2384
FY13 FY14 FY15 FY16 FY17
Speciality ChemicalsCAGR: 7.9%

333 366447
542615
FY13 FY14 FY15 FY16 FY17
EBITCAGR: 16.6 %
Higher growth relative to revenue highlights value addition delivered by AIL
EBIT Performance (Consolidated)
32(Rs. Crore)
9
3036 39
48
FY13 FY14 FY15 FY16 FY17
PharmacuticalsCAGR: 52.0% 5
4 3
(0)1
FY13 FY14 FY15 FY16 FY17
Home & Personal Care
319 333408
504566
FY13 FY14 FY15 FY16 FY17
Speciality ChemicalsCAGR: 15.4%

Gross Profit (Rs. Cr.) & Gross margin EBITDA & Net Profit (Rs. Cr.)
Earnings Per Share (EPS) & Book Value
Financial Highlights – (Consolidated)
33
813
947
1076
1244
1422
38.8% 36.0% 37.0%41.3% 44.9%
0%10%20%30%40%50%
0
500
1000
1500
FY13 FY14 FY15 FY16 FY17
Gross Profit Gross Margin
361
401
466
572
656
134 162206
257316
0
100
200
300
400
0
200
400
600
800
FY13 FY14 FY15 FY16 FY17
EBITDA Net Profit
15.1
7
18.3
4
23.2
4
30.8
3
38.4
5
85.36 98.29114.73
133.80165.90
0
50
100
150
200
0.0010.0020.0030.0040.0050.00
FY13 FY14 FY15 FY16 FY17
EPS Book Value

Financial Highlights – (Consolidated)
• Growth-oriented investments have been committed by the management, strong execution has resulted inpositive impact on returns on capital
• Annual Capex plan of Rs. 400-450 crore over the next 3 years, investments focused on value-added products.Brownfield expansion will allow leverage of previously committed investments
• Fixed Capital leverage and value addition focus is evident in rapid revenue expansion• Working Capital management initiatives have allowed better efficiency• Leverage has remained stable while growing profitability has allowed debt to be serviced comfortably
34
220
240 208
332
528
1.7 1.8 1.7
1.2 1.2
0.0
0.5
1.0
1.5
2.0
0
200
400
600
FY13 FY14 FY15 FY16 FY17
Capex (Rs. Cr) Gross Fixed Assets Turnover
1.12
1.19
1.18
1.16
1.17
3.1 3.03.0
4.3 4.4
0.01.02.03.04.05.0
1.081.101.121.141.161.181.20
FY13 FY14 FY15 FY16 FY17
Debt/Equity Interest Coverage
798
848
893
876
964
49.5%44.2% 40.1% 36.5%
35.6%
0%10%20%30%40%50%60%
0200400600800
1,0001,200
FY13 FY14 FY15 FY16 FY17
Net Working Capital (Rs. Cr) Wcap Intensity
1,71
0
2,00
6
2,19
3
2,40
0
2,86
2
21.1% 20.0% 21.2% 23.8% 23.4%
0.0%5.0%10.0%15.0%20.0%25.0%
0
1,000
2,000
3,000
4,000
FY13 FY14 FY15 FY16 FY17
Capital Employed (Rs. Cr) Avg. ROCE
756
871
1,01
6
1,11
4
1,36
2
20.0% 20.0% 21.8% 24.1% 25.9%
0.0%5.0%10.0%15.0%20.0%25.0%30.0%
0
500
1,000
1,500
FY13 FY14 FY15 FY16 FY17
* Networth (Rs. Cr) Avg. ROE* Pre- IndAS to make it comparable

Shareholding Pattern
35
54.55%26.59%
12.26%
3.48% 3.11% 0.01%Promoters
Individuals
Mutual Funds
Foreign InstitutionalInvestorsOthers
FinancialInstitutions/ Banks
Increasing Institutional Ownership ….
60.88% 59.22% 54.80% 53.78%
8.17% 13.08%13.74% 16.15%
30.95% 27.70% 31.46% 30.07%
Mar-14 Mar-15 Mar-16 Mar-17
Promoter Instituational Others
For March16: Pursuant to merger of promoter's investment companies, 52.71 lakhs equity shares were cancelled, resulting in the decline in promoter stake by about 5.95%
*

CSR Initiatives
Research & Development
for social uplift
Childcare and
Healthcare Facilities
Women Empowerment and Livelihood Opportunities
Disaster Relief and
Rehabilitation
Eradication of Hunger and
Poverty
Water Conservation
and Environment
36
Cluster and Rural
Development
Education and Skill
Development
Aarti Industries is a responsible corporate citizen engaged in community welfare throughassociated trusts (Aarti Foundation and DhanvallabhCharitable Trust) aswell as focused NGOs engaged in diverse segments
Promoters of the company have set aside approximately 40 lac equity shares held in the Company (Rs. 5/-each fully paid up, worth about Rs. 240 crore), for charitable/philanthropic purpose
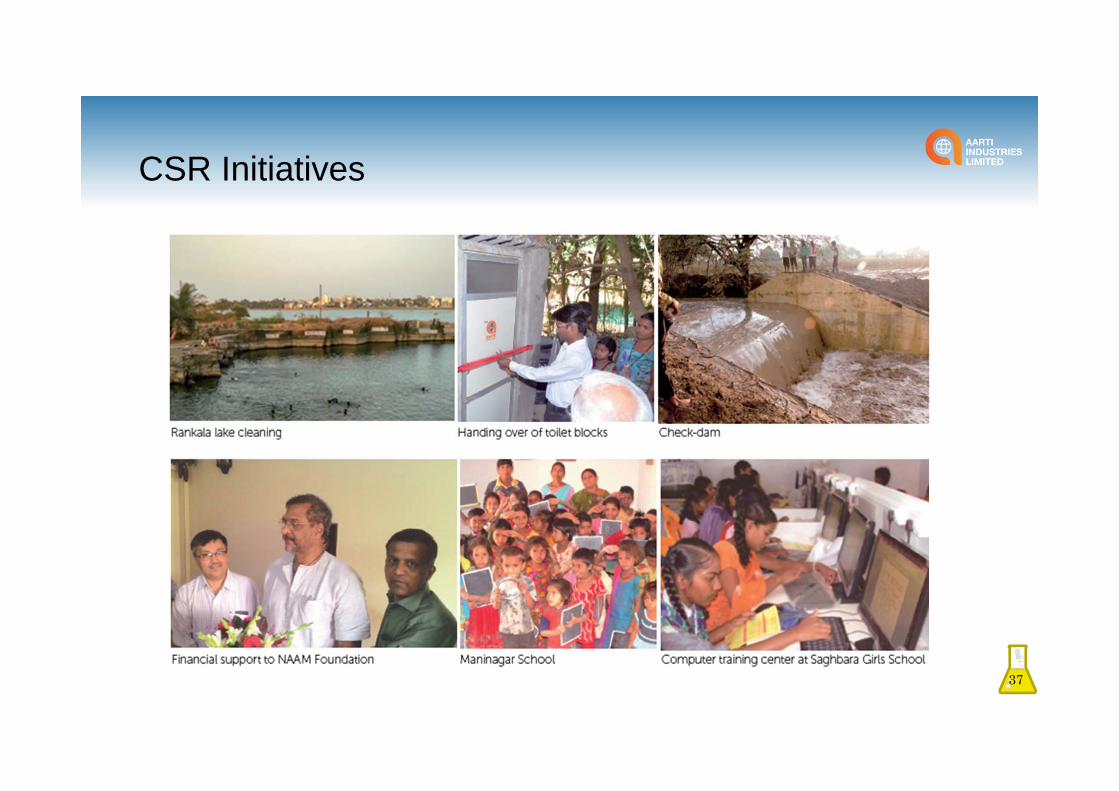
Involved in various CSR initiatives with specific focus on Health, Education & WomenEmpowerment.
CSR Initiatives
37
Business Model
38

Segmental overview
39
Speciality ChemicalsSpeciality Chemicals
Polymer & additives
Agrochemicals & intermediates
Fuel Additives, Rubber chemicals, Resins, etc.
Dyes, Pigments, Paints & Printing Inks
Fertilizer & Nutrients
Pharma Intermediates
PharmaceuticalsPharmaceuticals
Active Pharmaceutical Ingredients (APIs)
Intermediates for Innovators & Generic Companies
Home & Personal Care
Home & Personal Care
Non-ionic Surfactants
Concentrates for shampoo, hand wash & dish wash
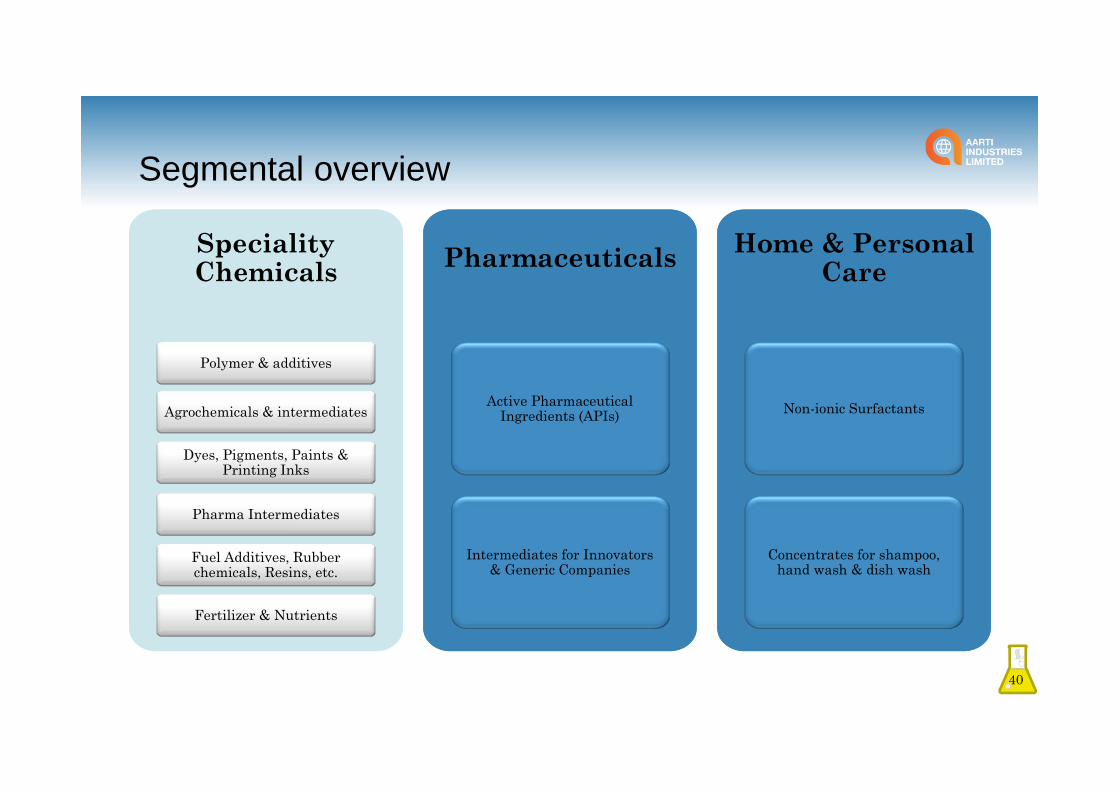
Segmental overview
40
Speciality ChemicalsSpeciality Chemicals
Polymer & additives
Agrochemicals & intermediates
Fuel Additives, Rubber chemicals, Resins, etc.
Dyes, Pigments, Paints & Printing Inks
Fertilizer & Nutrients
Pharma Intermediates
PharmaceuticalsPharmaceuticals
Active Pharmaceutical Ingredients (APIs)
Intermediates for Innovators & Generic Companies
Home & Personal Care
Home & Personal Care
Non-ionic Surfactants
Concentrates for shampoo, hand wash & dish wash

Chemical Industry Overview
Growth for Indian speciality chemicals is driven by both domestic consumption andexports.Speciality chemicals are finding applications across consumer, industrial,infrastructure and agricultural industries of India.India is developing into an important manufacturing hub for speciality chemicalsbenefitting tightened environmental norms (eg. REACH regulations) in developedcountries and the slowdown of China. 41
Source: FICCI, Tata Strategic
25
44
FY14 FY19E
Indian Speciality Chemicals Industry Future Outlook (USD bn)
CAGR 15%
139
214
FY14 FY19E
Indian Chemicals Industry Future Outlook (USD bn)
CAGR 11%

Key Parameters for Global Success
Speciality Chemicals Overview
42
Current Narrative in India • SME sector contributes 60% of output
• Low cost, local market suppliers
• Manufacturing Intermediates
• Limited Process, Quality, Customer Engagement Capabilities
Make-in-India campaign to supplement industry growth • Industrial licensing has been put an end to for most chemical sub-sectors except for certain hazardous chemicals
• 100% FDI permissible under the automatic route in the chemicals sector
• GOI is progressively reducing the list of reserved chemical items for production in the small scale sector, thus enabling higherinvestment in technology upgradation and modernization
• To set up integrated Petroleum, Chemicals, and Petrochemicals Investment Regions (PCPIRs) - will be investment regions spread across 250 square kilometers for manufacturing domestic and export-related products of petroleum, chemicals, and petrochemicals
• Several initiatives underway by GOI addressing challenges of Infrastructure, Regulations & Licenses, availability of feedstock and taxes
Knowledge, Knowledge, Processes, Processes, InnovationInnovation
High Impact on User IndustriesHigh Impact on User Industries
Long Term Partnerships with Global Leaders
Long Term Partnerships with Global Leaders
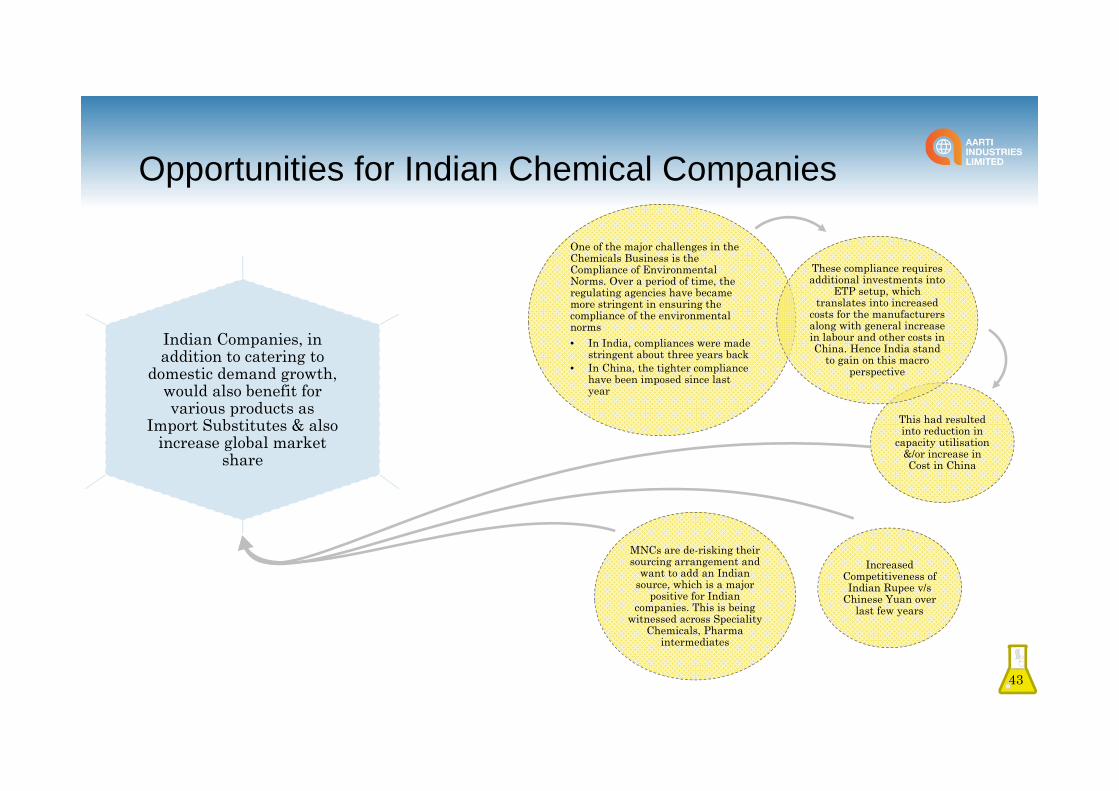
Opportunities for Indian Chemical Companies
43
One of the major challenges in the Chemicals Business is the Compliance of Environmental Norms. Over a period of time, the regulating agencies have became more stringent in ensuring the compliance of the environmental norms • In India, compliances were made
stringent about three years back• In China, the tighter compliance
have been imposed since last year
This had resulted into reduction in
capacity utilisation &/or increase in Cost in China
These compliance requires additional investments into
ETP setup, which translates into increased
costs for the manufacturers along with general increase in labour and other costs in China. Hence India stand
to gain on this macro perspective
Increased Competitiveness of Indian Rupee v/s
Chinese Yuan over last few years
MNCs are de-risking their sourcing arrangement and
want to add an Indian source, which is a major
positive for Indian companies. This is being
witnessed across Speciality Chemicals, Pharma
intermediates
Indian Companies, in addition to catering to
domestic demand growth, would also benefit for various products as
Import Substitutes & also increase global market
share

Speciality Chemicals – Financial Highlights
• Our performance over the last severalyears has been stronger than industryaverage
• Operating revenues have grown on theback of strong volume growth enabled bydeep engagement with global customers inSpeciality chemicals. Top line is a functionof variations in raw material pricesespecially crude
• Higher growth relative to revenuehighlights value addition and operatingefficiencies delivered by AIL
44
1,7582,217 2,398 2,265 2,384
FY13 FY14 FY15 FY16 FY17
RevenueCAGR: 7.9%
(Rs. Crore)
319 333408
504566
FY13 FY14 FY15 FY16 FY17
EBITCAGR 15.4%

Benzene Based Value Chain
45
Chlorination (Ranked amongst top 3 globally)
Hydrogenation(Ranked amongst top 2 globally)
Nitration (Ranked amongst top 4 globally)
Others Fluro compounds - Halex chemistry (Only player in India)
Ammonolysis (Ranked amongst top 2 globally)
(NCB) Value Chain
ChloroBenzene
Value Chain
PDA Value Chain

Other Chemicals
• Sulphuric Acid and Derivatives
• Single Super Phosphate (Fertilizer)
• Export Grade Calcium Chloride Granules (for Oil Exploration & De-icing)• Fuel Additives
• Phthalates
46
Global leaderSteam
SULPHUR 1000 OC
Co Gen Power Plant
(6MW)
SO2 SO3
Sulphuric Acid
OLEUM 23% % 65%
Chloro Sulphonic Acid
Di Methyl Sulphate
Di Ethyl Sulphate

• Multi product• Multi geography • Multi customer• Multi Industry
• Customer Confidence• Entry Barrier• Offsets demand vagaries
• Create differentiated process • High value products• Customization• Participate in Growth of fast growing end-user
application
• Cost Competitiveness & Economies of Large Scale
• Ability to cater to large global customers• Largest in India & Ranked amongst Top 5
Globally
• Supply Security• Adapt to Growth Oriented Product
Mix• Seamless product manufacturing and
sales leads to optimal utilization of resources
• Meet Stringent Specifications of varied Customers
• Adopt latest technologies and environment friendly process
• Highest attention to environmental, health and safety standards
Speciality Chemicals – Business Model
47
Strategic Supplier/Partner of Choice for major Global and Domestic Customer
Global Size Plants
Global Size Plants
Highly Integrated Operations
Highly Integrated Operations
Risk management
Risk management
Co Product Balancing
Co Product Balancing
Quality, Safety,
Sustainability
Quality, Safety,
Sustainability
Technical StrengthsTechnical Strengths
• Each reaction produces multiple co-products, necessitating multiple relationships with multiple customers – thereby creating a meaningful entry barrier for back integration of customers or new entrants
• Aarti converts its by-products from various processes into commercially viable products, thereby augmenting overall value

Speciality Chemicals – Business Model
48
Impact of Volatility in Crude / Benzene PricePricing Model
• Key RM cost component + Delta per kg or per ton. • Variation in key RM prices/component passed on to
customers.• Delta per Kg or per ton comprises of other RM, Energy
Costs, Overheads and Profits. These are fixed in absolute terms.
• In general, savings by way of yield improvement, optimizing utilities, cost reduction initiatives,etc, are retained by the company.
• Variation in Benzene prices leads to variation in the top line.
• Since the business model is on pass-on of key RM price component, absolute EBIDTA is not affected (except for inventory valuation).
• OPM increases at lower Benzene Price. • Demand is inelastic to Benzene prices, as in value
added end products (Polymers, Pharmaceuticals, Agrochemicals) Benzene cost in total product cost is not very significant
319
333
408
504
566
18.1%15.0%
17.0%
22.2%23.7%
0%
5%
10%
15%
20%
25%
0100200300400500600
FY13 FY14 FY15 FY16 FY17
EBIT EBIT MarginEBIT captures value addition delivered by AIL. Expansion is the result of: 1) strong contribution from higher value products and 2) Larger economies of scale

Strategy for Long Term Growth
49
Increase Market Share and participate in demand growth for existing products and adding products in current value chain
• Capacity expansion of Chlorobenzenes and various downstreams in from FY16 to FY18 • Developing value added products for NT and Downstream Value Chain • Developing new products based on existing as well as different Chemistries
Strategic alliances with global partners in areas of mutual interests

Growth Projects - New
• Nitro Chloro Benzene (NCB) Value Chain– Expanded NCB Capacity of 75,000 tpa from earlier 57,000 tpa, commissioned in Nov 2015
• Chloro Benzene Value Chain– Commissioned New Calcium Chloride Unit at Jhagadia with capacity of 30,000 tpa in Q1FY17.– Expanding Chlorination Capacity from 110KTPA to 175KTPA. Expected to commission in
FY18.
• PDA Value Chain– PDA Expansion
• Only Manufacturer in India• Expended From 250 tpm to 1,000 tpm.• 1st phase from 250 tpm to 450 tpm completed in Q1FY16.• 2nd Phase from 450 tpm to 1,000 tpm completed in Sept 2016.
50
Production (in tons)
FY13 FY14 FY15 FY16 FY17
48,072 54,230 53,400 59,500 63,700

Growth Projects - New
New Toluene Value Chain
• Nitration Unit at Jhagadia (Nitro Toulene & Downstreams)– New Capacity of 30,000 tpa expected to be commissioned in Q1FY18
• Ethylation Facility at Dahej– Commenced in Sept 2016– Capacity to manufacture about 8,000 – 10,000 tpa of Ethylene derivatives
Co-generation & Solar plants
– In Q4FY17, operationalized captive co-generation power plant at Jhagadia, Kutch and Vapi.AIL now has a total of five power plants – two at Vapi and one each at Jhagadia, Kutch andTarapur; which would help reduce power costs significantly
– Operationalized Solar plants with aggregate capacity of 697 KW across five locations
51

Introduction of New Products: Toluene Based Value Chain
52
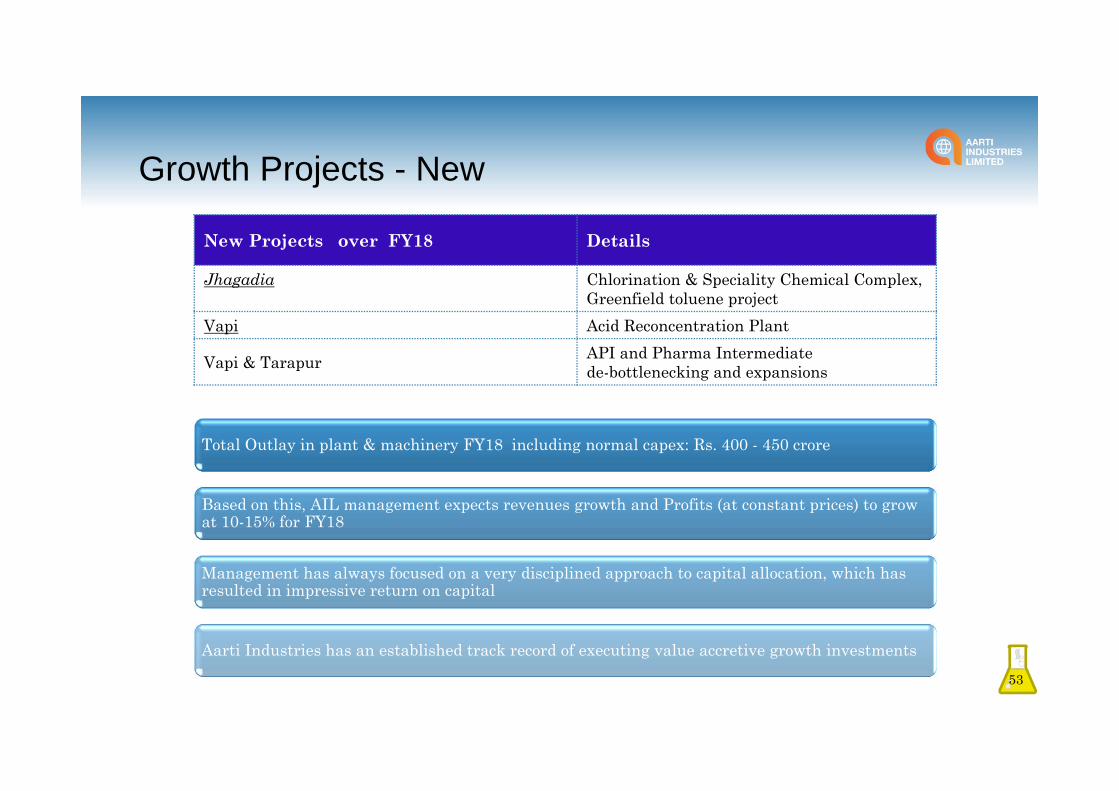
Growth Projects - New
Total Outlay in plant & machinery FY18 including normal capex: Rs. 400 - 450 crore
Based on this, AIL management expects revenues growth and Profits (at constant prices) to grow at 10-15% for FY18
Management has always focused on a very disciplined approach to capital allocation, which has resulted in impressive return on capital
Aarti Industries has an established track record of executing value accretive growth investments53
New Projects over FY18 Details
Jhagadia Chlorination & Speciality Chemical Complex,Greenfield toluene project
Vapi Acid Reconcentration Plant
Vapi & Tarapur API and Pharma Intermediate de-bottlenecking and expansions

Segmental overview
54
Speciality ChemicalsSpeciality Chemicals
Polymer & additives
Agrochemicals & intermediates
Fuel Additives, Rubber chemicals, Resins, etc.
Dyes, Pigments, Paints & Printing Inks
Fertilizer & Nutrients
Pharma Intermediates
PharmaceuticalsPharmaceuticals
Active Pharmaceutical Ingredients (APIs)
Intermediates for Innovators & Generic Companies
Home & Personal Care
Home & Personal Care
Non-ionic Surfactants
Concentrates for shampoo, hand wash & dish wash
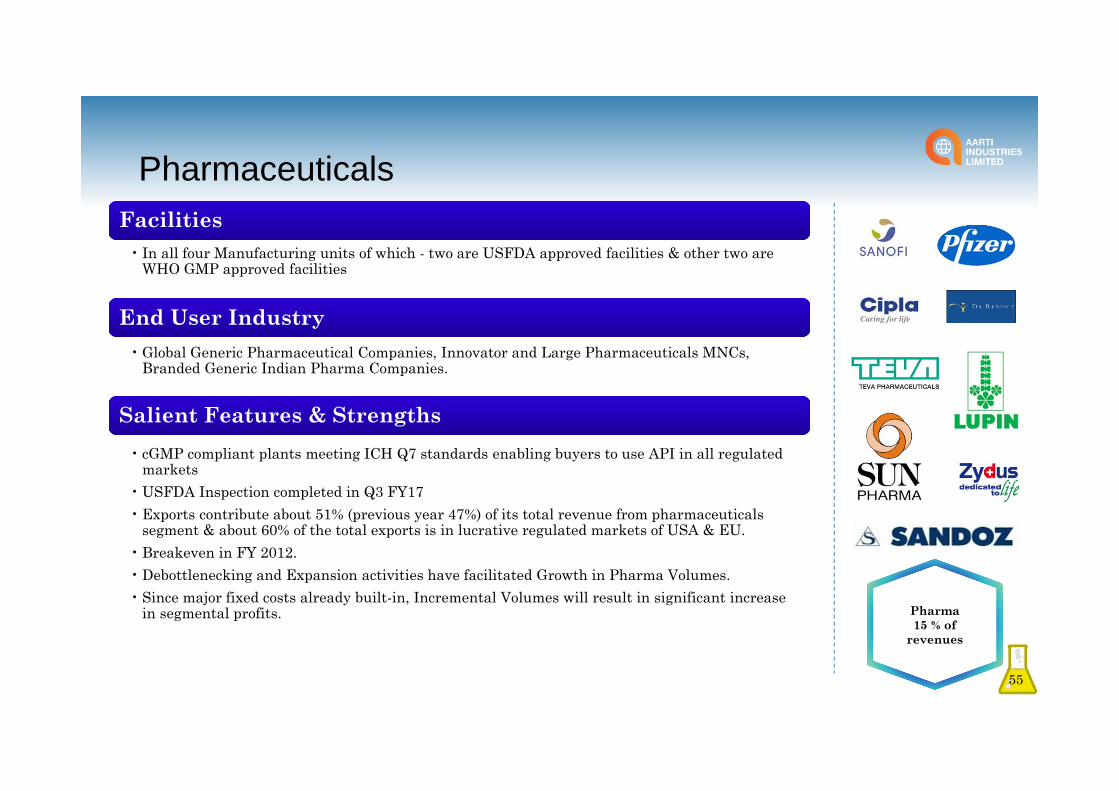
Pharma 15 % of
revenues
Pharmaceuticals
55
FacilitiesFacilities• In all four Manufacturing units of which - two are USFDA approved facilities & other two are
WHO GMP approved facilities
End User IndustryEnd User Industry• Global Generic Pharmaceutical Companies, Innovator and Large Pharmaceuticals MNCs,
Branded Generic Indian Pharma Companies.
Salient Features & StrengthsSalient Features & Strengths• cGMP compliant plants meeting ICH Q7 standards enabling buyers to use API in all regulated
markets• USFDA Inspection completed in Q3 FY17• Exports contribute about 51% (previous year 47%) of its total revenue from pharmaceuticals
segment & about 60% of the total exports is in lucrative regulated markets of USA & EU.• Breakeven in FY 2012.• Debottlenecking and Expansion activities have facilitated Growth in Pharma Volumes.• Since major fixed costs already built-in, Incremental Volumes will result in significant increase
in segmental profits.

Pharmaceuticals – Financial Highlights
• We have been consistently increasing ourshare of operations and engagement withvarious customers in regulated marketspace.
• The above along with successful closure ofUSFDA Inspection, has resulted intoconsistent growth in topline, increase inexports in regulated markets andcorresponding EBIT over past few years.
• Further the API intermediate business isalso expected to grow upon the capacitycoming online in FY17-18.
• We expect to continue on the growthmomentum
56
187249
303383 395
FY13 FY14 FY15 FY16 FY17
RevenueCAGR: 20.6%
(Rs. Crore)
9
3036 39
48
FY13 FY14 FY15 FY16 FY17
EBITCAGR 52.0%

• 48 commercial APIs with 33 EDMF, 28 USDMF and 16 CEP (1 under approval)
• 12 new APIs under development.• Own Backward integrated facilities for
most APIs.• Exports to US and EU increasing to
60% of total exports with 4 commercial products in US and several other awaiting Partners approval.
• Distinct Advantage having dedicated USA, Japan and EU approval for Steroids and Anti-cancer products.
• Scaled up to 9 lines from earlier 4 lines.
• CRAMs activity focused on intermediates
• Dedicated 50 scientist working in separate R&D block for these Intermediates.
• Have developed 10 APIs Intermediates• Working with several Innovators on
API Intermediates opportunities. • Offering end to end solution from
process development to toll manufacturing.
• Doubled capacities to cater to demand for Cola / Energy Drinks manufacturers.
Pharmaceuticals – Growth Drivers
57

Segmental overview
58
Speciality ChemicalsSpeciality Chemicals
Polymer & additives
Agrochemicals & intermediates
Fuel Additives, Rubber chemicals, Resins, etc.
Dyes, Pigments, Paints & Printing Inks
Fertilizer & Nutrients
Pharma Intermediates
PharmaceuticalsPharmaceuticals
Active Pharmaceutical Ingredients (APIs)
Intermediates for Innovators & Generic Companies
Home & Personal Care
Home & Personal Care
Non-ionic Surfactants
Concentrates for shampoo, hand wash & dish wash

Home & Personal Care Chemicals
• This business has onlyabout 3.5% of the overallcapital employed in it.We are making concertedefforts to gain largerscale and drive sustainedimprovement in thisbusiness.
59
152 167207
132 149
FY13 FY14 FY15 FY16 FY17
Revenue
(Rs. Crore)
5 4
3
(0)1
FY13 FY14 FY15 FY16 FY17
EBIT
Facilities One unit each at Pithampur (Madhya Pradesh) & at Silvassa
End User Industry FMCGs – Shampoos, Anti-Dandruff Shampoos, Disinfectants, Hand & Body wash, Dish Wash, Detergents Bars & Powders, Soaps, Tooth Powders & Paste etc.
Salient Features Relatively low margin business.
Growth Drivers Plans are afoot to optimize on the production capabilities to suitablyalter/revise the product mix and explore new markets to improve themargins.
Demerger AIL’s Board gave in-principle approval for demerger of Home &Personal Care business. The Board has directed the Company toinitiate discussions with merchant bankers and other agencies totake the process forward
5% of revenues

Key Investment Theme
60
Clear Path to Value Creation
Leadership excellence –established
record of execution
Global leadership in key products – ranked #1
- #5
Increasing focus on high margin products and
high value knowledge based
industries
De-risked portfolio – multiple
products, multiple customers, multiple
geographies, multiple end-user
industries
Global Partner of Choice
engagements with target customers,
cross selling across value chain
Quality and environment polices
mapped to global benchmarks
ensuring customer confidence and
business sustainability
Balanced capacity model: • Agile operations enable
higher customization and value maximization –process driven production provides flexibility to change product based on market dynamics
Strong financial profile: • Track record of revenue
growth, value addition and margin expansion
• Strong execution has delivered ROCE improvement on growth investments
Economies of Scale and Operational Efficiency: • Highly Backward Integrated
and gainful usage of by-products, ensuring steady supply of Intermediates
• Constant Drive to Improve Process Efficiency has reduced Opex Costs
Best placed to capture Industry trends like Easternization and Supplier Country Diversification • MNC’s looking to increase
their share of procurement from India
• India finding favor vis-à-vis China

“Over the last decade this singular evolution –
from an Indian company servicing global
markets to what is fundamentally a global
company selecting to manufacture out of India
– has been responsible for our consistent
growth. Aarti Industries is at the cusp of
robust sustainable growth in respect,
relationships, revenues, margins and profits”
Chairman’s Message
61

Contact Us
For further information please log on to www.aartigroup.com or contact:
62
Mr. Chetan Gandhi / Mrs. Mona Patel
Aarti Industries Limited
Tel: +91 22 6797 6666
Email: [email protected]
Shiv Muttoo / Vikram Rajput
CDR India
Tel: +91 22 6645 1207/1223
Email: [email protected]

Thank You
63