aaea2009 paper soybean rust impacts july24
TRANSCRIPT

Economic Impacts of Soybean Rust on the US Soybean Sector
Miguel I. Gómez Assistant Professor
Department of Applied Economics and Management Cornell University 246 Warren Hall
Héctor M. Núñez Graduate Student
Department of Agricultural and Consumer Economics University of Illinois 415 Mumford Hall
Hayri Önal Professor
Department of Agricultural and Consumer Economics University of Illinois 326 Mumford Hall [email protected]
Selected Paper prepared for presentation at the Agricultural & Applied Economics Association 2009
AAEA & ACCI Joint Annual Meeting, Milwaukee, Wisconsin, July 26-29, 2009 Copyright 2009 by Miguel I. Gómez, Héctor M. Núñez and Hayri Önal. All rights reserved. Readers may make verbatim copies of this document for non-commercial purposes by any means, provided that this copyright notice appears on all such copies.

1
Economic Impacts of Soybean Rust on the US Soybean Sector
Abstract: The spread of Asian Soybean Rust (ASR) represents a real threat to the U.S. soybean sector. We analyze potential impacts of ASR on domestic soybean production and commodity markets as well as the competitive position of the US in the soybean export market using a price endogenous mathematical programming sector model. The model takes into account the spatial dynamics of the spread of disease during the cropping season, the inherent uncertainty regarding the risk of infection, and the dichotomous decisions that farmers make (no treatment, preventive treatment, and curative treatment) facing the risk of infection. Our results indicate substantial impacts from potential ASR spread on the agricultural output, prices and exports. The simulation results suggest that losses to the US soybean industry may be avoided by establishing effective soybean rust control policies particularly in the gateway regions on the south-to-north path of the ASR spread. Due to the spatially varying risk factors resulting from climatic differences, a significant shift occurs in soybean production from lower-latitude states toward higher-latitude states where ASR threat is less.
Keywords: Asian Soybean Rust, Stochastic Models, Dynamic Models
JEL: C61, Q13
Introduction
Asian Soybean Rust (ASR) is among the most severe foliage diseases of soybeans. It spreads
rapidly and can reduce yields drastically (Miles, Frederick, and Hartman 2003). In the US it was
first detected in Southern Louisiana in 2004 and experts believe that its spores were brought by
summer storm winds originating in South America. Since then, it has been observed in soybeans
and kudzu (an important ASR host plant for its spores) in several Southern coastal states,
including Alabama, Florida, Georgia, Mississippi and Texas (USDA 2009). ASR has also been a
major threat to farmers in South America since 2001. It has been present in Argentina since 2002
and by 2005 it had spread to virtually all production regions in the country. In 2004 soybean
output in Brazil dropped by nearly 5% due to ASR infection. The US, Argentina and Brazil are
the main suppliers of soybeans in world markets, with a total share of more than 90% in

2
international markets. Therefore, a significant change in the supply of any of these countries may
have serious impacts on domestic commodity and livestock markets and on international soybean
markets.
The spread of ASR represents a real threat to the U.S. soybean sector and warrants its
strict surveillance. Consequently, in 2005 the U.S. Department of Agriculture initiated a
sophisticated Soybean Rust Coordinated Framework to monitor and control the spread of the
disease. The premise for creating this coordinated framework is that publicly provided
information creates value by allowing farmers make better decisions regarding actions for the
control and prevention of ASR infection (Roberts and Schimmelpfennig 2006). Information
about ASR spread in the United States is communicated through various channels including an
interactive website in which users can observe daily maps of ASR incidence, education on
management strategies to control spread of the disease, links to recent research findings on ASR,
and expert advice as to possible disease spread patterns (see Figure 1 and Figure 2). The
framework contributes to coordinate communication between individuals monitoring ASR in
sentinel plots and soybean production areas, government officials, academic researchers and
stakeholders (Roberts and Schimmelpfennig 2006).
In spite of its importance and the current government-led efforts to control ASR spread,
very few studies have been presented so far about potential economic impacts of ASR in the U.S.
soybean sector. Agricultural economists started to evaluate impacts of ASR only recently as data
on disease spread patterns and possible control strategies became available. Johansson et al.
(2006) examined the impact of alternative scenarios for spread of ASR in the US and found
increased prices and substantial reductions in soybean production and exports. Bekkerman et al.
(2008) conducted a risk analysis that takes into account spatial and temporal correlations to price

3
possible annual insurance contracts to cover soybean rust damages. This study contributes to the
empirical literature on ASR’s economic impact assessment and welfare implications by using a
stochastic programming model in which spatial patterns of ASR dispersion are taken into
account explicitly and farmers’ decision making under uncertainty is simulated in a price
endogenous sector modeling framework. Simulating the spatial dynamics of ASR spread
delineates this study from Johansson et al. (2006).
The specific objectives of this study are two-fold: i) assess the impacts of ASR on
domestic soybean production and commodity markets, ii) analyze the competitive position of the
US in the soybean export market. Our hypothesis is that an effective control of the spread of
ASR domestically may protect US soybean producers against production losses and may also
improve the competitive position of U.S. in the export markets. The ASR influences agricultural
production in several ways. It reduces soybean yields (which can be drastic unless adequate
preventive measures are taken), increases production costs (due to additional fungicide
applications), and may encourage farmers to switch to alternative crops (to reduce production
risk). All these factors are likely to alter the equilibria in commodity markets. Moreover, changes
in crop patterns are expected to vary across regions due to the spatial differences in climatic
conditions, hence the effectiveness of ASR, and the comparative advantage of individual regions
in producing alternative crops.
This article is organized as follows. The next section reviews earlier literature on the
economic impacts of plant disease in general and ASR in particular. The third section describes
the stochastic dynamic programming model developed in this study. The fourth section described
the data employed to calibrate the model. The fifth section discusses the results and the last
section concludes and proposes areas for future research.

4
Literature Review
Plant disease risks and economic approaches
Plant diseases are becoming increasingly important in the design of domestic and international
policies affecting food and agriculture. Plant health issues as well as the resulting policies in
response to plant disease challenges may impact food security, international trade, economic
welfare and sector performance. Consequently, governments are making efforts in data
collection to detect and monitor the spread of plant diseases. The increasing amount of data
available together with the wide variety of economic issues related to plant diseases have
attracted the attention of agricultural economists interested in assessing the economic costs of
plant diseases and in identifying appropriate strategies to eliminate or contain disease spread.
Oude Lansink (2007) summarizes recent research advances in the study of economic
impacts of plant disease. At the heart of these new approaches is how to respond optimally to a
plant disease-related problem with inherent risk and uncertainty. A stream of research focuses on
the costs and benefits of phytosanitary measures to avoid or control disease spread such as pre-
emptive actions, continuous monitoring and scouting, border inspections, and curative actions to
control disease. For instance, Moffit et al. (2007) combines an info-gap model and the principle
of stochastic dominance to develop a robust inspection strategy when inspection budgets are
limited. Surkov et al. (2007) develops a conceptual model to allocate scarce resources in the
context of quarantine risks related to the international trade of agricultural products. They find
that more effective risk reductions can be achieved by allocating greater resources to the
inspection of riskier disease paths; and smaller resources to inspection of less risky pathways.

5
Spatial models have been employed to evaluate the risks and economic impacts of
disease spread. Goodwin and Piggott (2007) constructs a spatiotemporal model to quantify the
risk of Asiatic citrus canker disease for commercial producers of oranges in Florida. The authors
employ a large database of inspections spanning the period 1998-2004 to estimate probit and
Poisson regression models. Based on their parameter estimates, the authors develop a risk model
that contributes to determine the value of insurance contracts for protection against the disease.
In the same spirit, Acquaye et al. (2007) employs a partial equilibrium framework to evaluate the
economic impact of hurricanes on the spread of Asiatic citrus canker disease and the subsequent
eradication policy in Florida. The model takes into account the spatial and temporal aspects or
disease spread as well as the costs and benefits of the eradication policy. The authors show that
farmers’ welfare increases from Asian citrus cancer and from the eradication policy at the
expense of reduced economic welfare from other sectors in society. Breukers et al. (2007) focus
on the spread of brown-rot potato disease in the Netherlands. Their approach combines an
epidemiological stochastic model that simulates the spatial spread of brown-rot disease and an
economic model of the private costs of efforts to contain the disease. They find that low
monitoring efforts are more efficient if the product is offered in domestic markets. In contrast,
high monitoring efforts are desirable if the product is intended for the international market.
Another stream of research focuses on the non-monetary impacts of phytosanitary
policies. Researchers have developed methods to elicit stakeholder willingness to pay (WTP) for
measures to control disease spread. Areal and Macleod (2007) investigate the WTP for trees at
risk of infection from Phytophthora ramorum, a disease that cause sudden oak death. The
authors use a discrete choice model and a double-bound bid likelihood function and find that the
average WTP of the British taxpayer for disease control is about 55 pound per year over a five-

6
year period. Mourits and Lansink (2007) take a broader approach to assess the impact of
phytosanitary regulation. They employ a tool called Multi-Criteria Decision Making, which
allow them to integrate such disease-relater aspects as epidemiology, economic and ethical. They
show the value of using this tool to assess various strategies to control animal quarantine
diseases in animals.
Overall, these studies emphasize the importance of modeling the stochastic nature of
plant disease spread as well as the spatiotemporal patterns of disease dispersion when evaluating
alternative policies and private strategies for disease control. At the same time, this literature
stresses the need to quantify the costs and benefits of phytosanitary measures that affect
agricultural sectors.
Soybean Rust in the United States
Five years ago, when ASR was first detected in the United States, policy makers and
agricultural economists started to examine potential economic impacts of ASR, given the
importance of the soybean sector in the country. Roberts and Schimmelpfennig (2006) examined
the value of publicly available information about ASR versus the costs of USDA’s Soybean Rust
Coordinated Framework initiated in 2005. They showed that the costs accrued to the framework
are much lower than the value of the information provided. For farmers who face potential ASR
infection, information about the likelihood of disease occurrence can help them make better
decisions about the amount and timing of fungicide applications, which will ultimately increase
their profits.
Relatively little research has been conducted on the economic impacts of ASR in the US
soybean sector, in part because it was first detected in Louisiana quite recently. To our
knowledge, only two studies have addressed the economic impacts of ASR spread in the US

7
(Johansson et al. 2006; Bekkerman et al. 2008). Johansson et al. (2006) conducted an early
assessment of ex-ante ASR impacts by considering alternative scenarios for spread and control
of the disease in the US. The authors examined economic consequences of three possible ASR
impact scenarios on production costs and yields: do nothing, apply a preventive fungicide
treatment, and apply a curative fungicide treatment. They use a partial equilibrium mathematical
programming model developed by USDA’s Economic Research Service to simulate the regional
yield and cost impacts and subsequent changes in equilibrium prices and quantities (Livingston
et al. 2004). The model assumes an adjustment period of five years so the expected impacts are
calculated for a steady state in 2010. The model considers forty five geographic regions in the
US and the markets for twenty three agricultural inputs including labor, land and water, among
others. The model is calibrated employing data on the spatiotemporal distribution of ASR, on the
spread patterns of other similar wheat and corn diseases that have occurred in the past, and on the
available information regarding the costs of fungicides necessary for disease control. Their
results suggest that economic impacts of ASR may be higher than expected in earlier
assessments and will likely result in smaller soybean harvests, reduced exports, and increased
prices by 2010. Specifically, the authors find that losses to US agriculture are lowest with a
curative fungicide application strategy, followed by the no-treatment strategy. The preventive
fungicide application strategy results in the highest losses for US agriculture. The authors,
however, point out to that the restrictive assumptions of their model suggest that uncertainty
about ASR impacts remain and more studies are necessary to evaluate, ex-ante, the potential
impacts of this disease for US agriculture. While the study by Johansson et al. considers spatial
variation in the incidence of rust across soybean producing states, by using an estimated fraction
for rust infected acreage in each region, it does not explicitly incorporate the movement patterns

8
of rust over space and time. Although this is a complicated issue which is not fully understood
yet, the approach we use in this paper attempts to incorporate the movement patterns (to our best
knowledge) in farmers’ preventive fungicide application decisions. Besides the differences in
price endogenous modeling methods, this issue distinguishes the present study from the
Johansson et al. study.
More recently, Bekkerman et al. (2008) analyzed the economic impacts of ASR in the
context of risk and severity to quantify the risk of ASR infection and to simulate possible prices
of ASR-related insurance contracts or indemnification programs. The authors use data from the
disease inspection and monitoring program established by the USDA and information about
climatological and biological factors to develop a model of the risks of ASR infection in the US.
The model results are used to calculate fair premium rates for insurance policies conditional to
the severity of crop losses. The study uses over 35,000 field-level inspections spanning the
period 2005-2007, and includes county-level weather statistics, planting dates and maturity
groups from various sources. The econometric model of ASR risk infection is aggregated at the
county level and the parameter estimates are obtained from alternative models, including simple
probit, zero-inflated Poisson and negative binomial models. The authors provide a careful
treatment of the endogeneity that may exist between inspections and ASR findings. The
conditional probabilities of ASR infection estimated above are employed to compute expected
losses and the subsequent fair premiums of insurance contracts. The results indicate a high
degree of variability in ASR infection probabilities and in the corresponding insurance premiums
across soybean production regions in the United States. The estimated average premium rates are
lower in northern regions (1.59%) and substantially higher in southern regions (27.66%). The

9
authors point out the need to do further research to understand the links between economic
impacts and spread patterns of ASR.
Overall, the few studies summarized above indicate a high degree of uncertainty
regarding the impacts of ASR infection on the US agricultural sector. Our study contributes to
this literature by developing a stochastic programming sector model with explicit consideration
of spatial and temporal dynamics of rust spread to assess the economic impacts of ASR on US
agriculture. The model takes into account ASR spread during the cropping season, the inherent
uncertainty regarding the risk of infection, and the dichotomous decisions that farmers make
facing the risk of disease spread.
Figure 1. Soybean acreage in the US, 2008
Source: USDA, NASS
The Model
In order to address the research issues stated above, we develop a multi-market, multi-
product spatial equilibrium model employing the well known social-surplus maximization

10
approach (Takayama-Judge, 1971; McCarl and Spreen, 1980). Consumer demand is incorporated
via aggregate demand functions for major commodities and a detailed supply response
component simulates the allocation of agricultural land among crops, technology choices, and
resource utilization at a spatially disaggregate level. We formulate the US soybeans production
component of the model in a discrete stochastic programming framework considering three
periods during the growing season. The appearance of ASR in any region and time period is
stochastic and optimal fungicide application in each region and time period depends on what
happens in the ‘downstream’ region on the path of ASR. To do this, we follow the surveillance
system established by the USDA in 2004, which shows that the spread of ASR follows a path
from the Gulf States early in the cropping season and moves towards north as far as Minnesota
around September.
As production activities the model considers planting three crops, corn, soybeans and
wheat. These are the three main crops competing for land in the Corn Belt region, which in turn
is the major supplier of soybeans in the U.S.; together produce about two thirds of the total US
soybean production). This limited coverage allows us to address the main research issues without
overly complicating the model. The three cropping activities produce five products
(commodities), namely corn, soybeans, soybean meal, soybean oil, and wheat, which are either
sold in the domestic markets or exported. We include an explicit demand function for each of
these commodities for human/industrial consumption, feed use, and exports to international
markets. The model takes into account all the commodity demand functions and the competition
between cropping activities producing those commodities when determining the market
equilibrium. The optimal production possibilities in each region depend on the comparative
advantage of each region in producing these crops. This is modeled using linear (Leontief or

11
input/output) production functions, incorporating land as the primary input and crop yields as the
output, varying across regions. Land is considered as the only input whose availability is limited,
while the availability of all other inputs (fertilizers, chemicals, seed, credit, labor, machinery
services, etc.) is assumed to be unlimited at constant prices. The costs of all those production
factors and processing costs (soybean crushing) are summed and given as an aggregate per-acre
cost (crop budget).
The model considers regional variations in crop production costs, yields, and resource
(land) availability at state level. Twenty-two states are included in the model. Because of their
climatic characteristics and the related ASR threat level these states are grouped into four broad
regions: Region-I includes Texas, Louisiana, Mississippi, Alabama, Georgia, and South
Carolina, which are most prone to rust occurrence; Region-II includes transition states Arkansas,
Tennessee, North Carolina, Kentucky, which are on the pathways of rust movement from south
to north; Region-III includes Nebraska, Iowa, Illinois, Indiana, Ohio, Kansas and Missouri; and
finally Region-IV includes N. Dakota, S. Dakota, Minnesota, Wisconsin and Michigan, which
are least susceptible to rust incidence (see Figures 2, 3 and 4). Together these 22 states supply
more than 98% of the soybeans produced in the US.
The model structure is too complex to provide all the details here. Instead we provide a
sketchy description of the major constraints. The demand and supply balances for individual
commodities (at national level) represent the disappearance of commodities while the availability
of agricultural land determines the crop supplies (acreage) at state level. A difficulty that is often
encountered when working with programming models is the extreme specialization of
production activities, where each producing region is assigned a few –even a single- production
activity in the optimal solution. This difficulty is lessened by considering crop rotation activities

12
in some models or planting flexibility is limited by upper and lower bounds (the latter approach
is ad hoc and typically lacks proper justification). To alleviate the extreme specialization
problem, in this study we use the historical crop mix approach originally proposed by McCarl
(1982) as a mathematical modeling method. In this approach the feasible solutions (land
allocation among crops) are restricted to be a weighted average of the historically observed crop
patterns (in mathematical terms the solution vector must be in the convex hull of the observed
crop patterns -vectors). Unlike the limited planting flexibility approach (upper/lower bounds),
this approach has a theoretical justification and founded on mathematical programming theory
(Önal and McCarl, 1991). In addition, the model takes into account most common rotation
practices employed in the agricultural production regions considered in the study.
Figure 2. Soybean Rust detected in US. 2005-2008
Soybean Rust – Oct 2008
Source: ipmpipe

13
The most complicated details of the model relate to the movement of ASR and farmers’
fungicide application decisions. Based on the recent literature, we employ the following
assumptions in the development of our stochastic dynamic programming model of ASR spread
(Roberts et al. 2006; Rossman 2008; Robinson 2005; Mueller et al. 2006; Mueller et al. 2006;
Sweets et al. 2004; Livingston et al. 2004; Isard et al. 2005; Isard et al. 2007; Integrated
Aerobiology Modeling System 2009):
Figure 3. Grouping of US Soybean Producing Regions
based on ASR occurrence.
• ASR is permanently present in the southern region of the United States (Region-I, including
Texas, Louisiana, Mississippi , Alabama, Georgia, South Carolina) because the climatic
conditions in this region are conducive to ASR overwinter; subsequently, as spring
progresses, the disease starts to spread toward the central (or transition) region (Region-II,
including Arkansas, Tennessee, North Carolina, Kentucky); and it continues moving
gradually northward to lower Great Plains and the Midwest (Region-III, including Nebraska,
Kansas, Iowa, Illinois, Indiana, Ohio, Missouri). It is believed that ASR threat is minimal or

14
nonexistent in the northern states (Region-IV, including South Dakota, North Dakota,
Minnesota, Wisconsin and Michigan). It cannot overwinter in the Central and Midwest
Northern regions (i.e. Regions II and III), and it moves from the southern states to the
northern states during the cropping season, depending on the climatic conditions
(temperature, humidity) and wind patterns (see Figure 4).
Figure 4. Assumed Soybean Rust Pathways in the US.
• In the cropping season farmers can avoid ASR infestation by applying preventive fungicide
in the first two reproductive stages of the soybean crop.
• Farmers who do not apply preventive fungicide treatment have between 60% and 80%
probability of ASR infestation; when ASR is observed they apply curative fungicide
treatment and are not affected by ASR in the remaining of the cropping season; however,
their yields are reduced by about 7% at harvest.
• Farmers in Regions II and III periodically check whether ASR infection occurs in the
adjacent downstream region (i.e. to the South). More specifically, Region-II watches ASR

15
infections in Region-I, and Region-III watches ASR infection in Region-II. We model these
considering two cases: 1) if the amount of land in the adjacent southern region infested with
ASR is less than 5% of the total soybean acreage in that region, then a farmer in the upstream
(northern) region has a “low risk” of infestation and does not apply preventive fungicide; and
2) if 5% or more of the soybean acreage in the downstream (southern) region is infested,
farmers in the adjacent upstream region are in “high risk” of ASR infestation, in which case
they have the choice to apply or not to apply preventive fungicide.
• Farmers in Region-I plant soybeans two weeks earlier than farmers in Region-II; and farmers
in Region-II plant soybeans two weeks earlier than farmers in Region-III.
Based on these assumptions, we develop a stochastic model of three distinct regions
(Regions I, II, and III) and three time periods during the cropping season. The producers are
assumed to be profit maximizers and consider the costs of both preventive and curative fungicide
applications when making their decisions to protect against ASR risk. If a proper application is
not done and rust occurs, the model penalizes this by reducing the soybean yield on the land that
exhibits ASR infestation (which coincides with the land on which curative fungicide treatment is
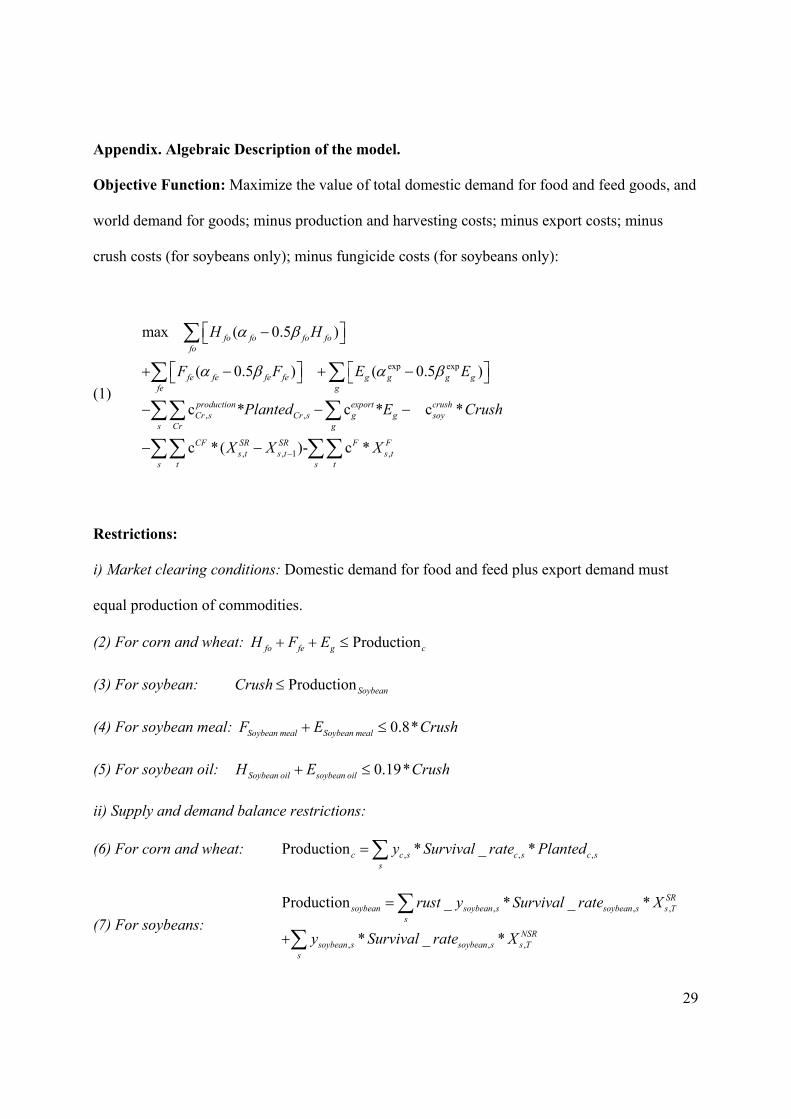
applied). For readability, we provide the algebraic details of the model in Appendix.
Data
The model described above requires a considerable amount of data. Specific data
requirements include base year commodity prices and demands at the farm gate, price elasticities
of food, feed and export demands, historical crop mixes (areas planted to individual crops -we

16
considered the period 1990-2006 for this), and regional crop yields and itemized crop budgets for
all producing regions. We employ year 2006 as the base year to conduct our simulations.
The data are obtained from various secondary sources including USDA’s National
Agricultural Statistics Service, Economic Research Service and Foreign Agricultural Service; the
farm decision outreach central at the University of Illinois. The costs of curative and preventive
fungicides treatments are obtained from Roberts et al. (2006).
Results
Table 1 presents the results of the base run, which demonstrates the validity of the model.
The first column presents the observed (actual) acreage data in 2006. The second column
presents the model output with no ASR incidence. In general, the planted acres reported in the
model solution column are highly close to the actual acreage, particularly for states that are
major producers of the respective crops. Overall, the acreage of corn, soybeans and wheat are
simulated with 1.4, 0.1 and 6.0 % deviation from the actual total acreages, respectively (see the
third column values). The fifth and sixth columns present the actual and simulated production of
the three crops. Again, the simulation values are highly satisfactory, showing 2.0%, 3.5%, and
10% deviation from the actual production values of corn, soybeans, and wheat, respectively, in
the base year. This is a strong indication of the model’s validity. Therefore, it can be used safely
for ASR analysis.
Table 2 presents the simulated impacts of ASR infestation and the farmers’ response to
control ASR spread, in terms of percent changes in acres planted, production, exports and prices
of soybeans, wheat and corn, relative to the base run (without ASR incidence). The simulation
results reveal substantial economic impacts associated with the ASR spread. Although at the

17
national level the soybean acreage declines marginally (0.6%), the production and exports
decline substantially by 8.4%, 26.3%, respectively, after ASR is introduced. The decrease in
production is mainly because of the adverse yield effects, rather than an acreage decline. The
relatively stable soybean acreage may be puzzling, but this is not surprising because the reduced
output increases the price, from $6.9 to $8.6 per bushel (23.4%), which encourages farmers to
plant soybeans despite the disease risk and increased production costs due to repeated fungicide
applications.
The regional breakdown of the simulated acreage figures shows interesting findings. The
impacts of ASR on acres planted vary substantially across states. In particular, the scenario with
ASR infection indicate that the most dramatic reductions in soybean acreage occur in states
bordering the southern region (i.e. Arkansas and Tennessee) and in Missouri. These states may
substitute soybeans with other crops to avoid higher production costs due to additional
fungicides and lower yields resulting from ASR. In contrast, under the ASR infection scenario,
Northern states such as Minnesota, the Dakotas, Wisconsin, Michigan and Iowa either increase
of keep the same planting levels of soybeans. Interestingly, our results show substantial
differences regarding the impact of ASR in the largest soybean-producing states: soybean
acreage increases by 5.4% in Iowa, keep constant in Illinois, increases 6.9% in Michigan, and
decreases by 19,6% in Missouri.
Other results no presented suggest that ASR infection may influence the structure of
agriculture across regions and across states. At the national level, the results show that corn
acreage, production and exports may experience modest reductions with ASR, -0.58%, -0.78%
and -3.54%, respectively; and corn prices could increase by 6.38%. Similarly, our simulations
suggest that the wheat sector exhibits changes in the presence of ASR infection. Specifically, in

18
the scenario with ASR, national wheat production increases by 0.1%, exports and prices hold
constant. The simulation results also indicate large changes in the structure of field crops
agriculture at the state level, with general gains in acreage and production in Northern states and
loses of acreage and production in Southern states.
Table 3 presents the simulation results corresponding to the soybean acreage on which
preventive and curative fungicide treatments are applied to control ASR spread and reduce yield
risk. The results indicate that the profit driven disease control strategy emphasizes curative
fungicide treatments in most of the southern states, in particular Mississippi, Louisiana, and S.
Carolina. This result makes sense because ASR tends to overwinter in those states. As expected,
the results suggest that region II and region III prefer to share the risk applying both preventive
and curative treatment due to relatively less risk of ASR incidence in those states. Also, the
Dakotas, Michigan and Minnesota would not apply preventive fungicide treatments since they
are immune to the disease because of their cold winter and cool summer conditions and
relatively drier weather. In the main soybean-producing states such as Iowa, Illinois, Ohio and
Indiana, the average number of preventive fungicide applications is 0.27, which means that
preventive fungicide application would be chosen by less than half of the soybean producers in
those states. While this may look like a good sign, the assumed probability of rust incidence is
high in those states if a preventive application has not been done. Therefore, on those acres (75%
of the total soybean acreage) a curative fungicide application may become necessary. All of
these results are intuitive.
Finally, Table 4 displays the welfare implications of ASR, namely consumers’ surplus,
producers’ surplus (net returns) and social surplus (sum of producers’ and consumers’ surplus)
considering the three crops and five commodities. The income effect of ASR on soybean and

19
corn producers is particularly noteworthy, 22.8% increase, which results from the price increase
following the reduced production. These gains are offset by the welfare losses of consumers,
particularly the losses of the consumers (buyers) of soybean products (soy oil and soy meal,
7.1% and 9.6%, respectively). The net effect on social welfare is a minor loss, about 0.1%.
Therefore, while assessing the economic and welfare impacts of ASR the distributional impacts
must be taken into account in addition to the total economic impact.

20
Table 1. Model Validation Acreage ( 1000 Ac) % Production (1000 bu) %
State Observed 2006 Model ChangeObserved 2006 Model Change
Corn IL 11,295.2 11,750.0 4.0% 1,817,450.0 1,889,826.3 4.0%IN 5,497.7 5,682.3 3.4% 844,660.0 872,654.4 3.3%IA 12,594.6 12,827.1 1.8% 2,050,100.0 2,087,057.6 1.8%KS 3,348.6 3,350.0 0.0% 345,000.0 345,000.0 0.0%
MN 7,296.9 7,449.6 2.1% 1,102,850.0 1,125,451.8 2.0%MO 2,698.8 2,650.0 1.8% 362,940.0 356,218.9 1.9%NE 8,096.5 8,100.0 0.0% 1,178,000.0 1,178,000.0 0.0%ND 1,689.3 1,690.0 0.0% 155,400.0 155,400.0 0.0%OH 3,148.7 3,441.0 9.3% 470,640.0 514,119.2 9.2%SD 4,498.1 3,800.0 15.5% 312,340.0 263,753.8 15.6%
Total 71,849.3 72,885.8 1.4% 9,986,980.010,190,257.1 2.0%Soybean
IL 10,095.7 9,950.0 1.4% 482,400.0 490,086.8 1.6%IN 5,697.6 5,482.3 3.8% 284,000.0 281,960.8 0.7%IA 10,145.7 9,924.5 2.2% 510,050.0 498,716.6 2.2%KS 3,148.7 3,150.0 0.0% 98,560.0 105,336.0 6.9%
MN 7,346.9 7,199.2 2.0% 319,000.0 312,455.6 2.1%MO 5,147.8 5,100.0 0.9% 194,180.0 207,918.7 7.1%NE 5,047.8 5,050.0 0.0% 250,500.0 250,500.0 0.0%ND 3,898.3 3,900.0 0.0% 119,970.0 119,970.0 0.0%OH 4,648.0 4,518.0 2.8% 217,140.0 212,293.9 2.2%SD 3,948.3 4,500.0 14.0% 130,900.0 149,126.6 13.9%
Total 73,268.7 73,341.1 0.1% 3,117,560.0 3,226,716.7 3.5%
Wheat IL 929.6 920.0 1.0% 60,970.0 60,314.4 1.1%IN 469.8 788.3 67.8% 31,740.0 53,234.4 67.7%IA 25.0 23.4 6.4% 1,188.0 1,111.6 6.4%KS 9,795.8 9,800.0 0.0% 291,200.0 291,200.0 0.0%
MN 1,749.3 1,751.2 0.1% 80,340.0 80,397.2 0.1%MO 999.6 1,350.0 35.1% 49,140.0 66,339.0 35.0%NE 1,799.2 1,800.0 0.0% 61,200.0 61,200.0 0.0%ND 8,796.2 8,800.0 0.0% 251,770.0 252,016.0 0.1%OH 989.6 876.2 11.5% 65,280.0 57,775.2 11.5%SD 3,308.6 3,025.0 8.6% 84,090.0 76,746.9 8.7%
Total 37,624.9 39,888.6 6.0% 1,179,035.0 1,297,042.1 10.0%

21
Table 2. Soybean Rust Effects on Soybean Planted Acres and Production Acreage ( 1000 Ac) % Production (1000 bu) %
Region State Base Run Soybean Rust Change Base Run Soybean Rust Change
Region 1 TX 260.0 225.1 ‐13.4% 4,325.5 3,476.0 ‐19.6% LA 902.4 921.9 2.2% 33,055.5 31,811.4 ‐3.8% MS 1,516.8 1,516.8 0.0% 42,129.2 39,423.5 ‐6.4% Al 172.2 172.2 0.0% 3,477.1 3,252.9 ‐6.4% GA 212.5 212.5 0.0% 6,787.6 6,454.4 ‐4.9% SC 538.4 538.4 0.0% 20,315.9 19,258.8 ‐5.2%
Region 2 AR 3,466.0 3,114.2 ‐10.2% 142,447.5 102,452.0 ‐28.1% TN 1,154.0 1,110.2 ‐3.8% 54,085.4 43,193.0 ‐20.1% NC 1,475.0 1,475.0 0.0% 59,740.7 56,549.4 ‐5.3% KY 1,220.0 1,220.0 0.0% 70,277.5 64,865.3 ‐7.7%
Region 3 IA 9,924.5 10,464.5 5.4% 498,716.6 495,928.5 ‐0.6% IL 9,950.0 9,950.0 0.0% 490,086.8 398,186.3 ‐18.8% IN 5,482.3 5,482.3 0.0% 281,960.8 266,415.6 ‐5.5% NE 5,050.0 5,050.0 0.0% 250,500.0 236,244.0 ‐5.7% OH 4,518.0 4,518.0 0.0% 212,293.9 200,287.3 ‐5.7% MO 5,100.0 4,100.0 ‐19.6% 207,918.7 129,696.3 ‐37.6% KS 3,150.0 3,150.0 0.0% 105,336.0 99,844.4 ‐5.2%
Region 4 MI 2,000.0 2,138.9 6.9% 89,550.0 95,768.8 6.9% MN 7,199.2 7,350.0 2.1% 312,455.6 319,000.0 2.1% ND 3,900.0 3,900.0 0.0% 119,970.0 119,970.0 0.0% SD 4,500.0 4,500.0 0.0% 149,126.6 149,126.6 0.0% WI 1,650.0 1,691.2 2.5% 72,160.0 73,961.4 2.5%
Total 73,341.1 72,801.1 ‐0.7% 3,226,716.7 2,955,166.1 ‐8.4%Exports and price effect
Exports (1000 bu) 1,128,368.2 831,429.2 ‐26.3% Price $/Bu 6.9 8.6 23.4%

22
Table 3. Fungicide Applications and Related Costs Area with Fungicide aplication ( 1000 Ac)
Region State Planted Area
(1000 Ac) Preventive % Curative %
Total Cost of fungicide applications (1000 US $)
Region 1 TX 225.1 0.0 0% 223.3 99% 1,563.4 LA 921.9 184.4 20% 741.2 80% 9,798.3 MS 1,516.8 0.0 0% 1,504.6 99% 10,532.4 Al 172.2 0.0 0% 170.8 99% 1,195.4 GA 212.5 0.0 0% 210.8 99% 1,475.3 SC 538.4 0.0 0% 534.1 99% 3,738.6
Region 2 AR 3,114.2 2,123.0 68% 1,610.1 52% 64,345.9 TN 1,110.2 756.9 68% 574.0 52% 22,940.1 NC 1,475.0 0.0 0% 1,435.2 97% 10,046.2 KY 1,220.0 183.0 15% 985.8 81% 11,475.3
Region 3 IA 10,464.5 1,569.7 15% 8,507.7 81% 98,795.5 IL 9,950.0 4,895.3 49% 6,346.8 64% 166,810.0 IN 5,482.3 822.3 15% 4,457.1 81% 51,758.3 NE 5,050.0 757.5 15% 4,105.7 81% 47,677.1 OH 4,518.0 677.7 15% 3,673.1 81% 42,654.3 MO 4,100.0 2,050.0 50% 2,476.4 60% 68,584.8 KS 3,150.0 694.9 22% 2,507.3 80% 34,923.6
Total 53,221.0 14,714.7 28% 40,063.9 75% 648,314.4

23
Table 4. Welfare effects Good Base Run model ($) Scenario with SR ($) Change
Consumer Surplus* Non Feed Consumption CORN 51,008,108.0 50,422,296.9 ‐1.1% WHEAT 7,313,752.9 7,313,882.9 0.0% SOY OIL 26,230,922.7 24,358,536.1 ‐7.1%Feed consumption CORN 41,563,852.7 40,614,155.1 ‐2.3% WHEAT 679,327.3 679,327.3 0.0% SOY MEAL 9,204,163.6 8,324,640.8 ‐9.6% Total (a) 136,000,127.2 131,712,839.0 ‐3.2%
Producer surplus** CORN 7,571,641.3 9,299,399.3 22.8% SOYBEAN 9,985,208.1 12,264,655.1 22.8% WHEAT 262,025.5 250,434.3 ‐4.4%Total (b) 17,818,875.0 21,814,488.7 22.4%
Crush Cost (c) 1,976,645.6 1,883,258.4 ‐4.7%Social Surplus (a) + (b) ‐ (c) 151,842,356.5 151,644,069.4 ‐0.1%
Conclusions and Future Research
In this study we evaluate the impacts of ASR on domestic soybean production and
commodity markets as well as the competitive position of the US in the soybean export market.
The study contributes to the empirical literature by developing a stochastic programming model
in which prices are determined endogenously and the spatial and temporal dynamics of ASR
dispersion are considered explicitly. Our simulation results suggest that the total soybean acreage
may be relatively stable, but substantial differences may occur in the regional distribution of
acreage and production. Specifically, the simulation results show that more land may be
allocated to soybean production particularly in the northern regions where soy rust effect is
minimal or virtually nonexistent. The results further indicate a gradual shift in soybean
production from lower-latitude states toward higher-latitude states, particularly towards the
traditional soybean-producing states such as Iowa, Illinois, Missouri and Nebraska. The southern
states bear the highest costs on preventive and curative fungicide treatments, in particular in the

24
Gulf States. Despite the total acreage maintain almost constant, total production of soybeans in
the US may decline substantially, as much as 8.4%, which would go hand in hand with a
dramatic price increase (23.4%). As a result, US exports would decline by 26%, and consumers
suffer a welfare loss (3.2%).
The next step of this study is to extend the model to assess the impacts of ASR on
domestic soybean production and commodity markets as well as the competitive position of US
versus Argentina and Brazil in the soybean export market. Our hypothesis is that an effective
control of the spread of ASR domestically may protect US soybean producers against production
losses and may also improve the competitive position of US in the export markets. Conversely,
adverse effects of ASR overseas may encourage U.S. producers to plant more soybeans in the
short or medium-run given higher price expectations.

25
References
Acquaye, A., J. Alston, H. Lee, and D. Sumner (2007), “Hurricanes and Invasive Species: The
Economics and Spatial Dynamics of Eradication Policies”, in A.G.J.M. Oude Lansink
(editor), New Approaches to the Economics of Plant Health, Wageningen UR Frontis
Series, Volume 20, Dordrecht: Springer, pp. 101-118.
Areal, F. and A. MacLeod (2007), “Estimating the Economic Value of Trees at Risk from a
Quarantine Disease”, in A.G.J.M. Oude Lansink (editor), New Approaches to the
Economics of Plant Health, Wageningen UR Frontis Series, Volume 20, Dordrecht:
Springer, pp. 119-130.
Bekkerman, A., B.K. Goodwin and N.E. Piggott (2008), “Spatio-temporal Risk and Severity
Analysis of Soybean Rust in the United States”, Journal of Agricultural and Resource
Economics, 33 (3): 311-330.
Goodwin, B.K. and N.E. Piggott (2007), “Risk and Indemnification Models of Infectious Plant
Diseases: The Case of Asiatic Citrus Canker in Florida”, in A.G.J.M. Oude Lansink
(editor), New Approaches to the Economics of Plant Health, Wageningen UR Frontis
Series, Volume 20, Dordrecht: Springer, pp. 71-99.
Integrated Aerobiology Modeling System, IAMS (2009), Forecasting the Aerial Dispersal of
Soybean Rust Spores throughout North America. Computational Epidemiology &
Aerobiology Laboratory, Pennsylvania State University.
Isard, S. A., Gage, S. H., Comtois, P. & Russo, J. M. (2005), “Principles of aerobiology applied
to soybean rust as an invasive species”, BioScience, 55: 851-862.
Isard, S. A., Russo, J. M. & Ariatti, A. (2007), “Aerial transport of soybean rust spores into the
Ohio river valley during September 2006”, Aerobiologia, 23: 271–282.
26
Johansson, R.C., M.J. Livingston and J. Westra, K. Guidry (2006), “Simulating the U.S. Impacts
of Alternative Asian Soybean Rust Treatment Regimes”, Agricultural and Resource
Economics Review, 35 9(1), 116-27.
Livingston, M., Johansson, R., Daberkow, S., Roberts, M., Ash, M. & Breneman, V. (2004).
Economic and policy implications of wind-borne entry of Asian soybean rust into the
United States, Electronic Outlook Report from the U.S. Department of Agriculture
Economic Research Service, OCS-04D-02. Retrieved August 1, 2007, from
http://www.ers.usda.gov/publications/OCS/APR04/OCS04D02/.
McCarl B.A. “Cropping Activities in Agricultural Sector Models: A Methodological Proposal,”
American Journal of Agricultural Economics 64 (1982):768-72.
McCarl B.A. and T. H. Spreen. “Price Endogenous Mathematical Programming as a Tool for
Policy Analysis,” American Journal of Agricultural Economics, 62 (1980):87-102.
Miles, M.R., R.D. Frederick, G.L. Hartman (2003), “Soybean Rust: Is the U.S. Soybean Crop At
Risk?” APSNet, viewed at http://www.apsnet.org/online/feature/rust/.
Moffitt, J.L., Stranlund, J.K., Field B.C., Osteen, C.D. (2007), “Robust Inspection for Invasive
Species With a Limited Budget”, in A.G.J.M. Oude Lansink (editor), New Approaches to
the Economics of Plant Health, Wageningen UR Frontis Series, Volume 20, Dordrecht:
Springer, pp. 7-22.
Mourits, M. and A, Oude Lansink (2007), “Multi-criteria Decision Making to Evaluate
Quarantine Disease Control Strategies”, in A.G.J.M. Oude Lansink (editor), New
Approaches to the Economics of Plant Health, Wageningen UR Frontis Series, Volume
20, Dordrecht: Springer, pp. 131-146.

27
Mueller, J.D., Stephen R. Koenning, Robert C. Kemerait, Jr., and Patrick M. Phipps (2006)
Soybean Rust Management in the Mid-Atlantic. Clemson University Extension Service,
North Carolina State University Cooperative Extension, South Carolina Department of
Agriculture, South Carolina Soybean Board, Virginia Cooperative Extension, and the
University of Georgia Cooperative Extension.
Mueller, J.D., Stephen R. Koenning, Robert C. Kemerait, Jr., and Patrick M. Phipps (2008)
Soybean Rust Management in the Mid-Atlantic. Clemson University Extension Service,
North Carolina State University Cooperative Extension, South Carolina Department of
Agriculture, South Carolina Soybean Board, Virginia Cooperative Extension, and the
University of Georgia Cooperative Extension.
Önal, H. and B.A. McCarl. “Exact Aggregation in Mathematical Programming Sector Models,”
Canadian Journal of Agricultural Economics 39(1991):319-334.
Oude Lansink, A.G.J.M (2007) New Approaches to the Economics of Plant Health, Wageningen
UR Frontis Series, Volume 20, Dordrecht: Springer.
Roberts, M.J., D. Schimmelpfennig (2006), “Public Information Creates Value,” Amber Waves 4
(2), 10-17.
Roberts, M. J., Schimmelpfennig, D., Ashley, E. and Livingston, M. (2006). The value of plant
disease early-warning systems: A case study of USDA’s soybean rust coordinated
framework. United States Department of Agriculture, Economic Research Service,
Economic Research Report No. 18. Retrieved August 1, 2007 from
http://www.ers.usda.gov/publications/err18/err18fm.pdf.
Rossman, A.Y. (2008), “The impact of invasive fungi on agricultural ecosystems in the United
States,” Biological Invasions, published online on July 9, 2008.

28
Surkov I.V., A.G.J.M. Oude Lansink, W. Van Der Werfand and O. Van Kooten (2007),
“Designing Optimal Phytosanitary Inspection Policy”, in A.G.J.M. Oude Lansink
(editor), New Approaches to the Economics of Plant Health, Wageningen UR Frontis
Series, Volume 20, Dordrecht: Springer, pp. 39-54.
Sweets, L.E., J. Allen Wrather and Simeon Wright (2004), Soybean Rust. Published by Missouri
Cooperative Extension, University of Missouri – Columbia.
Takayama, T. and G. Judge (1971). Spatial and Temporal Price and Allocation Models,
Amsterdam, North Holland Publications Co.
U.S. Department of Agriculture (2009), http://sbr.ipmpipe.org/cgi-bin/sbr/public.cgi, visited
frequently from June, 2008 through April, 2009.
29
Appendix. Algebraic Description of the model.
Objective Function: Maximize the value of total domestic demand for food and feed goods, and
world demand for goods; minus production and harvesting costs; minus export costs; minus
crush costs (for soybeans only); minus fungicide costs (for soybeans only):
(1)
exp exp
, ,
, , 1 ,
max ( 0.5 )
( 0.5 ) ( 0.5 )
c * c * c *
c *( )- c *
fo fo fo fofo
fe fe fe fe g g g gfe g
production export crushCr s Cr s g g soy
s Cr g
CF SR SR F Fs t s t s t
s t s t
H H
F F E E
Planted E Crush
X X X
α β
α β α β
−
−
+ − + −
− − −
− −
∑
∑ ∑
∑∑ ∑
∑∑ ∑∑
Restrictions:
i) Market clearing conditions: Domestic demand for food and feed plus export demand must
equal production of commodities.
(2) For corn and wheat: Productionfo fe g cH F E+ + ≤
(3) For soybean: ProductionSoybeanCrush ≤
(4) For soybean meal: 0.8*Soybean meal Soybean mealF E Crush+ ≤
(5) For soybean oil: 0.19*Soybean oil soybean oilH E Crush+ ≤
ii) Supply and demand balance restrictions:
(6) For corn and wheat: , , ,Production * _ *c c s c s c ss
y Survival rate Planted=∑
(7) For soybeans: , , ,
, , ,
Production _ * _ *
* _ *
SRsoybean soybean s soybean s s T
sNSR
soybean s soybean s s Ts
rust y Survival rate X
y Survival rate X
=
+
∑
∑

30
iii) Land available restriction: Total planted equals total land available (by State)
(8) , _Cr s sCr
Planted land av s≤ ∀∑
iv) ASR treatment decision: A critical component of the model relates to the farmer’s decision of
applying or not applying preventive fungicide treatment, which depends on ASR infection in the
adjacent downstream (southern) region. This is achieved by using a binary variable that reflects
whether the severity of rust occurrence (rust infested area / soybean acreage) in the downstream
region exceeds a specified threshold level1 . For each period (t), we define slack and surplus
variables, S and U. If S>0, the threshold level is not reached, therefore the rust incidence is not
considered as severe. If U>0, the threshold value is exceed (by the amount U). In each situation,
only one of these two cases can occur. We reflect this by a binary variable Z, where Z = 1 if the
threshold level is exceeded, otherwise Z = 0. The following equations depict these possibilities:
(9)
1, , 1 ,
, ,
, ,
, , 1
* 1 (1 ) 1
1 1 1
SRs t s t s s t
s t s t
s t s t
s t s t
X S Treshold X U s tS m Z s tU mZ s tZ Z s t
− −
−
+ = + > ∧ ∀
≤ − > ∧ ∀
≤ > ∧ ∀
≥ > ∧ >
(where m is an arbitrarily specified large number)
v) Land to allocate either to apply preventive fungicide or do anything:
(10) , ,
,, , , 1
, ,
1
1
1 1
F NFs t s t s
F NF NSR NFs t s t s t
Fs t s t
X X X s t
X X X s t
X mZ s t−
+ = ∀ ∧ =
+ = ∀ ∧ >
≤ > ∧ >
vi) Land with ASR
1 This threshold is region-specific. This means that each region has a unique probability of ASR infection, depending on such climatic conditions as temperature, humidity and wind speed.

31
(11) , , , ,
, , 1 , 1 , 1 , , ,
, ,
( | ) 1
( | ) ( | ) 1 1
1
SR NFs t s t s t s t
SR F SR NFs t s t t s t s t s t s t s t
SRs t s t
X P SR NF X s t
X P SR F X X P SR NF X s t
X mZ s t− − −
= ∀ ∧ =
= + + > ∧ >
≤ > ∧ ∀
vii) Land without SR and without fungicide application
(12)
,, , , ,
,, , , 1 , 1 , , ,
,, , , , ,
,, , , 1 , 1
(1 ( | )) 1
(1 ( | )) (1 ( | )) 1
(1 ( | )) (1 ) 1 1
(1 ( | )) (
NSR NF NFs t s t s t s t
NSR NF F NFs t s t s t s t s t s t s t
NSR NF NFs t s t s t s t s t
NSR NF Fs t s t s t s t
X P SR NF X s t
X P SR F X P SR NF X s t
X P SR NF X m Z s t
X P SR F X
− −
− −
= − ∀ ∧ =
= − + − ∀ ∧ >
≤ − + − > ∧ =
≤ − + , , , ,
,, ,
1 ( | )) (1 ) 1 1
1
NFs t s t s t s t
NSR NF NFs t s t
P SR NF X m Z s t
X X s t
− + − > ∧ >
≤ > ∧ ∀
ix) Land without SR
(13) ,, , ,
NSR F NSR NFs t s t s tX X X s t= + ∀ ∧ ∀ .
The first three equations in system (9) indicate that if ASR is greater than 5% in a given
region, then S must be 0 and U must be greater than 0; otherwise S should be greater than 0 and
U equal to 0 and farmers in the region do not apply fungicide treatment and wait for the
following period. The fourth equation indicates that farmers decide whether or not to apply
preventive fungicide because ASR was found in the previous period in the downstream region in
excess of the region-specific threshold. In this case the risk of infection is high.
We employ separable programming procedures to linearly approximate the nonlinear
functions involved in the objective function (representing the producers’ and consumers’
surplus). This is needed because the nonlinear solver GAMS/MINOS cannot handle binary
decision variables. After linear approximation of the nonlinear functions the optimization
problem is solved using GAMS/CPLEX.