a9r7791
TRANSCRIPT

7/31/2019 A9R7791
http://slidepdf.com/reader/full/a9r7791 1/20
Depositary Receipts:Creating Value across
Emerging Markets
Te aim o this brieng is to provide an independent, robust analysis o the value
and liquidity eects o depositary receipts (DRs) established by companies rom
emerging markets. Te DR programmes o 628 rms were analysed, covering the
period 1980-20071. Te key conclusions rom the research are outlined below:
• Stock exchange-listed DRs (both ADRs and GDRs) add (on average) over 20%
o shareholder value in their rst year o trading as the international markets
welcome the greater nancial disclosure, transparency and signal o superior
governance;
• OC-traded DRs (both ADRs and GDRs) add over 30% o value on average;
• An upgrade rom an OC-traded DR to a stock exchange-listed DR
programme adds on average a urther 60% o value as investors respond to the
higher reporting standards;
• Delisting a listed DR programme to the over-the-counter trading market
destroys 20% o value on average as it becomes clear that the additional
nancial reporting will be withdrawn;
• Listed DRs improve home-market liquidity by 40% on average, as access to,
and visibility in, the issuer’s stock rises and is accompanied by greater and widercoverage by equity analysts;
• OC-traded DRs improve home-market liquidity by 48% on average;
Empirical evidence is presented that DR programmes established by rms in
emerging markets add signicant value and improve home-market liquidity to
the benet o both issuers and investors. DRs additionally provide a strong signal
o willing disclosure, greater transparency and superior governance, particularly
important rom emerging, less-regulated markets.
1 to 30 June 2007
N THIS ISSUE
oreword 4
xecutive Summary 5
ntroduction 5
erformance of
isted DRs 7
erformance of
OTC DRs 11
mpact of Upgrading
nd Delisting 16
vidence on Liquidity
mprovement 17
ummary and Conclusions 18
A Glossary of Terms 19
Appendix 19
Our partner in developing this
esearch paper...

7/31/2019 A9R7791
http://slidepdf.com/reader/full/a9r7791 2/20
As the world’s leading depositary bank, we strongly believe in the benets o issuing and investing in
depositary receipts (DRs). Although we have a vested interest in DRs, time and again the acts support the
benets. Over the years we have seen DRs bring positive, measurable change to the non-U.S. companies
that issue them – rom double-digit growth in shareholder value to elevated liquidity to dramatic increases
in international name and brand recognition. In today’s increasingly global marketplace, DRs allow companies to eectively expand their presence beyond their own borders. And nowhere have these results
proven stronger than in the emerging markets.
We are extremely pleased that Oxord Metrica, a respected strategic adviser specializing in research-based
intelligence, has drawn these conclusions independently as they relate to the emerging markets. As you
review the data within, you will see that no matter a corporation’s country, DRs add tangible value with
remarkable consistency. DR issuers can attest to the act that once they establish a DR program, it just
keeps on working or them.
We are pleased to have contributed to Oxord Metrica’s study and welcome your questions or comments
on DRs.
Christopher Sturdy
Head, Depositary Receipt Division
Te Bank o New York Mellon
Te Bank o New York Mellon
1 Wall Street
New York, NY 10286

7/31/2019 A9R7791
http://slidepdf.com/reader/full/a9r7791 3/20
Foreword
Chie executives o corporations and their board o directors need to consider the costs and benets
o internationalising their shareholder base. Tere are several routes open to achieving this objective,
rom attracting oreign investors to the local market to selling shares in an international public oer-
ing. I choosing to go abroad, the choice between a stock exchange listing and an over-the-counter
(OC) quotation platorm is necessary. Finally, a choice on jurisdiction is required. Each one o
these choices entails careul consideration. Tis has become ever more relevant as the perceived cost
in international regulatory compliance has increased, particularly in the United States.
Te most popular route to access the international equity capital markets in the last quarter century
has been the depositary receipt. Tis instrument enables corporations rom around the world to
oer international investors access to oreign shares in the orm o a security local to the investor.
Generally, when the depositary receipt is primarily traded in the U.S., the securities are called Ameri-
can depositary receipts (ADRs). When the securities are primarily traded outside the U.S. they are
called global depositary receipts (GDRs). Both ADRs and GDRs may be listed on a stock exchange
or traded over-the-counter. For simplication, we reer to ADRs and GDRs collectively as “DRs.”
Te ultimate criterion by which these alternatives should be evaluated is the value created by theprogramme. Any sensible board o directors would expect to take an evidence–based decision in
order to ensure that a programme o internationalisation added value net o costs or the sharehold-
ers. Measurement issues aside, such decisions are difcult as they are oten one-o and thereore
the company has no specic experience to draw on. Tis problem is particularly elt in the so-called
emerging markets. Te best proxy or your own experience is to understand what has happened to
others. In the case o the emerging markets, no comprehensive source o inormation on the impact
o depositary receipts on share price has been available to assist boards in this crucial area.
At Oxord Metrica, we have been researching and analysing international equity markets or nearly
a decade. With data and input rom Te Bank o New York Mellon, we are delighted to make
available this report on the impact o establishing a DR programme on stock price and liquidity or
emerging markets. Te report is a rigorous analysis o all emerging-market DR programmes estab-lished rom January 1980 to the present. Te study is based on our comprehensive database o all
the companies that have created such instruments.
Te results are striking. DR programmes demonstrably add considerable value across markets,
regions and types o instrument (listed or OC). In addition, the results clearly show that there
continues to be a lively demand or the DR with a strong showing o new programmes every year.
Obviously the impact on a particular company’s share price will be unique. However, we aim to
provide this report to support the decision to establish a DR programme. Te specic circumstances
o each corporation need to be considered when placing a company in the context o these results.
We grateully acknowledge the assistance o Te Bank o New York Mellon, a leading player in the
Depositary Receipt industry, or agreeing to underwrite this project.
Dr Rory Knight
Chairman, Oxord Metricia
All data underlying this study are
publicly available and were obtained
from a variety of online sources
including, but not limited to, the
websites of the U.S. Securities
and Exchange Commission (SEC);
international stock exchanges including
the American Stock Exchange (AMEX),
the Dubai International Financial
Exchange (DIFX), the London Stock
Exchange (LSE), the Luxembourg Stock
Exchange (LuxSE), NASDAQ and the
New York Stock Exchange (NYSE);
and the leading depositary banks.
The raw data on local and U.S. share
prices, market indices, trading volumes,
market values and exchange rates were
obtained from Bloomberg’s financial
database.
October 200

7/31/2019 A9R7791
http://slidepdf.com/reader/full/a9r7791 4/20
Executive Summary
he aim o this brieing is to provide an independent, robust analysis o the value and liquidity eects
o depositary receipts (DRs) established by companies rom emerging markets. he DR programmes
o 628 irms were analysed, covering the period 1980-20071. he key conclusions rom the research
are outlined below.
Key Conclusions
1 Stock exchange-listed DRs (both ADRs and GDRs) add (on average) over 20% o shareholder value
in their irst year o trading as the international markets welcome the greater inancial disclosure,
transparency and signal o superior governance; Figure 3. Subregional results include:
• 15% value added in Asia; Figure 4
• 8% value added in EEMEA; Figure 6
• 35% value added in Latin America; Figure 7
• 35% value added in BRIC countries; Figure 9
2 OC-traded DRs (both ADRs and GDRs) add over 30% o value on average; Figure 11.
Subregional results include:
• 25% value added in Asia; Figure 12
• 30% value added in EEMEA; Figure 14
• 40% value added in Latin America; Figure 17
• 50% value added in BRIC countries; Figure 19
3 An upgrade rom an OC-traded DR to a stock exchange-listed DR programme adds on average a
urther 60% o value as investors respond to the higher reporting standards; Figure 21.
4 Delisting a listed DR programme to the over-the-counter trading market destroys 20% o value on
average as it becomes clear that the additional inancial reporting will be withdrawn; Figure 22.
5 Listed DRs improve home-market liquidity by 40% on average, as access to, and visibility in, the
issuer’s stock rises and is accompanied by greater and wider coverage by equity analysts; Figure 23.
OC-traded DRs improve home-market liquidity by 48% on average; Figure 24.
Empirical evidence is presented that DR programmes established by irms in emerging markets add
signiicant value and improve home-market liquidity to the beneit o both issuers and investors. DRs
additionally provide a strong signal o willing disclosure, greater transparency and superior governance
particularly important rom emerging, less-regulated markets.
1. Introduction
he analysis presented in this report measures the value and liquidity impact on local shares o es-
tablishing, upgrading or delisting a depositary receipt (DR) programme2
. he ull history o DRs isanalysed, rom 1980 to 2007. In this particular report, the ocus is on emerging markets, as deined
by the MSCI International Equity Indices; see Appendix or deinition.
Shown in Figure 1 is the number o DR programmes by year over the last decade3. For the purpose
o this study, Level I DR programmes are deined as DRs that trade on an over-the-counter (OC)
market and are exempt rom most international reporting and accounting requirements.
1 to 30 June 2007 2 For definitions of industry terminology, see “A Glossary of Terms.” 3 Where the year runs from 1 July to 30 June, thus the graph shows DRs from 1 July 1997 to 30 June 2007.

7/31/2019 A9R7791
http://slidepdf.com/reader/full/a9r7791 5/20
Despite recent doubts expressed over the beneits o cross-listing, the dramatic increase in listings rom
emerging markets is clear rom this graph. Subsequent sections o this report will quantiy the share-
holder value and liquidity beneits or these irms.
Figure 2 provides an illustrative overview o the empirical research presented herein.
Figure 1: A decade of success in DRs
Figure 2: Analytical framework
In sections 2 and 3 o this report, the research ocuses on the value impact o establishing a new listed
(Levels II/III) or new OC (Level I) DR programme, respectively. Following these aggregate analyses
our regions rom within emerging markets are evaluated separately: Asia, EEMEA (Eastern Europe,
the Middle East and Arica), Latin America and the BRIC countries o Brazil, Russia, India and
China.
In contrast, stock exchange-listed DRs (Levels II/III) require international registration, reconciliation
with U.S. generally accepted accounting principles (GAAP) or international inancial reporting stan-
dards (IFRS) and annual reporting according to the particular stock exchange requirements.

7/31/2019 A9R7791
http://slidepdf.com/reader/full/a9r7791 6/20
4 Market-wide factors removed include all those which are found, statistically, to be influencing all stocks in that market or sector. They include,
for example, macroeconomic changes such as interest-rate movements and core economic trends, and key industry-wide events. All returns are
presented on a risk-adjusted basis. That is, the returns are adjusted to take account of the stock’s price sensitivity to the market as a whole – the
firm’s beta. The result of these modelling procedures is a daily impact of the establishment of the DR programme on a firm’s local share price;
Value Reaction™. The metric captures a firm’s shareholder value performance, relative to investors’ expectations, in the domestic stock market.
By making the necessary adjustments, ValueReaction™ captures a very clean measurement of impact, which is the firm-specific value response
to establishment of the DR programme.
5 For DR programmes involving Initial Public Offerings (IPOs) where data is not available before the date of DR establishment, the average
figures in the graph have been adjusted accordingly.
2. Performance of Listed DRs
his section ocuses on the value impact on an emerging-market company o establishing a listed
(Levels II/III) DR programme. Using the methodology described in the previous section, Figure3 shows the average value impact on share prices in the issuers’ local markets across 380 new listed
programmes.
Figure 3: Over 20% added from Listed (Levels II/III) DRs
he graph shows a modelled share price reaction (using local share prices), where market-wide inlu-
ences have been stripped out and the returns are risk-adjusted4. he dates on which the new pro-
grammes started trading have been aligned to Event Day Zero; the graph relects one calendar year. Adegree o inormation leakage to the markets is evident as the additional value becomes apparent over
the twenty trading days prior to Day 05.
Investors anticipate the programmes and the positive market reaction is sustained through the year.
By the end o the irst year’s trading, in an equally-weighted investment strategy, investors have added
over 20% (equivalent to over US$100 billion) to their portolios.
he next ew graphs show the value reaction across selected regions in the emerging markets portolio:
Asia, EEMEA (Eastern Europe, the Middle East and Arica), Latin America and the BRIC countries
(Brazil, Russia, India and China).
Section 4 ocuses on the interaction between the listed and OC DRs. Both the value impact o
upgrading one’s programme (moving rom Level I to Level II/III) and delisting one’s programme
(moving rom Level II/III to Level I) are analysed. Finally, in section 5, the eect on home-market
liquidity o establishing DRs is evaluated.

7/31/2019 A9R7791
http://slidepdf.com/reader/full/a9r7791 7/20
It can be seen that 15% o value is added to the Asian portolio o new DR programmes, equivalent to
over US$40 billion in an equally-weighted investment portolio. Particularly strong value was realised
in India; Figure 5.
Figure 4: Over 15% added across Asia
Figure 5: Strong value added in India

7/31/2019 A9R7791
http://slidepdf.com/reader/full/a9r7791 8/20
he picture here is positive but more volatile, the volatility being due, in part, to the smaller portolio
size under analysis.
he results rom Latin America are stellar with companies, on average, increasing their value by over
one-third. his is equivalent to US$72 billion in an equally-weighted investment portolio.
Figure 6: Significant value impact across EEMEA
Figure 7: 35% value added across Latin America
O the 84 new DR listings by Indian companies, 51 have been on the Luxembourg Stock Exchange.
Across the EEMEA region also, the positive value eects are demonstrable in Figure 6 with a signi-
cant 8% o value being added to portolios, equivalent to US$1.4 billion.

7/31/2019 A9R7791
http://slidepdf.com/reader/full/a9r7791 9/20
he inal region selected or analysis is that o the so-called BRIC countries: Brazil, Russia, India and
China. For these purposes, China is considered as mainland China and excludes aiwan (and Hong
Kong, considered a developed market). Shown in Figure 9 is the value reaction.
Figure 8: Strong value in Mexico
Figure 9: 35% value added across BRIC countries
Te New York Stock Exchange appears as the exchange o choice or Latin American companies,
dominating the listings with 87 o a total 98 new programmes rom the region.
Presented in Figure 8 is the value reaction to programmes established by Mexican companies; equiva-
lent to US$22 billion in monetary terms.

7/31/2019 A9R7791
http://slidepdf.com/reader/full/a9r7791 10/20
10
Figure 10: Substantial value added in Brazil
3. Performance of OTC DRs
Presented in this section is an analysis o irms’ local share-price perormance ollowing the establish-
ment o an over-the-counter (Level I) DR programme. Unlike their U.S.-listed counterparts, OC
programmes are exempt rom U.S. reporting requirements and rom U.S. GAAP compliance.
Shown in Figure 11 is the value reaction to 248 irms across emerging markets as they establish an
OC (Level I) programme.
It is clear that by signing up voluntarily to more stringent standards o reporting and disclosure,companies rom emerging markets can make a strong signal o their willingness to embrace superior
governance. hese signals are not lost on the markets, and the companies are rewarded with higher
valuations.
Figure 11: Over 30% added from OTC (Level I) DRs
A dramatic 35% o value is added, on average, to companies across these countries, equivalent to over
US$36 billion. In Brazil speciically, 80% o value is added (US$33 billion); Figure 10.

7/31/2019 A9R7791
http://slidepdf.com/reader/full/a9r7791 11/20
11
A steady and sustained 25% o value is added to irms, equivalent to US$9 billion. Figure 13 shows
the powerul value eects in mainland China due to establishing an OC DR programme.
he value impact is dramatic with approximately one-third o companies’ value being added in
the year ollowing establishment. In an equally-weighted investment strategy, this is equivalent to
US$136 billion.
he ollowing graphs show the value reaction in dierent subregions o emerging markets. Presented
in Figure 12 is the value impact across Asia.
Figure 12: 25% value added across Asia
Figure 13: Strong performance in mainland China

7/31/2019 A9R7791
http://slidepdf.com/reader/full/a9r7791 12/20
1
Approximately 30% o value is added across this region by the establishment o a Level I programme,
equivalent to US$84 billion. wo countries notable in driving the value growth in this region are Rus-sia and South Arica; Figures 15 and 16.
Figure 16: More volatile but still impressive in South Africa
Over 30% (US$3 billion) is added to an investment portolio o such irms. Similarly strong results
are ound in the region o Eastern Europe, the Middle East and Arica (EEMEA); Figure 14.
Figure 14: Higher valuations across EEMEA
Figure 15: Dramatic value growth in Russia

7/31/2019 A9R7791
http://slidepdf.com/reader/full/a9r7791 13/20
1
In Russia and South Arica, respectively, the value added to investors has been 90% (US$221 billion)
and 14% (US$5 billion).
Latin American irms demonstrate strong value growth in the year ollowing establishment o an OC
programme; Figure 17. Over 40% is added on average to such an investment portolio, equivalent to
US$34 billion.
Figure 17: 40% value added in Latin America
Figure 18: Further success in Mexico
Both listed and OC DR programmes prove popular and successul amongst Mexican companies,
with OC programmes adding 14% in value over the irst trading year, equivalent to almost US$9
billion.

7/31/2019 A9R7791
http://slidepdf.com/reader/full/a9r7791 14/20
1
Figure 19: 50% value added across BRIC
he inal region under consideration within the emerging markets is the BRIC region, which includes
Brazil, Russia, India and China. Shown in Figure 19 is the value perormance across these countries
ollowing the establishment o an OC DR programme.
Firms rom these countries add on average 50% o shareholder value in the irst trading year, equiva-
lent to an impressive US$150 billion.
Figure 20: Impressive performance from Brazil
Similar in percentage terms is the value reaction to Brazilian companies establishing an OC DR programme, equivalent to US$11 billion in monetary terms.

7/31/2019 A9R7791
http://slidepdf.com/reader/full/a9r7791 15/20
1
4. Impact of Upgrading and Delisting
his section ocuses on the interaction between OC (Level I) DR programmes and U.S.-listed (Lev-
els II/III) programmes. Speciically, the value eects o upgrading rom a Level I to a Level II/III, and
delisting rom a Level II/III to a Level I programme, are measured.
Figure 21 illustrates clearly the value enhancement possibilities o upgrading one’s programme to meet
more rigorous reporting and disclosure requirements, whereas Figure 22 is a stark warning to issuers
considering delisting.
Figure 22: …and 20% value destroyed by delisting
For U.S.-listed issuers wishing to delist but not incur such extensive value losses, there is now a
premier level o OC programme, the International OCQX SM programme launched by Pink Sheets
LLC. his tier o programme enables issuers to retain the advantages o an OC DR programme
(rather than terminate it completely) but distinguish themselves through speciied disclosures.
Figure 21: 60% value added by upgrading…
7/31/2019 A9R7791
http://slidepdf.com/reader/full/a9r7791 16/20
1
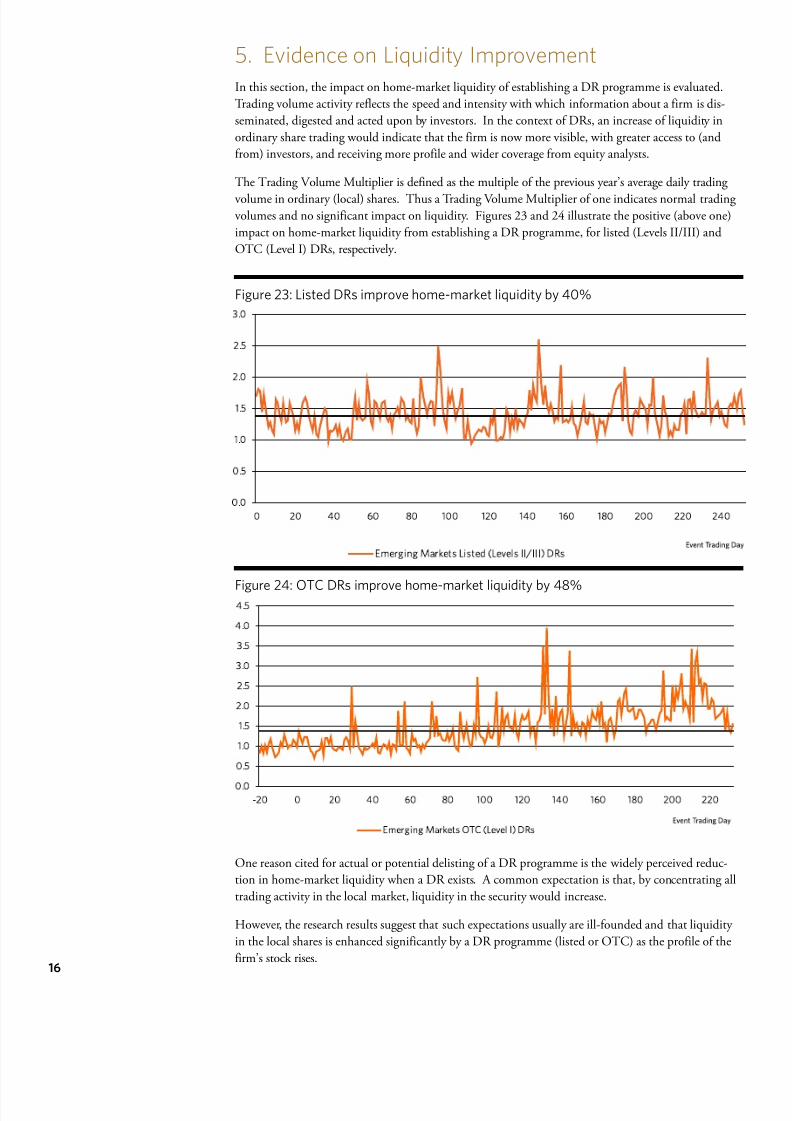
5. Evidence on Liquidity Improvement
In this section, the impact on home-market liquidity o establishing a DR programme is evaluated.
rading volume activity relects the speed and intensity with which inormation about a irm is dis-
seminated, digested and acted upon by investors. In the context o DRs, an increase o liquidity in
ordinary share trading would indicate that the irm is now more visible, with greater access to (and
rom) investors, and receiving more proile and wider coverage rom equity analysts.
he rading Volume Multiplier is deined as the multiple o the previous year’s average daily trading
volume in ordinary (local) shares. hus a rading Volume Multiplier o one indicates normal trading volumes and no signiicant impact on liquidity. Figures 23 and 24 illustrate the positive (above one)
impact on home-market liquidity rom establishing a DR programme, or listed (Levels II/III) and
OC (Level I) DRs, respectively.
Figure 23: Listed DRs improve home-market liquidity by 40%
Figure 24: OTC DRs improve home-market liquidity by 48%
One reason cited or actual or potential delisting o a DR programme is the widely perceived reduc-
tion in home-market liquidity when a DR exists. A common expectation is that, by concentrating all
trading activity in the local market, liquidity in the security would increase.
However, the research results suggest that such expectations usually are ill-ounded and that liquidity
in the local shares is enhanced signiicantly by a DR programme (listed or OC) as the proile o the
irm’s stock rises.

7/31/2019 A9R7791
http://slidepdf.com/reader/full/a9r7791 17/20
1
6. Summary and Conclusions
he research conducted demonstrates that, on average, there are signiicant value and liquidity advan-
tages to be gained by emerging-market companies which pursue a cross-listing. Furthermore, with the
help o eective investor relations, it appears that these advantages are sustainable over the long-term.
Figure 25 shows the DR perormance or emerging-market companies over the last our years against
the S&P 500 Composite Index. An investment o US$100 million in the S&P 500 Composite Index
over the last our years would be worth US$155 million at the end o the period. A similar investmen
in he Bank o New York Emerging Markets ADR Index would be worth US$341 million.
DR programmes have much to oer irms in emerging markets seeking to demonstrate their growing
willingness to embrace robust standards o inancial disclosure and reporting, heighten their visibility
and expand their investor bases.
Figure 25: Sustained performance over time

7/31/2019 A9R7791
http://slidepdf.com/reader/full/a9r7791 18/20
1
A Glossary of Terms
Delisting he downgrading o a DR programme rom listed (Levels II/III)
status to OC (Level I) status.
Depositary Receipt (DR) A negotiable receipt, denominated in U.S. dollars and issued as a
certiicate, that represents a set number o a non-U.S. irm’s pub-
licly-traded shares in its home market. It is sponsored by a U.S.
depositary bank.
Listed (Levels II/III) DRs DRs that are listed on a U.S. exchange (NYSE, NASDAQ or
AMEX) or an international exchange (including London and Lux-
embourg) and require, thereore, a higher degree o registration,
accounting (US GAAP or IFRS) and annual reporting. Level II
DRs are deined as a listing without a capital raising in DR orm.
Level III DRs additionally raise capital.
OTC (Level I) DRs DRs that trade in the “over-the-counter” market and are exempt
rom U.S. reporting requirements and rom complying with U.S.
GAAP.
Upgrade Te development o a DR programme rom one status to another
or which additional requirements must be met. ‘Pure’ upgrades
represent those DR programmes that are upgraded rom OC
(Level I) status to listed (Levels II/III) status.
Appendix
For the purposes o the research presented herein, emerging markets are deined as the 25 countries
included in the MSCI Emerging Markets Index plus the 8 MSCI Stand-alone countries; Gul Coop-
eration Council (GCC) plus Sri Lanka and Venezuela. hese 33 countries – presented in Figure 26
– capture 95% o the listed and OC DRs established by irms in all markets which could be consid-
ered “emerging”.
Figure 26: Emerging Markets defined6
MSCI International Equity Indices --- Country and Market Coverage
MSCI World Index
Stand-alone
Countries
Latin America Europe
Middle East
Africa
Argentina
BrazilChile
Colombia
Mexico
Peru
Emerging
Asia
North America Europe
Canada
United States
Austria
BelgiumDenmark
Finland
France
Germany
Greece
Ireland
Italy
Netherlands
Norway
Portugal
Spain
Sweden
Switzerland
United Kingdom
Australia
Hong KongJapan
New Zealand
Singapore
Pacific
MSCI Emerging Markets Index
Czech Republic
EgyptHungry
Israel
Jordan
Morocco
Poland
Russia
South Africa
Turkey
China
IndiaIndonesia
Korea
Malaysia
Pakistan
Philippines
Taiwan
Thailand
GCC Count
BahrainKuwait
Oman
Qatar
Saudi Arabi
United Arab
Emirates
Sri Lanka
Venezuela

7/31/2019 A9R7791
http://slidepdf.com/reader/full/a9r7791 19/20
1
Figure 27: Listed (Levels II/III) DRs by country
Figure 28: OTC (Level I) DRs by country
Presented in Figures 27 and 28, respectively, are the distributions by country o listed (Levels II/III)
and OC (Level I) DRs7.
6Source: MSCI Barra
7 at 30 June 2007

7/31/2019 A9R7791
http://slidepdf.com/reader/full/a9r7791 20/20
Oxford Metrica
Oxord Metrica is an independent research and analytics irm in international investments. We ocus
on risk, value reputation and governance – the strategic aspects o inancial perormance. he irm
connects inancial and risk theory with real data to provide empirical, quantitative and practical analy-
sis or clients worldwide. Oxord Metrica aims to provide evidence-based support or key manage-
ment decisions. Oxord Metrica also provides research and analytics to several Hedge und managers,
particularly those involving emerging markets and multi-manager strategies. We would be happy to
discuss the implications o this current report or your company. Ater all, a potential increase in value
o 15% to 20% is worth considering. For urther inormation, please visit our website at
www.oxordmetrica.com.
The Bank of New York Mellon
Te Bank o New York Mellon’s Depositary Receipt business is conducted through Te Bank o New
York subsidiary, which acts as depositary or more than 1,270 American and global depositary receipt
programmes, acting in partnership with leading companies rom 60 countries. With an unrivalled
commitment to helping securities issuers succeed in the world’s rapidly evolving nancial markets, the
Company delivers the industry’s most comprehensive suite o integrated depositary receipt, corporate
trust, and stock transer services. Additional inormation is available at www.adrbny.com.
Te Bank o New York Mellon Corporation is a global nancial services company ocused on help-
ing clients manage and move their nancial assets, operating in 37 countries and serving more than
100 markets. Te company is a leading provider o nancial services or institutions, corporationsand high-net-worth individuals, providing superior asset management and wealth management, asset
servicing, issuer services and treasury services through a worldwide client-ocused team. It has more
than $20 trillion in assets under custody and administration and more than $1 trillion in assets under
management. Additional inormation is available at www.bnymellon.com