a unified theory of early visual representa tions … · published as a conference paper at iclr...
TRANSCRIPT

Published as a conference paper at ICLR 2019
A UNIFIED THEORY OF EARLY VISUAL REPRESENTA-TIONS FROM RETINA TO CORTEX THROUGH ANATOMI-CALLY CONSTRAINED DEEP CNNS
Jack Lindsey∗†, Samuel A. Ocko∗, Surya Ganguli1, Stephane Deny†Department of Applied Physics, Stanford and 1Google Brain, Mountain View, CA
ABSTRACT
The vertebrate visual system is hierarchically organized to process visual infor-mation in successive stages. Neural representations vary drastically across thefirst stages of visual processing: at the output of the retina, ganglion cell receptivefields (RFs) exhibit a clear antagonistic center-surround structure, whereas in theprimary visual cortex (V1), typical RFs are sharply tuned to a precise orientation.There is currently no unified theory explaining these differences in representa-tions across layers. Here, using a deep convolutional neural network trained onimage recognition as a model of the visual system, we show that such differencesin representation can emerge as a direct consequence of different neural resourceconstraints on the retinal and cortical networks, and for the first time we find a sin-gle model from which both geometries spontaneously emerge at the appropriatestages of visual processing. The key constraint is a reduced number of neuronsat the retinal output, consistent with the anatomy of the optic nerve as a strin-gent bottleneck. Second, we find that, for simple downstream cortical networks,visual representations at the retinal output emerge as nonlinear and lossy featuredetectors, whereas they emerge as linear and faithful encoders of the visual scenefor more complex cortical networks. This result predicts that the retinas of smallvertebrates (e.g. salamander, frog) should perform sophisticated nonlinear com-putations, extracting features directly relevant to behavior, whereas retinas of largeanimals such as primates should mostly encode the visual scene linearly and re-spond to a much broader range of stimuli. These predictions could reconcile thetwo seemingly incompatible views of the retina as either performing feature ex-traction or efficient coding of natural scenes, by suggesting that all vertebrates lieon a spectrum between these two objectives, depending on the degree of neuralresources allocated to their visual system.
1 INTRODUCTION
Why did natural selection shape our visual representations to be the way they are? Traditionally, theproperties of the early visual system have been explained with theories of efficient coding, whichare based on the premise that the neural representations are optimal at preserving information aboutthe visual scene, under a set of metabolic constraints such as total firing rate or total number ofsynapses. These theories can successfully account for the antagonistic center-surround structure ofreceptive fields (RFs) found in the retina (Atick & Redlich, 1990; 1992; Vincent & Baddeley, 2003;Karklin & Simoncelli, 2011; Doi et al., 2012), as well as for the oriented structure of RFs found inthe primary visual cortex V1 (Olshausen & Field, 1996; 1997; Bell & Sejnowski, 1997).
However, a number of properties of the early visual system remain unexplained. First, it is unclearwhy RF geometries would be so different in the retina and V1. A study (Vincent et al., 2005)has proposed that both representations are optimal at preserving visual information under differentmetabolic constraints: a constraint on total number of synapses for the retina, and one on totalfiring rate in V1. However, it is unclear why the two systems would be optimized for these two∗Equal contribution. All code is available at https://github.com/ganguli-lab/RetinalResources.†Corresponding authors: [email protected] and [email protected].
1
arX
iv:1
901.
0094
5v1
[q-
bio.
NC
] 3
Jan
201
9

Published as a conference paper at ICLR 2019
different objectives. Second, there is a great diversity of ganglion cell types at the output the retina(Gollisch & Meister, 2010), with each cell type tiling the entire visual field and performing a specificcomputation. Interestingly, some of these types perform a highly nonlinear computation, extractingspecific, behaviorally-relevant cues from the visual scene (e.g. direction-selective cells, object-motion-selective cells), whereas other types are better approximated by a quasi-linear model, andrespond to a broad range of stimuli (e.g. midget cells in the primate (Roska & Meister, 2014) andquasi-linear pixel-encoders in the mouse (Johnson et al., 2018)). Intriguingly, although quasi-linearand more nonlinear types exist in species of all sizes (e.g. primate parasol cells are nonlinear (Crooket al., 2008)), the proportion of cells performing a rather linear encoding versus a nonlinear featuredetection seems to vary across species. For example, the most common ganglion cell type in theprimate retina is fairly well approximated by a quasi-linear pixel-encoder (midget cells, 50% of allcells and >95% in the central retina (Roska & Meister, 2014; Dacey, 2004)), whereas the mostcommon cell type in mouse acts as a specific feature detector, thought to serve as an alarm systemfor overhead predators (W3 cells, 13% of all ganglion cells (Zhang et al., 2012)). Again, theoriesof efficient coding have not been able to account for this diversity of computations found across celltypes and across species.
The limitations of current efficient coding theories might reside in the simplistic assumption that theobjective is to simply relay indiscriminately all visual information to the next stages of processing.Indeed, the ultimate goal of the visual system is to extract meaningful features from the visualscene in order to produce an adequate behavioral response, not necessarily to faithfully encodeit. A recent line of work has proposed using the information bottleneck framework as a way tomove beyond the simplistic objective of information preservation towards more realistic objectives(Chalk et al., 2016; 2018). Another study has shown that by changing the objective from efficientlyencoding the present to efficiently encoding the future (predictive coding), one could better accountfor the spatio-temporal RFs of V1 cells (Singer et al., 2018). Although promising, these approacheswere limited to the study of a single layer of neurons, and they did not answer the aforementionedquestions about cross-layer or cross-species differences. On the other hand, deep convolutionalnetworks have proven to be accurate models of the visual system, whether they are trained directlyon reproducing neural activity (McIntosh et al., 2016; Cadena et al., 2017), or on a behaviorallyrelevant task (Yamins et al., 2014; Eberhardt et al., 2016; Cadena et al., 2017), but they have not yetbeen used to study the visual system through the lens of efficient coding theories.
In this study, we trained deep convolutional neural networks on image recognition (CIFAR-10,Krizhevsky (2009)) and varied their architectures to explore the sets of constraints that could haveshaped vertebrates’ early visual representations through natural selection. We modeled the visualsystem with a series of two convolutional networks, one corresponding to the retina and one down-stream network corresponding to the ventral visual system in the brain. By varying the architectureof these networks, we first found that a reduction in the number of neurons at the retinal output – cor-responding to a realistic physical constraint on the number of fibers in the optic nerve – accountedsimultaneously for the emergence of center-surround RFs in our model of the retina, and for theemergence of oriented receptive fields in the primary visual relay of the brain. Second, we foundthat the degree of neural resources allocated to visual cortices in our model drastically reshaped reti-nal representations. Given a deep visual cortex, the retinal processing emerged as quasi-linear andretained substantial information about the visual scene. In contrast, for a shallow cortex, the retinalprocessing emerged as nonlinear and more information-lossy, but was better at extracting featuresrelevant to the object classification task. These observations make testable predictions on the quali-tative differences that should be found in retinal representations across species, and could reconcilethe seemingly incompatible theories of retinal processing as either performing efficient encoding orfeature detection.
2 FRAMEWORK: A DEEP CONVOLUTIONAL NEURAL NETWORK MODEL OFTHE VISUAL SYSTEM
The retinal architecture is strongly conserved across species (Masland, 2001), and consists of threelayers of feed-forward convolutional neurons (photoreceptors, bipolar cells, ganglion cells) and twolayers of inhibitory interneurons (horizontal, amacrine cells). However, we chose to model the retinaas a convolutional neural network (LeCun et al., 2015) with only two layers (fig. 1A). Indeed theretinal response of many species to complex stimuli has been modeled successfully with only one
2

Published as a conference paper at ICLR 2019
or two-layer models (Deny et al., 2017; Maheswaranathan et al., 2018; Gollisch & Meister, 2010),with some rare exceptions of models requiring more layers (McIntosh et al., 2016). We refer to thisnetwork as the retina-net. In our simulations, we varied the number of neurons in the second layerof the retina-net, which is the output of the retina, corresponding to the physical bottleneck of theoptic nerve conveying all the visual information to the brain (fig. 1B).
We modeled the ventral visual system – the system associated with object recognition in the brain(Hubel, 1995) – as a convolutional neural network taking its inputs from the retina-net (fig. 1A). Wevaried the neural resources allocated to the ventral visual system network (VVS-net) by changingthe number of layers it is composed of (fig. 1B).
We trained the neural network composed of the retina-net and VVS-net end-to-end on an objectclassification task (CIFAR-10, fig. 1A-B-C). Even though the visual system does much more thanjust classify objects in natural images, this objective is already much more complex and biologicallyrealistic than the one used in previous studies of efficient coding, namely preserving all informationabout the visual scene. Moreover, we are encouraged by the fact that previous studies using thisobjective have found a good agreement between neural activity in artificial and biological visualnetworks (Yamins et al., 2014; Cadena et al., 2017).
More specifically, we trained a convolutional neural network on a grayscale version of the standardCIFAR-10 dataset for image classification. The retina-net consisted of two convolutional layers with32 channels and NBN channels respectively, and with ReLU nonlinearities at each layer. The VVS-net consisted of a varying number DV V S of convolutional layers with 32 channels followed by twofully connected layers (the first one with 1024 neurons and the second one with 10 neurons mappingto the 10 object categories), with ReLU nonlinearities at each layer and a softmax nonlinearity atthe last layer. The full system encompassing the retina-net and VVS-net thus had 32 → NBN →32→ 32→ ... channels respectively, where we varied the retinal bottleneck width, NBN , as well asthe number DV V S of convolutional brain layers (not counting the fully connected layers). In eachconvolutional layer, we used 9x9 convolutional filters with a stride of 1 at each step. The large filtersize was chosen to give the network flexibility in determining the optimal filter arrangement. Wetrained our network with the RMSProp optimizer for 20 epochs on the training set with batches ofsize 32. All optimizations were performed using Keras and TensorFlow. For all results presented, we
A
“Horse”
V1
Fully Connected
VVS-
net
|
{z
}
Ret
inal
Bot
tlene
ck
Size
B
C
“Hor
se”
“Hor
se”
“Hor
se”
“Hor
se”
. . .
. . .. . . ..
.
...
D|
{z}
Ret
ina-
net
A
0 1 2 3 4
.5
.7
.6
VVS-net depth
Net
wor
k pe
rform
ance
on
CIF
AR-1
0
D
VVS-net depth
VVS-net depth
Ret
inal
Bot
tlene
ck
Size
Figure1Final
Figure 1: Illustration of the framework we used to model early visual representations. A: We trainedconvolutional neural networks on an image recognition task (CIFAR-10). The networks were com-posed of two parts, a retina-net and a ventral-visual-system-net (VVS-net), which receives inputfrom the retina-net. B: We varied the number of layers in the VVS-net (white boxes) and the numberof channels at the output of the retina-net (blue box). C: Key results: (1) A bottleneck at the output ofthe retina yielded center-surround retinal RFs. (2) A shallow VVS-net yielded more nonlinear reti-nal responses (linearity is schematized by the red arrow), which better disentangled image classes(represented as bent manifolds). D: Test-set accuracy of all model architectures on CIFAR-10, av-eraged over ten networks with random initial weights for each architecture. Performance increaseswith VVS-net depth and retinal channel, indicating that both factors are meaningful constraints onthe network in the regime tested.
3

Published as a conference paper at ICLR 2019
tested statistical significance by training 10 identical networks with different random initializationsof weights and biases taken from a Glorot-uniform distribution (Glorot & Bengio, 2010).
After training, we determined the linear approximation of RFs of each convolutional channel of thenetwork in each layer. This was achieved by computing the gradient of the activation of that channelwith respect to a blank image. This gradient map gives a first-order approximation of the image pat-tern that maximally activates the cells in the channel of interest. In the limit of small noise variance,this computation is mathematically equivalent to measuring the cell’s spike-triggered average in re-sponse to a perturbative white-noise stimulus (Koelling & Nykamp, 2008; Schwartz et al., 2006),a commonly used method for determining receptive fields in experimental biology (Chichilnisky,2001). This equivalence allowed us to compare directly the geometries of RFs experimentally mea-sured in biological networks with the ones found in our models.
The test accuracy of our neural network model of the visual system at the recognition task increasedboth with the number of channels in the retinal bottleneck, and with the number of layers in theVVS-net (fig. 1D), confirming that we were in a regime where the restrictions on neural resourcesin the VVS-net and at the output of the retina were critical to the ability of the network to performthe task.
3 A UNIFIED MODEL FOR CENTER-SURROUND RFS IN THE RETINA ANDORIENTED RFS IN V1
Here we investigate the effects of a dimensionality bottleneck at the retinal output on early visualrepresentations in our model of the visual system.
3.1 A DIMENSIONALITY BOTTLENECK AT THE RETINAL OUTPUT YIELDS THE EXPECTEDREPRESENTATIONS IN RETINA AND V1
When reducing the number of neurons at the output of the retina we found that RFs with antagonisticcenter and surround emerged. For NBN = 32, our control setting with no bottleneck at the retinaloutput, we observed mostly oriented receptive fields in the second layer of the network (fig. 2A).For NBN = 4, 2, and 1, we observed center-surround receptive fields in the second layer of thenetwork and mostly oriented receptive fields in the third layer, which is the first layer of the ventralvisual system in our model (fig. 2B). We quantified these results in App. A. The RF geometriesdid not depend qualitatively on the VVS-net depth DV V S (results shown for DV V S = 2), exceptfor the shallowest VVS-net tested (DV V S = 0, no convolutional layer, and thus no dimensionalityexpansion), for which the shape of emergent retinal RFs were variable across trials and difficult tointerpret. These results are in good agreement with the organization of the biological visual system,where retinal RFs are center-surround and most downstream RFs in primary visual cortex (V1) aresharply oriented (Hubel, 1995), suggesting that the dimensionality bottleneck at the output of theretina is sufficient to explain these differences in representations. It is worth noting that for bothconditions (bottleneck and no bottleneck), the RFs of downstream layers in the VVS-net after thefirst layer exhibited complex shapes that were neither clearly oriented, nor circular, and the RFs inthe first layer of the retina did not appear to have any well-defined structure (data not shown).
We then tested in our model the hypothesis of Hubel and Wiesel concerning how center-surroundcells are pooled to give rise to oriented RFs in V1 (Hubel, 1995). We found that orientation-selectiveneurons in the VVS-net typically draw primarily from center-surround neurons in the retina-net thatare aligned with the direction of the edge, with positive or negative weights corresponding to whetherthe polarity (light-selective / dark-selective) of the two neurons are consistent or inconsistent (fig.2C, and App. A for a quantification). These qualitative results are in good agreement with Hubeland Wiesel’s hypothesis. Of course, this hypothesis remains to be tested in the real brain, since thereis no evidence that the micro-circuitry of the brain matches that of our simulation.
In the visual system of mammals, the main relay of visual information taking its input from the retinais the LGN (thalamus), which has center-surround RFs and a similar total number of neurons as theretinal output (Hubel, 1995). We created a network reflecting this architecture by having two low-dimensionality layers in a row instead of just one (fig. 2C). After training, we found center-surroundRFs in the two layers with a bottleneck (retinal output and LGN), and oriented RFs in the nextlayer, corresponding to the primary visual cortex (V1). These results suggest that center-surround
4

Published as a conference paper at ICLR 2019
representations remain advantageous as long as the dimensionality of the representation remainslow, and hence dimensionality expansion seems to be the crucial factor explaining the qualitativechange of RFs found between LGN and V1.
It is an interesting question to ask whether neurons in our model of the VVS are more similar tosimple or complex cells (Hubel, 1995). To test this, we performed a one-step gradient ascent onthe neural activity of VVS neurons with respect to the image, starting from several random initialimages (App. B). If the neurons were acting as simple cells (i.e. are approximately linear in thestimulus), we would expect all optimized stimuli to converge to the same preferred stimulus. On theother hand, if the cells were complex (i.e. OR function between several preferred stimuli), we wouldexpect the emergent preferred stimuli to depend on the exact initialization. Interestingly, we foundthat most neurons in the first layer of the VVS-net behaved as simple cells, whereas most neuronsin the second layer of the VVS-net behaved as complex cells. Note that in biology, both simpleand complex cells are found in V1. These results expose the fact that anatomical regions of visualcortex involve multiple nonlinearities and hence may map onto more than one layer of our simplemodel. Indeed, V1 itself is a multilayered cortical column, with LGN inputs coming in to layer 4,and layer 4 projecting to layers 2 and 3 (Hubel, 1995). Simple cells are predominantly found inlayer 4 and complex cells are predominantly found in layers 2 and 3. These observations bolster theinterpretation that biological V1 may correspond to multiple layers in our model.
Local divisive normalization (i.e. local gain control) is an ubiquitous source of nonlinearity inthe visual system (Geisler & Albrecht, 1992; Heeger, 1992; Deny et al., 2017). We thus tested therobustness of our main result to a more realistic model of the visual system with local normalization,by adding it at every layer of the network (App. C). We found that receptive fields still emergedas center-surround in the retina-net, and as oriented in our model of V1. We note that the localnormalization slightly degraded the performance of the network on the task for all parameter settingswe tried.
Figure2Final
VVS-net
“Horse”
Retina-net
A B E
F
“Horse”“Horse”
D..
.
t-SNE
Retina-net
“LGN”
VVS-net
V1 V1V1
|
{z
}
|
{z
}
C
Figure 2: Effects of a bottleneck constraint on receptive fields (RFs). All results are shown forDV V S = 2. A: Examples of RFs of cells at selected layers (layers 2 and 3) of a control networkwith no bottleneck. No center-surround RFs appear. B: Center-surround RFs emerge at the output ofthe retina-net (layer 2) and oriented RFs emerge in the first layer of the VVS-net when we impose abottleneck constraint at the output of the retina (NBN = 1) C: Top: Hubel and Wiesel’s hypothesison oriented cell formation in V1 (Hubel, 1995). Bottom: A representative example of an orientation-selective neuron (bottom RF) drawing from center-surround channels (top RFs) in the previouslayer with weight matrices (center) according to their polarity. Light / dark-selective regions of areceptive field, and positive / negative weights, are represented with red / blue, respectively. D:Examples of RFs in a network with an extra bottleneck layer corresponding to mammalian LGN.Center-surround RFs appear at both the retinal output and LGN layer. E: Examples of ON and OFFcenter-surround RFs in the untied network (NBN = 4). F: t-SNE clustering of the retinal neuronsof the untied network (see text). Two distinct cell type clusters form corresponding to ON and OFFcenter-surround receptive fields.
5

Published as a conference paper at ICLR 2019
3.2 EMERGENCE OF ON AND OFF POPULATIONS OF CENTER-SURROUND CELLS IN THERETINA
We then verified that the emergence of center-surround RFs in the retina-net is a consequence ofreducing the number of neurons at the retinal output, not of reducing the number of channels, ourmodel’s equivalent of biological retinal cell types. In the retina, there exist 20-30 types of ganglioncells (Roska & Meister, 2014), each with a different and stereotyped receptive field, density, polarity(i.e. ON or OFF), and nonlinearities. Cells of each type tile the entire visual field like a convolutionalchannel in our model, so there is a direct analogy between channels in our model and ganglion celltypes in the retina. In order to test whether the emergence of center-surround RFs depends onthe number of types that we allow, or just on the number of neurons that we allow at the outputof the retina (i.e. dimensionality bottleneck), we employed locally connected layers – equivalentto convolutional layers, but without parameter-tying between artificial neurons within a channelat different spatial locations. In this manner, we can limit the number of neurons at the retinaloutput without imposing a constraint on the number of cell types. Such a network contains toomany parameters to be trained from scratch by gradient descent; to work around this, we trained themodel stage-wise by first training our convolutional control network (NBN = 32 with parametertying) and then substituting the untied retina-net in place of the first two layers of the control modelfor the rest of training. Even in the untied retina-net, in which each neuron is effectively its ownchannel, we found that center-surround RFs emerged (fig. 2E), indicating that center-surround RFsare the network’s preferred strategy for passing information through a dimensionality bottleneckeven when no constraint on the number of cell types is imposed. We then found that the cells clusterin two distinct populations. To demonstrate this, we measured their activations in response to 10000natural images, computed the first 20 principal components of this 10000-dimensional space, andran t-SNE to visualize the clustering of neuron types. We found that two distinct clusters emerged,that corresponded visually to ON and OFF center-surround RFs (fig. 2F). We thus observe in ourmodel the emergence of one of the most prominent axes of dichotomy of biological ganglion celltypes, namely the classification of cells in ON and OFF populations with RFs of opposite polarity.
4 RETINAL REPRESENTATIONS ARE A FUNCTION OF THE NEURALRESOURCES ALLOCATED TO THE VENTRAL VISUAL STREAM
To what extent are retinal representations in our model shaped by the degree of neural resourcesallocated to downstream processing? To investigate this question, we studied the effects of varyingthe degree of neural resources in the VVS-net, on emergent visual representations in the retina-net.
4.1 THE RETINA BECOMES MORE LINEAR AS BRAIN COMPLEXITY INCREASES
As we increased the number of layers in the VVS-net, the retinal computation became more linear(fig. 3A), as measured by the ability of the raw image to linearly map onto the neural representa-tion at the retinal output (see methods, and App. F for a visualization of retinal representation asVVS-net depth increases). This observation is consistent with the current state of knowledge of thedifferences found in retinal representations across vertebrate species with different brain sizes. Thelinearization of the retinal response with increased brain complexity was true for different values ofbottleneck NBN . However, when we did not use any bottleneck (NBN = 32), the trend becamenon-monotonic, with a peak in linearity of the response when the VVS-net had 1 conv layer (data notshown). Another interesting phenomenon to note is that linearity of the retinal response decreasedas we increased the number of channels in the bottleneck, at any fixed brain depth (fig. 3A).
The two main sources of nonlinearity in the retina are thought to be the inner retinal rectifications(bipolar and amacrine cells, corresponding to the first rectified layer in our model) and the ganglioncell rectification (corresponding to the second rectified layer in our model). As we decreased VVS-net depth, we observed that the retinal response became more nonlinear. Is this increase in responsenonlinearity due to the first or second stage of nonlinearity in our retina-net? To test this, we plottedthe real response against the response predicted by a purely linear model for the most shallow andfor the deepest VVS-nets tested (fig. 3B). If the linear prediction were inaccurate because of the firststage of nonlinear processing in the retina-net, we would expect the points on the scatter plot to bescattered around the unit line. If the prediction error were due to the second-stage of nonlinearity, we
6

Published as a conference paper at ICLR 2019
would expect the linear approximation to make incorrect negative predictions for inactive neurons.In practice, we found that the prediction error of the linear model was partly explained by bothstages of nonlinearity in the retina-net model, predicting that both inner retinal nonlinear processingand ganglion cell rectifications should be more pronounced in animals with fewer neural resourcesin their visual cortices.
4.2 THE RETINAL REPRESENTATION IS THE RESULT OF A TRADE-OFF BETWEENINFORMATION TRANSMISSION AND FEATURE EXTRACTION
Why would retinal representations be more linear when the subsequent ventral visual stream hasmore resources? One hypothesis is that with a restricted number of neurons, the retina must trade-offbetween the two incentives of (1) compressing visual information in order to transmit it to down-stream layers and (2) extracting nonlinear features from the scene to start disentangling the manifoldscorresponding to different classes of objects (Chung et al., 2018a;b). According to this hypothesis,when the VVS is shallow, the priority of the retina should be to work toward extracting relevantfeatures. When the VVS is deep, the priority of the retina should be to transmit as much visualinformation as possible for downstream processing. We validated this hypothesis in two ways in ourmodel.
First we showed that the retinal representation retained more information about the image as VVS-net complexity increased (fig. 3C). To estimate information retention, we trained a linear decoder
A B
D E VVS-net depthVVS-net depth
VVS-net depth Network Layer
Ret
inal
Res
pons
e Li
near
ity
Imag
e C
lass
Se
para
billit
y
Imag
e C
lass
Se
para
bilit
y
Rec
onst
ruct
ion
Perfo
rman
ce
Predicted Activations
VVS-depth = 0
VVS-depth = 4C
Rea
l Act
ivat
ions
Net
wor
k Pe
rform
ance
(C
ifar-1
0)
Retina Representation
RawPixels
1 Channel2 Channels4 ChannelsRaw Pixels
Raw Pixels
A B
D E FVVS-net depthVVS-net depth
VVS-net depth Network Layer
Ret
inal
Res
pons
e Li
near
ity
Imag
e C
lass
Se
para
billit
y
Imag
e C
lass
Se
para
billit
y
Rec
onst
ruct
ion
Perfo
rman
ce
Predicted Actvations
VVS-depth = 0
VVS-depth = 4C
Rea
l Act
ivat
ions
Net
wor
k Pe
rform
ance
(C
ifar-1
0)
Retina Representation
RawPixels
1 Channel2 Channels4 ChannelsRaw Pixels
1 Channel2 Channels4 ChannelsRaw Pixels
F
A B
D E FVVS-net depthVVS-net depth
VVS-net depth Network Layer
Ret
inal
Res
pons
e Li
near
ity
Imag
e C
lass
Se
para
billit
y
Imag
e C
lass
Se
para
billit
y
Rec
onst
ruct
ion
Perfo
rman
ce
Predicted Actvations
VVS-depth = 0
VVS-depth = 4C
Rea
l Act
ivat
ions
Net
wor
k Pe
rform
ance
(C
ifar-1
0)
Retina Representation
RawPixels
1 Channel2 Channels4 ChannelsRaw Pixels
1 Channel2 Channels4 ChannelsRaw Pixels
1 Channel32 Channels
***
V1
Retina
***
***
Figure 3: Emergent retinal representations are function of the depth of downstream visual cortices.All error bars represent the 95% confidence interval about the mean (all simulations were repeatedover 10 networks trained from random initial conditions). Three stars indicate t-test significance(p<0.001). A: Linearity of the retinal response increases with the number of layers in the VVS-net. Note that it also decreases with the number of cells at the retinal output (different lines). B:Responses of example retina-net output cell to natural images, vs. best linear fit prediction fromraw image, for most (top) and least (bottom) deep VVS-nets. Nonlinearity arises from two sources:rectification within the retina-net (corresponds to the spread of the bulk of the point cloud) andrectification at the retina-net output (corresponds to inactive neurons being incorrectly predicted tohave negative activations). C: Quality of image reconstruction from the retinal representation as afunction of VVS-net depth. The retinal representation retains more information about the raw imagefor deep VVS-nets. D: Linear separability of classes of objects at the retinal output, as a function ofVVS-net depth. Dashed line indicates separability of classes of images from the raw image pixels.Classes are less separable at the retinal output for deeper VVS-nets. E: Performance on CIFAR-10for a two-layer densely connected network taking its input from the retina-net or from a raw image.Class information is more accessible from retinal representation. F: Class separability at all layers ofnetwork for a deep VVS-net (DV V S = 4) with and without bottleneck (NBN = 1 and NBN = 32).Retinal representation of bottleneck network has low separability. However, the first layer of theVVS-net has high separability (see text).
7

Published as a conference paper at ICLR 2019
(see methods) from the output of the retina to reconstruct the image and we measured the recon-struction error. The reconstruction error provided a lower bound on the information that the retinaretained about the stimulus (note that more information for reconstruction might be accessible bya nonlinear decoder). This result corroborated our hypothesis that, as the VVS-net becomes morecomplex, the retinal representation gets better at retaining visual information for further processingby the VVS-net.
Second, we found that different classes of objects of CIFAR-10 (e.g. trucks, frogs) were morelinearly separable from the retina-net representation when the VVS-net was shallow than when itwas deep (fig. 3D). To measure linear separability of manifolds, we trained a linear SVM decoderto separate all pairs of classes and evaluated the performance of the SVM classifier on held-outimages (see methods). Moreover, we showed that a VVS-net consisting of two fully connectedlayers only (no convolutional layers) equipped and trained end-to-end with a retina with a tightbottleneck NBN = 1 (dimensionality of retinal output matches dimensionality of the input image)performed better at image recognition than the same VVS-net trained without a retina-net, takingraw images as input (fig. 3E). Both these results corroborate our hypothesis that retinas followed bya simple cortex performs meaningful feature extraction, whereas retinas followed by more complexvisual cortices prioritize non-lossy encoding, postponing feature extraction to downstream layersthat are better equipped to do it.
Next, we show that within a single network, each retinal channel is trading-off between (1) linearlytransmitting visual information to the brain, and (2) extracting relevant features for the object clas-sification task. For 10 instantiations of a network with a retinal bottleneck containing 4 channels,we represented the linearity of each of these 4 channels against the linear separability of object cat-egories obtained from each of these representations. We found, across all networks, a systematicnegative correlation between linearity and linear separability across all 4 channels (App. D). Again,this result strongly suggests that extracting features and transmitting visual information are indeedtwo competing goals shaping representations in our model of the retina.
In the case of the deepest VVS-nets tested, the retinal processing was quasi-linear for the tightestbottleneck (var.expl. = 0.9, NBN = 1, fig. 3A). One might take this result to suggest that the retina-net in such models does little more than copy image information. However the very first layer of theVVS-net after the retina disentangled classes (as measured by linear separability) almost as well asthe second layer of a VVS-net without a retina (fig. 3F), suggesting that the retinal representation,while only moderately linearly separable itself, is especially transformable into a representation witha high linear separability. This result suggests that even when the retina-net is quasi-linear, it canstill participate in extracting relevant features for downstream processing by the brain. The increasedseparability allowed by the retinal pre-processing for this deep VVS-net could be due to (1) the linearprocessing or (2) the slightly nonlinear part of the retinal processing (3) a combination of both linearand nonlinear processing. To distinguish between these hypotheses, we replaced the true retinalprocessing by its best linear approximation, retrained the VVS-net on the output of this linearizedretina, and tested whether separability was as high as with the true retinal processing (App. E). Wefound that the first layer trained on the output of the linearized retinal representation was indeedmuch more separable than the first layer of the control network (trained directly on natural images)at separating classes of objects, suggesting that the linear operation done by the retina does indeedplay a crucial role in making the representation especially separable for subsequent layers.
5 METHODS
To estimate the linearity of the response of retinal neurons, we fit a linear model to predict theneural response from the image on 8,000 images. In order to prevent overfitting, we regularized thelinear weights with an L2 penalty and optimized the weights using ridge regression. The value ofthe penalty term was chosen by 10-fold cross-validation on the training set. We then measured thePearson correlation between the linearized responses and original model responses on a testing setof 2,000 images.
To estimate the information about the input image retained by the retinal output representation, we fita linear model to reconstruct the image from the (fixed) outputs of the trained retina-net of interest.All numerical figures given are variance-explained results on the held-out test set.
8

Published as a conference paper at ICLR 2019
To estimate the linear separability of classes of objects from the neural representation, we trainedan SVM classifier between all pairs of classes on half of the testing set of CIFAR-10 (1,000 imagesthat were not used to train the network), and we tested the performance of the SVM classifier on1,000 held-out images from the testing set, as measured by the percentage of images classifiedcorrectly. We then averaged the performance of the SVM across all pairs of classes to obtain thelinear separability score.
6 DISCUSSION
A unified theoretical account for the structural differences between the receptive field shapes ofretinal neurons and V1 neurons has until now been beyond the reach of efficient coding theories.Karklin & Simoncelli (2011) found that efficient encoding of images with added noise and a coston firing rate produce center-surround RFs, whereas the same task without noise produces edgedetectors. However, this observation (as they note) does not explain the discrepancy between retinaland cortical representations. Vincent et al. (2005) propose a different set of constraints for theretina and V1, in which the retina optimizes for a metabolic constraint on total number of synapses,whereas V1 optimizes for a constraint on total firing rate. It is not clear why each of these constraintswould predominate in each respective system. Here we show that these two representations canemerge from the requirement to perform a biologically relevant task (extracting object identity froman image) with a bottleneck constraint on the dimensionality of the retinal output. Interestingly,this constraint differs from the ones used previously to account for center-surround RFs (number ofsynapses or total firing rate). It is worth noting that we unsuccessfully tried to reproduce the resultof Karklin & Simoncelli (2011) in our network, by adding noise to the image and applying an L1regularization to the retina-net activations. In our framework (different than the one of Karklin &Simoncelli (2011) in many ways), the receptive fields of the retina-net without bottleneck remainedoriented across the full range of orders of magnitude of noise and L1 regularization that permittedsuccessful task performance.
There is a long-standing debate on whether the role of the retina is to extract relevant featuresfrom the environment (Lettvin et al., 1959; Gollisch & Meister, 2010; Roska & Meister, 2014), or toefficiently encode visual information (Barlow, 1961; Atick & Redlich, 1990; 1992). In this work, weshow that our model of the visual system, trained on the same task and with the same input statistics,can exhibit different retinal representations depending on the degree of neural resources allocatedto downstream processing by the ventral visual stream. These results suggest the hypothesis that,despite its conserved structure across evolution, the retina could prioritize different computationsin different species. In species with fewer brain resources devoted to visual processing, the retinashould nonlinearly extract relevant features from the environment for object recognition, and inspecies with a more complex ventral visual stream, the retina should prioritize a linear and efficienttransmission of visual information for further processing by the brain. Although all species contain amix of quasi-linear and nonlinear cell types, the proportion of quasi-linear cells seems to vary acrossspecies. In the mouse, the most numerous cell type is a two-stage nonlinear feature detector, thoughtto detect overhead predators (Zhang et al., 2012). In contrast, the most common ganglion cell typein the primate retina is fairly well approximated by a linear filter (midget cells, 50% of all cells and>95% in the central retina (Roska & Meister, 2014; Dacey, 2004)). Note however that two-stagenonlinear models are also present in larger species, such as cat Y-type cells and primate parasol cells(Crook et al., 2008), making it difficult to make definitive statements about inter-species differencesin retinal coding. To gain a better understanding of these differences, it would be useful to collecta dataset consisting of recordings of complete populations of ganglion cells of different species inresponse to a common bank of natural scenes.
A related question is the role of the parcellation of visual information in many ganglion cell typesat the retinal output. A recent theory of efficient coding has shown that properties of midget andparasol cells in the primate retina can emerge from the objective of faithfully encoding naturalmovies with a cost on the total firing rate traversing the optic nerve (Ocko et al., 2018). On theother hand, many cell types seem exquisitely sensitive to behaviorally relevant features, such aspotential prey or predators (Gollisch & Meister, 2010). For example, some cell types in the frog aretuned to detect moving flies or looming predators (Lettvin et al., 1959). It is an intriguing possibilitythat different cell types could subserve different functions within a single species, namely efficientcoding of natural scenes for some types and extraction of behaviorally-relevant features for others.
9

Published as a conference paper at ICLR 2019
In this study we allowed only a limited number of cell types (i.e. convolutional channels) at theretinal output (1 to 4), in order to have a dimensionality expansion between the retinal representationand the representation in the ventral visual stream (32 channels), an important condition to see theretinal center-surround representation emerge. By using larger networks with more channels in theretina-net and the VVS-net, we could study the emergence of a greater diversity of neuron types inour retina-net and compare their properties to real retinal cell types. It would also be interesting toextend our model to natural movies. Indeed, most feature detectors identified to date seem to processsome form of image motion: wide-field, local or differential (Roska & Meister, 2014). Adding atemporal dimension to the model would be necessary to study their emergence.
In conclusion, by studying emergent representations learned by a deep network trained on a biologi-cally relevant task, we found that striking differences in retinal and cortical representations of visualinformation could be a consequence of the anatomical constraint of transmitting visual informationthrough a low-dimensional communication channel, the optic nerve. Moreover, our computationalexplorations suggest that the rich diversity of retinal representations found across species couldhave adaptively co-evolved with the varying sophistication of subsequent processing performed bythe ventral visual stream. These insights illustrate how deep neural networks, whose creation wasonce inspired by the visual system, can now be used to shed light on the constraints and objectivesthat have driven the evolution of our visual system.
ACKNOWLEDGMENTS
We would like to thank Lane McIntosh, Niru Maheswaranathan, Aran Nayebi, SueYeon Chung,Vardan Papyan, Nora Brackbill, E.J. Chichilnisky for useful discussions and Stephen Baccus for hiscomments that greatly improved the manuscript. S.G. thanks the Burroughs-Wellcome, McKnight,James S. McDonnell and Simons foundations for support.
REFERENCES
Joseph J. Atick and A. Norman Redlich. Towards a theory of early visual processing. NeuralComputation, 2(3):308–320, 1990.
Joseph J. Atick and A. Norman Redlich. What does the retina know about natural scenes? Neuralcomputation, 4(2):196–210, 1992.
HB Barlow. Possible principles underlying the transformations of sensory messages. In WA Rosen-blith (ed.), Sensory Communication, pp. 217–234. MIT Press, 1961.
A. J. Bell and T. J. Sejnowski. The ”independent components” of natural scenes are edge filters.Vision Research, 37(23):3327–3338, December 1997. ISSN 0042-6989.
Santiago A. Cadena, George H. Denfield, Edgar Y. Walker, Leon A. Gatys, Andreas S. Tolias,Matthias Bethge, and Alexander S. Ecker. Deep convolutional models improve predictions ofmacaque V1 responses to natural images. bioRxiv, pp. 201764, October 2017. doi: 10.1101/201764.
Matthew Chalk, Olivier Marre, and Gasper Tkacik. Relevant sparse codes with variational infor-mation bottleneck. In D. D. Lee, M. Sugiyama, U. V. Luxburg, I. Guyon, and R. Garnett (eds.),Advances in Neural Information Processing Systems 29, pp. 1957–1965. Curran Associates, Inc.,2016.
Matthew Chalk, Olivier Marre, and Gaper Tkaik. Toward a unified theory of efficient, predictive,and sparse coding. Proceedings of the National Academy of Sciences of the United States ofAmerica, 115(1):186–191, 2018. ISSN 1091-6490. doi: 10.1073/pnas.1711114115.
E. J. Chichilnisky. A simple white noise analysis of neuronal light responses. Network (Bristol,England), 12(2):199–213, May 2001. ISSN 0954-898X.
SueYeon Chung, Uri Cohen, Haim Sompolinsky, and Daniel D. Lee. Learning Data Manifoldswith a Cutting Plane Method. Neural Computation, 30(10):2593–2615, October 2018a. ISSN0899-7667, 1530-888X. doi: 10.1162/neco a 01119.
10

Published as a conference paper at ICLR 2019
SueYeon Chung, Daniel D. Lee, and Haim Sompolinsky. Classification and Geometry of GeneralPerceptual Manifolds. Physical Review X, 8(3), July 2018b. ISSN 2160-3308. doi: 10.1103/PhysRevX.8.031003.
Joanna D. Crook, Beth B. Peterson, Orin S. Packer, Farrel R. Robinson, John B. Troy, and Dennis M.Dacey. Y-cell receptive field and collicular projection of parasol ganglion cells in macaque mon-key retina. The Journal of Neuroscience: The Official Journal of the Society for Neuroscience, 28(44):11277–11291, October 2008. ISSN 1529-2401. doi: 10.1523/JNEUROSCI.2982-08.2008.
Dennis Dacey. Origins of perception: retinal ganglion cell diversity and the creation of parallelvisual pathways. In The cognitive neuroscience (2004), pp. 281–301, 2004.
Stephane Deny, Ulisse Ferrari, Emilie Mace, Pierre Yger, Romain Caplette, Serge Picaud, GaperTkaik, and Olivier Marre. Multiplexed computations in retinal ganglion cells of a single type.Nature communications, 8(1):1964, 2017.
Eizaburo Doi, Jeffrey L. Gauthier, Greg D. Field, Jonathon Shlens, Alexander Sher, MartinGreschner, Timothy A. Machado, Lauren H. Jepson, Keith Mathieson, Deborah E. Gunning,Alan M. Litke, Liam Paninski, E. J. Chichilnisky, and Eero P. Simoncelli. Efficient coding ofspatial information in the primate retina. The Journal of Neuroscience, 32(46):16256–16264,November 2012.
Sven Eberhardt, Jonah G Cader, and Thomas Serre. How Deep is the Feature Analysis underlyingRapid Visual Categorization? pp. 9, 2016.
Wilson S. Geisler and Duane G. Albrecht. Cortical neurons: isolation of contrast gain control. Visionresearch, 32(8):1409–1410, 1992.
Xavier Glorot and Yoshua Bengio. Understanding the difficulty of training deep feedforward neuralnetworks. In Proceedings of the thirteenth international conference on artificial intelligence andstatistics, pp. 249–256, 2010.
Tim Gollisch and Markus Meister. Eye smarter than scientists believed: neural computations incircuits of the retina. Neuron, 65(2):150–164, January 2010. ISSN 1097-4199. doi: 10.1016/j.neuron.2009.12.009.
D. J. Heeger. Normalization of cell responses in cat striate cortex. Visual Neuroscience, 9(2):181–197, August 1992. ISSN 0952-5238.
David H. Hubel. Eye, brain, and vision. Scientific American Library/Scientific American Books,1995.
Keith P. Johnson, Lei Zhao, and Daniel Kerschensteiner. A Pixel-Encoder Retinal Ganglion Cellwith Spatially Offset Excitatory and Inhibitory Receptive Fields. Cell Reports, 22(6):1462–1472,February 2018. ISSN 22111247. doi: 10.1016/j.celrep.2018.01.037.
Yan Karklin and Eero P. Simoncelli. Efficient coding of natural images with a population of noisyLinear-Nonlinear neurons. In J. Shawe-Taylor, R. S. Zemel, P. L. Bartlett, F. Pereira, and K. Q.Weinberger (eds.), Advances in Neural Information Processing Systems 24, pp. 999–1007. CurranAssociates, Inc., 2011.
Melinda E. Koelling and Duane Q. Nykamp. Computing linear approximations to nonlinear neu-ronal response. Network (Bristol, England), 19(4):286–313, 2008. ISSN 1361-6536. doi:10.1080/09548980802503139.
Alex Krizhevsky. Learning Multiple Layers of Features from Tiny Images. pp. 60, 2009.
Yann LeCun, Yoshua Bengio, and Geoffrey Hinton. Deep learning. Nature, 521(7553):436–444,May 2015. ISSN 1476-4687. doi: 10.1038/nature14539.
J. Y. Lettvin, H. R. Maturana, W. S. McCulloch, and W. H. Pitts. What the Frog’s Eye Tells theFrog’s Brain. Proceedings of the IRE, 47(11):1940–1951, November 1959. ISSN 0096-8390.doi: 10.1109/JRPROC.1959.287207.
11

Published as a conference paper at ICLR 2019
Niru Maheswaranathan, David B. Kastner, Stephen A. Baccus, and Surya Ganguli. Inferring hiddenstructure in multilayered neural circuits. PLoS computational biology, 14(8):e1006291, August2018. ISSN 1553-7358. doi: 10.1371/journal.pcbi.1006291.
Richard H. Masland. The fundamental plan of the retina. Nature Neuroscience, 4(9):877–886,September 2001. ISSN 1546-1726. doi: 10.1038/nn0901-877.
Lane McIntosh, Niru Maheswaranathan, Aran Nayebi, Surya Ganguli, and Stephen Baccus. DeepLearning Models of the Retinal Response to Natural Scenes. In D. D. Lee, M. Sugiyama, U. V.Luxburg, I. Guyon, and R. Garnett (eds.), Advances in Neural Information Processing Systems29, pp. 1369–1377. Curran Associates, Inc., 2016.
Samuel A. Ocko, Jack Lindsey, Surya Ganguli, and Stephane Deny. The emergence of multipleretinal cell types through efficient coding of natural movies. bioRxiv, pp. 458737, October 2018.doi: 10.1101/458737. URL https://www.biorxiv.org/content/early/2018/10/31/458737.
B. A. Olshausen and D. J. Field. Emergence of simple-cell receptive field properties by learning asparse code for natural images. Nature, 381(6583):607–609, June 1996. ISSN 0028-0836. doi:10.1038/381607a0.
B. A. Olshausen and D. J. Field. Sparse coding with an overcomplete basis set: a strategy employedby V1? Vision Research, 37(23):3311–3325, December 1997. ISSN 0042-6989.
Botond Roska and Markus Meister. The Retina Dissects the Visual Scene into Distinct Features. InThe New Visual Neurosciences (Werner, JS, Chalupa, LM, eds), pp 163182., pp. 20. Cambridge,MA: MIT Press, 2014.
Odelia Schwartz, Jonathan W. Pillow, Nicole C. Rust, and Eero P. Simoncelli. Spike-triggered neuralcharacterization. Journal of Vision, 6(4):13, July 2006. ISSN 1534-7362. doi: 10.1167/6.4.13.
Yosef Singer, Yayoi Teramoto, Ben DB Willmore, Jan WH Schnupp, Andrew J. King, and Nicol S.Harper. Sensory cortex is optimized for prediction of future input, June 2018.
Benjamin T. Vincent and Roland J. Baddeley. Synaptic energy efficiency in retinal processing.Vision Research, 43(11):1283–1290, May 2003. ISSN 0042-6989.
Benjamin T. Vincent, Roland J. Baddeley, Tom Troscianko, and Iain D. Gilchrist. Is the early visualsystem optimised to be energy efficient? Network: Computation in Neural Systems, 16(2-3):175–190, January 2005. ISSN 0954-898X. doi: 10.1080/09548980500290047.
Daniel L. K. Yamins, Ha Hong, Charles F. Cadieu, Ethan A. Solomon, Darren Seibert, and James J.DiCarlo. Performance-optimized hierarchical models predict neural responses in higher visualcortex. Proceedings of the National Academy of Sciences of the United States of America, 111(23):8619–8624, June 2014. ISSN 1091-6490. doi: 10.1073/pnas.1403112111.
Yifeng Zhang, In-Jung Kim, Joshua R. Sanes, and Markus Meister. The most numerous ganglioncell type of the mouse retina is a selective feature detector. Proceedings of the National Academyof Sciences, pp. 201211547, August 2012. ISSN 0027-8424, 1091-6490. doi: 10.1073/pnas.1211547109.
12

Published as a conference paper at ICLR 2019
APPENDIX
A QUANTIFICATION OF RECEPTIVE FIELD ISOTROPY IN RETINA AND V1
A
B
VVS-
net
Ret
ina-
net
“Horse”
V1
|
{z
}
Edgyness Quantification Figure (filters and HW)
A C
B
Figure 4: A: Left: Schematic re-illustrating the architecture of a vanilla (no bottleneck) network andshowing examples oriented RFs in its second layer. Center: Visualization of average RF isotropyfor cells in the second layer of a vanilla convolutional network (NBN = 1, DV V S = 2). Orangeerror bars indicate 95% confidence intervals. Right: Visualization of RF isotropy for ten exampleRFs from the same network architecture. B: Left: Schematic re-illustrating the architecture of theretina-net + VVS-net model (NBN = 1, DV V S = 2) and showing example center-surround RFsat the retina-net output and oriented RFs in the following layer (V1). Center and right: Same RFisotropy visualizations as in part A. C: Left: re-illustration of V1 RFs pooling in oriented fashionfrom center-surround retinal RFs (NBN = 1, DV V S = 2). Right: Same isotropy visualizations asin panel A carried on the weight matrix from retina to V1.
The following analysis corroborates our qualitative observation that a dimensionality bottleneck inthe retina-net yields center-surround retinal receptive fields and oriented, edge-detecting receptivefields in the first layer of the VVS-net (V1). For a given receptive field, we quantified its orientednessas follows: we displayed rectangular bar stimuli of all possible combinations of width, orientationsand spatial translations that fit in the input image window. Among all these combinations, we se-lected the bar stimulus width, orientation, and translation that yielded the strongest response from theRF. Bars with the same width as the best stimuli were presented at all orientations and translations,and for each orientation, we select the strongest response it produced (across all translations). In thismanner we obtained a measure of the strength of a receptive field’s preference for all orientations.
We measured the strength of each RF preference (maximum strength of response) for its preferredorientation and for the orthogonal orientation, and computed the ratio of these strengths. Completelyisotropic filters would be expected to give a ratio of 1, while oriented filters should give higherratios. Note however that some deviation from 1 may indicate noise in the filter rather than trueorientedness. For each network layer, we averaged this ratio across filters (for convolutional layerswith multiple layers) and trials (re-training of the same neural network architecture with differentrandom initializations). We found that the average ratios were 1.56(±0.22) for the retinal output,3.05(±0.30) for the first VVS-net layer, and 2.57(±0.27) for the second VVS-net layer, where errormargins given are 95% confidence intervals. To help assess whether retinal RFs were more isotropicthan expected by chance, we compared them to receptive fields composed of random Gaussian noiseas a baseline. These give an average ratio (as computed above) of 1.97(±0.08), significantly higherthan that for retinal RFs. Furthermore, the standard deviation of RF preference across orientationswas significantly lower for the retinal RFs (0.118 ± 0.036) than for random RFs (0.177 ± 0.007),also indicating that retinal RFs were more isotropic than expected by chance.
13

Published as a conference paper at ICLR 2019
We also plot the average RF preference for different orientations at each layer to more comprehen-sively assess the isotropy of RFs at each network layer. To aggregate results across multiple trialsand filters, we rotated the coordinates of each receptive field such that its preferred orientation wasvertical, and averaged our results across filters and trials. (See Figure 4).
The results confirm our qualitative observations that (1) RFs in the second layer of a vanilla network(NBN = 32) are highly oriented (Figure 4A) (2) RFs in the second layer (retina output) of a bot-tleneck network (NBN = 1) are much more isotropic, consistent with center-surround RFs (Figure4B top), and (3) RFs in the layer immediately following the retina-net in the bottleneck network areoriented (Figure 4B bottom).
We also quantitatively corroborate our observation that oriented receptive fields in the V1 layerpool input from oriented arrays of center-surround filters in the retina-net output layer. We applyour method of isotropy quantification described above to the weight matrix for each input-outputfilter combination in the V1 convolutional layer. We find that this weight matrix itself exhibitsorientedness across filters and trials, confirming our observation (Figure 4C).
B SIMPLE AND COMPLEX CELLS
Retina-net VVS-net Layer 1 VVS-net Layer 2
Convolutional Channel Convolutional Channel
Diff
eren
t Ran
dom
Initi
aliz
atio
ns fo
r Lin
ear R
F Ap
prox
.
A B C
Figure 5: A: Visualizations of retina-net output RFs for an example network (NBN = 1, DV V S = 2)using different random initialization, as described in the text. B: Same as A, for the first layer of theVVS-net, and showing 5 of the layer’s 32 channels on the x axis. C: Same as B, for the second layerof the VVS-net. In contrast to the first layer, the emergent preferred stimuli are always differentacross different initializations, indicative of a complex-cell like behavior.
To investigate whether neurons in our model’s early layers more closely resembled simple or com-plex cells, we performed the following analysis. As before, we obtained local linear approximationsof receptive fields by computing the gradient in input space with respect to the response of a givenneuron. Rather than beginning with a blank input, we ran multiple trials with different randomlyinitialized inputs. A purely linear cell would give the same result no matter the initialization; asomewhat nonlinear but still “simple” cell is expected to give similar results across initializations.A “complex” cell is expected to give different RF visualizations for different random inputs, re-flecting multiple peaks in its response as a function of input. In Figure 5 we show examples ofreceptive fields at different layers of our retina-net + VVS-net model (with NBN = 1, DV V S = 2)for different random intializations of the image (uniform random in [0, 1]). The retina-net outputand first VVS-net layer exhibit “simple” behavior, but the second VVS-net layer exhibits observ-ably “complex” behavior. To quantify this effect, we measure the average (across filters within eachlayer and re-trainings of the same network architecture) standard deviation of computed RFs (nor-malized to the range [0, 1]) for each network layer. We found that the average standard deviations
14

Published as a conference paper at ICLR 2019
were 7.9(±1.1)× 10−3, 15.4(±0.8)× 10−3, and 35.9(±0.8)× 10−3 for the retina-net output, firstVVS-net layer, and second VVS-net layer, respectively, where the margins of error given are 95%confidence intervals. These results corroborate the observation of significantly more complex be-havior in the second VVS-net layer, mirroring the biological phenomenon in which complex cellspool from simple cells in V1.
C EFFECTS OF LOCAL RESPONSE NORMALIZATION ON EARLY VISUALREPRESENTATIONSNormalization Figure
VVS-
net
Ret
ina-
net
A
“Horse”
V1
|
{z
}
VVS-
net
Ret
ina-
net
B
“Horse”
V1
|
{z
}
Figure 6: Example RFs from the bottleneck network (NBN = 1, DV V S = 2without (A) and with (B) local response normalization (i.e. local gain control).
We tested the robustness of our first main finding – that a bottlenecked retina-net + VVS-net modelyields center-surround receptive fields in the retina and oriented receptive felds in V1 – to the useof biologically realistic local response normalization at every layer of the network. In particular, wenormalized the output x of each channel (row r, column c) of each layer as follows (during trainingand testing):
xr,c ←xr,c(
k + α∑r′∈[r−n
2 ,r+n2 ],c′∈[c−n
2 ,c+n2 ] xr′,c′
)β
where the subscripts of x indicate the spatial location (row/column), and k, α, ad β are constants.We used k = 2, β = 0.5 and β = 0.75, and α = 5×10⁻⁴ and α = 5.0. All parameter settings testedyielded RFs with the same qualitative properties as in the model without normalization. Figure 6shows example RFs from the no-normalzation model next to example RFs from the normalizationmodel with k = 2, β = 0.5, α = 5.0.
15
Published as a conference paper at ICLR 2019
D RETINAL CELL TYPES TRADE OFF BETWEEN LINEAR INFORMATIONTRANSMISSION AND NONLINEAR FEATURE EXTRACTION
Linearity vs. separability of bottleneck channels
Response Linearity
Fig XX Linearity vs. separability of retina-net output channels (as in XX), calculated over individual channels in the bottleneck layers. Each
network has a VVS-Net depth of 4 and a bottleneck size of 4. Distributions are plotted across 8 network instances; each point
represents a single channel, colored according to its network. Here, we can see that the tradeoff between efficient coding and feature extraction
also happens within the retina-nets of individual networks.
Imag
e C
lass
Se
para
bilit
y
Figure 7: Linearity vs. Class separability for each retina-net output channels (i.e. bottleneck layer).VVS-Net depth is equal to 4. Each network has a bottleneck size of 4 channels (i.e. NBN =4). Dis-tributions are plotted across 10 network instances; each point represents a single channel, coloredaccording to its network. The negative slope suggests that there is trade-off between linearly trans-mitting visual information for downstream processing (i.e. efficient coding) and extracting usefulfeatures for the object recognition task.
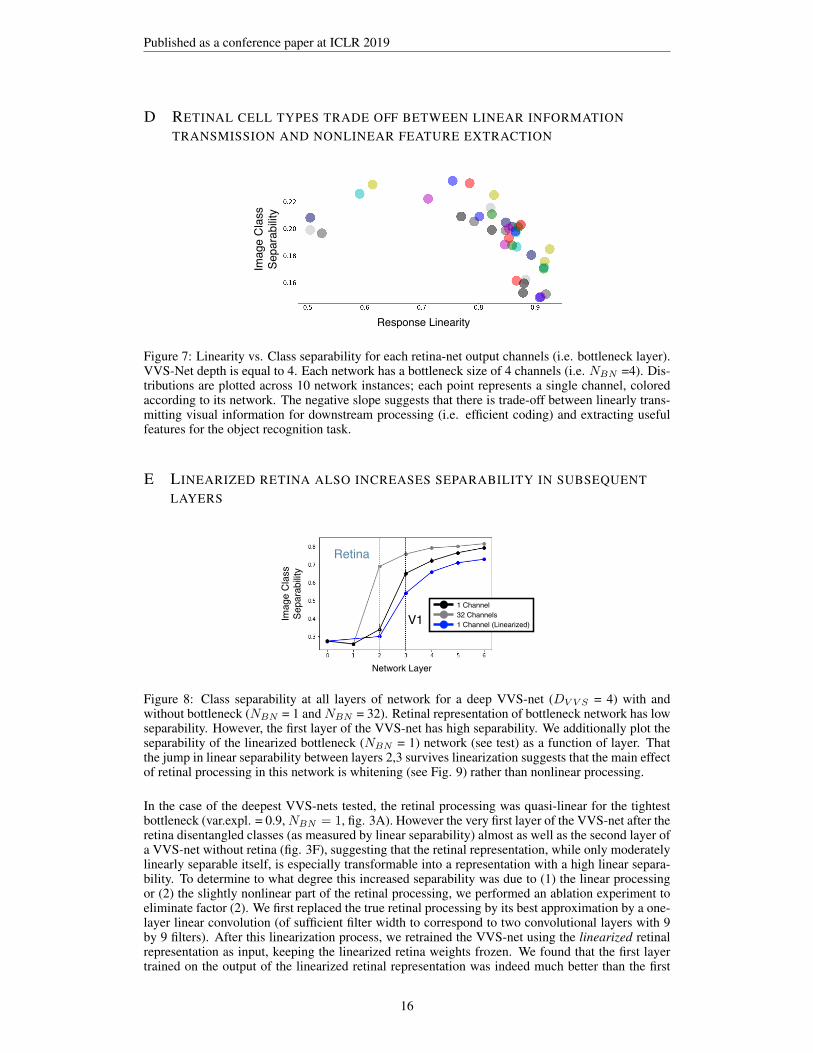
E LINEARIZED RETINA ALSO INCREASES SEPARABILITY IN SUBSEQUENTLAYERS
Retina
V11 Channel32 Channels1 Channel (Linearized)
Network LayerFig. XX: Class separability at all layers of network for a deep VVS-net
(DVV S = 4) with and without bottleneck (NBN = 1 and NBN = 32). Retinal representation of bottleneck network has low separability. However, the first layer of the VVS-net has high separability. We additionally plot the separability of the linearized bottleneck (NBN = 1) network (see test) as a function of layer. That the jump in linear separability between layers 2,3 survives linearization suggests that the main effect of retinal processing
in this network is whitening rather than non-linear processing.
Imag
e C
lass
Se
para
bilit
y
Figure 8: Class separability at all layers of network for a deep VVS-net (DV V S = 4) with andwithout bottleneck (NBN = 1 and NBN = 32). Retinal representation of bottleneck network has lowseparability. However, the first layer of the VVS-net has high separability. We additionally plot theseparability of the linearized bottleneck (NBN = 1) network (see test) as a function of layer. Thatthe jump in linear separability between layers 2,3 survives linearization suggests that the main effectof retinal processing in this network is whitening (see Fig. 9) rather than nonlinear processing.
In the case of the deepest VVS-nets tested, the retinal processing was quasi-linear for the tightestbottleneck (var.expl. = 0.9,NBN = 1, fig. 3A). However the very first layer of the VVS-net after theretina disentangled classes (as measured by linear separability) almost as well as the second layer ofa VVS-net without retina (fig. 3F), suggesting that the retinal representation, while only moderatelylinearly separable itself, is especially transformable into a representation with a high linear separa-bility. To determine to what degree this increased separability was due to (1) the linear processingor (2) the slightly nonlinear part of the retinal processing, we performed an ablation experiment toeliminate factor (2). We first replaced the true retinal processing by its best approximation by a one-layer linear convolution (of sufficient filter width to correspond to two convolutional layers with 9by 9 filters). After this linearization process, we retrained the VVS-net using the linearized retinalrepresentation as input, keeping the linearized retina weights frozen. We found that the first layertrained on the output of the linearized retinal representation was indeed much better than the first
16

Published as a conference paper at ICLR 2019
layer of the control network (trained directly on natural images) at separating classes of objects (Fig.8), suggesting that the linear operation done by the retina does indeed play a crucial role in makingthe representation especially separable for subsequent layers. Visualization of retinal processing inApp. F suggest that whitening is an important part of this linear processing.
F RETINAL REPRESENTATION VISUALIZATION AS A FUNCTION OF VVS-NETDEPTH FOR BOTTLENECK NBN =1
Raw image
DVVS = 0DVVS = 1DVVS = 2DVVS = 3DVVS = 4
Fig XX Visualization of the output of Retina-Net (1 channel bottleneck) for different test examples (x axis) as a function of VVS-Net depth (y axis)Figure 9: Visualization of the output of the retina-net (one-channel-bottleneck, i.e. NBN =1) for
different images from the testing set (x-axis) as a function of VVS-net depth (y-axis). Each pixelintensity of the retinal image is proportional to the activation of the corresponding neuron of theretina, where light shades indicate high activities and dark shades low activities. While retinas forevery VVS-net depth appear to whiten the input, we can see that the retinal image is more and moreprocessed and less and less recognizable as VVS-net depth decreases.
17