a two-point vehicle classification system
TRANSCRIPT
178 TRANSPORTATION RESEARCH RECORD 1215
A Two-Point Vehicle Classification System
BERNARD C. McCULLOUGH, JR., SrAMAK A. ARDEKANI, AND
LI-REN HUANG
The counting and classification of vehicles is an important part of transportation engineering. In the past 20 years many automated systems have been developed to accomplish that laborintensive task. Unfortunately, most of those systems are characterized by inaccurate detection systems and/or classification methods that result in many classification errors, thus limiting the accuracy of the system. This report describes the development of a new vehicle classification database and computer program, originally designed for use in the Two-Point-TimeRatio method of vehicle classification, which greatly improves the accuracy of automated classification systems. The program utilizes information provided by either vehicle detection sensors or the program user to determine the velocity, number of axles, and axle spacings of a passing vehicle. It then matches the axle numbers and spacings with one of thirty-one possible vehicle classifications and prints the vehicle class, speed, and wheelbase lengths. It also tabulates and prints totals and average speeds for each vehicle type. This paper describes the database built and utilized, as well as a roadside experiment conducted to test the accuracy of the database and the classification program, showing the classifications to be highly accurate.
In 1912, the U.S. government realized that a vast network of public roads had to be built and maintained for automobile travel. Today, that network consists of a staggering 3.8 million miles of highways. Unfortunately, that growth has not been able to keep up with the steadily rising number of automobiles in the United States. Thus many urban areas (and even some rural areas) are plagued with congestion problems.
To prevent such problems from occurring, and to alleviate those that do occur, careful planning and monitoring are needed . This is often accomplished through the use of traffic surveillance and control systems or traffic flow data collection systems. Those systems are also used in pavement management and maintenance to estimate pavement loads due to various types of trucks, depending on the axle configuration. Such systems are used in a similar way in bridge maintenance and management. A common feature of such systems is a method of counting and classifying the number of vehicles using the facility. For many years this was commonly done by roadside observers who spent long hours sitting in a vehicle along the facility, manually recording and totaling the number and type of vehicles going by. The job was tedious, and the pay was usually minimum wage; because of the manpower and man-
B. C. McCullough, Jr. , F. R. Harris, Inc. S. A. Ardekani, Virginia Polytechnic Institute and State University, Blacksburg 24061. Current affiliation: University of Texas at Arlington, Arlington 76019. L.-R. Huang, University of Texas at Austin, Austin 78712.
hours required, however, the cost of such a count was often high. To offset such costs, many techniques for the automatic counting, length determination, and classification of vehicles have been developed within the past decade. One popular method, especially in Europe, is the Automatic Length Indication and Classification Equipment method, known as "ALICE," which was introduced by D. D. Nash in 1976 (1). This report covers a simpler, more accurate system of vehicle counting and classification and details the development of the classification software that will enable it to surpass previous systems in accuracy.
Although many articles on vehicle classification methods have appeared in transportation journals within the past decade, most have dealt solely with new types, or applications, of vehicle detection systems. For the actual classification of the vehicles detected, most have depended on the classification method developed by D. D. Nash (1) for his Automatic Length Indication and Classification Equipment system. Therefore this paper begins with an overview of that system, which is referred to as the ALICE method .
THE ALICE METHOD
In 1974, during a project known as the West London Area Traffic Control Experiment in England, planners encountered a major problem. Owing to the traffic composition changes that occurred at various times, it was determined that the vehicular counts to be utilized in the experiment would have to be weighted by vehicle type . An investigation of the traffic instrumentation equipment available at the time revealed that nothing met the requirements, and thus the planners set out to create such a system. What they created was termed the Automatic Length Indication and Classification Equipment, or ALICE, method. It was introduced in an article by D.D. Nash (1).
ALICE utilizes two loop detectors and an axle detector, which are placed in sequence in a short (about 5.5-m) segment of highway (Figure 1).
As a vehicle enters the segment, it is detected by the first loop detector and then by the second loop detector after a short time interval, called tl. The axles of the vehicle then trip the axle detector as they pass; and the time interval between axles, called t2 , is recorded . The time intervals are measured using a rather complex circuit consisting of a crystal oscillator, a comparator, and several counters. The distance between the leading edges of the two loop detectors, called dl, is known and is related to tl and the velocity of the vehicle.

McCullough et al. 179
r-d1--I ./ Axle detector
DIRECTION OF
TRAVEL -I LOOP A I I LOOPB I [DJ
~d2~ OUTPUT _J
DETECTOR A
OUTPUT DETECTOR-----'
B i- t2 -j O~~r~T _______ ____.n fl_
DETECTOR - TIME
FIGURE 1 Principle of the ALICE method.
Likewise, t2 is related to the velocity of the vehicle and the distance between the two axles, termed d2. Since this produces two equations with two unknowns, d2 can be determined. This calculation is performed within the circuit, which results in the recording of the length, axle spacings, speeds, and gap distance for each vehicle that passes through the segment.
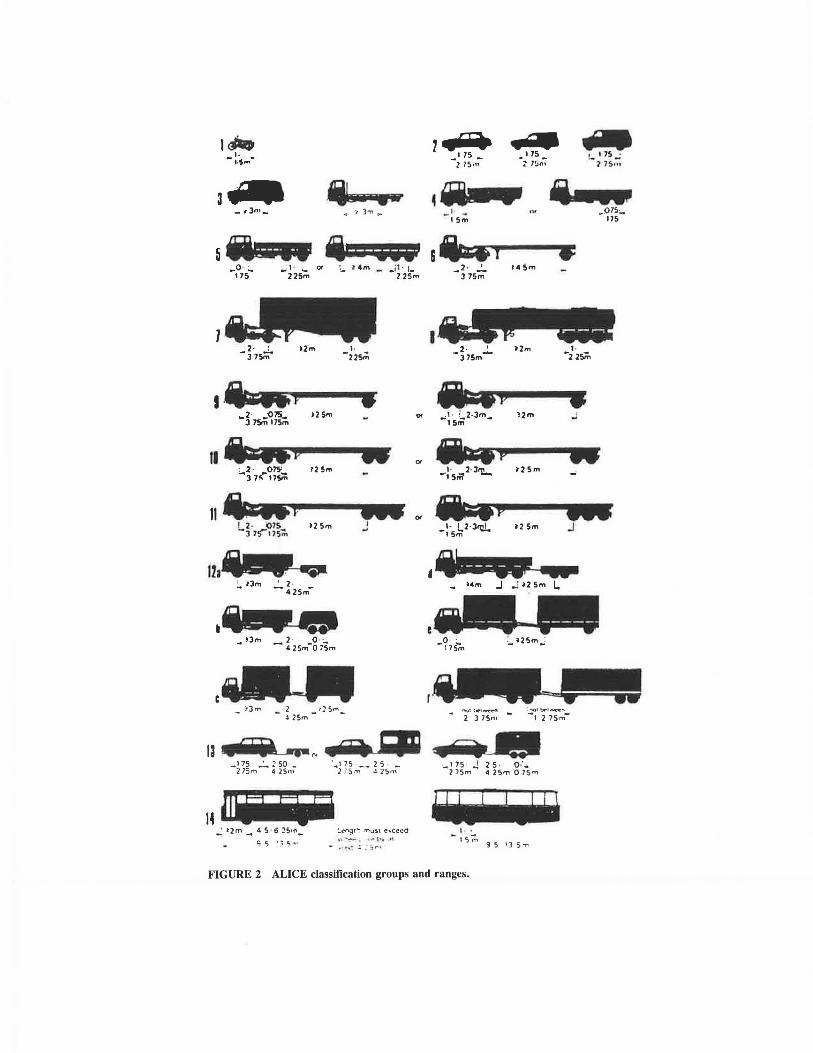
The ALICE system then compares the axle numbers and spacing data of the vehicle with a database, consisting of the axle number and spacing ranges of fourteen vehicle groups, using a logic program. The database includes the following classification groups as termed by ALICE (and as commonly referred to):
1. Motorcycles, 2. Private cars and light vans, 3. Two-axle heavy goods vehicles (two-axle single-unit
trucks or vans), 4. Three-axle rigid goods vehicles (three-axle single-unit
trucks), 5. Four-axle rigid goods vehicles (four-axle single-unit
trucks), 6. Three-axle articulated lorries (three-axle tractor
trailers), 7. Four-axle articulated lorries (two-axle tractors with two
axle trailers), 8. Five-axle articulated lorries (two-axle tractors with three
axle trailers), 9. Four-axle articulated lorries (three-axle tractors with
one-axle trailers), 10. Five-axle articulated lorries (three-axle tractors with
two-axle trailers), 11. Six-axle articulated lorries (three-axle tractors with three-
axle trailers), 12. Road trains (single-unit trucks with trailers), 13. Cars with caravan/trailer, and 14. Buses or coaches.
If the axle data of the vehicle fit within the spacing ranges of one of those groupings (Figure 2), then the vehicle is classified as a member of that group and recorded.
THE TWO-POINT-TIME-RATIO METHOD
The Two-Point-Time-Ratio, hereafter referred to as TPTR, method of vehicle classification is similar to the ALICE method, except that only two vehicle detectors are needed to determine the same data (except for vehicle length, which is not essential for classification purposes); thus, it is more efficient in its use of hardware. The detector sensors are placed in a short section of highway, similar to the ALICE sensors; but more flexibility is offered because in TPTR, unlike ALICE, any combination of passage loop detectors, presence loop detectors, or axle detectors may be utilized. For simplicity the first detector in the sequence is referred to as sensor A and the second detector, as sensor B, as shown in Figure 3.
As a vehicle enters the segment, its front axle is initially detected by sensor A and then by sensor B after a short time interval, which is referred to as 1U (and is equivalent to the variable tl in the ALICE method). The time interval(s) between axle detections at sensor A are also determined, with n representing the interval between the first and second axles, 12 representing the interval between the second and third axles, and so on.
As the work progressed on the circuitry necessary to interface the TPTR sensors with a microcomputer, the focus shifted to possible classification programs. The first such program that was considered was one that would utilize the methodology of the ALICE system; it was determined, however, that such a program would not be well suited for use with the TPTR system for several reasons. One of the predominant reasons was the limited number of vehicle classes covered by the ALICE database. Since the database resulted from observations in England in the early 1970s, it was biased toward
_ 1Jm_
--------.. ••• _o - .; ' ... or ._ ' ""' _ i1. 1 .. 175 225m 22Sm
1 2· :
- 3 7s;;;" alm •· -22~
.~, ••• ? • .2· _<>75_ nsm J 75m 17Sm
11lra&Wit cc '-~·7("~~ l2 Sm
11 ••• , CCU I 2· 07S. >2Sm I -3 7s'"°l7S~
,.,
121~ ~ JJm ' 2.
- 42Sm-
-~
14
_ tlm 2 . -0 . c 2Sm-o 7Sm
llm 2 •2 Sm J 2Sm
_175 .:.. "50 · -l75m 4 2Sm
_: t2m _ 4 5 •6 ~51,,_
g 5 .. , 5 ..
·-' 75 -- 2 5 -2 ;:" 5m J.2Sn\
!..t.'<'lgt"': l'T"uSt e'ceed ., ·~-.... , .. ,, - ... , . .:. : :, ....
"'
..
"'
11Cll .... .. _, 75 - -175 !. I 75..;
2 75.n z 7~;;- 'l 7~1u
.a a ii SCI _,. - .075:_ 1 Sm 115
& •• , • _2 . ~ 14Sm J 75m
I ... 2· ..!.. >2m 1·
J 75m -2 2sm
•• p • ...1 · L.2·3m_ ?2m ' 15m
,.,
iitel p cc 1· 2·lm .... ,5,,,. .... J25m
iircwv GUS -:·5~2 · l'UJ.. >2 Sm J . ...___ - >4m J ,.Jnsm L
_o :... :_ >2Sm~ 175m
""J'~'~" : .,,,,1tw1~ .. • 2 3 75m - -, 2 75m-
an• '"1 1s ..J 2 s. o:_
2 75m 4 25m 0 /Sm
FIGURE 2 ALICE classification groups and ranges.

McCullough et al.
L
Front Axle
TO
T1
Front Axle
Rear Axle
T1
A •----- -1
d
Rear TO Axle
FIGURE 3 Principle of TPTR method.
B
vehicles of European design, which in some cases are very different from North American designs. For example, a twoaxle vehicle with a wheelbase of 10 ft (3.07 m), such as the typical American-made, sedan-type passenger car, would be classified as a two-axle, heavy goods vehicle by a classification system using the ALICE grouping ranges. The ALICE database also contains many axle configurations, such as threeaxle full trailers, which are very rarely seen in North America. The database also lacks groupings for vehicles, such as tractor twin-trailers, that have become common in recent years. Therefore it was determined that an updated, and more extensive, classification program was needed for the TPTR system.
The objective therefore was to create a flexible, modern classification program that could be interfaced to operate automatically with the TPTR system, or operated interactively by an individual, and would result in greater accuracy than the ALICE system for the North American vehicle mix.
The Classification Methodology
This classification program was set up so that it could be used in either of two modes. The first mode, referred to as the automatic mode, is for use when the microcomputer is directly interfaced with the field sensors. In that mode data are retrieved directly from the storage file. The second mode, referred to as the interactive mode, is interactive and allows data to be entered from the computer keyboard in either time-interval or wheelbase-spacing form. The classification theory utilized by both modes is the same, and the process can be divided into two steps: speed and wheelbase determination, and vehicle classification.
The theory behind the calculation of speed in this program is simple. Point A and point B (Figure 3), the locations of the two sensors, are a known distance apart. The time taken
181
by the vehicle to travel that distance, 7D, is also known (one of the time intervals retrieved from data storage or entered by the operator). Therefore, by dividing the distance by the time, the program computes the speed of the vehicle.
The program then uses that speed calculation and the time intervals between axles (Tl, T2 ... ) to compute the axle spacings. Dl (the distance between the first two axles) is computed by multiplying Tl by the vehicle speed. Likewise, D2 can be calculated from 72, D3 from 13, and so forth.
Those simple calculations result in obtaining estimates of the speed of the vehicle and, more important, the axle spacings, which are the basis for the vehicle classification.
The classification methodology on which this program is based rises from the fact that the number and spacing of a vehicle's axles are closely related to the length and use of that vehicle. Because of different designs, manufacturers, and options, very few of the thousands of vehicle models produced are exactly alike in all wheelbase measurements. While no single set of measurements can be used, however, ranges can be developed that will include most, if not all, of the vehicle models that are similar in appearance and function. For example, one vehicle type is the passenger automobile, which is intended for the transport of a small number of people and a low amount of weight. It is characterized by a frame that has two axles, a length of less than 20 ft, and a wheelbase spacing of between 6 and 13 ft. The development of such ranges for all vehicle types is discussed later, in the section entitled "Vehicle Classes." Those ranges are the basis for the computer program used for classification.
In the first step of the classification process, the program retrieves the axle count and proceeds to the section where vehicles with that number of axles are analyzed. The program then retrieves the axle spacing data and compares them to the axle spacing ranges of the most common vehicle class with the same number of axles. If all the axle spacings of the vehicle fit within the ranges of that class, then the vehicle is classified as a member of that class. If not, then the axle data are compared to the ranges of the second most common vehicle, and so on, until the vehicle is classified. If the vehicle data do not fit into any of the class ranges in the database, then the vehicle is classified as an "unknown X-axle vehicle" (where Xis the number of axles). This is unlike the ALICE method, which classifies any vehicle that does not fit within any other group into group 12 ("road trains"). Because of the design of the program, it is unlikely for a vehicle to be classified into more than one group; but in those cases where a vehicle's wheelbase can be associated with more than one class, the operator is alerted through an information screen that may be viewed after the classification. That screen lists the most common vehicle in the class, other vehicles within the class, and vehicles of other classes that may be erroneously placed in that class owing to similar axle spacings.
For example, a two-axle vehicle with a 14-in. wheelbase is detected by the sensors. The program shifts to the section for analysis of two-axle vehicles. After unsuccessfully comparing the 14-in. wheelbase with the range for the small and midsize car class (6-9 ft) and the range for the large passenger car class (9-13 ft), it successfully matches that wheelbase to the two-axle, single-unit truck class (13-25 ft). Therefore the vehicle is classified as a two-axle single-unit truck. That classification is displayed on the screen along with the calculated speed of the vehicle (in miles per hour) and the wheelbase.
182 TRANSPORTATION RESEARCH RECORD 1215
A quick glance at the information screen, invoked with a response of yes to the next prompt, reveals that the most common vehicle in this class is indeed the two-axle single-unit truck and that recreational vehicles (RVs) and conventional schoolbuses are also included in the class. It also reveals that limousines and crew-cab pickup trucks (both members of the large passenger car class) have wheelbases that may cause them to be incorrectly placed in this class.
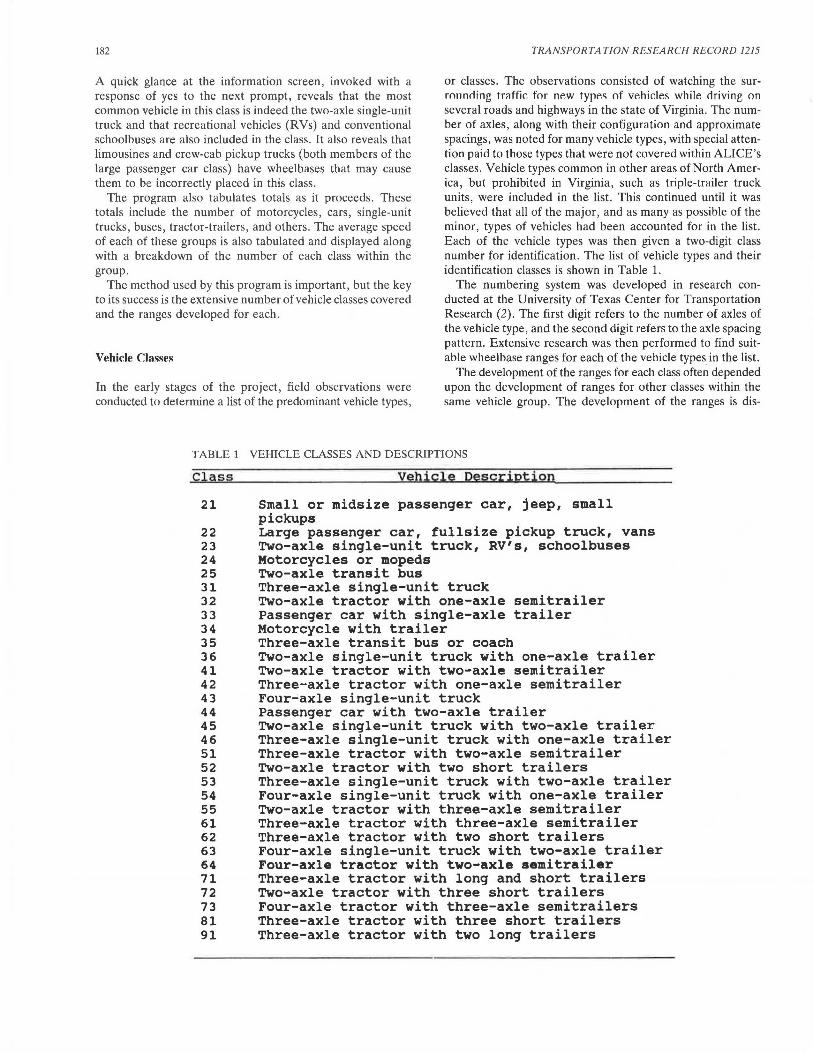
or classes. The observations consisted of watching the surrrnmrling trnffir. for nP.w types of vehir.les while clrivine on several roads and highways in the state of Virginia. The number of axles, along with their configuration and approximate spacings, was noted for many vehicle types, with special attention paid to those types that were not covered within ALICE's classes. Vehicle types common in other areas of North America, but prohibited in Virginia, such as triple-trailer truck units, were included in the list. This continued until it was believed that all of the major, and as many as possible of the minor, types of vehicles had been accounted for in the list. Each of the vehicle types was then given a two-digit class number for identification. The list of vehicle types and their identification classes is shown in Table 1.
The program also tabulates totals as it proceeds. These totals include the number of motorcycles, cars, single-unit trucks, buses, tractor-trailers, and others. The average speed of each of these groups is also tabulated and displayed along with a breakdown of the number of each class within the group.
The method used by this program is important, but the key to its success is the extensive number of vehicle classes covered and the ranges developed for each.
The numbering system was developed in research conducted at the University of Texas Center for Transportation Research (2). The first digit refers to the number of axles of the vehicle type, and the second digit refers to the axle spacing pattern. Extensive research was then performed to find suitable wheelbase ranges for each of the vehicle types_ in the list . Vehicle Classes
In the early stages of the project, field observations were conducted to determine a list of the predominant vehicle types,
The development of the ranges for each class often depended upon the development of ranges for other classes within the same vehicle group. The development of the ranges is dis-
TABLE 1 VEHICLE CLASSES AND DESCRIPTIONS
Class
21
22 23 24 25 31 32 33 34 35 36 41 42 43 44 45 46 51 52 53 54 55 61 62 63 64 71 72 73 81 91
Vehicle Description
Small or midsize passenger car, jeep, small pickups Large passenger car, fullsize pickup truck, vans Two-axle single-unit truck, RV's, schoolbuses Motorcycles or mopeds Two-axle transit bus Three-axle single-unit truck Two-axle tractor with one-axle semitrailer Passenger car with single-axle trailer Motorcycle with trailer Three-axle transit bus or coach Two-axle single-unit truck with one-axle trailer Two-axle tractor with two-axle semitrailer Three-axle tractor with one-axle semitrailer Four-axle single-unit truck Passenger car with two-axle trailer Two-axle single-unit truck with two-axle trailer Three-axle single-unit truck with one-axle trailer Three-axle tractor with two-axle semitrailer Two-axle tractor with two short trailers Three-axle single-unit truck with two-axle trailer Four-axle single-unit truck with one-axle trailer Two-axle tractor with three-axle semitrailer Three-axle tractor with three-axle semitrailer Three-axle tractor with two short trailers Four-axle single-unit truck with two-axle trailer Four-axle tractor with two-axle semitrailer Three-axle tractor with long and short trailers Two-axle tractor with three short trailers Four-axle tractor with three-axle semitrailers Three-axle tractor with three short trailers Three-axle tractor with two long trailers

McCullough et al. 183
TABLE 2 WHEELBASE RANGES (IN FEET) BY CLASS
Class Wl W2 W3 W4 W5 W6 W7 W8
21 6-9 22 9-12.25 23 12.25-25 24 3-6 26 25-35 31 8-25 2-6 32 8-20 20-45 33 6-12.25 6-20 34 3-6 3-7 35 25-35 2-6 36 12.25-25 6-20 41 8-20 15-45 2-12.5 42 8-25 2-6 15-45 43 8-25 2-6 2-6 44 6-12.25 6-15 2-6 45 12.25-25 6-15 2-6
6-12 7-20 46 8-25 2-6 6-15 51 8-25 2-6 15-45 2-12.5 52 8-25 11-36 6-20 7-35 53 8-25 2-6 6-15 2-6
6-12 7-20 54 8-25 2-6 2-6 6-15 55 8-20 11-42 2.6 2-6 61 8-25 2-6 11-42 2-6 2-6 62 8-25 2-6 11-36 6-20 7-35 63 8-25 2-6 2-6 6-15 2-6
6-12 7-20 64 8-25 2-6 2-6 15-45 2-12.5 71 8-25 2-6 11-45 2-6 7-15 11-25 72 8-20 11-45 7-15 11-25 7-15 11-25 73 8-25 2-6 2-6 11-42 2-6 2-6 81 8-25 2-6 11-45 7-15 11-25 7-15 11-25 91 8-25 2-6 11-45 2-12.5 7-15 2-6 11-45 2-12.5
cussed in this section on a group-by-group basis. The ranges obtained are shown in Table 2. In this table, Wl represents the distance between the first and second axles, W2 represents the distance between the second and third axles, and so on.
Motorcycles
The vehicle type that is most easily identified from its wheelbase is the motorcycle (class 24). Although model lengths have tended to increase in recent years, the motorcycle wheelbase has remained much shorter than that of any other vehicle. The first range considered for this vehicle type was the 1-1.5-m range used by ALICE. Field measurements showed that the lower limit was appropriate but that some models had wheelbases exceeding the upper limit. Therefore the lower limit was converted to the nearest equivalent length in feet, namely 3 ft, and the upper limit was extended to 6 ft, a distance that would include all the models inspected.
Motorcycles with small trailers were also encountered during research and were included in the vehicle list as class 34.
These vehicles consist of a cycle with a short single-axle trailer connected to it at the hub of the rear wheel to provide additional luggage or storage space. The vehicles inspected were found to have distances of approximately 3 to 7 ft between the rear cycle axle and the trailer axle. Since these trailers can be used with most cycles, the range used for the distance between the first and second axles, Wl, was the same as that used for class 24 (3-6 ft).
Passenger Cars
The most common type of highway vehicle is the passenger car, which accounts for more than half of the traffic on a typical highway. Every year, several manufacturers produce millions of these vehicles in a variety of hundreds of models and sizes. These range from tiny, two-door subcompact models to limousines. Naturally, most of those models have different wheelbases, encompassing a wide size range. As an example of the wide range in car wheelbases, consider the 1988 Yugo and the 1988 Cadillac Fleetwood . The Yugo has a wheelbase
184
of 84.6 in., whereas the Fleetwood has a wheelbase of 134.4 in ., ;i ciifference of 50 in. in cars produced in the same year (3). Research determined that the shortest wheelbase among car models produced in the past 15 years was the 83 .0-in . span of Triumphs produced between 1972 and 1980 (4). The vehicle with the longest wheelbase within the same period was the 1975 Cadillac Fleetwood, with a span of 151.5 in. (5). For most years, however, the longest wheelbase was 145 in. or less . If present trends continue, cars in the future will have shorter wheelbases than those currently seen . Such a trend led to the consideration of the lower limit of 6 ft used by Izadmehr (2).
Pickup trucks and vans are also included in the passenger car classes; thus, research was likewise performed to determine the upper limits of their wheelbase ranges. The lower limit was not examined thoroughly because field observations had revealed that limit to be much longer than ~3 in. From brochures of various manufacturers , it was determined that most conventional, full-sized pickups had wheelbases of as much as 168 in . (6) .
Based on those figures , and the fact that a significant number of single-unit trucks had been found to have wheelbases as short as 150 in., the lower and upper limits of the passenger car range were set at 6 ft (72 in.) and 12.25 ft (147 in.) . This class was then split into two classes: class 21, for small and midsize cars, Jeeps , Blazers, and small pickups; and class 22, for large cars, vans , and full-size pickups. The point of division was selected as 9 ft , since it resembled figures used by automotive magazines (3) for such separation.
Two other classes were created for passenger cars with trailers. Class 33 is for passenger cars, pickups, Jeeps, and Blazers that are pulling a short , single-axle trailer. Class 44 is for such cars pulling a short , two-axle trailer. The range for the first axle spacing in each of these classes is the 6- to 12.25-ft range developed earlier. For the development of the range for the second axle spacing of these classes, other factors had to be considered. The first fal:lur was Lhal lluee-axle single-unit trucks have a first axle spacing that closely resembles that of larger passenger cars and a second axle spacing of 2 to 6 ft. The second factor was that the first axle spacing of three-axle tractor-trailers is also similar to that of passenger cars. Those tractor-trailers have a second spacing of 11 to 45 ft. From field measurements, it was determined that the distance between the rear passenger car axle and the front trailer axle is usually greater than 6 ft. It was also determined that for a three-axle vehicle with a second axle spacing greater than 20 ft, three-axle tractor-trailers were more common than cars with trailers . But for four-axle vehicles with second axle spacings greater than 15 ft, four-axle tractor-trailers were found to be more common .
Therefore class 33, cars with a one-axle trailer , was given a range of 6 to 20 ft for the spacing between the second and third axles.
Class 44, cars with a two-axle trailer, was given a range of 6 to 15 ft for the second axle spacing and a range of 2 to 6 ft for the third axle spacing, because that is the range of tandem axles.
Single-Unit Trucks
To determine appropriate intervals for the nine classes of single-unit trucks covered by the program, each class was
TRANSPORTATI ON RESEARCH RECORD 1215
divided into its components. Because of similarities between classes, the task could be reduced to the development of intervals for the five components that make up those nine classes. Those components are two-axle , three-axle , and fouraxle single-unit trucks and one-axle and two-axle trailers.
The interval of 11 to 25 ft is suggested by Izadmehr (2) for two-axle single-unit trucks, but that interval was found to include many passenger cars and pickups and thus had to be altered. As described earlier in the section on passenger cars, research determined that an appropriate upper limit of the range for the passenger car class would be 12.25 ft, to minimize classification errors between the two classes. Therefore 12.25 ft, inclusive , was decided on as the lower limit for the interval. After research revealed a significant number of twoaxle single-unit trucks with wheelbases of 24 ft , the suggested upper limit of 25 ft was adhered to .
lzadmehr (2) also suggests an interval of 8 to 26 ft fur the first axle spacing and an interval of 2 to 6 ft for the second axle spacing of three-axle single-unit trucks. Since three-axle passenger cars are rare, the same lower limit constraints -do not exist for these vehicles. All of the three-axle single-unit trucks observed during research fit within the suggested range , but some transit buses that were observed had 25-ft distances between the first two axles. Thus the ranges within the program for three-axle single-unit trucks were set at 8 to 25 ft and at 2 to 6 ft.
Izadmehr also suggests ranges of 8 to 25 ft and of 2 to 6 ft for the axle spacings of four-axle single-unit trucks. Since all such vehicles observed fit within those ranges, they were adopted into the program.
For the one-axle trailers an interval had to be determined for the distance between the last axle of the preceding truck and the axle of the trailer. As in the previous case with passenger cars, it was determined that ranges that included lengths shorter than 6 ft would result in the classification of the rear axle of some tandem-axle vehicles as a trailer , since some Lamle111-axle sets have spacings of 6 ft. Likewise , it was determined that ranges with upper limits exceeding 15 ft would result in numerous misclassifications of short tractor-trailer combinations. The interval selected was 6 to 15 ft.
For two-axle trailers, two types were noted . The first type involves a set of tandem axles near the rear of the trailer. The second type, called a full trailer, has a front axle and a rear axle. The range for single-axle trailers (6-15 ft) was chosen, along with the typical tandem-axle spacing of 2 to 6 ft, for the first type. Since few examples of the second type of trailer could be found, the first range used by the ALICE system was adopted, and a second range was created that was thought to typify short full trailers. Those ranges are 6 to 12 ft and 7 to 20 ft, respectively . The axle spacing ranges for each class that result from the preceding component spacings can be seen in Table 2.
Buses
Buses are probably the most difficult type of vehicle to differentiate from vehicles of other classes. This is due to the fact that most buses, especially schoolbuses, are constructed on frames that were designed for single-unit trucks . That results in a range of wheelbases from 12 ft (typical minibus) to more than 30 ft (long transit-type buses) . The most common school-
McCullough el al.
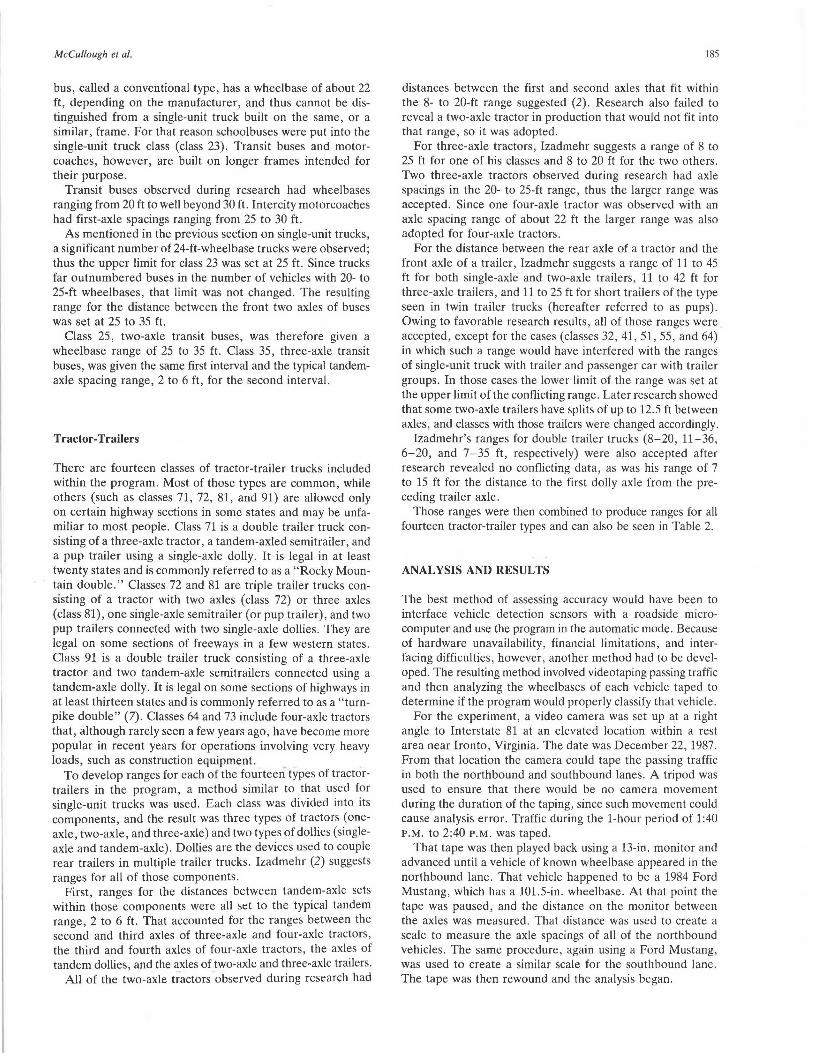
bus, called a conventional type, has a wheelbase of about 22 ft, depending on the manufacturer, and thus cannot be distinguished from a single-unit truck built on the same , or a similar, frame. For that reason school buses were put into the single-unit truck class (class 23). Transit buses and motorcoaches, however, are built on longer frames intended for their purpose.
Transit buses observed during research had wheelbases ranging from 20 ft to well beyond 30 ft . Intercity motorcoaches had first-axle spacings ranging from 25 to 30 ft.
As mentioned in the previous section on single-unit trucks, a significant number of 24-ft-wheelbase trucks were observed; thus the upper limit for class 23 was set at 25 ft. Since trucks far outnumbered buses in the number of vehicles with 20- to 25-ft wheelbases, that limit was not changed. The resulting range for the distance between the front two axles of buses was set at 25 to 35 ft.
Class 25, two-axle transit buses, was therefore given a wheelbase range of 25 to 35 ft. Class 35, three-axle transit buses, was given the same first interval and the typical tandemaxle spacing range, 2 to 6 ft, for the second interval.
Tractor-Trailers
There are fourteen classes of tractor-trailer trucks included within the program. Most of those types are common, while others (such as classes 71, 72, 81, and 91) are allowed only on certain highway sections in some states and may be unfamiliar to most people. Class 71 is a double trailer truck consisting of a three-axle tractor, a tandem-axled semitrailer, and a pup trailer using a single-axle dolly. It is legal in at least twenty states and is commonly referred to as a "Rocky Mountain double." Classes 72 and 81 are triple trailer trucks consisting of a tractor with two axles (class 72) or three axles (class 81), one single-axle semitrailer (or pup trailer), and two pup trailers connected with two single-axle dollies. They are legal on some sections of freeways in a few western states. Class 91 is a double trailer truck consisting of a three-axle tractor and two tandem-axle semitrailers connected using a tandem-axle dolly. It is legal on some sections of highways in at least thirteen states and is commonly referred to as a "turnpike double" (7). Classes 64 and 73 include four-axle tractors that, although rarely seen a few years ago, have become more popular in recent years for operations involving very heavy loads, such as construction equipment.
To develop ranges for each of the fourteen types of tractortrailers in the program, a method similar to that used for single-unit trucks was used. Each class was divided into its components, and the result was three types of tractors (oneaxle, two-axle, and three-axle) and two types of dollies (singleaxle and tandem-axle) . Dollies are the devices used to couple rear trailers in multiple trailer trucks. Izadmehr (2) suggests ranges for all of those components.
First, ranges for the distances between tandem-axle sets within those components were all set to the typical tandem range, 2 to 6 ft. That accounted for the ranges between the second and third axles of three-axle and four-axle tractors, the third and fourth axles of four-axle tractors, the axles of tandem dollies, and the axles of two-axle and three-axle trailers.
All of the two-axle tractors observed during research had
185
distances between the first and second axles that fit within the 8- to 20-ft range suggested (2). Research also failed to reveal a two-axle tractor in production that would not fit into that range, so it was adopted.
For three-axle tractors, Izadmehr suggests a range of 8 to 25 ft for one of his classes and 8 to 20 ft for the two others. Two three-axle tractors observed during research had axle spacings in the 20- to 25-ft range , thus the larger range was accepted. Since one four-axle tractor was observed with an axle spacing range of about 22 ft the larger range was also adopted for four-axle tractors.
For the distance between the rear axle of a tractor and the front axle of a trailer, Izadmehr suggests a range of 11 to 45 ft for both single-axle and two-axle trailers, 11 to 42 ft for three-axle trailers, and 11 to 25 ft for short trailers of the type seen in twin trailer trucks (hereafter referred to as pups). Owing to favorable research results, all of those ranges were accepted , except for the cases (classes 32 , 41, 51, 55, and 64) in which such a range would have interfered with the ranges of single-unit truck with trailer and passenger car with trailer groups . In those cases the lower limit of the range was set at the upper limit of the conflicting range. Later research showed that some two-axle trailers have splits of up to 12.5 ft between axles, and classes with those trailers were changed accordingly.
Izadmehr's ranges for double trailer trucks (8-20 , 11-36, 6-20, and 7-35 ft, respectively) were also accepted after research revealed no conflicting data, as was his range of 7 to 15 ft for the distance to the first dolly axle from the preceding trailer axle.
Those ranges were then combined to produce ranges for all fourteen tractor-trailer types and can also be seen in Table 2.
ANALYSIS AND RES UL TS
The best method of assessing accuracy would have been to interface vehicle detection sensors with a roadside microcomputer and use the program in the automatic mode. Because of hardware unavailability, financial limitations, and interfacing difficulties, however, another method had to be developed. The resulting method involved videotaping passing traffic and then analyzing the wheelbases of each vehicle taped to determine if the program would properly classify that vehicle.
For the experiment, a video camera was set up at a right angle to Interstate 81 at an elevated location within a rest area near Ironto, Virginia. The date was December 22, 1987. From that location the camera could tape the passing traffic in both the northbound and southbound Janes. A tripod was used to ensure that there would be no camera movement during the duration of the taping, since such movement could cause analysis error. Traffic during the 1-hour period of 1:40 P.M. to 2:40 P.M. was taped .
That tape was then played back using a 13-in. monitor and advanced until a vehicle of known wheelbase appeared in the northbound lane. That vehicle happened to be a 1984 Ford Mustang, which has a 101.5-in. wheelbase. At that point the tape was paused, and the distance on the monitor between the axles was measured . That distance was used to create a scale to measure the axle spacings of all of the northbound vehicles . The same procedure, again using a Ford Mustang, was used to create a similar scale for the southbound lane. The tape was then rewound and the analysis began.
186
As each vehicle passed across the monitor, the tape was paused and the axle spacings measured. The measured spacings were then compared with the ranges used with the program to determine whether the vehicle would have been classified into the correct class. The result for each vehicle was then recorded as either a correct or an incorrect classification.
. That procedure was repeated until all of the vehicles on the tape had been classified.
Because of the small screen used and the amount of visual uislurliun common to video recordings, the spacings could be measured only to within 3 in. (0.25 ft). This was judged to be accurate enough for vehicles where a difference of 3 in. would not have affected classification. In those cases where it would have affected classification, the distance was measured in several consecutive video frames and an average calculated.
The measurements of certain vehicles, such as 1983-1985 Mustangs, were also compared with the actual wheelbases (from Chilton's Automotive Industries) throughout the analysis to determine the accuracy of the experiment and to make sure that the camera had not moved.
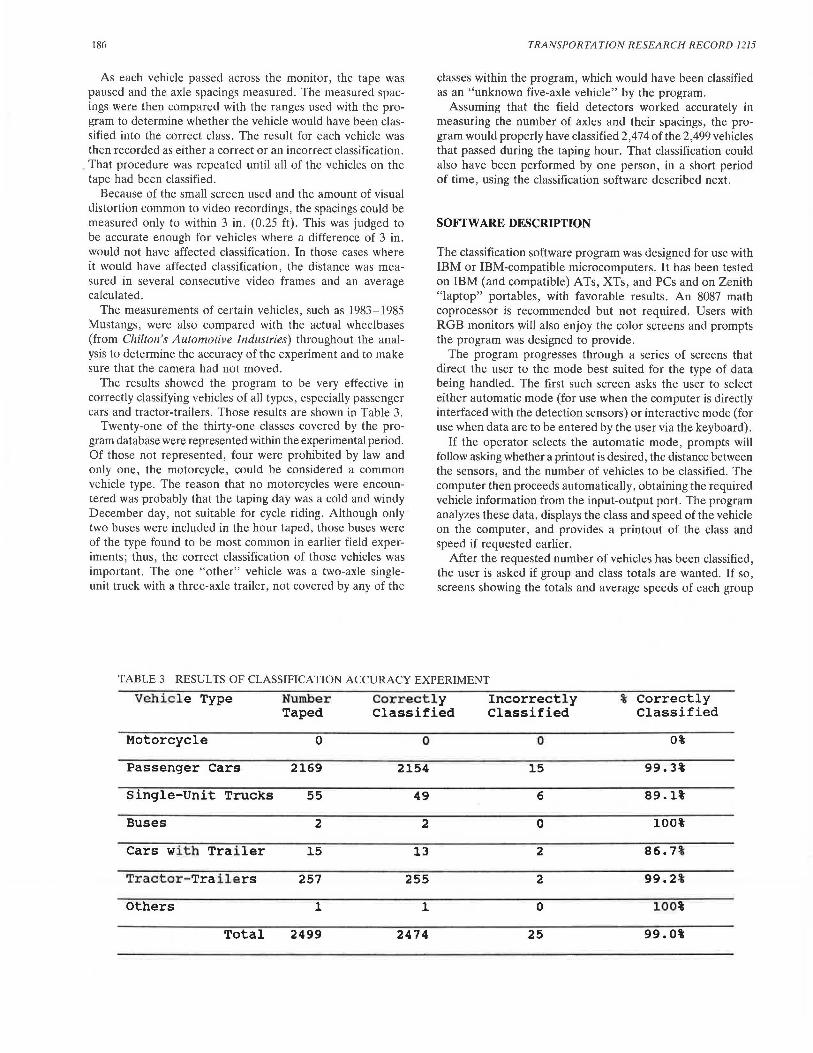
The results showed the program to be very effective in correctly classifying vehicles of all types, especially passenger cars and tractor-trailers. Those results are shown in Table 3.
Twenty-one of the thirty-one classes covered by the program database were represented within the experimental period. Of those not represented, four were prohibited by law and only one, the motorcycle, could be considered a common vehicle type. The reason that no motorcycles were encountered was probably that the taping day was a cold and windy December day, not suitable for cycle riding. Although only two buses were included in the hour taped, those buses were of the type found to be most common in earlier field experiments; thus, the correct classification of those vehicles was important. The one "other" vehicle was a two-axle singleunit truck with a three-axle trailer, not covered by any of the
TRANSPORTATION RESEARCH RECORD 1215
classes within the program, which would have been classified as an "unknown five-axle vehicle" by the program.
Assuming that the field detectors worked accurately in measuring the number of axles and their spacings, the program would properly have classified 2,474 of the 2,499 vehicles that passed during the taping hour. That classification could also have been performed by one person, in a short period of time, using the classification software described next.
SOFTWARE DESCRIPTION
The classification software program was designed for use with IBM or IBM-compatible microcomputers. It has been tested on IBM (and compatible) ATs, XTs, and PCs and on Zenith "laptop" portables, with favorable results. An 8087 math coprocessor is recommended but not required. Users with RGB monitors will also enjoy the color screens and prompts the program was designed to provide.
The program progresses through a series of screens that direct the user to the mode best suited for the type of data being handled. The first such screen asks the user to select either automatic mode (for use when the computer is directly interfaced with the detection sensors) or interactive mode (for use when data are to be entered by the user via the keyboard).
If the operator selects the automatic mode, prompts will follow asking whether a printout is desired, the distance between the sensors, and the number of vehicles to be classified. The computer then proceeds automatically, obtaining the required vehicle information from the input-output port. The program analyzes these data, displays the class and speed of the vehicle on the computer, and provides a printout of the class and speed if requested earlier.
After the requested number of vehicles has been classified, the user is asked if group and class totals are wanted. If so, screens showing the totals and average speeds of each group
TABLE 3 RES UL TS OF CLASSIFICATION ACCURACY EXPERIMENT
Vehicle Type Number Correctly Incorrectly % Correctly Taped Classified Classified Classified
Motorcycle 0 0 0 0%
Passenger Cars 2169 2154 15 99.3%
Single-Unit Trucks 55 49 6 89.1%
Buses 2 2 0 100%
Cars with Trailer 15 13 2 86.7%
Tractor- Trailers 257 255 2 99.2%
Others 1 1 0 100%
Total 2499 2474 25 99.0%
McCullough er al.
(car, bus, and so on), along with the totals for each class, are displayed on the monitor and the user is asked if a printout of those totals is desired. The next prompt asks if classification of another set of vehicles is desired. If the user answers yes, the program asks whether the totals are to be reset to zero, and then returns to ask the number to be classified. If the answer is no, then the computer asks the user whether it is desired to change mode or quit. When the user requests a mode change, the computer asks whether totals are to be reset and then asks which mode is desired.
If the operator selects the interactive mode, he or she is then asked to choose either the time-based option (for entry of data in the form of time intervals) or the length-based option (for entry of data in the form of wheelbase distances). Both options begin by asking if a printout is desired.
The time-based option then asks for the distance between the detection sensors, the time interval between the detection of the first axle at the two sensors, the number of axles, and the time interval between the axles at either of the detection sensors.
The length-based option asks for the number of axles, the distances between the axles, and whether a calculation of the speed is required. If so, the user is asked for the distance and time between the two points (or the sensors).
The program then uses that information to classify the vehicle and prints the class, speed (which is "unknown" if speed calculation was not requested in the length-based mode), and wheelbases of the vehicle on the monitor.
The user is also asked if additional information on the class of the vehicle is wanted. If the reply is yes, an information screen is displayed that lists the most common vehicle type in the class, other vehicles within the class, and vehicles of other classes that may accidentally be placed in the class.
The next prompt allows the user to perform one of five options. By selecting "C" (for "continue") the user is returned to the beginning of the previous option, so that data on the next vehicle can be entered. The selection of "T" (for "totals") results in the display of the previously mentioned total screens, showing group totals, group average speeds, and class totals. The user is then asked if he or she wants a printout of the totals, before returning to this prompt. Selecting "R" (for "reset") results in the resetting of the totals to zero and a return to this prompt. Selecting "M" (for "mode change") allows the user to change modes and reset the totals to zero if desired, while selecting "Q" allows the user to "quit."
To operate properly in automatic mode, vehicle detection sensors must be interfaced with the microcomputer so that the axle count (A), the time interval between sensors for the first axle (TO), and nine time intervals between axles (TlT9) are supplied to the program via the input-output port. Research is currently under way at Virginia Polytechnic Institute to develop such an interfacing system .
SUMMARY AND CONCLUSIONS
This report has described in detail the theoretical similarities and differences between the ALICE and Two-Point-TimeRatio systems of vehicle classification. It contains a review of the methodology used by the ALICE vehicle classification
187
system and the deficiencies of the database of the program used. The methodology and development of an alternative program , being developed for use with the TPTR system, were then discussed at length, with particular attention focused on the classification ranges used within it. An experiment has been conducted to determine the accuracy of the program, and the results are g"iven. The results prove the program to be highly accurate in the classification of all vehicle groups.
A thorough overview of the software has been given, followed by a discussion of the interfacing required for automatic operation. The uses and possible extensions of the classification system and the program itself have also been discussed.
It is therefore concluded that the Two-Point-Time-Ratio vehicle classification system represents a definite improvement over the popular ALICE system in the field of automated vehicle classification and speed determination. It requires only two detection sensors, covers a broader range of vehicle types, can be used interactively, is more modern, and is more accurate in classification. With an experimentally tested classification logic accuracy of 99.0 percent, the system can be viewed as a major advance in automated vehicle classification systems.
It is also anticipated that other automated classification systems could be greatly improved through use of the classification data bank and program set forth here.
APPLICATIONS
This classification system and its program can be used in many ways. It will provide needed information on the number of each type of vehicle using a portion of highway and will perform traffic counts to monitor the level of service provided. It will also provide information on the axle configurations of vehicles for use in maintenance management and planning, especially in the case of trucks, where those configurations greatly influence the stress and wear on highways and bridges. It also allows for monitoring vehicle speeds.
The program itself can be used in conjunction with other classification systems. As has been shown, the program is flexible enough to be used in the field or in the office. It was also designed with future vehicles in mind. That was done through the study of current trends in automobile design, such as size reduction, and the projection of those trends into the future.
With the inclusion of an axle counter that produces a signal proportional to the weight of a passing axle (such as a piezoelectric cable), this system could be extended to include weight information.
REFERENCES
1. D. D. Nash. ALICE: Automatic Length Indication and Classification Equipment: An Equipment for Automatically Classifying Vehicles and Measuring Their Speed . Traffic Engineering & Control , Vol. 17, No . 12, December 1976, pp . 195-201.
2. B. Izadmehr. Automatic Vehicle Classification System. Ph.D . dissertation . University of Texas, Austin , 1986, pp. 109-117 .
3. Engineering Specifications and Statistics : Motor Vehicles. Chi/-

188
ton's Automotive Industries, Vol. 166, No. 3, March 1987, pp. 57-81.
4. Engineering Specifications and Statistics: Motor Vehicles. Chilton's Automotive Industries, Vol. 152, No. 7, April 1, 1975, pp. 40-57.
5. Engineering Specifications and Statistics: Motor Vehicles. Chilton's Automotive Industries, Vol. 150, No. 7, April 1, 1974, pp. 46-68.
TRANSPORTATION RESEARCH RECORD 1215
6. Ford F-Series Pickup. Brochure 8803. Ford Motor Company, Detroit, Mich., August 1987, p. 19.
7. Special Report 211: Twin Trailer Trucks. TRB, National Research Council, Washington, D.C., 1986, pp. 212-219.
Publication of this paper sponsored by Committee on Vehicle Counting, Classification, and Weigh-In-Motion Systems.