axle and length based vehicle classification performance
TRANSCRIPT

Axle and Length Based Vehicle Classification Performance
Seoungbum Kim, PhD Candidate Graduate Research Associate Department of Civil, Environmental, and Geodetic Engineering The Ohio State University Columbus, OH 43210 E-mail: [email protected] Benjamin Coifman, PhD Associate Professor The Ohio State University Joint appointment with the Department of Civil, Environmental, and Geodetic Engineering, and the Department of Electrical and Computer Engineering Hitchcock Hall 470 2070 Neil Ave, Columbus, OH 43210 Phone: (614) 292-4282 E-mail: [email protected]

Kim and Coifman 13-0058
2
Abstract
This study evaluates the performance of three freeway, permanent vehicle classification stations
against concurrent video based ground truth. All of the stations have dual loop detectors and a
piezoelectric sensor in each lane, providing both axle-based and length-based classification. The
evaluation is done at the individual, per-vehicle resolution for each vehicle that passed during the study
periods (over 18,000 vehicles, uncongested). While the stations exhibited good performance overall (97%
correct), the performance for trucks was far worse, e.g., only 60% of the single unit trucks (SUT) were
correctly classified. We diagnosed all of the observed errors and some can be fixed quickly while others
cannot. Using data from one site, we revise the classifier to solve almost all of the fixable errors and then
test the performance at another location.
One chronic error found in this research is intrinsic to the vehicle fleet and may be impossible to
correct with the existing sensors; namely, the shorter, SUT have a length range and axle-spacing range
that overlaps with passenger vehicles (PV). Depending on the calibration, the error may be manifest as
SUT counted as PV or vice versa. One should expect such errors at most classification stations. All
subsequent uses of the classification data must accommodate this unavoidable blurring error. The blurring
also means that one cannot blindly use an axle classification station to calibrate the boundary between PV
and SUT for length-based classification stations, otherwise, the unavoidable errors in the axle-based
classification will be amplified in the length-based classification scheme.
Kim and Coifman 13-0058
3
1. Introduction For many transportation applications it is important to know the mix of passing vehicles on the
roadway. The volume of different vehicle classes are used for pavement design and management,
modeling freight flows, and studying air quality since different vehicle classes make systematically
different contributions [1]. The classification data are also important to ITS, e.g., automated tolling
systems often charge different rates depending on vehicle class.
Typical of most developed countries, every state in the US maintains a network of vehicle
classification stations to explicitly sort vehicles into several classes based on observable features, e.g.,
length, axle-spacing, and weight. Various technologies are used for this automated classification, the three
most common approaches are: weigh in motion (WIM); axle-based classification from a combination of
loop detectors, piezoelectric sensors or pneumatic sensors; and length-based classification from dual loop
detectors. There are many more emerging technologies that also promise vehicle classification, e.g., video
image processing and side-fire microwave radar.
While our findings likely apply to most classification stations, this study specifically examines
three permanent vehicle classification stations operated by the Ohio Department of Transportation
(ODOT) on different freeways around Columbus, OH (Figure 1(a)). Each lane at each of the stations has
dual loop detectors to measure speed and vehicle length, and a piezoelectric sensor to detect the axle
passages (Figure 1(b)), providing both the conventional 13 axle-based classes [1] and length-based
classification. In the latter case, it is common to provide only three or four classes, which are intended to
map to passenger vehicles (PV), single unit trucks (SUT), and multi-unit trucks (MUT).
The performance evaluation in this study is done at the "per-vehicle record" (pvr) resolution, i.e.,
we compare every individual vehicle that passed during the study periods (over 18,000 vehicles,
uncongested conditions). Evaluating the pvr data as done in this work is uncommon; normally the pvr
classifications are binned by fixed time periods, e.g., over 15 min or 1 hr, and the individual vehicle
information is discarded. However, such conventional aggregation allows errors to cancel one another,
which can obscure underlying problems.
While the stations exhibited good performance overall (97% correct), across all three stations the
performance for trucks was far worse, e.g., only 60% of the SUT were correctly classified as SUT by the
axle classifier. We diagnosed all of the observed errors and some can be fixed quickly (e.g., gaps between
bins) while others cannot. Using data from one site, we revise the classifier to solve almost all of the
fixable errors and then test the performance at another location.
One chronic error found in this research is intrinsic to the vehicle fleet and may be impossible to
correct with the existing sensors; namely, the shorter, SUT have a length range and axle-spacing range

Kim and Coifman 13-0058
4
that overlaps with PV. Depending on the calibration, the error may be manifest as SUT counted as PV or
vice versa. One should expect such errors at most classification stations. All subsequent uses of the
classification data (e.g., planning and measuring freight flows) must accommodate this unavoidable
blurring of SUT with PV. The blurring also means that one cannot blindly use an axle classification
station to calibrate the boundary between PV and SUT for length-based classification stations, otherwise,
the unavoidable errors in the axle classification will be amplified in the length-based classification
scheme.
The challenge from SUT blurring with PV is not unique to conventional detectors. Our group
found similar problems between PV/SUT when using side-fire LIDAR to classify vehicle profiles [2] and
estimated vehicle length from single loop detectors [3]. Meanwhile, several non-invasive sensor
manufacturers now offer length based vehicle classification as a feature of their sensors and their
classification performance has been evaluated in [4-9]. Most of these studies rely on manual counts for
ground truth to quantify performance and typically found overall classification error rates between 5%-
10%. Like the present study, however, most of the passing vehicles were PV. Many of the studies
sampled counts over extended periods, e.g., 15 min or 1 hr [4-7], which as noted above, allows for over-
counting errors to cancel under-counting errors. Even allowing the individual errors to cancel, the
SmartSensor had an overall error rate for trucks (SUT and MUT combined) of 46% [4], 80% [5], 50%-
400% [6], 20%-50% [7] and the RTMS had an error rate for trucks of 25% [4], 40%-97% [6]. Two
studies used a small sample of pvr data, only a few hundred vehicles, and found the SmartSensor had an
error rate for trucks of 13%-57% [8], 42% [9]. A few studies considered video systems, e.g., [7] found the
length based classification from an Autoscope to be unacceptable, while [10] had an error rate for trucks
of 73%. Although these studies reveal degraded non-invasive based classification for trucks, the authors
do not explicitly investigate the causes.
1.1. Overview
The remainder of this paper is as follows, in Section 2 we briefly review the details of the
classification stations, collection of concurrent video based ground truth data, and data reduction
processes for validation. Section 3 presents the overall performance of the stations and discusses the
systematic errors that we observed. Section 4 refines the classification tree to eliminate most of the
preventable errors using the ground truth data at one station and then evaluates the performance at another
station. Finally, Section 5 presents the conclusions and summarizes the results of this study.
Kim and Coifman 13-0058
5
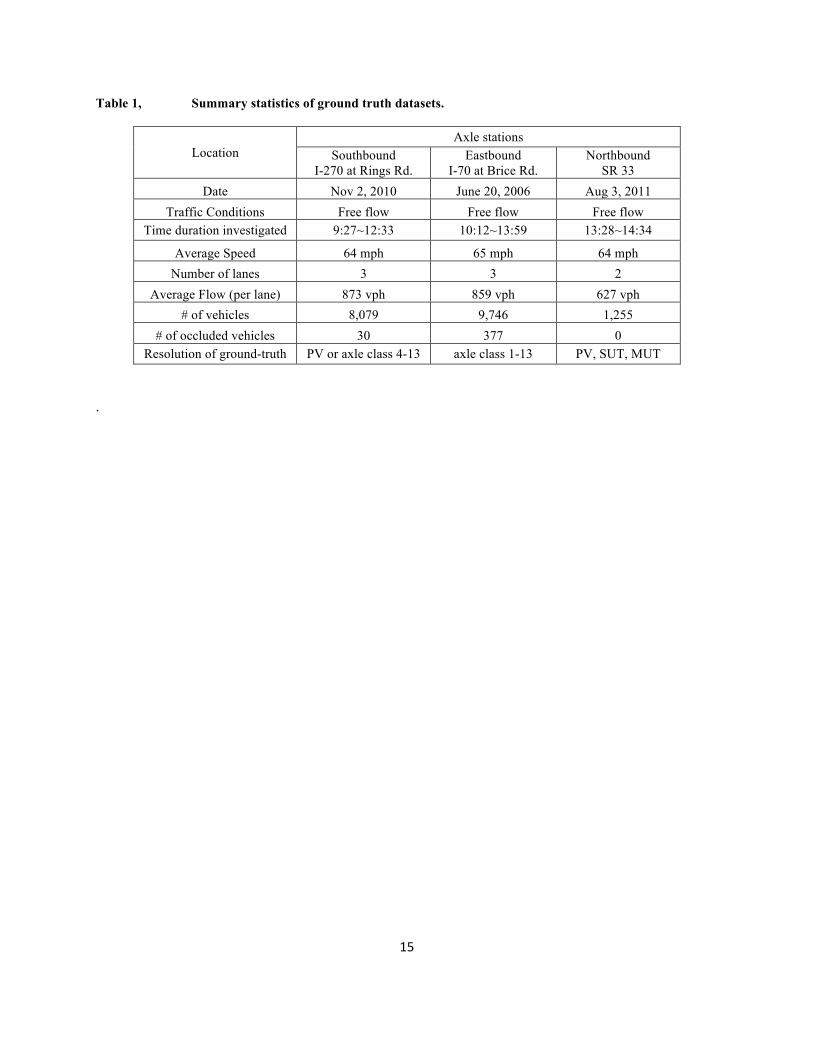
2. Classification Stations and Concurrent Ground Truth Data Table 1 enumerates summary statistics for the three classification stations used in this study and
Figure 1(a) shows their locations. The observation periods ranged between 1 and 3.5 hours, during which
time the per-vehicle record (pvr) data from the classifier were logged for the research and concurrent
video was recorded for evaluation. The classifier uses the dual loop detectors and piezoelectric sensor to
calculate vehicle speed, length, and axle-spacing(s). The classifier uses fixed length-thresholds to assign
length-class and a decision tree to assign axle-class based on the number of axles and their spacing(s). For
each vehicle the pvr data include: time stamp, lane, speed, number of axles, axle-spacing(s), axle-class,
vehicle length, and length-class.
After collecting the data in the field, we manually generate ground truth data from the video to
evaluate the performance of the classification stations. The first step consists of extracting individual
frames from the video. Although both the video and pvr data are time stamped, the two clocks are
independent, so the two datasets need to be time synchronized with one another. The time offset is a
constant and in the absence of any detection errors, a sequence of observed headways in one dataset
provides a unique pattern that can be found in the other dataset (similar to the vehicle reidentification in
[11]). Or more formally, we manually extract 9 successive headways from the video. After only a few
vehicles the sequence becomes distinct. We then look for this same headway sequence in the pvr data by
finding the time off-set that minimizes the total relative error between the video and pvr data time stamps
for the successive vehicles. Once the two datasets are time synchronized, we employ a semi-automated
process to generate the ground truth data using a software tool to simultaneously view the pvr
classification and the corresponding video frame (see [12-13] for details). The user then selects the axle
classification for the vehicle (or in rare cases indicates either that the vehicle is unclassifiable or that it is a
non-vehicle actuation). After the user has entered a class for the vehicle, the software immediately jumps
to the next vehicle reported in the pvr data for the lane. Obviously this approach will not catch a vehicle
that is completely missed by the classification station. The focus of the present work is on classification
performance; however, one could use additional techniques to also catch missed vehicles (e.g., using a
simple video image processing "trip wire", as in [12]; or an independent sensor, as in [2]). In an ideal
case, every single vehicle in the pvr would be assigned to its specific class, as was done in the I-70
dataset. The vast majority of the vehicles in our datasets are PV, axle-class 1-3. To greatly reduce the
labor necessary to reduce the data, in the I-270 dataset we combined the PV into a single group, and in the
SR-33 dataset we do a similar consolidation for the SUT and MUT vehicles. For a given dataset, all of the
vehicles were manually classified at the resolution shown in the bottom row of Table 1.
Kim and Coifman 13-0058
6
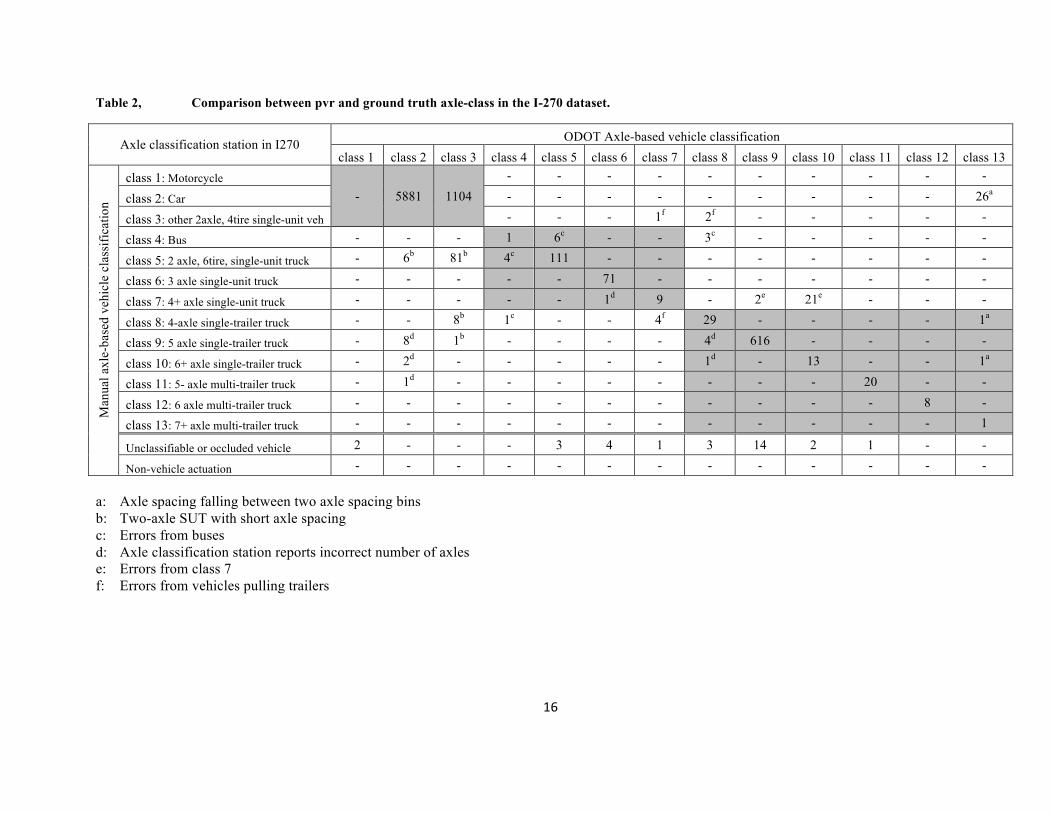
3. Performance of the Classification Stations Table 2 compares the pvr axle-class against the manual classifications over the 13 conventional
axle-classes for the 8,079 vehicles in the I-270 dataset. A given vehicle is counted in a single cell, the row
corresponding to its ground truth axle-class and the column corresponding to its pvr axle-class from the
classification station. Thus, each cell shows the total number of vehicles with the pairwise combination
from the manual and pvr classifications. As noted above, for a vehicle with pvr axle-class 1-3 in I-270,
the user only verifies that it is indeed a PV when generating the ground truth, and thus, the top left cells
span three rows.
For classes 4-13, the cells on the diagonal tally the number of correct classifications, while all of
the cells off of the diagonal tally classification errors. Overall 97% of vehicles are correctly classified, we
reviewed all of the vehicles that fell in cells off of the diagonal in Table 2. The various sources of error
are denoted with superscripts and will be discussed in the next section. These detailed results are similar
to those from I-70, as will be presented in Section 4.1.
3.1. Investigation of Axle-‐based Misclassifications
Table 2 shows that 2.2% (185 of 8,049) of the vehicles with ground truth were misclassified at
the I-270 site. We reviewed the video and actuations from all 185 erroneous classifications to diagnose
the source of each error. We found six different sources of the misclassifications, denoted with
superscripts in the table and described below.
Case “a”: Axle-‐spacing falling in between two axle-‐spacing bins
In Table 2 there are 26 axle-class 2 vehicles misclassified as class 13, which is clearly an error
since all of these vehicles had only two axles while class 13 is defined to have seven or more axles.
Although Table 2 only uses 3 hrs of data, we have a total of 14.5 hrs of pvr data from the station. The
remaining period does not have concurrent video, but is still useful for diagnosing this problem. Over the
entire dataset we found 88 class 13 vehicles with only two axles. Looking at a distribution of their axle-
spacing measurements, we found all of these vehicles had one of five discrete axle-spacing
measurements. The discretization is not in itself problematic or surprising, it merely reflects the sampling
resolution of the classifier. However, reviewing the axle-spacing criteria for the two-axle vehicle classes
(axle-classes 1-5) in the classifier's decision tree, it became apparent that there were small gaps between
the upper-bound of one class and the lower-bound for the next. These 88 vehicles literally fell in the
cracks between the classes. Obviously the bounds should be made continuous to avoid these errors. Since
the decision tree does not differentiate between axle-class 13 and unclassifiable, the errors were

Kim and Coifman 13-0058
7
compounded when the two-axle vehicles were assigned to axle-class 13. To prevent similar errors from
going undetected, an operating agency should explicitly define axle-class 13 and then add a 14th class for
the otherwise unclassifiable vehicles (e.g., as used in [4, 7]).
Case “b”: Two-‐axle SUT with short axle-‐spacing
In Table 2, there are 87 axle-class 5 vehicles misclassified as either axle-class 2 or axle-class 3 in
the pvr data. Reviewing the decision tree, all of these vehicles turn out to have an axle-spacing that falls
into the pvr assigned axle-class (see [13] for details), i.e., this problem arises because these vehicles' true
axle-spacing falls below the boundary for SUT. The classifier correctly classified these vehicles given
their measured axle-spacing and there is no indication that the axle-spacing measurements were
inaccurate. Figure 2(a) shows that all PV fell to the left of the axle-spacing boundary while (b) shows
many SUT with two-axles also fall to the left of the axle-spacing boundary. The problem cannot be
resolved by lowering the axle-spacing boundary because many PV would then be misclassified as SUT.
In fact if the boundary were moved any lower the number of PV misclassified as SUT would exceed the
number of SUT errors that are eliminated. It is possible that some of these errors could be eliminated if
the classifier considered both vehicle length and axle-spacing in the decision tree. Although as discussed
shortly in Section 3.3 most of these errors would remain because axle-spacing and vehicle length of these
vehicles are highly correlated. Marginal improvements could be made by also considering the distance
between the last axle and rear bumper, but still many of these errors would persist.
Returning to the classifier's decision tree with this mechanism in mind, PV pulling trailers should
be classified as PV (based on the first axle-spacing) regardless of how many axles they may have, while
SUT pulling trailers should be classified as MUT. This difference in handling vehicles with trailers
caused some of the short axle-spacing errors to impact vehicles classified as MUT in the ground truth
data. Reviewing the SUT pulling trailers, we found nine axle-class 5 vehicles pulling trailers (thus,
making them class 8 or 9, depending on the number of trailer axles); but because they had a short first
axle-spacing, the decision tree assigned these vehicles to class 3 in the pvr data.
Case “c”: Errors from buses
The classifier's decision tree assumes two-axle buses have a larger axle-spacing than two-axle
SUT. However, among the two-axle vehicle classes, the observed range of buses' axle-spacing overlaps
with that of class 5 SUT, giving rise to a problem similar to Case "b". In Table 2 there were six two-axle
buses with axle-spacing in the range for class 5 SUT, and four two-axle class 5 SUT with axle-spacing in
the range for class 4 buses. Thus, all 10 of these vehicles were misclassified. As with Case "b", the error

Kim and Coifman 13-0058
8
is unavoidable and all subsequent analysis of the classification data must accommodate this
disproportionately higher error rate.
On the other hand, the classifier's decision tree does not consider buses pulling trailers, so the
three such vehicles that passed were classified as if they were a SUT pulling a trailer (class 8). However,
it is possible to catch some of these errors by explicitly looking for buses pulling trailers, as will be
illustrated shortly.
Case “d”: Axle classification station reports incorrect number of axles
There are 17 vehicles in Table 2 that had fewer axles in the pvr data than observed in the ground
truth, denoted with superscript "d". It appears that the classification station missed one or more axles on
each of these vehicles. Upon inspection, all of these vehicles were straddling the edge of the lane as they
passed the station, either changing lanes or traveling partially in the shoulder. Fortunately, none of these
misclassified vehicles were double counted in the adjacent lane. This type of error cannot be easily
identified from the axle classification station data, but fortunately the frequency is low. While the I-270
dataset in Table 2 only shows errors due to missing axles, the I-70 dataset also exhibits errors due to
overcounting the axles (see [13] for details), where we believe the piezoelectric sensors extended slightly
into the adjacent lane and would occasionally detect axles from the wrong lane. In any event, the Case "d"
errors appear to be due to sensing faults, not the classifier.
Case “e”: Errors from axle-‐class 7
Table 2 shows several axle-class 7 vehicles that were misclassified as MUT. The decision tree
used at this station implicitly assumed axle-class 7 vehicles had exactly four axles, while the conventional
definition is for SUT with four or more axles. So the 23 class 7 trucks with more than four axles were
counted as MUT (class 9 or 10, depending on the number of axles). As will be illustrated, an added step
in the decision tree can catch most of these vehicles, since an axle-class 7 vehicle with more than four
axles typically will have much shorter axle-spacings than a MUT with the same number of axles.
Case “f”: Errors from vehicles pulling trailers
Like Cases "b" and "c", the axle-spacings for vehicles pulling trailers overlap. There were three
axle-class 3 vehicles with trailers long enough to look like trucks (class 7 and 8). While there were four
MUT with small enough axle-spacings that they looked like SUT. Like Cases “c” and "e", it is possible to
prevent some of these errors, as will be discussed shortly.

Kim and Coifman 13-0058
9
3.2. Consolidating Axle Classifications by Vehicle Type
At a more coarse level, the three shaded regions in Table 2 contain vehicles that were assigned
the correct vehicle type: PV (class 1-3), SUT (class 4-7), or MUT (class 8-13). The off-diagonal cells
within these shaded regions represent less severe errors, since the miss-classified vehicles were still
assigned the correct vehicle type. These intra-type errors represent 9.7% of the total misclassifications in
the table. Using the three vehicle types, the top third of Table 3 reiterates the performance from the I-270
station at the coarser granularity and the off diagonal cells retain all 167 of the inter-type
misclassifications. The bottom right cell for I-270 shows the overall performance across all three vehicle
types. The lower two thirds of Table 3 repeat this exercise for I-70 and SR-33. Note that although all three
sets had over 97% success rate, the number of SUT that were correctly classified (i.e., by row) is on the
order of 60%.
3.3. Length-‐Based Vehicle classification
Length-based vehicle classification uses less information than axle-based classification to sort
vehicles into classes. Due to the lower fidelity available from the length measurements, most length-based
classification schemes only sort vehicles by type, e.g., length-class 1: PV, length-class 2: SUT (including
buses), or length-class 3: MUT. As mentioned above, all three test-sites also report length-based
classification in the pvr data. After looking at the distribution of vehicle lengths at the I-270 site, the
classifier used 20.5 ft and 40.5 ft of physical vehicle length as the upper boundary for PV and SUT,
respectively. In the absence of detector errors, this resolution is comparable to the consolidated axle
classes shown in Table 3. We use the vehicle types to indirectly evaluate the length-based classifications.
To this end, using the 8,049 vehicle records with ground truth axle-classes at the I-270 site, the ground
truth axle-classes are clustered into type (as was done in Table 3) and then each length-based
classification is compared with the corresponding ground truth type in the top third of Table 4. Overall,
the length-based classification is 97% accurate on I-270. Compared to Table 3, now there are very few
true SUT that are misclassified (91% of the SUT are correctly classified- by row), but there are many PV
that are classified as SUT (only 69% of the vehicles classified as SUT are actually SUT- by column). This
result reflects the fact that the threshold between the two classes is lower in Table 4 than in Table 3.
Reviewing the vehicles with errors, the majority of the PV classified as SUT were pulling trailers (67 of
118). Ideally, the threshold would balance over-counting with under-counting, but that is impossible to do
with a constant threshold since the optimal threshold also depends on the relative flow of SUT.
Figure 2 explicitly shows the trade-off from the axle-spacing boundary and vehicle length
boundary between PV and SUT for the two-axle vehicles. The two-axle vehicles are sorted based on the

Kim and Coifman 13-0058
10
ground truth classification. Compared to the axle-spacing, discussed in Section 3.1, there are some PV
above the vehicle length boundary and some SUT below it. Figure 2(c) shows PV and SUT together, and
a dark colored square highlights a SUT assigned to a PV axle-class in the pvr. It is impossible to choose a
threshold on either dimension that would be error free, in each case the PV and SUT ranges overlap.
Furthermore, the axle-spacing and vehicle length exhibit correlation. This blurring means that one cannot
blindly use an axle classification station to calibrate the boundary between PV and SUT for length-based
classification stations, otherwise, the unavoidable errors in the axle classification will be amplified in the
length-based classification scheme.
4. Improving the Axle-Based Classification Decision Tree Although axle classification was correct over 97% of the time, we observed systematic
misclassification errors categorized by the six types discussed in Section 3.1, and summarized as follows
for the I-270 dataset:
1: Unavoidable misclassifications (case “b”, case “c”, case “d”, case “f”) 68%
2: Misclassifications due to class 7 with 5 or more axles (case “e”) 12%
3: Misclassifications caused by decision tree (case “c”, case “f”) 5%
4: Misclassifications due to gaps between two classes (case “a”) 15%
Since the majority of misclassifications (68%) are unavoidable due to an overlapping range of axle-
spacing among classes (case “b”, “c”, and “f”) or the detector reporting the incorrect number of axles
(case “d”), this section addresses the remaining misclassifications (32%) by recalibrating the 20 step
ODOT decision tree and adding new steps to it, yielding the 37 steps in Table 5. This recalibration is done
using only the I-70 dataset and then we evaluate the performance using the I-270 dataset.
First, we address case "a" by closing the gaps between classes, add an explicit definition for class
13, and create a 14th bin for unclassifiable vehicles. Secondly, to address the case "e" misclassifications
we add several new steps to classify class 7 vehicles with 5 or more axles. A typical class 7 with 5+ axles
has 4+ closely spaced rear axles. This cluster of so many axles is unique among the observed vehicles and
can be used for identifying class 7 vehicles with 5+ axles. The five-axle, class 7 vehicles' axle-spacing
distributions show that S2 and S3 fall between 1 and 6 ft (where Sn denotes the n-th axle-spacing), while S4
has a longer upper bound of 13.1 ft. When there are more than five axles the final axle-spacing range is
similar to S4 in a five-axle, class 7 vehicle, while the preceding spacings are similar to S2 and S3.
Next, we looked at all of the case "c" and "f" misclassifications in the I-70 dataset, and then
progressively updated the decision tree by adding steps, reordering steps, and changing boundaries to

Kim and Coifman 13-0058
11
eliminate most of these errors at I-70. For example, the ODOT classifier tends to misclassify class 7
vehicles with four axles as class 8 because the original decision tree checked for class 8 vehicles first and
used too liberal boundaries. In the revised tree, we check for four axle class 7 vehicles before checking for
class 8, and use more stringent criteria for both classes. If any change increased the number of
misclassifications in the I-70 dataset, we kept the original conditions from the ODOT classifier.
Although the range of length classes for two adjacent vehicle types tend to overlap (especially PV
and SUT, e.g., Figure 2), we found that when combined with the axle-spacings, vehicle length can help
differentiate between SUT and MUT. We explicitly incorporate length class when segmenting three-axle
class 6 vehicles from class 4 and 8 vehicles. We believe length class could also help segment axle-class 7
vehicles from MUT with the same number of axles; however, we did not observe enough vehicles in these
classes to develop the threshold for vehicles with more than three axles.
Table 5 shows the resulting decision tree based on the I-70 dataset, after accounting for all of the
above adjustments. Note that this tree uses length class to select the three-axle class 6 vehicles, which
catches five errors in the development dataset on I-70 that would occur if using axle-spacing alone. The
vehicle length test caught one more such error in the evaluation dataset after applying the decision tree to
I-270, discussed in the next section. Aside from these six errors, the performance will not change if the
length criterion is removed.
Due to the relatively small number of observations and larger variability in axle-spacing, there are
many SUT and MUT axle classes that would likely benefit from further data collection and decision tree
refinement. Finally, note that this decision tree was tuned to the vehicles on central Ohio freeways.
Obviously the decision tree would need further refinement if other axle configurations were present, but
the process of calibrating the decision tree is completely transferrable and many of the specific
improvements should also transfer to other states.
4.1. Evaluating the New Classifier
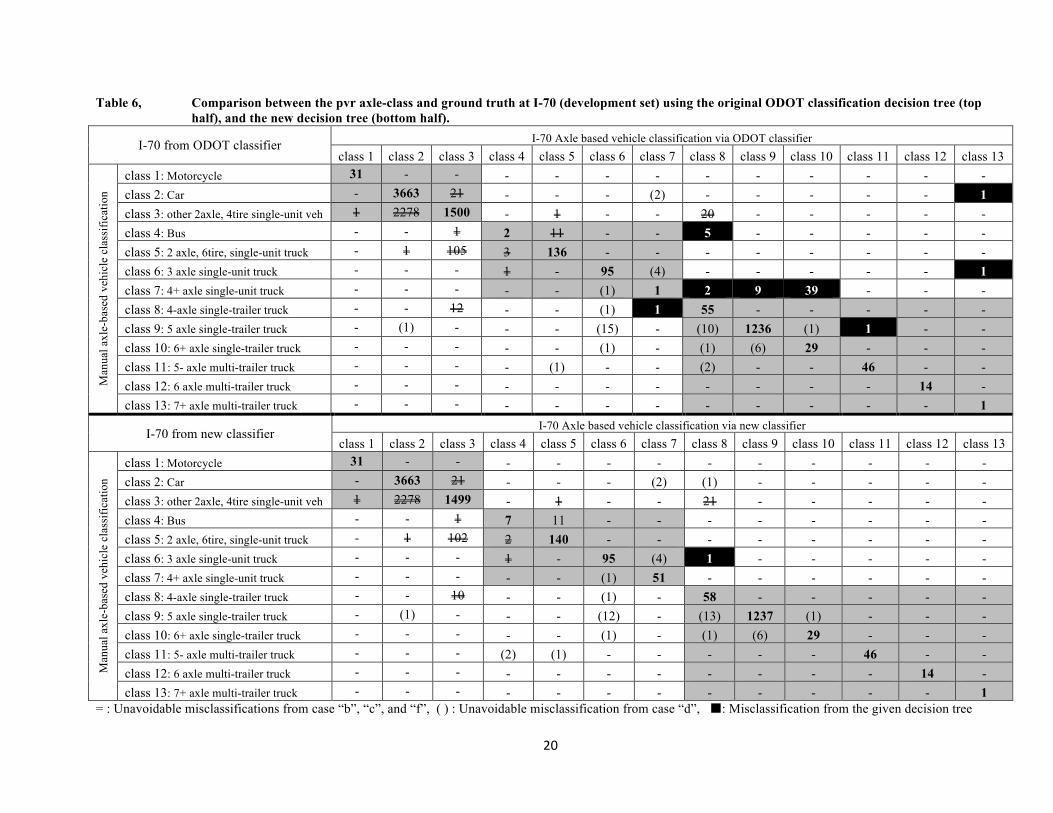
To evaluate the performance of the new classifier, we repeat the analysis from Table 2,
comparing the classifier results against the ground truth vehicle class. We apply the new decision tree first
to the development dataset, lower half of Table 6, and then the evaluation dataset, lower half of Table 7.
For reference, the top half of each table shows the results from the original ODOT decision tree. In each
table the numbers with a double strikethrough are unavoidable due to errors from overlapping ranges of
axle-spacing (case “b”, “c”, and “f”) and the numbers in parentheses are also unavoidable, due to the
sensors reporting an incorrect number of axles (case “d”). Comparing top and bottom halves of Table 6,
excluding the errors between PV classes, on I-70 there are 201 unavoidable errors due to case “b”, “c”,
“d” or “f” from the ODOT classifier and 197 from the new classifier. The small difference in unavoidable

Kim and Coifman 13-0058
12
errors is simply noise, due to slight changes in the boundaries (e.g., if the axle-spacing boundary in Figure
6(c) moves slightly, the observed net error rate might change but there is little room for the expected net
error rate to improve). The numbers in the black cells are potentially avoidable misclassifications that
arise from the given classification decision tree. There are 59 such misclassifications in the top half of
Table 6 due to the ODOT classifier but only 1 in the lower half of Table 6 from the new classifier.
Repeating this comparison in the evaluation dataset on I-270, Table 7, we observe similar trends
both in terms of unavoidable and avoidable misclassifications. The most noticeable difference from the
development dataset is the larger number of two-axle vehicles that were assigned class 13 by the ODOT
classifier. In both the development dataset and evaluation dataset the new classifier greatly reduced the
number of avoidable misclassifications errors. Upon further inspection, it turns out that the remaining
misclassifications in the black cells in the lower halves of Table 6 and 7 are due to axle configurations
that are not typical of the given class.
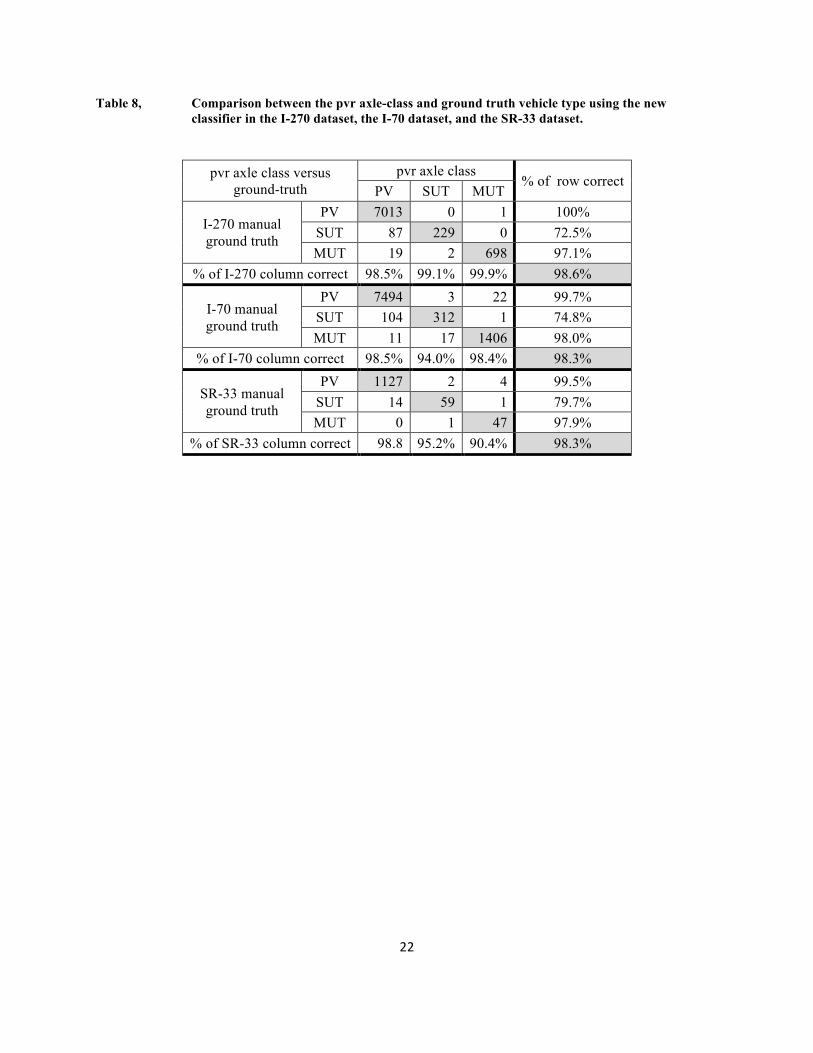
Table 8 summarizes the performance of the new classifier at the coarser granularity of vehicle
type. Compared to Table 3, at this resolution one can see improvement up to 20% in the number of SUT
that were correctly classified (row average). Since many of the now correctly classified SUT were
erroneously classified as MUT by the ODOT classifier, the percent of MUT classifications that are correct
(column average) also improved by 4%-20%. While the new decision classifier provided reproducible
improvements across multiple stations in Ohio, since the legal vehicle configurations differ from state to
state, the specific thresholds used in Table 5 might not be transferrable to every state. However, the
underlying problems discussed herein are likely common to most operating agencies, e.g., gaps between
bins with the same number of axles, omitting feasible axle configurations for a given class, or simply
using care to sequence the steps in the optimal order. This paper highlights the importance of evaluating
performance at the pvr level. In the short term an operating agency could collect concurrent video and pvr
data, focusing only on the less common classes or suspect vehicles. In the longer term, our group is
preparing a paper discussing our tools to eliminate most of the manual labor necessary for the current
study by deploying a portable non-intrusive vehicle classification system, e.g., [2], concurrent with the
classification station being evaluated. A human only examines the outcomes when the two classification
systems disagree.
5. Conclusions Vehicle classification stations are commonly used to sort vehicles into various classes based on
observable features. Evaluating the pvr data as we do in this work is uncommon; both due to the inherent
difficulty generating ground truth data, and the fact that normally the pvr classifications are binned by
fixed time periods at which point the individual vehicle information is discarded. However, such

Kim and Coifman 13-0058
13
conventional aggregation allows errors to cancel one another, which can obscure underlying problems.
This study evaluated three permanent axle classification stations against concurrent video based ground
truth in terms of axle-based and length-based classification. Only 3%-4% of the vehicles were
misclassified, however, the relative impacts were much larger on the trucks, e.g., only 60% of the SUT
were correctly classified as SUT by the existing axle classifier.
Diagnosing the axle classification errors, it was found that all of them could be attributed to one
of six causes. About a third of the errors among class 4-13 can be easily fixed by redefining the decision
tree, e.g., ensuring that there are no gaps between successive classes and adding an additional outcome
from the tree to indicate a vehicle is unclassifiable. After making these changes, the classifier was able to
correctly classify an additional 10% of the SUT, with smaller improvements in almost every other metric.
One chronic error found in this research is intrinsic to the vehicle fleet and may be impossible to
correct with the existing sensors; namely, the shorter, SUT have a length range and axle-spacing range
that overlaps with PV. Depending on the calibration, the error may be manifest as SUT counted as PV or
vice versa. As discussed in the literature review, this PV/SUT blurring appears to impact other sensors as
well. In any case, one should expect such errors at most classification stations. All subsequent uses of the
classification data (e.g., planning and measuring freight flows) must accommodate this unavoidable
blurring of SUT with PV. The blurring also means that one cannot blindly use an axle classification
station to calibrate the boundary between PV and SUT for length-based classification stations, otherwise,
the unavoidable errors in the axle classification will be amplified in the length-based classification
scheme.
6. Acknowlegements This material is based upon work supported in part by NEXTRANS the USDOT Region V
Regional University Transportation Center, The Ohio Transportation Consortium University
Transportation Center, and the Ohio Department of Transportation. The contents of this report reflect the
views of the authors who are responsible for the facts and the accuracy of the data presented herein. The
contents do not necessarily reflect the official views or policies of the Ohio Department of Transportation
or the Federal Highway Administration. This report does not constitute a standard, specification or
regulation.
We are particularly grateful for the assistance and input from David Gardner and Linsdey Pflum
at the Ohio Department of Transportation.
Kim and Coifman 13-0058
14
7. References [1] Federal Highway Administration. Traffic monitoring guide, USDOT, Office of Highway Policy
Information, FHWA-PL-01-021, 2001.
[2] Lee, H., Coifman, B. "Side-Fire LIDAR Based Vehicle Classification." Transportation Research
Record 2308, 2012, pp 173-183.
[3] Coifman, B., Kim, S. "Speed Estimation and Length Based Vehicle Classification from Freeway
Single Loop Detectors," Transportation Research Part-C, Vol 17, No 4, 2009, pp 349-364.
[4] Kotzenmacher, J., Minge, E., Hao, B., Evaluation of Portable Non-Intrusive Traffic Detection
System, Minnesota Department of Transportation, 2005, MN-RC-2005-37.
[5] Zwahlen, H. T., Russ, A., Oner, E. and M. Parthasarathy, "Evaluation of Microwave Radar Trailers
for Non-intrusive Traffic Measurements." Transportation Research Record 1917, 2005, pp 127-
140.
[6] French, J., French, M., Traffic Data Collection Methodologies, Pennsylvania Department of
Transportation, Contract 04-02 (C19), 2006.
[7] Yu, X., Prevedouros, P., Sulijoadikusumo, G., "Evaluation of Autoscope, SmartSensor HD, and
Infra-Red Traffic Logger for Vehicle Classification," Transportation Research Record 2160, 2010,
pp 77–86.
[8] Banks, J., Evaluation of Portable Automated Data Collection Technologies: Final Report,
California PATH Research Report, 2008, UCB-ITSPRR-2008-15.
[9] Minge, E., Evaluation of Non-Intrusive Technologies for Traffic Detection, Minnesota Department
of Transportation, 2010, Final Report #2010-36.
[10] Schwach, J., Morris, T., Michalopoulos, P., Rapidly Deployable Low-Cost Traffic Data and Video
Collection Device, Center for Transportation Studies, University of Minnesota, 2009, CTS 09-21.
[11] Coifman, B. "Vehicle Reidentification and Travel Time Measurement in Real-Time on Freeways
Using the Existing Loop Detector Infrastructure", Transportation Research Record 1643,
Transportation Research Board, 1998, pp 181-191.
[12] Coifman, B., Vehicle Classification from Single Loop Detectors, Project 05-02, Midwest Regional
University Transportation Center, University of Wisconsin, Madison, 2007.
[13] Coifman, B., Lee, H., Kim, S., Validating the Performance of Vehicle Classification Stations, Ohio
Department of Transportation, 2012.

Kim and Coifman 13-0058
15
List of Table Captions
Table 1, Summary statistics of ground truth datasets.
Table 2, Comparison between pvr and ground truth axle-class in the I-270 dataset.
Table 3, Comparison between the pvr axle-class and ground truth vehicle type in the I-270 dataset, the I-70 dataset, and the SR-33 dataset.
Table 4, Comparison between the pvr length-class and ground truth vehicle type in the I-270 dataset, the I-70 dataset, and the SR-33 dataset.
Table 5, New axle classification decision tree, developed from the I-70 dataset ground truth. For each vehicle, the classifier will progress downward through the table until the vehicle first satisfies one condition, at which point the classifier stops and assigns that class to the vehicle.
Table 6, Comparison between the pvr axle-class and ground truth at I-70 (development set) using the original ODOT classification decision tree (top half), and the new decision tree (bottom half).
Table 7, Comparison between the pvr axle-class and ground truth at I-270 (evaluation set) using the original ODOT classification decision tree (top half), and the new decision tree (bottom half).
Table 8, Comparison between the pvr axle-class and ground truth vehicle type using the new classifier in the I-270 dataset, the I-70 dataset, and the SR-33 dataset.

Kim and Coifman 13-0058
16
List of Figure Captions
Figure 1, (a) Location of the axle classification stations used in this study, around the Columbus, Ohio, metropolitan area, (b) schematic of a typical axle classification station.
Figure 2, Length versus axle spacing of two-axle vehicles at the I-270 station (a) all PV, (b) all SUT, (c) all PV and SUT combined, highlighting the SUT-axle misclassified as PV by the axle boundary.
15
Table 1, Summary statistics of ground truth datasets.
Location Axle stations
Southbound I-270 at Rings Rd.
Eastbound I-70 at Brice Rd.
Northbound SR 33
Date Nov 2, 2010 June 20, 2006 Aug 3, 2011 Traffic Conditions Free flow Free flow Free flow
Time duration investigated 9:27~12:33 10:12~13:59 13:28~14:34
Average Speed 64 mph 65 mph 64 mph Number of lanes 3 3 2
Average Flow (per lane) 873 vph 859 vph 627 vph # of vehicles 8,079 9,746 1,255
# of occluded vehicles 30 377 0 Resolution of ground-truth PV or axle class 4-13 axle class 1-13 PV, SUT, MUT
.
16
Table 2, Comparison between pvr and ground truth axle-class in the I-270 dataset.
Axle classification station in I270 ODOT Axle-based vehicle classification class 1 class 2 class 3 class 4 class 5 class 6 class 7 class 8 class 9 class 10 class 11 class 12 class 13
Man
ual a
xle-
base
d ve
hicl
e cl
assi
ficat
ion
class 1: Motorcycle - 5881 1104
- - - - - - - - - -
class 2: Car - - - - - - - - - 26a
class 3: other 2axle, 4tire single-unit veh - - - 1f 2f - - - - -
class 4: Bus - - - 1 6c - - 3c - - - - -
class 5: 2 axle, 6tire, single-unit truck - 6b 81b 4c 111 - - - - - - - -
class 6: 3 axle single-unit truck - - - - - 71 - - - - - - -
class 7: 4+ axle single-unit truck - - - - - 1d 9 - 2e 21e - - -
class 8: 4-axle single-trailer truck - - 8b 1c - - 4f 29 - - - - 1a
class 9: 5 axle single-trailer truck - 8d 1b - - - - 4d 616 - - - -
class 10: 6+ axle single-trailer truck - 2d - - - - - 1d - 13 - - 1a
class 11: 5- axle multi-trailer truck - 1d - - - - - - - - 20 - -
class 12: 6 axle multi-trailer truck - - - - - - - - - - - 8 -
class 13: 7+ axle multi-trailer truck - - - - - - - - - - - - 1
Unclassifiable or occluded vehicle 2 - - - 3 4 1 3 14 2 1 - - Non-vehicle actuation - - - - - - - - - - - - - a: Axle spacing falling between two axle spacing bins b: Two-axle SUT with short axle spacing c: Errors from buses d: Axle classification station reports incorrect number of axles e: Errors from class 7 f: Errors from vehicles pulling trailers

17
Table 3, Comparison between the pvr axle-class and ground truth vehicle type in the I-270 dataset, the I-70 dataset, and the SR-33 dataset.
pvr axle class versus ground-truth
pvr axle class % of row correct
PV SUT MUT
I-270 manual ground truth
PV 6985 1 28 99.6% SUT 87 203 26 64.2% MUT 20 5 694 96.5%
% of I-270 column correct 98.5% 97.1% 92.8% 97.9%
I-70 manual ground truth
PV 7494 3 21 99.7% SUT 107 255 56 61.0% MUT 13 18 1402 97.8%
% of I-70 column correct 98.4% 92.4% 94.8% 97.7%
SR-33 manual ground truth
PV 1127 2 4 99.5% SUT 14 44 16 59.5% MUT 0 1 47 97.9%
% of SR-33 column correct 98.8% 93.6% 70.1% 97.1%

18
Table 4, Comparison between the pvr length-class and ground truth vehicle type in the I-270 dataset, the I-70 dataset, and the SR-33 dataset.
pvr length versus ground-truth
pvr length class % of row correct
PV SUT MUT
I-270 manual ground truth
PV 6867 118 29 97.9% SUT 26 286 4 90.5% MUT 0 11 708 98.5%
% of I-270 column correct 99.6% 68.9% 95.5% 97.7%
I-70 manual ground truth
PV 7397 82 39 98.4% SUT 148 262 8 62.7% MUT 10 20 1403 97.9%
% of I-70 column correct 97.9% 72.0% 96.8% 96.7%
SR-33 manual ground truth
PV 1117 14 2 98.6% SUT 19 54 1 73.0% MUT 1 3 44 91.7%
% of SR-33 column correct 98.2% 76.1% 93.6% 96.8%

19
Table 5, New axle classification decision tree, developed from the I-70 dataset ground truth. For each vehicle, the classifier will progress downward through the table until the vehicle first satisfies one condition, at which point the classifier stops and assigns that class to the vehicle.
# of axles Class Class name Length Axle Spacing (ft) Index
2 1 Motorcycle 1~5.9 M 2 2 Car 5.9~10.3 M 2 3 other 2axle, 4tire, single-unit
veh.
10.3~15 2 5 2 axle, 6tire, single-unit truck 15~24 M 2 4 Bus 23.5~99.9 3 6 3 axle single unit truck 0~40.5ft any, 3.5~8 R 3 1 Motorcycle 1~5.9, any M 3 2 Car 5.9~10.3, 10~18.8 M 3 3 other 2axle, 4tire, single-unit
veh.
10.3~15, 10~18.8 3 4 Bus 23.5~99.9, any 3 8 4 or fewer axle single-trailer
truck
any, any M 4 7 4 or more axle single-unit truck any, 1~6, 1~13.1 M, R 4 8 4 or fewer axle single-trailer
truck
any, any, 3.5~8 M, R 4 8 4 or fewer axle single-trailer
truck
any, 3.5~8, any M, R 4 2 Class 2 pulling a trailer 1~10.3, any, any M 4 3 Class 3 pulling a trailer 10.3~15, any, any M 4 4 Bus pulling a trailer 23.5~99.9, any, any A 4 4 Bus pulling a car any, 17~99.9, 5.9~99.9 A 4 8 4 or fewer axle single-trailer
truck
any, any, any A 5 7 4 or more axle single-unit truck any, 1~6, 1~6, 1~13.1 A 5 11 5 or fewer axle multi-trailer
truck
any, 17~99.9, any, 6~99.9 M, R 5 9 5 axle single-trailer truck any, 17~99.9, any, 3.5~11 A 5 9 5 axle single-trailer truck any, 3.5~11, any, 3.5~11 M, R 5 2 Class 2 pulling a trailer 1~10.3, any, 1~3.5, 1~3.5 M 5 3 Class 3 pulling a trailer 10.3~15, any, 1~3.5, 1~3.5 5 9 5 axle single-trailer truck any, any, any, any A 6 7 4 or more axle single-unit truck any, 1~6, 1~6, 1~6, 1~13.1 A 6 10 6 or more axle single-trailer
truck
any, 1~8, 1~8, any, 8~99.9 M 6 12 6 axle multi-trailer truck any, any, any, any, 8~99.9 6 10 6 or more axle single-trailer
truck
any, any, any, any, 1~8 M 7 7 4 or more axle single-unit truck any, any, 1~6, any, any A 7 10 6 or more axle single-trailer
truck
any, any, any, 1~8, 1~8 M 7 13 7 or more axle multi-trailer
truck
any, any, any, any, any, any A 8 10 6 or more axle single-trailer
truck
any, 1~8, 1~8, any, 1~8, 1~8, 1~8 A 8 13 7 or more axle multi-trailer
truck
any, any, any, any, any, any, any A 9+ 13 7 or more axle multi-trailer
truck
any, any, any, any, any, any, any, any A 2+ 14 Unclassified vehicle others A
M: Modified step from ODOT decision tree (changes are highlighted with bold text) R: Reordered step from ODOT decision tree A: Newly added step
20
Table 6, Comparison between the pvr axle-class and ground truth at I-70 (development set) using the original ODOT classification decision tree (top half), and the new decision tree (bottom half).
I-70 from ODOT classifier I-70 Axle based vehicle classification via ODOT classifier class 1 class 2 class 3 class 4 class 5 class 6 class 7 class 8 class 9 class 10 class 11 class 12 class 13
Man
ual a
xle-
base
d ve
hicl
e cl
assi
ficat
ion
class 1: Motorcycle 31 - - - - - - - - - - - - class 2: Car - 3663 21 - - - (2) - - - - - 1 class 3: other 2axle, 4tire single-unit veh 1 2278 1500 - 1 - - 20 - - - - - class 4: Bus - - 1 2 11 - - 5 - - - - - class 5: 2 axle, 6tire, single-unit truck - 1 105 3 136 - - - - - - - - class 6: 3 axle single-unit truck - - - 1 - 95 (4) - - - - - 1 class 7: 4+ axle single-unit truck - - - - - (1) 1 2 9 39 - - - class 8: 4-axle single-trailer truck - - 12 - - (1) 1 55 - - - - - class 9: 5 axle single-trailer truck - (1) - - - (15) - (10) 1236 (1) 1 - - class 10: 6+ axle single-trailer truck - - - - - (1) - (1) (6) 29 - - - class 11: 5- axle multi-trailer truck - - - - (1) - - (2) - - 46 - - class 12: 6 axle multi-trailer truck - - - - - - - - - - - 14 - class 13: 7+ axle multi-trailer truck - - - - - - - - - - - - 1
I-70 from new classifier I-70 Axle based vehicle classification via new classifier
class 1 class 2 class 3 class 4 class 5 class 6 class 7 class 8 class 9 class 10 class 11 class 12 class 13
Man
ual a
xle-
base
d ve
hicl
e cl
assi
ficat
ion
class 1: Motorcycle 31 - - - - - - - - - - - - class 2: Car - 3663 21 - - - (2) (1) - - - - - class 3: other 2axle, 4tire single-unit veh 1 2278 1499 - 1 - - 21 - - - - - class 4: Bus - - 1 7 11 - - - - - - - - class 5: 2 axle, 6tire, single-unit truck - 1 102 2 140 - - - - - - - - class 6: 3 axle single-unit truck - - - 1 - 95 (4) 1 - - - - - class 7: 4+ axle single-unit truck - - - - - (1) 51 - - - - - - class 8: 4-axle single-trailer truck - - 10 - - (1) - 58 - - - - - class 9: 5 axle single-trailer truck - (1) - - - (12) - (13) 1237 (1) - - - class 10: 6+ axle single-trailer truck - - - - - (1) - (1) (6) 29 - - - class 11: 5- axle multi-trailer truck - - - (2) (1) - - - - - 46 - - class 12: 6 axle multi-trailer truck - - - - - - - - - - - 14 - class 13: 7+ axle multi-trailer truck - - - - - - - - - - - - 1
= : Unavoidable misclassifications from case “b”, “c”, and “f”, ( ) : Unavoidable misclassification from case “d”, : Misclassification from the given decision tree

21
Table 7, Comparison between the pvr axle-class and ground truth at I-270 (evaluation set) using the original ODOT classification decision tree (top half), and the new decision tree (bottom half).
I-270 from ODOT classifier I-270 Axle based vehicle classification via ODOT classifier class 1 class 2 class 3 class 4 class 5 class 6 class 7 class 8 class 9 class 10 class 11 class 12 class 13
Man
ual a
xle-
base
d ve
hicl
e cl
assi
ficat
ion
class 1: Motorcycle - 5881 1104
- - - - - - - - - - class 2: Car - - - - - - - - - 26 class 3: other 2axle, 4tire single-unit veh - - - 1 2 - - - - - class 4: Bus - - - 1 6 - - 3 - - - - - class 5: 2 axle, 6tire, single-unit truck - 6 81 4 111 - - - - - - - - class 6: 3 axle single-unit truck - - - - - 71 - - - - - - - class 7: 4+ axle single-unit truck - - - - - (1) 9 - 2 21 - - - class 8: 4-axle single-trailer truck - - 8 1 - - 4 29 - - - - 1 class 9: 5 axle single-trailer truck - (8) 1 - - - - (4) 616 - - - - class 10: 6+ axle single-trailer truck - (2) - - - - - (1) - 13 - - 1 class 11: 5- axle multi-trailer truck - (1) - - - - - - - - 20 - - class 12: 6 axle multi-trailer truck - - - - - - - - - - - 8 - class 13: 7+ axle multi-trailer truck - - - - - - - - - - - - 1
I-270 from new classifier I-270 Axle based vehicle classification via new classifier
class 1 class 2 class 3 class 4 class 5 class 6 class 7 class 8 class 9 class 10 class 11 class 12 class 13
Man
ual a
xle-
base
d ve
hicl
e cl
assi
ficat
ion
class 1: Motorcycle - 5907 1106
- - - - - - - - - - class 2: Car - - - - - - - - - - class 3: other 2axle, 4tire single-unit veh - - - - 1 - - - - - class 4: Bus - - - 4 6 - - - - - - - - class 5: 2 axle, 6tire, single-unit truck - 6 81 4 111 - - - - - - - - class 6: 3 axle single-unit truck - - - - - 71 - - - - - - - class 7: 4+ axle single-unit truck - - - - - (1) 32 - - - - - - class 8: 4-axle single-trailer truck - - 8 1 1 - - - 33 - - - - - class 9: 5 axle single-trailer truck - (8) - - - - - (4) 617 - - - - class 10: 6+ axle single-trailer truck - (2) - - - - - (1) - 14 - - - class 11: 5- axle multi-trailer truck - (1) - - - - - - - - 20 - - class 12: 6 axle multi-trailer truck - - - - - - - - - - - 8 - class 13: 7+ axle multi-trailer truck - - - - - - - - - - - - 1
= : Unavoidable misclassifications from case “b”, “c”, and “f”, ( ) : Unavoidable misclassification from case “d”, : Misclassification from the given decision tree
22
Table 8, Comparison between the pvr axle-class and ground truth vehicle type using the new classifier in the I-270 dataset, the I-70 dataset, and the SR-33 dataset.
pvr axle class versus ground-truth
pvr axle class % of row correct
PV SUT MUT
I-270 manual ground truth
PV 7013 0 1 100% SUT 87 229 0 72.5% MUT 19 2 698 97.1%
% of I-270 column correct 98.5% 99.1% 99.9% 98.6%
I-70 manual ground truth
PV 7494 3 22 99.7% SUT 104 312 1 74.8% MUT 11 17 1406 98.0%
% of I-70 column correct 98.5% 94.0% 98.4% 98.3%
SR-33 manual ground truth
PV 1127 2 4 99.5% SUT 14 59 1 79.7% MUT 0 1 47 97.9%
% of SR-33 column correct 98.8 95.2% 90.4% 98.3%

23
Figure 1, (a) Location of the axle classification stations used in this study, around the Columbus, Ohio,
metropolitan area, (b) schematic of a typical axle classification station.
(a) (b)
Direction of travel
Lane 1
Lane 2
Lane 3
Piezoelectric sensor sensor Sensors
Dual loop detectors
I-71
I-71
I-70
I-270
N I270 station
I-70 Station
SR33 Station
I-70
I-270

24
Figure 2, Length versus axle spacing of two-axle vehicles at the I-270 station (a) all PV, (b) all SUT, (c) all PV and SUT combined, highlighting the SUT-axle misclassified as PV by the axle boundary.
(a) (b)
(c)