a (true) tale of two finance...
TRANSCRIPT
A (True) Tale of Two Finance Directors
Investing in Your WRRF’s Energy Neutral Future

Who Are You?
Jeff Tucker Dir. of Admin. Services/
Chief Financial Officer
Napa Sanitation District

How do you view your wastewater treatment plant
manager?

Sewage Treatment Plant Publicly Owned Treatment Works
Wastewater Treatment Plant
Water Resources Recovery Facility
What is a WRRF, exactly?
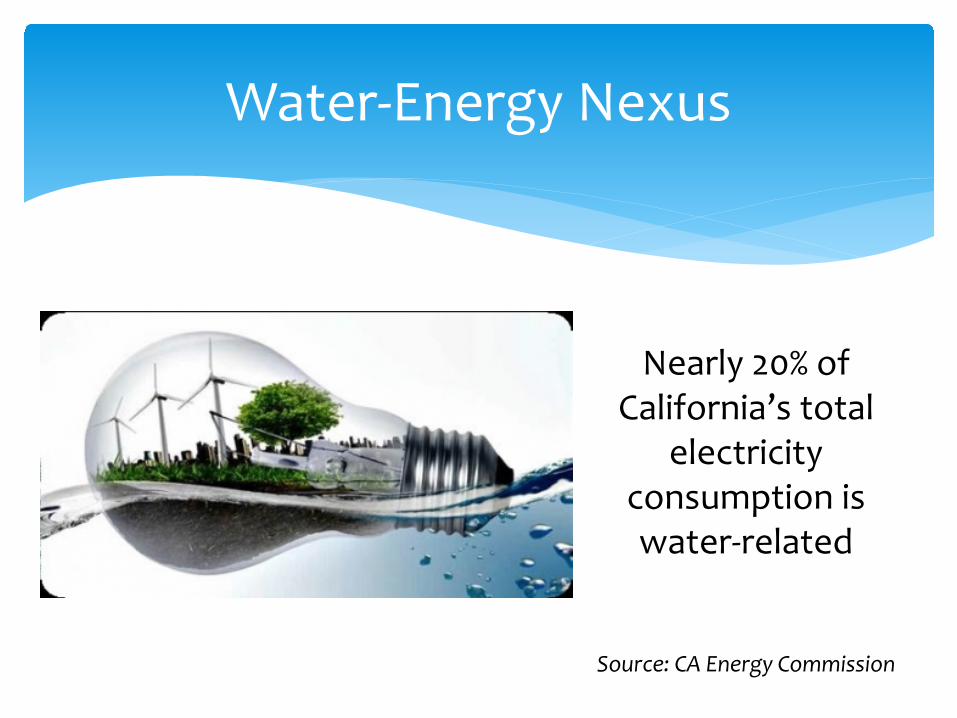
Water-Energy Nexus
Nearly 20% of California’s total
electricity consumption is water-related
Source: CA Energy Commission
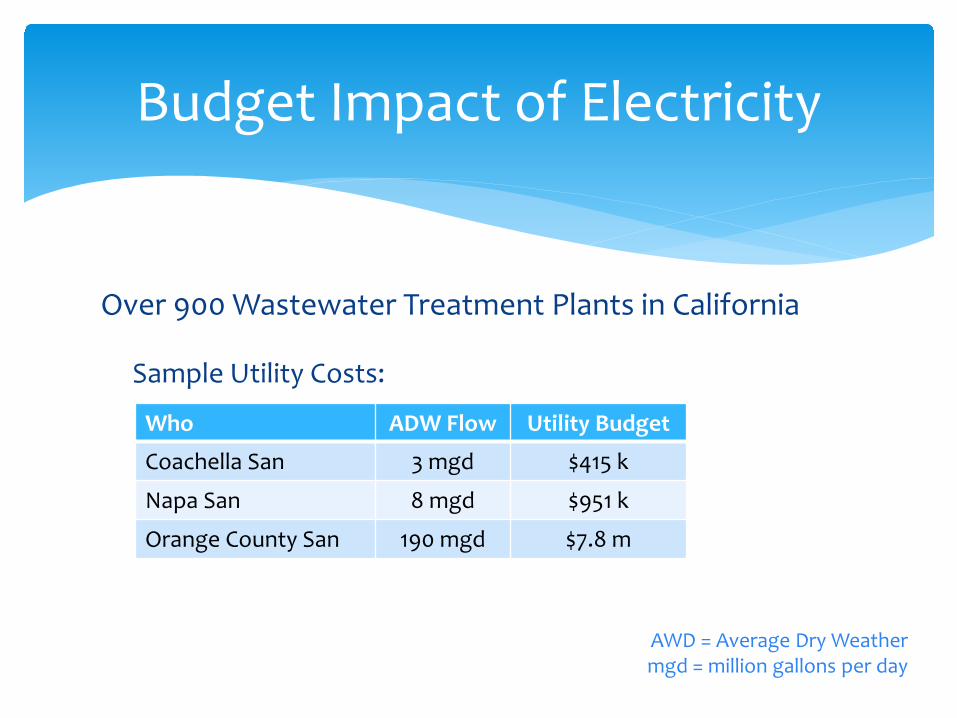
Over 900 Wastewater Treatment Plants in California
Sample Utility Costs:
Budget Impact of Electricity
Who ADW Flow Utility Budget
Coachella San 3 mgd $415 k
Napa San 8 mgd $951 k
Orange County San 190 mgd $7.8 m
AWD = Average Dry Weather mgd = million gallons per day
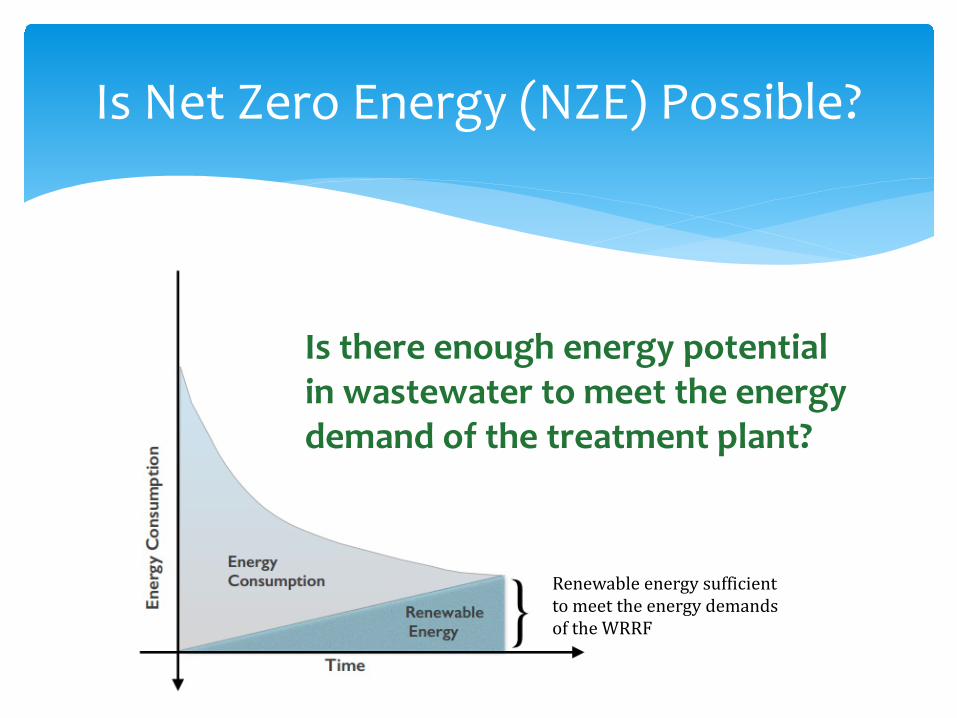
Is Net Zero Energy (NZE) Possible?
Is there enough energy potential in wastewater to meet the energy demand of the treatment plant?
Renewable energy sufficient to meet the energy demands of the WRRF

∗ Sankey energy diagrams for energy usage, by different plant process/design
∗ Evaluated impact of “Best Practices”
∗ Evaluated 18 different technologies/processes to minimize energy use or maximize energy potential
WERF – Water Environment
Research Foundation
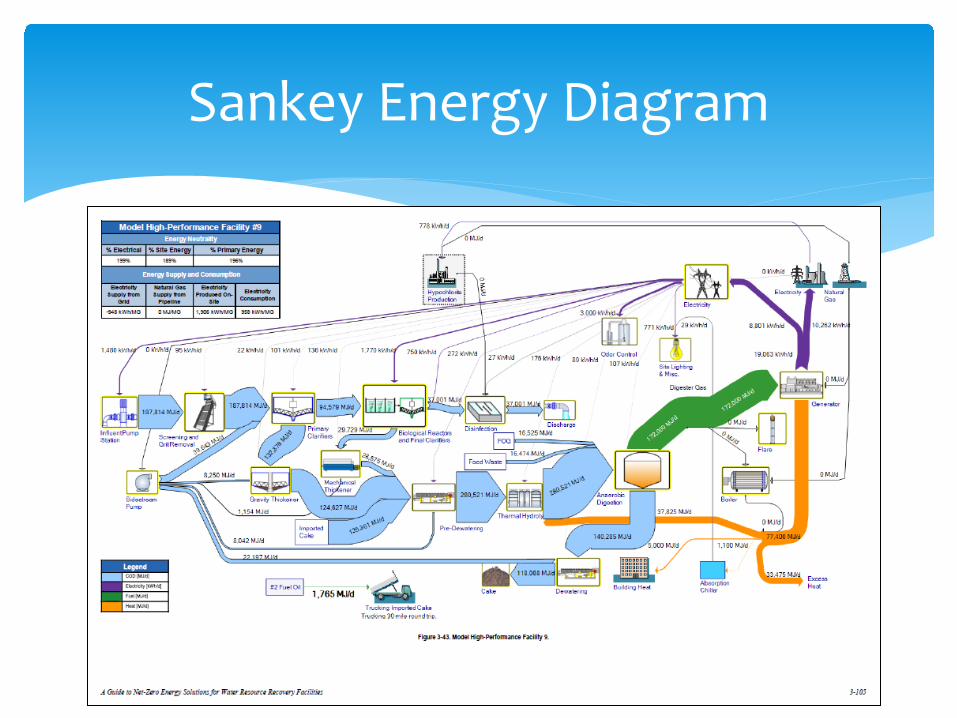
Sankey Energy Diagram

Most significant ways to become NZE: ∗ 40% Reduction – Best Practices
∗ Improved biosolids capture (e.g., CEPT) ∗ Reduced blower fowling
∗ 35% – Anaerobic Digestion with Combined Heat & Power About 15% of California WWTP have anaerobic digesters
∗ NZE – Co-digestion of high-strength waste (e.g., FOG)
Sankey Energy Diagrams

Fats, Oil & Grease (FOG)
∗ Tipping fee charged
∗ Methane from FOG
∗ Increased methane production from biosolids
FOG Receiving Station

FOG Receiving Station
$0
$100,000
$200,000
$300,000
$400,000
$500,000
$600,000
$700,000
$800,000
8/31
/201
210
/15/2
012
11/2
9/20
121/1
3/20
132/
27/2
013
4/13
/201
35/
28/2
013
7/12
/201
38/
26/2
013
10/10
/201
311
/24/
2013
1/8/2
014
2/22
/201
44/
8/20
145/
23/2
014
7/7/
2014
8/21
/201
410
/3/2
014
11/1
7/20
141/1
/201
52/
15/2
015
4/1/2
015
5/16
/201
56/
30/2
015
8/14
/201
59/
28/2
015
11/1
2/20
1512
/27/
2015
$620,000 Initial Investment 39-month ROI
Tipping Revenue
Savings Due to FOG Addition
Savings Due to FOG Enhancement
Project Cost
ROI based on electricity cost savings and tipping revenue.
Does not include reduced solids handling costs.
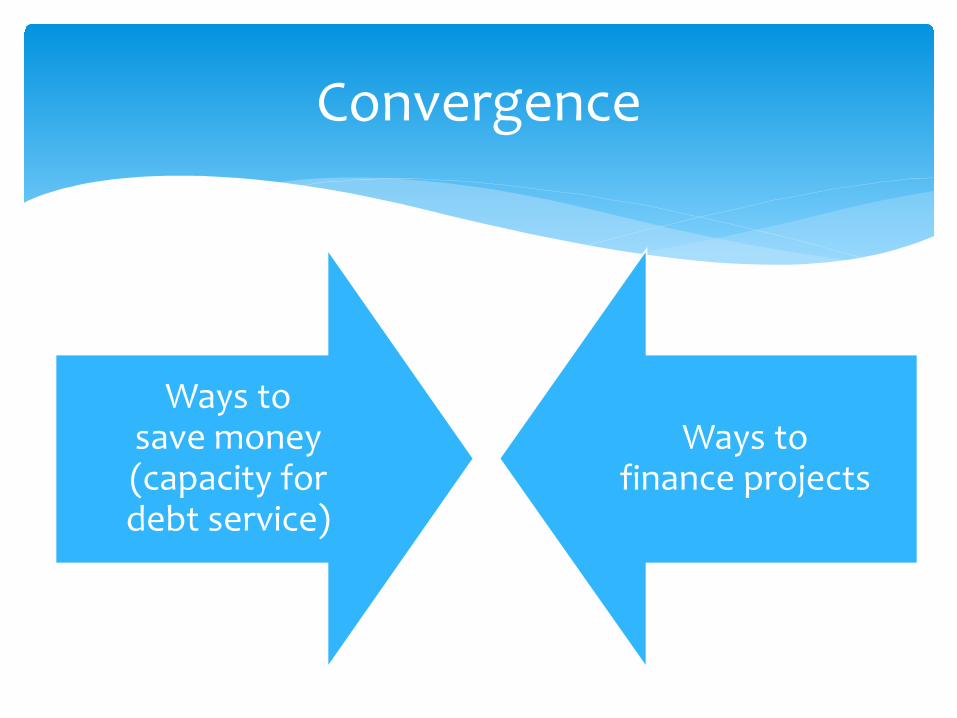
Convergence
Ways to save money (capacity for debt service)
Ways to finance projects

Traditional Methods - Bonds
∗ Muni Bonds
∗ Qualified Energy Conservation Bonds (QECBs)
∗ Clean Renewable Energy Bonds (CREBs)
How do we pay for it?
Traditional Methods - Loans
∗ State Revolving Fund (SRF) Loans
∗ Private Placement Loans or Capital Leases
How do we pay for it?

Alternative Methods
∗ Utility Financing / Incentives
∗ P3 (that really works!)
∗ Internal Financing
How do we pay for it?

Utility Financing / Incentives
∗ Self-Generation Incentive Program (SGIP) (Solar / Co-Generation / Waste Heat Capture)
∗ Local Government Renewable Energy Self-Generation Bill Credit Transfer Program (RES-BCT)
∗ Net Energy Metering (NEM)
How do we pay for it?
Utility Financing / Incentives
∗ On-Bill Financing ∗ Up to $1 million ∗ 10 years ∗ 0% interest
∗ Demand Response (“Load Shedding”)
How do we pay for it?
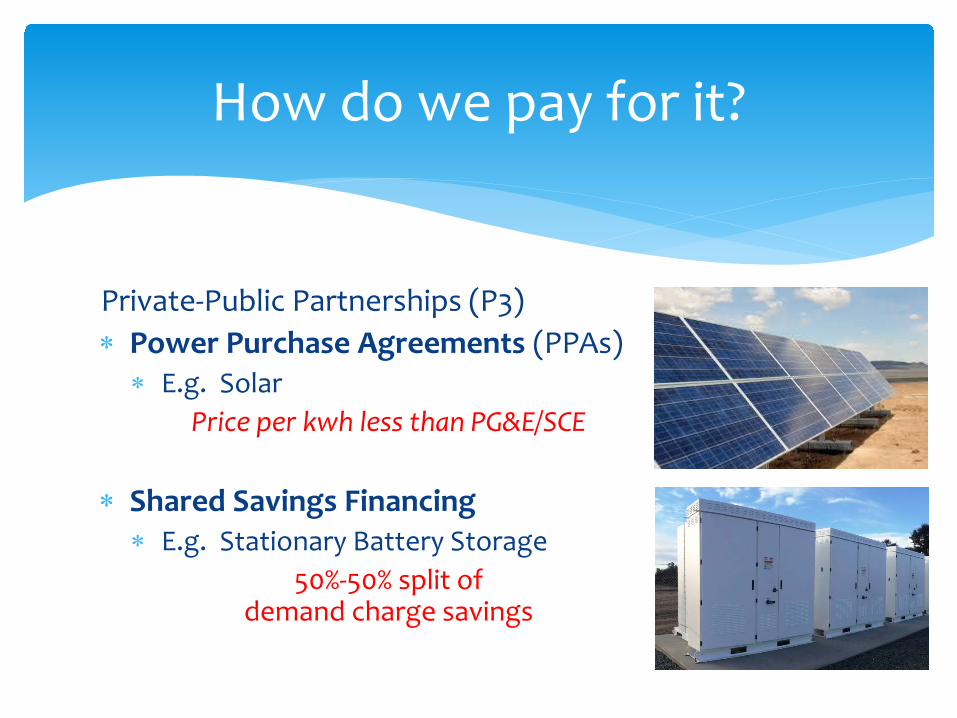
Private-Public Partnerships (P3) ∗ Power Purchase Agreements (PPAs) ∗ E.g. Solar
Price per kwh less than PG&E/SCE
∗ Shared Savings Financing ∗ E.g. Stationary Battery Storage
50%-50% split of demand charge savings
How do we pay for it?

Private-Public Partnerships (P3) ∗ Design / Build / Finance ∗ E.g. San Luis Obispo WRRF
How do we pay for it?
Team: AECOM – Design PG&E – Contractor Financing – SRF Loan Results: 25% Reduction in electricity usage Savings pay Debt Service
Project: Cogeneration Engine Headworks Tertiary Filters Dewatering VFDs Lighting Efficiency SCADA upgrade
Construction cost: $9.5m O&M Avoided Cost: $168k Energy savings: $157k
Internal Financing
How do we pay for it?

Internal Financing
∗ Change to Investment Policies
∗ Structure like Private Placement Bond (revenue pledges)
∗ Use of Financial Advisor
∗ Advantages: Risk Management, Yield
How do we pay for it?

Total Cost of Ownership – Example AB Diffuser Replacement
Energy Audit: Energy Savings (audit) $50,000/yr
Project: Cost ROI Diffuser Replacement $200,000 4.0 yrs Outside Engineering $25,000 4.5 yrs DO probes, new manifold $120,000 6.9 yrs Life expectancy: 6-8 years
Other Thoughts
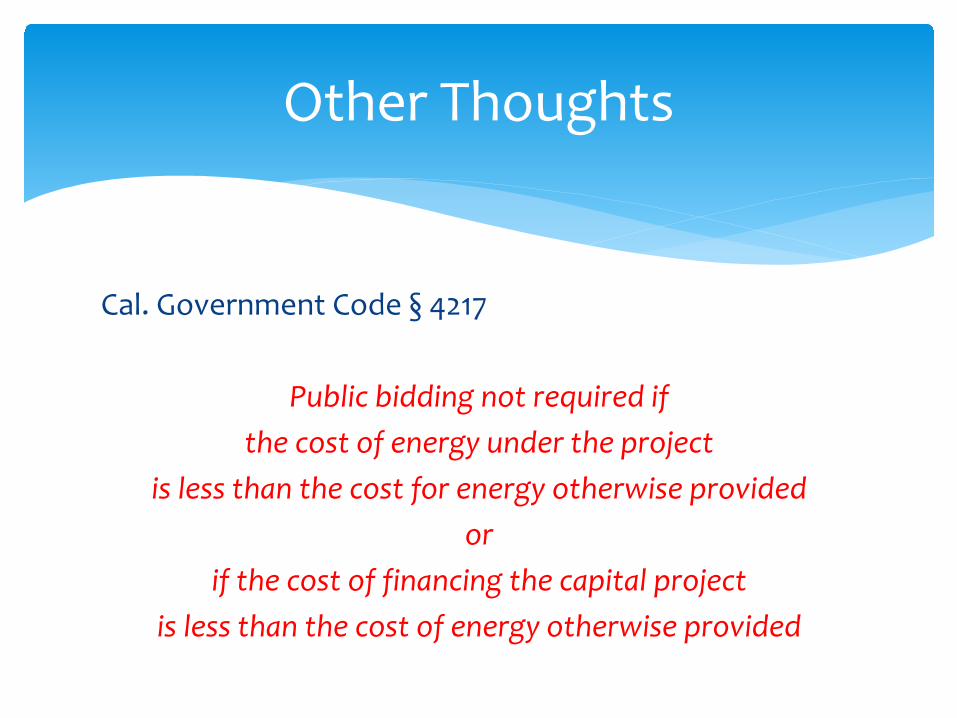
Cal. Government Code § 4217
Public bidding not required if the cost of energy under the project
is less than the cost for energy otherwise provided or
if the cost of financing the capital project is less than the cost of energy otherwise provided
Other Thoughts
Manage the Message with Board / City Council ∗ Expense vs. Investment ∗ Green Energy / Sustainability ∗ Lower Rates = Easier Rate /
Prop 218 Processes
Other Thoughts

Jeff Tucker Chief Finance Officer
Napa Sanitation District [email protected]
(707) 258-6012
Comments?