a tradition of quality since 1850 annual report...
TRANSCRIPT

A Tradition of Quality Since 1850
A N N U A L R E P O R T 2 0 0 6
■ ■ ■ ■ ■ ■

Matthews International Corporation, headquartered
in Pittsburgh, Pennsylvania, is a designer, manufacturer and
marketer principally of memorialization products and brand
solutions. Memorialization products consist primarily of bronze
memorials and other memorialization products, caskets and
cremation equipment for the cemetery and funeral home industries.
Brand solutions include graphics imaging products and services,
marking products, and merchandising solutions. The Company’s
products and services include cast bronze memorials and other
memorialization products; caskets; cast and etched architectural
products; cremation equipment and cremation-related products;
mausoleums; brand management, printing plates, pre-press
services and imaging services for the primary packaging and
corrugated industries; marking and coding equipment and
consumables, and industrial automation products for identifying,
tracking and conveying various consumer and industrial products,
components and packaging containers; and merchandising
display systems and marketing and design services.
Detailed financial information relating to business segments and to domestic
and international operations is presented in Note 15 (Segment Information)
to the Consolidated Financial Statements.
Matthews International ~ a Global Corporation
dedicated to creating value for our employees,
customers and shareholders.
On July 20, 2006, David M. Kelly, present Chairman
and past CEO of Matthews International Corporation,
presided over the NASDAQ Opening Bell to celebrate
12 years of Matthews being listed on the NASDAQ.
Shown in front of NASDAQ Headquarters are the
members of the Matthews Board of Directors, from
left to right: Joseph C. Bartolacci, Robert G. Neubert,
David J. DeCarlo, Robert J. Kavanaugh, Glenn R.
Mahone, David M. Kelly, John P. O’Leary, Jr.,
John D. Turner and William J. Stallkamp.
■ ■ ■ ■ ■ ■

I am proud to report that fiscal 2006 was another year of value
creation for our employees, customers, and shareholders. I want
to express a special thanks to the thousands of Matthews employees
who made it possible! The following report from Joe Bartolacci,
our President and Chief Executive Officer, describes the major
challenges and accomplishments of the year.
Fiscal 2006 was the twelfth consecutive year of improved
performance since our Initial Public Offering in 1994. During that period,
sales have increased 14% per year; earnings per share have grown 15%
per year and our share price has increased by a resounding 22% per
year! These results have been achieved in good economic years and
bad economic years, and despite some significant bumps in the road.
Along the way, we have been periodically recognized in several
national publications as one of the best small companies and one of the
most stable companies in America.
How do we do it? The key is the Matthews culture, nurtured and
strengthened and reinforced ever since our founding over 150 years ago.
Our employees are dedicated to product quality and customer service
and they make the difference. I can think of no better foundation
upon which to build another 150 years of success!
It is with a tinge of sadness that I announced my retirement
this year. On October 1, 2006, I relinquished the role of Chief Executive
Officer. On January 31, 2007, I will retire from employment and, per
agreement with the Board, I will remain as non-employee Chairman
until February 2008.
I am very pleased that Joe Bartolacci has taken over as President and
Chief Executive Officer. His background, commitment, and dedication
make him a wonderful choice to lead our company. There is no doubt
that, in coming years, we will continue to confront challenges and be
presented with new opportunities. With support from a strong
management team, Joe is the right person to lead us in a continued
quest for value creation for our constituencies – employees, customers,
and shareholders.
It is rewarding to see Matthews grow, but being bigger will never
take the place of being good! Good for our employees; good for
our customers; and good for our shareholders.
Thank you for the opportunity to serve with a wonderful
group of people!
I have been truly blessed to
have been a part of this great
organization. I am extremely
thankful for the tremendous
support that I have received from
our shareholders, customers
and, especially, our employees.
I continue to believe our
employees are our greatest asset
and the success of Matthews
is due to their hard work,
dedication and loyalty. I look
forward to continuing to serve
the Company as Chairman
of the Board and helping
Mr. Bartolacci toward a
successful transition.
David M. Kelly
Chairman of the Board
M E S S A G E F R O M T H E C H A I R M A N

F iscal 2006 will certainly be remembered as one of
the more challenging years for our Company. When
we began the year, we were in the midst of significant
changes in two of our manufacturing operations. One of
these changes was the establishment of a metal casket
manufacturing operation in Monterrey, Mexico. The
other significant change was the facilities consolidation
within our Merchandising Solutions business. Both of
these projects were initiated for the purpose of improving
the cost structure of these businesses to better position
Matthews in these increasingly competitive markets.
I am pleased to report that both of these projects
have been substantially completed. Our Mexican operation
passed the start-up phase early in fiscal 2006, achieved its
break-even point later in the year, and we are continuing to
increase the production rate and improve profitability. The
facilities consolidation in our Merchandising Solution segment
was substantially completed as of September 30, 2006 and
we began to see the benefits of this project through improved
operating margins in the fiscal 2006 third and fourth quarters.
As we continue through the transition phase of these
projects, it is appropriate to still expect further challenges.
However, the early results are definitely encouraging.
As the year progressed, our Bronze segment was
faced with a significant escalation in the cost of bronze
ingot. Copper is the primary component of bronze.
Although the cost of copper had been steadily increasing
over the previous two years, this trend accelerated during
fiscal 2006 with the cost peaking at around $4.00 per
pound. This compares to copper prices well below $2.00
per pound in fiscal 2005. The rapid increase in the cost of
our principal raw material had a negative impact on the
Bronze segment’s gross margin for the year. As a result
of the efforts of our Bronze segment management team,
the Company was able to mitigate a large portion of this
increase through significant cost containment initiatives
and price changes. One of these cost initiatives included
productivity improvements resulting from the closure of
two operations and the transfer of the manufacturing of
these products to other facilities.
With the purchase of Milso Industries in July 2005,
we acquired an established casket distribution expertise to
complement our sales through independent distribution.
Beginning in fiscal 2005 and into fiscal 2006, we experienced
turnover with some of our independent distribution that
required us to expand our own distribution operations into
additional areas of the United States. The transition to
Company-owned distribution in these areas resulted in
additional investments through the purchase of one of
our independent distributors and a significant use of cash
related to the increased working capital requirements
(inventory and accounts receivable) inherent in the
warehousing and distribution of caskets. Our Casket
segment has been working hard to effectively manage
these transitions through the promotion of the Milso and
York casket brands. Some of these transitions will continue
into fiscal 2007 and we still expect further challenges.
Late in fiscal 2005 and during fiscal 2006, we initiated
other actions to reduce the cost structure in several of our
businesses and improve manufacturing productivity. Cost
structure changes initiated in fiscal 2005 contributed to
operating profit improvements in our U.S. and U.K.
Graphics operations and our Cremation business. In our
Casket segment, we were able to close one of our metal
casket manufacturing plants early in the year as the
segment’s productivity increased. As the productivity of
this business continues to grow, we expect to further
adjust our capacity in fiscal 2007.
M E S S A G E T O O U R S H A R E H O L D E R S
Mr. Bartolacci joined Matthews in 1997 as General Counsel. In 1999, he became
President of Caggiati, S.p.A., the Company’s wholly-owned subsidiary in Parma, Italy.
In 2002, Mr. Bartolacci also assumed responsibility for Matthews European graphics
operations. He returned to North America in December 2003 and became Executive
Vice President of Matthews and President of the Company’s casket operations in 2004.
In September 2005, Mr. Bartolacci was appointed President and Chief Operating Officer
of Matthews and he was elected to the Company’s Board of Directors in November 2005.
Mr. Bartolacci was appointed Chief Executive Officer of Matthews effective October 1, 2006.

It is a privilege for me to accept this new responsibility. Mr. Kelly has set a high
standard of excellence and I intend to work hard to continue this tradition.
I have a great degree of confidence in Matthews and our employees and believe
we can continue to achieve the Company’s long-term growth objectives.
Given these challenges during fiscal 2006, we were
generally satisfied with our consolidated operating
performance. All of our business segments, with the
exception of Merchandising Solutions, reported earnings
growth for the fiscal year. And, as noted earlier, the
Merchandising Solutions segment posted improved results
in the last half of the fiscal year. In addition, our Marking
Products and Cremation segments each recorded double-
digit organic revenue growth in fiscal 2006 resulting in
significant operating profit improvement over fiscal 2005.
FISCAL 2006 FINANCIAL HIGHLIGHTS
The principal financial accomplishments achieved by our
Company in fiscal 2006 included the following:
� Matthews reported earnings per share of $2.06
for fiscal 2006, compared to $1.79 for fiscal 2005.
Fiscal 2006 earnings included a favorable impact of
$0.04 per share from unusual items in the fourth quarter.
Excluding the impact of these unusual items, our
earnings per share growth was still within our 12%
to 15% long-term growth objective. In addition, our
average annual increase in earnings per share over
the last ten years remains over 15%.
� The Company’s consolidated revenues were $715.9
million in fiscal 2006, compared to $639.8 million in
fiscal 2005. A significant portion of this increase resulted
from our acquisition of Milso Industries in July 2005.
� The Company’s consolidated operating profit increased
15.7% to $113.9 million in fiscal 2006, compared to
$98.4 million in fiscal 2005. The improvement reflected
the Company’s sales growth, the Milso acquisition and
productivity initiatives in several of our businesses.
� For the quarter ended September 30, 2006, the Board
of Directors increased the Company’s quarterly cash
dividend by 10% to $0.055 per share. This was
Matthews’ twelfth dividend increase since our initial
public offering in July 1994.
A PATH TOWARD FUTURE GROWTH
Effective October 1, 2006, I was granted the privilege of
serving Matthews as its President and Chief Executive
Officer. I am taking on this responsibility encouraged by
the progress we have achieved in the face of recent
challenges and with a conviction that we are well
positioned for success as we confront future issues.
Under the leadership of David M. Kelly, we have
developed a strong, well-respected publicly-traded
company with a demonstrated track record of success.
I am grateful for the solid foundation that has been
built under his leadership. He has always attributed the
success of Matthews to its dedication in serving three
constituencies: employees, customers and shareholders.
I share this belief as well. I am pleased that Mr. Kelly
will continue to be an integral part of the Company
through his role as Chairman of the Board of Directors.
The performance of Matthews and its reputation in
the marketplace are directly attributable to the efforts
our employees. I am proud to be a part of this Company
and I look forward to your support as we continue on
our path toward future growth.
Joseph C. Bartolacci
President and Chief Executive Officer
■ ■ ■ ■ ■ ■

� Earnings per share increased to $2.06 in fiscal 2006,
compared to $1.79 for fiscal 2005. Fiscal 2006 earnings
included a favorable impact of $0.04 per share from
unusual items in the fourth quarter. Excluding the impact
of these unusual items, our earnings per share growth
was within our 12% to 15% long-term growth objective.
� The Company’s consolidated revenues were $715.9
million in fiscal 2006, compared to $639.8 million in
fiscal 2005, an increase of 11.9%.
� The Company’s consolidated operating profit increased
15.7% to $113.9 million in fiscal 2006, compared to
$98.4 million in fiscal 2005.
� For the quarter ended September 30, 2006, the Board
of Directors increased the Company’s quarterly cash
dividend by 10% to $0.055 per share. This was
Matthews’ twelfth dividend increase since our
initial public offering in July 1994.
Fiscal 2006 Achievements at a Glance
Financial Highlights
Percentage of Company’s Consolidated Sales in Fiscal 2006
Dollar amounts in thousands, except share data 2006 2005 2004
Operating Results
Sales $715,891 $639,822 $508,801
Operating profit 113,884 98,413 95,078
Income before income taxes 105,408 93,056 89,117
Net income 66,444 58,071 54,533
Per Common Share
Diluted earnings per share $2.06 $1.79 $1.68
Dividends .205 .185 .165
Financial Position
Total assets $716,090 $665,455 $533,432
Long-term debt, noncurrent 120,289 118,952 54,389
Shareholders’ equity 392,425 337,749 315,140
Bronze30.4%
Casket28.1%
Cremation3.6%
GraphicsImaging19.7%
MarkingProducts
7.3%
MerchandisingSolutions
10.9%
B R A N D S O L U T I O N SM E M O R I A L I Z A T I O N
F I N A N C I A L H I G H L I G H T S • F I S C A L 2 0 0 6 A C H I E V E M E N T S
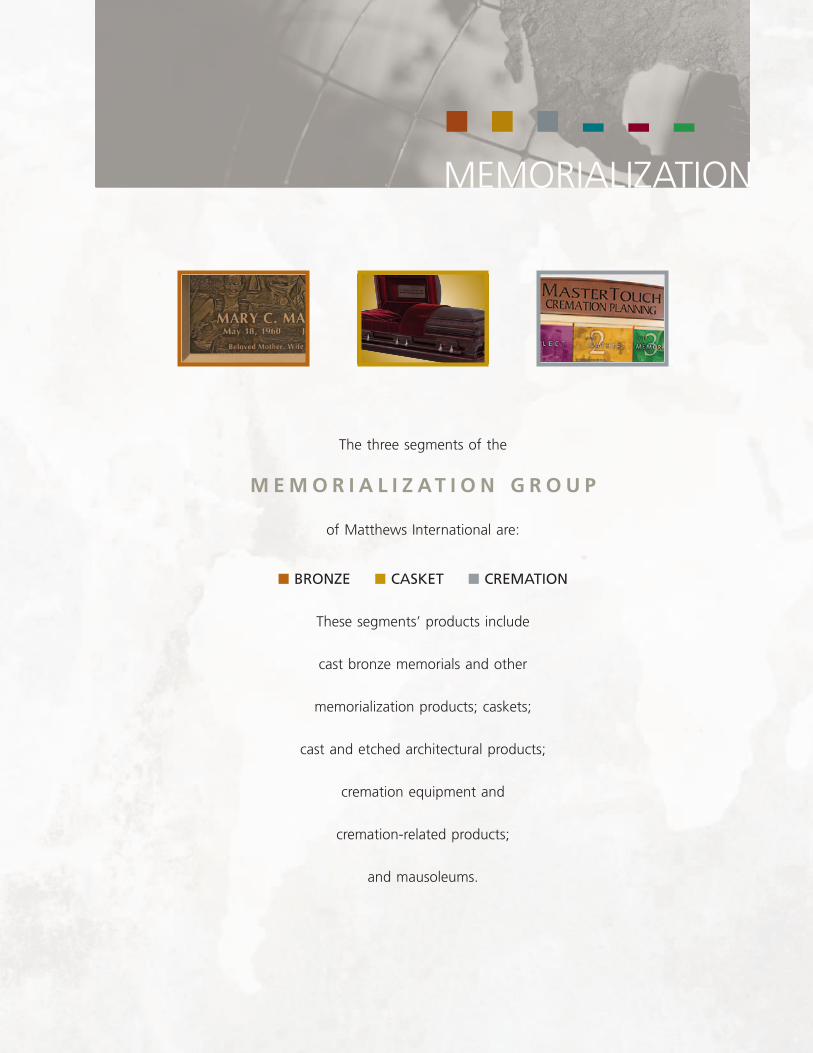
MEMORIALIZATION
The three segments of the
M E M O R I A L I Z A T I O N G R O U P
of Matthews International are:
■ BRONZE ■ CASKET ■ CREMATION
These segments’ products include
cast bronze memorials and other
memorialization products; caskets;
cast and etched architectural products;
cremation equipment and
cremation-related products;
and mausoleums.

M E M O R I A L I Z A T I O N
BRONZE
The Bronze segment manufactures and
markets products in the United States,
Europe, Canada and Australia used
primarily in the cemetery and funeral
home industries. The segment’s principal
products include cast bronze memorials
and other memorialization products used
mainly in cemeteries. Memorial products
include flush bronze memorials, flower
vases, crypt plates and letters, cameo
portraits, cremation urns, niche units,
cemetery features and statues, community
and family mausoleums, and granite
monuments. In addition, the segment
manufactures and markets cast bronze
and aluminum architectural products
used to identify or commemorate
people, places and events.
A Introduced in 2005, Lasting Memories™
montage memorials allow treasured photos to
be transformed into meaningful memorialization.
These memorials are offered in a large selection
of sizes in a beautiful antique bronze finish.
B New, larger crypt plates that can be personalized
with cameo portraits, emblems and matching
vases provide a premium form of mausoleum
memorialization.
C The Lasting Memories product line expanded
to include cast bronze niche fronts to provide
highly-personalized cremation memorialization.
D Architectural letters are the newest offering
in the ImageCast™ product line. With this
patent-pending process, customers can reproduce
exact images of photographs as part of the
cast metal letters. All images are actual raised
sculpted reliefs on the letters.
E Private mausoleums are a premium form of
memorialization. The Bronze segment supplies
a large selection of styles and designs in a
beautiful selection of granite colors.
A
B
C
D
E

M E M O R I A L I Z A T I O N
CASKET
The Casket segment is a leading
manufacturer of caskets in the United
States. The segment produces a wide
variety of wood and metal caskets. It is
also a leader in providing assortment
planning and merchandising and display
products for funeral service businesses.
These products assist funeral service
professionals in providing value and
satisfaction to their client families.A
D
B
A The new flagship of the Casket segment’s
hardwood collection, the solid mahogany
Chancellor showcases a lustrous hand-polished
finish, intricate moldings and a plush
wine velvet interior.
B A consolidation of both Milso and York
casket corner programs, the new Eternal
Reflections corner art collection features
34 colorful ornaments in hand-painted and
gold-tone finishes. Each piece is 20% larger
and compatible with a wide range of
Milso and York caskets.
C The Renaissance Resource Center®
literature module helps the healing process
begin, providing families with many choices
of therapeutic books and leaflets.
D Now installed in over 2,000 funeral
homes across the United States, the York
Merchandising System® is the industry’s
premier fractional casket display system.
C
CREMATION
M E M O R I A L I Z A T I O N
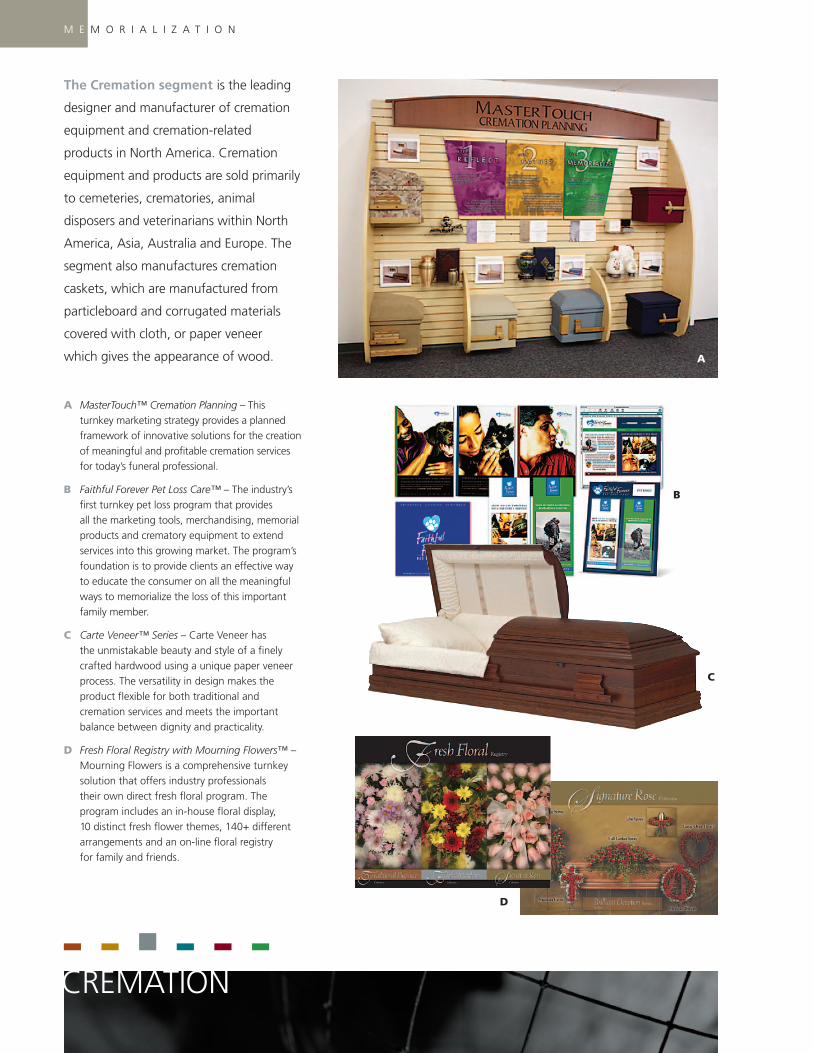
The Cremation segment is the leading
designer and manufacturer of cremation
equipment and cremation-related
products in North America. Cremation
equipment and products are sold primarily
to cemeteries, crematories, animal
disposers and veterinarians within North
America, Asia, Australia and Europe. The
segment also manufactures cremation
caskets, which are manufactured from
particleboard and corrugated materials
covered with cloth, or paper veneer
which gives the appearance of wood.
A MasterTouch™ Cremation Planning – Thisturnkey marketing strategy provides a plannedframework of innovative solutions for the creationof meaningful and profitable cremation servicesfor today’s funeral professional.
B Faithful Forever Pet Loss Care™ – The industry’sfirst turnkey pet loss program that providesall the marketing tools, merchandising, memorialproducts and crematory equipment to extendservices into this growing market. The program’sfoundation is to provide clients an effective wayto educate the consumer on all the meaningfulways to memorialize the loss of this importantfamily member.
C Carte Veneer™ Series – Carte Veneer hasthe unmistakable beauty and style of a finelycrafted hardwood using a unique paper veneerprocess. The versatility in design makes theproduct flexible for both traditional andcremation services and meets the importantbalance between dignity and practicality.
D Fresh Floral Registry with Mourning Flowers™ –Mourning Flowers is a comprehensive turnkeysolution that offers industry professionalstheir own direct fresh floral program. Theprogram includes an in-house floral display,10 distinct fresh flower themes, 140+ differentarrangements and an on-line floral registryfor family and friends.
D
B
A
C
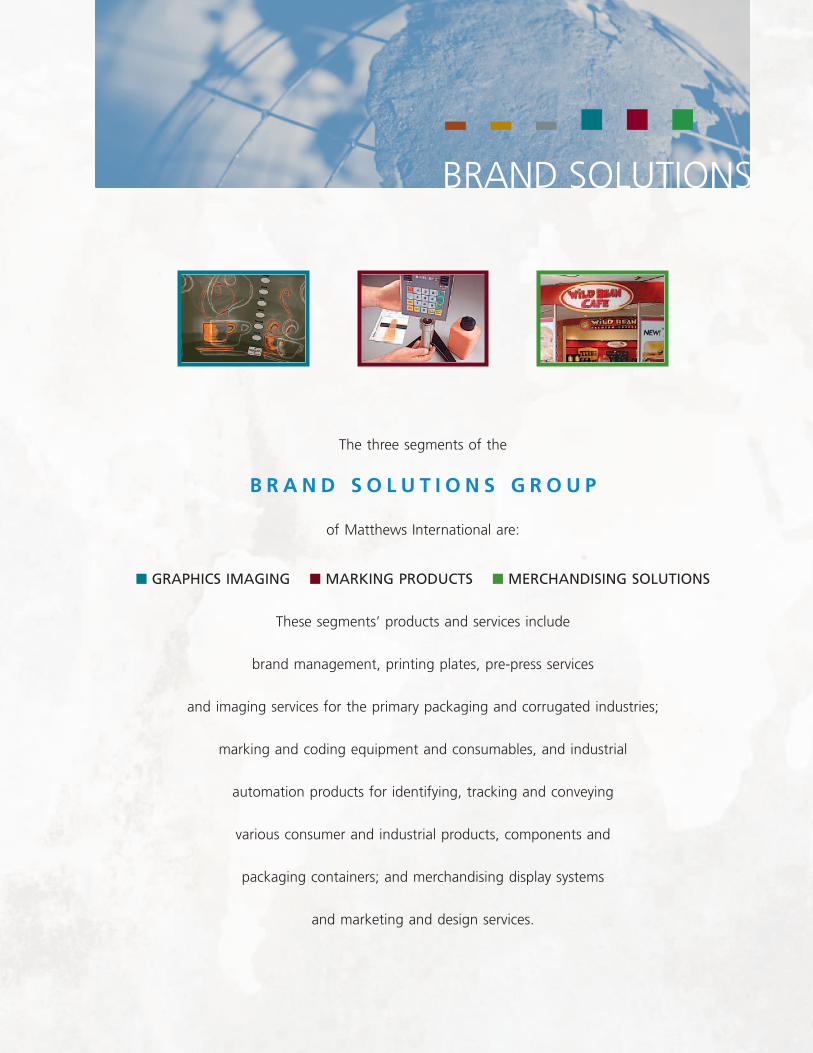
The three segments of the
B R A N D S O L U T I O N S G R O U P
of Matthews International are:
■ GRAPHICS IMAGING ■ MARKING PRODUCTS ■ MERCHANDISING SOLUTIONS
These segments’ products and services include
brand management, printing plates, pre-press services
and imaging services for the primary packaging and corrugated industries;
marking and coding equipment and consumables, and industrial
automation products for identifying, tracking and conveying
various consumer and industrial products, components and
packaging containers; and merchandising display systems
and marketing and design services.
BRAND SOLUTIONS

The Graphics Imaging segment
provides brand management, pre-press,
printing plates and creative design
services to the primary packaging and
corrugated industries. The segment’s
principal products and services include
brand management, pre-press graphics
services, printing plates, print process
assistance, print production management,
digital asset management, content
management and package design.
These products and services are used
by consumer products companies and
packaging manufacturers to develop and
print packaging graphics that identify and
help sell the product in the marketplace.
A Matthews Packaging Graphics created newgraphic designs for Reckitt Benckiser, andrendered as a 3-D image as shown, providingthe client a unique view of their product as itwould appear in the marketplace.
B Digital photography is used to capture imagesat the highest resolutions possible to be usedin package design and creation.
C Flexographic insulated coffee container forInsulair by Dixie, producers of Insulair and Dixiebrands, a leading world producer of specializedpaper cups and plates.
D Matthews proofing devices provide theconsumer product company a visual contracttarget for the packaging manufacturer to useduring packaging production.
E Image color is adjusted and retouched onMatthews high-end computer systems.
F Assortment of holiday graphics produced byMatthews for Anheuser-Busch, one of theworld’s leading brewers.
B R A N D S O L U T I O N S
C
B
GRAPHICS IMAGING
D
E
F
A

The Marking Products segment
designs, manufactures and distributes
a wide range of marking and coding
equipment and consumables, and
industrial automation products used by
customers to identify, track and convey
various consumer and industrial products,
components and packaging containers.
Marking technologies include contact
and ink-jet printing using a wide range
of specialty inks, as well as indenting and
etching processes. Marking solutions can
be a stand-alone operation or integrated
directly into the manufacturing process
at high speeds with extreme accuracy.
A Recently introduced, the SX-32 is an entry levelproduct that is both simple and expandable.Ideal for the packaging industry, this controlleroperates up to 32 valves in a wide selection ofprinthead types. Using the unique tilt headfunction, it marks a large range of character sizes.
B The ProPoint indenting machine uses a computercontrolled carbide stylus to permanently markmetal and plastic parts giving manufacturersaccurate traceability.
C Matthews 8000 Printheads feature precisionjeweled nozzles set in stainless steel face plates,which provide higher resolution at faster linespeeds. This results in significantly lower inkconsumption over conventional ink-jet heads.
D The I-Mark V80i is used by OEMs to integrateink-jet printing into the manufacturing process.This system has been used by manufacturersof lumber grading, metal stamping andpackaging equipment.
E The Marking Products segment developsand manufactures a complete line of offset,direct and ink-jet printing inks to meet a widerange of marking applications in severalmanufacturing industries.
F Matthews Jet-A-Mark Printheads are constructedto perform in rugged industrial environments.Their advanced design assures trouble-free,reliable operation.
B R A N D S O L U T I O N S
A
B
C
D E
F
MARKING PRODUCTS
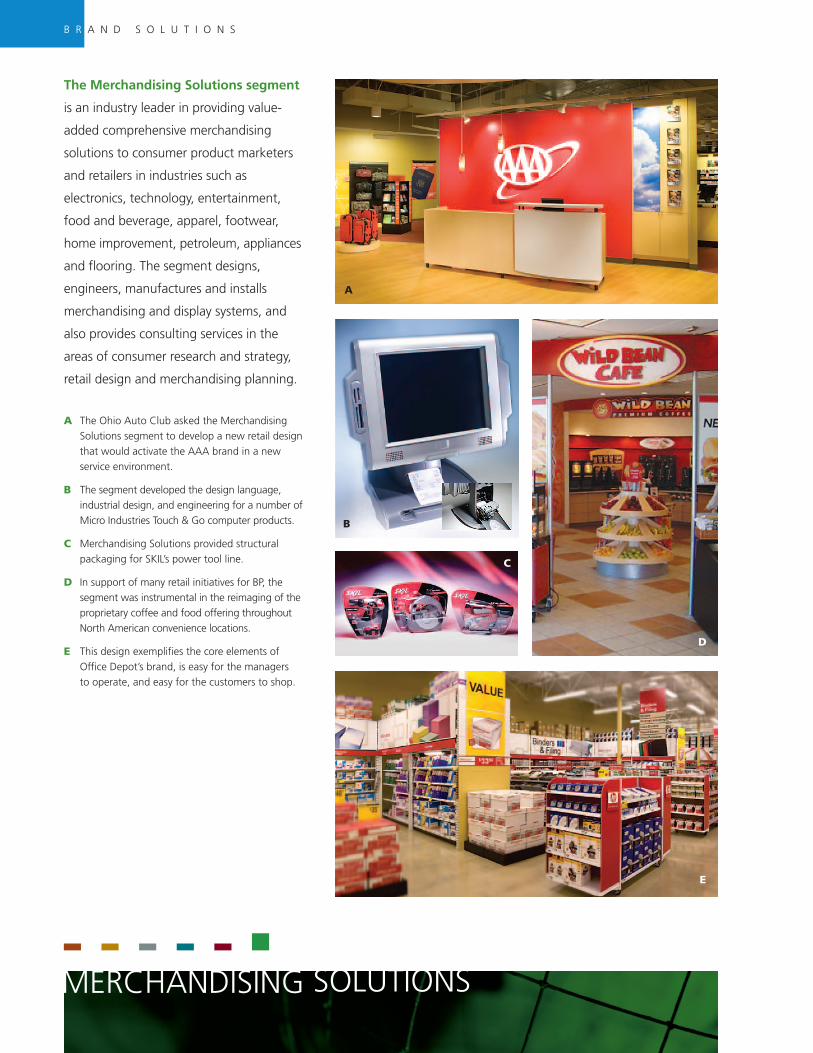
The Merchandising Solutions segment
is an industry leader in providing value-
added comprehensive merchandising
solutions to consumer product marketers
and retailers in industries such as
electronics, technology, entertainment,
food and beverage, apparel, footwear,
home improvement, petroleum, appliances
and flooring. The segment designs,
engineers, manufactures and installs
merchandising and display systems, and
also provides consulting services in the
areas of consumer research and strategy,
retail design and merchandising planning.
A The Ohio Auto Club asked the MerchandisingSolutions segment to develop a new retail designthat would activate the AAA brand in a newservice environment.
B The segment developed the design language,industrial design, and engineering for a number ofMicro Industries Touch & Go computer products.
C Merchandising Solutions provided structuralpackaging for SKIL’s power tool line.
D In support of many retail initiatives for BP, thesegment was instrumental in the reimaging of theproprietary coffee and food offering throughoutNorth American convenience locations.
E This design exemplifies the core elements ofOffice Depot’s brand, is easy for the managersto operate, and easy for the customers to shop.
B R A N D S O L U T I O N S
MERCHANDISING SOLUTIONS
A
B
D
C
E

UNITED STATESSECURITIES AND EXCHANGE COMMISSION
Washington, D.C. 20549
FORM 10-K� ANNUAL REPORT PURSUANT TO SECTION 13 OR 15(d) OF THE
SECURITIES EXCHANGE ACT OF 1934
For the fiscal year ended September 30, 2006
Commission File Number 0-9115
MATTHEWS INTERNATIONAL CORPORATION(Exact name of registrant as specified in its charter)
COMMONWEALTH OF PENNSYLVANIA 25-0644320(State or other jurisdiction of (I.R.S. Employerincorporation or organization) Identification No.)
TWO NORTHSHORE CENTER, PITTSBURGH, PA 15212-5851(Address of principal executive offices) (Zip Code)
Registrant’s telephone number, including area code (412) 442-8200
Securities registered pursuant to Section 12(b) of the Act:Name of each exchange
Title of each class on which registered
Class A Common Stock, $1.00 par value NASDAQ National Market System
Securities registered pursuant to Section 12(g) of the Act: None
Indicate by check mark if the registrant is a well-known seasoned issuer, as defined in Rule 405 of the Securities Act.Yes � No �
Indicate by check mark if the registrant is not required to file reports pursuant to Section 13 or Section 15(d) of the Act.Yes � No �
Indicate by check mark whether the registrant (1) has filed all reports required to be filed by Section 13 or 15(d) of the Securities ExchangeAct of 1934 during the preceding 12 months (or for such shorter period that the registrant was required to file such reports), and (2) hasbeen subject to such filing requirements for the past 90 days. �
Indicate by check mark if disclosure of delinquent filers pursuant to Item 405a of Regulation S-K is not contained herein, and will not becontained, to the best of registrant’s knowledge, in definitive proxy or information statements incorporated by reference in Part III ofthis Form 10-K or any amendment to this Form 10-K. �
Indicate by check mark whether the registrant is a large accelerated filer, an accelerated filer or a non-accelerated filer. See definitionof “accelerated filer” and “large accelerated filer” in Rule 12b-2 of the Exchange Act.
Large accelerated filer � Accelerated filer � Non-accelerated filer �
Indicate by check mark whether the registrant is a shell company (as defined in Rule 12b-2 of the Exchange Act). Yes � No �
The aggregate market value of the Class A Common Stock outstanding and held by non-affiliates of the registrant, based upon theclosing sale price of the Class A Common Stock on the NASDAQ National Market System on March 31, 2006, the last business day ofthe registrant’s most recently completed second fiscal quarter, was approximately $1.2 billion.
As of November 30, 2006, shares of common stock outstanding were: Class A Common Stock 31,653,186 shares
Documents incorporated by reference: Specified portions of the Proxy Statement for the 2007 Annual Meeting of Shareholders areincorporated by reference into Part III of this Report.
The index to exhibits is on pages 73–75.
■ 1 ■

PART I
CAUTIONARY STATEMENT REGARDING FORWARD-LOOKING INFORMATION:
Any forward-looking statements contained in this Annual Report on Form 10-K (specifically those contained in Item 1,“Business”, Item 1A, “Risk Factors” and Item 7, “Management’s Discussion and Analysis of Financial Condition and Resultsof Operations”) are included in this report pursuant to the “safe harbor” provisions of the Private Securities Litigation ReformAct of 1995. Such forward-looking statements involve known and unknown risks and uncertainties that may cause theCompany’s actual results in future periods to be materially different from management’s expectations. Although MatthewsInternational Corporation (“Matthews” or the “Company”) believes that the expectations reflected in such forward-lookingstatements are reasonable, no assurance can be given that such expectations will prove correct. Factors that could causethe Company’s results to differ materially from the results discussed in such forward-looking statements principally includechanges in domestic or international economic conditions, changes in foreign currency exchange rates, changes in the costof materials used in the manufacture of the Company’s products, changes in death rates, changes in product demand orpricing as a result of consolidation in the industries in which the Company operates, changes in product demand or pricingas a result of domestic or international competitive pressures, unknown risks in connection with the Company’s acquisitions,and technological factors beyond the Company’s control. In addition, although the Company does not have any customersthat would be considered individually significant to consolidated sales, changes in the distribution of the Company’s productsor the potential loss of one or more of the Company’s larger customers could be considered a risk factor.
ITEM 1. BUSINESS.
Matthews, founded in 1850 and incorporated in Pennsylvania in 1902, is a designer, manufacturer and marketer principallyof memorialization products and brand solutions. Memorialization products consist primarily of bronze memorials andother memorialization products, caskets and cremation equipment for the cemetery and funeral home industries. Brandsolutions include graphics imaging products and services, marking products, and merchandising solutions. The Company’sproducts and operations are comprised of six business segments: Bronze, Casket, Cremation, Graphics Imaging, MarkingProducts and Merchandising Solutions. The Bronze segment is a leading manufacturer of cast bronze memorials and othermemorialization products, cast and etched architectural products and is a leading builder of mausoleums in the UnitedStates. The Casket segment is a leading casket manufacturer in the United States and produces a wide variety of wood andmetal caskets. The Cremation segment is a leading designer and manufacturer of cremation equipment and cremationcaskets primarily in North America. The Graphics Imaging segment manufactures and provides printing plates, pre-pressservices and imaging services for the corrugated and primary packaging industries. The Marking Products segment designs,manufactures and distributes a wide range of marking and coding equipment and consumables, and industrial automationproducts for identifying, tracking and conveying various consumer and industrial products, components and packagingcontainers. The Merchandising Solutions segment designs and manufactures merchandising displays and systems andprovides creative merchandising and marketing solutions services.
At November 30, 2006, the Company and its majority-owned subsidiaries had approximately 3,900 employees. TheCompany’s principal executive offices are located at Two NorthShore Center, Pittsburgh, Pennsylvania 15212, its telephonenumber is (412) 442-8200 and its internet website is www.matw.com.
The following table sets forth reported sales and operating profit for the Company’s business segments for the past threefiscal years. Detailed financial information relating to business segments and to domestic and international operations ispresented in Note 15 (Segment Information) to the Consolidated Financial Statements included in Part II of this AnnualReport on Form 10-K. Prior year amounts contained in this table have been restated for the retrospective adoption ofStatement of Financial Accounting Standards (“SFAS”) No. 123 (revised 2004) (“SFAS No. 123 (R)”) (“Share-BasedPayment”). See Note 8 of the Notes to Consolidated Financial Statements.
■ 2 ■

Years Ended September 30,
2006 2005 2004
Amount Percent Amount Percent Amount Percent
(Dollars in Thousands)
Sales to unaffiliated customers:Memorialization:Bronze $218,004 30.4% $205,675 32.1% $197,377 38.8%Casket 200,950 28.1 135,512 21.2 116,588 22.9Cremation 25,976 3.6 21,497 3.4 22,476 4.4
444,930 62.1 362,684 56.7 336,441 66.1
Brand Solutions:Graphics Imaging 140,886 19.7 143,159 22.4 113,226 22.2Marking Products 52,272 7.3 45,701 7.1 37,990 7.5Merchandising Solutions 77,803 10.9 88,278 13.8 21,144 4.2
270,961 37.9 277,138 43.3 172,360 33.9
Total $715,891 100.0% $639,822 100.0% $508,801 100.0%
Operating profit:Memorialization:Bronze $ 65,049 57.1% $ 59,722 60.7% $ 53,100 55.9%Casket 16,971 14.9 12,645 12.8 14,000 14.7Cremation 3,372 3.0 701 .7 1,294 1.4
85,392 75.0 73,068 74.2 68,394 72.0
Brand Solutions:Graphics Imaging 16,554 14.5 14,861 15.1 18,764 19.7Marking Products 9,066 8.0 7,373 7.5 6,371 6.7Merchandising Solutions 2,872 2.5 3,111 3.2 1,549 1.6
28,492 25.0 25,345 25.8 26,684 28.0
Total $113,884 100.0% $ 98,413 100.0% $ 95,078 100.0%
In fiscal 2006, approximately 77% of the Company’s sales were made from the United States, and 20%, 2% and 1% weremade from Europe, Canada and Australia, respectively. Bronze segment products are sold throughout the world with thesegment’s principal operations located in the United States, Italy, Canada and Australia. Casket segment products areprimarily sold in the United States and Canada. Cremation segment products and services are sold primarily in NorthAmerica, as well as Asia, Australia, and Europe. Products and services of the Graphics Imaging segment are sold primarilyin the United States and Europe. The Marking Products segment sells equipment and consumables directly to industrialconsumers and distributors in the United States and internationally through the Company’s wholly-owned subsidiaries inCanada and Sweden and through other foreign distributors. Matthews owns a minority interest in Marking Productsdistributors in Asia, Australia, France, Germany, the Netherlands and the United Kingdom. Merchandising Solutions segmentproducts and services are sold principally in the United States.
■ 3 ■
ITEM 1. BUSINESS (continued)

MEMORIALIZATION PRODUCTS AND MARKETS:
Bronze:
The Bronze segment manufactures and markets products used primarily in the cemetery and funeral home industries. Thesegment’s products, which are sold principally in the United States, Europe, Canada and Australia, include cast bronzememorials and other memorialization products used primarily in cemeteries. The segment also manufactures and marketscast and etched architectural products, that are produced from bronze, aluminum and other metals, which are used toidentify or commemorate people, places, events and accomplishments.
Memorial products, which comprise the majority of the Bronze segment’s sales, include flush bronze memorials, flowervases, crypt letters, cremation urns, niche units, cemetery features and statues, along with other related products and services.Flush bronze memorials are bronze plaques which contain personal information about a deceased individual such as name,birth date, death date and emblems. These memorials are used in cemeteries as an alternative to upright and flush granitemonuments. The memorials are even or “flush” with the ground and therefore are preferred by many cemeteries for easiermowing and general maintenance. In order to provide products for the granite memorial and mausoleum markets, theCompany’s other memorial products include community and family mausoleums, granite monuments and benches, bronzeplaques, letters, emblems, vases, lights and photoceramics that can be affixed to granite monuments, mausoleums, cryptsand flush memorials. Matthews is a leading builder of mausoleums within North America. Principal customers for memorialproducts are cemeteries and memorial parks, which in turn sell the Company’s products to the consumer.
Customers of the Bronze segment can also purchase memorials and vases on a “pre-need” basis. The “pre-need” conceptpermits families to arrange for these purchases in advance of their actual need. Upon request, the Company willmanufacture the memorial to the customer’s specifications (e.g., name and birth date) and place it in storage for futuredelivery. All memorials in storage have been paid in full with title conveyed to each pre-need purchaser.
The Bronze segment manufactures a full line of memorial products for cremation, including urns in a variety of sizes, stylesand shapes. The segment also manufactures bronze and granite niche units, which are comprised of numerouscompartments used to display cremation urns in mausoleums and churches. In addition, the Company also markets turnkeycremation gardens, which include the design and all related products for a cremation memorial garden.
Architectural products include cast bronze and aluminum plaques, etchings and letters that are used to recognize,commemorate and identify people, places, events and accomplishments. The Company’s plaques are frequently used toidentify the name of a building or the names of companies or individuals located within a building. Such products are alsoused to commemorate events or accomplishments, such as military service or financial donations. The principal marketsfor the segment’s architectural products are corporations, fraternal organizations, contractors, churches, hospitals, schoolsand government agencies. These products are sold to and distributed through a network of independent dealers includingsign suppliers, awards and recognition companies, and trophy dealers.
Raw materials used by the Bronze segment consist principally of bronze and aluminum ingot, sheet metal, coating materials,photopolymers and construction materials and are generally available in adequate supply. Ingot is obtained from variousNorth American, European and Australian smelters.
Competition from other bronze memorialization product manufacturers is on the basis of reputation, product quality, delivery,price and design availability. The Company also competes with upright granite monument and flush granite memorialproviders. The Company believes that its superior quality, broad product lines, innovative designs, delivery capability, customerresponsiveness, experienced personnel and consumer-oriented merchandising systems are competitive advantages in itsmarkets. Competition in the mausoleum construction industry includes various construction companies throughout NorthAmerica and is on the basis of design, quality and price. Competitors in the architectural market are numerous and includecompanies that manufacture cast and painted signs, plastic materials, sand-blasted wood and other fabricated products.
■ 4 ■
ITEM 1. BUSINESS (continued)

Casket:
The Casket segment is a leading manufacturer of caskets in the United States. The segment produces two types of caskets:metal and wood. Caskets can be customized with many different options such as color, interior design, handles and trimin order to accommodate specific religious, ethnic or other personal preferences.
Metal caskets are made from various gauges of cold rolled steel, stainless steel, copper and bronze. Metal caskets aregenerally categorized by whether the casket is non-gasketed or gasketed, and by material (i.e., bronze, copper, or steel) andin the case of steel, by the gauge, or thickness, of the metal.
The segment’s wood caskets are manufactured from nine different species of wood, as well as from veneer. The speciesof wood used are poplar, pine, ash, oak, pecan, maple, cherry, walnut and mahogany. The Casket segment is a leadingmanufacturer of all-wood constructed caskets, which are manufactured using pegged and dowelled construction, andinclude no metal parts. All-wood constructed caskets are preferred by certain religious groups.
The segment also produces casket components. Casket components include stamped metal parts, metal lockingmechanisms for gasketed metal caskets, adjustable beds, interior panels and plastic ornamental hardware for the exteriorof the casket. Metal casket parts are produced by stamping cold rolled steel, stainless steel, copper and bronze sheets intocasket body parts. Locking mechanisms and adjustable beds are produced by stamping and assembling a variety of steelparts. Certain ornamental hardware styles are produced from injection molded plastic. The segment purchases fromsawmills and lumber distributors various species of uncured wood, which it dries and cures. The cured wood is processedinto casket components.
Additionally, the segment provides assortment planning and merchandising and display products to funeral servicebusinesses. These products assist funeral service professionals in providing value and satisfaction to their client families.
The primary materials required for casket manufacturing are cold rolled steel and lumber. The segment also purchasescopper, bronze, stainless steel, cloth, ornamental hardware and coating materials. Purchase orders or supply agreementsare typically negotiated with large, integrated steel producers that have demonstrated timely delivery, high quality materialand competitive prices. Lumber is purchased from a number of sawmills and lumber distributors. The Company purchasesmost of its lumber from sawmills within 150 miles of its wood casket manufacturing facility in York, Pennsylvania.
Prior to July 2005, the segment marketed its casket products primarily through independent distributors. With theacquisition of Milso Industries Corporation in July 2005, the segment significantly expanded its internal casket distributioncapabilities. The segment now markets its casket products in the United States through a combination of internal andindependent casket distribution facilities. The Company currently operates over 40 distribution centers in the United States.
The casket business is highly competitive. The segment competes with other manufacturers on the basis of product quality,price, service, design availability and breadth of product line. The segment provides a line of casket products that it believesis as comprehensive as any of its major competitors. Although there are a large number of casket industry participants,the Casket segment and its two largest competitors account for a substantial portion of the finished caskets produced inthe United States.
Historically, the segment’s operations have experienced seasonal variations. Generally, casket sales are highest in the secondquarter and lowest in the fourth quarter of each fiscal year. These fluctuations are due in part to the seasonal variance inthe death rate, with a greater number of deaths generally occurring in cold weather months.
■ 5 ■
ITEM 1. BUSINESS (continued)

Cremation:
The Cremation segment has four major groups of products and services: cremation equipment, cremation caskets,equipment service and repair, and supplies and urns.
The Cremation segment is the leading designer and manufacturer of cremation equipment in North America. Cremationequipment includes systems for cremation of humans and animals, as well as equipment for processing the crematedremains and other related equipment such as handling equipment (tables, cooler racks, vacuums). Cremation equipmentand products are sold primarily to funeral homes, cemeteries, crematories, animal disposers and veterinarians within NorthAmerica, Asia, Australia and Europe.
Cremation casket products consist primarily of three types of caskets: cloth-covered wood, cloth-covered corrugated materialand paper veneer-covered particleboard. These products are generally used in cremation and are marketed principally tofuneral homes through independent distributors in the United States.
Service and repair consists of maintenance work performed on various makes and models of cremation equipment. Thiswork can be as simple as routine maintenance or as complex as complete on-site reconstruction. The principal marketsfor these services are the owners and operators of cremation equipment. These services are marketed principally in NorthAmerica through Company sales representatives.
Supplies and urns are consumable items associated with cremation operations. Supplies distributed by the segment includeoperator safety equipment, identification discs and combustible roller tubes. Urns distributed by the segment includeproducts ranging from plastic containers to bronze urns for cremated remains. These products are marketed primarily inNorth America.
Raw materials used by the Cremation segment consist principally of structural steel, sheet metal, electrical components,cloth, wood, particleboard, corrugated materials, paper veneer and masonry materials and are generally available inadequate supply from numerous suppliers.
The Company competes with several manufacturers in the cremation equipment market principally on the basis of productquality and price. The Cremation segment and its three largest competitors account for a substantial portion of the domesticcremation equipment market. The cremation casket business is highly competitive. The segment competes with othercremation casket manufacturers on the basis of product quality, price and design availability. Although there are a largenumber of casket industry participants, the Cremation segment and its two largest competitors account for a substantialportion of the cremation caskets sold in the United States.
Historically, the segment’s cremation casket operations have experienced seasonal variations. These fluctuations are due inpart to the seasonal variance in the death rate, with a greater number of deaths generally occurring in cold weather months.
BRAND SOLUTIONS PRODUCTS AND MARKETS:
Graphics Imaging:
The Graphics Imaging segment provides brand management, pre-press services, printing plates and creative design servicesto the primary packaging and corrugated industries. The corrugated packaging industry consists of manufacturers ofprinted corrugated containers. The primary packaging industry consists of manufacturers of printed packaging materialssuch as boxes, flexible packaging, folding cartons and bags commonly seen at retailers of consumer goods.
■ 6 ■
ITEM 1. BUSINESS (continued)

The principal products and services of this segment include brand management, pre-press graphics services, printing plates,print process assistance, print production management, digital asset management, content management, and packagedesign. These products and services are used by brand owners and packaging manufacturers to develop and printpackaging graphics that identify and help sell the product in the marketplace. Other packaging graphics can includenutritional information, directions for product use, consumer warning statements and UPC codes. The corrugated packagingmanufacturer produces printed containers from corrugated sheets. Using the Company’s products, this sheet is printedand die cut to make a finished container. The primary packaging manufacturer produces printed packaging from paper,film, foil and other composite materials used to display, protect and market the product.
The segment offers a wide array of value-added services and products. These include print process and print productionmanagement services; pre-press preparation, which includes computer-generated art, film and proofs; plate mountingaccessories and various press aids; and rotary and flat cutting dies used to cut out intricately designed containers and point-of-purchase displays. The segment also provides creative digital graphics services to brand owners and packaging markets.
The Company works closely with manufacturers to provide the proper printing plates and tooling used to print thepackaging to the user’s specifications. The segment’s printing plate products are made principally from photopolymer resinand sheet materials. Upon customer request, plates can be pre-mounted press-ready in a variety of configurations thatmaximize print quality and minimize press set-up time.
The Graphics Imaging segment customer base consists primarily of packaging industry converters and brand owners. Brandowners are generally large, well-known consumer products companies and retailers with a national or global presence.These types of companies tend to purchase their graphics needs directly and supply the printing plates, or the electronicfiles to make the printing plates, to the packaging printer for their products. The Graphics Imaging segment servescustomers primarily in the United States and Europe. In Europe, Matthews has subsidiaries principally in England, Germanyand Austria. Products and services of these operations include pre-press packaging, digital and analog flexographic printingplates, design, artwork, lithography and color separation.
Major raw materials for this segment’s products include photopolymers, film and graphic art supplies. All such materialsare presently available in adequate supply from various industry sources.
The Graphics Imaging segment is one of several manufacturers of printing plates and providers of pre-press services withan international presence in the United States and Europe. The segment competes in a fragmented industry consisting ofa few multi-plant regional printing plate suppliers and a large number of local single-facility companies located across theUnited States and Europe. The combination of the Company’s Graphics Imaging business in the United States and Europeis an important part of Matthews’ strategy to become a worldwide leader in the graphics industry and service multinationalcustomers on a global basis. Competition is on the basis of product quality, timeliness of delivery, price and value-addedservices. The Company differentiates itself from the competition by consistently meeting customer demands, its ability toservice customers nationally and globally, and its ability to provide value-added services.
Marking Products:
The Marking Products segment designs, manufactures and distributes a wide range of marking and coding products andrelated consumables, as well as industrial automation products. The Company’s products are used by manufacturers andsuppliers to identify, track and convey their products and packaging. Marking products can range from a simple handstamp to microprocessor-based ink-jet printing systems. Coding systems often integrate into the customer’s manufacturing,inventory tracking and conveyance control systems. The Company manufactures and markets products and systems thatemploy the following marking methods to meet customer needs: contact printing, indenting, etching and ink-jet printing.
■ 7 ■
ITEM 1. BUSINESS (continued)

Customers will often use a combination of these methods in order to achieve an appropriate mark. These methods applyproduct information required for identification and traceability as well as to facilitate inventory and quality control, regulatorycompliance and brand name communication.
Industrial automation products that the Company manufactures are based upon embedded control architecture to createinnovative custom solutions which can be “productized.” Industries that products are created for include oil exploration,material handling and security scanning. The material handling industry customers include the largest automated assemblyand mail sorting companies in the United States.
A significant portion of the revenue of the Marking Products segment is attributable to the sale of consumables andreplacement parts in connection with the marking, coding and tracking hardware sold by the Company. The Companydevelops inks, rubber and steel consumables in harmony with the marking equipment in which they are used, which iscritical to assure ongoing equipment reliability and mark quality. Many marking equipment customers also use theCompany’s inks, solvents and cleaners.
The principal customers for the Company’s marking products are consumer goods manufacturers, including food andbeverage processors, producers of pharmaceuticals, and manufacturers of durable goods and building products. TheCompany also serves a wide variety of industrial markets, including metal fabricators, manufacturers of woven andnon-woven fabrics, plastic, rubber and automotive products.
A portion of the segment’s sales are outside the United States and are distributed through the Company’s subsidiaries inCanada and Sweden in addition to other international distributors. Matthews owns a minority interest in distributors in Asia,Australia, France, Germany and the Netherlands.
The marking products industry is diverse, with companies either offering limited product lines for well-defined specialtymarkets, or similar to the Company, offering a broad product line and competing in various product markets and countries.In the United States, the Company has manufactured and sold marking products and related consumable items since 1850.
Major raw materials for this segment’s products include precision components, electronics, printing components, toolsteels, rubber and chemicals, all of which are presently available in adequate supply from various sources.
Competition for marking products is intense and based on product performance, integration into the manufacturingprocess, service and price. The Company normally competes with specialty companies in specific brand marking solutionsand traceability applications. The Company believes that, in general, it offers the broadest line of marking products toaddress a wide variety of industrial marking applications.
Merchandising Solutions:
The Merchandising Solutions segment, acquired by Matthews in July 2004, provides merchandising and printing solutionsfor manufacturers and retailers. The segment designs, manufactures and installs merchandising and display systems, andalso provides marketing and merchandising consulting services.
The majority of the segment’s sales are derived from the design, engineering, manufacturing and installation ofmerchandising and display systems. These systems include permanent and temporary displays, custom store fixtures, brandconcept shops, interactive kiosks, custom packaging, and screen and digitally printed promotional signage. Design andengineering services include concept and model development, graphics design and prototyping. Merchandising and displaysystems are manufactured to specifications developed by the segment in conjunction with the customer. These productsare marketed and sold primarily in the United States.
■ 8 ■
ITEM 1. BUSINESS (continued)

The segment also provides consulting services in the areas of consumer research and strategy, retail design, merchandiseplanning, brand and product communications, marketing and product design. These services are provided to a wide varietyof manufacturing, retail and consumer products and services customers, principally in the United States.
The segment operates in a fragmented industry consisting primarily of a number of small, locally operated companies.Industry competition is intense and the segment competes on the basis of reliability, creativity and providing a broad arrayof merchandising products and services. The segment is unique in its ability to provide in-depth marketing andmerchandising consulting services as well as design, engineering and manufacturing capabilities. These capabilities allowthe segment to deliver complete turnkey merchandising solutions quickly and cost effectively.
Major raw materials for the segment’s products include wood, particleboard, corrugated materials, structural steel, plastic,laminates, inks, film and graphic art supplies. All of these raw materials are presently available in adequate supply fromvarious sources.
PATENTS, TRADEMARKS AND LICENSES:
The Company holds a number of domestic and foreign patents and trademarks. However, the Company believes the loss ofany or a significant number of patents or trademarks would not have a material impact on consolidated operations or revenues.
BACKLOG:
Because the nature of the Company’s Bronze, Graphics Imaging and Merchandising Solutions businesses are primarilycustom products made to order with short lead times, backlogs are not generally material except for mausoleums. Backlogsvary in a range of approximately one year of sales for mausoleums. The Casket segment and the cremation casket businessnormally fill sales orders within one month and, therefore, do not have a significant backlog of unfilled orders. Cremationequipment sales backlogs vary in a range of eight to ten months of sales. Backlogs generally vary in a range of up to fourweeks of sales in the Marking Products segment.
REGULATORY MATTERS:
The Company’s operations are subject to various federal, state and local laws and regulations relating to the protection ofthe environment. These laws and regulations impose limitations on the discharge of materials into the environment andrequire the Company to obtain and operate in compliance with conditions of permits and other government authorizations.As such, the Company has developed environmental, health and safety policies and procedures that include the properhandling, storage and disposal of hazardous materials.
The Company is party to various environmental matters. These include obligations to investigate and mitigate the effectson the environment of the disposal of certain materials at various operating and non-operating sites. The Company iscurrently performing environmental assessments and remediation at these sites, as appropriate. In addition, prior to itsacquisition, The York Group, Inc. was identified, along with others, by the Environmental Protection Agency as a potentiallyresponsible party for remediation of a landfill site in York, Pennsylvania. At this time, the Company has not been joined inany lawsuit or administrative order related to the site or its clean-up.
At September 30, 2006, an accrual of approximately $10.0 million had been recorded for environmental remediation (ofwhich $925,000 was classified in other current liabilities), representing management’s best estimate of the probable andreasonably estimable costs of the Company’s known remediation obligations. The accrual does not consider the effectsof inflation and anticipated expenditures are not discounted to their present value. While final resolution of thesecontingencies could result in costs different than current accruals, management believes the ultimate outcome will nothave a significant effect on the Company’s consolidated results of operations or financial position.
■ 9 ■
ITEM 1. BUSINESS (continued)

ITEM 1A. RISK FACTORS.
Risk factors specific to the Company relate primarily to the Casket segment and include Civil Investigative Demands fromthe Attorneys General in Maryland, Florida and Connecticut and the potential loss of the segment’s largest independentdistributor of caskets. Each of these factors are described more fully in Item 3 “Legal Proceedings” of this Form 10-K.
Other general risk factors that could affect the Company’s future results principally include changes in domestic orinternational economic conditions, changes in foreign currency exchange rates, changes in commodity pricing which effectthe cost of materials used in the manufacture of the Company’s products, changes in death rates, changes in productdemand or pricing as a result of consolidation in the industries in which the Company operates, changes in product demandor pricing as a result of domestic or international competitive pressures, unknown risks in connection with the Company’sacquisitions, and technological factors beyond the Company’s control. Although the Company does not have any customersthat would be considered individually significant to consolidated sales, changes in the distribution of the Company’s productsor the potential loss of one or more of the Company’s larger customers could be considered a risk factor. These factorsare also included in this Form 10-K under the caption “Cautionary Statement Regarding Forward-Looking Information.”
ITEM 1B. UNRESOLVED STAFF COMMENTS.
Not Applicable.
■ 10 ■

ITEM 2. PROPERTIES.
Principal properties of the Company and its majority-owned subsidiaries as of November 30, 2006 were as follows(properties are owned by the Company except as noted):
Location Description of Property Square Feet
Bronze:Pittsburgh, PA Manufacturing / Division Offices 97,000Kingwood, WV Manufacturing 121,000Melbourne, Australia Manufacturing 26,0001
Milton, Ontario, Canada Manufacturing 30,000Parma, Italy Manufacturing / Warehouse 231,0001
Searcy, AR Manufacturing 113,000Seneca Falls, NY Manufacturing 21,000
Casket:Brooklyn, NY Distribution / Administrative Offices 47,0001
Marshfield, MO Manufacturing 86,000Monterrey, Mexico Manufacturing 178,0001
Richmond, IN Manufacturing 55,0001
Richmond, IN Manufacturing / Metal Stamping 92,000Richmond, IN Injection Molding 18,0001
York, PA Manufacturing 307,000
Cremation:Apopka, FL Manufacturing / Division Offices 40,000Richmond, IN Manufacturing 129,0001
Graphics Imaging:Pittsburgh, PA Manufacturing / Division Offices 56,000Jülich, Germany Manufacturing / Division Offices 24,000Atlanta, GA Manufacturing 16,000Beverly, MA Manufacturing 14,5001
Dallas, TX Manufacturing 15,0001
Denver, CO Manufacturing 12,0001
Goslar, Germany Manufacturing 39,0001
Kansas City, MO Manufacturing 42,0001
Leeds, England Manufacturing 64,0001
Munich, Germany Manufacturing 10,0001
Nuremberg, Germany Manufacturing 27,0001
Oakland, CA Manufacturing 21,0001
St. Louis, MO Manufacturing 25,000Vienna, Austria Manufacturing 38,0001
Marking Products:Pittsburgh, PA Manufacturing / Division Offices 85,000Gothenburg, Sweden Manufacturing / Distribution 28,0001
Tualatin, OR Manufacturing 15,0001
Merchandising Solutions:East Butler, PA Manufacturing / Division Offices 630,0002
Columbus, OH Administrative Offices 12,0001
Corporate Office:Pittsburgh, PA General Offices 48,000
In addition, the Casket division leases warehouse facilities totaling approximately 641,000 square feet in 17 states underoperating leases.1These properties are leased by the Company under operating lease arrangements. Rent expense incurred by the Company for all leased facilities wasapproximately $10,800,000 in fiscal 2006.
2Approximately one-fifth of this building is leased to unrelated parties.
■ 11 ■

All of the owned properties are unencumbered. The Company believes its facilities are generally well suited for theirrespective uses and are of adequate size and design to provide the operating efficiencies necessary for the Company tobe competitive. The Company’s facilities provide adequate space for meeting its near-term production requirements andhave availability for additional capacity. The Company intends to continue to expand and modernize its facilities as necessaryto meet the demand for its products.
ITEM 3. LEGAL PROCEEDINGS.
In August 2005, The York Group, Inc. (“York”), a wholly-owned subsidiary of the Company, was served with CivilInvestigative Demands (“CIDs”) from the Attorneys General in Maryland and Florida. Thereafter, in October 2005, Yorkwas also served with a CID from the Attorney General in Connecticut. The pending CIDs are part of a multi-stateinvestigation in which the Attorneys General from Maryland, Florida and Connecticut have requested information fromvarious sources, including several national owners and operators of funeral homes, as well as several manufacturers ofcaskets, regarding alleged anti-competitive practices in the funeral service industry. As one of many potential sources ofinformation, York has already timely responded to the document production request communicated through the CIDs.Presently, the investigation continues to remain in the preliminary stages and the scope of the investigation has been limitedto evaluating the sale of caskets in the funeral service industry.
In October 2005, York filed a complaint and a motion for a special and/or preliminary injunction in the Court of CommonPleas of Allegheny County, Pennsylvania (the “Court”) against Yorktowne Caskets, Inc. (“Yorktowne”), the shareholdersof Yorktowne, Batesville Casket Company, Inc. and Batesville Services. This action was taken in response to theannouncement that Batesville Casket Company, Inc. and/or Batesville Services (collectively “Batesville”) had entered into adefinitive agreement to acquire the outstanding stock of Yorktowne, York’s largest independent distributor of wood andmetal caskets. The causes of action alleged by York involve the distributor agreement between York and Yorktowne whichremains in effect through April 14, 2007.
The Court issued a Decision and Order on November 9, 2005 concluding that York had demonstrated its entitlement to apreliminary injunction and ordered: (1) Yorktowne, its shareholders and Batesville to refrain from further pursuit orconsummation of the proposed sale of Yorktowne to Batesville; (2) Yorktowne and its shareholders to provide York withthe right of first refusal as required under the enforceable distributor agreement; (3) Yorktowne and its shareholders torefrain from violating the non-assignment provisions of the distributor agreement; (4) Yorktowne to use its best efforts topromote York products and to refrain from selling, marketing or promoting products in competition with York; and (5)Yorktowne’s shareholders and Batesville from interfering with the distributor agreement between York and Yorktowne.
The lawsuit against Yorktowne, its shareholders and Batesville remains pending and the defendants filed appeals from theCourt’s injunction ruling to the Superior Court of Pennsylvania (the “Superior Court”). The defendants’ appeals wereargued orally before the Superior Court in Pittsburgh, Pennsylvania in late June of 2006 and a decision addressing themerits of the defendants’ appeal could be issued at any time by the Superior Court. Pending a decision by the SuperiorCourt, the preliminary injunction issued on November 9, 2005 remains in force.
In February 2006, Yorktowne and its shareholders filed a complaint in the Court of Common Pleas of Allegheny County,Pennsylvania against the Company, York and Milso Industries, Inc. (“Milso”) alleging, in part, that the Company, York andMilso breached York’s distributor agreement with Yorktowne dated April 15, 2005, as well as tortuously interfered withYorktowne’s contractual and prospective contractual relations. Yorktowne alleges entitlement to various monetary damages,including a specific claim for $58 million.
■ 12 ■
ITEM 2. PROPERTIES (continued)

It is possible that resolution of the foregoing matter could be unfavorable to the Company; however, the Company intendsto vigorously defend against the allegations set forth in the Complaint and the Company does not presently believe thatthe ultimate resolution will have a material adverse impact on the Company’s financial position or results of operations.
ITEM 4. SUBMISSION OF MATTERS TO A VOTE OF SECURITY HOLDERS.
No matters were submitted to a vote of the Company’s security holders during the fourth quarter of fiscal year 2006.
■ 13 ■
ITEM 3. LEGAL PROCEEDINGS (continued)

OFFICERS AND EXECUTIVE MANAGEMENT OF THE REGISTRANT
The following information is furnished with respect to officers and executive management as of November 30, 2006:
Name Age Positions with Registrant
David M. Kelly 64 Chairman of the Board
Joseph C. Bartolacci 46 President and Chief Executive Officer
David F. Beck 54 Controller
Martin J. Beck 63 President, Brand Solutions
David J. DeCarlo 61 Vice Chairman
Brian J. Dunn 49 President, Marking Products Division
David H. Hewitt 56 President, Bronze Division
Steven F. Nicola 46 Chief Financial Officer, Secretary and Treasurer
Harry A. Pontone 76 President, Casket Division
Paul F. Rahill 49 President, Cremation Division
Franz J. Schwarz 58 President, Graphics Europe
Brian E. Tottman 57 Managing Director, Packaging Graphics U.K. and U.S.
David M. Kelly has been Chairman of the Board since March 1996. He was Chief Executive Officer of the Company fromSeptember 2005 through September 2006. Prior thereto, he had been President and Chief Executive Officer of theCompany from October 1995 through September 2005.
Joseph C. Bartolacci was appointed President and Chief Executive Officer effective October 1, 2006. He had been Presidentand Chief Operating Officer since September 1, 2005. Mr. Bartolacci was elected to the Board of Directors on November 15,2005. He had been President, Casket Division since February 2004 and Executive Vice President of Matthews since January 1,2004. He had been President, Matthews Europe since April 2002, and had also been President, Caggiati, S.p.A. (a wholly-owned subsidiary of Matthews International Corporation) since June 1999. Prior thereto, he was General Counsel of Matthews.
David F. Beck was appointed Controller effective September 15, 2003. He had been Vice President, Finance for theCompany’s Casket segment since December 2001. Prior thereto, he held various financial positions as an officer with TheYork Group, Inc.
■ 14 ■

Martin J. Beck was appointed President, Brand Solutions effective August 2005. He joined the Company in July 2004 asPresident and Chief Executive Officer of The Cloverleaf Group, Inc. (a wholly-owned subsidiary of Matthews InternationalCorporation). Mr. Beck served as President and Chief Executive Officer of Big Red Rooster, Inc., a marketing servicescompany, from its founding in September 2002 until its acquisition as part of The Cloverleaf Group, Inc., by Matthews inJuly 2004. Prior thereto, he served as President and Chief Executive Officer of Ten Worldwide from January 2001 to May2002, and of Lighthouse Global Network from January 2000 to December 2000, both of which were integrated marketingservices companies.
David J. DeCarlo, a Director of the Company since 1987, was appointed Vice Chairman effective September 1, 2005.Mr. DeCarlo had been Group President, Bronze and Casket Divisions since February 2004 and prior thereto had beenPresident, Bronze Division since November 1993.
Brian J. Dunn was appointed President, Marking Products Division in 2002. Prior thereto, he was President, MarkingProducts, North America.
David H. Hewitt joined the Company in February 2005 as President, Bronze Division. From 2000 to 2005, Mr. Hewittserved in various executive positions with General Binding Corporation, a designer and manufacturer of branded binding,laminating and office equipment.
Steven F. Nicola was appointed Chief Financial Officer, Secretary and Treasurer effective December 1, 2003. Prior thereto,he was Vice President, Accounting and Finance since December 2001. He had been Controller of the Company sinceDecember 1995.
Harry A. Pontone joined the Company in July 2005 as President, Casket Division upon Matthews’s acquisition of MilsoIndustries, a casket manufacturer and distributor. Mr. Pontone served as President of Milso Industries for more than fiveyears prior to its acquisition by Matthews.
Paul F. Rahill has been President, Cremation Division since October 2002. He performed independent consulting servicesfrom April 2000 until October 2002.
Franz J. Schwarz was named President, Graphics Europe in May 2006. He has been Managing Director of MatthewsInternational GmbH (a wholly-owned subsidiary of Matthews International Corporation) since 2000. He was a partial ownerof S+T Gesellschaft fur Reprotechnik GmbH (“S+T GmbH”), a provider of printing plates and print services located in Jülich,Germany, until September 30, 2005. Matthews International GmbH owns an 80% interest in S+T GmbH as of September 30, 2006.
Brian E. Tottman was appointed Managing Director, Packaging Graphics U.K. and U.S. in June 2006. He joined theCompany in August 2004 upon Matthews’s acquisition of The InTouch Group Limited, a provider of reprographic servicesto the packaging industry in the United Kingdom. Mr. Tottman served as an executive officer of The InTouch Group Limitedfor more than five years prior to its acquisition by Matthews.
■ 15 ■
OFFICERS AND EXECUTIVE MANAGEMENT OF THE REGISTRANT (continued)

PART II
ITEM 5. MARKET FOR REGISTRANT’S COMMON EQUITYAND RELATED STOCKHOLDER MATTERS.
(a) Market Information:
The authorized common stock of the Company consists of 70,000,000 shares of Class A Common Stock, $1 par value.The Company’s Class A Common Stock is traded on the NASDAQ National Market System under the symbol “MATW”.The following table sets forth the high, low and closing prices as reported by NASDAQ for the periods indicated:
High Low Close
Fiscal 2006:
Quarter ended: September 30, 2006 $38.25 $31.02 $36.79June 30, 2006 38.32 33.21 34.47 March 31, 2006 39.98 35.03 38.26December 31, 2005 40.49 34.25 36.41
Fiscal 2005:Quarter ended: September 30, 2005 $41.86 $36.13 $37.80
June 30, 2005 39.50 31.54 38.96 March 31, 2005 38.48 31.78 32.76December 31, 2004 38.38 31.36 36.80
The Company has a stock repurchase program, which was initiated in 1996. Under the program, the Company’s Board ofDirectors has authorized the repurchase of a total of 10,000,000 shares of Matthews’ common stock, of which 9,135,146shares have been repurchased as of September 30, 2006. The buy-back program is designed to increase shareholder value,enlarge the Company’s holdings of its common stock, and add to earnings per share. Repurchased shares may be retainedin treasury, utilized for acquisitions, or reissued to employees or other purchasers, subject to the restrictions of the Company’sRestated Articles of Incorporation.
All purchases of the Company’s common stock during fiscal 2006 were part of this repurchase program.
■ 16 ■

The following table shows the monthly fiscal 2006 stock repurchase activity:Maximum
Total number of shares number of shares purchased as part that may yet be
Total number of Average price of a publicly purchased underPeriod shares purchased paid per share announced plan the plan
October 2005 — $ — — 1,378,604November 2005 — — — 1,378,604December 2005 — — — 1,378,604January 2006 1,000 36.44 1,000 1,377,604February 2006 — — — 1,377,604March 2006 — — — 1,377,604April 2006 — — — 1,377,604May 2006 — — — 1,377,604June 2006 54,300 33.96 54,300 1,323,304July 2006 187,050 33.69 187,050 1,136,254August 2006 209,500 35.63 209,500 926,754September 2006 61,900 35.66 61,900 864,854
Total 513,750 $34.75 513,750
(b) Holders:
Based on records available to the Company, the number of registered holders of the Company’s common stock was 496at November 30, 2006.
(c) Dividends:
A quarterly dividend of $.055 per share was paid for the fourth quarter of fiscal 2006 to shareholders of record on October 31,2006. The Company paid quarterly dividends of $.05 per share for the first three quarters of fiscal 2006 and the fourth quarterof fiscal 2005. The Company paid quarterly dividends of $.045 per share for the first three quarters of fiscal 2005.
Cash dividends have been paid on common shares in every year for at least the past forty years. It is the present intentionof the Company to continue to pay quarterly cash dividends on its common stock. However, there is no assurance thatdividends will be declared and paid as the declaration and payment of dividends is at the discretion of the Board of Directorsof the Company and is dependent upon the Company’s financial condition, results of operations, cash requirements, futureprospects and other factors deemed relevant by the Board.
■ 17 ■
ITEM 5. MARKET FOR REGISTRANT’S COMMON EQUITY AND RELATED STOCKHOLDER MATTERS (continued)

ITEM 6. SELECTED FINANCIAL DATA.
Prior year amounts contained in this table have been restated for the retrospective adoption of Statement of FinancialAccounting Standards (“SFAS”) No. 123 (revised 2004) (“SFAS No. 123 (R)”) (“Share-Based Payment”). See Note 8 of theNotes to Consolidated Financial Statements.
Years Ended September 30,
20061 2005 2004 20032 20023
(Amounts in thousands, except per share data)(Not Covered by Report of Independent Registered Public Accounting Firm)
Net sales $715,891 $639,822 $508,801 $458,865 $428,086
Gross profit 271,933 223,075 193,754 170,302 160,364
Operating profit 113,884 98,413 95,078 77,816 65,921
Interest expense 6,995 2,966 1,998 2,852 4,171
Income before income taxesand change in accounting 105,408 93,056 89,117 71,086 60,192
Income taxes 38,964 34,985 34,584 27,582 23,346
Income before change in accounting 66,444 58,071 54,533 43,504 36,846
Cumulative effect of change inaccounting, net of tax — — — — (3,226)
Net income $ 66,444 $ 58,071 $ 54,533 $ 43,504 $ 33,620
Earnings per common share:Diluted, before change
in accounting $2.06 $1.79 $1.68 $1.35 $1.16Diluted 2.06 1.79 1.68 1.35 1.06Basic 2.08 1.81 1.69 1.37 1.09
Weighted-average commonshares outstanding:Basic 31,999 32,116 32,217 31,686 30,765Diluted 32,252 32,381 32,542 32,147 31,644
Cash dividends per share $.205 $.185 $.165 $.123 $.106
Total assets $716,090 $665,455 $533,432 $443,294 $426,162
Long-term debt, non-current 120,289 118,952 54,389 57,023 96,487
1 Fiscal 2006 included a net pre-tax gain of $1,016 which consisted of a pre-tax gain of $2,670 from the sale of a facility and a pre-tax charge ofapproximately $1,654 related to asset impairments and related costs.
2 Fiscal 2003 included a net pre-tax charge of approximately $1,000 which consisted of a pre-tax gain of $2,600 on the sale of a facility and a goodwillimpairment charge of $3,600.
3 In fiscal 2002, the Company recorded a pre-tax charge of $5,255 for transitional goodwill impairment as a result of the adoption of SFAS No. 142,“Goodwill and Other Intangible Assets.”
■ 18 ■

ITEM 7. MANAGEMENT’S DISCUSSION AND ANALYSIS OF FINANCIAL CONDITIONAND RESULTS OF OPERATIONS.
The following discussion should be read in conjunction with the consolidated financial statements of Matthews InternationalCorporation and related notes thereto. In addition, see “Cautionary Statement Regarding Forward-Looking Information”included in Part I of this Annual Report on Form 10-K.
RESULTS OF OPERATIONS:
The following table sets forth certain income statement data of the Company expressed as a percentage of net sales forthe periods indicated and the percentage change in such income statement data from year to year. Prior year amountscontained in this table and the following discussion have been restated for the retrospective adoption of Statement ofFinancial Accounting Standards (“SFAS”) No. 123 (revised 2004) (“SFAS No. 123 (R)”) (“Share-Based Payment”). See Note8 of the Notes to Consolidated Financial Statements.
Years EndedSeptember 30, Percentage Change
2006 – 2005 –2006 2005 2004 2005 2004
Sales 100.0% 100.0% 100.0% 11.9% 25.8%Gross profit 38.0 34.9 38.1 21.9 15.1Operating profit 15.9 15.4 18.7 15.7 3.5Income before taxes 14.7 14.5 17.5 13.3 4.4Net income 9.3 9.1 10.7 14.4 6.5
Comparison of Fiscal 2006 and Fiscal 2005:
Sales for the year ended September 30, 2006 were $715.9 million and were $76.1 million, or 11.9%, higher than salesof $639.8 million for the year ended September 30, 2005. The increase resulted principally from the acquisition of MilsoIndustries Corporation (“Milso”) in July 2005, and higher sales in the Cremation, Marking Products and Bronze segments.These increases were partially offset by the effect of lower sales in the Merchandising Solutions segment and lower foreigncurrency values against the U.S. dollar. Bronze segment sales for fiscal 2006 were $218.0 million, compared to $205.7million for fiscal 2005. The higher level of Bronze segment sales principally reflected an increase in memorial sales (whichincluded price surcharges related to increases in the cost of bronze ingot) and higher mausoleum sales. Sales for the Casketsegment were $201.0 million for fiscal 2006, compared to $135.5 million for fiscal 2005. The increase reflected theacquisition of Milso. Excluding Milso, fiscal 2006 sales volume was lower than fiscal 2005, partially attributable to thetransition to Company-owned distribution in certain territories and a lower death rate for the year. Sales for the Cremationsegment were $26.0 million for the year ended September 30, 2006, compared to $21.5 million for fiscal 2005. Theincrease primarily reflected higher sales of cremation equipment and cremation caskets. Sales for the Graphics Imagingsegment in fiscal 2006 were $140.9 million, compared to $143.2 million in fiscal 2005. The decrease primarily reflecteda lower value of the Euro against the U.S. dollar and a decline in volume in certain German markets. Marking Productssegment sales for the year ended September 30, 2006 were $52.3 million, compared to $45.7 million for the year endedSeptember 30, 2005. The increase of $6.6 million was principally due to higher worldwide ink-jet coating business anddomestic sales volume, particularly in the segment’s industrial automation business. Sales for the Merchandising Solutionssegment were $77.8 million for fiscal 2006, compared to $88.3 million for fiscal 2005. The decline is attributable to lowersales of merchandising systems and displays. Additionally, fiscal 2005 included sales for several promotional programs thatdid not repeat in fiscal 2006. Lower foreign currency values against the U.S. dollar had an unfavorable impact of approximately$2.6 million on the Company’s consolidated sales compared to the prior year.
■ 19 ■

Gross profit for the year ended September 30, 2006 was $271.9 million, compared to $223.1 million for the year endedSeptember 30, 2005. The increase in consolidated gross profit primarily reflected the Milso acquisition, higher sales in theCremation, Marking Products and Bronze segments and the effects of manufacturing improvements and cost reductioninitiatives. These gains were partially offset by lower Casket segment sales excluding Milso and lower sales in theMerchandising Solutions segment. Consolidated gross profit as a percent of sales increased from 34.9% for fiscal 2005 to38.0% for fiscal 2006. The gross margin percentage improvement principally related to the acquisition of Milso and thetransition to Company-owned casket distribution in certain territories formerly served through independent distribution.Sales through Company-owned distribution generally result in higher gross margin and selling and administrative costs asa percent of sales compared to sales through independent distribution. Gross margin percentages also improved in theCremation, Graphics Imaging, Marking Products and Merchandising Solutions segments. These increases were partiallyoffset by a decline in Bronze segment gross margin, reflecting the significant rise in bronze ingot cost.
Selling and administrative expenses for the year ended September 30, 2006 were $158.0 million, compared to $124.7million for fiscal 2005. The increase primarily reflected the acquisition of Milso, the expansion of the Casket segment’sdistribution capabilities and a charge of $1.7 million in the Casket segment for the impairment of redundant assets andrelated costs. These increases were partially offset by a decrease in Bronze segment selling and administrative costs due tocost containment efforts intended to mitigate some of the increase in bronze metal cost, a reduction in MerchandisingSolutions segment costs reflecting the effects of the segment’s facilities consolidation program and a gain of $2.7 millionon the sale of a Bronze segment facility. Consolidated selling and administrative expenses as a percent of sales were 22.1%for the year ended September 30, 2006, compared to 19.5% for fiscal 2005. The increase reflected the acquisition ofMilso, the expansion of the Casket segment’s casket distribution capabilities and the impairment charge, partially offsetby the gain on the sale of the Bronze facility.
Operating profit for fiscal 2006 was $113.9 million, representing an increase of $15.5 million over operating profit of $98.4 millionfor the year ended September 30, 2005. Bronze segment operating profit for fiscal 2006 was $65.0 million, comparedto $59.7 million for the year ended September 30, 2005. The increase reflected higher sales and cost reduction initiatives.In addition, the segment’s fiscal 2006 operating profit included a gain of $2.7 million on the sale of a facility. Operatingprofit for the Casket segment for the year ended September 30, 2006 was $17.0 million, compared to $12.6 million forfiscal 2005. The increase primarily reflected the Milso acquisition, partially offset primarily by lower sales in several territoriesand a fourth quarter 2006 charge of $1.7 million for the impairment of redundant assets and related costs. Cremationsegment operating profit was $3.4 million for fiscal 2006, compared to $701,000 for fiscal 2005. The increase primarilyreflected higher sales of cremation equipment and caskets, improved pricing and cost reduction initiatives. GraphicsImaging operating profit for the year ended September 30, 2006 was $16.6 million, compared to $14.9 million for theyear ended September 30, 2005. The increase primarily reflected the effects of cost structure initiatives implemented in thesegment’s U.S. and U.K. operations in the fourth quarter of fiscal 2005, partially offset by lower foreign currency valuesagainst the U.S. dollar. Operating profit for the Marking Products segment for fiscal 2006 was $9.1 million, compared to$7.4 million for fiscal 2005. The increase resulted from the benefit of higher sales. Merchandising Solutions segmentoperating profit for the year ended September 30, 2006 was $2.9 million, compared to $3.1 million for fiscal 2005. Thedecrease primarily reflected lower sales volume. However, Merchandising Solutions operating margin as a percent of salesimproved during the second six months of fiscal 2006, reflecting the effects of the facilities consolidation program andother cost reduction initiatives.
Investment income for the year ended September 30, 2006 was $1.4 million, compared to $1.7 million for fiscal 2005.The decrease from the prior year primarily reflected lower levels of invested cash.
■ 20 ■
ITEM 7. MANAGEMENT’S DISCUSSION AND ANALYSIS (continued)

Interest expense for the year ended September 30, 2006 was $7.0 million, compared to $3.0 million for the prior year.The increase in interest expense primarily reflected higher borrowings under the Company’s domestic Revolving CreditFacility (see “Liquidity and Capital Resources”) and higher interest rates during fiscal 2006. Other income (deductions),net, for the year ended September 30, 2006 represented an increase in pre-tax income of $70,000, compared to an increasein pre-tax income of $1.7 million for fiscal 2005. Other income in fiscal 2005 primarily reflected foreign currency exchangegains on intercompany advances to foreign affiliates. Minority interest deduction for fiscal 2006 was $3.0 million, comparedto $5.8 million for fiscal 2005. The lower minority interest deduction for fiscal 2006 resulted principally from the Company’sacquisition of an additional 30% interest in S+T Gesellschaft fur Reprotechnik GmbH (“S+T”) on September 30, 2005.
The Company’s effective tax rate for the year ended September 30, 2006 was 37.0% compared to 37.6% for fiscal 2005.The decrease in the effective tax rate resulted primarily from the favorable tax impact of the sale of a Bronze facility. Thedifference between the Company’s effective tax rate and the Federal statutory rate of 35% primarily reflected the impactof state and foreign income taxes.
Comparison of Fiscal 2005 and Fiscal 2004:
Sales for the year ended September 30, 2005 were $639.8 million and were $131.0 million, or 25.8%, higher than salesof $508.8 million for the year ended September 30, 2004. The increase resulted principally from acquisitions, which includedMilso during the fourth quarter of fiscal 2005 and a full twelve months of activity for The Cloverleaf Group, Inc. (“Cloverleaf”),The InTouch Group, Limited (“InTouch”) and Holjeron Corporation (“Holjeron”), which were acquired during the fourthquarter of fiscal 2004. In addition, higher foreign currency values against the U.S. dollar had a favorable impact ofapproximately $5.9 million on the Company’s consolidated sales compared to the prior year. Bronze segment sales for theyear ended September 30, 2005 were $205.7 million, compared to $197.4 million for fiscal 2004. The higher level of Bronzesegment sales principally reflected higher memorial sales (which included price surcharges related to increases in the costof bronze ingot) and the favorable impact of increases in the values of foreign currencies against the U.S. dollar. Theseincreases were offset partially by a decline in mausoleum sales. Sales for the Casket segment were $135.5 million for fiscal2005, compared to $116.6 million for fiscal 2004. The increase primarily reflected the acquisition of Milso in July 2005.Sales for the Cremation segment were $21.5 million for fiscal 2005, compared to $22.5 million for the year ended September30, 2004. The decrease primarily reflected a decline in volume of cremation caskets. Sales for the Graphics Imaging segmentin fiscal 2005 were $143.2 million, compared to $113.2 million in fiscal 2004. The increase primarily reflected the acquisitionof InTouch and an increase in the value of the Euro against the U.S. dollar. Marking Products segment sales for fiscal 2005were $45.7 million, compared to $38.0 million for the year ended September 30, 2004. The increase of $7.7 million wasprincipally due to the acquisition of Holjeron, higher sales volume, and the increase in value of the Swedish Krona againstthe U.S. dollar. Sales for the Merchandising Solutions segment were $88.3 million for the year ended September 30, 2005,compared to $21.1 million for fiscal 2004 (acquired in July 2004).
Gross profit for the year ended September 30, 2005 was $223.1 million, compared to $193.8 million for the year endedSeptember 30, 2004. Consolidated gross profit as a percent of sales decreased from 38.1% for fiscal 2004 to 34.9% forfiscal 2005. The increase in consolidated gross profit primarily reflected the Milso acquisition completed in the fourthquarter of fiscal 2005, the full year impact of the acquisions of Cloverleaf, InTouch and Holjeron during the fourth quarterof fiscal 2004, the effects of manufacturing improvements and cost reduction initiatives in several of the Company’ssegments, and higher foreign exchange values against the U.S. dollar. These gains were partially offset by lower sales inthe Cremation segment, higher costs for bronze ingot and steel, and costs incurred in connection with the establishmentof a casket manufacturing facility in Mexico. The gross margin percentage decline principally related to the factors discussedabove, as well as the inclusion of a full year of results for Cloverleaf, which generally has lower gross margins than otherMatthews’ businesses.
■ 21 ■
ITEM 7. MANAGEMENT’S DISCUSSION AND ANALYSIS (continued)

Selling and administrative expenses for fiscal 2005 were $124.7 million, compared to $98.7 million for the year endedSeptember 30, 2004. The increase resulted primarily from the aforementioned acquisitions. Consolidated selling andadministrative expenses as a percent of sales were 19.5% for the year ended September 30, 2005, compared to 19.4% forfiscal 2004. The increase reflected the July 2005 acquisition of Milso. As a distributor of caskets, Milso has higher sellingand administrative expenses as a percentage of sales than other Matthews’ businesses. This increase was partially offsetby cost controls in the Bronze segment and the July 2004 acquisition of Cloverleaf, which generally has lower selling andadministrative expenses as a percentage of sales than most of Matthews’ other businesses.
Operating profit for the year ended September 30, 2005 was $98.4 million, representing an increase of $3.3 million overoperating profit of $95.1 million for fiscal 2004. Higher foreign currency values against the U.S. dollar had a favorableimpact of approximately $1.5 million on the Company’s consolidated operating profit for the year ended September 30,2005 compared to fiscal 2004. Bronze segment operating profit for fiscal 2005 was $59.7 million, compared to $53.1million for fiscal 2004. The increase reflected higher sales, cost reduction initiatives and the favorable impact of the increasein the value of foreign currencies against the U.S. dollar. In addition, the segment’s operating profit during the prior yearincluded one-time severance costs related to personnel reductions. Operating profit for the Casket segment for the yearended September 30, 2005 was $12.6 million, compared to $14.0 million for the year ended September 30, 2004. Thedecrease primarily reflected the higher cost of steel and costs incurred in connection with the establishment of a casketmanufacturing facility in Mexico. Fiscal 2005 expenses related to the Mexico project approximated $3.7 million. Thesefactors were partially offset by higher sales and operating efficiencies realized in connection with productivity initiatives.Cremation segment operating profit was $701,000 for fiscal 2005, compared to $1.3 million for fiscal 2004. The decreaseprimarily reflected lower sales volume and higher raw material costs. The Company estimates that for 2005, the aggregatenegative impact on consolidated operating profit of increases in the cost of steel and bronze, net of the bronze pricesurcharges, approximated $2.9 million compared to fiscal 2004. Graphics Imaging operating profit for fiscal 2005 was$14.9 million, compared to $18.8 million for the year ended September 30, 2004. The segment’s decrease in operatingprofit reflected lower margins in North America and several European graphics businesses and investments during fiscal2005 in developing new domestic accounts. Operating profit for the Marking Products segment for fiscal 2005 was $7.4 million,compared to $6.4 million for the year ended September 30, 2004. The increase resulted from the acquisition of Holjeron,the benefit of higher sales, and the increase in value of the Swedish Krona against the U.S. dollar. These gains were partiallyoffset by an increase in new product development costs. The Merchandising Solutions segment contributed $3.1 millionof operating profit during fiscal 2005, compared to $1.5 million for fiscal 2004 (acquired in July 2004).
Investment income for the year ended September 30, 2005 was $1.7 million, compared to $1.6 million for the prior year.The increase from the prior year primarily reflected higher rates of return on invested cash.
Interest expense for the year ended September 30, 2005 was $3.0 million, compared to $2.0 million for the prior year.The increase in interest expense primarily reflected new borrowings under the Company’s domestic Revolving Credit Facility(see “Liquidity and Capital Resources”). Other income (deductions), net, for the year ended September 30, 2005represented an increase in pre-tax income of $1.7 million, compared to a reduction in pre-tax income of $57,000 for fiscal2004. Other income in fiscal 2005 primarily reflected foreign currency exchange gains on intercompany advances to foreignaffiliates. Minority interest deduction for fiscal 2005 was $5.8 million, compared to $5.5 million for the prior year. Thehigher minority interest deduction for fiscal 2005 resulted principally from an increase in operating income in several ofthe Company’s less than wholly-owned European Graphics Imaging businesses.
The Company’s effective tax rate for the year ended September 30, 2005 was 37.6% compared to 38.8% for fiscal 2004.The decrease in the effective tax rate resulted primarily from lower state and foreign taxes. The difference between theCompany’s effective tax rate and the Federal statutory rate of 35% primarily reflected the impact of state and foreignincome taxes.
■ 22 ■
ITEM 7. MANAGEMENT’S DISCUSSION AND ANALYSIS (continued)

LIQUIDITY AND CAPITAL RESOURCES:
Net cash provided by operating activities was $66.1 million for the year ended September 30, 2006, compared to $70.3million and $82.3 million for fiscal 2005 and 2004, respectively. Operating cash flow for fiscal 2006 primarily reflectednet income adjusted for depreciation and amortization, stock-based compensation expense and an increase in minorityinterest, partially offset by an increase in working capital. The year-over-year decline in cash provided by operating activitiesis attributable to an increase in working capital primarily resulting from higher levels of accounts receivable and inventorieswith the Casket segment’s expansion of its distribution capabilities. Operating cash flow for fiscal 2005 primarily reflectednet income adjusted for depreciation and amortization, stock-based compensation expense and an increase in minorityinterest, partially offset by an increase in working capital, primarily accounts receivable and inventory. Operating cash flowfor fiscal 2004 primarily reflected net income adjusted for depreciation and amortization, stock-based compensationexpense, an increase in minority interest and a $1.5 million cash contribution to the Company’s principal pension plan.
Cash used in investing activities was $48.8 million for the year ended September 30, 2006, compared to $139.0 million and$82.8 million for fiscal years 2005 and 2004, respectively. Investing activities for fiscal 2006 primarily reflected payments (netof cash acquired) of $32.3 million for acquisitions, capital expenditures of $19.4 million, and proceeds of $3.1 million from thesale of assets. Investing activities for fiscal 2005 primarily reflected payments (net of cash acquired) of $109.4 million foracquisitions, capital expenditures of $28.1 million, net purchases of investments of $2.6 million and proceeds of $1.1 millionfrom the sale of assets. Investing activities for fiscal 2004 primarily included payments (net of cash acquired) of $74.5 millionfor acquisitions and capital expenditures of $10.4 million. See “Acquisitions” for further discussion of the Company’s acquisitions.
Capital expenditures were $19.4 million for the year ended September 30, 2006, compared to $28.1 million and $10.4million for fiscal 2005 and 2004, respectively. The increase in capital spending in fiscal 2005 reflected the capitalexpenditures made in connection with establishment of the casket manufacturing facility in Mexico and the acquisition ofproduction facilities for the Merchandising Solutions segment and a European graphics business. Capital expenditures ineach of the last three fiscal years reflected reinvestment in the Company’s business segments and were made primarily forthe purchase of new manufacturing machinery, equipment and facilities designed to improve product quality, increasemanufacturing efficiency, lower production costs and meet regulatory requirements. Capital expenditures for the last threefiscal years were primarily financed through operating cash. Capital spending for property, plant and equipment hasaveraged $19.3 million for the last three fiscal years. The capital budget for fiscal 2007 is $27.1 million. The Companyexpects to generate sufficient cash from operations to fund all anticipated capital spending projects.
Cash used in financing activities for the year ended September 30, 2006 was $28.8 million, reflecting net repayments oflong-term debt of $2.1 million, treasury stock purchases of $17.5 million, proceeds of $2.0 million from the sale of treasurystock (stock option exercises), a tax benefit of $902,000 from exercised stock options, dividends of $6.6 million ($0.205 pershare) to the Company’s shareholders and distributions of $5.5 million to minority interests. Cash provided by financingactivities for the year ended September 30, 2005 was $45.4 million, reflecting proceeds, net of repayments, from long-term debt of $75.7 million, treasury stock purchases of $27.9 million, proceeds of $5.9 million from the sale of treasury stock(stock option exercises), a tax benefit of $3.1 million from exercised stock options, dividends of $5.9 million ($0.185 pershare) to the Company’s shareholders and distributions of $5.5 million to minority interests. Cash used in financing activitiesfor the year ended September 30, 2004 was $2.2 million, reflecting proceeds, net of repayments, from long-term debt of$6.4 million, treasury stock purchases of $14.9 million, proceeds of $10.6 million from the sale of treasury stock (stockoption exercises), a tax benefit of $4.5 million from exercised stock options, dividends of $5.3 million ($0.165 per share)to the Company’s shareholders and distributions of $3.5 million to minority interests.
■ 23 ■
ITEM 7. MANAGEMENT’S DISCUSSION AND ANALYSIS (continued)

The Company has a domestic Revolving Credit Facility with a syndicate of financial institutions. In February 2005, thefacility, which was originally in the amount of $125.0 million, was amended to increase the borrowing capacity to $150.0million. Borrowings under the amended facility, which is scheduled to mature on April 30, 2009, bear interest at LIBORplus a factor ranging from .50% to 1.00% based on the Company’s leverage ratio. The leverage ratio is defined as netindebtedness divided by EBITDA (earnings before interest, taxes, depreciation and amortization). The Company is requiredto pay an annual commitment fee ranging from .20% to .30% (based on the Company’s leverage ratio) of the unusedportion of the facility. The Revolving Credit Facility, as amended, requires the Company to maintain certain leverage andinterest coverage ratios. A portion of the facility (not to exceed $10.0 million) is available for the issuance of trade andstandby letters of credit. Outstanding borrowings on the Revolving Credit Facility at September 30, 2006 were $123.2million. The weighted-average interest rate on outstanding borrowings at September 30, 2006 and 2005 was 4.88% and3.80%, respectively.
In April 2004, the Company entered into an interest rate swap that fixed, for a five year period, the interest rate onborrowings in an initial amount of $50.0 million. The interest rate was fixed at 2.66% plus a factor based on the Company’sleverage ratio (the factor was .50% at September 30, 2006). The interest rate swap was designated as a cash flow hedgeof the future variable interest payments under the Revolving Credit Facility which are considered probable of occurring.Based on the Company’s assessment, all of the critical terms of the hedge matched the underlying terms of the hedged debtand related forecasted interest payments and as such, these hedges were considered highly effective. Equal quarterlypayments of $2.5 million plus interest are due on this $50.0 million borrowing until its maturity in April 2009.
In July 2005, the Company increased its outstanding borrowings under the facility. The additional borrowings were usedto complete the acquisition of Milso. Effective September 30, 2005, the Company entered into an additional interest rateswap that fixed, for the period through the maturity of the Revolving Credit Facility, the interest rate on additionalborrowings in an initial amount of $50.0 million. The interest rate was fixed at 4.14% plus a factor based on the Company’sleverage ratio (the factor was .50% at September 30, 2006). The interest rate swap was designated as a cash flow hedgeof the future variable interest payments under the Revolving Credit Facility which are considered probable of occurring.Based on the Company’s assessment, all of the critical terms of the hedge match the underlying terms of the hedged debtand related forecasted interest payments and as such, these hedges were considered highly effective. Equal quarterlypayments of $3.3 million plus interest are due on this $50.0 million borrowing until its maturity in April 2009.
The fair value of the interest rate swaps reflected an unrealized gain of $1.5 million ($918,000 after tax) at September 30,2006 that is included in equity as part of accumulated other comprehensive income. Assuming market rates remainconstant with the rates at September 30, 2006, approximately $356,000 of the $918,000 gain included in accumulatedother comprehensive income is expected to be recognized in earnings as an adjustment to interest expense over the nexttwelve months.
The Company, through its wholly-owned subsidiary, Matthews International GmbH (“MIGmbH”), has a credit facility withNational Westminster Bank Plc for borrowings up to 10.0 million Euros. At September 30, 2006, outstanding borrowingsunder the credit facility totaled 8.5 million Euros ($10.8 million). The weighted-average interest rate on outstandingMIGmbH related borrowings at September 30, 2006 and 2005 was 3.69% and 2.66%, respectively.
The Company, through its wholly-owned subsidiary, Caggiati S.p.A., has several loans with various Italian banks. Outstandingborrowings on these loans totaled 8.0 million Euros ($10.2 million) at September 30, 2006. Caggiati S.p.A. also has threelines of credit totaling approximately 8.4 million Euros ($10.6 million) with the same Italian banks. Outstanding borrowingson these lines were 2.4 million Euros ($3.0 million) at September 30, 2006. The weighted-average interest rate onoutstanding Caggiati S.p.A. related borrowings at September 30, 2006 and 2005 was 3.17% and 2.81%, respectively.
■ 24 ■
ITEM 7. MANAGEMENT’S DISCUSSION AND ANALYSIS (continued)

The Company has a stock repurchase program, which was initiated in 1996. As of September 30, 2006, the Company’sBoard of Directors had authorized the repurchase of a total of 10,000,000 shares of Matthews’ common stock under theprogram, of which 9,135,146 shares had been repurchased as of September 30, 2006. The buy-back program is designedto increase shareholder value, enlarge the Company’s holdings of its common stock, and add to earnings per share.Repurchased shares may be retained in treasury, utilized for acquisitions, or reissued to employees or other purchasers,subject to the restrictions of the Company’s Restated Articles of Incorporation.
Consolidated working capital of the Company was $105.6 million at September 30, 2006, compared to $86.6 million and$90.9 million at September 30, 2005 and 2004, respectively. Working capital at September 30, 2006 reflected higherlevels of accounts receivable and inventories resulting primarily from the Casket segment’s expansion of its distributioncapabilities. Working capital at September 30, 2005 reflected higher levels of accounts receivable and inventories, primarilydue to the Milso acquisition, an increase in current maturities of debt, and higher levels of current liabilities, also primarilythe result of the Milso acquisition. Cash and cash equivalents were $29.7 million at September 30, 2006, compared to$39.6 million and $65.8 million at September 30, 2005 and 2004, respectively. The Company’s current ratio at September30, 2006 was 1.8, compared to 1.6 and 1.8 at September 30, 2005 and 2004, respectively.
ENVIRONMENTAL MATTERS:
The Company’s operations are subject to various federal, state and local laws and regulations relating to the protection ofthe environment. These laws and regulations impose limitations on the discharge of materials into the environment andrequire the Company to obtain and operate in compliance with conditions of permits and other government authorizations.As such, the Company has developed environmental, health, and safety policies and procedures that include the properhandling, storage and disposal of hazardous materials.
The Company is party to various environmental matters. These include obligations to investigate and mitigate the effectson the environment of the disposal of certain materials at various operating and non-operating sites. The Company iscurrently performing environmental assessments and remediation at these sites, as appropriate. In addition, prior to itsacquisition, The York Group, Inc. (“York”) was identified, along with others, by the Environmental Protection Agency as apotentially responsible party for remediation of a landfill site in York, Pennsylvania. At this time, the Company has notbeen joined in any lawsuit or administrative order related to the site or its clean-up.
At September 30, 2006, an accrual of approximately $10.0 million had been recorded for environmental remediation (ofwhich $925,000 was classified in other current liabilities), representing management’s best estimate of the probable andreasonably estimable costs of the Company’s known remediation obligations. The accrual, which reflects previouslyestablished reserves assumed with the acquisition of York and additional reserves recorded as a purchase accountingadjustment, does not consider the effects of inflation and anticipated expenditures are not discounted to their presentvalue. Changes in the accrued environmental remediation obligation from the prior fiscal year reflects payments chargedagainst the accrual. While final resolution of these contingencies could result in costs different than current accruals,management believes the ultimate outcome will not have a significant effect on the Company’s consolidated results ofoperations or financial position.
■ 25 ■
ITEM 7. MANAGEMENT’S DISCUSSION AND ANALYSIS (continued)

ACQUISITIONS:
Fiscal 2006:
Acquisition spending, net of cash acquired, during the year ended September 30, 2006 totaled $32.3 million, and primarilyincluded the following:
On March 1, 2006, the Company acquired Royal Casket Company, a distributor of primarily York brand caskets in theSouthwest region of the United States. The transaction was structured as an asset purchase, with potential additionalconsideration payable contingent upon the operating performance of the acquired operations during the next fiveyears. The Company expects to account for this consideration as additional purchase price. The acquisition wasintended to expand Matthews’ casket distribution capabilities in the Southwestern United States.
On February 23, 2006, the Company acquired The Doyle Group, a provider of reprographic services to the packagingindustry, located in Oakland, California. The transaction was structured as an asset purchase, with potential additionalconsideration payable contingent upon the operating performance of the acquired operations during the next threeyears. The Company expects to account for this consideration as additional purchase price. The acquisition wasintended to expand the Company’s graphics business in the Western United States.
On September 30, 2005, the Company acquired an additional 30% interest in S+T which was paid in October 2005.The Company had acquired a 50% interest in S+T in 1998.
Fiscal 2005:
In July 2005, the Company acquired Milso, a leading manufacturer and marketer of caskets in the United States. Milso,headquartered in Brooklyn, New York, has manufacturing operations in Richmond, Indiana and maintains distributioncenters throughout the Northeast, Mid-Atlantic, Midwest and Southwest regions of the United States. The transactionwas structured as an asset purchase, at an initial purchase price of approximately $95.0 million. In connection with thecontingent consideration provisions of the acquisition agreement, the Company has agreed to pay additional purchaseconsideration of $7.0 million. The additional consideration, which will be paid in fiscal 2007, was recorded as additionalpurchase price as of September 30, 2006. The acquisition was intended to expand Matthews’ products and services inthe United States casket market.
In June 2005, the Company paid additional consideration of $6.0 million to the minority owner of Rudolf Reproflex GmbH underthe terms of the original acquisition agreement. The Company had acquired a 75% interest in Rudolf in 2001.
Fiscal 2004:
In August 2004, the Company acquired InTouch, a leading provider of reprographic services to the packaging industry inthe United Kingdom. InTouch is headquartered in Leeds, England and has operations in London, Portsmouth, Manchesterand Boston, Massachusetts. The transaction was structured as a stock purchase, at a cost of approximately $39.0 million.The acquisition was intended to further the Company’s position as a provider of reprographic services to the Europeanpackaging industry.
In July 2004, the Company acquired Cloverleaf, a provider of merchandising solutions. Cloverleaf was formed by themerger of iDL, Inc., a provider of merchandising systems and displays, headquartered near Pittsburgh, Pennsylvania, andBig Red Rooster, a marketing and design services organization located in Columbus, Ohio. The transaction was structuredas an asset purchase, at a cost of approximately $34.0 million. The transaction was structured to include potential additionalconsideration during the next six years contingent on the future growth in value of the acquired operations. The Company
■ 26 ■
ITEM 7. MANAGEMENT’S DISCUSSION AND ANALYSIS (continued)

expects to account for this additional consideration as additional purchase price. The acquisition was designed to expandthe Company’s products and services into the merchandising solutions market.
In July 2004, the Company acquired Holjeron, an industrial controls manufacturer located near Portland, Oregon. The acquisitionwas structured as a stock purchase. In February 2005, additional consideration was paid in accordance with the purchaseagreement. The acquisition was a part of Matthews’ strategy to increase its presence in the marking products industry.
Matthews has accounted for these acquisitions using the purchase method and, accordingly, recorded the acquired assetsand liabilities at their estimated fair values at the acquisition dates. The excess of the purchase price over the estimated fairvalue of the net assets acquired was recorded as goodwill.
FORWARD-LOOKING INFORMATION:
The Company’s objective with respect to operating performance is to increase annual earnings per share in the range of12% to 15% over the long term. For the past ten fiscal years, the Company has achieved an average annual increase inearnings per share of 16.3%.
Matthews has a three-pronged strategy to attain the annual growth rate objective, which has remained unchanged fromthe prior year. This strategy consists of the following: internal growth (which includes productivity improvements, newproduct development and the expansion into new markets with existing products), acquisitions and share repurchasesunder the Company’s stock repurchase program (see “Liquidity and Capital Resources”).
The significant factors impacting the Company’s fiscal 2006 results were the fiscal 2005 acquisition of Milso, a significantrise in bronze metal costs, continued work on the start-up of the Mexican casket plant, the transition to Company-ownedcasket distribution in certain territories and the facilities consolidation efforts in the Merchandising Solutions segment. TheCompany expects to continue to face several of these same issues in fiscal 2007. Bronze metal costs may remain high.The casket business will continue the transition to Company-owned distribution in certain territories in 2007, and as theproduction rate of the Mexican facility continues to increase, the Company will be further evaluating its casketmanufacturing capacity needs. Lastly, although the facilities consolidation in the Merchandising Solutions business issubstantially complete, as the segment is in the early stages of the improvements generated from this consolidation, theoperation is still expected to have some challenges.
Based on the Company’s growth strategy and factors discussed above, the Company currently expects to achieve fiscal2007 diluted earnings per share growth in the range of its long-term growth objective of 12% to 15% over fiscal 2006earnings per share. This earnings expectation excludes the net favorable impact of the gain on the sale of property and theimpairment of assets and related costs on the fiscal 2006 fourth quarter. In addition, this expectation does not includethe impact of any unusual items in fiscal 2007, such as any payouts that may be earned in fiscal 2007 under the Milsoacquisition-related agreements.
CRITICAL ACCOUNTING POLICIES:
The preparation of financial statements in conformity with generally accepted accounting principles requires managementto make estimates and assumptions that affect the reported amounts of assets and liabilities and disclosure of contingentassets and liabilities at the date of the financial statements and the reported amounts of revenues and expenses duringthe reporting period. Therefore, the determination of estimates requires the exercise of judgment based on variousassumptions and other factors such as historical experience, economic conditions, and in some cases, actuarial techniques.Actual results may differ from those estimates. A discussion of market risks affecting the Company can be found in Item7A, “Quantitative and Qualitative Disclosures about Market Risk,” of this Annual Report on Form 10-K.
■ 27 ■
ITEM 7. MANAGEMENT’S DISCUSSION AND ANALYSIS (continued)

The Company’s significant accounting policies are included in the Notes to Consolidated Financial Statements included inthis Annual Report on Form 10-K. Management believes that the application of these policies on a consistent basis enablesthe Company to provide useful and reliable financial information about the Company’s operating results and financialcondition. The following accounting policies involve significant estimates, which were considered critical to the preparationof the Company’s consolidated financial statements for the year ended September 30, 2006.
Allowance for Doubtful Accounts:
The allowance for doubtful accounts is based on an evaluation of specific customer accounts for which available facts andcircumstances indicate collectibility may be a problem. In addition, the allowance includes a reserve for all customers basedon historical collection experience.
Long-Lived Assets:
Property, plant and equipment, goodwill and other intangible assets are carried at cost. Depreciation on property, plant andequipment is computed primarily on the straight-line method over the estimated useful lives of the assets. Property, plantand equipment are reviewed for impairment whenever events or changes in circumstances indicate that the carrying amountof such assets may not be recoverable. Recoverability of assets is determined by comparing the estimated undiscountednet cash flows of the operations to which the assets relate. An impairment loss would be recognized when the carryingamount of the assets exceeds the estimated undiscounted net cash flows.
Goodwill is not amortized, but is subject to periodic review for impairment. In general, when the carrying value of areporting unit exceeds its implied fair value, an impairment loss must be recognized. For purposes of testing for impairment,the Company uses a combination of valuation techniques, including discounted cash flows. Intangible assets are amortizedover their estimated useful lives, unless such lives are considered to be indefinite. A significant decline in cash flowsgenerated from these assets may result in a write-down of the carrying values of the related assets. The Companyperformed its annual impairment reviews in the second quarters of fiscal 2006 and fiscal 2005 and determined that noadjustments to the carrying values of goodwill or other intangibles were necessary at those times.
Share-Based Payment:
Prior to October 1, 2005, the Company accounted for its stock-based compensation plan in accordance with the intrinsicvalue provisions of Accounting Principles Board Opinion No. 25, “Accounting for Stock Issued to Employees” and provided therequired pro-forma disclosures of SFAS No. 123, “Accounting for Stock-Based Compensation”. Effective October 1, 2005, theCompany adopted SFAS No. 123(R) using the modified retrospective method. Accordingly, stock-based compensation cost ismeasured at grant date, based on the fair value of the award, and is recognized as expense over the employee requisite serviceperiod. In accordance with SFAS No. 123(R), financial statements for all periods prior to October 1, 2005 have been adjustedto give effect to the fair-value method of accounting for all awards granted in fiscal years beginning after December 15, 1994.Amounts previously disclosed as pro-forma adjustments have been reflected in earnings for all prior periods.
Pension and Postretirement Benefits:
Pension assets and liabilities are determined on an actuarial basis and are affected by the market value of plan assets, estimatesof the expected return on plan assets and the discount rate used to determine the present value of benefit obligations.Actual changes in the fair market value of plan assets and differences between the actual return on plan assets, the expectedreturn on plan assets and changes in the selected discount rate will affect the amount of pension cost.
■ 28 ■
ITEM 7. MANAGEMENT’S DISCUSSION AND ANALYSIS (continued)

The Company’s principal pension plan maintains a substantial portion of its assets in equity securities in accordance withthe investment policy established by the Company’s pension board. Based on an analysis of the historical performance ofthe plan’s assets and consultation with its independent investment advisor, the Company has maintained the long-termrate of return assumption for these assets at 9.0% for purposes of determining pension cost and funded status underSFAS No. 87, “Employers’ Accounting for Pensions.” The Company’s discount rate assumption used in determining thepresent value of the projected benefit obligation is based upon published indices for long-term (10-year) high quality bondsas of its plan year-end date (July 31). The discount rate was 6.5%, 5.75% and 6.5% in fiscal 2006, 2005 and 2004,respectively, reflecting long-term bond rates in each of those periods.
Environmental Reserve:
Environmental liabilities are recorded when the Company’s obligation is probable and reasonably estimable. Accruals forlosses from environmental remediation obligations do not consider the effects of inflation, and anticipated expenditures arenot discounted to their present value.
Revenue Recognition:
Revenues are generally recognized when title and risk of loss pass to the customer, which is typically at the time of productshipment. For pre-need sales of memorials and vases, revenue is recognized when the memorial has been manufacturedto the customer’s specifications (e.g., name and birth date), title has been transferred to the customer and the memorialand vase are placed in storage for future delivery. A liability has been recorded in Estimated Finishing Costs for the estimatedcosts of finishing pre-need bronze memorials and vases that have been manufactured and placed in storage prior to July 1,2003 for future delivery.
In July 2003, the Emerging Issues Task Force (“EITF”) issued Issue No. 00-21 “Revenue Arrangements with MultipleDeliverables.” Issue No. 00-21 addresses certain aspects of the accounting by a vendor for arrangements under which itwill perform multiple revenue generating activities. The provisions of Issue No. 00-21 were effective July 1, 2003 and havebeen applied prospectively by the Company to the finishing and storage elements of its pre-need sales. Beginning July 1,2003, revenue is deferred by the Company on the portion of pre-need sales attributable to the final finishing and storageof the pre-need merchandise. Deferred revenue for final finishing is recognized at the time the pre-need merchandise isfinished and shipped to the customer. Deferred revenue related to storage is recognized on a straight-line basis over theestimated average time that pre-need merchandise is held in storage.
At September 30, 2006, the Company held 354,182 memorials and 248,104 vases in its storage facilities under the pre-need sales program.
Construction revenues are recognized under the percentage-of-completion method of accounting using the cost-to-costmethod. The Company offers rebates to certain customers participating in volume purchase programs. Rebates areestimated and recorded as a reduction in sales at the time the Company’s products are sold.
■ 29 ■
ITEM 7. MANAGEMENT’S DISCUSSION AND ANALYSIS (continued)

LONG-TERM CONTRACTUAL OBLIGATIONS AND COMMITMENTS:
The following table summarizes the Company’s contractual obligations at September 30, 2006, and the effect suchobligations are expected to have on its liquidity and cash flows in future periods.
Payments due in fiscal year:
Total 2007 2008 to 2009 2010 to 2011 After 2011
Contractual Cash Obligations: (Dollar amounts in thousands)
Revolving credit facilities $133,946 $23,333 $110,613 $ — $ —Notes payable to banks 10,214 1,253 2,600 2,600 3,761Short-term borrowings 2,961 2,961 — — —Capital lease obligations 1,673 958 706 9 —Non-cancelable operating leases 32,784 8,417 12,086 6,621 5,660
Total contractual cash obligations $181,578 $36,922 $126,005 $9,230 $9,421
A significant portion of the loans included in the table above bear interest at variable rates. At September 30, 2006, theweighted-average interest rate was 4.88% on the Company’s domestic Revolving Credit Facility, 3.69% on the credit facilitythrough the Company’s wholly-owned German subsidiary, and 3.17% on bank loans to the Company’s wholly-ownedsubsidiary, Caggiati S.p.A.
Benefit payments under the Company’s principal retirement plan are made from plan assets, while benefit payments underthe supplemental retirement plan and postretirement benefit plan are funded from the Company’s operating cash. TheCompany does not currently plan to make any significant contributions to its principal retirement plan in fiscal 2007. TheCompany estimates that benefit payments to participants under its retirement plans (including its supplemental retirementplan) and postretirement benefit payments will be $4.6 million and $1.0 million, respectively, in fiscal 2007. The amountsare not expected to change materially thereafter. The Company believes that its current liquidity sources, combined withits operating cash flow and borrowing capacity, will be sufficient to meet its capital needs for the foreseeable future.
INFLATION:
Except for the significant increases in the cost of bronze ingot and steel (see “Results of Operations”), inflation has nothad a material impact on the Company over the past three years nor is it anticipated to have a material impact for theforeseeable future.
ACCOUNTING PRONOUNCEMENTS:
In November 2005, the Financial Accounting Standards Board (“FASB”) issued FASB Staff Position (“FSP”) FAS 115-1 andFAS 124-1, “The Meaning of Other-Than-Temporary Impairment and Its Application to Certain Investments” (“FSP 115-1”),which provides guidance on determining when investments in certain debt and equity securities are considered impaired,whether that impairment is other-than-temporary, and on measuring such impairment loss. FSP 115-1 also includesaccounting considerations subsequent to the recognition of an other-than-temporary impairment and requires certaindisclosures about unrealized losses that have not been recognized as other-than-temporary impairments. FSP 115-1 wasadopted by the Company in the second quarter of fiscal 2006 as required and had no material impact on the Company’sconsolidated financial position and results of operations.
■ 30 ■
ITEM 7. MANAGEMENT’S DISCUSSION AND ANALYSIS (continued)

In June 2006, FASB issued Interpretation No. 48, “Accounting for Uncertainty in Income Taxes” (FIN 48) which clarifies theaccounting for uncertainty in income taxes recognized in an enterprise’s financial statements in accordance with SFAS No. 109,“Accounting for Income Taxes.” This interpretation prescribes a recognition threshold and measurement attribute for thefinancial statement recognition and measurement of a tax position taken or expected to be taken in a tax return. FIN 48also provides guidance on derecognition, classification, interest and penalties, accounting in interim periods, disclosureand transition. Any resulting cumulative effect of applying the provisions of FIN 48 upon adoption will be reported as anadjustment to beginning retained earnings in the period of adoption. The Interpretation is effective for fiscal years beginningafter December 15, 2006. The Company is currently evaluating the impact of the adoption of FIN 48.
In September 2006, the FASB issued SFAS No. 158, “Employers’ Accounting for Defined Benefit Pension and OtherPostretirement Plans” which amends SFAS 87, 88, 106 and 132(R). SFAS No. 158 requires employers to recognize theover-funded or under-funded status of defined benefit postretirement plans on the balance sheet and to recognize thecorresponding adjustment in other comprehensive income. In addition, the statement requires recognition in othercomprehensive income of gains or losses and prior service costs or credits that are not included as components of periodicbenefit expense. These provisions of the statement are effective for public companies for fiscal years ending after December 15,2006. Accordingly, the Company will adopt this provision of SFAS No. 158 prospectively for the year-end financial statementsdated September 30, 2007. If the Company had adopted SFAS No. 158 as of September 30, 2006, the liability for pension andpostretirement benefits would have increased approximately $10.0 million, deferred tax assets would have increased approximately$3.9 million and equity (other accumulated comprehensive income) would have decreased by approximately $6.1 million.
Further, SFAS No. 158 requires the Company to measure the plan assets and benefit obligations of defined benefitpostretirement plans as of the date of its year-end balance sheet. This provision of the SFAS No. 158 is effective for publiccompanies for fiscal years beginning after December 15, 2008. The Company currently measures plan assets and benefitobligations as of July 31 of each year. The Company is considering the implications of this provision and the feasibility ofearlier adoption of this portion of the statement. Upon adoption, this provision is not expected to have a material effecton the financial statements.
In September 2006, the FASB issued SFAS No. 157, “Fair Value Measurements.” This Statement defines fair value,establishes a framework for measuring fair value in generally accepted accounting principles, and expands disclosuresabout fair value measurements. The Statement applies under other accounting pronouncements that require or permitfair value measurements and does not require any new fair value measurements. The Statement is effective for financialstatements issued for fiscal years beginning after November 15, 2007. The adoption of SFAS No. 157 is not expected tohave a material impact on the Company’s consolidated financial position or results of operations.
■ 31 ■
ITEM 7. MANAGEMENT’S DISCUSSION AND ANALYSIS (continued)

ITEM 7A. QUANTITATIVE AND QUALITATIVE DISCLOSURES ABOUT MARKET RISK.
The following discussion about the Company’s market risk involves forward-looking statements. Actual results could differmaterially from those projected in the forward-looking statements. The Company has market risk related to changes ininterest rates, commodity prices and foreign currency exchange rates. The Company does not generally use derivativefinancial instruments in connection with these market risks, except as noted below.
Interest Rates – The Company’s most significant long-term debt instrument is the domestic Revolving Credit Facility, asamended, which bears interest at variable rates based on LIBOR. In April 2004, the Company entered into an interest rateswap that fixed, for a five-year period, the interest rate on borrowings in an initial amount of $50.0 million ($27.5 millionoutstanding at September 30, 2006). The interest rate was fixed at 2.66% plus a factor based on the Company’s leverageratio (the factor was .50% at September 30, 2006). The interest rate swap was designated as a cash flow hedge of thefuture variable interest payments under the Revolving Credit Facility which are considered probable of occurring. On July 11,2005 the Company increased its outstanding borrowings under the facility and, effective September 30, 2005, the Companyentered into an additional interest rate swap that fixed, for the period through the maturity of the Revolving Credit Facility,the interest rate on the additional borrowings in an initial amount of $50.0 million ($36.7 million outstanding at September30, 2006). The interest rate was fixed at 4.14% plus a factor based on the Company’s leverage ratio (the factor was .50%at September 30, 2006). The interest rate swap was designated as a cash flow hedge of the future variable interest paymentsunder the Revolving Credit Facility which are considered probable of occurring. The fair value of the interest rate swapsreflected an unrealized gain of $1.5 million ($918,000 after tax) at September 30, 2006 that is included in equity as part ofaccumulated other comprehensive income. A decrease of 10% in market interest rates (i.e. a decrease from 3.5% to 3.15%)would result in a decrease of approximately $254,000 in the fair value of the interest rate swaps.
Commodity Price Risks – In the normal course of business, the Company is exposed to commodity price fluctuationsrelated to the purchases of certain materials and supplies (such as bronze ingot, steel and wood) used in its manufacturingoperations. The Company obtains competitive prices for materials and supplies when available.
Foreign Currency Exchange Rates – The Company is subject to changes in various foreign currency exchange rates,including the Euro, the British Pound, Canadian dollar, Australian dollar and Swedish Krona, in the conversion from localcurrencies to the U.S. dollar of the reported financial position and operating results of its non-U.S. based subsidiaries. Anadverse change of 10% in exchange rates would have resulted in a decrease in sales of $16.5 million and a decrease inoperating income of $2.9 million for the year ended September 30, 2006.
■ 32 ■

ITEM 8. FINANCIAL STATEMENTS AND SUPPLEMENTARY DATA.
Description Pages
Management’s Report to Shareholders 34
Report of Independent Registered Public Accounting Firm 35-36
Financial Statements:
Consolidated Balance Sheets 37-38
Consolidated Statements of Income 39
Consolidated Statements of Shareholders’ Equity 40
Consolidated Statements of Cash Flows 41
Notes to Consolidated Financial Statements 42-65
Supplementary Financial Information (unaudited) 66
Financial Statement Schedule – Schedule II – Valuation and QualifyingAccounts for the years ended September 30, 2006, 2005 and 2004 67
■ 33 ■

MANAGEMENT’S REPORT TO SHAREHOLDERS
To the Shareholders and Board of Directors ofMatthews International Corporation:
Management’s Report on Financial Statements
The accompanying consolidated financial statements of Matthews International Corporation and its subsidiaries (collectively,the “Company”) were prepared by management, which is responsible for their integrity and objectivity. The statementswere prepared in accordance with generally accepted accounting principles and include amounts that are based onmanagement’s best judgments and estimates. The other financial information included in this Annual Report on Form 10-Kis consistent with that in the financial statements.
Management’s Report on Internal Control over Financial Reporting
Management is responsible for establishing and maintaining adequate internal control over financial reporting for the Company.In order to evaluate the effectiveness of internal control over financial reporting management has conducted an assessmentusing the criteria in Internal Control – Integrated Framework, issued by the Committee of Sponsoring Organizations of theTreadway Commission (COSO). The Company’s internal controls over financial reporting include those policies and proceduresthat (i) pertain to the maintenance of records that, in reasonable detail, accurately and fairly reflect the transactions anddispositions of the assets of the Company; (ii) provide reasonable assurance that transactions are recorded as necessary topermit preparation of financial statements in accordance with generally accepted accounting principles, and that receipts andexpenditures of the Company are being made only in accordance with authorizations of management and directors of theCompany; and (iii) provide reasonable assurance regarding prevention or timely detection of unauthorized acquisition, use,or disposition of the Company’s assets that could have a material effect on the financial statements. Because of its inherentlimitations, internal control over financial reporting may not prevent or detect misstatements. Also, projections of any evaluationof effectiveness to future periods are subject to the risk that controls may become inadequate because of changes in conditions,or that the degree of compliance with the policies or procedures may deteriorate.
Based on its assessment, management has concluded that the Company maintained effective internal control over financialreporting as of September 30, 2006, based on criteria in Internal Control – Integrated Framework issued by the COSO.Management’s assessment of the effectiveness of the Company’s internal control over financial reporting as of September30, 2006, has been audited by PricewaterhouseCoopers LLP, an independent registered public accounting firm, as statedin their report which is included herein.
Management’s Certifications
The certifications of the Company’s Chief Executive Officer and Chief Financial Officer required by the Sarbanes-Oxley Acthave been included as Exhibits 31 and 32 in the Company’s Form 10-K.
■ 34 ■

REPORT OF INDEPENDENT REGISTERED PUBLIC ACCOUNTING FIRM
To the Shareholders and Board of Directors ofMatthews International Corporation:
We have completed integrated audits of Matthews International Corporation’s 2006 and 2005 consolidated financialstatements and of its internal control over financial reporting as of September 30, 2006, and an audit of its 2004consolidated financial statements in accordance with the standards of the Public Company Accounting Oversight Board(United States). Our opinions, based on our audits, are presented below.
Consolidated financial statements and financial statement schedule
In our opinion, the consolidated financial statements listed in the accompanying index present fairly, in all material respects,the financial position of Matthews International Corporation and its subsidiaries (the Company) at September 30, 2006and 2005, and the results of their operations and their cash flows for each of the three years in the period ended September30, 2006 in conformity with accounting principles generally accepted in the United States of America. In addition, in ouropinion, the financial statement schedule listed in the accompanying index presents fairly, in all material respects, theinformation set forth therein when read in conjunction with the related consolidated financial statements. These financialstatements and financial statement schedule are the responsibility of the Company’s management. Our responsibility isto express an opinion on these financial statements and financial statement schedule based on our audits. We conductedour audits of these statements in accordance with the standards of the Public Company Accounting Oversight Board (UnitedStates). Those standards require that we plan and perform the audit to obtain reasonable assurance about whether thefinancial statements are free of material misstatement. An audit of financial statements includes examining, on a testbasis, evidence supporting the amounts and disclosures in the financial statements, assessing the accounting principlesused and significant estimates made by management, and evaluating the overall financial statement presentation. Webelieve that our audits provide a reasonable basis for our opinion.
As discussed in Note 8 to the consolidated financial statements, effective October 1, 2005, the Company changed itsmethod of accounting for share-based payments.
Internal control over financial reporting
Also, in our opinion, management’s assessment, included in Management’s Report on Internal Control over FinancialReporting appearing under Item 8, that the Company maintained effective internal control over financial reporting as ofSeptember 30, 2006 based on criteria established in Internal Control - Integrated Framework issued by the Committeeof Sponsoring Organizations of the Treadway Commission (COSO), is fairly stated, in all material respects, based on thosecriteria. Furthermore, in our opinion, the Company maintained, in all material respects, effective internal control overfinancial reporting as of September 30, 2006, based on criteria established in Internal Control - Integrated Frameworkissued by the COSO. The Company’s management is responsible for maintaining effective internal control over financialreporting and for its assessment of the effectiveness of internal control over financial reporting. Our responsibility is toexpress opinions on management’s assessment and on the effectiveness of the Company’s internal control over financialreporting based on our audit. We conducted our audit of internal control over financial reporting in accordance with thestandards of the Public Company Accounting Oversight Board (United States). Those standards require that we plan andperform the audit to obtain reasonable assurance about whether effective internal control over financial reporting wasmaintained in all material respects. An audit of internal control over financial reporting includes obtaining an understandingof internal control over financial reporting, evaluating management’s assessment, testing and evaluating the design andoperating effectiveness of internal control, and performing such other procedures as we consider necessary in thecircumstances. We believe that our audit provides a reasonable basis for our opinions.
■ 35 ■

A company’s internal control over financial reporting is a process designed to provide reasonable assurance regarding thereliability of financial reporting and the preparation of financial statements for external purposes in accordance with generallyaccepted accounting principles. A company’s internal control over financial reporting includes those policies and proceduresthat (i) pertain to the maintenance of records that, in reasonable detail, accurately and fairly reflect the transactions anddispositions of the assets of the company; (ii) provide reasonable assurance that transactions are recorded as necessary topermit preparation of financial statements in accordance with generally accepted accounting principles, and that receipts andexpenditures of the company are being made only in accordance with authorizations of management and directors of thecompany; and (iii) provide reasonable assurance regarding prevention or timely detection of unauthorized acquisition, use, ordisposition of the company’s assets that could have a material effect on the financial statements.
Because of its inherent limitations, internal control over financial reporting may not prevent or detect misstatements. Also,projections of any evaluation of effectiveness to future periods are subject to the risk that controls may become inadequatebecause of changes in conditions, or that the degree of compliance with the policies or procedures may deteriorate.
/s/PricewaterhouseCoopers LLP
Pittsburgh, PennsylvaniaDecember 6, 2006
■ 36 ■

MATTHEWS INTERNATIONAL CORPORATION AND SUBSIDIARIES
CONSOLIDATED BALANCE SHEETS
September 30, 2006 and 2005
(Dollar amounts in thousands, except per share data)
ASSETS 2006 2005
Current assets:Cash and cash equivalents $ 29,720 $ 39,555Short-term investments 92 67Accounts receivable, net of allowance for doubtful
accounts of $10,829 and $10,547, respectively 121,750 115,362Inventories 85,415 71,333Deferred income taxes 1,682 1,506Other current assets 4,184 4,310
Total current assets 242,843 232,133
Investments 11,492 11,072
Property, plant and equipment, net 88,099 88,867
Deferred income taxes 24,441 20,415
Other assets 6,125 5,899
Goodwill 298,125 260,672
Other intangible assets, net of accumulated amortization of $5,260 and $2,918, respectively 44,965 46,397
Total assets $716,090 $665,455
The accompanying notes are an integral part of these consolidated financial statements.
■ 37 ■

MATTHEWS INTERNATIONAL CORPORATION AND SUBSIDIARIES
CONSOLIDATED BALANCE SHEETS, continued
September 30, 2006 and 2005
(Dollar amounts in thousands, except per share data)
LIABILITIES AND SHAREHOLDERS’ EQUITY 2006 2005
Current liabilities:Long-term debt, current maturities $ 28,451 $ 28,721Trade accounts payable 26,925 43,524Accrued compensation 33,517 32,858Accrued income taxes 9,230 11,640Other current liabilities 39,086 28,834
Total current liabilities 137,209 145,577
Long-term debt 120,289 118,952
Pension and postretirement benefits 35,142 30,494
Deferred income taxes 9,942 7,589
Environmental reserve 9,028 9,607
Other liabilities and deferred revenue 12,055 15,487
Commitments and contingent liabilities
Shareholders’ equity:Class A common stock, $1.00 par value; authorized
70,000,000 shares; 36,333,992 shares issued 36,334 36,334Preferred stock, $100 par value, authorized 10,000 shares, none issued — —Additional paid-in capital 33,953 29,524Retained earnings 410,203 350,311Accumulated other comprehensive income (loss) 4,386 (1,359)Treasury stock, 4,699,697 and 4,307,300 shares, respectively, at cost (92,451) (77,061)
Total shareholders’ equity 392,425 337,749
Total liabilities and shareholders’ equity $716,090 $665,455
The accompanying notes are an integral part of these consolidated financial statements.
■ 38 ■

MATTHEWS INTERNATIONAL CORPORATION AND SUBSIDIARIES
CONSOLIDATED STATEMENTS OF INCOME
for the years ended September 30, 2006, 2005 and 2004
(Dollar amounts in thousands, except per share data)
2006 2005 2004
Sales $715,891 $639,822 $508,801Cost of sales (443,958) (416,747) (315,047)
Gross profit 271,933 223,075 193,754
Selling expense (70,354) (59,484) (46,999)Administrative expense (87,695) (65,178) (51,677)
Operating profit 113,884 98,413 95,078
Investment income 1,420 1,726 1,612Interest expense (6,995) (2,966) (1,998)Other income (deductions), net 70 1,658 (57)Minority interest (2,971) (5,775) (5,518)
Income before income taxes 105,408 93,056 89,117
Income taxes (38,964) (34,985) (34,584)
Net income $ 66,444 $ 58,071 $ 54,533
Earnings per share:
Basic $2.08 $1.81 $1.69
Diluted $2.06 $1.79 $1.68
The accompanying notes are an integral part of these consolidated financial statements.
■ 39 ■

MATTHEWS INTERNATIONAL CORPORATION AND SUBSIDIARIES
CONSOLIDATED STATEMENTS OF SHAREHOLDERS’ EQUITY
for the years ended September 30, 2006, 2005 and 2004
(Dollar amounts in thousands, except per share data)
Accumulated
Other
Additional Comprehensive
Common Paid-in Retained Income (Loss) Treasury
Stock Capital Earnings (net of tax) Stock Total
Balance, September 30, 2003 $36,334 $18,195 $248,951 $ 6,643 $(50,784) $259,339Net income — — 54,533 — — 54,533Unrealized gains (losses) — — — (37) — (37)Minimum pension liability — — — (737) — (737)Translation adjustment — — — 5,360 — 5,360Fair value of derivative — — — 309 — 309
Total comprehensive income 59,428Stock-based compensation — 2,716 — — — 2,716Treasury stock transactions:
Purchase of 497,736 shares — — — — (14,894) (14,894)Issuance of 746,261 shares
under stock plans — 3,948 — — 9,922 13,870Dividends, $.165 per share — — (5,319) — — (5,319)
Balance, September 30, 2004 36,334 24,859 298,165 11,538 (55,756) 315,140Net income — — 58,071 — — 58,071Unrealized gains (losses) — — — (28) — (28)Minimum pension liability — — — (9,833) — (9,833)Translation adjustment — — — (3,676) — (3,676)Fair value of derivatives — — — 640 — 640
Total comprehensive income 45,174Stock-based compensation — 2,874 — — — 2,874Treasury stock transactions:
Purchase of 792,728 shares — — — — (27,933) (27,933)Issuance of 408,846 shares
under stock plans — 1,791 — — 6,628 8,419Dividends, $.185 per share — — (5,925) — — (5,925)
Balance, September 30, 2005 36,334 29,524 350,311 (1,359) (77,061) 337,749Net income — — 66,444 — — 66,444Minimum pension liability — — — 88 — 88Translation adjustment — — — 5,688 — 5,688Fair value of derivatives — — — (31) — (31)
Total comprehensive income 72,189Stock-based compensation — 3,865 — — — 3,865Treasury stock transactions:
Purchase of 513,750 shares — — — — (17,491) (17,491)Issuance of 121,353 shares
under stock plans — 564 — — 2,101 2,665Dividends, $.205 per share — — (6,552) — — (6,552)
Balance, September 30, 2006 $36,334 $33,953 $410,203 $ 4,386 $(92,451) $392,425
The accompanying notes are an integral part of these consolidated financial statements.
■ 40 ■

MATTHEWS INTERNATIONAL CORPORATION AND SUBSIDIARIES
CONSOLIDATED STATEMENTS OF CASH FLOWS
for the years ended September 30, 2006, 2005 and 2004
(Dollar amounts in thousands, except per share data)
2006 2005 2004
Cash flows from operating activities:Net income $ 66,444 $ 58,071 $ 54,533
Adjustments to reconcile net income to net cash provided byoperating activities:Depreciation and amortization 21,463 19,893 15,628Minority interest 2,971 5,775 5,518Stock-based compensation expense 3,865 2,874 2,716Change in deferred taxes (2,150) 681 (39)Impairment charges 986 — 1,028Net (gain) loss on dispositions of assets (3,090) (200) 35Changes in working capital items (28,093) (19,673) 1,936(Increase) decrease in other assets (118) (1,622) 3,724Decrease in other liabilities (1,205) (2,240) (3,939)Increase in postretirement benefits 5,007 6,719 1,139
Net cash provided by operating activities 66,080 70,278 82,279
Cash flows from investing activities:Capital expenditures (19,397) (28,066) (10,403)Proceeds from dispositions of assets 3,114 1,099 1,484Acquisitions, net of cash acquired (32,278) (109,352) (74,487)Purchases of investment securities (232) (11,758) (15,260)Proceeds from dispositions of investments 15 9,119 15,829
Net cash used in investing activities (48,778) (138,958) (82,837)
Cash flows from financing activities:Proceeds from long-term debt 45,422 103,587 55,478Payments on long-term debt (47,539) (27,851) (49,050)Proceeds from the sale of treasury stock 2,028 5,894 10,629Purchases of treasury stock (17,491) (27,933) (14,894)Tax benefit on exercised stock options 902 3,148 4,517Dividends (6,552) (5,925) (5,319)Distributions to minority interests (5,536) (5,507) (3,524)
Net cash (used in) provided by financing activities (28,766) 45,413 (2,163)
Effect of exchange rate changes on cash 1,629 (3,008) 1,597
Net change in cash and cash equivalents (9,835) (26,275) (1,124)Cash and cash equivalents at beginning of year 39,555 65,830 66,954
Cash and cash equivalents at end of year $ 29,720 $ 39,555 $ 65,830
Cash paid during the year for:Interest $ 6,377 $ 2,692 $ 1,823Income taxes 42,377 32,125 11,200
The accompanying notes are an integral part of these consolidated financial statements.
■ 41 ■

MATTHEWS INTERNATIONAL CORPORATION AND SUBSIDIARIES
NOTES TO CONSOLIDATED FINANCIAL STATEMENTS
(Dollar amounts in thousands, except per share data)
1. NATURE OF OPERATIONS:
Matthews International Corporation (“Matthews”), founded in 1850 and incorporated in Pennsylvania in 1902, is a designer,manufacturer and marketer principally of memorialization products and brand solutions. Memorialization products consistprimarily of bronze memorials and other memorialization products, caskets and cremation equipment for the cemetery andfuneral home industries. Brand solutions include graphics imaging products and services, marking products andmerchandising solutions. The Company’s products and operations are comprised of six business segments: Bronze, Casket,Cremation, Graphics Imaging, Marking Products and Merchandising Solutions. The Bronze segment is a leading manufacturerof cast bronze memorials and other memorialization products, cast and etched architectural products and is a leading builderof mausoleums in the United States. The Casket segment is a leading casket manufacturer in the United States and producesa wide variety of wood and metal caskets. The Cremation segment is a leading designer and manufacturer of cremationequipment and cremation caskets primarily in North America. The Graphics Imaging segment manufactures and providesbrand solutions, printing plates, pre-press services and imaging services for the primary packaging and corrugated industries.The Marking Products segment designs, manufactures and distributes a wide range of marking and coding equipment andconsumables, and industrial automation products for identifying, tracking and conveying various consumer and industrialproducts, components and packaging containers. The Merchandising Solutions segment designs and manufacturesmerchandising displays and systems and provides creative merchandising and marketing solutions services.
The Company has manufacturing and marketing facilities in the United States, Canada, Mexico, Australia, and Europe.
2. SUMMARY OF SIGNIFICANT ACCOUNTING POLICIES:
Principles of Consolidation:
The consolidated financial statements include all domestic and foreign subsidiaries in which the Company maintains anownership interest and has operating control. All intercompany accounts and transactions have been eliminated.
Use of Estimates:
The preparation of financial statements in conformity with generally accepted accounting principles requires managementto make estimates and assumptions that affect the reported amounts of assets and liabilities and the disclosure of contingentassets and liabilities at the date of the financial statements and the reported amounts of revenues and expenses duringthe reporting period. Actual results could differ from those estimates.
Foreign Currency:
Balance sheet accounts for foreign subsidiaries are translated into U.S. dollars at exchange rates in effect at the consolidatedbalance sheet date. Gains or losses that result from this process are recorded in other comprehensive income. The revenueand expense accounts of foreign subsidiaries are translated into U.S. dollars at the average exchange rates that prevailedduring the period.
■ 42 ■

Cash and Cash Equivalents:
For purposes of the consolidated statement of cash flows, the Company considers all investments purchased with aremaining maturity of three months or less to be cash equivalents. The carrying amount of cash and cash equivalentsapproximates fair value due to the short-term maturities of these instruments.
Allowance for Doubtful Accounts:
The allowance for doubtful accounts is based on an evaluation of specific customer accounts for which available facts andcircumstances indicate collectibility may be a problem. In addition, the allowance includes a reserve for all customers basedon historical collection experience.
Inventories:
Inventories are stated at the lower of cost or market with cost generally determined under the average cost method.
Property, Plant and Equipment:
Property, plant and equipment are carried at cost. Depreciation is computed primarily on the straight-line method overthe estimated useful lives of the assets, which generally range from 10 to 45 years for buildings and 3 to 12 years formachinery and equipment. Gains or losses from the disposition of assets are reflected in operating profit. The cost ofmaintenance and repairs is charged against income as incurred. Renewals and betterments of a nature considered toextend the useful lives of the assets are capitalized. Property, plant and equipment are reviewed for impairment wheneverevents or changes in circumstances indicate that the carrying amount of such assets may not be recoverable. Recoverabilityof assets is determined by comparing the estimated undiscounted net cash flows of the operations to which the assetsrelate. An impairment loss would be recognized when the carrying amount of the assets exceeds the estimatedundiscounted net cash flows.
Goodwill and Other Intangible Assets:
Goodwill is not amortized but is subject to annual review for impairment. Intangible assets are amortized over theirestimated useful lives, ranging from 2 to 20 years, unless such lives are considered to be indefinite. A significant declinein cash flows generated from these assets may result in a write-down of the carrying values of the related assets.
Environmental:
Costs that mitigate or prevent future environmental issues or extend the life or improve equipment utilized in currentoperations are capitalized and depreciated on a straight-line basis over the estimated useful lives of the related assets.Costs that relate to current operations or an existing condition caused by past operations are expensed. Environmentalliabilities are recorded when the Company’s obligation is probable and reasonably estimable. Accruals for losses fromenvironmental remediation obligations do not consider the effects of inflation, and anticipated expenditures are notdiscounted to their present value.
Treasury Stock:
Treasury stock is carried at cost. The cost of treasury shares sold is determined under the average cost method.
■ 43 ■
NOTES TO CONSOLIDATED FINANCIAL STATEMENTS (continued)
(Dollar amounts in thousands, except per share data)

Income Taxes:
Deferred tax assets and liabilities are provided for the differences between the financial statement and tax bases of assetsand liabilities using enacted tax rates in effect for the years in which the differences are expected to reverse. Valuationallowances are recorded to reduce deferred tax assets when it is more likely than not that a tax benefit will not be realized.Deferred income taxes for U.S. tax purposes have not been provided on certain undistributed earnings of foreign subsidiaries,as such earnings are considered to be reinvested indefinitely. To the extent earnings are expected to be returned in theforeseeable future, the associated deferred tax liabilities are provided.
Revenue Recognition:
Revenues are generally recognized when title and risk of loss pass to the customer, which is typically at the time of productshipment. For pre-need sales of memorials and vases, revenue is recognized when the memorial has been manufacturedto the customer’s specifications (e.g., name and birth date), title has been transferred to the customer and the memorialand vase are placed in storage for future delivery. A liability has been recorded in Estimated Finishing Costs for the estimatedcosts of finishing pre-need bronze memorials and vases that have been manufactured and placed in storage prior to July 1,2003 for future delivery.
In July 2003, the Emerging Issues Task Force (“EITF”) issued Issue No. 00-21 “Revenue Arrangements with MultipleDeliverables.” Issue No. 00-21 addresses certain aspects of the accounting by a vendor for arrangements under which itwill perform multiple revenue generating activities. The provisions of Issue No. 00-21 were effective July 1, 2003 and havebeen applied prospectively by the Company to the finishing and storage elements of its pre-need sales. Beginning July 1,2003, revenue is deferred by the Company on the portion of pre-need sales attributable to the final finishing and storageof the pre-need merchandise. Deferred revenue for final finishing is recognized at the time the pre-need merchandise isfinished and shipped to the customer. Deferred revenue related to storage is recognized on a straight-line basis over theestimated average time that pre-need merchandise is held in storage.
At September 30, 2006, the Company held 354,182 memorials and 248,104 vases in its storage facilities under the pre-needsales program.
Construction revenues are recognized under the percentage-of-completion method of accounting using the cost-to-costmethod. The Company offers rebates to certain customers participating in volume purchase programs. Rebates areestimated and recorded as a reduction in sales at the time the Company’s products are sold.
Share-Based Payment:
Prior to October 1, 2005, the Company accounted for its stock-based compensation plan in accordance with the intrinsic valueprovisions of Accounting Principles Board Opinion (“APB”) No. 25, “Accounting for Stock Issued to Employees” and providedthe required pro-forma disclosures of Statement of Financial Accounting Standards (“SFAS”) No. 123, “Accounting for Stock-Based Compensation”. Effective October 1, 2005, the Company adopted SFAS No. 123 (revised 2004), “Share-Based Payment”,(“SFAS No. 123 (R)”) using the modified retrospective method. Accordingly, stock-based compensation cost is measured atgrant date, based on the fair value of the award, and is recognized as expense over the employee requisite service period. Inaccordance with SFAS No. 123(R), financial statements for all periods prior to October 1, 2005 have been adjusted to give effectto the fair-value method of accounting for all awards granted in fiscal years beginning after December 15, 1994. Amountspreviously disclosed as pro-forma adjustments have been reflected in earnings for all prior periods.
■ 44 ■
NOTES TO CONSOLIDATED FINANCIAL STATEMENTS (continued)
(Dollar amounts in thousands, except per share data)

Derivatives and Hedging:
Derivatives are held as part of a formal documented hedging program. All derivatives are straight forward and held forpurposes other than trading. Matthews measures effectiveness by formally assessing, at least quarterly, the historical andprobable future high correlation of changes in the fair value or future cash flows of the hedged item. If the hedgingrelationship ceases to be highly effective or it becomes probable that an expected transaction will no longer occur, gainsand losses on the derivative will be recorded in other income (deductions) at that time.
Changes in the fair value of derivatives designated as cash flow hedges are recorded in other comprehensive income, netof tax, and are reclassified to earnings in a manner consistent with the underlying hedged item. The cash flows fromderivative activities are recognized in the statement of cash flows in a manner consistent with the underlying hedged item.
Research and Development Expenses:
Research and development costs are expensed as incurred and were approximately $2,800, $3,300 and $3,000 for theyears ended September 30, 2006, 2005 and 2004, respectively.
Earnings Per Share:
Basic earnings per share is computed by dividing net income by the average number of common shares outstanding.Diluted earnings per share is computed using the treasury stock method, which assumes the issuance of common stockfor all dilutive securities.
Reclassifications and Restatements:
Prior period amounts have been adjusted to reflect the modified retrospective adoption method of SFAS No. 123(R) (SeeNote 8). In addition, certain reclassifications have been made in the Consolidated Statements of Cash Flows andConsolidated Balance Sheets for prior periods to conform to the current period presentation.
3. INVENTORIES:
Inventories at September 30 consisted of the following:2006 2005
Materials and finished goods $79,715 $64,711Labor and overhead in process 5,700 6,622
$85,415 $71,333
4. INVESTMENTS:
Investment securities are recorded at estimated market value at the consolidated balance sheet date and, except forinvestments held in a non-revocable trust established to fund benefit payments under the Company’s supplementalretirement plan, are classified as available-for-sale. Short-term investments consisted principally of corporate obligations withpurchased maturities of over three months but less than one year. The cost of short-term investments approximated marketvalue at September 30, 2006 and 2005. Investments classified as non-current and available for sale consisted of securitiesof the U.S. government and its agencies and corporate obligations with purchased maturities in the range of one to fiveyears. Accrued interest on these non-current investment securities was classified with short-term investments.
■ 45 ■
NOTES TO CONSOLIDATED FINANCIAL STATEMENTS (continued)
(Dollar amounts in thousands, except per share data)

At September 30, 2006 and 2005, non-current investments classified as available for sale were as follows:
Book Value Gross(Amortized Unrealized Market
Cost) Losses Value
September 30, 2006:U.S. government and its agencies $2,248 $(1) $2,247Corporate obligations 2,747 — 2,747Other 31 — 31
Total $5,026 $(1) $5,025
September 30, 2005:U.S. government and its agencies $ 549 $(1) $ 548Corporate obligations 4,247 — 4,247Other 40 — 40
Total $4,836 $(1) $4,835
Unrealized gains and losses on investment securities, including related deferred taxes, are reflected in accumulated othercomprehensive income. Realized gains and losses are based on the specific identification method and are recorded ininvestment income. Realized gains (losses) for fiscal 2006, 2005 and 2004 were not material. Bond premiums and discountsare amortized on the straight-line method, which does not significantly differ from the interest method.
In addition, investments included the Company’s 49% ownership interest in Applied Technology Developments, Ltd.(“ATD”), which was $647 at September 30, 2006 and 2005. The investment in ATD was recorded under the equity methodof accounting. Investments also included ownership interests in various entities of less than 20%, which totaled $1,222and $1,193 at September 30, 2006 and 2005, respectively. Investments of less than 20% ownership interest are recordedunder the cost method of accounting.
Investments at September 30, 2006 and 2005 also included various mutual funds (classified as trading securities) valuedat $4,598 and $4,397, respectively, held in a non-revocable trust established to fund benefit payments under the Company’ssupplemental retirement plan.
■ 46 ■
NOTES TO CONSOLIDATED FINANCIAL STATEMENTS (continued)
(Dollar amounts in thousands, except per share data)

5. PROPERTY, PLANT AND EQUIPMENT:
Property, plant and equipment and the related accumulated depreciation at September 30, 2006 and 2005 were as follows:
2006 2005
Buildings $ 43,907 $ 44,745Machinery and equipment 148,387 128,362
192,294 173,107Less accumulated depreciation (114,247) (97,365)
78,047 75,742Land 4,814 4,679Construction in progress 5,238 8,446
$ 88,099 $ 88,867
During the fourth quarter of fiscal 2006, the Company recorded a pre-tax gain of approximately $2,670 from the sale ofa facility and a pre-tax charge of approximately $986 related to asset impairments.
6. LONG-TERM DEBT:
Long-term debt at September 30, 2006 and 2005 consisted of the following:
2006 2005
Revolving credit facilities $133,946 $132,117Notes payable to banks 10,214 10,956Short-term borrowings 2,961 3,363Capital lease obligations 1,619 1,237
148,740 147,673Less current maturities (28,451) (28,721)
$120,289 $118,952
The Company has a domestic Revolving Credit Facility with a syndicate of financial institutions. In February 2005, thefacility, which was originally in the amount of $125,000, was amended to increase the borrowing capacity to $150,000.Borrowings under the amended facility, which is scheduled to mature on April 30, 2009, bear interest at LIBOR plus a factorranging from .50% to 1.00% based on the Company’s leverage ratio. The leverage ratio is defined as net indebtednessdivided by EBITDA (earnings before interest, taxes, depreciation and amortization). The Company is required to pay anannual commitment fee ranging from .20% to .30% (based on the Company’s leverage ratio) of the unused portion ofthe facility. The Revolving Credit Facility, as amended, requires the Company to maintain certain leverage and interestcoverage ratios. A portion of the facility (not to exceed $10,000) is available for the issuance of trade and standby lettersof credit. Outstanding borrowings on the Revolving Credit Facility at September 30, 2006 and 2005 were $123,167 and$122,500 respectively. The weighted-average interest rate on outstanding borrowings at September 30, 2006 and 2005was 4.88% and 3.80%, respectively.
■ 47 ■
NOTES TO CONSOLIDATED FINANCIAL STATEMENTS (continued)
(Dollar amounts in thousands, except per share data)

In April 2004, the Company entered into an interest rate swap that fixed, for a five year period, the interest rate onborrowings in an initial amount of $50,000. The interest rate was fixed at 2.66% plus a factor based on the Company’sleverage ratio (the factor was .50% at September 30, 2006). The interest rate swap was designated as a cash flow hedgeof the future variable interest payments under the Revolving Credit Facility which are considered probable of occurring.Based on the Company’s assessment, all of the critical terms of the hedge matched the underlying terms of the hedged debtand related forecasted interest payments and as such, these hedges were considered effective. Equal quarterly principalpayments of $2,500 plus interest are due on this borrowing until its maturity in April 2009.
In July 2005, the Company increased its outstanding borrowings under the Revolving Credit Facility. The additional borrowingswere used to complete the acquisition of Milso Industries (“Milso”). Effective September 30, 2005, the Company enteredinto an interest rate swap that fixed, for the period through the maturity of the Revolving Credit Facility, the interest rate onthe additional borrowings in an initial amount of $50,000. The interest rate was fixed at 4.14% plus a factor based on theCompany’s leverage ratio (the factor was .50% at September 30, 2006). The interest rate swap was designated as a cashflow hedge of the future variable interest payments under the Revolving Credit Facility, which are considered probable ofoccurring. Based on the Company’s assessment, all of the critical terms of the hedge match the underlying terms of thehedged debt and related forecasted interest payments and as such, these hedges are considered effective. Equal quarterlyprincipal payments of $3,333 plus interest are due on this $50,000 portion of the borrowing until its maturity in April 2009.
The fair value of the interest rate swaps reflected an unrealized gain of $1,507 ($918 after tax) at September 30, 2006 that isincluded in shareholders’ equity as part of accumulated other comprehensive income. Assuming market rates remain constantwith the rates at September 30, 2006, approximately $356 of the $918 gain included in accumulated other comprehensiveincome is expected to be recognized in earnings as an adjustment to interest expense over the next twelve months.
The Company, through its wholly-owned subsidiary, Matthews International GmbH (“MIGmbH”), has a credit facility withNational Westminster Bank Plc for borrowings up to 10.0 million Euros. Outstanding borrowings under the credit facility totaled8.5 million Euros ($10,779) and 8.0 million Euros ($9,617) at September 30, 2006 and 2005, respectively. The weighted-averageinterest rate on outstanding borrowings of MIGmbH at September 30, 2006 and 2005 was 3.69% and 2.66%, respectively.
The Company, through its wholly-owned subsidiary, Caggiati S.p.A., has several loans with various Italian banks.Outstanding borrowings on these loans totaled 8.0 million Euros ($10,195) and 9.0 million Euros ($10,900) at September30, 2006 and 2005, respectively. Caggiati S.p.A. also has three lines of credit totaling 8.4 million Euros ($10,614) withthe same Italian banks. Outstanding borrowings on these lines were 2.3 million Euros ($2,961) and 2.8 million Euros($3,363) at September 30, 2006 and 2005, respectively. The weighted-average interest rate on outstanding borrowingsof Caggiati S.p.A. at September 30, 2006 and 2005 was 3.17% and 2.81%, respectively.
Aggregate maturities of long-term debt, including short-term borrowings and capital leases, follows:
2007 $ 28,4512008 25,3032009 88,6162010 1,3082011 1,301Thereafter 3,761
$148,740
The carrying amounts of the Company’s borrowings under its financing arrangements approximated their fair value.
■ 48 ■
NOTES TO CONSOLIDATED FINANCIAL STATEMENTS (continued)
(Dollar amounts in thousands, except per share data)

7. SHAREHOLDERS’ EQUITY:
The authorized common stock of the Company consists of 70,000,000 shares of Class A Common Stock, $1 par value.
The Company has a stock repurchase program, which was initiated in 1996. Under the program, the Company’s Board ofDirectors has authorized the repurchase of a total of 10,000,000 shares of Matthews’ common stock, of which 9,135,146shares have been repurchased as of September 30, 2006. The buy-back program is designed to increase shareholder value,enlarge the Company’s holdings of its common stock, and add to earnings per share. Repurchased shares may be retainedin treasury, utilized for acquisitions, or reissued to employees or other purchasers, subject to the restrictions of the Company’sRestated Articles of Incorporation.
Comprehensive income consists of net income adjusted for changes, net of any related income tax effect, in cumulative foreigncurrency translation, the fair value of derivatives, unrealized investment gains and losses and minimum pension liability.
Accumulated other comprehensive income at September 30, 2006 and 2005 consisted of the following:
2006 2005
Cumulative foreign currency translation $ 13,980 $ 8,292Fair value of derivatives, net of tax of $586 and $607, respectively 918 949Minimum pension liability, net of tax of $6,721 and $6,778, respectively (10,512) 10,600)
$ 4,386 $ (1,359)
8. SHARE-BASED PAYMENTS:
The Company has a stock incentive plan that provides for grants of incentive stock options, non-statutory stock optionsand restricted share awards in an aggregate number not to exceed 15% of the outstanding shares of the Company’scommon stock (4,745,144 shares at September 30, 2006). The plan is administered by the Compensation Committee ofthe Board of Directors. The option price for each stock option that may be granted under the plan may not be less thanthe fair market value of the Company’s common stock on the date of grant. Outstanding stock options are exercisable invarious share amounts based on the attainment of certain market value levels of Class A Common Stock. In addition,options generally vest in one-third increments after three, four and five years, respectively, from the grant date (but, in anyevent, not until the attainment of the certain market value levels). The options expire on the earlier of ten years from thedate of grant, upon employment termination, or within specified time limits following voluntary employment termination(with the consent of the Company), retirement or death. The Company generally settles employee stock option exerciseswith treasury shares.
Prior to October 1, 2005, the Company accounted for its stock-based compensation plan in accordance with the intrinsicvalue provisions of APB No. 25 and provided the required pro-forma disclosures of SFAS No. 123. Effective October 1, 2005,the Company adopted SFAS No. 123(R) using the modified retrospective method. Accordingly, stock-based compensationcost is measured at grant date, based on the fair value of the award, and is recognized as expense over the employee requisiteservice period. Beginning in fiscal 2006, expense is recognized immediately for participants eligible for normal retirement,where appropriate under the vesting provisions of the grants to such participants. In accordance with SFAS No. 123(R),financial statements for all periods prior to October 1, 2005 have been restated to give effect to the fair-value based methodof accounting for all awards granted in fiscal years beginning after December 15, 1994. Amounts previously disclosed as pro-forma adjustments have been reflected in earnings for all prior periods.
■ 49 ■
NOTES TO CONSOLIDATED FINANCIAL STATEMENTS (continued)
(Dollar amounts in thousands, except per share data)
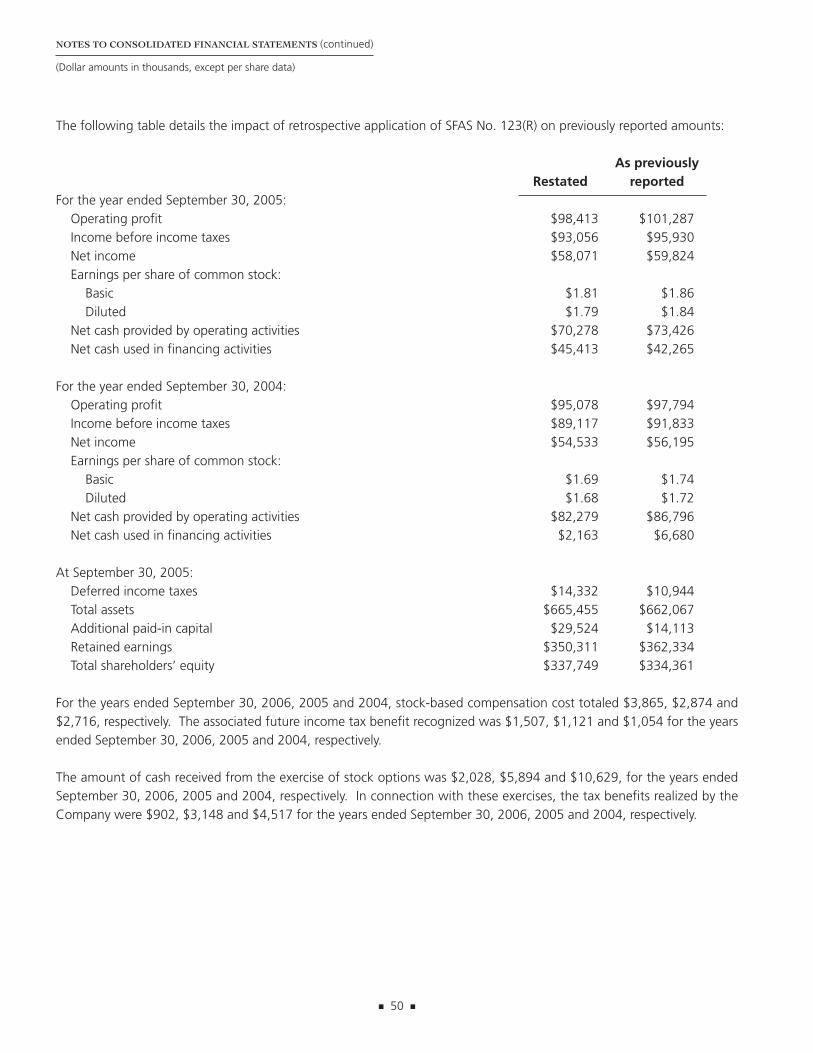
The following table details the impact of retrospective application of SFAS No. 123(R) on previously reported amounts:
As previouslyRestated reported
For the year ended September 30, 2005:Operating profit $98,413 $101,287Income before income taxes $93,056 $95,930Net income $58,071 $59,824Earnings per share of common stock:
Basic $1.81 $1.86Diluted $1.79 $1.84
Net cash provided by operating activities $70,278 $73,426Net cash used in financing activities $45,413 $42,265
For the year ended September 30, 2004:Operating profit $95,078 $97,794Income before income taxes $89,117 $91,833Net income $54,533 $56,195Earnings per share of common stock:
Basic $1.69 $1.74Diluted $1.68 $1.72
Net cash provided by operating activities $82,279 $86,796Net cash used in financing activities $2,163 $6,680
At September 30, 2005:Deferred income taxes $14,332 $10,944Total assets $665,455 $662,067Additional paid-in capital $29,524 $14,113Retained earnings $350,311 $362,334Total shareholders’ equity $337,749 $334,361
For the years ended September 30, 2006, 2005 and 2004, stock-based compensation cost totaled $3,865, $2,874 and$2,716, respectively. The associated future income tax benefit recognized was $1,507, $1,121 and $1,054 for the yearsended September 30, 2006, 2005 and 2004, respectively.
The amount of cash received from the exercise of stock options was $2,028, $5,894 and $10,629, for the years endedSeptember 30, 2006, 2005 and 2004, respectively. In connection with these exercises, the tax benefits realized by theCompany were $902, $3,148 and $4,517 for the years ended September 30, 2006, 2005 and 2004, respectively.
■ 50 ■
NOTES TO CONSOLIDATED FINANCIAL STATEMENTS (continued)
(Dollar amounts in thousands, except per share data)

The transactions for shares under options for the year ended September 30, 2006 were as follows:
Weighted-average Aggregate
Weighted-average remaining intrinsicShares exercise price contractual term value
Outstanding, September 30, 2005 2,090,607 $25.50Granted 610,500 37.31Exercised (114,858) 16.64Expired or forfeited (56,798) 25.37
Outstanding, September 30, 2006 2,529,451 28.75 7.0 $20,329
Exercisable, September 30, 2006 861,240 20.97 5.3 $13,628
Shares reserved for future options 2,215,693
The weighted-average grant date fair value of options granted was $9.47 per share in 2006, $11.61 per share in 2005and $9.33 per share in 2004. The fair value of shares earned was $3,572, $2,606 and $1,714 during the years endedSeptember 30, 2006, 2005 and 2004, respectively. The intrinsic value of options (which is the amount by which the stockprice exceeded the exercise price of the options on the date of exercise) exercised during the years ended September 30,2006, 2005 and 2004 was $2,411, $9,132 and $13,028, respectively.
The transactions for non-vested shares for the year ended September 30, 2006 were as follows:
Weighted-averagegrant-date
Shares fair value
Non-vested at September 30, 2005 1,621,874 $9.58Granted 610,500 9.47Vested (512,365) 6.97Expired or forfeited (51,798) 7.97
Non-vested at September 30, 2006 1,668,211 9.67
As of September 30, 2006, the total unrecognized compensation cost related to non-vested stock options was approximately$4,981. This cost is expected to be recognized over a weighted-average period of 3.5 years in accordance with the vestingperiods of the options.
As of October 1, 2005, the fair value of each option grant is estimated on the date of grant using a binomial lattice valuationmodel. Prior to October 1, 2005, the fair value of each option award was estimated on the grant date using a Black-Scholes valuation model. The following table indicates the assumptions used in estimating fair value for the years endedSeptember 30, 2006, 2005 and 2004.
■ 51 ■
NOTES TO CONSOLIDATED FINANCIAL STATEMENTS (continued)
(Dollar amounts in thousands, except per share data)

Years Ended September 30,2006 2005 2004
(Binomial Lattice) (Black-Scholes) (Black-Scholes)
Expected volatility 24.0% 23.2% 24.2%Dividend yield .6% 1.0% 1.0%Average risk free interest rate 4.4% 4.3% 3.9%Average expected term (years) 5.5 7.9 7.9
The risk free interest rate is based on United States Treasury yields at the date of grant. The dividend yield is based on themost recent dividend payment and average stock price over the 12 months prior to the grant date. Expected volatilities arebased on the implied volatility of market traded options and the historical volatility of the Company’s stock price. Theexpected term represents an estimate of the period of time options are expected to remain outstanding. Separate employeegroups and option characteristics are considered separately for valuation purposes.
Under the Company’s Director Fee Plan, directors who are not also officers of the Company each receive, as an annualretainer fee, either cash or shares of the Company’s Class A Common Stock equivalent to $30. Where the annual retainerfee is provided in shares, each director may elect to be paid these shares on a current basis or have such shares credited toa deferred stock account as phantom stock, with such shares to be paid to the director subsequent to leaving the Board.Directors may also elect to receive the common stock equivalent of meeting fees credited to a deferred stock account. Thevalue of deferred shares is recorded in other liabilities. Shares deferred under the Director Fee Plan at September 30, 2006,2005 and 2004 were 49,569, 51,313 and 50,064, respectively. Additionally, beginning in fiscal 2005, directors who arenot also officers of the Company each receive an annual stock-based grant (non-statutory stock options, stock appreciationrights and/or restricted shares) with a value of $40. Stock options granted under the Director Fee Plan during the yearsended September 30, 2006 and 2005 were 4,800 and 17,500, respectively. All of the stock options were outstandingand unvested at September 30, 2006. Additionally, 4,800 shares of restricted stock were granted in March 2006 under theDirector Fee Plan. The restricted shares generally vest two years after the date of issuance. A total of 500,000 shares havebeen authorized to be issued under the Director Fee Plan.
9. EARNINGS PER SHARE:
2006 2005 2004
Net income $66,444 $58,071 $54,533
Weighted-average common shares outstanding 31,999,309 32,116,012 32,216,753
Dilutive securities, primarily stock options 252,415 265,562 325,329
Diluted weighted-average common shares outstanding 32,251,724 32,381,574 32,542,082
Basic earnings per share $2.08 $1.81 $1.69
Diluted earnings per share $2.06 $1.79 $1.68
■ 52 ■
NOTES TO CONSOLIDATED FINANCIAL STATEMENTS (continued)
(Dollar amounts in thousands, except per share data)

10. PENSION AND OTHER POSTRETIREMENT PLANS:
The Company provides defined benefit pension and other postretirement plans to certain employees. The following providesa reconciliation of benefit obligations, plan assets and funded status of the plans:
Pension Other Postretirement
2006 2005 2006 2005
Change in benefit obligation:Benefit obligation, beginning $106,352 $ 89,077 $ 22,068 $ 18,690Service cost 4,504 3,707 632 505Interest cost 5,923 5,615 1,227 1,173Assumption changes (9,887) 9,830 (1,693) 1,277Actuarial (gain) loss 2,016 2,569 (2,494) 1,231Benefit payments (4,848) (4,446) (1,473) (808)
Benefit obligation, ending 104,060 106,352 18,267 22,068
Change in plan assets:Fair value, beginning 79,915 74,115 — —Actual return (43) 9,470 — —Benefit payments (4,848) (4,446) (1,473) (808)Employer contributions 793 776 1,473 808
Fair value, ending 75,817 79,915 — —
Funded status (28,242) (26,437) (18,267) (22,068)Unrecognized actuarial loss 27,487 30,979 5,335 10,168Unrecognized prior service cost 342 (221) (5,502) (6,790)
Net amount recognized $ (413) $ 4,321 $(18,434) $(18,690)
Amounts recognized in thebalance sheet:Accrued benefit liability $ (18,236) $ (13,063) $(18,434) $(18,690)Accumulated other
comprehensive income 17,823 17,384 — —
Net amount recognized $ (413) $ 4,321 $(18,434) $(18,690)
The accumulated benefit obligation for the Company’s defined benefit pension plans was $91,442 and $91,095 atSeptember 30, 2006 and 2005, respectively.
■ 53 ■
NOTES TO CONSOLIDATED FINANCIAL STATEMENTS (continued)
(Dollar amounts in thousands, except per share data)

Net periodic pension and other postretirement benefit cost for the plans included the following:
Pension Other Postretirement
2006 2005 2004 2006 2005 2004
Service cost $4,504 $3,707 $3,694 $ 632 $ 505 $ 395
Interest cost 5,923 5,615 5,118 1,227 1,173 1,049
Expected return on plan assets (6,879) (6,333) (5,978) — — —Amortization:
Prior service cost (14) 83 80 (1,287) (1,287) (1,287)Net actuarial loss 1,979 1,378 1,204 646 493 446
Net benefit cost $5,513 $4,450 $4,118 $1,218 $ 884 $ 603
Benefit payments under the Company’s principal retirement plan are made from plan assets, while benefit payments underthe postretirement benefit plan are made from the Company’s operating funds. Under IRS regulations, the Company wasnot required to make any contributions to its principal retirement plan in fiscal year 2006. Contributions of $793 and$1,473 were made under the Company’s retirement plans and postretirement plan, respectively, in fiscal 2006.
The measurement date of annual actuarial valuations for the Company’s principal retirement and other postretirementbenefit plans is July 31, and the weighted-average assumptions for those plans were:
Pension Other Postretirement
2006 2005 2004 2006 2005 2004
Discount rate 6.50% 5.75% 6.50% 6.50% 5.75% 6.50%Return on plan assets 9.00 9.00 9.00 — — —Compensation increase 4.25 4.25 4.25 — — —
The Company’s principal pension plan maintains a substantial portion of its assets in equity securities in accordance withthe investment policy established by the Company’s pension board. Based on an analysis of the historical performance ofthe plan’s assets and consultation with its independent investment advisor, the Company has maintained the long-termrate of return assumption for these assets at 9.0% for purposes of determining pension cost and funded status underSFAS No. 87. The Company’s discount rate assumption used in determining the present value of the projected benefitobligation is based upon published indices for long-term (10-year) high quality bonds. The discount rate was 6.50%,5.75% and 6.50% in fiscal 2006, 2005 and 2004, respectively, reflecting long-term bond rates during those periods.
■ 54 ■
NOTES TO CONSOLIDATED FINANCIAL STATEMENTS (continued)
(Dollar amounts in thousands, except per share data)

Benefit payments expected to be paid are as follows:
Pension PostretirementYear ended September 30: Benefits Benefits
2007 $ 4,604 $ 1,0122008 5,161 1,0392009 5,384 1,1282010 5,571 1,1802011 5,728 1,2782012-2016 32,960 7,486
$59,408 $13,123
For measurement purposes, rates of increase of 10.0% in the per capita cost of health care benefits were assumed for2006; the rates were assumed to decrease gradually to 5.0% for 2014 and remain at that level thereafter. Assumed healthcare cost trend rates have a significant effect on the amounts reported. An increase in the assumed health care cost trendrates by one percentage point would have increased the accumulated postretirement benefit obligation as of September30, 2006 by $902 and the aggregate of the service and interest cost components of net periodic postretirement benefit costfor the year then ended by $104. A decrease in the assumed health care cost trend rates by one percentage point wouldhave decreased the accumulated postretirement benefit obligation as of September 30, 2006 by $788 and the aggregateof the service and interest cost components of net periodic postretirement benefit cost for the year then ended by $90.
11. INCOME TAXES:
The provision for income taxes consisted of the following:
2006 2005 2004
Current:Federal $28,782 $26,346 $23,503State 5,245 2,953 2,559Foreign 7,087 5,005 8,533
41,114 34,304 34,595Deferred (2,150) 681 (11)
Total $38,964 $34,985 $34,584
■ 55 ■
NOTES TO CONSOLIDATED FINANCIAL STATEMENTS (continued)
(Dollar amounts in thousands, except per share data)

The components of the net deferred tax asset at September 30 were as follows:
2006 2005
Deferred tax assets:Postretirement benefits $ 7,189 $ 7,289Environmental reserve 3,924 4,009Pension costs 6,088 4,303Deferred compensation 4,289 2,886Stock options 4,631 3,388Other 13,148 11,073
39,269 32,948
Deferred tax liabilities:Depreciation (4,725) (6,119)Goodwill amortization (17,776) (11,890)Other (587) (607)
(23,088) (18,616)
Net deferred tax asset $16,181 $14,332
The reconciliation of the federal statutory tax rate to the consolidated effective tax rate was as follows:
2006 2005 2004
Federal statutory tax rate 35.0% 35.0% 35.0%Effect of state income taxes, net of federal deduction 2.9 1.8 1.9Foreign taxes in excess of federal statutory rate .4 .5 1.5Tax on repatriated earnings .0 .7 .0Other (1.3) (.4) .4
Effective tax rate 37.0% 37.6% 38.8%
The Company’s foreign subsidiaries had income before income taxes for the years ended September 30, 2006, 2005 and2004 of approximately $24,500, $24,600 and $23,300, respectively. At September 30, 2006, undistributed earnings offoreign subsidiaries for which deferred U.S. income taxes have not been provided approximated $58,200. During fiscal2005, the Company’s Chief Executive Officer and Board of Directors approved a domestic reinvestment program as requiredby the American Jobs Creation Act of 2004. The Company repatriated $13,700 of dividends in fiscal 2005, on which taxeswere provided in accordance with FASB Staff Position No. 109-2, “Accounting and Disclosure Guidance for the ForeignEarnings Repatriation Provision within the American Jobs Creation Act of 2004”.
■ 56 ■
NOTES TO CONSOLIDATED FINANCIAL STATEMENTS (continued)
(Dollar amounts in thousands, except per share data)

12. COMMITMENTS AND CONTINGENT LIABILITIES:
The Company operates various production, warehouse and office facilities and equipment under operating leaseagreements. Annual rentals under these and other operating leases were $13,747, $10,950 and $7,000 in 2006, 2005 and2004, respectively. Future minimum rental commitments under non-cancelable operating lease arrangements for fiscalyears 2007 through 2011 are $8,417, $7,075, $5,011, $3,684 and $2,937, respectively, and $5,660 thereafter.
The Company is party to various legal proceedings, the eventual outcome of which are not predictable. Although theultimate disposition of these proceedings is not presently determinable, management is of the opinion that they shouldnot result in liabilities in an amount which would materially affect the Company’s consolidated financial position, results ofoperations or cash flows.
The Company has employment agreements with certain employees, the terms of which expire at various dates between2007 and 2010. The agreements generally provide for base salary and bonus levels and include non-compete provisions.The aggregate commitment for salaries under these agreements at September 30, 2006 was $10,884.
13. ENVIRONMENTAL MATTERS:
The Company’s operations are subject to various federal, state and local laws and regulations relating to the protection ofthe environment. These laws and regulations impose limitations on the discharge of materials into the environment andrequire the Company to obtain and operate in compliance with conditions of permits and other government authorizations.As such, the Company has developed environmental, health and safety policies and procedures that include the properhandling, storage and disposal of hazardous materials.
The Company is party to various environmental matters. These include obligations to investigate and mitigate the effectson the environment of the disposal of certain materials at various operating and non-operating sites. The Company iscurrently performing environmental assessments and remediation at these sites, as appropriate. In addition, prior to itsacquisition, The York Group, Inc. (“York”) was identified, along with others, by the Environmental Protection Agency as apotentially responsible party for remediation of a landfill site in York, Pennsylvania. At this time, the Company has notbeen joined in any lawsuit or administrative order related to the site or its clean-up.
At September 30, 2006, an accrual of $9,953 had been recorded for environmental remediation (of which $925 wasclassified in other current liabilities), representing management’s best estimate of the probable and reasonably estimablecosts of the Company’s known remediation obligations. The accrual, which reflects previously established reserves assumedwith the acquisition of York and additional reserves recorded as a purchase accounting adjustment, does not consider theeffects of inflation and anticipated expenditures are not discounted to their present value. While final resolution of thesecontingencies could result in costs different than current accruals, management believes the ultimate outcome will nothave a significant effect on the Company’s consolidated results of operations or financial position.
■ 57 ■
NOTES TO CONSOLIDATED FINANCIAL STATEMENTS (continued)
(Dollar amounts in thousands, except per share data)

14. SUPPLEMENTAL CASH FLOW INFORMATION:
Changes in working capital items as presented in the Consolidated Statements of Cash Flows consisted of the following:
2006 2005 2004
Current assets:Accounts receivable $ (4,110) $(13,489) $ (2,367)Inventories (10,860) (9,886) (3,959)Other current assets 518 549 (716)
(14,452) (22,826) (7,042)
Current liabilities:Trade accounts payable (9,765) 7,529 75Accrued compensation 50 1,584 3,430Accrued income taxes (2,410) (1,378) $10,352Customer prepayments (674) 722 (2,928)Accrued shutdown — — (693)Other current liabilities (842) (5,304) (1,258)
(13,641) 3,153 8,978
Net change $(28,093) $(19,673) $ 1,936
15. SEGMENT INFORMATION:
The Company’s products and operations consist of two principal businesses that are comprised of three operating segmentseach, as described under Nature of Operations (Note 1): Memorialization Products (Bronze, Casket, Cremation) and BrandSolutions (Graphics Imaging, Marking Products, Merchandising Solutions) (see Note 16). Management evaluates segmentperformance based on operating profit (before income taxes) and does not allocate non-operating items such as investmentincome, interest expense, other income (deductions), net and minority interest.
The accounting policies of the segments are the same as those described in Summary of Significant Accounting Policies(Note 2). Intersegment sales are accounted for at negotiated prices. Operating profit is total revenue less operatingexpenses. Segment assets include those assets that are used in the Company’s operations within each segment. Assetsclassified under “Other” principally consist of cash and cash equivalents, investments, deferred income taxes and corporateheadquarters’ assets. Long-lived assets include property, plant and equipment (net of accumulated depreciation), goodwill,and other intangible assets (net of accumulated amortization).
■ 58 ■
NOTES TO CONSOLIDATED FINANCIAL STATEMENTS (continued)
(Dollar amounts in thousands, except per share data)

Information about the Company’s segments follows:
BRAND SOLUTIONSMEMORIALIZATION
Graphics Marking Merchandising
Bronze Casket Cremation Imaging Products Solutions Other Consolidated
Sales to external customers:2006 $218,004 $200,950 $25,976 $140,886 $52,272 $77,803 $ — $715,8912005 205,675 135,512 21,497 143,159 45,701 88,278 — 639,8222004 197,377 116,588 22,476 113,226 37,990 21,144 — 508,801
Intersegment sales:2006 151 301 1,048 1 36 105 — 1,6422005 175 437 423 — 37 224 — 1,2962004 178 438 276 4 35 — — 931
Depreciation and amortization:2006 4,411 6,581 221 6,015 482 2,760 993 21,4632005 4,644 4,456 237 6,634 475 2,677 770 19,8932004 4,797 4,150 242 4,917 416 406 700 15,628
Operating profit:2006 65,049 16,971 3,372 16,554 9,066 2,872 — 113,8842005 59,722 12,645 701 14,861 7,373 3,111 — 98,4132004 53,100 14,000 1,294 18,764 6,371 1,549 — 95,078
Total assets:2006 149,593 258,224 11,452 157,677 31,477 65,860 41,807 716,0902005 148,408 222,270 11,128 150,687 29,924 58,173 44,865 665,4552004 147,816 102,902 11,725 141,282 26,452 48,948 54,307 533,432
Capital expenditures:2006 2,101 7,217 38 3,730 592 5,391 328 19,3972005 2,129 7,730 29 8,119 638 2,207 7,214 28,0662004 3,510 1,109 86 3,903 567 858 370 10,403
Information about the Company’s operations by geographic area follows:
United States Mexico Canada Australia Europe Consolidated
Sales to external customers:2006 $550,254 $ — $13,520 $8,411 $143,706 $715,8912005 474,466 — 11,319 8,106 145,931 639,8222004 381,134 — 9,495 7,003 111,169 508,801
Long-lived assets:2006 300,502 6,785 2,544 2,561 118,797 431,1892005 270,540 6,759 2,482 2,634 113,521 395,9362004 190,336 — 2,345 2,574 98,755 294,010
■ 59 ■
NOTES TO CONSOLIDATED FINANCIAL STATEMENTS (continued)
(Dollar amounts in thousands, except per share data)

16. ACQUISITIONS:
Fiscal 2006:
Acquisition spending, net of cash acquired, during the year ended September 30, 2006 totaled $32,278, and primarilyincluded the following:
On March 1, 2006, the Company acquired Royal Casket Company (“Royal”), a distributor of primarily York brand casketsin the Southwest region of the United States. The transaction was structured as an asset purchase, with potentialadditional consideration payable contingent upon the operating performance of the acquired operations during thenext five years. The Company expects to account for this consideration as additional purchase price. The excess ofpurchase price over the fair market value of net assets acquired was allocated to goodwill. The acquisition was intendedto expand Matthews’ casket distribution capabilities in the Southwestern United States.
On February 23, 2006, the Company acquired The Doyle Group (“Doyle”), a provider of reprographic services to thepackaging industry, located in Oakland, California. The transaction was structured as an asset purchase, with potentialadditional consideration payable contingent upon the operating performance of the acquired operations during thenext three years. The Company expects to account for this consideration as additional purchase price. The excess ofpurchase price over the fair market value of net assets acquired was allocated to goodwill. The acquisition was intendedto expand the Company’s graphics business in the Western United States.
In September 2005, the Company acquired an additional 30% interest in S+T Gesellschaft fur Reprotechnik GmbH(“S+T”) which was paid in October 2005. The Company had acquired a 50% interest in S+T in 1998.
Fiscal 2005:
In July 2005, the Company acquired Milso, a leading manufacturer and marketer of caskets in the United States. Milso,headquartered in Brooklyn, New York, has manufacturing operations in Richmond, Indiana and maintains distributioncenters throughout the Northeast, Mid-Atlantic, Midwest and Southwest regions of the United States. The transactionwas structured as an asset purchase, at an initial purchase price of approximately $95,000. In connection with thecontingent consideration provisions of the acquisition agreement, the Company has agreed to pay additional purchaseconsideration of $7,000. The additional consideration, which will be paid in fiscal 2007, was recorded as additional purchaseprice as of September 30, 2006. The acquisition was intended to expand Matthews’ products and services in the UnitedStates casket market.
Acquired intangible assets of Milso include trade names with an assigned value of $5,800, which are not subject toamortization. Intangible assets also include customer relationships with an assigned value of $10,400 to be amortizedover their estimated useful lives of 20 years.
■ 60 ■
NOTES TO CONSOLIDATED FINANCIAL STATEMENTS (continued)
(Dollar amounts in thousands, except per share data)

The following table summarizes the estimated fair values of the assets acquired and liabilities assumed of Milso at the dateof acquisition.
Cash $ 197Trade receivables 13,143Inventories 17,975Property, plant and equipment 5,434Intangible assets 16,200Goodwill and other assets 63,152
Total assets acquired 116,101
Trade accounts payable 9,467Debt 1,207Other liabilities 3,022
Total liabilities assumed 13,696
Net assets acquired $102,405
In June 2005, the Company paid additional consideration of 5.0 million Euros ($6,000) to the minority owner of RudolfReproflex GmbH (“Rudolf”) under the terms of the original acquisition agreement. The Company had acquired a 75%interest in Rudolf in 2001.
Fiscal 2004:
In August 2004, the Company acquired The InTouch Group, Limited (“InTouch”), a leading provider of reprographic servicesto the packaging industry in the United Kingdom. InTouch is headquartered in Leeds, England and has operations inLondon, Portsmouth, Manchester and Boston, Massachusetts. The transaction was structured as a stock purchase, at acost of approximately $39,000. The acquisition was intended to further the Company’s position as a provider ofreprographic services to the European packaging industry.
In July 2004, the Company acquired The Cloverleaf Group, Inc. (“Cloverleaf”), a provider of merchandising solutions.Cloverleaf was formed by the merger of iDL, Inc., a merchandising solutions company headquartered near Pittsburgh,Pennsylvania, and Big Red Rooster, a marketing and design services organization located in Columbus, Ohio. The transactionwas structured as an asset purchase, at a cost of approximately $34,000. The transaction was structured to include potentialadditional consideration during the next six years contingent on the future growth in value of the acquired operations.The Company expects to account for this additional consideration as additional purchase price. The acquisition wasdesigned to expand the Company’s products and services into the merchandising solutions market.
■ 61 ■
NOTES TO CONSOLIDATED FINANCIAL STATEMENTS (continued)
(Dollar amounts in thousands, except per share data)

The following table summarizes the estimated fair values of the assets acquired and liabilities assumed of Cloverleaf andInTouch at their respective dates of acquisition.
Cloverleaf InTouch
Cash $ 295 $ 1,151Trade receivables 14,618 7,177Inventories 10,669 690Property, plant and equipment 5,450 2,921Intangible assets 8,000 11,681Goodwill and other assets 8,869 20,919
Total assets acquired 47,901 44,539
Trade accounts payable 4,743 1,313Customer prepayments 3,002 —Other liabilities 5,903 3,544
Total liabilities assumed 13,648 4,857
Net assets acquired $34,253 $39,682
In July 2004, the Company acquired Holjeron Corporation, an industrial controls manufacturer located near Portland,Oregon. The acquisition was structured as a stock purchase. In February 2005, additional consideration was paid inaccordance with the purchase agreement. The acquisition was a part of Matthews’ strategy to increase its presence in themarking products industry.
The following unaudited pro forma information for the years ended September 30, 2005 and 2004 presents a summaryof the consolidated results of Matthews combined with Milso, InTouch and Cloverleaf as if the acquisition had occurredon October 1, 2003:
2006 2005 2004
Sales $715,891 $707,222 $680,047Income before taxes 105,408 98,734 94,234Net income 66,444 61,614 57,665Earnings per share $2.06 $1.90 $1.77
These unaudited pro forma results have been prepared for comparative purposes only and include certain adjustments,such as interest expense on acquisition debt. The pro forma information does not purport to be indicative of the resultsof operations which actually would have resulted had the acquisition occurred on the date indicated, or which may resultin the future.
Matthews has accounted for these acquisitions using the purchase method and, accordingly, recorded the acquired assetsand liabilities at their estimated fair values at the acquisition dates. The excess of the purchase price over the estimated fairvalue of the net assets acquired was recorded as goodwill. The acquired goodwill in the InTouch acquisition was notdeductible for tax purposes.
■ 62 ■
NOTES TO CONSOLIDATED FINANCIAL STATEMENTS (continued)
(Dollar amounts in thousands, except per share data)

17. GOODWILL AND OTHER INTANGIBLE ASSETS:
Goodwill is not amortized but is subject to annual review for impairment. In general, when the carrying value of a reportingunit exceeds its implied fair value, an impairment loss must be recognized. For purposes of testing for impairment theCompany uses a combination of valuation techniques, including discounted cash flows. Intangible assets are amortizedover their estimated useful lives unless such lives are considered to be indefinite. A significant decline in cash flows generatedfrom these assets may result in a write-down of the carrying values of the related assets.
The Company performed its annual impairment reviews in the second quarters of fiscal 2006 and fiscal 2005 anddetermined that no adjustments to the carrying values of goodwill or other indefinite lived intangibles were necessary.
Changes to goodwill, net of accumulated amortization, during the years ended September 30, 2006 and 2005, follow.
Graphics Marking Merchandising
Bronze Casket Cremation Imaging Products Solutions Consolidated
Balance at September 30, 2004 $73,641 $ 40,706 $6,536 $58,618 $1,496 $8,019 $189,016Additions during period — 51,271 — 16,886 3,717 1,928 73,802Translation and other
adjustments (612) — — (1,534) — — (2,146)
Balance at September 30, 2005 73,029 91,977 6,536 73,970 5,213 9,947 260,672Additions during period — 24,005 — 8,502 — — 32,507Translation and other adjustments 1,149 — — 3,797 — — 4,946
Balance at September 30, 2006 $74,178 $115,982 $6,536 $86,269 $5,213 $9,947 $298,125
The additions to goodwill during fiscal 2006 related primarily to the acquisitions of Royal (Casket) and Doyle (GraphicsImaging). The additions to goodwill during fiscal 2005 primarily related to the acquisition of Milso (Casket), additionalownership acquired in S+T and Rudolf (Graphics Imaging), and additional consideration paid to complete the acquisitionof Holjeron (Marking Products) (see Note 16).
■ 63 ■
NOTES TO CONSOLIDATED FINANCIAL STATEMENTS (continued)
(Dollar amounts in thousands, except per share data)

The following tables summarize the carrying amounts and related accumulated amortization for intangible assets as ofSeptember 30, 2006 and 2005, respectively.
Carrying AccumulatedAmount Amortization Net
September 30, 2006:
Trade names $24,003 $ —)* $24,003Customer relationships 20,900 (2,714) 18,186Copyrights/patents/other 5,322 (2,546) 2,776
$50,225 $ (5,260) $44,965
September 30, 2005:
Trade names $23,585 $ —)* $23,585Customer relationships 20,778 (1,517) 19,261Copyrights/patents/other 4,952 (1,401) 3,551
$49,315 $ (2,918) $46,397
*Not subject to amortization.
The additions to intangible assets during fiscal 2006 related to the acquisitions of Royal and Doyle (see Note 16).
Amortization expense on intangible assets was $2,216, $1,826, and $498 in 2006, 2005 and 2004, respectively. Amortizationexpense is estimated to be $1,900 in 2007, $1,870 in 2008, $1,780 in 2009, $1,300 in 2010 and $1,300 in 2011.
18. ACCOUNTING PRONOUNCEMENTS:
In November 2005, the Financial Accounting Standards Board (“FASB”) issued FASB Staff Position (“FSP”) FAS 115-1 andFAS 124-1, “The Meaning of Other-Than-Temporary Impairment and Its Application to Certain Investments” (“FSP 115-1”), which provides guidance on determining when investments in certain debt and equity securities are consideredimpaired, whether that impairment is other-than-temporary, and on measuring such impairment loss. FSP 115-1 alsoincludes accounting considerations subsequent to the recognition of an other-than-temporary impairment and requirescertain disclosures about unrealized losses that have not been recognized as other-than-temporary impairments. FSP 115-1 was adopted by the Company in the second quarter of fiscal 2006 as required and had no material impact on theCompany’s consolidated financial position and results of operations.
In June 2006, FASB issued Interpretation No. 48, “Accounting for Uncertainty in Income Taxes” (FIN 48) which clarifies theaccounting for uncertainty in income taxes recognized in an enterprise’s financial statements in accordance with SFAS No.109, “Accounting for Income Taxes.” This interpretation prescribes a recognition threshold and measurement attribute forthe financial statement recognition and measurement of a tax position taken or expected to be taken in a tax return. FIN48 also provides guidance on derecognition, classification, interest and penalties, accounting in interim periods, disclosureand transition. Any resulting cumulative effect of applying the provisions of FIN 48 upon adoption will be reported as anadjustment to beginning retained earnings in the period of adoption. The Interpretation is effective for fiscal years beginningafter December 15, 2006. The Company is currently evaluating the impact of the adoption of FIN 48.
■ 64 ■
NOTES TO CONSOLIDATED FINANCIAL STATEMENTS (continued)
(Dollar amounts in thousands, except per share data)

In September 2006, the FASB issued SFAS No. 158, “Employers’ Accounting for Defined Benefit Pension and OtherPostretirement Plans” which amends SFAS 87, 88, 106 and 132(R). SFAS No. 158 requires employers to recognize theover-funded or under-funded status of defined benefit postretirement plans on the balance sheet and to recognize thecorresponding adjustment in other comprehensive income. In addition, the statement requires recognition in othercomprehensive income of gains or loss and prior service costs or credits that are not included as components of periodicbenefit expense. These provisions of the statement are effective for public companies for fiscal years ending after December15, 2006. Accordingly, the Company will adopt this provision of SFAS No. 158 prospectively for the year-end financialstatements dated September 30, 2007. If the Company had adopted SFAS No. 158 as of September 30, 2006, the liabilityfor pension and postretirement benefits would have increased approximately $10,000, deferred tax assets would haveincreased approximately $3,900 and equity (other accumulated comprehensive income) would have decreased byapproximately $6,100.
Further, SFAS No. 158 requires the Company to measure the plan assets and benefit obligations of defined benefitpostretirement plans as of the date of its year-end balance sheet. This provision of the SFAS No. 158 is effective for publiccompanies for fiscal years beginning after December 15, 2008. The Company currently measures plan assets and benefitobligations as of July 31 of each year. The Company is considering the implications of this provision and the feasibility ofearlier adoption of this portion of the statement. Upon adoption, this provision is not expected to have a material effecton the financial statements.
In September 2006, the FASB issued SFAS No. 157, “Fair Value Measurements.” This Statement defines fair value,establishes a framework for measuring fair value in generally accepted accounting principles, and expands disclosuresabout fair value measurements. The Statement applies under other accounting pronouncements that require or permitfair value measurements and does not require any new fair value measurements. The Statement is effective for financialstatements issued for fiscal years beginning after November 15, 2007. The adoption of SFAS No. 157 is not expected tohave a material impact on the Company’s consolidated financial position or results of operations.
■ 65 ■
NOTES TO CONSOLIDATED FINANCIAL STATEMENTS (continued)
(Dollar amounts in thousands, except per share data)

SUPPLEMENTARY FINANCIAL INFORMATION
Selected Quarterly Financial Data (Unaudited):
The following table sets forth certain items included in the Company’s unaudited consolidated financial statements foreach quarter of fiscal 2006 and fiscal 2005. Prior year amounts contained in this table have been restated for theretrospective adoption of Statement of Financial Standards (“SFAS”) No. 123 (revised 2004), “Share-Based Payment”. SeeNote 8 of the Notes to Consolidated Financial Statements.
Quarter Ended
Year Ended
December 31 March 31 June 30 September 30 September 30
(Dollar amounts in thousands, except per share data)
FISCAL YEAR 2006:
Sales $170,109 $181,068 $181,804 $182,910 $715,891
Gross profit 61,197 66,947 70,289 73,500 271,933
Operating profit 22,418 29,061 30,523 31,882 113,884
Net income 12,907 16,852 17,706 18,979 66,444
Earnings per share .40 .52 .55 .59 2.06
FISCAL YEAR 2005:
Sales $148,706 $156,243 $158,983 $175,890 $639,822
Gross profit 48,419 54,386 57,120 63,150 223,075
Operating profit 19,490 25,511 26,604 26,808 98,413
Net income 12,335 14,721 15,613 15,402 58,071
Earnings per share .38 .45 .49 .47 1.79
■ 66 ■
FINANCIAL STATEMENT SCHEDULE
SCHEDULE II — VALUATION AND QUALIFYING ACCOUNTS
Additions
Balance at Charged tobeginning of Charged to other Balance at
Description period expense accounts1 Deductions2 end of period
Allowance for Doubtful Accounts:
Fiscal Year Ended:
September 30, 2006 $10,547 $ 474 $ 890 $(1,082) $10,829
September 30, 2005 7,717 398 3,209 (777) 10,547
September 30, 2004 6,013 2,278 425 (999) 7,717
1 Amount comprised principally of acquisitions and purchase accounting adjustments in connection with acquisitions.2 Amounts determined not to be collectible, net of recoveries.
■ 67 ■

ITEM 9. CHANGES IN AND DISAGREEMENTS WITH ACCOUNTANTS ONACCOUNTING AND FINANCIAL DISCLOSURE.
There have been no changes in accountants or disagreements on accounting or financial disclosure between the Companyand PricewaterhouseCoopers LLP, Independent Registered Public Accounting Firm, for the fiscal years ended September 30,2006, 2005 and 2004.
ITEM 9A. CONTROLS AND PROCEDURES.
(a) Evaluation of Disclosure Controls and Procedures.
Based on their evaluation at the end of the period covered by this Annual Report on Form 10-K, the Company’s ChiefExecutive Officer and Chief Financial Officer have concluded that the Company’s disclosure controls and procedures (asdefined in Rule 13a-15(e) under the Securities Exchange Act of 1934 (the “Exchange Act”)) provide reasonable assurancethat information required to be disclosed by the Company in reports that it files or submits under the Exchange Act isrecorded, processed, summarized and reported within the time periods specified in Securities and Exchange Commissionrules and forms.
(b) Management’s Report on Internal Control over Financial Reporting.
Management’s Report on Internal Control over Financial Reporting is included in Management’s Report to Shareholdersin Item 8 of this Annual Report on Form 10-K.
(c) Attestation Report of the Registered Public Accounting Firm.
Management’s assessment of the effectiveness of the Company’s internal control over financial reporting as of September30, 2006 has been audited by PricewaterhouseCoopers LLP, an independent registered public accounting firm, as statedin their report which is included in Item 8 of this Annual Report on Form 10-K.
(d) Changes in Internal Control over Financial Reporting.
There have been no changes in the Company’s internal controls over financial reporting that occurred during the fiscalquarter ended September 30, 2006 that have materially affected, or are reasonably likely to materially affect, the Company’sinternal controls over financial reporting.
PART III
ITEM 10. DIRECTORS, OFFICERS and EXECUTIVE MANAGEMENT OF THE REGISTRANT.
In addition to the information reported in Part I of this Form 10-K, under the caption “Officers and Executive Managementof the Registrant”, the information required by this item as to the directors of the Company is hereby incorporated byreference from the information appearing under the captions “Proposal No. 1 – Elections of Directors”, “General InformationRegarding Corporate Governance – Audit Committee” and “Compliance with Section 16(a) of the Exchange Act” in theCompany’s definitive proxy statement, which involves the election of the directors and is to be filed with the Securities andExchange Commission pursuant to the Exchange Act of 1934, as amended, within 120 days of the end of the Company’sfiscal year ended September 30, 2006.
The Company’s Code of Ethics Applicable to Executive Management is set forth in Exhibit 14.1 hereto.
■ 68 ■

ITEM 11. EXECUTIVE COMPENSATION.
The information required by this item as to the compensation of directors and executive management of the Company ishereby incorporated by reference from the information appearing under the captions “Compensation of ExecutiveManagement and Retirement Benefits” and “Compensation of Directors” in the Company’s definitive proxy statementwhich involves the election of directors and is to be filed with the Commission pursuant to the Exchange Act, within 120days of the end of the Company’s fiscal year ended September 30, 2006. The information contained in the “Report ofthe Compensation Committee” and the “Comparison of Five Year Cumulative Return (Performance Graph)” is specificallynot incorporated herein by reference.
ITEM 12. SECURITY OWNERSHIP OF CERTAIN BENEFICIALOWNERS AND MANAGEMENT.
The information required by this item as to the ownership by management and others of securities of the Company ishereby incorporated by reference from the information appearing under the caption “Stock Ownership” in the Company’sdefinitive proxy statement which involves the election of directors and is to be filed with the Commission pursuant to theExchange Act, within 120 days of the end of the Company’s fiscal year ended September 30, 2006.
Equity Compensation Plans:
The Company has a stock incentive plan that provides for grants of incentive stock options, non-statutory stock optionsand restricted share awards in an aggregate number not to exceed 15% of the outstanding shares of the Company’scommon stock. The option price for each stock option that may be granted under the plan may not be less than the fairmarket value of the Company’s common stock on the date of grant. Outstanding stock options are exercisable in variousshare amounts based on the attainment of certain market value levels of Class A Common Stock but, in the absence of suchevents, options granted in fiscal 2005 and prior are exercisable in full for a one-week period beginning five years from thedate of grant. Options granted after fiscal 2006 will not allow for such one-week exercise period. In addition, optionsgenerally vest in one-third increments after three, four and five years, respectively, from the grant date (but, in any event,not until the attainment of the certain market value levels described above). The options expire on the earlier of ten yearsfrom the date of grant, upon employment termination, or within specified time limits following voluntary employmenttermination (with the consent of the Company), retirement or death.
Under the Company’s Director Fee Plan, directors who are not also officers of the Company each receive, as an annualretainer fee, either cash or shares of the Company’s Class A Common Stock equivalent to $30,000. Where the annualretainer fee is provided in shares, each director may elect to be paid these shares on a current basis or have such sharescredited to a deferred stock account as phantom stock, with such shares to be paid to the director subsequent to leavingthe Board. Directors may also elect to receive the common stock equivalent of meeting fees credited to a deferred stockaccount. The value of deferred shares is recorded in other liabilities. Shares deferred under the Director Fee Plan atSeptember 30, 2006, 2005 and 2004 were 49,569, 51,313, and 50,064, respectively. Additionally, beginning in fiscal2005, directors who are not also officers of the Company each receive an annual stock-based grant (non-statutory stockoptions, stock appreciation rights and/or restricted shares) with a value of $40,000. Stock options granted under theDirector Fee Plan during the years ended September 30, 2006 and 2005 were 4,800 and 17,500, respectively. All of thestock options were outstanding and unvested at September 30, 2006. Additionally, 4,800 shares of restricted stock weregranted in March 2006 under the plan. The restricted shares generally vest two years after the date of issuance. A totalof 500,000 shares have been authorized to be issued under the Director Fee Plan.
■ 69 ■

The following table provides information about grants under the Company’s equity compensation plans as of September 30, 2006:
Equity Compensation Plan Information
Number of securitiesremaining availablefor future issuance
Number of securities Weighted-average under equityto be issued upon exercise price compensation plans
exercise of of outstanding (excludingoutstanding options, options, warrants securities reflected
Plan category warrants and rights and rights in column (a) )
(a) (b) (c)
Equity compensation plansapproved by security holders:
Stock Incentive Plan 2,529,451 $28.75 2,215,6931
Employee Stock Purchase Plan — — 1,749,61322,
Director Fee Plan 71,869 35.03 ,393,0953
Equity compensation plansnot approved by security holders None None None
Total 2,601,320 $28.80 4,358,4012,3
1 The aggregate number of shares available for grant under such plan cannot exceed 15% of the outstanding shares of the Company’s common stockand includes up to 1,000,000 shares that can be issued as restricted stock under the Company’s 1992 Stock Incentive Plan.
2 Shares under the Employee Stock Purchase Plan (the “Plan”) are purchased in the open market by employees at the fair market value of the Company’sstock. The Company provides a matching contribution of 10% of such purchases subject to certain limitations under the Plan. As the Plan is an openmarket purchase plan, it does not have a dilutive effect.
3 Shares of restricted stock may be issued under the Director Fee Plan.
ITEM 13. CERTAIN RELATIONSHIPS AND RELATED TRANSACTIONS.
The information required by this item as to certain relationships and transactions with management and other relatedparties of the Company is hereby incorporated by reference from the information appearing under the captions “ProposalNo. 1 – Election of Directors” and “Certain Transactions” in the Company’s definitive proxy statement, which involves theelection of directors and is to be filed with the Commission pursuant to the Exchange Act, within 120 days of the end ofthe Company’s fiscal year ended September 30, 2006.
ITEM 14. PRINCIPAL ACCOUNTING FEES AND SERVICES.
The information required by this item as to the fees billed and the services provided by the principal accounting firm ofthe Company is hereby incorporated by reference from the information appearing under the caption “Relationship withIndependent Registered Public Accounting Firm” in the Company’s definitive proxy statement, which involves the electionof directors and is to be filed with the Commission pursuant to the Exchange Act within 120 days of the end of theCompany’s fiscal year ended September 30, 2006.
■ 70 ■
ITEM 12. SECURITY OWNERSHIP OF CERTAIN BENEFICIAL OWNERS AND MANAGEMENT (continued)

PART IV
ITEM 15. EXHIBITS, FINANCIAL STATEMENT SCHEDULES, AND REPORTS ON FORM 8-K.
(a) 1. Financial Statements:
The following items are included in Part II, Item 8:Pages
Management’s Report to Shareholders 34
Report of Independent Registered Public Accounting Firm 35-36
Consolidated Balance Sheets 37-38
Consolidated Statements of Income 39
Consolidated Statements of Shareholders’ Equity 40
Consolidated Statements of Cash Flows 41
Notes to Consolidated Financial Statements 42-65
Supplementary Financial Information 66
2. Financial Statement Schedules:
Schedule II - Valuation and Qualifying Accounts is included on page 67 in Part II, Item 8 of this Annual Report onForm 10-K.
3. Exhibits Filed:
The index to exhibits is on pages 73-75.
(b) Reports on Form 8-K:
On July 24, 2006 Matthews filed a Current Report on Form 8-K under Item 2 in connection with a press releaseannouncing its earnings for the third fiscal quarter of 2006.
On September 19, 2006 Matthews filed a Current Report on Form 8-K under Item 5 in connection with theannouncement of a new executive appointment.
■ 71 ■

SIGNATURES
Pursuant to the requirements of Section 13 or 15(d) of the Securities Exchange Act of 1934, the Registrant has duly causedthis report to be signed on its behalf by the undersigned, thereunto duly authorized, on December 13, 2006.
MATTHEWS INTERNATIONAL CORPORATION____________________________________
(Registrant)
/s/ Joseph C. Bartolacci_________________________________
By Joseph C. BartolacciPresident and Chief Executive Officer
Pursuant to the requirements of the Securities Exchange Act of 1934, this report has been signed below by the followingpersons on behalf of the Registrant and in the capacities indicated on December 13, 2006:
/s/ Joseph C. Bartolacci /s/ Steven F. Nicola_________________________________ _________________________________
Joseph C. Bartolacci Steven F. NicolaPresident and Chief Executive Officer Chief Financial Officer, Secretary(Principal Executive Officer) and Treasurer (Principal Financial
and Accounting Officer)
/s/ David M. Kelly /s/ Robert G. Neubert_________________________________ _________________________________
David M. Kelly, Chairman of the Board Robert G. Neubert, Director
/s/ David J. DeCarlo /s/ John P. O’Leary, Jr._________________________________ _________________________________
David J. DeCarlo, Director John P. O’Leary, Jr., Director
/s/ Robert J. Kavanaugh /s/ William J. Stallkamp_________________________________ _________________________________
Robert J. Kavanaugh, Director William J. Stallkamp, Director
/s/ Glenn R. Mahone /s/ John D. Turner_________________________________ _________________________________
Glenn R. Mahone, Director John D. Turner, Director
■ 72 ■

MATTHEWS INTERNATIONAL CORPORATION AND SUBSIDIARIES
EXHIBITS
INDEX
The following Exhibits to this report are filed herewith or, if marked with an asterisk (*), are incorporated by reference.Exhibits marked with an “a” represent a management contract or compensatory plan, contract or arrangementrequired to be filed by Item 601(b)(10)(iii) of Regulation S-K.
Exhibit Prior Filing or Sequential
No. Description Page Numbers Herein
3.1 Restated Articles of Incorporation * Exhibit Number 3.1 to Form 10-Kfor the year ended September 30, 1994
3.2 Restated By-laws * Exhibit Number 3.1 to Form 8-Kdated July 22, 1999
4.1 a Form of Revised Option Agreement of Repurchase Exhibit Number 4.5 to Form 10-K(effective October 1, 1993) * for the year ended September 30, 1993
4.2 Form of Share Certificate for Class A Common Stock * Exhibit Number 4.9 to Form 10-K for the year ended September 30, 1994
10.1 Revolving Credit Facility * Exhibit Number 10.1 to Form 10-Kfor the year ended September 30, 2001
10.2 First Amendment to Revolving Credit Facility* Exhibit Number 10.1 to Form 10-Qfor the quarter ended March 31, 2004
10.3 Second Amendment to Revolving Credit Facility * Exhibit Number 10.1 to Form 10-Qfor the quarter ended December 31, 2004
10.4 a Supplemental Retirement Plan Filed Herewith
10.5 a 1992 Stock Incentive Plan (as amended through Exhibit Number 10.1 to Form 10-QApril 25, 2006) * for the quarter ended March 31, 2006
10.6 a Form of Stock Option Agreement * Exhibit Number 10.1 to Form 10-Qfor the quarter ended December 31, 1994
10.7 a 1994 Director Fee Plan (as amended through Exhibit Number 10.2 to Form 10-Q April 25, 2006) * for the quarter ended March 31, 2006
10.8 a 1994 Employee Stock Purchase Plan * Exhibit Number 10.2 to Form 10-Qfor the quarter ended March 31, 1995
■ 73 ■

10.9 a Key Employee Employment Agreement by and Exhibit Number 10.2 to Form 8-Kbetween The York Group, Inc. and Harry Pontone dated July 14, 2005dated May 28, 2005 and effective July 11, 2005*
10.10 Agreement and Plan of Merger By and Among Exhibit Number 10.3 to Form 8-KMatthews International Corporation, Empire Merger dated May 24, 2001Corp., and The York Group, Inc., dated as ofMay 24, 2001*
10.11 Asset Purchase Agreement between I.D.L. Incorporated Exhibit Number 10.1 to Form 10-Qand Hugh Andrew, L.P. and Big Red Rooster, Inc. and for the quarter ended June 30, 2004The Cloverleaf Group, L.P. and iDL shareholders andthe BRR shareholders and The Cloverleaf Group, Inc.and Matthews International Corporation datedas of July 19, 2004*
10.12 Share Sale and Purchase Agreement between Graeme Exhibit Number 10.11 to Form 10-K Phillip King and Brian Ernest Tottman and Robert Greig for the year ended September 30, 2004Watkins and Geoffrey William Roberts andHelen M. King and Josephine Tottman andSally R. Watkins and Jennifer R. Roberts andMatthews Holding Company (U.K.) Limited.
10.13 Asset Purchase Agreement by and among The York Exhibit Number 10.1 to Form 8-KGroup, Inc., Midnight Acquisition Corporation, Milso dated on July 14, 2005Industries, Inc., Milso Industries, LLC, SBC HoldingCorporation, the Shareholders identified therein andMatthews International Corporation
14.1 Form of Code of Ethics Applicable to Executive Exhibit Number 14.1 to Form 10-K Management for the year ended September 30, 2004
21 Subsidiaries of the Registrant Filed Herewith
23 Consent of Independent Registered Public Filed HerewithAccounting Firm
31.1 Certification of Principal Executive Officer for Filed Herewith Joseph C. Bartolacci
31.2 Certification of Principal Financial Officer for Filed HerewithSteven F. Nicola
■ 74 ■
EXHIBITS INDEX (continued)
Exhibit Prior Filing or Sequential
No. Description Page Numbers Herein

32.1 Certification Pursuant to 18 U.S.C. Section 1350, Filed Herewithas Adopted Pursuant to Section 906 of theSarbanes-Oxley Act of 2002, of Joseph C. Bartolacci
32.2 Certification Pursuant to 18 U.S.C. Section 1350, Filed Herewithas Adopted Pursuant to Section 906 of theSarbanes-Oxley Act of 2002, of Steven F. Nicola
Copies of any Exhibits will be furnished to shareholders upon written request. Requests should be directed toMr. Steven F. Nicola, Chief Financial Officer, Secretary and Treasurer of the Registrant.
■ 75 ■
Exhibit Prior Filing or Sequential
No. Description Page Numbers Herein
EXHIBITS INDEX (continued)

PAGE LEFT INTENTIONALLY BLANK

Directors
David M. KellyChairman of the Board
Joseph C. BartolacciPresident and Chief Executive Officer
David J. DeCarloVice Chairman
Robert J. KavanaughRetired Partner, Arthur Andersen LLP
Glenn R. MahonePartner, Reed Smith LLP
Robert G. NeubertRetired Partner, Ernst & Young LLP
John P. O’Leary, Jr.Retired Senior Vice President, SCA North America
William J. StallkampRetired Vice Chairman, Mellon Financial Corporation
John D. TurnerRetired Chairman and Chief Executive Officer,Copperweld Corporation
M a t t h e w s I n t e r n a t i o n a l C o r p o r a t i o n & S u b s i d i a r i e s
Corporate Office
Two NorthShore CenterPittsburgh, Pennsylvania 15212-5851Phone: (412) 442-8200 • Fax: (412) 442-8290E-mail: [email protected] website: www.matw.com
Annual Meeting
Thursday, February 15, 2007 ~ 6:00 p.m.Sheraton Station Square Hotel300 West Station Square DrivePittsburgh, Pennsylvania 15219
Form 10-K
A copy of the Matthews International CorporationAnnual Report to the Securities and ExchangeCommission on Form 10-K is also available toshareholders on the Company’s website.
Officers & Executive Management
David M. KellyChairman of the Board
of Directors
David J. DeCarloVice Chairman
David F. BeckController
Martin J. BeckPresident, Brand Solutions
Brian J. DunnPresident, Marking
Products Division
David H. HewittPresident, Bronze Division
Transfer Agent, Registrar &Dividend Disbursement Agent
Questions regarding stock certificates, replacement of lostcertificates, address changes, account consolidation, and lost ormisplaced dividends should be addressed to:
Computershare Investor Services LLCP.O. Box 2388Chicago, Illinois 60690-2388Phone: (888) 294-8217 • Fax: (312) 601-4332Internet: www.computershare.com
Inquiries
Matthews International Corporation welcomes and encouragesquestions and comments from its shareholders, potential investors,financial professionals, institutional investors and security analysts.Interested parties should contact Steven F. Nicola, Chief FinancialOfficer, Secretary and Treasurer, by mail or telephone at theCompany’s Corporate Office.
CORPORATE INFORMATION
Joseph C. BartolacciPresident and
Chief Executive Officer
Steven F. NicolaChief Financial Officer,
Secretary and Treasurer
Harry A. PontonePresident, Casket Division
Paul F. RahillPresident, Cremation Division
Franz J. SchwarzPresident, Graphics Europe
Brian E. TottmanManaging Director, Packaging
Graphics U.K. and U.S.

Corporate Office
Two NorthShore Center
Pittsburgh, PA 15212-5851
Phone: (412) 442-8200
Fax: (412) 442-8290
Internet: www.matw.com
MatthewsI N T E R N A T I O N A L