a tool for making environmental policypdf.wri.org/wri_mfa_policy.pdf · a tool for making...
TRANSCRIPT

IDDO K. WERNICK
FRANCES H. IRWIN
MATERIAL FLOWS ACCOUNTSA Tool for Making Environmental Policy
A b o u t W o r l d R e s o u r c e s I n s t i t u t e
World Resources Institute is an environmentalresearch and policy organization that creates solutions to protect the planet and improve people’s lives.
WRI’s work is concentrated on achieving progresstoward four key goals:
• Protect Earth’s living systems• Increase access to environmental information• Create sustainable enterprise and opportunity• Reverse global warming.
WRI is an independent, non-partisan organizationthat works closely with governments, the privatesector, and civil society groups in more than 100countries around the world.
Its strength is the ability to catalyze permanentchange through partnerships that implement innovative, incentive-based solutions founded upon hard, objective data. WRI believes that harnessing the power of markets will ensure real,not cosmetic, change.
WRI demands measurable results from its work;ideas must lead to action.
World Resources Institute10 G Street, NEWashington, DC 20002 USA
w w w . w r i . o r g
W R I R E P O R T
W orld
Resources
I ns t itut e

M A T E R I A L F L O W S A C C O U N T SA TOOL FOR MAKING ENVIRONMENTAL POLICY
IDDO K. WERNICK
FRANCES H. IRWIN
World
Resources
Institute
W A S H I N G T O N , D C
JO H. TUNSTALLEDITOR
HYACINTH BILLINGSPUBLICATIONS DIRECTOR
MAGGIE POWELLLAYOUT
Each World Resources Institute report represents a timely, scholarly treatment of a subject of public concern. WRI takes responsibility for choosing the study topics and guaranteeing its authors and researchers freedom of inquiry. It also
solicits and responds to the guidance of advisory panels and expert reviewers. Unless otherwise stated, however, all the interpretation and fi ndings set forth in WRI publications are those of the authors.
Copyright © 2005 World Resources Institute. All rights reserved.
ISBN 1-56973-566-2

WRI: MATERIAL FLOWS ACCOUNTS
III
C O N T E N T S
Acknowledgments ........................................................................................ iv
Executive Summary ......................................................................................1
1. Introduction ..............................................................................................6
2. A Useful Tool for Environmental Policymaking ....................................10
3. Frameworks for Material Flows Accounting .........................................16
4. The Material Flows Database and a Material Flows Data Sheet ............20
5. Case Studies: Examining Five Hazardous Chemicals ..........................29
6. Next Steps in Establishing U.S. Material Flows Accounts ....................33
References .....................................................................................................36
Appendix A: Materials Covered in the WRI Material Flows Database ......40
Appendix B: Glossary of Terms ....................................................................42

WRI: MATERIAL FLOWS ACCOUNTS
IV
A C K N O W L E D G M E N T S
We want to acknowledge the many colleagues who have generously given their time and in-formation to help us develop this report. WRI has now worked in the fi eld of material fl ows accounting for almost ten years, building on the data, analyses, and ideas of colleagues in numerous educational organizations, research institutes, and governments. Even with years of work behind us, we are continually uncovering new ways to measure and monitor the fl ows of materials through the environment and into and out of the formal economy.
With respect to this report, we want to thank, specifi cally, Allan Abramson, Steve Young, Angie Leith, and Priscilla Halloran all of EPA, Kather-ine Johnson (USGS), Marina Fischer-Kowalski (Klagenfurt University, Vienna), and Greg Norris (Harvard School of Public Health) for their com-ments and suggestions on how to improve our work. We also want to thank Rob Wolcott, Kevin Baumert, Frances Seymour, Janet Ranganathan, and Lauretta Burke, our WRI colleagues, for their critical reading of the manuscript.
Special thanks to Donald Rogich, Dan Tunstall, Amy Cassara, and David Jhirad, who worked on the project with us and provided valuable sug-gestions, criticisms, and information along the
way. We also want to acknowledge Gracia Matos and colleagues at the U.S. Geological Survey for helping us develop the data and the account-ing methods outlined in the report. The fi eld of Material Flows Accounting is only now emerging as a valuable addition to the social and economic accounting programs that dominate our ability to guide and infl uence policy. It is our hope that this report will help to convince government agencies of the necessity of implementing na-tional-level accounting of material fl ows.
Thanks also to Jo Tunstall (Editor), Hyacinth Billings (Publications Director), and Maggie Powell (Design and Layout) for their thoughtful, imaginative, and thorough work in bringing this work to completion.
Finally, we wish to thank Derry Allen and Barbara Karn of the Environmental Protection Agency for their guidance and encouragement. They have supported WRI’s work on material fl ows over the years and have brought their knowledge and persistence to bear on the re-search and application of material fl ows in EPA. This project was conducted under a cooperative agreement and with fi nancial support from the Environmental Protection Agency, which we acknowledge with our sincere thanks.

WRI: MATERIAL FLOWS ACCOUNTS
1
E X E C U T I V E S U M M A R Y
economy, from extraction, processing, and man-ufacturing to use, reuse, recycling, or disposal.
National Income Accounts, initiated in the 1930s and formalized in the federal government in the 1940s, still provide a foundation for U.S. fi scal and monetary policy. The need to provide these numbers is now taken for granted. Gov-ernment leaders and managers would not think of making fi scal or monetary policy without them. Members of the public look to indicators based on these accounts to make their decisions. Similarly, companies and investors cannot do business without the numbers from fi nancial ac-counting. Yet policymakers, fi rms, and the public lack any similar set of numbers for the material fl ows that are at the center of environmental is-sues.
This policy brief explains why material fl ows are critical to environmental quality and propos-es next steps for monitoring them by establish-ing a material fl ows accounting framework for the United States. It describes a pilot database and the material fl ows data sheets (MFDSs) that would be used for organizing data to be entered into the database. Such a database would supply suffi cient detail for supporting national policies intended to stimulate more productive use of resources and reduce environmental releases
As industrial economies mature, the heart of the environmental challenge comes from maintaining the continual fl ow of
goods and services to satisfy society’s needs for housing, food, energy, transport, and recreation while not destroying the natural resources that underlie the economy. The way society meets its needs determines the types and amounts of ma-terials—ranging from fuels and timber to fertiliz-ers and metals—that fl ow from the environment, through the economy, and back into the natural environment. Environmental consequences, good and bad, depend on the way a material is extracted, the nature of its release, how much is released, how it is released, and where it fl ows throughout its life cycle. A coherent approach to accounting for the fl ow of materials integrates two major concerns: the capacity of ecosystems to provide natural resources for extraction and use and the capacity of the earth and human so-ciety to handle pollution, greenhouse gases, toxic contamination, and other wastes.
Material Flows Accounting (MFA) tracks the amounts of materials—as classes or individual substances—that enter the economy, accumulate in capital stock such as housing and automo-biles, or exit to the environment as waste. In short, MFA documents the commercial life cycle of materials that become part of the industrial

WRI: MATERIAL FLOWS ACCOUNTS
2
of materials that harm human and ecologi-cal health. The ultimate goal of this effort is to encourage and support the regular compilation and dissemination of material fl ows accounts (MFAs) in the United States by the federal gov-ernment.
FindingsMaterial fl ows accounts provide a foundation for making and evaluating environmental policy decisions at both strategic and operational levels. MFA data offer government leaders a sound basis for setting strategic targets and tracking the effectiveness of environmental policies. The data can also help policymakers understand and deal with the origins of specifi c environmental problems. MFAs provide the data to support environmental performance indicators in much the same way that the national economic ac-counts support such economic indicators as expenditures per capita, debt/equity ratios, and the gross domestic product (GDP).
During the mid-1990s, an international team led by the World Resources Institute (WRI) generated national estimates of material in-puts in the economies of four industrial coun-tries—Germany, Japan, the Netherlands, and the United States—and published the fi ndings in 1997 in Resource Flows: The Material Basis of Industrial Economies. The next phase of the work covered the material outputs for the same four countries plus Austria. The results were pub-lished in 2000 in The Weight of Nations: Material Outfl ows from Industrial Economies.1
Analysis of the indicators published in The Weight of Nations showed that, while industrial economies may be using materials more ef-
fi ciently as their economies expand, total waste generation continued to increase in all of the countries considered. The WRI study also found that outputs of some hazardous materials to the environment had fallen or stabilized. However, the total output of potentially hazardous materi-als had risen nearly 30 percent in the United States between 1975 and 1996, due largely to the growing use of synthetic organic chemicals in products as well as contaminants associated with fossil fuels.2 Because materials are not uniform in their properties or their potential for environ-mental impact, indicators of total material fl ows through the economy need to be supplemented by indicators for individual materials or materi-als classes. Knowing the amount of output by material or class, especially if distinguished by uses, is a key step toward understanding likely impact on the environment.
At the operational level, material fl ows data can help identify the sources of environmental problems and the most effective opportunities for policy intervention. For example, when the origins of silver found in the San Francisco Bay puzzled public offi cials, material fl ows analysis identifi ed the sources as photo labs and dental offi ces, which led to a more focused and cost-effective environmental policy.3 Over the past decade, material fl ows analysis highlighted the presence of arsenic in a widely dispersed consumer product, pressure-treated lumber. Combined with data on the presence of arsenic in playgrounds and residential decks using the lumber, the use of material fl ows data helped lead the U.S. Environmental Protection Agency (EPA) to take action in 20034 by limiting the use of such lumber.
Material fl ows accounts provide a basis for choosing cost-effective environmental solu-

WRI: MATERIAL FLOWS ACCOUNTS
3
tions. Understanding the fl ow of materials can help policymakers address the shift in pollution sources from one part of the environment to another, for example, from cadmium emissions at mines and smelters to growing stocks of cadmium batteries in solid waste landfi lls across the country.
More fundamentally, the accounts can iden-tify opportunities to address multiple problems sharing a common origin. For example, the apparently separate problems of a Dead Zone in the Gulf of Mexico and climate change both relate to the increased fl ow of nitrogen from fertilizers used on farms. Changing fertilizer use addresses both problems.
The accounts can also reveal opportunities for greater national resource productivity by exploit-ing by-product synergies that reduce waste and save costs as in the case of metallurgical wastes used for cement manufacture5 or the use of agricultural wastes to replace petrochemical feedstocks.6
Material fl ows accounts can improve com-munication among policymakers and provide detailed information for public use. MFAs offer a common source of data that technical experts, government managers, and U.S. citizens can use to set targets and track the effectiveness of environmental policies. The indicators can help the public participate effectively in policymak-ing and provide them with the information they need to make personal decisions such as where to live or where and how to establish a business. By providing easy-to-understand indicators, MFAs can facilitate more informed policy debate on issues such as choosing sites for new facili-ties and can support more effective changes in how society uses its materials.
Basic data already exist for hundreds of ma-terials, including metals, minerals, fuels, tim-ber, agricultural products, and some industrial chemicals. MFAs can draw from a broad array of existing environmental, resource, and economic data sources within public and private sectors. However, without an agreed material fl ows framework, these data cannot provide detailed information in a standardized form about the throughput of materials in the economy over the life cycle of those materials. Individual efforts to set policy for a substance across its life cycle en-tail costly, one-at-a-time initiatives to locate and reorganize information from existing sources and to fi ll in missing data.
To standardize MFA information, WRI has de-veloped a pilot MFA database that covers material fl ows for more than 160 primary material inputs as well as many hundreds of outputs. The data-base is available at <http://materials.wri.org/>.
Analysis of available material fl ows data for priority chemicals for hazardous waste minimi-zation shows both data gaps and the potential usefulness of standardized data organized by a material’s life cycle. WRI’s analysis of fi ve substances designated by EPA as waste mini-mization priority chemicals—cadmium, hexa-chlorobenzene, naphthalene, pendimethalin, and trifl uralin—showed a general lack of data sources for synthetic organic chemicals.
Publicly available data on commercially pro-duced chemicals across their life cycles remain scarce, especially for the use phase and especial-ly as one moves up the value chain from primary feedstocks to intermediates to specialty chemi-cals. The Census Bureau and the International Trade Commission at the U.S. Department of Commerce have traditionally collected informa-

WRI: MATERIAL FLOWS ACCOUNTS
4
tion on domestic and foreign chemical ship-ments, but such data collection was signifi cantly curtailed in the mid-1990s. While some govern-ment offi ces, trade associations, and indepen-dent research institutes do collect some data on chemicals, proprietary considerations have been used to prevent their publication.
The EPA’s Toxics Release Inventory (TRI) currently provides standard information on the amounts of about 650 substances entering the environment from industrial facilities, primarily at the manufacturing stage. Data from TRI for the fi ve priority chemicals show an average of 62 percent reduction in air emissions of these chemicals, while TRI data on other releases of these substances and waste transfers show some increases. Remarkably, the amounts of these chemicals going into products remain largely unmonitored by existing systems, even though the products may comprise the main source of hazardous outputs to the environment. By organizing existing data by the stages of a material’s life cycle, material fl ows accounts can highlight fl ows for which data are now often missing, such as the amount of volatile organic compounds (VOCs) emitted from consumer products, and can offer policy insights.
Experience in developing material fl ows frameworks is growing around the world at na-tional, corporate, and facility levels. Macroscopic material fl ows indicators have been adopted in a growing number of countries and are now regularly published by the European Union7 and some member countries. In Japan, they provide a formal basis for government policy goals.8 Germany and Japan have both established physi-cal input-output tables that are linked to their economic input-output tables as part of their national environmental statistical systems.
Nordic product registries provide a data source for risk managers and also offer a public data-base with information on the amounts of several hundred chemicals fl owing into the economy, including their use in consumer products. In the United States, New Jersey and Massachusetts require data on material fl ows from facilities to encourage industrial practices that prevent pollution and to quantify the amount of hazard-ous material leaving factories in products. At the corporate level, no detailed protocol has yet been developed for reporting on materials, though some companies do provide some material fl ows data (mostly of outputs of waste and pollution) in their environmental or sustainability reports.
At present, the United States still lacks a comprehensive approach to material fl ows ac-counts. It is time to change that. The United States should develop and maintain a material fl ows accounting framework at the national level. Progress on U.S. environmental problems continues to be tracked for many individual sub-stances, mainly for compliance with pollution control or waste management standards. But, as a previous WRI analysis concluded, “Physi-cal accounts are urgently needed because our knowledge of resource use and waste outputs is surprisingly limited.”9 Stated even more strongly, the Committee on Material Flows of Natural Resources, Products, and Residuals of the U.S. National Academy of Sciences, in its 2003 report, stressed the national need for “a consistent material fl ows accounting framework to integrate existing and future data.”10

WRI: MATERIAL FLOWS ACCOUNTS
5
Recommendations This policy brief recommends three practical steps toward institutionalizing material fl ows accounts in the United States:
1. Develop a network of resource, environmen-tal, and economic data providers—including information and statistical offi ces—to expand and improve the data protocols for compiling and managing the data.
2. Identify the user community and evaluate methods for presenting material fl ows data that are policy relevant and accessible to the public.
3. Assemble a broad-based partnership of data providers and users to take the lead in institu-tionalizing material fl ows accounts, a pro-cess that is likely to require a congressional mandate and the creation of a dedicated staff within the U.S. federal government.

WRI: MATERIAL FLOWS ACCOUNTS
6WRI: MATERIAL FLOWS ACCOUNTS
6
1
I N T R O D U C T I O N
Material fl ows accounts (MFAs) offer another kind of accounting system that can facilitate the integration of environmental and economic poli-cies and prove essential to environmental policy-making. These accounts can help policymakers, business managers, and the public act before problems emerge by pointing to their origins and possible solutions. Similar to national income accounts, MFAs need to support both aggregate indicators and indicators that rely on detailed data on the transactions of a single resource sec-tor, region, or environmental media.
By examining the changes in materials cycles, society will be better prepared to answer such questions as: Are policies serving to break the link between economic growth and the amounts of materials used? Are policies providing incentives for business to design products and processes that avoid dispersion of hazardous materials into the environment? Is use of biodegradable materials in consumer products increasing? Are conversion effi ciencies for natural resources to consumer products improving? How are shifts in the nature of the economy (from manufacturing to services and use of information technology) changing the amounts and types of materials used?
Data collection on the fl ow of materials has been developed in a range of governmental pro-
Material fl ows accounts (MFAs) track the amounts of materials—ranging from timber and fuel to metals and agricul-
tural products—as they enter and exit the econo-my through various types of transactions. These materials can accumulate in capital stock such as housing and automobiles or exit to the environ-ment at any phase of their commercial life cycle, from extraction to processing, manufacturing, use, disposal, or recycling. Figure 1 shows the re-lationship between fl ows of material inputs and outputs and the phases of a material’s life cycle.
National Income Accounts date back to the 1930s and the 1940s when the United States developed them to help manage the economy during the Great Depression and World War II. Today, they are considered indispensable. Poli-cymakers would not think of making fi scal or monetary policy without the numbers that the Bureau of Economic Analysis and other agencies provide. The same holds true for companies that could no longer conceive of doing business with-out access to national economic indicators based on the National Income Accounts. To address different economic concerns, some of these in-dicators rely on broad aggregates of fi gures from across the economy, while others use data selec-tively to highlight fi nancial indicators specifi c to sectors or fi rms.

WRI: MATERIAL FLOWS ACCOUNTS
7WRI: MATERIAL FLOWS ACCOUNTS
7
grams.11 Beginning with historic interest in the mineral wealth in the western United States and supplies of strategic materials during World War II and the Cold War,12 federal resource agencies have collected data on natural resource produc-tion for more than a century. The Interior and Agriculture departments have long taken the lead in collecting data on the natural resources and primary organic and inorganic materi-als that enter the national economy. Concerns regarding energy supplies and markets during the 1970s spurred the creation of the Energy Information Administration within the newly established U.S. Department of Energy. These activities aim to monitor industrial growth and to provide a national data repository for re-source-based industries.
Data on outputs to the environment have developed more recently. The U.S. Congress es-tablished the Environmental Protection Agency
in 1970. At the same time, Congress began to adopt landmark laws to keep pollutants out of the air and water and to improve the manage-ment of wastes. These laws mandated collection of data, in large part to measure compliance with standards limiting pollution levels in the air and water or to track the handling of waste on land.
The inaugural report issued by the White House Council on Environmental Quality (CEQ) in 1970 pointed to the interrelationship of sepa-rate pollution problems and recognized that “a systems approach is needed, but what kind of a system? The pollution system, the materials and resources use system, the land use system, the water resources or atmospheric system?”13 Despite institutional changes that aimed to coor-dinate environmental and resource protection ac-tivities, new laws led to separate programs orga-nized by individual problems such as pesticides or environmental media such as air and water.
FIGURE 1 THE FLOW OF MATERIALS THROUGH THE COMMERCIAL LIFE CYCLE
Source: WRI Material Flows Project.
WRI: MATERIAL FLOWS ACCOUNTS
8
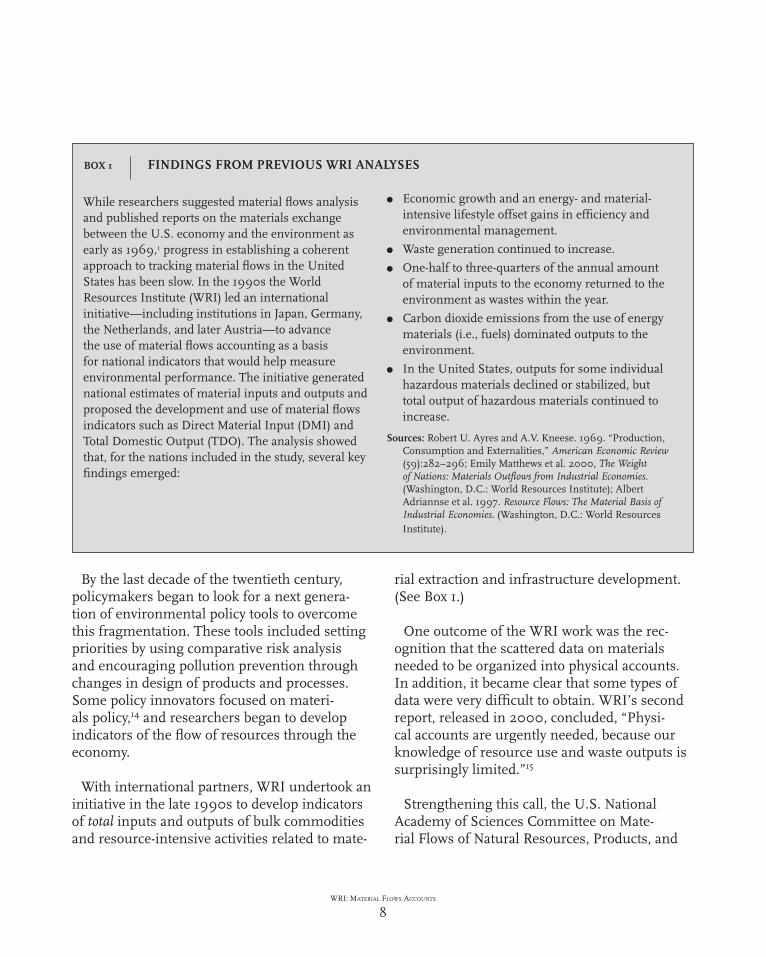
By the last decade of the twentieth century, policymakers began to look for a next genera-tion of environmental policy tools to overcome this fragmentation. These tools included setting priorities by using comparative risk analysis and encouraging pollution prevention through changes in design of products and processes. Some policy innovators focused on materi-als policy,14 and researchers began to develop indicators of the fl ow of resources through the economy.
With international partners, WRI undertook an initiative in the late 1990s to develop indicators of total inputs and outputs of bulk commodities and resource-intensive activities related to mate-
rial extraction and infrastructure development. (See Box 1.)
One outcome of the WRI work was the rec-ognition that the scattered data on materials needed to be organized into physical accounts. In addition, it became clear that some types of data were very diffi cult to obtain. WRI’s second report, released in 2000, concluded, “Physi-cal accounts are urgently needed, because our knowledge of resource use and waste outputs is surprisingly limited.”15
Strengthening this call, the U.S. National Academy of Sciences Committee on Mate-rial Flows of Natural Resources, Products, and
BOX 1 FINDINGS FROM PREVIOUS WRI ANALYSES
While researchers suggested material fl ows analysis and published reports on the materials exchange between the U.S. economy and the environment as early as 1969,1 progress in establishing a coherent approach to tracking material fl ows in the United States has been slow. In the 1990s the World Resources Institute (WRI) led an international initiative—including institutions in Japan, Germany, the Netherlands, and later Austria—to advance the use of material fl ows accounting as a basis for national indicators that would help measure environmental performance. The initiative generated national estimates of material inputs and outputs and proposed the development and use of material fl ows indicators such as Direct Material Input (DMI) and Total Domestic Output (TDO). The analysis showed that, for the nations included in the study, several key fi ndings emerged:
● Economic growth and an energy- and material-intensive lifestyle offset gains in effi ciency and environmental management.
● Waste generation continued to increase.
● One-half to three-quarters of the annual amount of material inputs to the economy returned to the environment as wastes within the year.
● Carbon dioxide emissions from the use of energy materials (i.e., fuels) dominated outputs to the environment.
● In the United States, outputs for some individual hazardous materials declined or stabilized, but total output of hazardous materials continued to increase.
Sources: Robert U. Ayres and A.V. Kneese. 1969. “Production, Consumption and Externalities,” American Economic Review (59):282–296; Emily Matthews et al. 2000, The Weight of Nations: Materials Outfl ows from Industrial Economies. (Washington, D.C.: World Resources Institute); Albert Adriannse et al. 1997. Resource Flows: The Material Basis of Industrial Economies. (Washington, D.C.: World Resources Institute).
WRI: MATERIAL FLOWS ACCOUNTS
9
Residuals released a report in 2003 stressing the need for “a consistent Material Flows Account-ing framework to integrate existing and future data.”16 At the international level, both the G-8 and the Organization for Economic Cooperation and Development (OECD) have recognized the
need for more systematic monitoring of environ-mental quality by recommending the establish-ment of “economy-wide material fl ows accounts” and urging that “the usefulness of indicators derived from material fl ows accounting should be further explored.”17

WRI: MATERIAL FLOWS ACCOUNTS
10WRI: MATERIAL FLOWS ACCOUNTS
10
2
A U S E F U L T O O L F O R E N V I R O N M E N T A L P O L I C Y M A K I N G
them by life cycle to highlight what is available, what is needed, and, thus, the location of gaps.
This policy brief complements earlier work that focused on the broader level of the na-tional economy by proposing to organize output data systematically by life cycles. It draws on estimates from economic data (for metals, for example) and identifi es emissions data to show what is now collected and to highlight what is now missing (data on production chemicals, for instance).
Current U.S. environmental laws regulating pollutants in air (the Clean Air Act), water (the Clean Water Act), and waste handling (the Re-source Conservation and Recovery Act) provide an essential fi rst line of environmental protection for the U.S. public. However, they focus on the symptoms of environmental problems. Each law typically applies regulatory standards to a single life cycle phase and one environmental medium (e.g., discharges to water during production), us-ing a prescribed list of materials. Together, these laws, along with others governing workplace exposures (the Occupational Safety and Health Act) and public reporting on industrial emissions and wastes (the Emergency Planning and Coom-munity Right to Know Act), cover about 1,100 in-dividual pollutants. Less than one-third of these
So far MFAs are being used primarily to support indicators of bulk or aggregated material fl ows through national econo-
mies. This policy brief proposes developing more detailed accounts that can be used to support indicators at the levels of sectors and individual materials as well as for environmental policy decisions at strategic and operational levels. Whether the problem is indoor or outdoor air pollution, climate change, contaminated water, leaking waste sites, or disappearing habitat, materials fl owing into, through, and out of the economy are likely to be the responsible agents. Organizing data by material fl ow18 can thus serve as a useful framework for understanding the ori-gins of environmental problems. This approach contrasts with fi rst-generation environmental policies that primarily focused on a single stage of a life cycle. The new approach builds instead on existing efforts to move toward policies that consider the entire life cycle of materials in the economy and the natural environment.
Most data used in developing macro material fl ows indicators have been generated for use in economic reporting. Environmental data are used when available but U.S. emission data are fragmented and limited in what they cover, and waste data are generally not material-specifi c. One way to improve these data is to organize
WRI: MATERIAL FLOWS ACCOUNTS
11WRI: MATERIAL FLOWS ACCOUNTS
11
are addressed under two or more programs, and only 49 substances appear in all fi ve laws.19
As a consequence, materials frequently slip through regulatory cracks. Some substances move off the regulatory radar screen as pollution or waste controls shift them to a part of the envi-ronment where they are not regulated. Because the existing laws focus almost entirely on the production and waste management phases, little information is available on outputs to the envi-ronment from the use and disposal of materials in consumer products. For the great majority of materials that are unregulated, data on outputs to the environment are usually unavailable or depend on rough estimates based on economic activities. Tracking the materials themselves di-rectly addresses these defi ciencies in the current system.
While the air, water, and waste laws dominate environmental policy, some strands of envi-ronmental legislation have long recognized the value of a material focus and a life-cycle approach. In 1976 Congress adopted the Toxic Substances Control Act (TSCA) to reduce unrea-sonable risk from toxic chemicals throughout their commercial life cycle. Under this law, EPA identifi ed for the fi rst time the number and amounts of industrial chemicals produced and imported into the United States. As of 2003, more than 76,000 chemicals were identifi ed as used in commerce.20
The Pollution Prevention Act adopted by Congress in 1990 is similarly inspired by the life-cycle approach to environmental policy. The law encourages consideration of the entire life cycle fl ow of materials by stating a policy that pollution should be prevented or reduced at its source whenever feasible, with a secondary
preference for recycling. Treatment and disposal are considered the least favorable options under this policy.21 More recently, EPA has taken initial steps to identify and analyze the common ori-gins of major environmental problems through programs such as the RCRA Vision project22 and the Resource Conservation Challenge.23 While the ambition is to develop strategies that would effectively address resource effi ciency and mini-mize environmental releases, these programs largely remain in a planning phase.
Already public, standardized data about the amounts of toxic substances entering the envi-ronment at facilities have demonstrated their usefulness. Established by Congress in 1986, the Toxic Release Inventory (TRI) requires industrial facilities to report releases for about 650 chemicals to air, water, and land as well as transfers to waste facilities. Government, busi-ness, and environmental advocates use TRI data in developing and evaluating policy and in com-munity negotiations related to individual facili-ties or regions.24 The database can be searched by chemical, by facility, and by location, making it easy to set and track goals to improve environ-mental performance.25 The data can also be ag-gregated to track trends. Nationally, for example, they show a 48 percent reduction in total onsite releases from facilities between 1988 and 2000. Transfers of waste offsite have increased slightly over the same period.26 TRI shows the benefi t of using a standard form to collect data on outputs, enter them into a database, and disseminate them widely. While a useful source of data for material fl ows accounts, TRI covers only a small portion of materials, and it focuses primarily on the production phase of the life cycle.
A comprehensive framework for tracking the entire fl ow of materials that enter and exit the

WRI: MATERIAL FLOWS ACCOUNTS
12
economy remains absent. No set of accounts provides information about the inputs and outputs of a material over its entire life cycle in the national economy, or how one fl ow affects another. Without a framework and a set of ac-counts for organizing the data by life cycle, each attempt to address an environmental pollutant across the cycle requires a costly effort to lo-cate and reorganize information from existing sources and to fi ll in the missing data. At the same time, such a framework and database are needed to support the development of strate-gic environmental indicators at the level of the national economy.
Economists regularly use indicators such as the gross domestic product (GDP) to mea-sure the state of the economy as a whole. Such macroscopic indicators to track the state of the environment at the national level, however, remain elusive. Due to the many types of units used to monitor environmental quality (i.e., concentrations in air and water, amounts emit-ted, biological populations, etc.), environmental indicators typically defy aggregation. The major-ity of indicators used in EPA’s 2003 Draft Report on the Environment relate to releases of single substances to single parts of the environment or ambient measures for them.27 Release data for regulated substances and ambient indicators are also used to comply with the Government Per-formance and Results Act that requires federal agencies to establish quantitative performance goals to measure the effectiveness of policies.
However, such measures frequently fail to fully capture broader progress or backsliding due to their narrow focus and are subject to varia-tions due to unrelated factors such as changing industrial practice and even changing weather conditions. Indicators, such as the outputs of a
class of hazardous materials to the environment, would complement more specifi c indicators by helping answer broader questions such as: Are we reducing the quantity and toxicity of persis-tent toxic materials entering the environment across the entire fl ow? Are consumer uses of hazardous materials increasing or decreasing? For what classes of materials should researchers be looking for substitutes? MFA indicators can be combined with ambient and other measures to enable government managers to set more in-clusive targets and better track the effectiveness of environmental policies.
At the operational level, more detailed accounts can help identify the most effective points for policy intervention to increase the effi ciency of the fl ow of materials and reduce the dispersion of haz-ardous materials to the environment. For example, MFAs support indicators of resource productivity that allow comparisons between different phases of the commercial life cycle for the same material fl ow (e.g., ratios of production waste to production, or outputs to uses) or between different fl ows (e.g., feed crops and meat production). These indicators offer insight into how the economic activity relates to the fl ow of materials into the environment.28 Between 1970 and the mid-1990’s, for example, the amount of residues recovered from lumber production rose 24 percent, indicating the in-creased fl ow of the residues to paper manufacture and energy recovery.29
Material fl ows data at the level of individual substances have already proven helpful in formulating national environmental policy. For example, over the past decade material fl ows analyses threw a spotlight on the fl ows of arsenic to pressure-treated lumber. A review of arsenic by end use in the U.S. economy shows a shift from use as a pesticide to use in a con-

WRI: MATERIAL FLOWS ACCOUNTS
13
sumer product, pressure-treated lumber for resi-dential and community structures. (See Figure 2.) When coupled with the investigation of the exposure pathways of arsenic from products into the environment, information about the fl ow of arsenic eventually led to EPA action in 2003 to limit residential and commercial uses of this product in the United States.30 If such data were regularly available and reviewed, it could lead to earlier action. As new policies limit use, MFA data can help monitor their effectiveness.
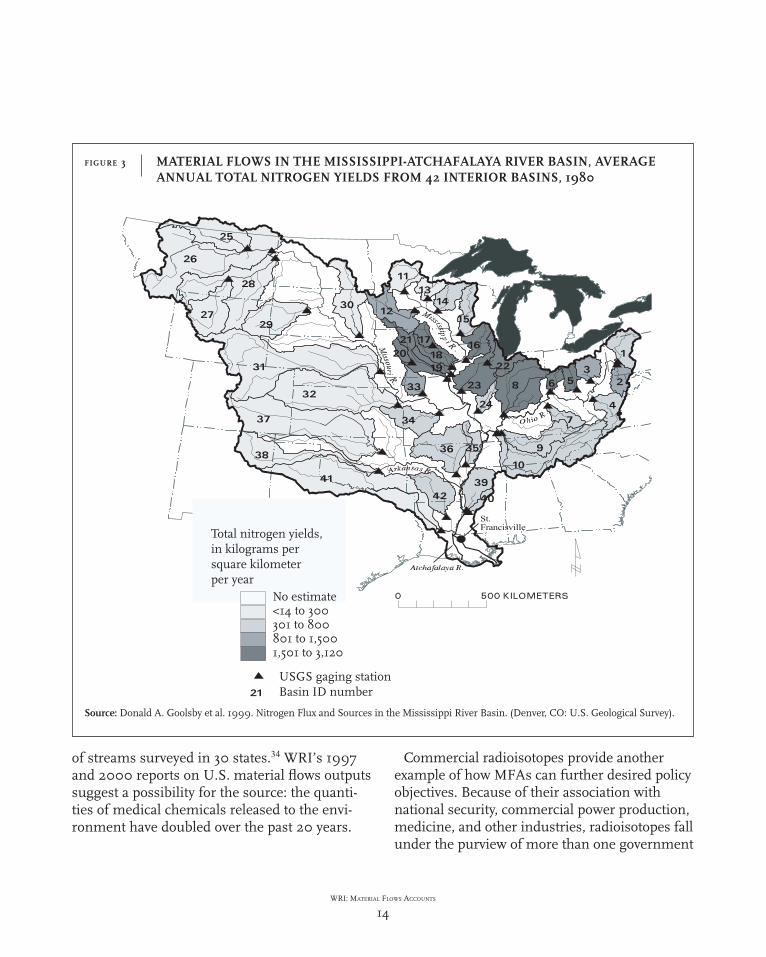
Material fl ows data can also be helpful in using comparative risk assessment to set priorities. So far, comparative risk assessment has been used to set priorities among problems such as urban air pollution, pesticide residues in food, or habitat destruction. Because the sources of environmental problems frequently overlap in the fl ow of materials, solving a single problem at a time may transfer it elsewhere or ignore the opportunity to address several problems at the same time. As policymakers look for the origins of problems in the fl ow of a material, including associated fl ows, they can avoid transfers from one environmental medium to another and also identify opportunities to reduce multiple impacts. For example, the apparently separate problems of a Dead Zone in the Gulf of Mexico and climate change both turn out to be related to the fl ow of nitrogen from fertilizer use on farms. More effi cient use of nitrogen fertilizer will limit the depletion of oxygen in the Gulf and reduce atmospheric emission of nitrous oxide.31 Such changed agricultural practices can both improve water quality and protect the climate. Figure 3 shows the result of a material fl ows analysis of nitrogen, county by county, across the U.S. Mis-sissippi basin. Such an analysis could be used to target locales where synthetic nitrogen fl uxes are highest.
When elevated levels of silver were found in the tissue of fi sh in San Francisco Bay, offi cials searched in vain for a missing large-point source as the origin. Using material fl ows analysis, university researchers eventually identifi ed the many small dental offi ces and photographic labs as the sources.32 Studies using life-cycle data are helping to identify the sources of mercury and cadmium pollution in the New York/New Jersey harbor from industrial emissions and consumer products and to suggest strategies for reducing them, such as targeted recycling.33 On a wider scale, a recent USGS study found evidence of some 95 pharmaceuticals, hormones, and other organic wastewater contaminants in 80 percent
FIGURE 2 ARSENIC CONSUMPTION BY END USE IN THE UNITED STATES, 1975–2000
Sources: U.S. Geological Survey. Mineral Commodity Summaries and Minerals Yearbook. Published annually. (Washington, DC: U.S. Geological Survey); WRI Material Flows Project.
WRI: MATERIAL FLOWS ACCOUNTS
14
of streams surveyed in 30 states.34 WRI’s 1997 and 2000 reports on U.S. material fl ows outputs suggest a possibility for the source: the quanti-ties of medical chemicals released to the envi-ronment have doubled over the past 20 years.
Commercial radioisotopes provide another example of how MFAs can further desired policy objectives. Because of their association with national security, commercial power production, medicine, and other industries, radioisotopes fall under the purview of more than one government
FIGURE 3 MATERIAL FLOWS IN THE MISSISSIPPI-ATCHAFALAYA RIVER BASIN, AVERAGE ANNUAL TOTAL NITROGEN YIELDS FROM 42 INTERIOR BASINS, 1980
Source: Donald A. Goolsby et al. 1999. Nitrogen Flux and Sources in the Mississippi River Basin. (Denver, CO: U.S. Geological Survey).
WRI: MATERIAL FLOWS ACCOUNTS
15
agency, making it diffi cult to track a material such as Cesium-137, which is used widely in the economy. Concerns over the disposition of Ce-sium-137 include fear of public exposures, con-tamination of metal scrap processing facilities, and national security.35 MFAs are currently being developed to help monitor the fl ow of Cesium-137 and other radioisotopes and hold the promise of improved methods for tracking and licensing these materials by the federal government.
Representatives of local civic groups and experts in mining, economics, toxicology, pub-lic health, ecology, and law now enter the envi-ronmental debate using different, sometimes incomparable, language and tools. All would benefi t from a vivid and consistent picture of the material fl ows involved, which would pro-vide a basis for making public policy as well as commercial and household decisions. Effective
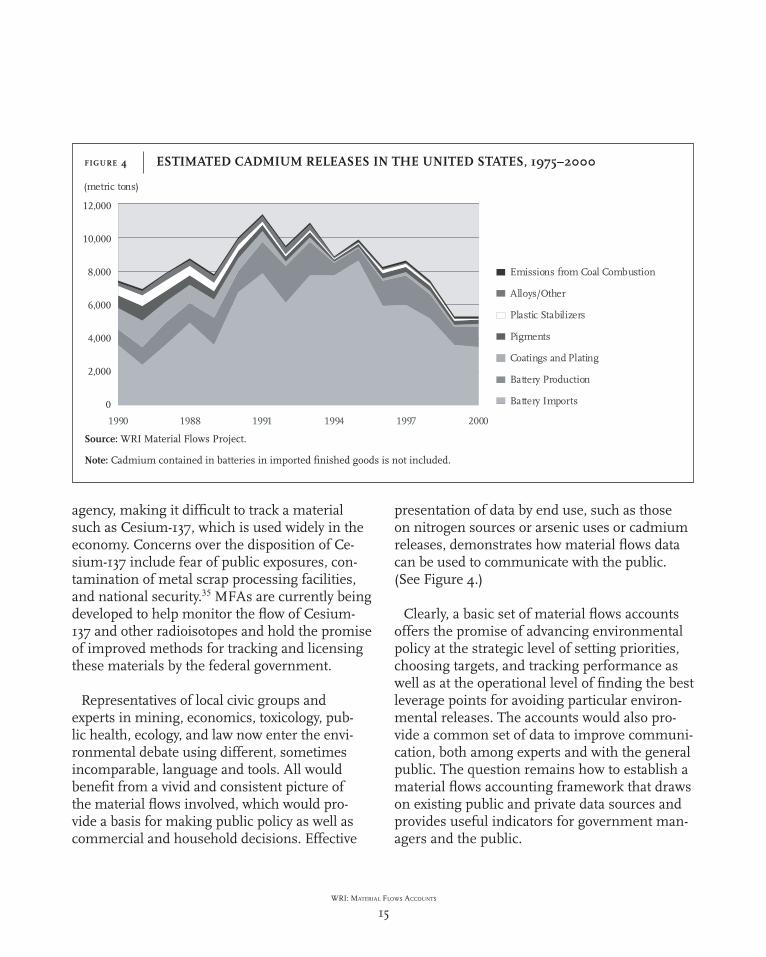
presentation of data by end use, such as those on nitrogen sources or arsenic uses or cadmium releases, demonstrates how material fl ows data can be used to communicate with the public. (See Figure 4.)
Clearly, a basic set of material fl ows accounts offers the promise of advancing environmental policy at the strategic level of setting priorities, choosing targets, and tracking performance as well as at the operational level of fi nding the best leverage points for avoiding particular environ-mental releases. The accounts would also pro-vide a common set of data to improve communi-cation, both among experts and with the general public. The question remains how to establish a material fl ows accounting framework that draws on existing public and private data sources and provides useful indicators for government man-agers and the public.
FIGURE 4 ESTIMATED CADMIUM RELEASES IN THE UNITED STATES, 1975–2000
Source: WRI Material Flows Project.
Note: Cadmium contained in batteries in imported fi nished goods is not included.
WRI: MATERIAL FLOWS ACCOUNTS
16WRI: MATERIAL FLOWS ACCOUNTS
16
3
F R A M E W O R K S F O R M A T E R I A L F L O W S A C C O U N T I N G
Product registries offer another approach to accounting for material fl ows. These registries have developed primarily in the Nordic countries to provide information for risk management and now constitute an integral part of their national environmental statistics. The SPIN database (Substances in Preparations in the Nordic Countries) provides nonconfi dential data on the volumes of chemicals fl owing into the economy and also identifi es the economic sectors in which they are used, the type of products in which they are found, and whether they are used in con-sumer products.40 The Swedish Product Register provides a national example. Begun in 1978, the register emerged from laws regulating hazard-ous chemicals. Companies report annually on the materials they have used that contribute to such human health effects as allergies, cancer, and birth defects. Using data from the product register and other economic data, the Swedish government publishes fl ow cards that offer data on the amount of a material that is imported, manufactured, and exported and on how it is used in the national economy.41 (See Figure 5.)
Product registries have generated product-level data used to support more complete analysis of how materials enter the environment. One Swedish study found that the amounts of heavy metals going into products were over three times
Aggregated national material fl ows ac-counts are becoming standard in the European Union (EU). The EU has
published a methodological guide36 and regularly publishes material fl ows indicators for EU coun-tries.37 These aggregated accounts provide indica-tors that are based on estimates of inputs to the economy of industrial minerals, fuels, construc-tion materials, and agricultural products and of outputs of emissions and wastes to national environments. Such accounts treat the national economy essentially as a “black box.” They focus on inputs and outputs but provide little detail on internal fl ows.
Physical input-output tables (PIOTs), in con-trast, go a step beyond national aggregated MFAs in providing more detailed information on the structure of material fl ows within national economies, not just what goes in and comes out. PIOTs are modeled on national economic input-output tables that monitor the monetary fl ows among economic sectors to fi nal consumers. PIOTs augment these detailed national economic accounts with data on the fl ows among sec-tors, consumers, and the natural environment, measured in units of the mass, or weight, of the materials. Both Germany38 and Japan,39 have introduced these tables as part of their national environmental statistical systems.

WRI: MATERIAL FLOWS ACCOUNTS
17WRI: MATERIAL FLOWS ACCOUNTS
17
larger than those emitted from the production facilities. With the exception of mercury, emis-sions during the production phase accounted for 3 percent or less of the potential outputs to the environment from products both during use and as waste at later stages in the fl ow.42 A study by the California Air Resources Board also showed the importance of considering the use phase in its fi nding that consumer products emitted
more volatile organic compounds during use than all the refi neries and gasoline stations in the state.43 These studies highlight the impor-tance of including data about all phases of the commercial life cycle in MFAs. The failure of most existing environmental data frameworks to track materials during a product’s use misses a major source of pollution and of waste to the environment.
FIGURE 5 SWEDISH PRODUCT FLOW CARD FOR BENZENE FOR 1998
Source: Swedish National Chemicals Inspectorate, available at <http://www.kemi.se/kemstat/fl oden/_fl odenbild/fl oden.cfm?id=249>.

WRI: MATERIAL FLOWS ACCOUNTS
18
In the United States, New Jersey44 and Mas-sachusetts45 offer examples of a facility-level approach to collecting, managing, and dissemi-nating materials data. These states are unusual in tracking the amount of listed chemicals going into products as well as the amounts released to air, water, and soil and transferred as waste. The Massachusetts data show that reporting compa-nies that have collected data since 1990 steadily reduced the quantities of chemicals they used in the following decade, falling 45 percent by 2001. Onsite releases from the facilities fell by 92 per-cent, showing signifi cant reductions in outputs of the listed chemicals during the manufactur-ing phase. Companies have found that they can reduce their environmental permitting, produc-tion, and waste management costs by taking such measures as reformulating products with non-toxic ingredients and recycling raw materi-als through the production process.46
While corporate environmental reports typi-cally discuss compliance with laws on emissions and wastes, some reports have begun to offer information on the physical fl ows of materials, energy, and the resulting internal costs to the company.47 Such reports are particularly promi-nent among Japanese companies, refl ecting enhanced government attention to measures of material fl ows.
International standards for corporate mate-rial and energy fl ows reporting are also emerg-ing.48 The Eco-Management and Audit Scheme (EMAS) offers one example in which participat-ing companies prepare public reports that in-clude information about the amounts of materi-als, energy, and water they use. EMAS provides guidance on how to report on particular fl ows
using physical units.49 The Global Reporting Initiative (GRI),50 an emerging global standard for corporate environmental and sustainabil-ity reporting, also offers general indicators of amounts of materials used in different catego-ries as well as indicators for pollutant releases and waste.
A detailed protocol, such as the Greenhouse Gas Protocol,51 is not yet available for organizing material fl ows data. Although public reporting for fi rms is generally voluntary, a few countries require their larger companies to prepare re-ports. Denmark,52 for example, includes infor-mation on material input and output fl ows in its system of Green Accounts.
The variety of material fl ows accounting frame-works discussed here demonstrates the range of current approaches and their strengths and limitations in materials covered, level of detail, and methods of data collection and dissemina-tion. Table 1 summarizes examples that indicate the status of material fl ows accounting.
Aggregated national MFAs provide indicators of the material intensity of whole economies. At the other end of the continuum, environmen-tal management systems and reports provide data on material fl ows at the level of individual facilities and fi rms, data that can contribute to internal business decisions and allow for bench-marking performance across fi rms. The Nordic product registries and state tracking systems show one way to fi ll the data gaps, particularly for the product-use phase and to provide the public with information at the national level about chemicals found in consumer products.

WRI: MATERIAL FLOWS ACCOUNTS
19
TABLE 1 SAMPLE FRAMEWORKS FOR MATERIAL FLOWS ACCOUNTING
Framework Materials CoveredTypes of Input and
Output Data System BoundariesData Collection
MethodData
Accessibility
World Resources Institute (WRI)
160commodities initially
Production, uses, imports, exports, and outputs across the life cycle
U.S. economy, U.S. environment
Government and trade association databases
Available for use in fall 2005
EUROSTAT[European Union Statistical Agency]
Several dozen aggregated and waste fl ows
Aggregated inputs and assorted wastes
National economies and EU-15
National statistical offi ces, third- party research institutes
Public database1
Center for Global Environmental Research, Japan
Major raw material trade categories
International trade focus
Japanese trade UN trade dataset Data available to the public2
Green Accounts, Denmark
Substances used in listed industrial activities
Amounts used in production of products or released as waste
Facility, company Companies engaged in listed activities required to submit reports to government agency
May use index to protect confi dential data
Product Register, Sweden
Flow cards for 200 high-volume chemicals
Imports, exports, and production amounts going into consumer use categories
Company reports aggregated at national level
Company data, reported on custom forms
Flow cards at national scale; some information on consumer uses in database3
Massachusetts Toxics Use Reduction Act
Chemicals listed in CERCLA and Toxic Release Inventory
Inventory and throughput data, including amount entering products
Facility data can be aggregated to state level
Annual report submitted by facilities meeting criteria
Data available by chemical, facility, and community4
Source: WRI Material Flows Project.
Notes:
1. See Wastebase, a database maintained by the European Topic Center on Resource and Waste management, at <http://waste.eionet.eu.int/wastebase>.
2. See <http://www-cger.nies.go.jp/>.
3. Sweden, Denmark, Finland, and Norway provide access to summary information from its product register about production volume by use at <http://www.spin2000.net/spin.html>. Flow cards can be found at <http://www.kmi.se/> Click on “databases” and then on “fl ow analyses.”
4. See Toxics Use Reduction Institute at <http://www.turi.org>.

WRI: MATERIAL FLOWS ACCOUNTS
20WRI: MATERIAL FLOWS ACCOUNTS
20
designed to cover the entire chain of materials that fl ow through the U.S. industrial economy, from primary inputs, or feedstocks, such as petroleum, salt, and industrial roundwood, to processed materials such as benzene, gasoline, chlorine, and lumber.
To complement this initial collection of mate-rials, the report explores fi ve chemicals on the list of Waste Minimization Priority Chemicals compiled by EPA’s Offi ce of Solid Waste. The purpose of including these chemicals is to test the utility of the database for substances of specifi c concern to human or ecological health. Over time the data coverage can expand to more fully capture the material process chain and to incorporate additional hazardous materials based on criteria such as high volume production, persistence, tendency to bioaccumulate, or rapid dissipation into the environment.
The Material Flows Data Sheet: A Template for Entering Data into the AccountsMaterial fl ows data sheets (MFDSs) offer a way to organize data on individual materials and pro-vide a standard template for material fl ows data to be entered into a database. The core set of data elements contained in the MFDS includes infor-
4
T H E M A T E R I A L F L O W S D A T A B A S E A N D A
M A T E R I A L F L O W S D A T A S H E E T
As a step toward a U.S. framework, WRI is developing an MFA database and associ-ated protocols for collecting, analyzing,
and presenting material fl ows data. The database systematically categorizes materials fl owing through the U.S. economy, emphasizing trans-parency in documenting data sources and any assumptions made in estimating the fl ows. The database is designed to be built by a network of data providers and will eventually be available to the general public. The ultimate goal for this activity is to see that the periodic compilation and dissemination of U.S. material fl ows accounts shifts from civil society to become an established function of the federal government. A descrip-tion of the pilot MFA database follows.
Materials Coverage The MFA database is designed to cover the physical resources entering the economy and follow them as they undergo successive physi-cal and chemical transformations as they move through the material life cycle. The database is structured around a list of the primary commodi-ties that drive the U.S. economy, covering fi ve principal resource sectors: agriculture, forestry, non-renewable organic materials (e.g., fossil fuels), metals, and minerals. The database is

WRI: MATERIAL FLOWS ACCOUNTS
21WRI: MATERIAL FLOWS ACCOUNTS
21
mation describing the material’s 1) context in the national economy, 2) inputs to the economy, including raw material supplies from all sourc-es, and 3) outputs to the environment, including processing wastes and outputs resulting from use. All values are uniformly denominated in mass units.
Context To establish the context for material fl ows, each MFDS includes information listing the name of the commodity and the resource sector to which it belongs, for example, agriculture, energy, forestry, or metals and minerals. The level of material use in the chain of processing can also be included. For example, copper could be classi-fi ed as copper ore (level 1), copper metal (level 2), copper pipe (level 3), and so on.
In addition, the MFDS identifi es the industrial and consumer codes associated with a material fl ow, such as the North American Industry Clas-sifi cation System used by the Census Bureau, the industrial function category and the com-mercial/consumer product category codes now required for reporting under TSCA53; and the chemical abstract service number when appli-cable.54 Registry numbers can also be included from EPA’s Envirofacts Master Chemical In-tegrator (EMCI), which provides information about a given material across different govern-ment regulations.55 Together, these codes allow for linking the data associated with a particular material fl ow with other economic and environ-mental data. The use of international standards will allow for more precise comparison with indicators developed in other countries and used by international organizations such as the World Bank.56
Because much of the interest in material fl ows stems from the dependencies that exist between fl ows in the economy, MFDSs formal-ize these relationships using a fi eld to record associated fl ows. For example, associated fl ows occur in the case of zinc and cadmium. While cadmium is not mined as a primary ore by itself, its occurrence in ores mined for zinc allows it to be extracted during the smelting and refi ning processes. The associated cadmium fl ow would be noted on the zinc data sheet.
InputsInput data for materials covered by MFDSs include the quantity of production, secondary production (production from pre- and post-consumer waste), by-product production (pro-duction as a by-product of another industrial process), imports, exports (a negative input), and changes in inventory. Included under inputs are the amounts of a material imported or exported as a component of fi nished goods (e.g., cadmi-um in nickel-cadmium batteries in imported or exported electronic devices).
OutputsThe section titled outputs from production on MFDSs reports the amount of materials enter-ing the natural environment from the produc-tion of fi nal products. This section provides details on the outputs generated as extractive wastes, processing wastes, and manufacturing wastes from domestic and foreign sources.
MFDSs also show the uses of a commodity in the economy to identify, for each use, the result-ing outputs to the environment and the quan-tity of materials going to recycling (a negative output). Incidental outputs represent material

WRI: MATERIAL FLOWS ACCOUNTS
22
Flow Descriptors A column called fl ow descriptors is included in the data sheet to provide a space for additional information on specifi c fl ows. In the cadmium example, the nature of each of the uses of cad-mium in the economy has been indicated, along with a notation that the extractive wastes were assigned to the zinc data sheet.
Environmental Descriptors Because materials vary greatly in their proper-ties, the number of tons alone does not effec-tively convey their impact on the environment. An initial rudimentary characterization method uses three environmental descriptors that relate each fl ow to its potential for environmental impact. This broad characterization scheme suggests an addition, not a replacement, to the detailed assessments performed by agencies such as EPA.
Most generally, the environmental impact from a material fl ow depends on how it enters the en-vironment, its inherent potential for harm, and the amount of time that the material resides in the economy. Three environmental descriptors, mode of release (M), quality (Q), and velocity (V), provide an approximate weighting of the impact of fl ows. The mode of release describes the physical form (gas, liquid, or solid) of the material and its freedom of movement in the environment. Quality describes the potential for environmental damage inherent in the material, ranging from materials that rapidly biodegrade to those known as toxicological threats. The velocity of a fl ow describes the average time that the material resides in the commercial economy and is essential for estimating the time before a material is dissipated or enters the waste stream.
outputs to the environment that are not of the same material as that being measured (e.g., mer-cury emissions would be an incidental output from coal used for energy production).
Hidden FlowsSome fl ows associated with the extraction of a commodity ( e.g., overburden removal), process-ing (e.g., concentrator tailings), and refi ning (e.g., smelter wastes) are termed hidden fl ows. They are considered “hidden” because they do not enter the dollar economy and are generally simply disposed of. All of these fl ows, with the exception of losses during recycling, occur prior to the commodity entering the use phase of the materials cycle. Many are very harmful to the en-vironment. On the material fl ows data sheet, all the hidden fl ows associated with production are identifi ed with an hf. Releases of wastes to the environment that occur during use or post-use are considered outputs.
Where two commodities, such as zinc and cad-mium, are contained in an extracted metal ore, the extraction waste and the removed nonmetal components of the ore are charged to the pri-mary commodity, in this case zinc. Releases of cadmium, the secondary metal, during process-ing and refi ning are considered units of that commodity. All non-mineralized wastes in the ore are accounted for on the primary commodity data sheet, in this case, that of zinc. Depending on where the activity takes place, these fl ows may result in either domestic or foreign releases to the environment, many of which cause much harm.

WRI: MATERIAL FLOWS ACCOUNTS
23
Decades of effort by EPA and others have resulted in a wide range of environmental descriptors to distinguish substances by their hazardous properties and by their potential for a negative impact on human health and the environment.57 One set of descriptors under development at EPA, the Tool for the Reduction and Assessment of Chemical and other Environ-mental Impacts (TRACI),58 could be used in the future to more precisely link data from material fl ows accounts to impacts. Such links would be made by using impact coeffi cients. Potential areas covered by TRACI include global warm-ing, acidifi cation, eutrophication, photochemical smog, human health, ecotoxicity, fossil fuel use, land use, and water use. TRACI is designed to work independently of site-specifi c knowledge but has the capacity to provide more precise results given more detailed data. The material fl ows database will eventually be able to link to environmental impact coeffi cients and geo-graphic markers to enable analysts to localize problems and target solutions.
Data Sources and NotesTo ensure transparency and the means to check data quality, full reference to the data source is included in MFDSs. In addition, the notes section records the assumptions, conversion factors, and calculations used to estimate fl ows. Table 2 lists all the elements that should be in-cluded in a material fl ows data sheet.
Collectively, these elements provide suffi cient data to describe the fl ow of a material through the economy and offer a way of relating that fl ow to other materials. Figure 6 shows a sample ma-terial fl ows data sheet fi lled out for cadmium.
Data Sources The data found in MFAs draw from a broad ar-ray of environmental, resource, and economic sources. The numbers themselves may have been reported, recently measured, or the esti-mates of experts. Regardless of the units used in the primary data sources, all data are converted to mass units, which provide the currency for MFAs.
TABLE 2 CORE DATA ELEMENTS IN A MATERIAL FLOWS DATA SHEET
Basic InformationCommodityResource SectorLevel of ProcessingIndustrial/Consumer CodesData SourcesAssociated FlowsFlow Descriptors
InputsProductionSecondary ProductionBy-Product ProductionChanges in InventoryImports/Exports (raw materials)Imports/Exports (fi nished goods)Reported Use
Outputs from ProductionExtractive WastesProcessing Wastes Manufacturing Wastes
UsesUses (listed as 1, 2, 3, 4, etc.)
Post-production OutputsOutputs from Each UseEnvironmental DescriptorsIncidental Outputs
Source: WRI Material Flows Project.

WRI: MATERIAL FLOWS ACCOUNTS
24
FIG
UR
E 6
M
AT
ER
IAL
FLO
WS
DA
TA S
HE
ET
FO
R C
AD
MIU
M (
all d
ata
are
in m
etri
c to
ns)

WRI: MATERIAL FLOWS ACCOUNTS
25
Most generally, resource inputs, including trade data, are provided by statistical offi ces in governmental agencies such as the Mineral Information Team at the U.S. Geological Survey (USGS), the Energy Information Administra-tion at the U.S. Department of Energy (DOE), and the Forest Products Laboratory and National Agricultural Statistics Service at the U.S. Depart-ment of Agriculture (USDA). Economic data col-lected by various offi ces at the U.S. Department of Commerce offer numbers in physical units on production and trade for some processed ma-terials and manufactured goods. However, data on manufactured goods are most often given in dollar fi gures and typically do not specify mate-rial composition. As a result, product data gener-ally rely on conversions from monetary data or expert estimates.
Data on synthetic organic chemicals (SOCs) come from government offi ces or trade associa-tions and independent research institutes that serve the private sector. At the level of primary and secondary feedstocks to the chemicals industry, the Energy Information Administra-tion produces detailed data on primary produc-tion of petroleum products and petrochemical feedstocks at U.S. refi neries.59 The challenge to obtaining these data comes only in part from the proprietary nature of much of the information. The challenge to organizing them derives from the fact that, unlike metals, organic chemicals undergo transformations during processing that change their chemical nature and can be the result of different synthesis pathways.
For industrial chemicals farther down the process chain, detailed production data are col-lected, in principle, under the TSCA inventory of chemicals in commerce. However, these data are given in ranges that span orders of magnitude
and thus provide only upper and lower bounds for data values. Furthermore, a large portion of the chemical data collected under TSCA is considered confi dential business information and as such is not available to the public. In the future, data collected under TSCA is supposed to provide more detailed information on chemi-cal production volumes classifi ed by industrial function and commercial/consumer product categories.60
The Census Bureau61 and the International Trade Commission62 at the U.S. Department of Commerce have traditionally collected informa-tion on domestic and foreign chemical ship-ments. However, this data collection function was signifi cantly curtailed in the mid-1990s.63 Proprietary considerations also prevent publica-tion from private data sources that provide some of the most comprehensive data collections for synthetic organic chemicals. For example, trade associations such as the National Petroleum Refi ners Association and independent research institutes such as SRI International offer data for a price, but explicitly prohibit their republica-tion. In sum, the scarcity of publicly available data for these chemicals becomes rapidly evident as one moves up the value chain from primary feedstocks to specialty chemicals.
The USDA generates data on pesticide use that can be harvested from the Agriculture Chemical Use Database.64 For inorganic chemicals, data obtained from USGS publications65 and com-modity specialists complement other sources to provide information on production, recycling, trade, and uses in the economy. Secondary data sources can also be useful for locating material fl ows data, such as the Toxicological Profi les prepared by the Agency for Toxic Substances
WRI: MATERIAL FLOWS ACCOUNTS
26
and Disease Registry at the Centers for Disease Control and Prevention.
Obtaining material-specifi c data on outputs presents an even more formidable challenge. Many of the outputs to the environment oc-cur during phases of the life cycle not covered by existing environmental data systems.66 EPA waste data only rarely contain material-specifi c information. Even waste data without any mate-rial-specifi c detail can be hard to come by. For example, the most recent data set for nonhazard-ous industrial wastes at the national level date back to the mid-1980s. For heavy metals and SOCs, the TRI provides the most comprehensive data set available, though it is limited in sources, number of substances, and life cycle phases covered. Emissions databases and government reports on wastes from coal mining and oil and gas exploration provide essential data on extrac-tion wastes. In the latter case, specialists with ex-pert knowledge of production practices involved must estimate values for waste and release data.
Technical reports and pools of expertise scat-tered across the federal government provide useful information for constructing accounts. For instance, multiple offi ces in EPA and DOE compile technical reports that can be used for determining the mass of the materials that con-stitute the inputs to and outputs from industrial processes. Missing data can be estimated, based on the data that are available for other substanc-es (e.g., precursors and derivatives) and on other phases of the material’s life cycle. Knowing the ratio of chemical feedstocks necessary as inputs allows for deducing the use of these feedstocks by examining the outputs of production. For example, the reported amounts of tire produc-tion offer information relevant to the tire’s main components such as synthetic rubber and car-
bon black.67 Ayres provides numerous examples of deducing material fl ows using auxiliary data and technical process information.68 Table 3 shows a representative, though not exhaustive, list of data sources arranged according to life cycle phase.
SHARING MATERIAL FLOWS DATA
Integrating material fl ows data from public and private statistical offi ces requires engaging com-modity specialists across departments as well as representatives from industry trade associations. As a step toward formalizing the MFA network, WRI suggests the development of a remote database in the form of an Extranet for sharing material fl ows data. Requiring a password for entry, the Extranet would allow members of the network to enter material fl ows data relevant to their area of technical expertise and perform analyses based on any or all of the data resid-ing in the database. As the network grows, the standards used for data entry would undergo continuing revision, with the associated develop-ment of tools to analyze the data.
Such an extensive database, which would en-able governmental agencies and private sources to share data using a compatible format, should catalyze the development of uniform data standards, templates, and data-sharing proto-cols among the contributors, leading to regular compilation and dissemination of U.S. MFAs, including detailed sub-accounts. Such an ambi-tious and extremely useful project should be a function of the federal government. As a part of that process, data on substances that are priori-ties due to ecological or human health concerns could be added to the database, which now focuses on major commodities.

WRI: MATERIAL FLOWS ACCOUNTS
27
TABLE 3 SELECTED SOURCES OF MATERIAL FLOWS DATA BY LIFE CYCLE PHASE
Raw Material Supply Production Use DisposalAgency Offi ce Sector
U.S. Geological Survey
Minerals Resources Program
Minerals, Metals
Waste Estimates from Mining by Experts
Mineral Commodity Summaries1
Mineral Commodity Summaries
Energy Resources Program
Energy Produced Waters Database2
U.S. Environmental Protection Agency
Air and Radiation Hazardous Substances
National Toxics Inventory3
National Toxics Inventory
Solid Waste Biennial Reporting Survey4, Municipal Solid Waste Reports5
Environmental Information
Toxics Release Inventory6
Prevention, Pesticides and Toxic Substances
TSCA Chemical Substances Inventory7
Inventory Update Rule8
U.S. Department of Agriculture
National Agricultural Statistics Service
Agriculture, Hazardous Substances
Agricultural Statistics Database9
Agriculture Chemical Use Database10
Forest Service Forest Products
Resource Planning Assessment11
Annual Statistics for Forest Products12
Annual Statistics for Forest Products
U.S. Department of Energy
Energy Information Administration
Energy, Hazardous Substances
Coal Mining Waste Estimates by Experts
Annual Energy Review13
Manufacturing Energy Consumption Survey14
CO2 Info. Analysis Center
CO2 Emissions from Fossil-Fuel Consumption 15
Offi ce of Industrial Technology
Technical Reports
Technical Reports
U.S. Department of Commerce
Census Bureau HazardousSubstances, Minerals, Metals
Materials Summary
Materials Summary16
U.S. Dept. of Transportation
Bureau of Transportation Statistics
Hazardous Substances, Minerals, Metals

WRI: MATERIAL FLOWS ACCOUNTS
28
TABLE 3 CONTINUED
Raw Material Supply Production Use DisposalAgency Offi ce Sector
American Chemical Society
Statistical Division
Petro-chemicals, Hazardous Substances
Annual Production Surveys17
American Chemistry Council
Petro-chemicals, Hazardous Substances
Annual Guide to the Business of Chemistry18
Annual Guide to the Business of Chemistry
National Petrochemical and Refi ners Association
Petrochemical Statistics
Selected Petrochemical Statistics
Selected Petrochemical Statistics
Source: WRI Material Flows Project
Notes1. U.S. Geological Survey. Mineral Commodity Summaries. Available at <http://minerals.usgs.gov/minerals/pubs/mcs/>.2. U.S. Geological Survey, Central Energy Data Management. Produced Waters Database. Available at <http://energy.cr.usgs.gov/prov/prodwat/>.3. National Transportation Library. National Toxics Inventory. Available at <http://ntl.bts.gov/card_view.cfm?docid=12145>.4. U.S. Environmental Protection Agency, Biennial Reporting System. Available at <http://www.epa.gov/enviro/html/cerclis/cerclis_overview.html>.5. For example, U.S. Environmental Protection Agency. 2001. Municipal Solid Wastes: Basic Facts. Available at <http://www.epa.gov/epaoswer/non-hw/muncpl/facts.htm>.6. U.S. Environmental Protection Agency. Toxics Release Inventory (TRI) Program. Available at <http://www.epa.gov/tri/>.7. U.S. Environmental Protection Agency. TSCA Chemical Substances Inventory. Available at <http://library.dialog.com/bluesheets/htmlaa/bl0052.html>. 8. U.S. Environmental Protection Agency. 2002. Inventory Update Rule. Available at <http://www.epa.gov/oppt/iurold/>.9. U.S. Department of Agriculture. National Agricultural Statistics Service. Quick Stats: Agricultural Statistics Database. Available at <http://www.nass.usda.gov:81/ipedb/>.10. U.S. Department of Agriculture, National Agricultural Statistics Service. Agricultural Chemical Usage Reports. Available at <http://usda.mannlib.cornell.edu/reports/nassr/other/pcu-bb>.11. U.S. Department of Agriculture, Forest Service. 2000. RPA Assessment of Forest and Range Lands (FS-687). Available at <http://www.fs.fed.us/pl/rpa/rpaasses.pdf>. 12. James L. Howard et al. 2001. Timber Production, Trade, Consumption, and Price Statistics 1965–1999. (FPL-RP-595). USDA Forest Service, Forest Products Laboratory. Available at <http://www.fpl.fs.fed.us/documnts/fplrp/fplrp595.pdf>. 13. U.S. Department of Energy, Energy Information Administration. 2001. Annual Energy Review 2001. Available at <http://www.eia.doe.gov/emeu/aer/contents.html>.14. U.S. Department of Energy, Energy Information Administration. 1998. Manufacturing Energy Consumption Survey (MECS). Available at <http://www.eia.doe.gov/emeu/mecs.contents.html>. 15. T.J. Blasing et al. 2003. “Estimates of monthly carbon dioxide emissions and associated 13C/12C values from fossil-fuel consumption in the U.S.A.” Trends: A Compendium of Data on Global Change. (Oak Ridge, TN: U.S. Department of Energy, Oak Ridge National Laboratory, Carbon Dioxide Information Analysis Center) Available at <http://cdiac.esd.ornl.gov/trends/emis_mon/emis_mon_co2.html>.16. U.S. Department of Commerce, Economics and Statistics Administration. 2001. Economic Census Manufacturing Subject Series. Material Summary, 1997. U.S. Census Bureau Report no. EC97M31S-MS.17. American Chemical Society. Annual. “US Chemicals Production, Facts & Figures,” Chemical and Engineering News. For example, see Chemical and Engineering News, June 25, 2001, pp. 44-51. 18. American Chemistry Council. Annual. Guide to the Business of Chemistry.

WRI: MATERIAL FLOWS ACCOUNTS
29WRI: MATERIAL FLOWS ACCOUNTS
29
5
C A S E S T U D I E S : E X A M I N I N G F I V E H A Z A R D O U S S U B S T A N C E S
of gathering the necessary data to evaluate the utility of the MFA framework for shaping policy decisions.
Synthetic organic chemicals and metals con-stitute the main categories of materials included in the original waste minimization priority chemicals list. Data for cadmium were relatively easy to obtain from sources across the federal government, particularly the USGS. The MFDS for cadmium (see Figure 6) shows a continuing decline in cadmium metal imports and confi rms the shift in domestic uses from steel plating to batteries. The data also show that imports of fi nished goods containing cadmium batteries compensate for the decline in imports of cad-mium metal.71 This fl ow of cadmium batteries in imported electronic products will eventually enter the waste stream. Concern about cadmium batteries entering landfi lls gave rise to state laws that were followed in 1996 by federal legisla-tion requiring that batteries be labeled and made easy to remove.72 Material fl ows accounts could provide the means for tracking the effectiveness of such policies.
Two of the SOCs selected, Pendimethalin and Trifl uralin, are produced specifi cally for use as pesticides. Organic pesticides have displaced many of the heavy metals, such as arsenic and
In the mid-1990s, using 1991 as a base year, the EPA Waste Minimization Program set a goal of reducing by half the occurrence of 30
priority chemicals in hazardous waste by 2005.69 The chemicals were chosen because they are persistent, bioacummulative, and toxic. They are frequently found in both hazardous waste and the environment. The goal was reached in 2001.
Using an expanded list of priority chemicals, the National Partnership for Environmental Priorities now plans to work toward a new goal for 2008.70 Using MFAs offers a way to comple-ment the hazardous waste reduction goal by also looking at opportunities for reductions at other stages of the commercial life cycle, including, for example, releases to air and water during produc-tion and transfers of products containing hazard-ous substances to nonhazardous waste landfi lls.
WRI selected one of the priority chemicals to put into a material fl ows data sheet, Cadmium, and studied four others, Hexachlorobenzene (HCB), Naphthalene, Pendimethalin, and Tri-fl uralin. These materials were chosen to include a range of material types and uses. (See Table 4.) Data for related inputs and outputs along its commercial life cycle were sought from EPA as well as other sources inside and outside the federal government to examine the feasibility
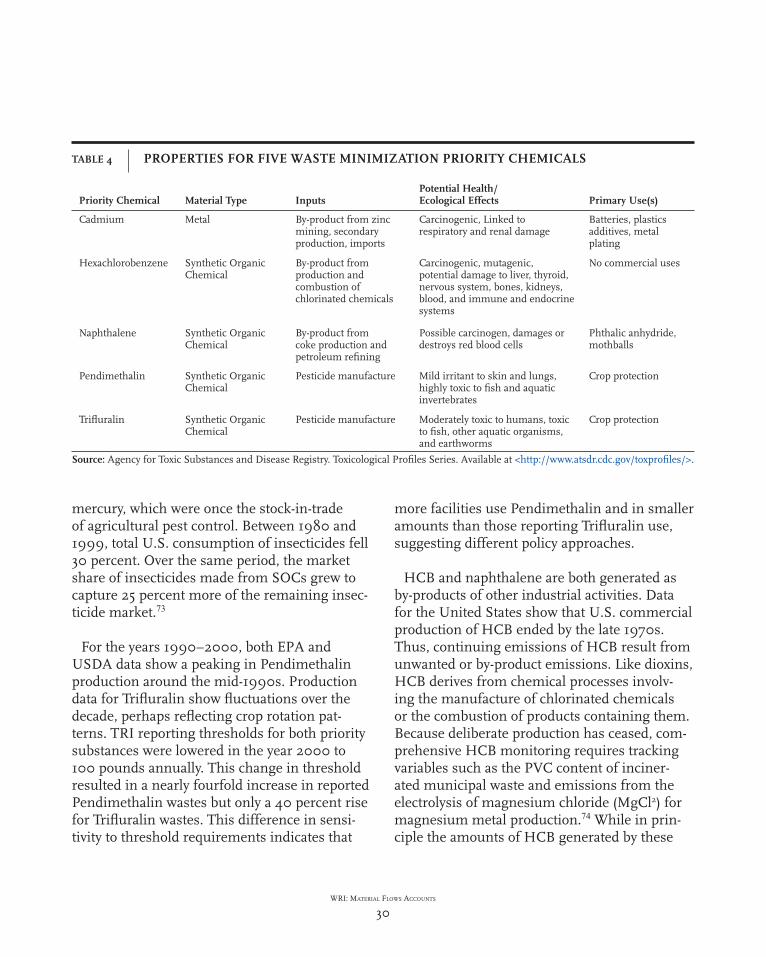
WRI: MATERIAL FLOWS ACCOUNTS
30
mercury, which were once the stock-in-trade of agricultural pest control. Between 1980 and 1999, total U.S. consumption of insecticides fell 30 percent. Over the same period, the market share of insecticides made from SOCs grew to capture 25 percent more of the remaining insec-ticide market.73
For the years 1990–2000, both EPA and USDA data show a peaking in Pendimethalin production around the mid-1990s. Production data for Trifl uralin show fl uctuations over the decade, perhaps refl ecting crop rotation pat-terns. TRI reporting thresholds for both priority substances were lowered in the year 2000 to 100 pounds annually. This change in threshold resulted in a nearly fourfold increase in reported Pendimethalin wastes but only a 40 percent rise for Trifl uralin wastes. This difference in sensi-tivity to threshold requirements indicates that
more facilities use Pendimethalin and in smaller amounts than those reporting Trifl uralin use, suggesting different policy approaches.
HCB and naphthalene are both generated as by-products of other industrial activities. Data for the United States show that U.S. commercial production of HCB ended by the late 1970s. Thus, continuing emissions of HCB result from unwanted or by-product emissions. Like dioxins, HCB derives from chemical processes involv-ing the manufacture of chlorinated chemicals or the combustion of products containing them. Because deliberate production has ceased, com-prehensive HCB monitoring requires tracking variables such as the PVC content of inciner-ated municipal waste and emissions from the electrolysis of magnesium chloride (MgCl2) for magnesium metal production.74 While in prin-ciple the amounts of HCB generated by these
TABLE 4 PROPERTIES FOR FIVE WASTE MINIMIZATION PRIORITY CHEMICALS
Priority Chemical Material Type Inputs Potential Health/Ecological Effects Primary Use(s)
Cadmium Metal By-product from zinc mining, secondary production, imports
Carcinogenic, Linked to respiratory and renal damage
Batteries, plastics additives, metal plating
Hexachlorobenzene Synthetic Organic Chemical
By-product from production and combustion of chlorinated chemicals
Carcinogenic, mutagenic, potential damage to liver, thyroid, nervous system, bones, kidneys, blood, and immune and endocrine systems
No commercial uses
Naphthalene Synthetic Organic Chemical
By-product from coke production and petroleum refi ning
Possible carcinogen, damages or destroys red blood cells
Phthalic anhydride, mothballs
Pendimethalin Synthetic Organic Chemical
Pesticide manufacture Mild irritant to skin and lungs, highly toxic to fi sh and aquatic invertebrates
Crop protection
Trifl uralin Synthetic Organic Chemical
Pesticide manufacture Moderately toxic to humans, toxic to fi sh, other aquatic organisms, and earthworms
Crop protection
Source: Agency for Toxic Substances and Disease Registry. Toxicological Profi les Series. Available at <http://www.atsdr.cdc.gov/toxprofi les/>.

WRI: MATERIAL FLOWS ACCOUNTS
31
activities can at least be estimated, the amounts remain undocumented and therefore unknown.
Naphthalene is a by-product from the process-ing of coal to coke for steel production as well as petroleum refi ning. Using data on coke produc-tion, along with technical data on the yield of naphthalene from the coking process, allows for determining naphthalene production from coke. No publicly available data were found on naph-thalene production at petroleum refi neries.
A downward trend in coke production over the last decades has directly led to signifi cant reductions in naphthalene production and emis-sions from this source. Driving this change in coke consumption is the growth of electric arc furnace (EAF) steel production that relies on scrap metal inputs and thus avoids the need for coke used to process virgin iron ore. TRI data show that releases of naphthalene from pri-mary metals producers fell by half from 1988 to 2000. Figure 7 shows the correlation between increased scrap steel recovery for EAF produc-tion and less hazardous material released into the environment. The rapid rise and fall in air emissions during the mid-1990s may refl ect increased monitoring of coke ovens as a result of stricter regulations on benzene, another coke by-product. While the wastes generated during EAF steel production are also considered hazardous, several processors in the United States and abroad have developed processes for recovering metals, such as iron and zinc, from EAF dusts.
Phthalic anhydride, used for plasticizers in syn-thetic resins as a precursor for organic dyes and in the synthesis of primary amines and organic acids, accounted for more than half of naphtha-lene consumption in the early 1990s. Current trends point to a reduction in the production of
naphthalene, possibly because of greater reli-ance on o-Xylene from petroleum refi neries as the primary feedstock for phthalic anhydride. Other products made from naphthalene include mothballs, which generally account for less than 10 percent of naphthalene production.75
The leverage to reduce naphthalene emissions will come from reduced demand for coke in primary steel production and from decreased demand at refi neries due to increased use of other feedstocks for phthalic anhydride produc-tion plus new resin and dye formulations that do not require phthalic anhydride. New ways of
FIGURE 7 NAPHTHALENE PRODUCTION FROM COKE AND FROM EAF STEEL PRODUCTION AND TRI AIR EMISSIONS FROM THE PRIMARY METALS SECTOR (SIC 33), 1990–2000
Sources: U.S. Department of Energy, Energy Information Administration. 2002. Annual Energy Review for Coal. Available at <http://www.eia.doe.gov/emeu/aer/coal.html>; U.S. Environmental Protection Agency. TRI Explorer. Chemical Report. Available at <http://www.epa.gov/triexplorer/>. Shows naphthalene emissions data; U.S. Census Bureau. 2000. Statistical Abstract of the United States. Table 1253; U.S. Census Bureau. 2002. Statistical Abstract of the United States. Table 978.

WRI: MATERIAL FLOWS ACCOUNTS
32
keeping moths out of the closet (e.g., inedible clothes) will be needed to reduce naphthalene demand for mothballs.
WRI’s analysis of these fi ve chemicals validates the concern over lack of publicly available data on synthetic organic chemicals. However, the analysis did reveal some of the dependencies between material fl ows and the links between usage trends for materials. Aggregated TRI data show an overall downward trend in air emissions of napthalene averaging 62 percent
from 1990 to 2000, which may indicate the use of more effi cient industrial practices and a likely reduction in occupational and com-munity exposure. Data on other release and waste transfers present a more mixed picture. Still largely unknown are the amounts used in products, amounts going to nonhazardous waste disposal, and amounts going into capital stock, even though these areas may comprise the main sources of outputs of these hazardous substanc-es into the environment.

WRI: MATERIAL FLOWS ACCOUNTS
33WRI: MATERIAL FLOWS ACCOUNTS
33
TASK 1: DEVELOP A DATA PROVIDER NETWORK
A network of data providers would lead in the development of standard protocols for entering material fl ows data with data stored in a remote database—an MFA Extranet. The proposed Extranet would connect experts in economic, resource, and environmental agencies, enabling them to enter their own data and to view data entered by their colleagues. Additional data providers, from trade associations and nongov-ernmental groups with data, would also need to be closely involved.
Individual governmental agencies might agree to lead or co-lead multi-stakeholder groups that would take on different tasks. EPA’s Offi ce of Environmental Information is a logical choice to convene a group to propose how MFAs can most effectively draw on and complement EPA regis-tries of environmental information. The USGS, DOE, and USDA could coordinate and improve existing commodity time series data with more detailed data on the uses of materials in the econ-omy and the wastes associated with production. Agencies like USGS could coordinate expertise in geology, geography, hydrology, and biology to develop standards for geographical information on material fl ows and to deepen understanding
6
N E X T S T E P S I N E S T A B L I S H I N G U . S . M A T E R I A L F L O W S A C C O U N T S
Past initiatives have demonstrated the feasi-bility of establishing material fl ows ac-counts and using them to establish indica-
tors of material input and output at the level of na-tional economies. Japan and several countries in the European Union have committed to variants of this approach, and efforts to refi ne the meth-odology are underway. At the same time, earlier work notes the importance of developing more detailed accounts for specifi c substances and for material categories.76 The accounting framework proposed in this policy brief offers the opportunity to move toward standard, disaggregated accounts in the United States and in any other country interested in adopting the MFA approach.
The next steps towards institutionalizing mate-rial fl ows accounts in the United States involve three tasks: 1) Develop a network of resource, environmental, and economic data providers—including government information and statisti-cal offi ces—to expand materials coverage and improve the protocols for entering and manag-ing the data; 2) Identify the user community and evaluate methods for presenting material fl ows data that are policy relevant and accessible to the public; and 3) Convene a broad-based partner-ship of data providers and users to take the lead in institutionalizing material fl ows accounts, a process that is likely to require a congressional mandate.

WRI: MATERIAL FLOWS ACCOUNTS
34
help with evaluation and policymaking. Non-governmental groups are also developing ways to look at and present the data. For instance, the environmental group INFORM provides infor-mation on persistent, bioaccumulative, and toxic substances entering the economy in industrial and consumer products in order to promote pur-chasing practices that prevent pollution.80
Examples of uses that might be explored by material fl ows users include ongoing initiatives as well as such new efforts as:
• Selecting targets for green chemistry projects to design substitutes for products that are major sources of dissipative uses;81
• Tracking changes in waste reduction and recy-cling using a basket of substances; and
• Using a basket of substances to track changes in the characteristics of the materials that Americans use. Are they increasingly biode-gradable, for example?82
To encourage broader public use of MFAs, the data need to be disseminated widely in an easily understood form. While the TRI data are easily available to anyone to analyze, most people gain knowledge through reports and presentations by government agencies, nongovernmental groups, and businesses or through media coverage. Us-ers of material fl ows data, including government agencies, nongovernmental organizations, and businesses, can be encouraged to work together to experiment and evaluate different ways of using and presenting MFA data. For example, in the 1990s, initiatives such as the website Score-cardTM demonstrated the potential to improve communication on environmental issues with the public. This website, developed by Environ-mental Defense, offers data about chemicals
of the relationship between material fl ows and impacts on the natural environment. The White House Council on Environmental Quality might address presentation and dissemination of the data through its work on environmental indica-tors.
To extend coverage of the database, data pro-viders could join users to decide priorities for materials to add. Possible criteria for selecting additional materials could include:
• Materials used in very large quantities for housing, transport, energy, or agriculture;
• Materials, especially chemicals, that are per-sistent and bioaccumulative;
• Materials in consumer products that dissipate during use;
• Materials identifi ed through environmental monitoring programs.
The group might examine the possibility of adding materials from specifi c lists. EPA’s prior-ity chemicals list is one. Others include persis-tent organic pollutants listed under the Stock-holm Convention,77 the list of chemicals being produced in large volumes being tested under an OECD program,78 or the chemicals found on the U.S. national priorities list of hazardous waste sites.79
TASK 2: EVALUATE METHODS FOR USING AND PRESENTING MATERIAL FLOWS DATA
Many governmental agencies at local, state, and national levels are already developing environ-mental indicators. Government managers are experimenting with ways to use MFA data to

WRI: MATERIAL FLOWS ACCOUNTS
35
ranging from health effects, hazard rankings, industrial and consumer uses, environmental releases and transfers, risk assessment, and regulations.83 Users can enter any U.S. zip code to retrieve local data about emissions in their community.
User groups could develop a series of case studies that aim to answer questions such as: What formats would be useful to government offi cials, business managers, and community leaders? How might the data be presented in ways to create incentives for using safer and more effi cient products? What regular indicators or graphics might the media provide that would help business and government leaders as well as individuals connect their actions to the effect on materials fl owing into the economy and out into the environment?
Material fl ows accounts are also likely to benefi t from the work of intermediaries. Writ-ers, journalists, educators, local citizen groups, and businesses can work together to encourage imaginative use of MFA data for people of differ-ent interests and perspectives. One goal might be to encourage trade publications and the news media to report regularly on perhaps a half-doz-en indicators displaying and comparing trends for selected material fl ows.
TASK 3: BUILD A PARTNERSHIP OF PROVIDERS AND USERS OF MATERIAL FLOWS DATA TO TAKE THE LEAD IN INSTITUTIONALIZING U.S. MATERIAL FLOWS ACCOUNTS
A dedicated group of experts has developed the methodology for material fl ows accounts and has raised its visibility in the research communi-ty over the past decade. Internationally, countries are cooperating to develop consistent method-ologies and indicators through institutions such as the Organization for Economic Cooperation and Development. The U.S. data provider and user groups suggested here form the kernel of a constituency for institutionalizing material fl ows accounts in the United States. MFAs might, for example, be included as one responsibility of an Environmental Statistics Bureau. This process will likely require a congressional mandate.
These three steps would help realize the prom-ise of material fl ows accounts to support contin-ued U.S. prosperity while offering government and the public an effective tool for meeting the environmental challenge that comes from main-taining the continued fl ow of goods and services to society.
WRI: MATERIAL FLOWS ACCOUNTS
36WRI: MATERIAL FLOWS ACCOUNTS
36
R E F E R E N C E S
11. Kenneth Geiser. 2001. Materials Matter: Toward A Sus-tainable Materials Policy. (Cambridge, MA: MIT Press). See tables 6.1, 6.2, and 6.3 for lists of mining and for-estry materials and environmental and health laws.
12. President’s Materials Policy Commission (The Paley Commission). 1952. Resources for Freedom. 5 volumes. (Washington, DC: Government Printing Offi ce).
13. Council on Environmental Quality. 1970. Environmental Quality: First Annual Report of the Council on Environmen-tal Quality. (Washington, D.C.: Government Printing Offi ce).
14. Geiser, Materials Matter.
15. Matthews, Weight of Nations, p. xii.
16. National Research Council. Materials Count. Chapter 4 describes the uses of material fl ows accounting data. Chapter 5 describes the gaps and fragmentation of U.S. data about the fl ows of materials. It states: “At the na-tional level in the United States, there are currently no regularly published, integrated data sets or material fl ow accounts that show total material production, use, and waste fl ows.” p. 70.
17. Organization for Economic Cooperation and Develop-ment, Environment Directorate. 2001. Key Environmen-tal Indicators. (Paris, France: Organization for Economic Cooperation and Development), p. 19.
18. Environment Directorate, Organization for Economic Cooperation and Development. 2002. Strategic Waste Prevention: OECD Reference Manual. Available at <http://www.olis.oecd.org/olis/2000doc.nsf/linkto/env-epoc-ppc(2000)5-fi nal>. The manual organizes materials by chemical class, such as hydrocarbons or phenols, as well as by type of use, waste management methods, and manner in which they are released to environment. One attempt to categorize materials from a waste manage-ment perspective suggests four classes: 1) small volume fl ows with high impacts, including heavy metals and toxics; 2) medium volume fl ows that are often recycled, including paper, steel, plastic, and glass; 3) large volume
1. Albert Adriaanse et al. 1997. Resource Flows: The Material Basis of Industrial Economies. (Washington, D.C.: World Resources Institute); Emily Matthews et al. 2000. The Weight of Nations: Material Outfl ows from Industrial Econ-omies. (Washington, D.C.: World Resources Institute).
2. Matthews, Weight of Nations, p. 33.
3. David Rejeski. 1988. “Mars, Materials, and Three Morality Plays: Material Flows and Environmental Policy,” Journal of Industrial Ecology 1(4):13-18.
4. U.S. Environmental Protection Agency. 2003. “Response to Requests to Cancel Certain Chromated Copper Arsenate (CCA) Wood Preservative Products and Amendments to Terminate Certain Uses of Other CCA Products.” Federal Register 68 (68), Wednesday, April 9, 2003 [OPP–2003–0104; FRL–7301–2].
5. World Business Council for Sustainable Development. 2002. The Cement Sustainability Initiative. Available at <http://www.wbcsd.org/>.
6. John L. Jechura et al. 2000. Encouraging the Development of Biorefi neries—Development of Qualitative and Quantita-tive Planning Models. (Golden, CO: National Renewable Energy Laboratory).
7. Eurostat. 2002. Material Use in the European Union 1980-2000: Indicators and Analysis. See also <http://waste.eionet.eu.int/mf>.
8. Noritoshi Ariyoshi and Yuichi Moriguchi. 2003. The Development of Environmental Accounting Frameworks and Indicators for Measuring Sustainability in Japan. Paper presented at the OECD Meeting on Accounting Frame-works to Measure Sustainable Development, OECD, Paris, May 14-16, 2003. Available at <http://www.oecd.org/dataoecd/19/51/2715344.doc>.
9. Matthews, Weight of Nations, p. xii.
10. National Research Council. 2003. Materials Count: The Case for Material Flows Analysis. (Washington, D.C.: National Academy Press).
WRI: MATERIAL FLOWS ACCOUNTS
37WRI: MATERIAL FLOWS ACCOUNTS
37
fl ows such as mining and harvesting wastes often as-sociated with high energy use; and 4) dissipative fl ows such as solvents, adhesives, and pesticides that enter the environment through use.
19. John C. Dernbach. 1997. “The Unfocused Regulation of Toxic and Hazardous Pollutants.” Harvard Environmen-tal Law Review (21)1. Although environmental pro-grams sometimes affect pollutants not on the lists, the potential for transfers among parts of the environment and gaps in coverage is evident from this analysis of the lists in the Clean Air Act, Clean Water Act, Resource Conservation and Recovery Act, Occupational Safety and Health Act, and Emergency Planning and Right to Know Act. The study found 768 of 1,134 substances were regulated under just one of the fi ve laws, while only 49 appeared in all fi ve.
20. U.S. Environmental Protection Agency, Offi ces of Environmental Information and of Research and De-velopment. 2003. 2003 Draft Report on the Environment, Technical Document. “Chemicals in the Landscape,” pp. 3-24.
21. Pollution Prevention Act of 1990. Sec. 6602.
22. U.S. Environmental Protection Agency, Offi ce of Solid Waste. 2002. Beyond RCRA: Waste and Materials Man-agement in the Year 2020. Report no. EPA530-R-02-009. Available at <www.epa.gov/epaoswer/osw/vision.pdf>.
23. U.S. Environmental Protection Agency, Offi ce of Solid Waste and Emergency Response. 2004. The Resource Conservation Challenge: A Year of Progress. Report no. EPA530-R-04-001. Available at <www.epa.gov/epao-swer/osw/conserve/resources/rcc-rpt1.pdf>.
24. U.S. Environmental Protection Agency. 2002. Toxics Release Inventory 2000 Public Data Release Report: Execu-tive Summary. Available at <http://www.epa.gov/tri>.
25. To explore the Toxics Release Inventory online, see <http://www.epa.gov/triexplorer/>.
26. United Nations Development Program, United Nations Environment Program, The World Bank, and the World Resources Institute. 2003. World Resources 2002–4, Deci-sions for the Earth: Balance, Voice, and Power. See Box 6.2 citing U.S. Environmental Protection Agency.
27. U.S. Environmental Protection Agency. 2003 Draft Report on the Environment.
28. P.H. Templet. “The Positive Relationship Between Jobs, Environment, and Pollution: An Empirical Analysis.”
Spectrum, Spring 1995: 37-49. Templet uses data from the Toxic Release Inventory to examine the relationship of waste and pollution levels to jobs and GDP.
29. I.K. Wernick et al. 1998. “Searching for Leverage to Conserve Forests: The Industrial Ecology of Wood Products in the U.S.” Journal of Industrial Ecology, 1(3):125-145.
30. U.S. Environmental Protection Agency. Response to Re-quests to Cancel Certain Chromated Copper Arsenate (CCA) Wood Preservative Products. Federal Register, April 9, 2003:68.
31. Suzie Greenhalgh and Amanda Sauer. 2003. Awaken-ing the Dead Zone: An Investment for Agriculture, Water Quality, and Climate Change. (Washington, DC: World Resources Institute).
32. David Rejeski. 1988. “Mars, Materials, and Three Moral-ity Plays: Material Flows and Environmental Policy,” Journal of Industrial Ecology 1(4):13-18.
33. Allison L. C. de Cerreno, Marta Panero, and Susan Boehme. 2002. Pollution Prevention and Management Strategies for Mercury in the New York/New Jersey Harbor. A Report from the Harbor Consortium of the New York Academy of Sciences; Susan Boehme and Marta Panero. 2003. Pollution Prevention and Management Strategies for Cadmium in the New York/New Jersey Har-bor. A Report from the Harbor Consortium of the New York Academy of Sciences.
34. D.W. Kolpin. 2002. “Pharmaceuticals, Hormones, and Other Organic Wastewater Contaminants in U.S. Streams, 1999-2002: A National Reconnaissance.” Environmental Science and Technology (36):1202-11.
35. C.D. Ferguson. 2003. Commercial Radioactive Sources: Surveying the Security Risks. (Monterey, CA: Center for Nonproliferation Studies).
36. Eurostat. 2001. Economy-wide Material Flow Accounts and Derived Indicators: A Methodological Guide. (Luxem-bourg: Eurostat.)
37. Eurostat. 2002. Material Use in the European Union 1980-2000: Indicators and Analysis. See also <http://waste.eionet.eu.int/mf>.
38. Federal Statistic Offi ce, Input (use) and Output (supply) Table 1990 for Former Territory of the Federal Republic of Germany. Available at <http://www.destatis.de/basis/e/vgr/vgrino3.htm>.

WRI: MATERIAL FLOWS ACCOUNTS
38
39. S. Nakamura. 2000. “Input-Output Analysis of Waste Management.” Waste Management Research 11(4):289-300 (in Japanese).
40. SPIN provides data on the use of chemical compounds in Norway, Sweden, Denmark, and Finland. The project is fi nanced by the Nordic Council of Ministers, Chemi-cal Group. The data is supplied by the product regis-tries of the contributing countries. See <http://www.spin2000.net>.
41. Rick Ulf. 2002. “The Swedish National Products Regis-ter.” Paper presented at the Workshop on Toxicological Information and Data Network—A European Chal-lenge? Held in Berlin on September 9 and 10, 2002. See <http://www.kemi.se> for a discussion of fl ow analysis.
42. Peter A. Maxson. 2001. Chemical Releases from Products: Emissions During the Product Life Cycle. Presentation at the Falkenberg Conference on Chemicals in Products as a Source of Environmental Pollution, April 2001. For mercury, point-source emissions accounted for 23 percent of potential product emissions
43. See California Air Resources Board Consumer Products and Smog page at <http://www.arb.ca.gov/consprod/re-gact/cpsmog.htm>.
44. New Jersey Worker and Community Right to Know Act, 1983; Pollution Prevention Act, 1991.
45. Massachusetts Toxics Use Reduction Act, 1989
46. Massachusetts Department of Environmental Pro-tection. 2003. 2001 Toxics Use Reduction Information Release. Available at <http://www.turi.org/turadata/Suc-cess/ResultsToDate.html>.
47. Sony Corporation. 2002. Social & Environmental Report 2002. Sony aims to reduce products by 20 percent in terms of weight or number of parts between 2000 and 2005 as one target on the input side. On the output side, one target calls for reducing total waste generated by 30 percent per sales unit while achieving zero land-fi ll waste. Other targets address hazardous materials, greenhouse gases, and water.
48. See, for example, the Environmental Management Accounting International Website at <http://www.emawebsite.org/>.
49. See EMAS, the Eco-Management and Audit Scheme set up as a voluntary EU program, at <http://europa.eu.int/comm/environment/emas>.
50. Global Reporting Initiative. 2002. Sustainability Report-ing Guidelines. Available at <http://www.globalreport-ing.org>.
51. World Business Council on Sustainable Development and the World Resources Institute. 2001. Greenhouse Gas Protocol: A Corporate Accounting and Reporting Stan-dard. (Washington, D.C.: World Resources Institute.)
52. Statutory Order from the Denmark Ministry of Environ-ment and Energy. No. 975, issued December 13, 1995, on the duty of drawing up green accounts for certain listed activities.
53. TSCA Inventory Update Rule Amendments, 40 CFR, Part 710, Subpart B.
54. Because a variety of trade and common names are often used for a single chemical, the Chemical Abstract Service number is used to ensure accuracy.
55. For information on EPA’s Envirofacts Master Chemi-cal Integrator, see <http://www.epa.gov/enviro/html/emci/>.
56. World Bank. 2001. World Development Indicators: 2001. (Washington, DC: World Bank); Kirk Hamilton et al. 1999. “Genuine Savings Rates in Developing Coun-tries.” World Bank Economic Review, vol. 13(2):333-56.
57. For a review of 13 methods for weighting emission data, see Michael W. Toffel and Julian D. Marshall, “Improving Environmental Performance Assessment: A Comparative Analysis of Weighting Methods Used to Evaluate Chemical Release Inventories.” Journal of Industrial Ecology, Vol. 8:1-2, 143-172.
58. Jane C. Bare et al. 2003. “TRACI: The Tool for the Reduction and Assessment of Other Environmental Impacts.” Journal of Industrial Ecology 6 (3-4):49–78.
59. U.S. Department of Energy, Energy Information Administration. Annual Energy Review. Available at <http://www.eia.doe.gov/emeu/aer/contents.html>.
60. Inventory Update Rule, 40 CFR, Part 710, Subpart B. Under the most recent Inventory Update Rule Amend-ments to TSCA, companies will provide some addi-tional data on about 9,000 manufactured or imported chemicals that are used in large volumes. Companies that use over 300,000 pounds annually of a substance will be required to provide data about their production volume in each industrial function and commercial and consumer product category as well as whether the products are intended for use by children.

WRI: MATERIAL FLOWS ACCOUNTS
39
61. U.S. Department of Commerce, Census Bureau. 2001. Materials Summary: 1997 Economic Census Manufactur-ing Subject Series. Report no. EC97Ms1S-MS.
62. U.S. International Trade Commission. Interactive Tariff and Trade Data, Web Version 2.6.0. See <http://da-taweb.usitc.gov/scripts/user_set.asp>.
63. Letter to U.S. International Trade Commission from Committee on Ways and Means, U.S. House of Repre-sentatives (Oct. 17, 1995); Synthetic Organic Chemicals (SOC) Reports, 60 Federal Register 58639, Nov. 28, 1995.
64. Pesticide use data provided by USDA and EPA’s annual estimates of production and use differ by an order of magnitude. USDA data only covers application to spe-cifi c crops. We note the discrepancy, leaving open the question of why the vast majority of pesticide use went unreported and pointing to the value in harmonizing sources.
65. U.S. Geological Survey. Mineral Commodity Summa-ries. Published annually. Available at <http://minerals.usgs.gov/minerals/pubs/mcs/>.
66. Matthews, The Weight of Nations, p. 34.
67. T. Amari et al. 1999. “Resource Recovery from Used Rubber Tires.” Resources Policy 25(3):179-188.
68. Robert U. Ayres. 1993. “Materials/Energy Flows and Balances as a Component of Environmental Statistics,” in Alfred Franz and Carsten Stahmer (eds.), Approaches to Environmental Accounting, Physica, pp. 126–142; Rob-ert U. Ayres. 1998. “The Life Cycle of Chlorine, Part III: Accounting for Final Use.” Journal of Industrial Ecology 2(2):65-89.
69. U.S. Environmental Protection Agency, Offi ce of Solid Waste and Emergency Response. 2003. Measuring Progress 1991-2001: The Priority Chemicals Trends Report. Available at <http://www.epa.gov/epaoswer/hazwaste/minimize/trends.htm>.
70. Ibid.
71. Susan Boehme et al. Pollution Prevention and Manage-ment Strategies for Cadmium in the New York/New Jersey Harbor, pp. 40-45.
72. Bette Fishbein. 1997. Industry Program to Collect Nickel Cadmium (Ni-Cd) Batteries. Available at <http://www.informinc.org/recyclenicd.php>.
73. David Donaldson et al. 2002. Pesticides Industry Sales and Usage, 1998 and 1999 Market Estimates. U.S. Envi-
ronmental Protection Agency, Offi ce of Prevention, Pes-ticides, and Toxic Substances, Biological and Economic Analysis Division. Report no. EPA-733-R-02-001.
74. Matthew J. Bramley. 1998. Dioxin and Hexachloro-benzene Releases from Magnesium Production in North America: Lessons from Noranda’s Magnola Project in Asbestos, Quebec. (Canada: Greenpeace)
75. Agency for Toxic Substances and Disease Registry. 1995. Toxicological Profi le for Naphthalene, 1-Methylnapthalene, 2-Methylnaphthalene. Available at <http://www.atsdr.cdc.gov/toxprofi les/tp67.html>.
76. Council on Environmental Quality. Environmental Qual-ity, The First Annual Report of the Council on Environmen-tal Quality, p. 3.
77. Stockholm Convention on Persistent Organic Pollut-ants, available at <http://www.pops.int/>.
78. Organization for Economic Cooperation and Develop-ment. See <http://www.oecd.org>, then search under High Production Volume Testing Programme. Scien-tists in member countries aim to test 1,000 of the more than 5,000 high volume chemicals by 2004.
79. Agency for Toxic Substances and Disease Registry. Toxicological Profi les Series. Available at <http://www.atsdr.cdc.gov/toxprofi les/>. Contains profi les on 275 chemicals found at sites on the U.S. national priorities list for Superfund sites.
80. Purchasing for Pollution Prevention. See <http://www.informinc.org/p3_00.php>.
81. Search for Green Chemistry Institute at <http://www.chemistry.org>. Home page includes links to introduc-tory readings.
82. Washington State, Department of Ecology. 2003. Improving Waste and Materials Tracking in Washington, Beyond Waste Consultant Team Issue Paper #7. In its Beyond Waste program, Washington has explored the possibility of monitoring a basket of products to track toxic concentrations, recyclability, recycled content, and other characteristics.
83. Environmental Defense. 2003. Available at <http://www.scorecard.org>.

WRI: MATERIAL FLOWS ACCOUNTS
40
Appendix A
M A T E R I A L S C O V E R E D I N T H E W R I M A T E R I A L F L O W S D A T A B A S E
34. Quartz Crystal (Industrial) 35. Salt 36. Caustic Soda37. Chlorine38. Sand & Gravel (Construction)39. Sand & Gravel (Industrial)40. Silicon 41. Soda Ash 42. Sodium Sulfate 43. Stone (Crushed) 44. Lime 45. Cement 46. Stone (Dimension) 47. Sulfur 48. Talc and Pyrophyllite 49. Vermiculite 50. Yttrium
METALS
51. Aluminum 52. Antimony 53. Arsenic 54. Beryllium 55. Bismuth 56. Boron57. Bromine 58. Cadmium 59. Chromium 60. Cobalt 61. Columbium (Niobium) 62. Copper 63. Gallium 64. Gold 65. Indium66. Iron ore
MINERALS
1. Abrasives (manufactured derivatives of Aluminum Oxide, Silicon Carbide)
2. Asbestos 3. Barite 4. Cesium 5. Clays6. Kaolin7. Ball8. Fire9. Bentonite10. Fullers earth11. Common12. Diamond (Industrial) 13. Diatomite 14. Feldspar 15. Fluorspar 16. Garnet (Industrial) 17. Gemstones 18. Germanium 19. Graphite (Natural) 20. Gypsum 21. Helium 22. Iodine 23. Kyanite & Related Minerals 24. Magnesium Compounds 25. Mica (Natural), Scrap & Flake26. Mica (Natural), Sheet 27. Nitrogen (Fixed), Ammonia 28. Peat 29. Perlite 30. Phosphate rock31. Phosphoric acid 32. Potash33. Pumice and Pumicite
67. Iron and steel68. Iron and steel slag 69. Lead70. Lithium 71. Magnesium Metal 72. Manganese 73. Mercury 74. Molybdenum 75. Nickel 76. Platinum-Group Metals 77. Rare Earths 78. Rhenium 79. Rubidium 80. Scandium 81. Selenium 82. Silver 83. Strontium 84. Tantalum 85. Tellurium 86. Thallium 87. Thorium 88. Tin 89. Titanium 90. Tungsten 91. Vanadium 92. Zinc 93. Zirconium and Hafnium
AGRICULTURE
94. Wheat 95. Rye 96. Rice 97. Corn98. Ethanol 99. Oats

WRI: MATERIAL FLOWS ACCOUNTS
41WRI: MATERIAL FLOWS ACCOUNTS
41
100. Barley 101. Sorghum 102. Cottonseed103. Soybeans104. Flaxseed 105. Cotton106. Sugar beets107. Sugar Cane108. Commercial Vegetables109. Potatoes 110. Sweet Potatoes111. Hay112. Hops113. Millet114. Peanuts115. Tobacco116. Honey117. Tree Nuts118. Mushrooms119. Beans, dry edible
120. Citrus Fruit121. Non-citrus Fruit122. Cattle123. Beef124. Hogs 125. Pork126. Chickens127. Chicken Meat128. Turkeys129. Turkey Meat130. Sheep131. Mutton and Lamb Meat132. Wool133. Milk and Dairy Products134. Eggs135. Animal Manure136. Animal By-Products137. Rubber138.Fishery Products139.Yard Trimmings
FORESTRY
138. Industrial Roundwood139. Lumber140. Plywood & Laminated Veneer
Lumber (LVL)141. Wood Panels142. Pulpwood143. Woodpulp144. Paper & Board 145. Fuelwood146. Other Industrial Roundwood
ENERGY
147. Natural Gas (Methane)148. Pentanes Plus149. Butane 150. Propane151. Ethane152. Crude Oil153. Asphalt & Road Oil154. Jet Fuel (inc. Aviation
Gasoline)155. Distillate Fuel Oil156. Kerosene157. Lubricant158. Motor Gasoline159. Petroleum Coke160. Residual Fuel Oil161. Coal162. Coke163. Combustion products

WRI: MATERIAL FLOWS ACCOUNTS
42WRI: MATERIAL FLOWS ACCOUNTS
42
Appendix B
G L O S S A R Y O F T E R M S
Government Performance and Results Act of 1993 (GPRA). Holds federal agencies accountable for using resources wisely and achieving program results. GPRA requires agencies to develop plans for what they intend to ac-complish, measure how well they are doing, make appropriate decisions based on the information they have gathered, and communicate information about their performance to Congress and to the public. Also see Performance indicators.
Green Chemistry. Branch of chemistry with the objective of promoting innovative chemical technologies that reduce or eliminate the use or generation of hazardous sub-stances in the design, manufacture, and use of chemical products.
Industrial Function Category. Refers to categories for desig-nating the intended industrial function for chemically formulated products and is used in reporting under the 2005 and 2006 amendments to the Toxic Substances Control Act Inventory Update Rule.
Life Cycle. Flow of material through successive phases of economic activity and into the natural environment. Phases can be defi ned in different ways. TSCA intro-duced this approach into public policy by covering manufacture, processing, distribution, use, and disposal.
Material Flows Data Sheet. A template developed by WRI to standardize data to be entered into material fl ows accounts.
Organic Wastewater Contaminants. Materials that enter waterways and are associated with human, industrial, and agricultural wastewater. They can include antibiot-ics, other prescription drugs, nonprescription drugs, steroids, reproductive hormones, personal care products, products of oil use and combustion, and other exten-sively used chemicals.
Performance Indicators. Measures the distance between a current situation and a desired situation or target, a distance-to-target assessment.
Persistent Toxic Material. Refers to a toxic compound that remains intact for an extended period after being intro-
Bioaccumulative. Accumulation of a substance, such as a toxic chemical, in various tissues of a living organism: the bioaccumulation of mercury in fi sh.
Chemical Abstract Service (CAS) Number. Unique identifi ca-tion number for a chemical as designated by the Chemi-cal Abstract Service, a division of the American Chemical Society. The classifi cations included approximately 22 million chemicals in 2003. CAS numbers are used in reference works, databases, and regulatory compliance documents by many organizations around the world to identify substances without the ambiguity of chemical nomenclature.
Commercial/Consumer Product Category. Categories for designating intended consumer uses for chemically for-mulated consumer products. The classifi cation is used in reporting under the 2005-2006 amendments for the Toxic Substances Control Act Inventory Update Rule.
Comparative Risk Assessment. A qualitative process to rank or compare environmental problems or programs by risk (likelihood of injury or damage that is or can be caused by a substance, technology, or activity) to human health and to the environment. It is used by EPA. The results help evaluate and reset priorities for environmental protection.
Data Protocols. A standard procedure for regulating data organization, presentation, and transmission between computers.
Dead Zone in the Gulf of Mexico. An area roughly the size of the state of Connecticut located at the mouth of the Mississippi River that experiences a condition of low oxygen called “hypoxia” caused by the fl ow of excessive nutrients—including nitrogen and phosphorous—that trigger algal blooms, eventually depleting the supply of dissolved oxygen and causing fi sh, shrimp, crabs, and other sea life to die or migrate.
Environmental Impact Coeffi cients. Numerical coeffi cients relating environmental and human health effects to dos-ages or quantities of materials. The coeffi cient estab-lishes a quantitative correlation between a material fl ow and its related impact.

WRI: MATERIAL FLOWS ACCOUNTS
43WRI: MATERIAL FLOWS ACCOUNTS
43
Toxic Substances Control Act (TSCA). Enacted in 1976 by Congress to give EPA the ability to track industrial chemicals produced or imported into the United States. Under TSCA, EPA screens new chemicals and can require reporting or testing on existing chemicals that may pose an environmental or health hazard. The law provides power to ban or otherwise limit the import, manufacture, or use of those chemicals found to pose an unreasonable risk.
Toxics Release Inventory (TRI). A publicly available EPA da-tabase established under the Emergency Planning and Community Right-To-Know Act of 1986. Industrial and federal facilities report annually on the amounts of any of about 650 listed chemicals released to air, water, and soil and transferred to waste management facilities.
Volatile Organic Compounds (VOCs). Any organic com-pound that participates in atmospheric photochemical reactions in which they tend to volatilize or evaporate.
Waste Minimization Priority Chemicals. A list of 30 chemi-cals found in hazardous waste and documented as contaminants to air, land, water, plants, and animals. The Partnership for Environmental Priorities, formed in 2002, is expanding the list of priority chemicals and setting a new goal to eliminate the hazardous waste containing them.
Waste. An unusable or unwanted substance or material. Something such as steam, which escapes without being used, or a used refrigerator, a solid waste that must be disposed of. Waste is usually defi ned as solid rather than liquid or gas in environmental policy, although all are wastes in the economic sense. Liquid and gaseous wastes are usually referred to as pollutants or releases.
duced into the environment. It is slow to metabolize into benign constituents.
Physical Input-Output Tables (PIOT). Modeled on national economic input-output accounts. The tables describe the fl ows of material and energy within the economic system and between the economic system and the natural environment. The tables also show the physi-cal accumulation of materials in the economy but not stocks of man-made or natural capital.
Pollution Prevention. Use of materials, processes, or prac-tices that reduce or eliminate the creation of pollutants or wastes at the source. It includes practices that reduce the use of hazardous materials, energy, water, or other resources as well as practices that protect natural re-sources through conservation or more effi cient use.
Pollution Prevention Act of 1990. Focuses industry, govern-ment, and public attention on reducing the amount of pollution through cost-effective changes in production, operation, and raw materials use. It identifi es source re-duction as fundamentally different and more desirable than waste management or pollution control.
Primary Feedstock. Materials used as basic ingredients in the manufacture of a commodity chain.
Product Registries. Contain information on chemical sub-stances and products. National legislation in Nordic countries, such as Sweden, require manufacturers and importers to report annually on the amounts of chemi-cal substances in their products that can cause human health effects such as allergies, cancer, or birth defects. Data in the registries are used to support risk assess-ments, statistical calculations, substance fl ow analyses, and supervision activities.
Synthetic Organic Chemicals (SOCs). Man-made substances containing mainly carbon, hydrogen, nitrogen, and oxygen.

IDDO K. WERNICK
FRANCES H. IRWIN
MATERIAL FLOWS ACCOUNTSA Tool for Making Environmental Policy
A b o u t W o r l d R e s o u r c e s I n s t i t u t e
World Resources Institute is an environmentalresearch and policy organization that creates solutions to protect the planet and improve people’s lives.
WRI’s work is concentrated on achieving progresstoward four key goals:
• Protect Earth’s living systems• Increase access to environmental information• Create sustainable enterprise and opportunity• Reverse global warming.
WRI is an independent, non-partisan organizationthat works closely with governments, the privatesector, and civil society groups in more than 100countries around the world.
Its strength is the ability to catalyze permanentchange through partnerships that implement innovative, incentive-based solutions founded upon hard, objective data. WRI believes that harnessing the power of markets will ensure real,not cosmetic, change.
WRI demands measurable results from its work;ideas must lead to action.
World Resources Institute10 G Street, NEWashington, DC 20002 USA
w w w . w r i . o r g
W R I R E P O R T
World
Resources
Institute