a threedimensional automated classification scheme for - mnras
TRANSCRIPT
Mon. Not. R. Astron. Soc. 384, 827–833 (2008) doi:10.1111/j.1365-2966.2007.12764.x
A three-dimensional automated classification scheme for the TAUVEXdata pipeline
Archana Bora,1,2� Ranjan Gupta,1� Harinder P. Singh,3� Jayant Murthy,4�
Rekhesh Mohan4� and K. Duorah2
1IUCAA, Post Bag 4, Ganeshkhind, Pune-411007, India2Department of Physics, Gauhati University, Guwahati 781014, India3Department of Physics and Astrophysics, University of Delhi, Delhi 110007, India4Indian Institute of Astrophysics, Koramangla, Bangalore 560034, India
Accepted 2007 November 23. Received 2007 November 13; in original form 2007 June 15
ABSTRACTIn order to develop a pipeline for automated classification of stars to be observed by the Tel-
Aviv University Ultra-Violet Experiment (TAUVEX) ultraviolet space telescope, we employ
an artificial neural network (ANN) technique for classifying stars by using synthetic spectra in
the ultraviolet (UV) region from 1250 to 3220 Å as the training set and International UltravioletExplorer (IUE) low-resolution spectra as the test set. Both the data sets have been pre-processed
to mimic the observations of the TAUVEX UV imager. We have successfully classified 229
stars from the IUE low-resolution catalogue to within three to four spectral subclass using two
different simulated training spectra, the TAUVEX spectra of 286 spectral types and UVBLUE
(http://www.inaoep.mx/∼modelos/uvblue/uvblue.html) spectra of 277 spectral types. Further,
we have also been able to obtain the colour excess [i.e. E(B − V) in magnitude units] or the
interstellar reddening for those IUE spectra which have known reddening to an accuracy of
better than 0.1 mag. It has been shown that even with the limitation of data from just photometric
bands, ANNs have not only classified the stars, but also provided satisfactory estimates for
interstellar extinction. The ANN based classification scheme has been successfully tested on
the simulated TAUVEX data pipeline. It is expected that the same technique can be employed
for data validation in the UV from the virtual observatories. Finally, the interstellar extinction
estimated by applying the ANNs on the TAUVEX data base would provide an extensive
extinction map for our Galaxy and which could in turn be modelled for the dust distribution
in the Galaxy.
Key words: methods: data analysis – space vehicles: instruments – astronomical data bases:
miscellaneous – dust, extinction – ultraviolet: general.
1 I N T RO D U C T I O N
Tel-Aviv University Ultra-Violet Experiment (TAUVEX) is an
Indo–Israeli Ultraviolet Imaging space mission that will image
large parts of the sky in the wavelength region between 1300 and
3200 Å. The instrument consists of three equivalent 20-cm ultravi-
olet (UV) imaging telescopes with a choice of filters for each tele-
scope. Each telescope has a field of view (FOV) of about 54 arcmin
and a spatial resolution of about 6–10 arcsec, depending on the wave-
length. TAUVEX will be launched into a geostationary orbit as part
of Indian Space Research Organization’s GSAT-4 mission in 2008
April.
�E-mail: [email protected] (AB); [email protected] (RG); hpsingh@
physics.du.ac.in (HPS); [email protected] (JM); [email protected] (RM);
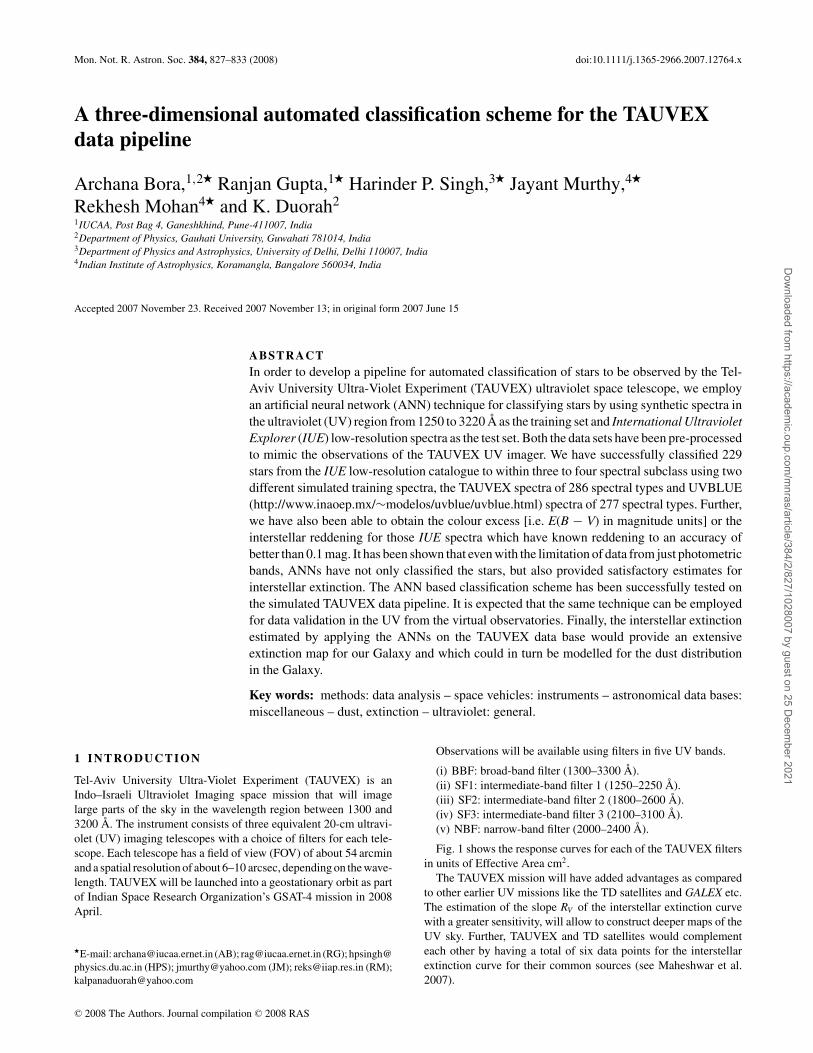
Observations will be available using filters in five UV bands.
(i) BBF: broad-band filter (1300–3300 Å).
(ii) SF1: intermediate-band filter 1 (1250–2250 Å).
(iii) SF2: intermediate-band filter 2 (1800–2600 Å).
(iv) SF3: intermediate-band filter 3 (2100–3100 Å).
(v) NBF: narrow-band filter (2000–2400 Å).
Fig. 1 shows the response curves for each of the TAUVEX filters
in units of Effective Area cm2.
The TAUVEX mission will have added advantages as compared
to other earlier UV missions like the TD satellites and GALEX etc.
The estimation of the slope RV of the interstellar extinction curve
with a greater sensitivity, will allow to construct deeper maps of the
UV sky. Further, TAUVEX and TD satellites would complement
each other by having a total of six data points for the interstellar
extinction curve for their common sources (see Maheshwar et al.
2007).
C© 2008 The Authors. Journal compilation C© 2008 RAS
Dow
nloaded from https://academ
ic.oup.com/m
nras/article/384/2/827/1028007 by guest on 25 Decem
ber 2021
828 A. Bora et al.
Figure 1. Filter response of the five filters of TAUVEX.
TAUVEX will mostly operate in scanning mode, since it will
be mounted on GSAT-4, a geosynchronous satellite. The FOV
will be scanning a strip of the sky with constant declination and
a limiting magnitude of 19 (Murthy 2003). A few years of suc-
cessful run of the mission will record more than a million UV
point sources apart from galaxies, quasi-stellar objects and the
UV background. The need for an automated classification pipeline
for the stellar sources that is repeatable and fast is, therefore,
immense.
The Artificial Neural Network (ANN) based schemes are now be-
ing routinely used to classify spectra from large spectral data bases
(Gulati et al. 1994; Singh, Gulati & Gupta 1998; Bailer-Jones 2002;
Gupta et al. 2004; Valdes et al. 2004; Singh et al. 2006) for the pur-
pose of sorting these large spectral data base into groups of main
spectral types (O, B, A, F, G, K and M) and subclasses. Further,
these schemes can also be used for obtaining stellar fundamental
atmospheric parameters (Gulati, Gupta & Rao 1997a; Gulati, Gupta
& Singh 1997b). Of these Gulati et al. (1997b) is of particular inter-
est, since it was shown that ANNs can determine the colour excess,
i.e. E(B − V) in units of magnitudes, as an additional parameter
when applied to the International Ultraviolet Explorer IUE spectral
data base.
The current work has used the ANN based tools for classifying
the IUE spectral data base (reduced to the TAUVEX band data)
in terms of the spectral types and also hierarchically estimated the
colour excess using this tool. It is worth noting that whereas the
Gulati et al. (1997b) used the IUE full spectra for spectral-type
classification and estimation of colour excess, the present work uses
the simulated band data as expected from the TAUVEX satellite and
even with this limitation, the neural network scheme has been able
to assign the spectral classes and also obtain reddening estimate to
satisfactory levels.
In the next section, we describe the generation and pre-processing
of the simulated TAUVEX data that are used for training of the
neural network as well as the processing of the IUE spectral data
which is used as the test set. In Section 3, we describe results of
the ANN classification scheme as well as the colour excess deter-
mination. In Section 4, we present important conclusions of the
study.
2 A N N A R C H I T E C T U R E , G E N E R AT I O N O FS I M U L AT E D DATA , A N D A N N T R A I N A N DT E S T S E T S
Following sections describe the ANN architecture, simulated data
generation, and the ANN train and test sets.
2.1 ANN architecture
The ANN architecture considered here is an supervised one with
a minimum configuration of three layers, i.e. (i) input layer where
the patterns are read, (ii) hidden layer where the information is pro-
cessed from the input layer and (iii) output layer where the output
patterns are rendered (see Bailer-Jones, Gupta & Singh 2002, for a
review). The hidden layer can have several nodes which intercon-
nect the input and the output layers with each connection with its
designated connection weight. We have used a back-propagation
algorithm (Gulati et al. 1994, 1997a,b; Singh et al. 1998) with two
hidden layers of 64 nodes each, and this scheme requires a training
session where the ANN output and the desired output get compared
after each iteration and the connection weights get updated till the
desired minimum error threshold is reached. At this stage, the net-
work training is complete and the connection weights are considered
frozen. The next stage is the testing session where the test patterns
are fed to the network and output is the classified spectral pattern or
colour excess in terms of the training sets.
In the actual post launch of TAUVEX when the real data will be
available, the scheme applied to estimate the colour excess will have
to run the ANN in two stages, i.e. in a hierarchal manner such that,
the first stage classifies the test set (IUE data base or the expected
TAUVEX data base) into the spectral classes and then a second
ANN stage performs the colour excess estimation.
2.2 Simulated data generation
We have used two independent sources to generate the training sets
of spectra with solar-type stars with [M/H] = 0. One is the stel-
lar flux calculator from TAUVEX website (http://tauvex.iiap.res.in/
htmls/tools/fluxcalc/) containing 286 spectroluminosity classes and
the other is the UVBLUE fluxes (Rodriguez-Merino et al. 2005)
(http://www.bo.astro.it/∼eps/uvblue/uvblue.html). Based on the
spectral type and luminosity class of a star, the TAUVEX calculator
derives the effective temperature and surface gravity using the cali-
bration of Allen (2000), Colina (1995) and Lang (1982), and calcu-
lates the spectral energy distribution for each star using appropriate
Kurucz model available on the webpage http://kurucz.harvard.edu/
(see Sujatha et al. 2004). We have used the information from Allen
(2000), Erika Beohm-Vitense (1981), Johnson (1966), Ridgway
et al. (1980), Alonso, Arribas & Martinez-Roger (1999) and Bertone
et al. (2004) for matching the parameter space of UVBLUE to spec-
tral types and luminosity classes. Both the sources provide sets of
theoretical fluxes (based on Kurucz model atmospheres) in the UV
region. These fluxes need to be processed via a common flux inte-
gration programme provided at the TAUVEX tools site to form two
sets of band data (each having four fluxes corresponding to the four
TAUVEX bands) and they constitute the simulated band data set for
the ANN training sets.
We have also obtained two sets of fluxes (with 50 Å reso-
lution and 40 data bins covering the spectral region of 1250–
3220 Å) aimed at preparing the ANN tools for another Indian sci-
entific mission satellite ASTROSAT (http://www.rri.res.in/astrosat/)
which will have gratings to provide slitless spectra for spatially
C© 2008 The Authors. Journal compilation C© 2008 RAS, MNRAS 384, 827–833
Dow
nloaded from https://academ
ic.oup.com/m
nras/article/384/2/827/1028007 by guest on 25 Decem
ber 2021
Automated classification pipeline for TAUVEX 829
resolved stars. It will also prepare us for the future GAIA mission
(http://gaia.esa.int/science-e/www/area/index.cfm?fareaid=26).
2.3 ANN train and test sets
While making the train and test sets, one has to ensure that the
number of spectral fluxes at the respective wavelengths and the
starting/ending wavelengths are identical. Also the spectral resolu-
tion needs to be same and for this, the spectral libraries had to be
convolved with appropriate Gaussian functions to bring them at par
with each other. The fluxes are normalized to unity with respect
to maximum flux in each spectrum before sending to the ANN in-
puts. The spectra for 286 TAUVEX spectral types generated in the
range 1250–3200 Å have a resolution of 10 Å which we have de-
graded to 50 Å. The resolution of 277 UVBLUE spectral types has
been degraded similarly (using the relevant codes provided on the
UVBLUE library website). These sets of data are then reddened
(using the observed extinction curve of Seaton 1979) in the range
of 0.00–1.00 mag, for preparing the training sets for the two stages
of the hierarchal scheme viz. the separation of the different spectral
types and the evaluation of reddening values. Below we provide the
details of the procedure adopted for generating the training sets for
the two stages:
(i) Generating data set for spectral-type determination. In the first
stage, reddening values are added in step sizes of 0.20 mag to the
simulated data. The 0.20 step is chosen for the computational con-
venience. For example, the TAUVEX data consist of 286 different
classes with 58 spectral types, each having five luminosity classes
(except for O6.5V). If one wants to classify the spectral type, lu-
minosity class and the reddening value in a single run; reddening
these 286 data sets with reddening value from 0.00–1.00, even at a
step of 0.1 leads to 286 × 11 = 3146 number of distinct classes.
However, this is not possible with our current computational facil-
ities and the present version of our ANN. Instead, we go for the
hierarchal scheme by first merging all the luminosity classes. For
example, instead of considering O3I–O3V as five separate classes,
the ANN will be trained to learn all the five different patterns as
single O3 spectral type only, though the variation in all the five
spectra still go as input to the ANN. The process thus reduces the
number of distinct classes from 286 to only 58 classes, making the
computation fast. When the learning process is completed, ANN
can separate different spectral types, thus making it possible to find
out the reddening values in the next stage.
(ii) Generating data set for reddening evaluation. In the second
stage, reddening values are added in step sizes of 0.05 to the sim-
ulated data. The separation of the available spectra into different
groups O, B, A, F, G, K, etc. in the first stage, makes it possible to
select this finer step size of 0.05. In our work, we have not classified
the luminosity classes separately, however, this can be done easily
by adding one more stage in the hierarchal scheme.
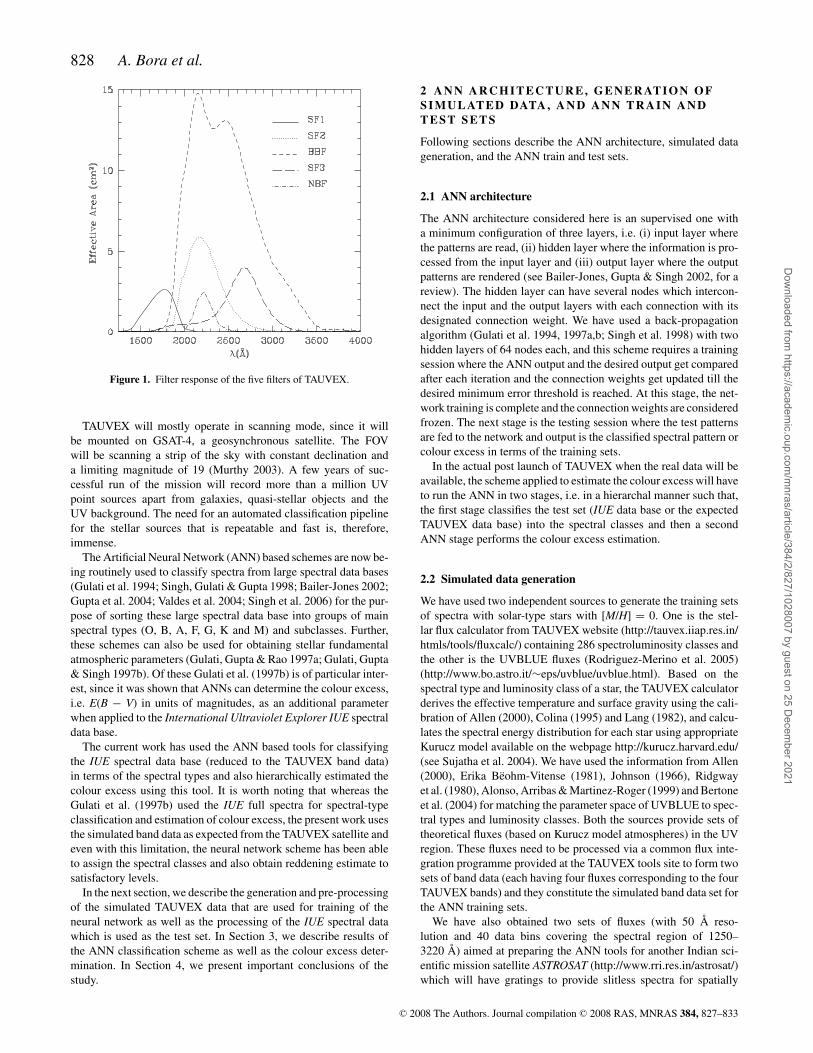
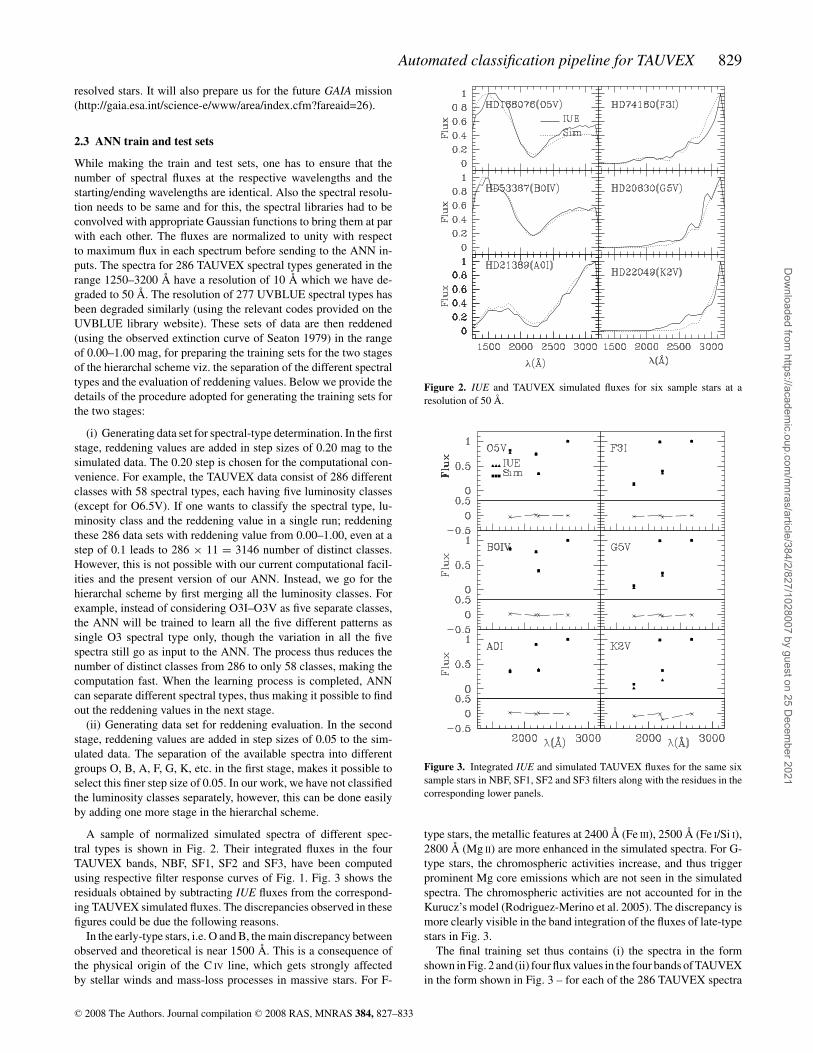
A sample of normalized simulated spectra of different spec-
tral types is shown in Fig. 2. Their integrated fluxes in the four
TAUVEX bands, NBF, SF1, SF2 and SF3, have been computed
using respective filter response curves of Fig. 1. Fig. 3 shows the
residuals obtained by subtracting IUE fluxes from the correspond-
ing TAUVEX simulated fluxes. The discrepancies observed in these
figures could be due the following reasons.
In the early-type stars, i.e. O and B, the main discrepancy between
observed and theoretical is near 1500 Å. This is a consequence of
the physical origin of the C IV line, which gets strongly affected
by stellar winds and mass-loss processes in massive stars. For F-
Figure 2. IUE and TAUVEX simulated fluxes for six sample stars at a
resolution of 50 Å.
Figure 3. Integrated IUE and simulated TAUVEX fluxes for the same six
sample stars in NBF, SF1, SF2 and SF3 filters along with the residues in the
corresponding lower panels.
type stars, the metallic features at 2400 Å (Fe III), 2500 Å (Fe I/Si I),
2800 Å (Mg II) are more enhanced in the simulated spectra. For G-
type stars, the chromospheric activities increase, and thus trigger
prominent Mg core emissions which are not seen in the simulated
spectra. The chromospheric activities are not accounted for in the
Kurucz’s model (Rodriguez-Merino et al. 2005). The discrepancy is
more clearly visible in the band integration of the fluxes of late-type
stars in Fig. 3.
The final training set thus contains (i) the spectra in the form
shown in Fig. 2 and (ii) four flux values in the four bands of TAUVEX
in the form shown in Fig. 3 – for each of the 286 TAUVEX spectra
C© 2008 The Authors. Journal compilation C© 2008 RAS, MNRAS 384, 827–833
Dow
nloaded from https://academ
ic.oup.com/m
nras/article/384/2/827/1028007 by guest on 25 Decem
ber 2021
830 A. Bora et al.
TAUVEX/UVBLUESimulated Spectra(1250-3200Å)
Resolution degraded to 50 Å and in 50 Å Bins
Reddening the Spectra using SEATON’S Law
Flux Integration in TAUVEX Bands1D Data with fluxes
1D Data with Count Rate
Peak Normalization of Fluxes
Peak Normalization of Count Rate
Training Set for ANN Training Set for ANN (BANDS) (FLUXES)
Training ANN
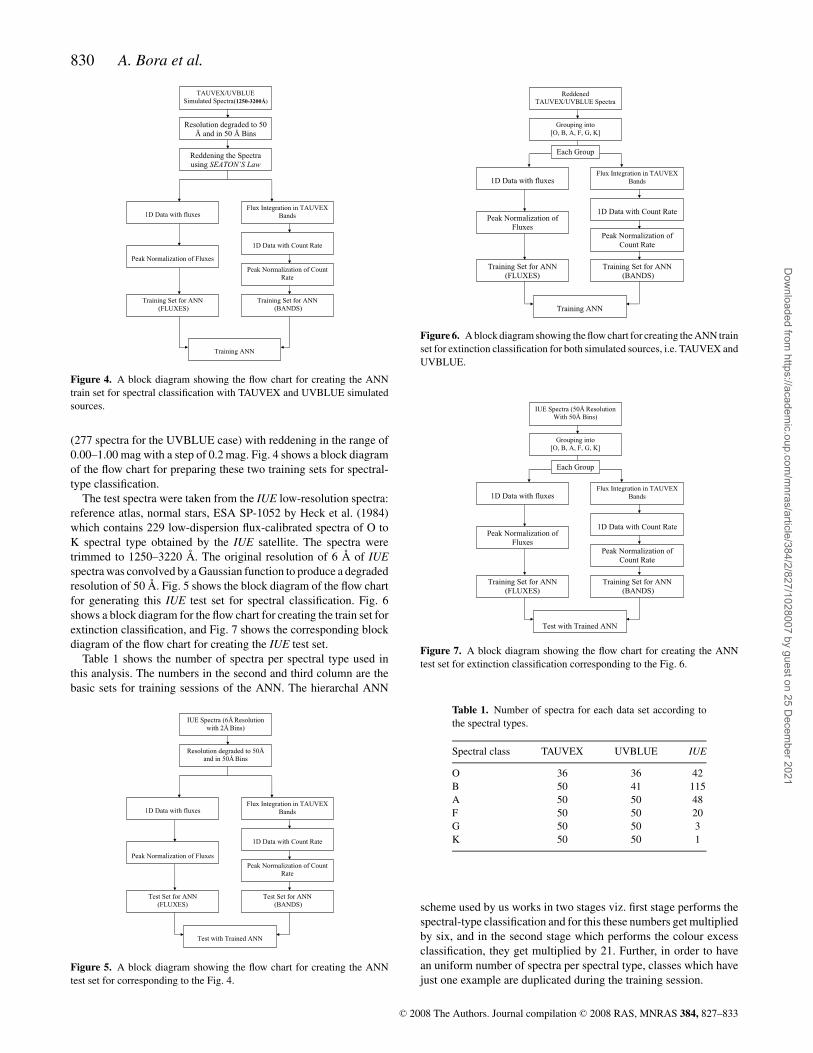
Figure 4. A block diagram showing the flow chart for creating the ANN
train set for spectral classification with TAUVEX and UVBLUE simulated
sources.
(277 spectra for the UVBLUE case) with reddening in the range of
0.00–1.00 mag with a step of 0.2 mag. Fig. 4 shows a block diagram
of the flow chart for preparing these two training sets for spectral-
type classification.
The test spectra were taken from the IUE low-resolution spectra:
reference atlas, normal stars, ESA SP-1052 by Heck et al. (1984)
which contains 229 low-dispersion flux-calibrated spectra of O to
K spectral type obtained by the IUE satellite. The spectra were
trimmed to 1250–3220 Å. The original resolution of 6 Å of IUEspectra was convolved by a Gaussian function to produce a degraded
resolution of 50 Å. Fig. 5 shows the block diagram of the flow chart
for generating this IUE test set for spectral classification. Fig. 6
shows a block diagram for the flow chart for creating the train set for
extinction classification, and Fig. 7 shows the corresponding block
diagram of the flow chart for creating the IUE test set.
Table 1 shows the number of spectra per spectral type used in
this analysis. The numbers in the second and third column are the
basic sets for training sessions of the ANN. The hierarchal ANN
IUE Spectra (6Å Resolutionwith 2Å Bins)
Resolution degraded to 50Åand in 50Å Bins
Flux Integration in TAUVEX Bands1D Data with fluxes
1D Data with Count Rate
Peak Normalization of Fluxes
Peak Normalization of Count Rate
Test Set for ANN Test Set for ANN (FLUXES) (BANDS)
Test with Trained ANN
Figure 5. A block diagram showing the flow chart for creating the ANN
test set for corresponding to the Fig. 4.
ReddenedTAUVEX/UVBLUE Spectra
Grouping into[O, B, A, F, G, K]
Each Group
Flux Integration in TAUVEX Bands1D Data with fluxes
1D Data with Count Rate Peak Normalization of
FluxesPeak Normalization of
Count Rate
Training Set for ANN Training Set for ANN (FLUXES) (BANDS)
Training ANN
Figure 6. A block diagram showing the flow chart for creating the ANN train
set for extinction classification for both simulated sources, i.e. TAUVEX and
UVBLUE.
IUE Spectra (50Å ResolutionWith 50Å Bins)
Grouping into[O, B, A, F, G, K]
Each Group
Flux Integration in TAUVEX Bands1D Data with fluxes
1D Data with Count Rate Peak Normalization of
FluxesPeak Normalization of
Count Rate
Training Set for ANN Training Set for ANN (FLUXES) (BANDS)
Test with Trained ANN
Figure 7. A block diagram showing the flow chart for creating the ANN
test set for extinction classification corresponding to the Fig. 6.
Table 1. Number of spectra for each data set according to
the spectral types.
Spectral class TAUVEX UVBLUE IUE
O 36 36 42
B 50 41 115
A 50 50 48
F 50 50 20
G 50 50 3
K 50 50 1
scheme used by us works in two stages viz. first stage performs the
spectral-type classification and for this these numbers get multiplied
by six, and in the second stage which performs the colour excess
classification, they get multiplied by 21. Further, in order to have
an uniform number of spectra per spectral type, classes which have
just one example are duplicated during the training session.
C© 2008 The Authors. Journal compilation C© 2008 RAS, MNRAS 384, 827–833
Dow
nloaded from https://academ
ic.oup.com/m
nras/article/384/2/827/1028007 by guest on 25 Decem
ber 2021
Automated classification pipeline for TAUVEX 831
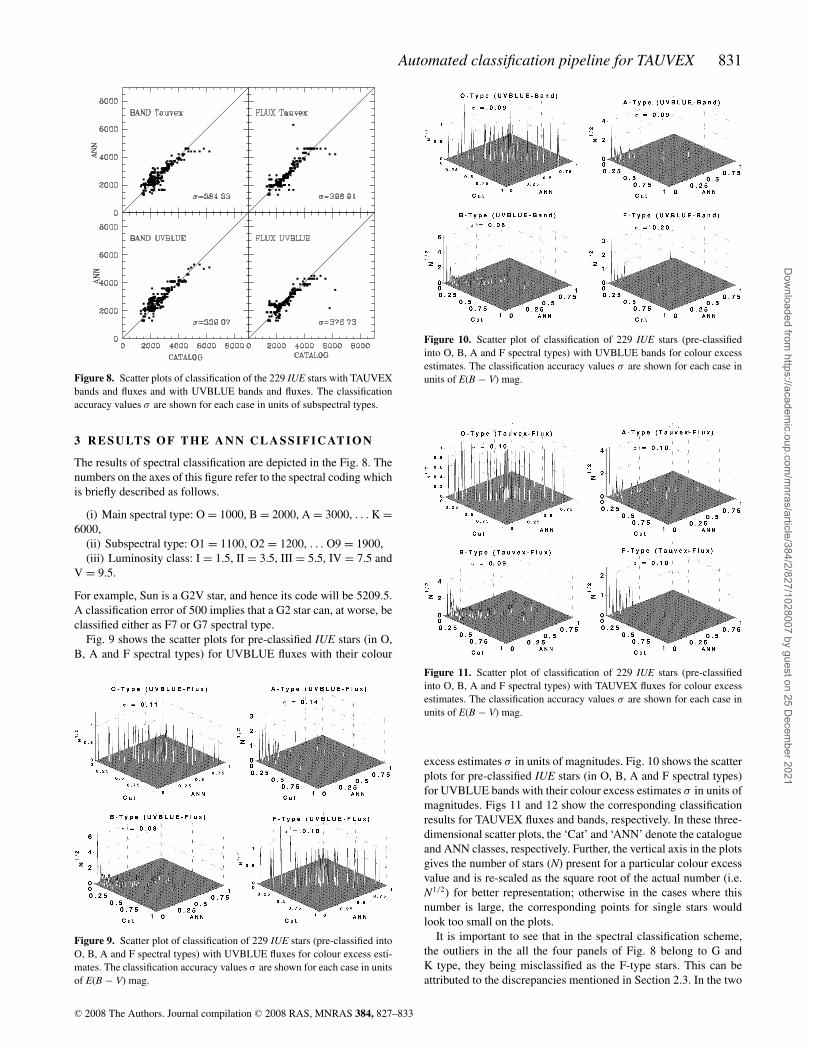
Figure 8. Scatter plots of classification of the 229 IUE stars with TAUVEX
bands and fluxes and with UVBLUE bands and fluxes. The classification
accuracy values σ are shown for each case in units of subspectral types.
3 R E S U LT S O F T H E A N N C L A S S I F I C AT I O N
The results of spectral classification are depicted in the Fig. 8. The
numbers on the axes of this figure refer to the spectral coding which
is briefly described as follows.
(i) Main spectral type: O = 1000, B = 2000, A = 3000, . . . K =6000,
(ii) Subspectral type: O1 = 1100, O2 = 1200, . . . O9 = 1900,
(iii) Luminosity class: I = 1.5, II = 3.5, III = 5.5, IV = 7.5 and
V = 9.5.
For example, Sun is a G2V star, and hence its code will be 5209.5.
A classification error of 500 implies that a G2 star can, at worse, be
classified either as F7 or G7 spectral type.
Fig. 9 shows the scatter plots for pre-classified IUE stars (in O,
B, A and F spectral types) for UVBLUE fluxes with their colour
Figure 9. Scatter plot of classification of 229 IUE stars (pre-classified into
O, B, A and F spectral types) with UVBLUE fluxes for colour excess esti-
mates. The classification accuracy values σ are shown for each case in units
of E(B − V) mag.
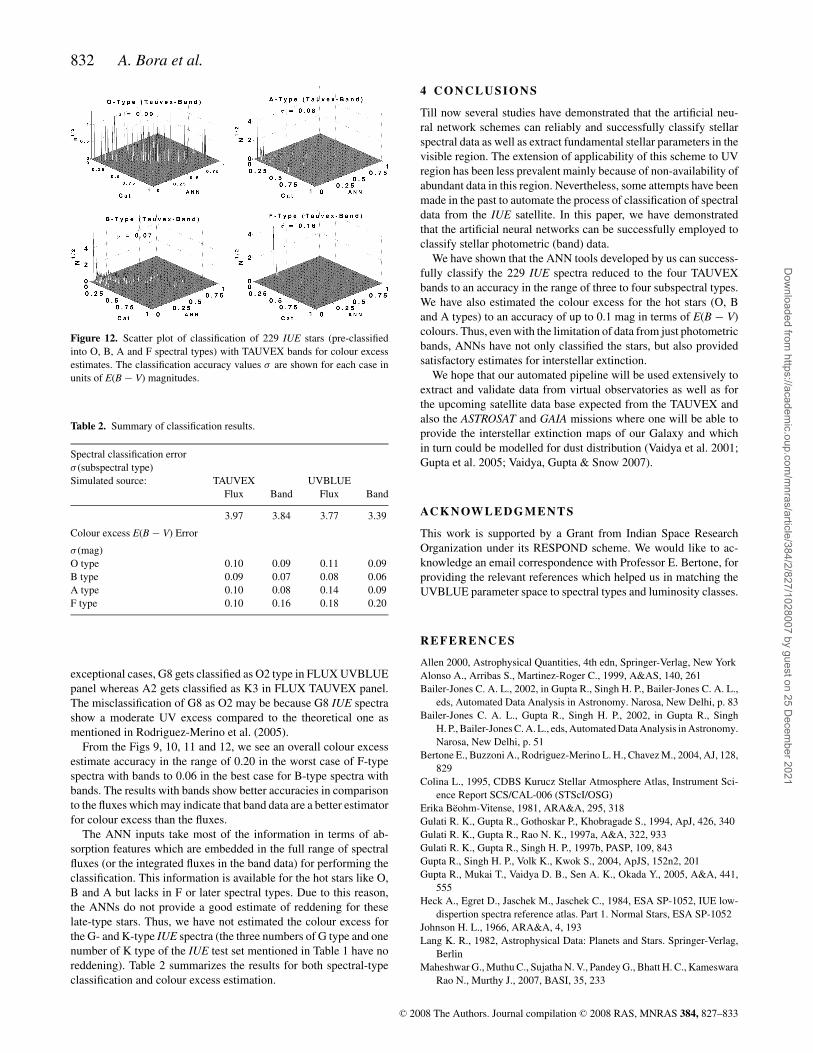
Figure 10. Scatter plot of classification of 229 IUE stars (pre-classified
into O, B, A and F spectral types) with UVBLUE bands for colour excess
estimates. The classification accuracy values σ are shown for each case in
units of E(B − V) mag.
Figure 11. Scatter plot of classification of 229 IUE stars (pre-classified
into O, B, A and F spectral types) with TAUVEX fluxes for colour excess
estimates. The classification accuracy values σ are shown for each case in
units of E(B − V) mag.
excess estimates σ in units of magnitudes. Fig. 10 shows the scatter
plots for pre-classified IUE stars (in O, B, A and F spectral types)
for UVBLUE bands with their colour excess estimates σ in units of
magnitudes. Figs 11 and 12 show the corresponding classification
results for TAUVEX fluxes and bands, respectively. In these three-
dimensional scatter plots, the ‘Cat’ and ‘ANN’ denote the catalogue
and ANN classes, respectively. Further, the vertical axis in the plots
gives the number of stars (N) present for a particular colour excess
value and is re-scaled as the square root of the actual number (i.e.
N1/2) for better representation; otherwise in the cases where this
number is large, the corresponding points for single stars would
look too small on the plots.
It is important to see that in the spectral classification scheme,
the outliers in the all the four panels of Fig. 8 belong to G and
K type, they being misclassified as the F-type stars. This can be
attributed to the discrepancies mentioned in Section 2.3. In the two
C© 2008 The Authors. Journal compilation C© 2008 RAS, MNRAS 384, 827–833
Dow
nloaded from https://academ
ic.oup.com/m
nras/article/384/2/827/1028007 by guest on 25 Decem
ber 2021
832 A. Bora et al.
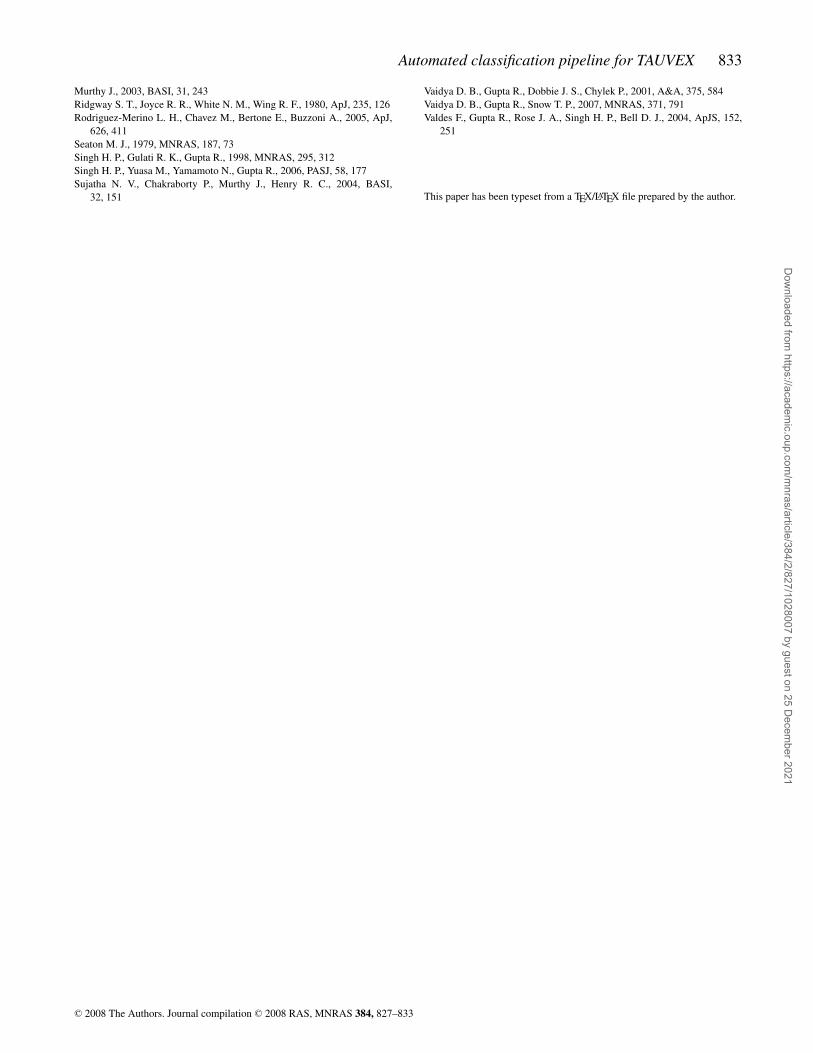
Figure 12. Scatter plot of classification of 229 IUE stars (pre-classified
into O, B, A and F spectral types) with TAUVEX bands for colour excess
estimates. The classification accuracy values σ are shown for each case in
units of E(B − V) magnitudes.
Table 2. Summary of classification results.
Spectral classification error
σ (subspectral type)
Simulated source: TAUVEX UVBLUE
Flux Band Flux Band
3.97 3.84 3.77 3.39
Colour excess E(B − V) Error
σ (mag)
O type 0.10 0.09 0.11 0.09
B type 0.09 0.07 0.08 0.06
A type 0.10 0.08 0.14 0.09
F type 0.10 0.16 0.18 0.20
exceptional cases, G8 gets classified as O2 type in FLUX UVBLUE
panel whereas A2 gets classified as K3 in FLUX TAUVEX panel.
The misclassification of G8 as O2 may be because G8 IUE spectra
show a moderate UV excess compared to the theoretical one as
mentioned in Rodriguez-Merino et al. (2005).
From the Figs 9, 10, 11 and 12, we see an overall colour excess
estimate accuracy in the range of 0.20 in the worst case of F-type
spectra with bands to 0.06 in the best case for B-type spectra with
bands. The results with bands show better accuracies in comparison
to the fluxes which may indicate that band data are a better estimator
for colour excess than the fluxes.
The ANN inputs take most of the information in terms of ab-
sorption features which are embedded in the full range of spectral
fluxes (or the integrated fluxes in the band data) for performing the
classification. This information is available for the hot stars like O,
B and A but lacks in F or later spectral types. Due to this reason,
the ANNs do not provide a good estimate of reddening for these
late-type stars. Thus, we have not estimated the colour excess for
the G- and K-type IUE spectra (the three numbers of G type and one
number of K type of the IUE test set mentioned in Table 1 have no
reddening). Table 2 summarizes the results for both spectral-type
classification and colour excess estimation.
4 C O N C L U S I O N S
Till now several studies have demonstrated that the artificial neu-
ral network schemes can reliably and successfully classify stellar
spectral data as well as extract fundamental stellar parameters in the
visible region. The extension of applicability of this scheme to UV
region has been less prevalent mainly because of non-availability of
abundant data in this region. Nevertheless, some attempts have been
made in the past to automate the process of classification of spectral
data from the IUE satellite. In this paper, we have demonstrated
that the artificial neural networks can be successfully employed to
classify stellar photometric (band) data.
We have shown that the ANN tools developed by us can success-
fully classify the 229 IUE spectra reduced to the four TAUVEX
bands to an accuracy in the range of three to four subspectral types.
We have also estimated the colour excess for the hot stars (O, B
and A types) to an accuracy of up to 0.1 mag in terms of E(B − V)
colours. Thus, even with the limitation of data from just photometric
bands, ANNs have not only classified the stars, but also provided
satisfactory estimates for interstellar extinction.
We hope that our automated pipeline will be used extensively to
extract and validate data from virtual observatories as well as for
the upcoming satellite data base expected from the TAUVEX and
also the ASTROSAT and GAIA missions where one will be able to
provide the interstellar extinction maps of our Galaxy and which
in turn could be modelled for dust distribution (Vaidya et al. 2001;
Gupta et al. 2005; Vaidya, Gupta & Snow 2007).
AC K N OW L E D G M E N T S
This work is supported by a Grant from Indian Space Research
Organization under its RESPOND scheme. We would like to ac-
knowledge an email correspondence with Professor E. Bertone, for
providing the relevant references which helped us in matching the
UVBLUE parameter space to spectral types and luminosity classes.
R E F E R E N C E S
Allen 2000, Astrophysical Quantities, 4th edn, Springer-Verlag, New York
Alonso A., Arribas S., Martinez-Roger C., 1999, A&AS, 140, 261
Bailer-Jones C. A. L., 2002, in Gupta R., Singh H. P., Bailer-Jones C. A. L.,
eds, Automated Data Analysis in Astronomy. Narosa, New Delhi, p. 83
Bailer-Jones C. A. L., Gupta R., Singh H. P., 2002, in Gupta R., Singh
H. P., Bailer-Jones C. A. L., eds, Automated Data Analysis in Astronomy.
Narosa, New Delhi, p. 51
Bertone E., Buzzoni A., Rodriguez-Merino L. H., Chavez M., 2004, AJ, 128,
829
Colina L., 1995, CDBS Kurucz Stellar Atmosphere Atlas, Instrument Sci-
ence Report SCS/CAL-006 (STScI/OSG)
Erika Beohm-Vitense, 1981, ARA&A, 295, 318
Gulati R. K., Gupta R., Gothoskar P., Khobragade S., 1994, ApJ, 426, 340
Gulati R. K., Gupta R., Rao N. K., 1997a, A&A, 322, 933
Gulati R. K., Gupta R., Singh H. P., 1997b, PASP, 109, 843
Gupta R., Singh H. P., Volk K., Kwok S., 2004, ApJS, 152n2, 201
Gupta R., Mukai T., Vaidya D. B., Sen A. K., Okada Y., 2005, A&A, 441,
555
Heck A., Egret D., Jaschek M., Jaschek C., 1984, ESA SP-1052, IUE low-
dispertion spectra reference atlas. Part 1. Normal Stars, ESA SP-1052
Johnson H. L., 1966, ARA&A, 4, 193
Lang K. R., 1982, Astrophysical Data: Planets and Stars. Springer-Verlag,
Berlin
Maheshwar G., Muthu C., Sujatha N. V., Pandey G., Bhatt H. C., Kameswara
Rao N., Murthy J., 2007, BASI, 35, 233
C© 2008 The Authors. Journal compilation C© 2008 RAS, MNRAS 384, 827–833
Dow
nloaded from https://academ
ic.oup.com/m
nras/article/384/2/827/1028007 by guest on 25 Decem
ber 2021
Automated classification pipeline for TAUVEX 833
Murthy J., 2003, BASI, 31, 243
Ridgway S. T., Joyce R. R., White N. M., Wing R. F., 1980, ApJ, 235, 126
Rodriguez-Merino L. H., Chavez M., Bertone E., Buzzoni A., 2005, ApJ,
626, 411
Seaton M. J., 1979, MNRAS, 187, 73
Singh H. P., Gulati R. K., Gupta R., 1998, MNRAS, 295, 312
Singh H. P., Yuasa M., Yamamoto N., Gupta R., 2006, PASJ, 58, 177
Sujatha N. V., Chakraborty P., Murthy J., Henry R. C., 2004, BASI,
32, 151
Vaidya D. B., Gupta R., Dobbie J. S., Chylek P., 2001, A&A, 375, 584
Vaidya D. B., Gupta R., Snow T. P., 2007, MNRAS, 371, 791
Valdes F., Gupta R., Rose J. A., Singh H. P., Bell D. J., 2004, ApJS, 152,
251
This paper has been typeset from a TEX/LATEX file prepared by the author.
C© 2008 The Authors. Journal compilation C© 2008 RAS, MNRAS 384, 827–833
Dow
nloaded from https://academ
ic.oup.com/m
nras/article/384/2/827/1028007 by guest on 25 Decem
ber 2021