mnras ,1– atex style file v3 - arxiv.org · mnras 000,1–?? (2016) preprint 2 february 2017...
TRANSCRIPT

MNRAS 000, 1–?? (2016) Preprint 2 February 2017 Compiled using MNRAS LATEX style file v3.0
Catching a Grown-Up Starfish Planetary Nebula: I.Morpho-Kinematical study of PC 22
L. Sabin1?, M.A. Gómez-Muñoz1, M.A. Guerrero2, S. Zavala3,4, G. Ramos-Larios5,R. Vázquez1, L. Corral5, M.W. Blanco Cárdenas1, P.F. Guillén1, L. Olguín6, C. Morisset7,S. Navarro51Instituto de Astronomía, Universidad Nacional Autónoma de México, Apdo. Postal 877, 22800 Ensenada, B.C., Mexico2Instituto de Astrofísica de Andalucía, IAA-CSIC, C/ Glorieta de la Astronomía s/n, 18008 Granada, Spain3Instituto Tecnológico de Ensenada, Blvd Tecnológico No. 150, 22780 Ensenada, B. C., Mexico4Instituto de Estudios Avanzados de Baja California, A. C., Blvd Tte. Azueta 147, Edif. Matematiké Planta Baja, 22800 Ensenada, B. C., Mexico5Instituto de Astronomía y Meteorología, Av. Vallarta No. 2602, Col. Arcos Vallarta, C.P. 44130 Guadalajara, Jalisco, Mexico6Dpto. de Investigación en Física, Universidad de Sonora, Blvd. Rosales-Colosio, Ed. 3H, 83190, Hermosillo, Sonora, Mexico7Instituto de Astronomía, Universidad Nacional Autónoma de México, Apdo. Postal 70264, Mexico D. F. 04510, Mexico
Last updated 2016 xx xx; in original form 2016 xx xx
ABSTRACT
We present the first part of an investigation on the planetary nebula (PN) PC 22 whichfocuses on the use of deep imaging and high resolution echelle spectroscopy to perform adetailed morpho-kinematical analysis. PC 22 is revealed to be a multipolar PN emitting pre-dominantly in [O III] and displaying multiple non-symmetric outflows. Its central region isfound to be also particularly inhomogeneous with a series of low ionization structures (knots)located on the path of the outflows. The morpho-kinematical model obtained with SHAPE in-dicates that i) the de-projected velocities of the outflows are rather large, >100 km s−1, whilethe central region has expansion velocities in the range ∼25 to ∼45 km s−1 following the“Wilson effect”, ii) the majority of the measured structures share similar inclination, '100◦,i.e. they are coplanar, and iii) all outflows and lobes are coeval (within the uncertainties).All these results make us to suggest that PC 22 is an evolved starfish PN. We propose thatthe mechanism responsible for the morphology of PC 22 consists of a wind-shell interaction,where the fast post-AGB wind flows through a filamentary AGB shell with some large voids.
Key words: (ISM:) planetary nebulae: individual: PC 22 — ISM: jets and outflows — ISM:kinematics and dynamics
1 INTRODUCTION
Planetary Nebulae (PNe) are well known for displaying differentdegrees of morphological complexity probing their, often intense,internal dynamical activity (see the imaging catalogues by, Parkeret al. 2006, 2016; Sahai et al. 2011 and Sabin et al. 2014). Hence,the presence of outflows, jets, rings or knots each indicate particularphysical processes whose origins are not always well constrained.By establishing with accuracy the morpho-kinematics and chem-ical characteristics of PNe, one can expect to better understandtheir formation history. Such multi-approach analyses have beenperformed to study in great detail various PNe such as NGC 3132(Monteiro et al. 2000), IPHASX J194359.5+170901 (Corradi et al.2011), K 4-55 and Kn 26 (Guerrero et al. 1996, 2013, respectively),M 2-48 (López-Martín et al. 2002), ETHOS 1 (Miszalski et al.
? E-mail:[email protected] (LS)
2011), and NGC 6309 (Vázquez et al. 2008). With this aim inmind, we present in this article a detailed investigation of a pe-culiar PN, PC 22 (PN G051.0−04.5) located at α2000=19:42:03.50,δ2000=+13:50:37.33.
Discovered by Apriamashvili (1959) and later catalogued byPeimbert & Costero (1961), this object, has not been subject of anyextensive targeted study so far. Manchado et al. (1996) classifiedPC 22 as an elliptical planetary nebula with “internal structures”(no description of these were made). Although no binary systemhas been detected, Soker (1997) predicted a high probability forthe progenitor to have gone through a common envelope with asub-stellar companion based on this morphology. Except for pho-tometric measurements realized at various wavelengths we foundno other relevant piece of information about the PN.
The distance to PC 22 seems to be relatively well constrained.Tajitsu & Tamura (1998) obtained a distance of 5.5 kpc for thisobject by fitting a blackbody to the flux of the four IRAS bands,
c© 2016 The Authors
arX
iv:1
702.
0002
9v1
[as
tro-
ph.S
R]
31
Jan
2017

2 L. Sabin et al.
whereas Giammanco et al. (2011) estimated a distance of 4.0±0.5kpc based on the distance-extinction method built with the firstIPHAS data release1 . More recently Frew et al. (2016), us-ing a new Hα surface brightness-radius relation, derived a meandistance of 5.27±1.52 kpc adopting log(S(Hα))= –2.77±0.10erg cm−2 s−1 sr−1.
In this paper we present new deep morpho-kinematical ob-servations which reveal a wealth of information on PC 22 and as-sert its physical structure. The article is organized as the follow-ing: the observations are described in §2; the results obtained fromeach observing technique are described in §3 and this includes ourproposed kinematical model. Finally we conclude our investiga-tion presenting the main findings in §4 followed by the discussionand concluding remarks in §5. This is the first paper on a serieswhich focuses on the morpho-kinematical analysis of PC 22. Wewill present a comprehensive chemical analysis in a forthcomingpaper (Sabin et al. in preparation).
2 OBSERVATIONS
2.1 ALFOSC optical imaging
Direct narrow-band images of PC 22 were obtained on 2009September 4 using the Alhambra Faint Object Spectrograph andCamera (ALFOSC) at the 2.5m Nordic Optical Telescope (NOT)at the Roque de los Muchachos Observatory (ORM, La Palma,Spain). The detector was a 2048×2048 EEV CCD (13.5 µmpixel size) with a plate scale of 0.′′184 pix−1 providing a fieldof view of 6.′3×6.′3. The Hα (λc = 6567 Å, FWHM = 8 Å),[N II] (λc = 6588 Å, FWHM = 9 Å), and [O III] (λc = 5007 Å,FWHM = 30 Å) filters were used to acquire two 900 s images ineach filter. The images were processed using standard IRAF rou-tines. A mean spatial resolution of 0.′′6 was achieved, as determinedfrom the FWHM of stars in the field.
2.2 MES long-slit high resolution optical spectroscopy
Long-slit high dispersion optical spectra of PC 22 were acquiredwith the Manchester Echelle Spectrograph (MES, Meaburn et al.2003) mounted on the 2.12m telescope at the Observatorio As-tronómico Nacional, San Pedro Mártir (OAN-SPM, Mexico). Afirst set of data was obtained on 2015 August 14-16. At this time, a2048×2048 pixels E2V CCD with a pixel size of 13.5 µm pixel−1
was used as detector. The fixed slit length is 6.′5 and we set theslit width to 150 µm (1.′′9). We used 2×2 and 4×4 binnings lead-ing to spatial scales of 0.′′351 pixel−1 and 0.′′702 pixel−1, respec-tively. The different spectra were taken with exposures of 1200 sand 1800 s through two filters: an Hα filter with ∆λ = 90 Å to iso-late the 87th order (0.05 and 0.1 Å pixel−1 spectral scale for the2×2 binning and 4×4 binning, respectively) and an [O III]5007 Åfilter with ∆λ = 50 Å to isolate the 114th order (0.043 and 0.086Å pixel−1 spectral scale for the 2×2 binning and 4×4 binning, re-spectively). We mostly used the latter filter based on the dominant[O III] emission in the PN (as seen in the images, see below). Ad-ditional spectra were taken on 2016 February 25 using the samesettings.
All the spectra were bias and flat corrected, and wavelengthcalibrated using standard IRAF routines for long-slit spectroscopy.
1 Since then a new photometric calibration has been performed by Bar-entsen et al. (2014).
The wavelength-calibration was performed with a ThAr arc lampto an accuracy of ±1km s−1. The FWHM of the arc lamp emissionlines, '12±1km s−1, provides an estimate of the spectral resolu-tion.
2.3 ESPRESSO multi-order optical echelle spectroscopy
Multi-order echelle spectroscopic observations were performed on2014 May 29 using ESPRESSO, an Echelle spectrograph mountedon the 2.12m telescope at the OAN-SPM (Mexico). The E2V CCDdetector described above was used. The wavelength range coveredwas 3900–7290 Å distributed through 27 orders with a spectralscale ∼0.1 Å pixel−1 at 5000 Å. The slit was positioned at an an-gle of 47◦ passing through the central star. No binning was appliedand the exposure time was set to 1800 s. The data reduction, whichincludes bias removal and flat fielding correction, was performedwith MIDAS (Grosbol 1989). Two-dimensional spectra of each or-der was then extracted and wavelength calibrated with a ThAr arclamp using IRAF routines. We note the absolute wavelength cali-bration of the spectral orders covering the [O III] λ5007 and [Ar V]λ7006 emission lines was not optimal. No flux calibration was per-formed. Each order was then analyzed separately and no attempt tobring them together was made.
3 RESULTS
3.1 Morphology
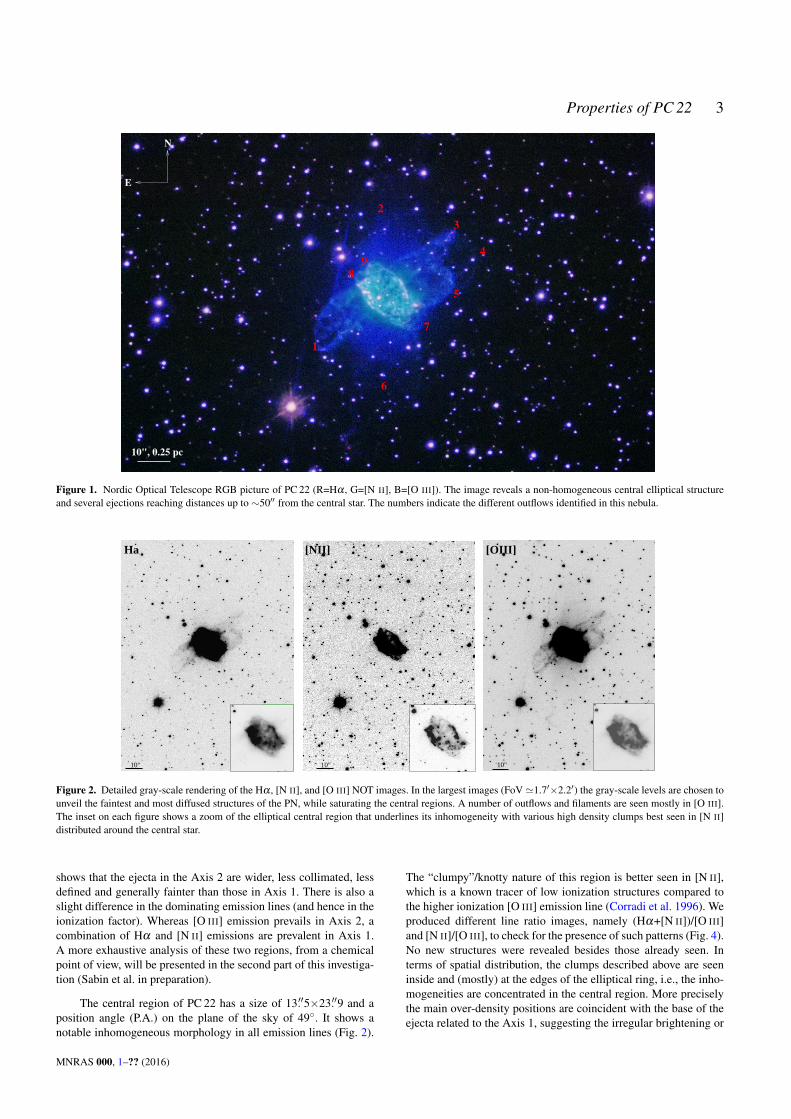
Our deep and high resolution Hα , [N II] and [O III] images of PC 22unveil a detailed picture of a complex multipolar morphology. The“elliptical” structure once believed to form the whole nebula is ac-tually the central part of a PN with multiple outflows (Fig. 1). Weidentified six large lobes or outflows (numbered 1-6 in Fig. 1) andthree secondary lobes or outflows closer to the central elliptical re-gion (numbered 7-9 in Fig. 1). The [O III] 5007Å nebular emissionis significantly bright and shows an extension of ∼1.′5×0.′9 includ-ing the tip of the faintest components presented in Fig. 2 and Fig. 3.The high level of [O III] 5007Å emission is somewhat peculiar as itextends up to the outermost regions of the PN and is not confinedto the inner parts of the nebula as one would expect (i.e. there isno stratification in the emission lines distribution). Such behavior,however, is not unique and it has been noted in other PNe such asNGC 6309 (Rubio et al. 2015) and NGC 6905 (Cuesta et al. 1993).
The faint aforementioned structures are under the form of fila-ments (in the south for example) and weak outflows which are bestseen in the contrast-enhanced image shown in Fig. 3. Three arc-likepatterns, labelled “A, B and C” can be associated to the tips of threedifferent outflows detailed below.
The Hα and [O III] images indicate a bright and slightly col-limated group of ejecta along the SE-NW direction (hereafter Axis1), with the NW outflow appearing to be “broken” by the emer-gence of a new one whose much dimer rim is mostly seen in [O III](Fig. 3– label “C”). This effect is not symmetric, i.e. the struc-ture “C” does not have a clear counterpart in the SE outflow. Inthe N-S direction (hereafter Axis 2), the presence of a bright in-ner section immediately followed by a much fainter one at largerdistances (seen in [O III]) could indicate the occurrence of two dif-ferent outflows running approximately along the same direction.The presence of these new structures is supported by the arc-likepatterns “A” and “B” observed in Fig. 3. Once again, there is nota clear, symmetric counterpart to the northern outflows. Fig. 3 also
MNRAS 000, 1–?? (2016)
Properties of PC 22 3
E
N
10", 0.25 pc
1
3
4
5
9
8
7
6
2
Figure 1. Nordic Optical Telescope RGB picture of PC 22 (R=Hα , G=[N II], B=[O III]). The image reveals a non-homogeneous central elliptical structureand several ejections reaching distances up to ∼50′′ from the central star. The numbers indicate the different outflows identified in this nebula.
10" 10"10"
[OIII][NII]Ha
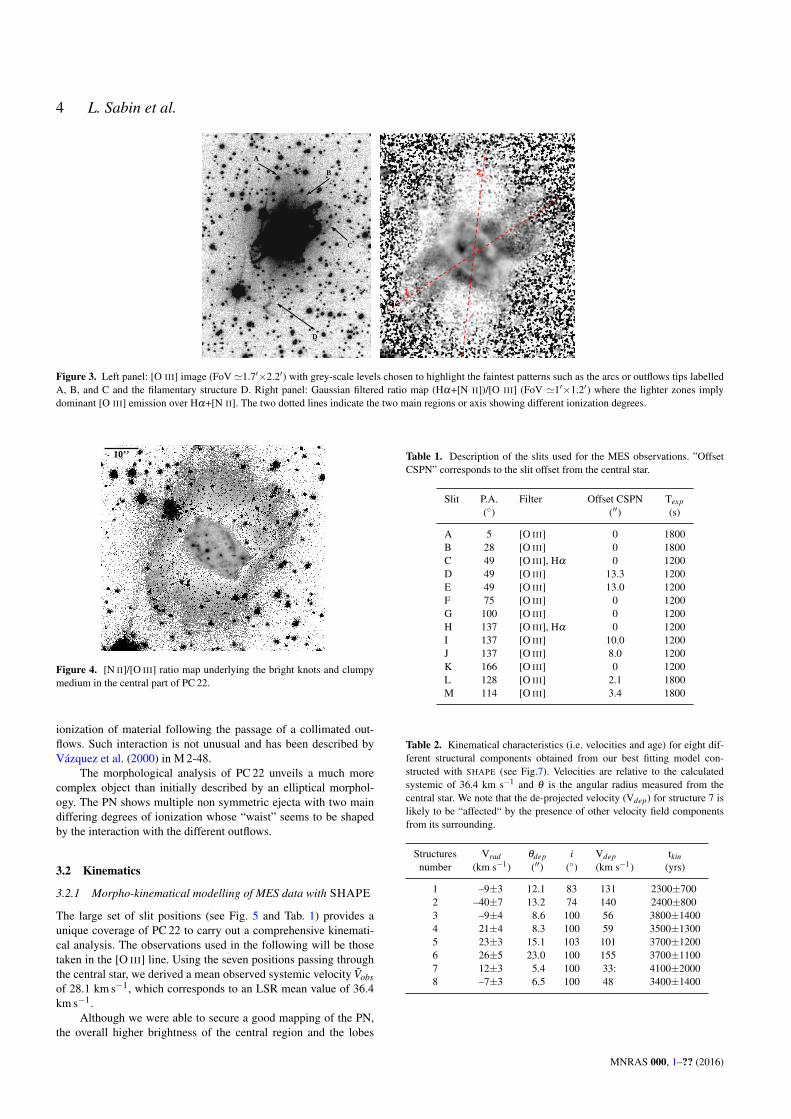
Figure 2. Detailed gray-scale rendering of the Hα , [N II], and [O III] NOT images. In the largest images (FoV'1.7′×2.2′) the gray-scale levels are chosen tounveil the faintest and most diffused structures of the PN, while saturating the central regions. A number of outflows and filaments are seen mostly in [O III].The inset on each figure shows a zoom of the elliptical central region that underlines its inhomogeneity with various high density clumps best seen in [N II]distributed around the central star.
shows that the ejecta in the Axis 2 are wider, less collimated, lessdefined and generally fainter than those in Axis 1. There is also aslight difference in the dominating emission lines (and hence in theionization factor). Whereas [O III] emission prevails in Axis 2, acombination of Hα and [N II] emissions are prevalent in Axis 1.A more exhaustive analysis of these two regions, from a chemicalpoint of view, will be presented in the second part of this investiga-tion (Sabin et al. in preparation).
The central region of PC 22 has a size of 13.′′5×23.′′9 and aposition angle (P.A.) on the plane of the sky of 49◦. It shows anotable inhomogeneous morphology in all emission lines (Fig. 2).
The “clumpy”/knotty nature of this region is better seen in [N II],which is a known tracer of low ionization structures compared tothe higher ionization [O III] emission line (Corradi et al. 1996). Weproduced different line ratio images, namely (Hα+[N II])/[O III]and [N II]/[O III], to check for the presence of such patterns (Fig. 4).No new structures were revealed besides those already seen. Interms of spatial distribution, the clumps described above are seeninside and (mostly) at the edges of the elliptical ring, i.e., the inho-mogeneities are concentrated in the central region. More preciselythe main over-density positions are coincident with the base of theejecta related to the Axis 1, suggesting the irregular brightening or
MNRAS 000, 1–?? (2016)
4 L. Sabin et al.
B
C
D
A
2
1
Figure 3. Left panel: [O III] image (FoV '1.7′×2.2′) with grey-scale levels chosen to highlight the faintest patterns such as the arcs or outflows tips labelledA, B, and C and the filamentary structure D. Right panel: Gaussian filtered ratio map (Hα+[N II])/[O III] (FoV '1′×1.2′) where the lighter zones implydominant [O III] emission over Hα+[N II]. The two dotted lines indicate the two main regions or axis showing different ionization degrees.
0 0.0099 0.03 0.069 0.15 0.31 0.62 1.2 2.5 5 10
10’’
Figure 4. [N II]/[O III] ratio map underlying the bright knots and clumpymedium in the central part of PC 22.
ionization of material following the passage of a collimated out-flows. Such interaction is not unusual and has been described byVázquez et al. (2000) in M 2-48.
The morphological analysis of PC 22 unveils a much morecomplex object than initially described by an elliptical morphol-ogy. The PN shows multiple non symmetric ejecta with two maindiffering degrees of ionization whose “waist” seems to be shapedby the interaction with the different outflows.
3.2 Kinematics
3.2.1 Morpho-kinematical modelling of MES data with SHAPE
The large set of slit positions (see Fig. 5 and Tab. 1) provides aunique coverage of PC 22 to carry out a comprehensive kinemati-cal analysis. The observations used in the following will be thosetaken in the [O III] line. Using the seven positions passing throughthe central star, we derived a mean observed systemic velocity Vobsof 28.1 km s−1, which corresponds to an LSR mean value of 36.4km s−1.
Although we were able to secure a good mapping of the PN,the overall higher brightness of the central region and the lobes
Table 1. Description of the slits used for the MES observations. ”OffsetCSPN” corresponds to the slit offset from the central star.
Slit P.A. Filter Offset CSPN Texp(◦) (′′) (s)
A 5 [O III] 0 1800B 28 [O III] 0 1800C 49 [O III], Hα 0 1200D 49 [O III] 13.3 1200E 49 [O III] 13.0 1200F 75 [O III] 0 1200G 100 [O III] 0 1200H 137 [O III], Hα 0 1200I 137 [O III] 10.0 1200J 137 [O III] 8.0 1200K 166 [O III] 0 1200L 128 [O III] 2.1 1800M 114 [O III] 3.4 1800
Table 2. Kinematical characteristics (i.e. velocities and age) for eight dif-ferent structural components obtained from our best fitting model con-structed with SHAPE (see Fig.7). Velocities are relative to the calculatedsystemic of 36.4 km s−1 and θ is the angular radius measured from thecentral star. We note that the de-projected velocity (Vdep) for structure 7 islikely to be “affected“ by the presence of other velocity field componentsfrom its surrounding.
Structures Vrad θdep i Vdep tkinnumber (km s−1) (′′) (◦) (km s−1) (yrs)
1 –9±3 12.1 83 131 2300±7002 –40±7 13.2 74 140 2400±8003 –9±4 8.6 100 56 3800±14004 21±4 8.3 100 59 3500±13005 23±3 15.1 103 101 3700±12006 26±5 23.0 100 155 3700±11007 12±3 5.4 100 33: 4100±20008 –7±3 6.5 100 48 3400±1400
MNRAS 000, 1–?? (2016)

Properties of PC 22 5
E
NA
C
B
F
G
K
H
10"
E
D
M
L
J
I
N
E
10"
Figure 5. Slit positions used for the MES observations superimposed on the optical RGB picture of PC 22. On the left panel we present all those passingthrough the central star (red square) and the remaining are shown on the right panel. The thirteen positions are meant to provide the best coverage of the PNfor the kinematic analysis.
corresponding to the Axis 1 were the only structures to actually ap-pear clearly in the spectra, with the other components being muchfainter. The upper panels of Fig. 6 show the resulting spectra orposition-velocity (PV) maps, passing through the short and longaxis of the main internal structure (PA=49◦: slit C and PA=137◦:slit H, respectively) and the bright lobes in Axis 1 at PA=100◦ cor-responding to the slit G. In all three cases we note the irregularshape of the inner regions which corresponds to the presence ofcompact knots. The remaining observed PV maps are presented inthe appendix A, Fig. A1 and A2.
We subsequently used the morpho-kinematical tool SHAPE
(Steffen et al. 2011) to model all the PV diagrams and obtain acomplete view of the (kinematical and morphological) structure ofPC 22. Due to the inhomogeneous nature of the central part, weconcentrated only on the representation and modelling of the ba-sic velocity patterns corresponding to an equatorial ring and sev-eral bipolar outflows. Therefore, one will observe a difference be-tween the actual (thicker) observed spectra and the narrower syn-thetic ones (see the lower panels of Fig. 6). The non-inclusion ofthe knots/clumps does not hamper the overall kinematical analysis.We should keep in mind that the spectra are not treated indepen-dently i.e. a change in the position/morphology or the velocity ofone spectrum will affect the position/morphology or the velocityof the adjacent one(s). The full set of PV diagrams are shown inFig. 6 and the appendices A1 and A2. The subsequent SHAPE re-construction of the PN is shown in Fig. 7. Table 2 summarizes thedata for the brightest (and best defined) components. In this casewe derived information for the two northern “bumps” (#1,#2), thesouthern small outflow (#5), the four extensions of the internal el-lipsoid (#3,4,7 and 8) and finally one of the western outflows (#6).In all cases the velocities were measured at the tip of the struc-tures. For each we calculated the radial velocities (Vrad) and theirrespective errors, the de-projected angular radii (θdep), the inclina-tions (i), de-projected velocities (Vdep) and kinematical ages (tkin).The errors on i and Vdep were derived empirically solely basedon our model and we estimated a mean error on the inclination of∼5◦ and a mean error on Vdep of ∼3 km s−1. Those are the typi-cal values above which we observed a notable variation in the PVmaps. The inclinations found indicate that most of the structuresare nearly lying in the plane of the sky. The deduced de-projectedvelocities allow us to distinguish two groups: the medium veloci-ties structures, from ∼33 to 59 km s−1 (although we note that the
Figure 6. Top: MES [O III] position-velocity (PV) plots of three of themain slit positions with higher signal-to-noise level, namely slit positionsC, G, and H (see Tab. 1 and Fig. 5, where the C and H slits go across thenebula center along P.A. 49◦ and 137◦, respectively, and slit H is offset formthe central star and goes along P.A. 100◦. The binning factor is 2×2 in allimages. Bottom: SHAPE kinematical modelling of these lines for the modelassumed in the text.
former value is very likely affected by nearby structures), which arerelated to the central region, and the high velocities (jets-like) ones,above ∼100 km s−1 related to the “bumps” and larger outflows.
The kinematical age of these components can be derived using
MNRAS 000, 1–?? (2016)

6 L. Sabin et al.
n
n
n
n
n
n
n
n
6
8
4
5
2
1
3
7
Figure 7. SHAPE reconstruction of PC 22 based on all PV diagrams. Thenumbers indicate the structures of reference for the different kinematicalcalculations (see table 2).
the relationship:
tkin =4744∗d(kpc)∗θ(′′)
Vdep(km/s). (1)
We can clearly see two groups: components #1 and #2, relatedto the northern “bumps” or small outflows, have a mean age of2300±800 yr, whereas the other components have a mean age of3600±1300 yr2.The elliptical region, if interpreted as a ring, has akinematical age of∼4500 yrs. Within the errors, the different com-ponents are coeval, but we notice that the interaction of the out-flows with the circumstellar medium would reduce their expansionvelocity (thus increasing their kinematical age). The kinematicalanalysis completes the morphological one, pointing towards a PNmostly shaped by the interaction of high-velocity non-symmetricwinds, the zone of the interaction being the central region which asa consequence is highly inhomogeneous. Most of the events (e.g.outflows launching) also appear to have occurred at approximatelythe same time in the life of the not so old PC 22. This will give usan important constraint on the evolutionary history of this PN (seesection 5).
3.2.2 ESPRESSO
The inspection of the ESPRESSO echelle spectrum of the centralregion of PC 22 reveals a notable number of emission lines thatpresent blue and red components (Fig. 8). These can be interpretedas the approaching and receding walls of the central structural com-ponent, respectively, and therefore they provide information on itsinternal kinematics. A list of these lines is reported in Table 3. Theradial velocities associated with each line has been determined by
2 Component #7, which suffers from the presence of adjacent knots thatadd velocity components not necessarily related to this part of the shell, hasnot been taken into account in this average.
Table 3. Kinematical analysis based on the different line splits observedin the ESPRESSO Echelle spectra at PA=47◦. The values were derivedthrough a Gaussian fit of the lines. For both the blue- and redshifted lineswe present: the observed velocities (Vobs), the observed data corrected fromLSR (VLSR) and the velocities relative to the systemic (Vrel ). Note that, dueto difficulties in the absolute wavelength calibration of the spectral orderscovering the [O III] and [Ar V] emission lines, only the observed velocitiesare quoted for these lines.
Line ID Blueshifted lines (km/s) Redshifted lines (km/s)Vobs VLSR Vrel Vobs VLSR Vrel
[O III] 5007 -21.9 – – 55.2 – –He II 5411 -30.7 6.6 -29.8 37.7 74.9 38.6He I 5876 -43.8 -6.5 -42.9 31.4 68.7 32.3[S III] 6312 -33.2 4.1 -32.3 38.9 76.2 39.8[N II] 6548 -37.2 0.1 -36.3 40.9 78.3 41.8He II 6560 -34.0 3.3 -33.1 29.3 66.6 30.2Hα 6563 -39.4 -2.1 -38.5 30.2 67.5 31.1[N II] 6583 -44.8 -7.5 -43.9 33.9 71.3 34.9[S II] 6716 -42.1 -4.8 -41.2 42.9 80.3 43.9[S II] 6731 -39.3 -1.9 -38.4 41.6 78.9 42.5[Ar V] 7005 -41.9 – – 12.0 – –[Ar III] 7135 -37.5 -0.2 -36.6 42.8 80.2 43.8
Table 4. Ionization potential vs expansion velocity for the line with clearsplitting seen in PC 22
Ion Line Ionization potential Vexp
(Å) (eV) (km s−1)
[S II] 6716 10.36 42.5[S II] 6731 10.36 40.4Hα 6563 13.59 34.8[N II] 6548 14.53 39.1[N II] 6583 14.53 39.4[S III] 6312 23.34 36.1He I 5876 24.59 37.6[Ar III] 7135 27.63 40.2[O III] 5007 35.12 38.5He II 5411 54.42 34.2He II 6560 54.42 31.6[Ar V] 7006 59.81 26.9
fitting Gaussian curves to each component to derive their wave-lengths. We estimated that the maximum error on the line measure-ment is ∼6 km s−1. Table 3 reports the observed (Vobs), LSR cor-rected (VLSR), and relative (from systemic velocity, Vrel) velocitiesfor both blueshifted and redshifted components. The systemic ve-locity, as derived from the ESPRESSO data, is 36.4 km s−1, whichis consistent with that derived from the MES data.
The expansion velocities are different for different lines. Wenote that there is a trend for the expansion velocity to increase asthe ionization potential of the species increases, as revealed by thelinear fit to the data (Table 4 and Fig. 9). Since species with higherionization potential are closer to the CSPN, it means there is a neg-ative velocity gradient as material is located further away from theCSPN. This is the so-called “Wilson effect” (Wilson 1950), whichdescribes the decrease of the line separation (or expansion velocity)with an increase of the ionization potential in PNe.
MNRAS 000, 1–?? (2016)

Properties of PC 22 7
-2
-1
0
1
2[S II]λ(6716 + 6730)Å
Vexp=41.4 km/s
Hα λ6563Å
Vexp=34.8 km/s
[N II]λ(6548 + 6583)Å
Vexp=39.2 km/s
[S III]λ6312Å
Vexp=36.1 km/s
He I λ5874Å
Vexp=37.6 km/s
-50 0 50
-2
-1
0
1
2[Ar III]λ7135Å
Vexp=40.2 km/s
-50 0 50
[O III]λ5007Å
Vexp=38.5 km/s
-50 0 50Relative Velocity (km/s)
He II λ5411Å
Vexp=34.2 km/s
-50 0 50
He II λ6560Å
Vexp=31.6 km/s
-50 0 50
[Ar V]λ7005Å
Vexp=26.9 km/s
Relative Position (arcse
c)
Figure 8. Position-Velocity (PV) diagrams resulting of the analysis of twelve well defined emission lines from the ESPRESSO echelle spectra of PC 22. Alllines show a split and the corresponding expansion velocities are quoted. The PVs are arranged in terms of increasing potential ionization level so as to visuallyfollow the change in Vexp. We notice that the [S II] and [N II] emission lines have been added to increase the signal-to-noise ratio. As for the He II (6560 Å)line, the dark area on the right hand-side corresponds to the much brighter contiguous Hα line.
0 10 20 30 40 50 60 70Ionization potential (eV)
25
30
35
40
45
Vex
p (k
m s
-1)
Figure 9. Graph render of Table 4 with the red dotted line representing thelinear fit.
4 MAIN FINDINGS
The main results of the morpho-kinematical study of PC 22presented here are the following:
• The PN, principally emitting in [O III], is not elliptical as pre-viously stated, but multipolar with several sets of non-symmetricoutflows showing different degrees of brightness, collimation andionization.• Most (if not all) over-density and low-ionization structures (e.g.,
the [N II] bright) are concentrated in the elliptical central part ofthe nebula and are spatially related to the passage of the aforemen-tioned outflows.• The morpho-kinematical model obtained with SHAPE reveals in-
formation on the different structural components of PC 22. Hence:- The de-projected velocities of the outflows and bumps are ratherlarge (> 100 km s−1) compared to that of the central elliptical re-gion (∼30–60 km s−1).- All the structures share similar inclination around 100◦ (slightlyless for the structures #1 and #2 in Fig.7), i.e., nearly all the ejec-tions can be considered as coplanar and close to the plane of thesky.- The kinematical age calculations are also well consistent for allthe analysed outflows with a mean of 3600±1300 yrs, but for struc-tures #1 and #2, which seem to be slightly “younger" (2300±800yrs). This may indicate either that structural features at the ellipticalcentral region have been accelerated, or that the outflows are beenslowed down (see, for instance, the ejecta in the born-again PNeA 30 and A 78, Fang et al. 2014). This is a tantalizing possibility,but at this moment we conclude that all ejections in PC 22 shouldbe considered to be coeval, owing to the uncertainties on the agecalculation.• The ESPRESSO echelle data obtained for twelve emission lines
presenting blue- and red-shifted components allowed us to derivetheir expansion velocities. This varies from 26.9 to 42.5 km s−1 andtends to abide by the “Wilson effect” as we noted a decrease of theexpansion velocity with an increase of the ionization potential.
5 DISCUSSION AND CONCLUSION
The combination of the morphological and kinematical analysis in-dicates that PC 22 belongs to the category of so-called starfish PNe
MNRAS 000, 1–?? (2016)

8 L. Sabin et al.
at a late evolutionary stage. Starfish nebulae were introduced by Sa-hai (2000) to describe Hen 2-47 and M 1-37, two young PNe inves-tigated during an Hα imaging survey with the Hubble Space Tele-scope. Later, the proto-PN IRAS 19024+0044 (Sahai et al. 2005)was added to this group. All three objects present the same mor-phological characteristics: they show multiple well defined and fast(∼100–200 km s−1) collimated lobes with approximately the samesizes which would indicate that they have emerged at the same timeand an equatorial waist or ring. Our claim that PC 22 is very likelyan evolved version of the aforementioned nebulae holds in the factthat:
(i) The contemporary lobes have a larger extent (∼20–40′′), they arefainter and show less collimation in some cases (see Axis 2). There-fore, the compactness of the young starfish nebulae (with outflowextents less than∼5′′ in all cases) and their sharpness of their lobesare lost.
(ii) PC 22 is a high-excitation PN, with dominant [O III] emission,indicating that the central star is hot and the photoionization veryefficient. This is contrary to the proto-PNe and young PNe starfish,which were selected for the HST observing program HST-P6353based on the (very) low [O III]5007 Å to Hα line ratio, probing their“early” evolutionary stage. PC 22 would therefore join NGC 6058(Guillén et al. 2013) in the very small group of evolved starfishPNe.
This investigation opens a new door in the understanding ofthe history formation and evolution of such objects. The morphol-ogy of PC 22 can be explained by a fast and probably primarily uni-form wind from the Asymptotic Giant Branch (AGB) phase goingthrough irregular and inhomogeneous cavities from the previousdenser AGB shell. Steffen et al. (2013) studied this phenomenonnumerically using SHAPE and an adjustable turbulent noise struc-ture (Perlin noise) to simulate, via hydrodynamical modelling, afilamentary AGB shell (their Figure 3) within which a fast windevolves. By changing the size of the cells or voids of the filamen-tary sheet, they could reproduce different types of starfish nebulae,indeed showing non symmetric patterns. It resulted, that the smallerthe cells, the smaller the resulting outflows and reversely with a lossof collimation (their Figure 4). Steffen et al. (2013) also found thatstarfish nebulae would only occur if the AGB shell and post-AGBwind keep a rather constant density and velocity with respect to theangular distance from the equator.
PC 22 would therefore be at a stage, still early in the ∼104 yrsPN life, where the material dragged by the fast post-AGB wind isgoing through a more evolved (and larger) AGB shell populatedwith predominantly wider, randomly distributed and inhomoge-neous voids. This therefore generates (mostly) large outflows/lobes,although small structures can also be present. The waist often de-scribed in starfish nebulae can therefore be explained as being thecondensation of the nebular material at the base of the voids in thefilamentary shell. We note that in this scenario, there is no need toinvoke a particular launching mechanism or precession as it wouldbe the case in other bipolar or multipolar PNe: the wind-shell inter-action, owing the evolving filamentary nature of the latter, seems towork appropriately.
ACKNOWLEDGMENTS
We would like to thank the reviewer for her/his thorough review andappreciate the comments and suggestions made. LS acknowledgessupport from PAPIIT grant IA-101316 (Mexico). GR-L acknowl-
edges support from CONACYT, CGCI, PRODEP and SEP (Mex-ico). MAG acknowledges support of the grant AYA 2014-57280-P,co-funded with FEDER funds. SZ acknowledges support from theUNAM-ITE collaboration agreement 1500-479-3-V-04. We thankthe daytime and night support staff at the OAN-SPM for facilitat-ing and helping obtain our observations especially to Mr GustavoMelgoza-Kennedy, our telescope operator, for his assistance dur-ing observations, as well as the CATT for time allocation. Thisarticle is based upon observations carried out at the Observato-rio Astronómico Nacional on the Sierra San Pedro Mártir (OAN-SPM), Baja California, México. The data presented here were ob-tained in part with ALFOSC, which is provided by the Instituto deAstrofisica de Andalucia (IAA) under a joint agreement with theUniversity of Copenhagen and NOTSA. We acknowledge the In-stituto de Astrofisica de Canarias for the use of the filters. This re-search has made use of the NASA/IPAC Infrared Science Archive,which is operated by the Jet Propulsion Laboratory, California In-stitute of Technology, under contract with the National Aeronauticsand Space Administration. We have also used archival observationsmade with the NASA/ESA Hubble Space Telescope, and obtainedfrom the Hubble Legacy Archive, which is a collaboration betweenthe Space Telescope Science Institute (STScI/NASA), the SpaceTelescope European Coordinating Facility (ST-ECF/ESA) and theCanadian Astronomy Data Centre (CADC/NRC/CSA). IRAF isdistributed by the National Optical Astronomy Observatory, whichis operated by the Association of Universities for Research in As-tronomy (AURA) under a cooperative agreement with the NationalScience Foundation.
REFERENCES
Apriamashvili S. P., 1959, Astronomicheskij Tsirkulyar, 202, 13Barentsen G., Farnhill H. J., Drew J. E., González-Solares E. A., Greimel
R., Irwin M. J., Miszalski B., Ruhland C., Groot P., et al., 2014, MN-RAS, 444, 3230
Corradi R. L. M., Manso R., Mampaso A., Schwarz H. E., 1996, A&A, 313,913
Corradi R. L. M., Sabin L., Miszalski B., Rodríguez-Gil P., Santander-García M., Jones D., Drew J. E., Mampaso A., et al. 2011, MNRAS,410, 1349
Cuesta L., Phillips J. P., Mampaso A., 1993, A&A, 267, 199Fang X., Guerrero M. A., Marquez-Lugo R. A., Toalá J. A., Arthur S. J.,
Chu Y.-H., Blair W. P., Gruendl R. A., Hamann W.-R., Oskinova L. M.,Todt H., 2014, ApJ, 797, 100
Frew D. J., Parker Q. A., Bojicic I. S., 2016, MNRAS, 455, 1459Giammanco C., Sale S. E., Corradi R. L. M., Barlow M. J., Viironen K.,
Sabin L., et al. 2011, A&A, 525, A58Grosbol P., 1989, in Klare G., ed., Reviews in Modern Astronomy Vol. 2 of
Reviews in Modern Astronomy, MIDAS.. pp 242–247Guerrero M. A., Manchado A., Serra-Ricart M., 1996, ApJ, 456, 651Guerrero M. A., Miranda L. F., Ramos-Larios G., Vázquez R., 2013, A&A,
551, A53Guillén P. F., Vázquez R., Miranda L. F., Zavala S., Contreras M. E., Ayala
S., Ortiz-Ambriz A., 2013, MNRAS, 432, 2676López-Martín L., López J. A., Esteban C., Vázquez R., Raga A., Torrelles
J. M., Miranda L. F., Meaburn J., Olguín L., 2002, A&A, 388, 652Manchado A., Guerrero M. A., Stanghellini L., Serra-Ricart M., 1996, The
IAC morphological catalog of northern Galactic planetary nebulaeMeaburn J., López J. A., Gutiérrez L., Quiróz F., Murillo J. M., Valdéz J.,
Pedrayez M., 2003, Rev. Mex. Astron. Astrofis., 39, 185Miszalski B., Corradi R. L. M., Boffin H. M. J., Jones D., Sabin L.,
Santander-García M., Rodríguez-Gil P., Rubio-Díez M. M., 2011, MN-RAS, 413, 1264
Monteiro H., Morisset C., Gruenwald R., Viegas S. M., 2000, ApJ, 537, 853
MNRAS 000, 1–?? (2016)

Properties of PC 22 9
Parker Q. A., Acker A., Frew D. J., Hartley M., Peyaud A. E. J., Ochsen-bein F., Phillipps S., Russeil D., Beaulieu S. F., Cohen M., Köppen J.,Miszalski B., Morgan D. H., Morris R. A. H., Pierce M. J., VaughanA. E., 2006, MNRAS, 373, 79
Parker Q. A., Bojicic I. S., Frew D. J., 2016, in Journal of Physics Confer-ence Series Vol. 728 of Journal of Physics Conference Series, HASH:the Hong Kong/AAO/Strasbourg Hα planetary nebula database. p.032008
Peimbert M., Costero R., 1961, Boletin de los Observatorios Tonantzintla yTacubaya, 3, 33
Rubio G., Vázquez R., Ramos-Larios G., Guerrero M. A., Olguín L., Guil-lén P. F., Mata H., 2015, MNRAS, 446, 1931
Sabin L., Parker Q. A., Corradi R. L. M., Guzman-Ramirez L., MorrisR. A. H., Zijlstra A. A., Bojicic I. S., et al. , 2014, MNRAS, 443, 3388
Sahai R., 2000, ApJ, 537, L43Sahai R., Morris M. R., Villar G. G., 2011, ApJ, 141, 134Sahai R., Sánchez Contreras C., Morris M., 2005, ApJ, 620, 948Soker N., 1997, ApJs, 112, 487Steffen W., Koning N., Esquivel A., García-Segura G., García-Díaz M. T.,
López J. A., Magnor M., 2013, MNRAS, 436, 470Steffen W., Koning N., Wenger S., Morisset C., Magnor M., 2011, IEEE
Transactions on Visualization and Computer Graphics, Volume 17, Is-sue 4, p.454-465, 17, 454
Tajitsu A., Tamura S., 1998, ApJ, 115, 1989Vázquez R., López-Martín L., Miranda L. F., Esteban C., Torrelles J. M.,
Arias L., Raga A. C., 2000, A&A, 357, 1031Vázquez R., Miranda L. F., Olguín L., Ayala S., Torrelles J. M., Contreras
M. E., Guillén P. F., 2008, A&A, 481, 107Wilson O. C., 1950, ApJ, 111, 279
This paper has been typeset from a TEX/LATEX file prepared by the author.
APPENDIX A: OBSERVED AND SYNTHETIC SPECTRAOF PC 22
MNRAS 000, 1–?? (2016)

10 L. Sabin et al.
Figure A1. From left to right: MES [O III], [O III]+contours, Hα and [O III] line SHAPE modelling for the slits C (top) and H (bottom)
MNRAS 000, 1–?? (2016)

Properties of PC 22 11
Figure A2. MES [O III], [O III]+contours and [O III] line SHAPE modelling for the slits A,B,F,M,L,I,J and K.
MNRAS 000, 1–?? (2016)