a tale of two prices: liquidity and asset prices in...
TRANSCRIPT

A Tale of Two Prices:
Liquidity and Asset Prices in Multiple Markets*
Justin S. P. Chan†
Dong Hong‡
Marti G. Subrahmanyam§**
First Draft: February 2005
This Draft: February 2006
* We thank Viral Acharya, Yakov Amihud, Cheol S. Eun, Joel Hasbrouck, Ravi Jain, Avanidhar Subrahmanyam, and seminar participants at the Singapore Management University 2005 Research Summer Camp for detailed comments on an earlier draft of this paper. We also thank Christian Starck of Deutsche Bank for clarifying some of the institutional aspects of the market for American Depositary Receipts. † Lee Kong Chian School of Business, Singapore Management University, 50 Stamford Road, Singapore 178899. Ph: (65) 6828-0718, Fax: (65) 6828-0777, E-mail: [email protected] ‡ Lee Kong Chian School of Business, Singapore Management University, 50 Stamford Road, Singapore 178899. Ph: (65) 6828-0744, Fax: (65) 6828-0777, E-mail: [email protected]. § Department of Finance, Leonard N. Stern School of Business, New York University, 44, West Fourth Street #9-15, New York, NY 10012-1126. Ph: (1) (212) 998-0348, Fax: (1) (212) 995-4233, E-mail: [email protected]. ** Subrahmanyam serves on the boards of two of the companies in the sample used in this study: ICICI Bank Ltd. (NYSE: IBN) and Infosys Technologies Ltd. (NASDAQ: INFY). This study is based only on publicly available data and does not draw on any privileged information he possesses as a director of these two companies.

A Tale of Two Prices:
Liquidity and Asset Prices in Multiple Markets
Abstract
This paper investigates the liquidity effect in asset pricing by studying the liquidity-
premium relationship of an American Depositary Receipt (ADR) and its underlying share.
Using the Amihud (2002) measure, the turnover ratio and trading infrequency as proxies
for liquidity, we show that a higher ADR premium is associated with higher ADR
liquidity and lower home share liquidity, in terms of changes in these variables. We find
that the liquidity effects remain strong after we control for firm size and a number of
country characteristics, such as the expected change in the foreign exchange rate, the
stock market performance, as well as several variables measuring the openness and
transparency of the home market.
JEL Classification: G10, G12, G15
Keywords: American Depositary Receipts (ADRs), dual listing, liquidity, turnover,
premium

I. Introduction
Similar or even identical financial assets are known to trade at different prices in different
markets. This apparent departure from the law of one price has captured academic
attention for decades. The observed price differential is often cited as evidence of market
imperfections, limits to arbitrage, and investor irrationality.
Recent studies suggest that differences in liquidity appear to explain part of this
phenomenon. For example, in the case of closed-end funds, Jain, Xia, and Wu (2004)
find that the premia on closed-end country funds correspond to differences in liquidity
between the funds’ host and home markets (i.e. U.S. and the country where the funds
invest, respectively). Other studies relate liquidity to price differences between pairs of
securities that have almost identical future cash flows. Examples of such studies are
papers by Silber (1991), for restricted stock compared with freely traded stock of the
same company, Amihud and Mendelson (1991), for U.S. Treasury notes and bills of
identical maturities, and Boudoukh and Whitelaw (1993), for Japanese government bonds
with a similar maturity and coupon.
Empirical studies generally show that illiquidity depresses asset prices, and leads to
higher expected returns.1,2 Amihud and Mendelson (1986), Brennan and Subrahmanyam
1 Theoretical models of liquidity effects, however, yield mixed results. Kyle (1985) and Allen and Gale
(1994) show an important effect of illiquidity on asset prices, while Constantinides (1986) and Vayanos
(1998) show that illiquidity has a large effect on asset turnover, but only a relatively small effect on asset
prices.
2

(1996), Brennan, Chordia, and Subrahmanyam (1998), and Datar, Naik, and Radcliffe
(1998) show how the expected return for common stocks is related to illiquidity. Other
features of liquidity have also shown a noticeable impact on stock returns.3 The pattern is
not limited to the stock market. For example, in the bond market, on-the-run Treasury
bonds are more liquid and have higher prices than their off-the-run counterparts, even
though they have similar cash flows and characteristics, as argued by Amihud and
Mendelson (1991) and Boudoukh and Whitelaw (1993).
The ADR market provides an ideal laboratory to test whether liquidity is a significant
factor in asset pricing. In cross-sectional studies of the asset liquidity-price relationship in
the stock markets, factor models are often used to control for common risk factors across
different stocks. The question that usually arises in these types of tests is the validity of
the particular asset pricing model used, and the extent to which one can empirically
separate the impact of the asset-pricing model from the liquidity effects being studied.
The advantage of studying the ADR market is that investors in the U.S. markets receive
exactly the same cash flows (on a foreign-exchange-adjusted basis) as shareholders in the
home market do.4 By comparing the differences in the prices and liquidity for the ADRs
2 See Amihud, Mendelson and Pedersen (2005) for a survey of the literature on liquidity effects in asset
pricing. 3 For instance, Chordia, Subrahmanyam, and Anshuman (2001) find that stock return is related to the
variability of liquidity. Pastor and Stambaugh (2003) find that stock returns are also related to the stocks’
sensitivities to innovations in market liquidity, also known as “liquidity beta”. At the market level, Amihud
(2002) shows that the aggregate stock returns are higher when the market is less liquid. Acharya and
Pedersen (2005) investigate the various channels for the liquidity effect on stock returns in a unified
liquidity-adjusted capital asset pricing model. 4 See Foerster and Karolyi (1999) for a primer on ADRs.
3

and their corresponding home shares, we are able to test the liquidity effect without the
conflation arising out of the potential mis-specification of the asset pricing models.
There is indirect evidence from the existing literature that links asset prices with liquidity
in cross-listings. For instance, Alexander, Eun and Janakiraman (1988) document a
reduction in a security’s expected return after its international listing. Kadlec and
McConnell (1994) and Foerster and Karolyi (1999) show that the reduction in expected
return is associated with an increase in the share price around the listing date. They also
attribute the increase in the share price to the superior liquidity associated with the
international listing.5
In this paper, we directly investigate the cross-sectional relationship between the ADR
premium and the liquidity of the ADR and that of its underlying share, in the presence of
several other controls. Our sample consists of 401 ADRs from 23 countries over the
period between January 1981 and December 2003. We use the Amihud (2002) measure
of liquidity, the turnover ratio and trading infrequency as proxies for liquidity. We
primarily examine the relationship between the monthly change in the ADR premium and
5 There is a vast literature on the pricing of ADRs, which is indirectly connected with the issue analyzed in
this paper. Many of the papers in this literature investigate the differences in pricing between the ADR and
the underlying share, and thus indirectly seek to explain the premium in relation to macroeconomic factors
and the degree of segmentation/integration between the home and ADR market. See, for example,
Rosenthal and Young (1990), Kato, Lin, and Schallheim (1991), Wahab, Lashgari, and Cohn (1992), Park
and Tavokkol (1994), Miller and Morey (1996), Chakravarty, Sarkar, and Wu (1998), Foerster and Karolyi
(1999), Dabora and Froot (1999), Grammig, Melvin, and Schlag (2001, 2005), Eun and Sabherwal (2002),
Karolyi and Li (2003), De Jong, Rosenthal, and van Dijk (2004), Doidge, Karolyi, and Stulz (2004),
Gagnon and Karolyi (2003), Suh (2003), Menkveld, Koopman, and Lucas (2003), Karolyi (2004), Bailey,
Karolyi, and Salva (2005), Blouin, Hail, and Yetman (2005).
4

the monthly change in the liquidity measures. We find that the change in the ADR
premium is positively correlated with the change in the ADR’s liquidity, and negatively
correlated with the change in the home share liquidity. The liquidity effects do not
disappear, even after we control for expectations about the future exchange rate change,
the foreign stock market return and the US stock market return.
There are two important advantages of examining the changes in the ADR premium and
the liquidity measures (change variables, hereafter). First, using the change variables
indirectly controls for other firm and country characteristics. Intuitively, institutional
factors such as restrictions on foreign ownership, short sale constraints, and opaque
accounting standards can potentially hinder the arbitrage activities between the two
markets, thus potentially determine the cross-sectional variation of the level of ADR
premium. However, it is likely that these factors would play less of a role in the change
in the ADR premium since the factors are quite stable from one month to the next. On the
other hand, the liquidity measures themselves vary substantially from one month to the
next. If liquidity is truly an important factor in the pricing of the ADR and its underlying
asset, we would expect the change in liquidity to be related to the change in the ADR’s
premium. As a result, the change variable regressions should show the isolated impact of
liquidity on the ADR premium.
Second, the level variables are highly persistent. If we use the level variables in a panel
regression, statistical inference would be problematic due to the biased standard error
estimates caused by the persistence in the dependent and independent variables. On the
5

other hand, the change variables are persistent to a much lesser extent. We can obtain
correct statistical inference with proper econometric procedures. Hence, we believe that
the regressions using change variables represent a better econometric specification to test
our hypothesis.
In a separate robustness test, we address the impact of market structures and
segmentation. We do so by carrying out regressions using the level variables with
controls for country variables that have been shown to affect financial markets.
Motivated by the research of La Porta et al (1998), we test whether the liquidity
explanation of the ADR premium is valid when the estimation is controlled for variables
such as the transparency and credibility of accounting standards, the efficacy of judicial
system, and corporate governance variables such as anti-director rights.6 Moreover, we
also include variables that proxy for market restrictions in different countries (measured
by restrictions on short-sales constraints and stock ownership concentration).7 Last, but
not least, we use the country’s openness measure developed by Edison and Warnock
(2003) to control for levels of market segmentation in our tests.8 We show that the
liquidity effects remain robust in the level regressions, even after controlling for the long
list of market structural and segmentation variables mentioned above.
6 Most of these characteristics are suggested by the recent work of La Porta et al (1998). 7 Bris, Goetzmann, and Zhu (2004). 8 Jain, Wu, and Xia (2004) use the same openness measures to show that the liquidity-premium relationship
is stronger for closed-end country funds that correspond to economies that are less integrated with the
world markets.
6

The rest of the paper is organized as follows. In section II, we discuss our ADR dataset
and report summary statistics. Section III covers the construction of liquidity measures
for the individual ADRs, the shares in the home market and the home markets as a whole.
Section IV presents our empirical findings. Section V concludes the paper.
II. Data
We begin our sample construction with the universe of all ADRs in the Center for
Research in Securities Prices (CRSP) datasets as of December 31, 2003. Depending on
the registration and reporting requirements, and trading conditions, there are four types of
ADRs: Level I, Level II, Level III and Rule 144A. Only Level II and level III ADRs are
listed on American Stock Exchange/New York Stock Exchange/National Association of
Securities Dealers Automated Quotation System.9 Our analysis includes only these listed
(Level II and Level III) ADRs, as CRSP only covers those from AMEX, NYSE or
NASDAQ. Based on these criteria, there are 809 ADRs in the entire CRSP dataset, of
which 437 were still actively traded at the end of 2003.
Out of the 809 ADRs, we are able to match 470 with their respective home market stock
prices and volumes, which are available on Datastream, and the corresponding ADR
ratios (1 share of ADR = # of shares of home stock). We also exclude countries with
9 Level I ADRs trade over the counter (OTC) on “pink sheets”, require minimal SEC disclosure and do not
require compliance with US GAAP financial reporting obligations. Rule 144A ADRs are privately placed
to Qualified Institutional Buyers and also do not require SEC disclosures or US GAAP compliance. We
exclude these from our study, due to the opacity of their price formation as well as the lack of reliable data
for our analysis.
7
fewer than 5 ADRs, since otherwise, the number of firms may be too few to account for
cross-sectional differences in the country characteristics we seek to use as explanatory
variables. This eliminates 30 ADRs, which represent 16 countries, and 440 ADRs remain
in our database for our empirical tests.
After these initial screens, we obtain daily prices, trading volume and shares outstanding
of the ADRs and U.S. daily market returns from CRSP. We then collect the same set of
data for the corresponding shares in the home market from Datastream. The daily foreign
exchange rates for conversion from the home market currency into U.S. dollars and the
daily returns of the respective home markets are also obtained from Datastream. The
sample period covers daily data for the period from January 1981 to December 2003.
One issue with our datasets is that the ADR ratios are only available at the end of our
sample period. As this ratio is crucial for calculating the ADR premium, we need to
make appropriate adjustments in our analysis, if the ratio changes over time. Typically,
custodian banks advise firms to change the ratio to maintain a “proper” price range in the
US, especially when the home share price changes significantly. In order to correct for
these ratio changes, we first manually check the ADR premium pattern of each stock to
identify such ratio changes. Out of the 440 ADRs we checked, 275 do not appear to have
such a ratio change during the period under investigation. The ratios of 126 ADRs
apparently changed and the old ratios are easily identifiable (e.g. the ratio changed from
1:5 to 1:1). We manually correct the old ADR ratios for these ADRs in our database on
these dates. We are unable to explain the premium pattern for the other 39 ADRs, which
8

might be due to data errors or mismatching of data from CRSP and Datastream in the first
step of our sample construction. We, therefore, eliminate these 39 ADRs from our
sample.
In our final sample, there are 401 ADRs from 23 countries from January 1981 to
December 2003. During this period, with the increasing trend towards globalization of
financial markets, the ADR, as a financial instrument, has been growing in popularity.
As a result, there are more ADRs towards the end of our sample period, particularly in
the last 5 years. On average, there are 183 ADRs that were traded each month during our
whole sample period.
Table 1 reports the summary statistics of the final sample. Not surprisingly, there are
more ADRs of firms from the developed markets, since these markets had fewer trading
restrictions, particularly in the earlier years, compared to the emerging markets. In our
sample, therefore, the UK has the most firms, with 92 ADRs traded in the U.S. Other
countries with more than 20 ADRs include France (29), Germany (24), Japan (32), Hong
Kong (23), and Australia (24). In recent years, there is an increasing tendency for
companies from emerging economies, especially from Asia and Latin America, to raise
capital in the form of ADRs. Hence, there are also significant numbers of ADRs
included in our sample from emerging market countries, such as Korea (9), India (10),
Taiwan (10), Mexico (18), Chile (17), Brazil (12), Argentina (10) and South Africa (14).
9

Columns 4 and 5 report the statistics on market capitalization (MV) of the ADRs in our
sample. The MV is calculated using data on the home share price and the exchange rate
from Datastream, as the data for shares outstanding on CRSP refer only to those in ADR
form and not to the total number of shares. The numbers reported are the time series
averages of the monthly median (mean) market capitalization of the ADRs for each
country. According to the averages of the monthly median market capitalization,
companies from Spain have the highest MV (US$38.6 billion), while those from Israel
have the lowest (US$396.75 million). For all companies from all countries, the average
of the monthly MV medians is US$3.17 billion and the average of the monthly MV
means is US$8.51 billion.
The statistics on the ADR premium are reported in column 6 and 7. We first compute the
daily ADR premium as defined below:
,,
, ,
*1
*
adri d d
i d hsi d i d
P ERPrem
P AR= − (1)
where is the premium (discount) for ADR i, if it is positive (negative) on day d,
is the ADR price from CRSP, is the home share price from Datastream, is
the currency exchange rate, and
,i dPrem
,adr
i dP ,hs
i dP dER
,i dAR is the ADR ratio, i.e. the number of home shares
equivalent to 1 share of ADR. After we compute the daily premium for each ADR, we
compute the average for each month to get its monthly premium. We again report the
time series average of the monthly median (mean) premium of the ADRs for each
10

country. According to the average of the monthly medians, the country ADR premium
ranges from -10.54% (Netherlands) to 21.53% (India). The average premium for all
ADRs from all countries, however, is close to zero (0.01%).
III. Liquidity Measures
III.A. The Amihud measure, the turnover ratio, and trading infrequency
In simple terms, illiquidity can be thought of as the sensitivity of asset returns (or prices)
to order flow. The larger the illiquidity, the greater is the impact of a particular level of
order flow on the asset price. Unfortunately, illiquidity is not an observable variable and
is somewhat difficult to quantify, sometimes even with actual market microstructure data.
In practice, several illiquidity proxies are used and their impact on stock returns has been
well documented in the existing academic literature. The simplest and the most
traditional measure of illiquidity is the quoted bid-ask spread employed in Amihud and
Mendelson (1986). Chalmers and Kadlec (1998) use the effective spread obtained from
quotes as well as from subsequent transactions. Brennan and Subrahmanyam (1996)
measure illiquidity based on the price response to signed order flow (i.e. using opposite
signs for buy and sell orders) using intra-day data on transactions and quotes. Easley,
Hvidkjaer and O’Hara (2002) introduce a measure of the probability of information-
based trading (PIN), which captures the information asymmetry aspect of illiquidity, i.e.,
the likelihood that the next trade comes from an informed agent. They show that PIN has
11

a direct impact on expected stock returns, independent of the stocks’ illiquidity and return
characteristics.
Unfortunately, it is difficult to apply these microstructure-based measures in the ADR
setting due to constraints on data availability. Although intra-day data on transactions
and quotes are available for the ADR market in the U.S. (e.g. the Trades and Quotes
(TAQ) database of the New York Stock Exchange), these are often not available for
individual foreign stock markets. As a result, we are constrained to obtain alternative
liquidity measures that use only daily return and volume data as inputs. Indeed, the
developments of these measures were partly motivated by the constraints on data
availability encocuntered in market microstructure research in general.
Among the first measures using only daily return and price data is the “Amivest”
liquidity ratio, which is defined as the average of daily ratio of volume to absolute return.
This measure has been used in the studies of Cooper, Groth and Avera (1985), and
Amihud, Mendelson, and Lauterbach (1997), among others. Another measure closely
related to the Amivest ratio is the Amihud (2002) illiquidity measure, which is based on
Kyle’s (1985) lambda and calculated as the average of daily ratio of absolute return to
volume (the reciprocal of the Amivest liquidity ratio). This measure is intuitively
appealing in the sense that it measures the daily price impact of the order flow, which is
exactly the concept of illiquidity, since it quantifies the price/return response to a given
size of trade. Finally, Pastor and Stambaugh’s (2003) liquidity beta estimates the
12

liquidity cost from signed volume-related return reversals using daily return and volume
data.
Clearly, any candidate metric for liquidity, using only daily price and volume data, needs
to be positively correlated to the finer measures using microstructure data. This would
justify its use, especially when the latter high frequency data are unavailable. Hasbrouck
(2005) addresses this issue by evaluating the various alternative liquidity measures using
daily data and estimates their correlations with the microstructure-based measures. He
finds that the correlations between the Amihud (2002) measure and various
microstructure-based measures are higher compared with those involving the Amivest
measure. He also finds that the Pastor and Stambaugh (2003) measure is weakly
correlated to microstructure-based measures, and sometimes with the wrong sign and
should be used with caution.
In our analysis, we use the Amihud (2002) measure of liquidity, which is founded on the
basic intuition about a security’s price impact (i.e. Kyle’s λ ), and can be easily computed
from the foreign and U.S. market daily price and volume data. Intuitively, liquidity
includes two dimensions: the liquidity level and the liquidity risk. The level of liquidity
is the predictable part of the tradability of the security without suffering the adverse
consequences of market impact. Liquidity risk, on the other hand, arises from the
unpredictable changes in liquidity over time. In this paper, we focus on the effect of
liquidity level, since we need to first establish whether this matters for the pricing of
ADRs, before examining the effect of liquidity risk. Also, the existing literature appears
13

to indicate that liquidity level is an important determinant of an asset’s price.10 Thus, our
procedure begins with calculating the liquidity measure for each ADR and its home
market counterpart. We first obtain the daily measure, when it is well defined.11 We then
average it across all trading days of a specific month to obtain the monthly measure. The
monthly Amihud measure , ,adri c tLiq for ADR i of country c, in month t is defined as:
,, ,
1 ,
1 tadrDi dadr
i c t adrdt i
RLiq
D Vol=
= ∑d
(2)
where tD is the number of trading days in month t, ,adri dR is the daily return of ADR i on
day d (within month t), and is the dollar trading volume of ADR i on day d,
defined as number of shares traded times the ADR price on day d.
,adri dVol
The monthly Amihud measure for the ADR’s home market counterpart, , ,hsi c tLiq , is defined
similarly, except that the daily money trading volume in that market is converted into U.S.
dollars at the corresponding spot exchange rate on day d. The purpose of this adjustment
is to ensure that the measure is calculated on the same basis for all stocks from different
countries.
10 Acharya and Pedersen (2005) estimate that, in the US markets, the return premium due to liquidity level
is 3.5%, while the return premium due to commonality in liquidity with market liquidity,
cov(Liquidityi,,LiquidityM) is only 0.08%. They also estimate the premium due to the other cross liquidity-
market risk factors, cov(Returni, LiquidityM) and cov(Liquidityi, ReturnM) to be 0.16% and 0.82%,
respectively. 11 The measure is not defined if there is no trading on a particular trading day.
14

In our cross-sectional analysis, we employ both the Amihud measure of the ADR, , ,adri c tLiq ,
and of its home market counterpart, , ,hsi c tLiq . Since the daily return of the ADR, ,
adri dR , and
that of its corresponding home share, ,hsi dR , are approximately equal on any given day, the
difference between , ,adri c tLiq and , ,
hsi c tLiq is largely determined by the respective dollar
trading volumes in the U.S. and in the home market. This, potentially, creates a
measurement discrepancy between these two variables, since the numbers of floating
shares are very different in the two markets. To address this issue, we use turnover ratio
as an alternative liquidity measure and carry out the same analysis. The turnover ratio
measures how actively the stock is being traded, adjusted by the number of shares
outstanding, and thus, available for trading. Chordia, Roll, and Subrahmanyam (2000)
also document high correlations between the quoted bid-ask spread and various volume
measures, which include share volume, dollar trading volume, and turnover. The
monthly turnover ratio is simply defined as the average of daily turnover ratios in
each month:
, ,i c tTO
,, ,
1 ,
1 t adrDadr i di c t adr
dt i
VolTO
D SO=
= ∑d
; ,, ,
1 ,
1 t hsDhs i di c t hs
dt i
VolTO
D SO=
= ∑d
(4)
where is the number of ADR shares traded and is the total ADR shares
outstanding on day d in the U.S. market. and correspond to the number of
home shares traded and total shares outstanding in the home market, respectively.
,adri dVol ,
adri dSO
,hsi dVol ,
hsi dSO
15

In extreme cases, some ADRs are so illiquid that there is virtually no trading at all during
many regular trading days in the U.S. markets. We believe that this type of trading
infrequency captures another aspect of illiquidity. So we construct another variable, the
monthly trading “infrequency,” defined as number of days that the ADR is not traded
divided by the total number of trading days in the month. This trading infrequency is
typically an issue only for the ADRs, but not for their home market counterparts, since
the underlying shares in the home markets are generally those of the larger companies,
and hence more actively traded in those markets. Hence, in virtually all cases, we
observe that the home shares are traded on almost every trading day, and trading
infrequency has no cross-sectional variation.
III.B. Summary statistics and correlations between the alternative liquidity measures and
size
Panel A in table 2 provides a brief overview of the statistical characteristics of the
Amihud measure and the turnover ratios of ADRs and the underlying securities in their
home markets. Notably, all variables, except trading infrequency, span wide ranges,
cross-sectionally in our dataset. Take the home share Amihud measure as an example:
the time series average of the monthly cross-sectional mean is 0.0332, while it has a
(cross-sectional) standard deviation of 0.1730. It is interesting to note that a significant
number of ADRs are not traded every day, since the average of the cross-sectional mean
trading infrequency is 0.1147, which means that, on average, the typical ADR has zero
16

trading volume on about 2 trading days per month. Investors who hold (or plan to buy)
ADRs that have a lower frequency of trading certainly face some liquidity risk if they
were to sell (or add to) their holdings.
Panel B in table 2 provides the correlation coefficients among the liquidity measures, the
size of the ADR and its home counterpart. The size of the ADR and the size of the home
market counterpart are typically quite different, since we only calculate them by
multiplying the price and the outstanding shares in the U.S. market and the home market,
respectively. (A typical firm in our sample has 5%-10% of its total outstanding shares
traded in the U.S. in ADR form.) There are two sets of correlations between the variables
– in the home markets and in the U.S. market, respectively. However, a striking
similarity is observed in the correlation pattern between the two sets. Surprisingly, the
Amihud measure has low correlation with the turnover ratio in both markets. This may
suggest that the two measures capture different aspects of the stock’s illiquidity that are
somewhat orthogonal to each other. Since the Amihud measure is negatively correlated
with firm size, a given amount of trading volume could lead to a large price movement
for a smaller firm, and hence, a greater Amihud measure. The turnover ratio is also
negatively correlated with size, which might be consistent with the fact that smaller
stocks tend to be held by retail investors, and thus have a higher turnover ratio.
Interestingly, trading infrequency is positively correlated with the Amihud measure. This
is consistent with our intuition that if a stock trades less often, it is likely to lead to large
price movement once it is traded. Finally, trading infrequency has a negative correlation
with size, as expected.
17

IV. Methodology and Empirical Results
IV.A. The Model
As discussed in the introduction, holders of ADRs and the underlying shares in the home
market have identical claims to the firm’s future cash flows. However, this does not
guarantee that the ADR and its underlying share trade at the same price, when there is a
certain level of market segmentation between the two markets, even apart from
differences between the time zones of the two markets. Our focus in this paper is to
study whether the differences in liquidity in the two markets have effects on the price of
the ADR in relation to the home share, apart from these other effects. If liquidity is an
important factor in pricing the asset, different levels of liquidity in the host (ADR) market
and home market can potentially cause the ADR price to deviate from the price of its
underlying asset, thus creating a premium (or a discount). High liquidity in the ADR
market increases the price of the ADR and its premium. On the other hand, high
illiquidity in the home market depresses the price of the home share, and thus increases
the ADR’s premium. Therefore, we expect a positive relationship between the premium
and the ADR’s liquidity, and a negative relationship between the premium and the
liquidity of the underlying share in the home market.
In addition to the liquidity differences, investors in the two markets face many
institutional and informational differences. In a prior study, Gagnon and Karolyi (2003)
18

use daily data to document that the ADR premium has a higher systematic co-movement
with the U.S. market index and a lower systematic co-movement with the corresponding
home market index. They also show that the “excessive co-movements” are influenced
by factors that impede arbitrage activities. The factors they study include three major
categories: first, market-based ones such as investment barriers, short-sales restrictions,
accounting standards, legal protection, etc., which are regulatory in nature; second,
information-based factors such as the degree of synchronization of the common
movement between the stock and the home market, the existence of asymmetry of
information between insiders and other shareholders; and third, trading-based factors
such as whether the cross-listed stocks have a “preferred” trading location, which we
believe is indirectly related to our concepts of liquidity. Since all these country factors
affect arbitrage activities between the home and ADR markets, they could potentially
explain the variations in the ADR premium.
Time zone differences may also contribute to the differences between the daily closing
prices of the ADR and their respective underlying assets. Since we construct monthly
measures for all variables by averaging their daily measures within each month, and our
regressions are all based on monthly observations, we believe that the possible time-zone
effects will have little impact on our empirical analysis.12
12 To check this conjecture, we test the sensitivity of our results to time-zone differences, by computing the
daily premium differently: by comparing the U.S. price on day d-1 and the home market price on day d, or
alternatively, by comparing the U.S. price on day d+1 and the home market price on day d. The empirical
results are essentially the same as those when the premium is computed as in equation (1) and are not
presented here in the interests of brevity.
19

In our model, we conjecture that the cross-sectional differences of the ADR premium are
determined both by the liquidity effects and country factors. The relationship can be
described by the following equation:
, , ,* *i t i t x i t z i tPrem X b Z b ,ε= + + (5)
where is ADR i’s premium in month t, defined as the average of the daily
premium in equation (1). is a vector of the liquidity measures discussed in section
III, and
,i tPrem
,i tX
,i tZ is a vector of country factors discussed above. To estimate (5) with panel data,
one should note that there is an important difference in the properties of and ,i tX ,i tZ :
The vector measures the liquidity of the ADR and its home counterpart, and varies
from one month to the next, while the vector
,i tX
,i tZ measures country characteristics, which
usually do not change much from month t-1 to month t. Since the liquidity effects are the
focus of this study and we are interested primarily in the coefficients xb , we instead
estimate the model in first differences:
, , *i t i t x i tPrem X b ,εΔ = Δ + Δ (5’)
which is the difference of equation (5) in t-1 and t. Note that ,i tZ and drop out because zb
,i tZ does not change from t-1 to t. Intuitively, the country factors can potentially
20

determine the level of ADR premium cross-sectionally.13 However, as mentioned above,
it is unlikely that there is such a relationship between the changes in these factors and the
change in the ADR premium. On the other hand, our liquidity measures vary
substantially from month to month. If liquidity is truly an important factor in the pricing
of the ADR and its underlying asset, we expect the change in liquidity to be related to the
change in the ADR’s premium. Estimating equation (5’) allows us to obtain unbiased
estimates of the liquidity effects, without the complication of the time-invariant
components ,i tZ in equation (5).14
Another advantage of using equation (5’) is due to an important statistical property of the
liquidity measures and the ADR premium . Although and do
vary from month to month, these variables are highly persistent in nature. The average
first-order auto-correlation of is about 45%, and that of the elements of falls
in the range of 40%-65%. With such a high degree of persistence in the dependent and
independent variables, we are likely to obtain biased standard errors of the coefficient
estimates in panel regressions, even if we apply some econometric correction to address
the problem. On the other hand, although there is still some degree of persistence in the
change variables, and , the average first-order auto-correlation coefficients
are much lower, and fall in the range of -10% to -25%. With proper econometric controls,
we are likely to obtain unbiased estimates from our regressions.
,i tX ,i tPrem ,i tX ,i tPrem
,i tPrem ,i tX
,i tXΔ ,i tPremΔ
13 In addition, Zi,t may also include firm characteristics that do not change much from month to month, such
as beta, firm size, value/growth characteristics, or analyst following, although their effects on the ADR
premium are unclear intuitively. 14 As a robustness test, we estimate equation (5) and report the results in a later subsection.
21

Given the advantages of using the change variables discussed above, we estimate
equation (5’) with panel data. The estimates for xb are the OLS estimates. Since the
change variables are still serially auto-correlated to some extent, the OLS standard errors
are biased due to the existence of firm fixed effect. To address this problem, we calculate
the corresponding t-statistics using Rogers’ estimate of standard errors, clustered by firm,
as suggested by Petersen (2005).15
IV.B. Liquidity Effects
By expanding equation (5’), we have the following equation:
, 0, 1 , , 2 , ,
3 , , 4 , , 5 , ,
* *
* * *
adr hsi t t i c t i c t
adr hsi c t i c t i c t i c t
Prem b b Liq b Liq
b TO b TO b Infreq , ,ε
Δ = + Δ + Δ
+ Δ + Δ + Δ + (6)
In the above regression, the right hand side includes the various liquidity measures
discussed in section III. , ,adri c tLiqΔ and , ,
hsi c tLiqΔ represent the change in the ADR and
home share Amihud liquidity measures, respectively. and denote the
change in the ADR and home share turnover ratios, respectively.
, ,adri c tTOΔ , ,
hsi c tTOΔ
, ,i c tInfreqΔ is the
change in the monthly trading infrequency of the ADR. The trading infrequency of the
15 Petersen (2005) examines different approaches used in the finance literature that address the firm fixed
effect in panel regressions. He finds that OLS, Fama-MacBeth and Newey-West standard errors are all
biased, while Rogers’ standard errors, clustered by firm, are unbiased.
22

home shares is not included in the model specification because the home shares are
traded on almost every day in virtually all cases, as discussed in subsection III.A.
Since we are examining the effect of liquidity on the price difference between the ADR
and its corresponding home share, one might be tempted to use the difference in liquidity
between the two markets as an explanatory variable. However, in a typical case, 95% of
the shares are traded in the home market and only 5% are traded as ADR, the home share
liquidity and the ADR liquidity have different scales. Thus, measuring the difference
between the two liquidity metrics might be problematic. In addition, using the liquidity
difference as an explanatory variable also assumes that the ADR liquidity and the home
market liquidity have the same magnitude and sign for the effect on the ADR premium,
which may be too restrictive. Indeed, our results show that the liquidity effect of the ADR
is much stronger than that of the home share.
Our intuition suggests that the signs of the estimates of the coefficients in regression (6)
should be b2>0, b3>0, and b1<0, b4<0, b5<0. Table 3 summarizes the main results. We
estimate equation (6) using different sets of independent variables, which allow us to
gauge the relative impact on the change in the ADR premium on the change in the ADR
liquidity and the home share liquidity. Regression I estimates the relationship between
the ADR premium and the illiquidity of the underlying assets, when the Amihud
measures are used. Regressions II and III estimates the same relationship when turnover
ratios and trading infrequency are used, respectively. In regression IV, we include the
23

Amihud measures, the turnover ratios, and trading infrequency to see if the estimates
differ significantly from the previous setups.
The results in table 3 are both intuitive and consistent with our expectations regarding
how illiquidities in the home and host markets are related to the ADR premium.
Regression I shows that the change in the ADR premium is negatively related to the
change in its Amihud measure, suggesting that the increase of the ADR’s illiquidity in
the U.S. market has an impact on reducing the ADR premium (i.e., reducing the ADR
price in relation to its home market counterpart). On the other hand, the relationship
between the ADR premium and the home share Amihud measure is not significant,
although it has the correct sign.16 The results in regression II are also consistent with our
main hypothesis, but the significance is somewhat marginal for the home share turnover.
Higher ADR turnover corresponds to higher liquidity, and thus a higher ADR premium.
In contrast, higher home share turnover corresponds to a lower ADR premium. As
expected, the signs of b1, b2 (in regression I and II) are opposite to the signs of b3, b4,
since the Amihud measure could be thought of as a scaled reciprocal of the volume
measures. In regression III, the inverse relationship between the ADR premium and the
trading infrequency is anticipated, since the latter is partially related to illiquidity. We
expect infrequently traded securities to be a subset of illiquid assets, although the two
dimensions are likely to offer different perspectives regarding the liquidity and
informational content of an asset. 16 Following the suggestion of Hasbrouck (2005), we also use the square root of the Amihud measures in
our regressions as a robustness check. The results are qualitatively the same as those when the simple
Amihud measure is used; therefore, we do not report those results in this paper.
24

Regression IV illustrates the full regression result of equation (6), with the Amihud
measures, the turnover ratios and the trading infrequency being used as explanatory
variables. Even though all three liquidity measures contain liquidity information, using
all of them in the same regression does not appear to diminish their respective individual
explanatory powers. This can be clearly seen from the similar levels of significance of the
estimates b1, b2, b3, b4, and b5 in regressions I - IV, respectively.
IV.C. Expectations about the future exchange rate and stock market movement
Since ADR investors are, in essence, U.S. (or more generally, global) investors interested
in taking a position in foreign stock markets, their expectations regarding future exchange
rate movements and future foreign stock market performance are potentially important
factors in ADR pricing.
If an investor owns an ADR of a firm from country A, she would get an additional benefit
if A’s currency appreciates against the U.S. dollar, everything else being equal. Thus,
she would be willing to pay a higher premium if she expects A’s currency to appreciate in
the future. (This argument presumes some transaction costs, currency restrictions or
other frictions that make it costly or difficult for the investor to speculate directly on A’s
exchange rate, since the ADR is an indirect and somewhat risky bet on the exchange rate.)
We use the most recent 1-month or 6-month exchange rate change as a proxy for such
expectations. Since our exchange rate is defined as the number of units of the foreign
25

currency per U.S. dollar, a positive exchange rate change indicates a depreciation of
foreign currency, while a negative change indicates appreciation. 17 Based on this
intuition, we should expect the coefficient of this variable to be negative. Similarly, if the
investor expects the stock market of country A to perform better in the future than the
U.S. market, she might be willing to pay a higher premium for an ADR from country A.
(Again, this presumes that other ways of placing this bet are costly or have significant
constraints attached to them.) We also use the most recent 1-month (or 6-month) stock
market performance as a proxy for such expectations, and include it in the regressions.18
We expect the estimated coefficient to be positive for the variable representing recent
foreign stock market performance, and to be negative for that of the recent US stock
market performance.
Regressions V and VI in table 3 report the results for the three expectation variables. The
1-month exchange rate change variable appears to have some explanatory power (with a
t-value of -1.704) on the change in the ADR’s premium. The 6-month exchange rate
change has much lower explanatory power, with a t-value of -0.553. Similarly, the 1-
17 We considered using the forward exchange rate, but decided not to, since by covered interest rate parity,
the forward exchange rate is the spot exchange rate adjusted by the interest rate differential. Hence, it is
not a market expectation variable, but simply an adjusted version of the spot exchange rate, given the
relative stability of the interest rate differential, from one month to the next. If market participants use any
type of extrapolation of past exchange rate changes in their forecast of the future exchange rate, our
variable should be a reasonable proxy of such a forecast. 18 A possible proxy for expectations about the future stock market performance would be the respective
forward rates/prices. However, given the relative stationarity of the interest rates, this would effectively be
a scaled version of the spot rate/price. A better alternative would be to assume that investors form their
expectations about changes in the future performance of the home stock market based on its past
performance.
26

month stock market return variable has a marginally stronger explanatory power than the
6-month variable. The 1-month home market return has a t-value of 5.25. On the other
hand, the 1-month US market return has a t-value of 3.84, but surprisingly with a sign
contradictory with our expectation. Since the dependent variable is the change in the
ADR premium from one month to the next, we suspect that the contemporaneous change
in the exchange rate and the stock market return provide more relevant information.
Thus, we observe a much stronger effect for the 1-month variables compared to the 6-
month variables.
More importantly, the qualitative results about the liquidity effects should not alter
significantly after the inclusion of these expectation variables. According to the results in
table 3, the coefficients remain as significant as before. This robustness
check is important because it shows that the liquidity effects remain strong after the
inclusion of the control variables.
1 2 3 4 5, , , , ,b b b b b$ $ $ $ $
From regressions IV, V and VI, it appears that liquidity in the host (i.e. ADR) market is
more important than liquidity in the home market. We suspect that the asymmetry of the
liquidity effects in both the host and home markets has to do with the fact that the
premium is largely determined by the investors in the U.S. market, rather than those in
the home market. Under normal conditions, investors in the U.S. market observe the
price of the underlying asset, and collectively determine the level of the premium
according to various factors they are faced with. It is also possible that home market
investors observe the ADR’s price in the U.S. market and then determine their demand
27

for the underlying asset, but we believe that it is to a lesser degree compared to investors
in the U.S. market doing the reverse. This argument is based on the presumption that the
bulk of the shares are typically held by investors in the home market, and most
information is revealed there, as well. Based on our analysis, liquidity is an important
factor in the pricing difference between the ADR and its home share. It is not surprising
that the ADR’s liquidity has stronger effects on its premium, since the latter is largely
determined by ADR investors, who care much more about the liquidity in the ADR
market rather than in the home market.
The findings are also economically significant. We find that the average premium of the
most liquid ADRs (the top decile in terms of the Amihud measure) is 1.53 percent higher
than the average premium of the most illiquid ones (bottom decile), with a t-statistic of
4.60. If the turnover ratio is used as the liquidity measure, the average premium of the
most liquid ADRs is 1.76 percent higher than the average premium of the most illiquid
ones, with a t-statistic of 5.45.
IV.D. Robustness Checks: Level Regressions
Using the change variables, our main conclusion of the results so far is that the liquidity
metrics, especially those of the ADR (the ADR’s Amihud measure, its turnover, and
trading infrequency), appear to have the strongest effects on the ADR’s premium. The
liquidity measures in the home market also have an impact on the premium, but only to a
less statistically significant extent, as measured by the respective t statistics. We argue in
28

subsection IV.A that estimating the ADR premium – liquidity relationship using change
variables is a better econometric model. In this subsection, we nevertheless carry out the
regressions of equation (5) using level variables, but along with the control variables as a
robustness check. Namely, we include ,i tZ , with elements such as firm size and a number
of country characteristics variables, which are relevant in determining the level of the
ADR premium. However, these variables are, to some extent, time invariant, and thus, do
not appear in the change regressions.
We report the results of level regressions in table 4. Regression I – IV involves only the
liquidity measures and the results are largely consistent with those in the change
regressions. All the liquidity measures, except for the ADR turnover ratio, have
significant coefficients with the right sign. The ADR turnover ratio is not significant,
although it also has the right sign.
Regression V and VI include the controls for expectations of exchange rate changes, and
the home and US market return. Again, we use the recent return as proxies for such
expectations. We use 1-month variables in regression V, and 6-month variables in
regression VI. In contrast to the change regressions, the 6-month variables seem to have
stronger explanatory power. In the change regressions, we show that the 1-month
variables help explain the monthly change in the ADR premium. It is probably not
surprising that the 6-month variables have stronger effects in the level regression since
the level of the ADR premium include the cumulative changes from previous months,
29

and thus the longer-period variables have stronger effects. In regressions VII and VIII,
we also use the 6-month variables as proxies.
We include the ADR size in regression VII. Size has been widely accepted as an
important factor in most asset pricing models. 19 Previous studies (e.g., Pastor and
Stambaugh (2003) and Acharya and Pedersen (2005)) also document a high correlation
between firm size and liquidity, which is also the case in our sample as reported in table 2.
To test whether our results in the previous sub-section are merely manifestations of the
size effect, we add the ADR size (market capitalization of the shares in ADR form) as an
additional independent variable and run the regressions once again. The results reported
in regression VII of table 4 shows that the liquidity effects do not disappear after the
ADR size is added to the regressions. Indeed, the coefficient estimates and t-values are
virtually unchanged from regression VI to VII.
IV.E. Robustness Checks: Country Characteristics
In this subsection, we control for a number of country-level characteristics to account for
the home country’s openness (as measured by intensity of capital controls, the
transparency and credibility of its accounting standards, the efficacy of its judicial system,
corporate governance variables such as anti-director rights), as well as its market
restrictions (measured by restrictions on short-sales constraints and stock ownership
concentration). On the one hand, firms from the emerging economies may have a larger
19 Indeed, many asset pricing models, such as that of Fama and French (1992), use size as a factor in
explaining cross-sectional returns.
30
ADR premium, since they often present high barriers for arbitrage trading between the
share and the ADR. On the other hand, these economies are also likely to have weaker
corporate governance and less efficient investor protection; therefore, international
investors might demand a discount on ADRs from these countries. Thus, the overall
effects of some of these country characteristics may not be clear.
First, the presence of short-sales restrictions in a country might explain the deviation of
ADR price from home share price. Bris et al. (2002) provides information on short-sales
restrictions (represented as 0 or 1) on most of the ADR-issuing countries in our dataset.
La Porta et al. (1998) shows that investors investing in a foreign country are usually
entitled a very different set of rights from those in their own markets. These rights
determine the level of investor protections and might therefore explain part of the ADR
premium. Among these variables, anti-director rights (AD) indicate how much a
country’s legal system favors minority shareholders, and takes a value between 0 and 5.
The quality of accounting standards (AS) is another variable, based on a proprietary
index published by the Centre for International Financial Analysis and Research. It rates
the countries’ disclosure coverage, by counting how many accounting items firms are
required to disclose, among 90 selected items. In addition to these variables, a more
comprehensive account of a country’s overall legal environment has been studied by
Berkowitz et al. (2000). They computed a legality index for most world economies by
incorporating the efficiency of their judiciary system, rule of law, corruption index, risk
of expropriation, and risk of contract repudiation. Overall, we consider these variables,
jointly, to provide an objective measure of a foreign market’s development.
31

Besides issues relating to market development, the ADR premium could be associated
with the corporate governance concerns of international investors. Foreign investors may
be concerned if the market is characterized by highly concentrated ownership,
particularly by domestic business groups with economic and political clout in the home
country. Again, La Porta et al (1998) provides a measure of the presence of such large
shareholders. It is the defined as the average percentage of common shares owned by the
three largest shareholders in the ten largest non-financial, privately-owned-domestic
firms in a given country. It is reasonable to expect a high ownership concentration could
be related positively to the ADR premium. We have included this variable in our cross-
sectional studies.
Even if a foreign market is highly developed and open, the securities market itself might
exhibit a high degree of firm-level informational asymmetry. Morck et al. (2000)
computed, for most countries under our studies, a synchronicity measure, which
corresponds to the adjusted R2 of regressing each stock’s return on its home market index
and U.S. market index. The higher is this measure, the lower is the extent that firm-
specific information contributes to stock price movements. Foreigners might refrain from
investing directly in a certain country’s shares, because the market is characterized by a
high degree of informational asymmetry. Therefore, we expect this measure to be
negatively related to ADR premium.
32

Finally, we use a simple measure of the intensity of capital controls, the Edison-Warnock
Restriction (EWR) measure, in our regression model. The measure, constructed by
Edison and Warnock (2003) is essentially the portion of the domestic shares that
foreigners may own, and is computed based on the market’s openness and the stock- and
industry-specific limitations.20 A value of 0 represents a completely open market and a
value of 1 means a completely closed market. Their study only covers emerging markets
from January 1989 to December 2000, but not the developed markets. Based on our
judgment, we assume a value of 0 for all the developed markets in our sample, since they
are likely to be all highly liberalized markets.21
Regression VIII in table 4 reports the regression result with the country variables. Since
most of the country variables are correlated with the level of development of the
country’s economy and its capital market, these variables (except for the short-sales
constraint variable) are highly correlated among each other. Including them together in
the same regression potentially creates a serious problem of multi-collinearity. To avoid
this problem, in regression VIII, the values of these variables are actually the residuals of
each variable regressed on the other country variables. The regression is also carried out
without the constant term as it appears that the country variable residuals are still highly
20 The market’s openness is based on the ability of foreigners to buy and sell shares and repatriate capital.
The stock- and industry-level openness measures are based on the industry and corporate by-laws, and
corporate charter limitations on foreign ownership. See Edison and Warnock (2003) for details about the
construction of this measure. 21 Given the value of the EWR measure is around 0.10 for some of the emerging markets, we believe that
the value should fall in between 0 and 0.10 for developed markets. Assuming a value of 0 for all developed
markets might introduce some bias. However, the bias appears to be minor since in a robustness test, we
also assume a EWR value of 0.05 or 0.10 for all developed markets and get similar results.
33

correlated with the constant term. With the inclusion of these variables, the liquidity
effects do not seem to disappear. The ADR Amihud measure, the ADR turnover ratio and
the home share turnover ratio still have significant explanatory power. However, the sign
of the trading infrequency, whose strength was weak even early, is reversed and
inconsistent with our hypothesis.22
In regression IX, we use country dummy variables as a catch-all variable for all country-
specific variables. In this regression, all liquidity measures have the right signs with the
home share turnover ratio and trading infrequency being significant at the 5% confidence
interval. The other liquidity measures are marginally significant. Essentially, this
“reduced form” representation of the country-specific openness and transparency
variables, through a dummy variable, reduces the problem of multi-collinearity leading to
a cleaner relationship between the premium and the liquidity variables.
V. Conclusion
Liquidity is generally viewed as a positive characteristic of a traded asset in positive net
supply. In this paper, we investigate the liquidity effect in asset pricing using a large
sample of ADRs. The ADR market is ideal for testing the liquidity effect, since it
consists of securities with cash flow rights that are identical to that of their counterparts
22 This may be due to the fact that in several emerging economies, which are not fully open or transparent,
the stocks of the major firms (that are usually the ones that are listed as ADRs) are actively traded, with low
levels of trading infrequency. Also, since they represent the larger firms in these countries, the frequency
of trading in the ADR market is usually high.
34

in the home market. The other aspect of the ADR market that makes it interesting for
such empirical testing is its size and growing importance in the context of global equity
markets, contributing in mid-2004 to about 5% of all trading value in the U.S. equity
markets.
In an integrated market without frictions and time zone differences, there should be no
premium or discount for the ADRs. In reality, financial markets are, to some extent,
segmented, and are affected by many market frictions such as international capital
controls, differences in taxes, security laws, and trading regimes, between the host and
home markets. In this paper, we focus mainly on the liquidity differences between the
two markets, and their effects on the pricing of an ADR in relation to its underlying share.
Consistent with the liquidity hypothesis, we find that an increase in the ADR premium is
associated with an increase in the liquidity in the ADR market. An increase in the
premium is also associated with a decrease in home share liquidity, albeit to a lesser
degree, compared to ADR liquidity. In the robustness check with level regressions, the
liquidity effects remain strong, even after we control for ADR market size, and investors’
expectations regarding future exchange rate movements, home stock market performance,
and various measures of country characteristics.
Our study has several implications for firms, regulators and investors. As firms from
more and more countries expand their investor base by listing in overseas markets,
particularly in New York, London and Singapore, the role of liquidity in the pricing of
their securities is bound to command attention. Our study has implications for the design
35

of depositary receipt programs, both American (ADR) and Global (GDR), since it
provides indirect clues regarding the optimal size of these offerings. A small size for an
ADR program in relation to its total amount outstanding may have large illiquidity effects.
By the same token, a large ADR program may cause the liquidity in the home market to
dry up. Caution must be exercised in ensuring that the amounts outstanding in the two
markets are well balanced.
An interesting question arises in the context of liquidity effects in dually listed securities,
in particular with regard to how liquidity is transferred from one market to another. This
also raises the possibility of arbitrage by forecasting movements in one market, based on
the price changes in the other, especially when there are differences in the time zones
where the two markets are situated. These effects are likely to be more significant for
firms from the emerging markets. We leave these questions to future research.
36

References
Alexander, Gordon, Cheol Eun, and S. Janakiramanan, 1988. International Listings and
Stock Returns: Some Empirical Evidence. Journal of Financial and Quantitative
Analysis 23, 135-151.
Allen, Franklin and Douglas Gale, 1994. Limited Market Participation and Volatility of
Asset Prices. American Economic Review 84, 933-955.
Acharya, Viral V. and Lasse Heje Pedersen, 2005. Asset Pricing with Liquidity Risk.
Journal of Financial Economics 77, 375-410.
Amihud, Yakov, 2002. Illiquidity and Stock Returns: Cross-section and Time Series
Effects. Journal of Financial Markets 5, 31-56.
Amihud, Yakov, Haim Mendelson, 1986. Asset Pricing and the Bid-ask Spread. Journal
of Financial Economics 17, 223-249.
Amihud, Yakov and Haim Mendelson, 1991. Liquidity, Maturity and the Yields on U.S.
Maturity Securities. Journal of Finance 46, 1411-1425.
37

Amihud, Yakov, Haim Mendelson, and Beni Lauterbach, 1997. Market Microstructure
and Securities Values: Evidence from the Tel Aviv Exchange. Journal of Financial
Economics 45, 365-390.
Amihud, Yakov, Haim Mendelson, and Lasse Pedersen, 2005. Liquidity and Asset Prices.
Foundations and Trends in Finance 1, 269-364.
Bailey, Warren, Andrew G. Karolyi, and C. Salva, 2005, The Economic Consequences of
Increased Disclosure Evidence from International Crosslistings, forthcoming in the
Journal of Financial Economics.
Berkowitz, Daniel, Katharina Pistor, and Jean-Francois Richard, 2000, Economic
Development, Legality, and the Transplant Effect, University of Michigan Working
Paper No. 308.
Blouin, Jennifer L., Luzi Hail, and Michelle Yetman, 2005. Capital Gains Taxes, Pricing
Spreads and Arbitrage: Evidence from U.S. Cross-Listed Firms. European Finance
Association 2005 Moscow Meetings Paper.
Boudoukh, Jacob and Robert F. Whitelaw, 1993. Liquidity as a Choice Variable: a
Lesson from the Japanese Government Bond Market. Review of Financial Studies 6, 265-
292.
38

Brennan, Michael J., Tarun Chordia and Avanindhar Subrahmanyam, 1998. Alternative
Factors Specifications, Security Characteristics, and the Cross-section of Expected Stock
Returns, Journal of Financial Economics 49, 345-373.
Brennan, Michael J., and Avanindhar Subrahmanyam, 1996. Market Microstructure and
Asset Pricing: on the Compensation for Illiquidity in Stock Returns, Journal of Financial
Economics 41, 441-464.
Bris, Arturo, William N. Goetzmann, and Ning Zhu, 2004. Efficiency and the Bear: Short
Sales and Market Around the World, Yale ICF Working Paper No. 02-45.
Chakravarty, Sugato, Asani Sarkar and Lifan Wu, 1998. Information Asymmetry, Market
Segmentation and the Pricing of Cross-Listed Shares: Theory and Evidence from Chinese
A and B Shares. Journal of International Financial Markets, Institutions and Money 8,
325-355.
Chalmers, John M.R., and Gregory B. Kadlec, 1998. An Empirical Examination of the
Amortized Spread, Journal of Financial Economics 48, 159-188.
Chordia, Tarun, Richard Roll and Avanidhar Subrahmanyam, 2000. Commonality in
Liquidity. Journal of Financial Economics 56, 3-28.
39

Chordia, Tarun, Avanidhar Subrahmanyam, and Ravi Anshuman, 2001. Trading Activity
and Expected Stock Returns. Journal of Financial Economics 59, 3-32.
Constantinides, George, 1986. Capital Market Equilibrium with Transaction Costs.
Journal of Political Economy 94, 842-862.
Cooper, S. Kerry, John C. Groth and W.E. Avera, 1985. Liquidity, Exchange Listing and
Common Stock Performance. Journal of Economics and Business 37, 19-33.
Dabora, Emil, and Kenneth A. Froot, 1999. How are Stock Prices Affected by the
Location of Trade? Journal of Financial Economics 53, 189-217.
Datar, Vinay T., Narayan Y. Naik, and Robert Radcliffe, 1998. Liquidity and Stock
Returns: An Alternative Test. Journal of Financial Markets 1, 203-219.
De Jong, Abe, Leonard Rosenthal and Mathijs A. Van Dijk, 2004. The Limits of
Arbitrage: Evidence from Dual-Listed Companies. European Finance Association 2004
Maastricht Meetings Paper.
Doidge, Craig, Andrew G. Karolyi, and Rene Stulz, 2004. Why Are Foreign Firms That
List in the U.S. Worth More? Journal of Financial Economics 71(2), 205-238.
40

Easley, David, Soeren Hvidkjaer, and Maureen O’Hara, 2002. Is Information Risk a
Determinant of Asset Returns? Journal of Finance 57, 2185-2221.
Edison, Hali J., and Francis E. Warnock, 2003. A Simple Measure of the Intensity of
Capital Controls. Journal of Empirical Finance 10, 81-103.
Eun, Cheol S. and Sanjiv Sabherwal, 2002. Forecasting Exchange Rates: Do Banks
Know Better? Global Finance Journal 13, 195-215.
Fama, Eugene F., and Kenneth R. French, 1992. The Cross-section of Expected Stock
returns. Journal of Finance 47, 427-465.
Foerster, Stephen R., and Andrew Karolyi, 1999. The Effects of Market Segmentation
and Investor Recognition on Asset Prices: Evidence from Foreign Stocks Listing in the
United States. Journal of Finance 54, 981-1013.
Gagnon, Louis and Andrew Karolyi, 2003. Multi-market Trading and Arbitrage. Working
paper, Ohio State University.
Grammig, Joachim, Michael Melvin, and Christian Schlag, 2001. Price Discovery in
International Equity Trading. Working Paper, Catholique de Louvain – Center for
Operations Research and Economics.
41

Grammig, Joachim, Michael Melvin, and Christian Schlag, 2005. Internationally Cross-
listed Stock Prices During Overlapping Trading Hours: Price Discovery and Exchange
Rate Effects. Journal of Empirical Finance 12, 139-165.
Hasbrouck, Joel, 2005. Trading Costs and Returns for US Equities: The Evidence from
Daily Data. Working paper, New York University.
Jain, Ravi, Yihong Xia, and Matthew Q. Wu, 2004. Illiquidity and Closed-end Country
Fund Discounts. Working paper, University of Pennsylvania.
Kadlec, Gregory and John McConnell, 1994. The Effect of Market Segmentation and
Illiquidity on Asset Prices: Evidence from Exchange Listings. Journal of Finance 49,
611-636.
Karolyi, Andrew and Lianfa Li, 2003. A Resolution of the Chinese Discount Puzzle.
Working Paper, Ohio State University.
Karolyi, Andrew, 2004. The Role of ADRs in the Development of Emerging Equity
Markets. Review of Economics and Statistics 86(3), 670-690.
Kato, Kiyoshi, Scott Linn, and James Schallheim, 1991. Are There Arbitrage
Opportunities in the Market for American Depositary Receipts? Journal of International
Financial Markets, Institutions and Money 1, 73-89.
42

Kyle, Albert S., 1985. Continuous Auctions and Insider Trading. Econometrica 53, 1315-
1335.
La Porta, Rafael, Florencio Lopez-de-Silanes, Andrei Shleifer, and Robert W. Vishny,
1998. Law and Finance, Journal of Political Economy 106, vol. 6, 1113-1155.
Menkveld, Albert J., S. J. Koopman and Andre Lucas, 2003. Round-the-Clock Price
Discovery for Cross-Listed Stocks: U.S.-Dutch Evidence. European Finance Association
2003 Glasgow Meetings Paper.
Miller, Darius P., and Matthew R. Morey, 1996. The Intraday Pricing Behavior of
International Dually Listed Securities. Journal of International Financial Markets,
Institutions and Money 6, 79-89.
Morck, Randall, Bernard Yeung, and Wayne Yu, 2000. The Information Content of
Stock Markets: Why Do Emerging Markets have Synchronous Stock Price Movements?
Journal of Financial Economics 58, 215-260.
Park, Jinwoo, and Amir Tavakkol, 1994. Are ADRs a Dollar Translation of Their
Underlying Securities? The Case of Japanese ADRs. Journal of International Financial
Markets, Institutions and Money 4, 77-87.
43

Pastor, Lubos, and Robert F. Stambaugh, 2003. Liquidity risk and expected stock returns.
Journal of Political Economy 111, 642-685.
Petersen, Mitchell, 2005. Estimating Standard Errors in Finance Panel Data Sets:
Comparing Approaches. Working paper, Kellogg School of Management, Northwestern
University and NBER.
Rosenthal, Leonard, and Leonard Cohn Young, 1990. The Seemingly Anomalous Price
Behavior of Royal Dutch / Shell and Unilever N. V. / PLC. Journal of Financial
Economics 26, 123-142.
Silber, William, 1991. Discounts on Restricted Stocks: The Impact of Illiquidity on Stock
Prices. Financial Analyst Journal 47, 60-64.
Suh, Terry Jungwon, 2003. ADRs and U.S. Market Sentiment. Journal of Investing 12,
87-95.
Vayanos, Dimitri, 1998. Transaction Costs and Asset Prices: A Dynamic Equilibrium
Model. Review of Financial Studies 11, 1-58.
Wahab, Mahmoud, Malei Lashgari, and Richard Cohn, 1992. Arbitrage Opportunities in
the American Depositary Receipts Market Revisited. Journal of International Financial
Markets, Institutions and Money 2, 97-130.
44

Country Total Average Median Mean Median MeanUK 92 35 3410 8743 0.36 -0.76France 29 12 6772 12488 -0.02 -0.12Germany 24 6 8465 12798 0.04 -0.44Netherlands 13 5 7843 9251 -10.54 -11.81Italy 11 5 6995 11371 0.06 5.40Sweden 8 4 3210 5970 0.04 0.13Switzerland 11 5 4954 11298 -0.18 -0.26Ireland 10 5 1968 2673 0.51 0.89Spain 6 4 38603 41312 -0.26 -0.02Israel 6 5 397 570 7.10 7.09Norway 7 3 3610 4701 -0.26 -0.79Finland 5 2 2734 11268 0.14 0.17Japan 32 24 9047 14925 -0.04 4.07HK 23 8 4609 7479 -0.15 -0.37Korea 9 3 11164 10644 6.72 4.54India 10 6 5014 6541 21.53 25.48Taiwan 10 3 7286 10364 6.93 11.14Australia 24 11 2479 4397 -0.13 -6.45Mexico 18 7 1223 3026 -0.15 0.25Chile 17 10 853 1428 2.03 2.03Brazil 12 5 840 1523 -2.44 -17.90Argentina 10 7 2482 3558 -0.73 -0.14South Africa 14 6 1007 1674 0.24 1.40
All 401 183 3173 8512 -0.01 1.13
Table 1: Summary Statistics: January 1981 - December 2003
# of ADRs
45
Average MV (Million) Average Premium (%)
This table reports the number, the average market capitalization and the premium statistics for the ADRs of each country included in the study. The data are obtained from two sources: the ADR data are obtained from CRSP; the home share data are obtained from Datastream. The sample includes 401 pairs of ADR and corresponding underlying shares in the home market from 23 countries, from January 1981 to December 2003. Column 1 reports the total number of ADRs included in the study for each country. Column 2 reports the average number of ADRs in each month. The next four columns refer to the central tendencies of the monthly market capitalization (MV) and the premium, for each country, using the average of daily observations. The 4rd (5th) column of the table represents the average of each country’s monthly median (mean) MV in millions of US dollar throughout the sample period. The 6th (7th) column is the average of each country’s monthly median (mean) premium in percentage throughout the sample period.

Mean Median Std Max MinHome Share Amihud Measure 0.0332 0.0002 0.1730 1.9724 0.0000Home Share Turnover 0.0093 0.0022 0.0772 1.0311 0.0001ADR Amihud Measure 0.0719 0.0052 0.2617 2.4288 0.0000ADR Turnover 0.0137 0.0052 0.0510 0.6280 0.0003ADR Trading Infrequency 0.1147 0.0336 0.1724 0.8202 0.0180
HS Amihud HS Turnover HS SizeHome Share Amihud Measure 1 -0.0081 -0.4139Home Share Turnover - 1 -0.2776Home Share Size - - 1
ADR Amihud ADR Turnover ADR Size ADR TIADR Amihud Measure 1 -0.0344 -0.4662 0.4688ADR Turnover - 1 -0.1869 0.0077ADR Size - - 1 -0.5614ADR Trading Infrequency - - - 1
Panel A
46
Table 2: Liquidity and Turnover Characcteristics of ADRs and their Underlying Securities
Panel B: Correlations
This table provides the basic statistics of the liquidity and turnover characteristics of ADRs’ and their underlying securities. The data are obtained from two sources: ADR data are obtained from CRSP; home share data are obtained from Datastream. The sample includes 401 pairs of ADR and corresponding underlying shares in the home market from 23 countries. Individual ADRs and home shares’ Amihud (2002) liquidity measures are defined as the ratio of absolute daily return and dollar volume, and are scaled by 1000. Daily measures are then averaged to provide monthly series of the ADRs in our study. Turnover is defined to be number of shares traded divided by the total number of shares outstanding. Trading infrequency is obtained by dividing the number of days that the ADR is not traded by the number of trading days in a given month. Panel A provides the time series averages of the monthly cross-sectional mean, median, standard deviation, maximum and minimum values. Panel B provides the time series averages of the monthly correlations among the liquidity measures and size.
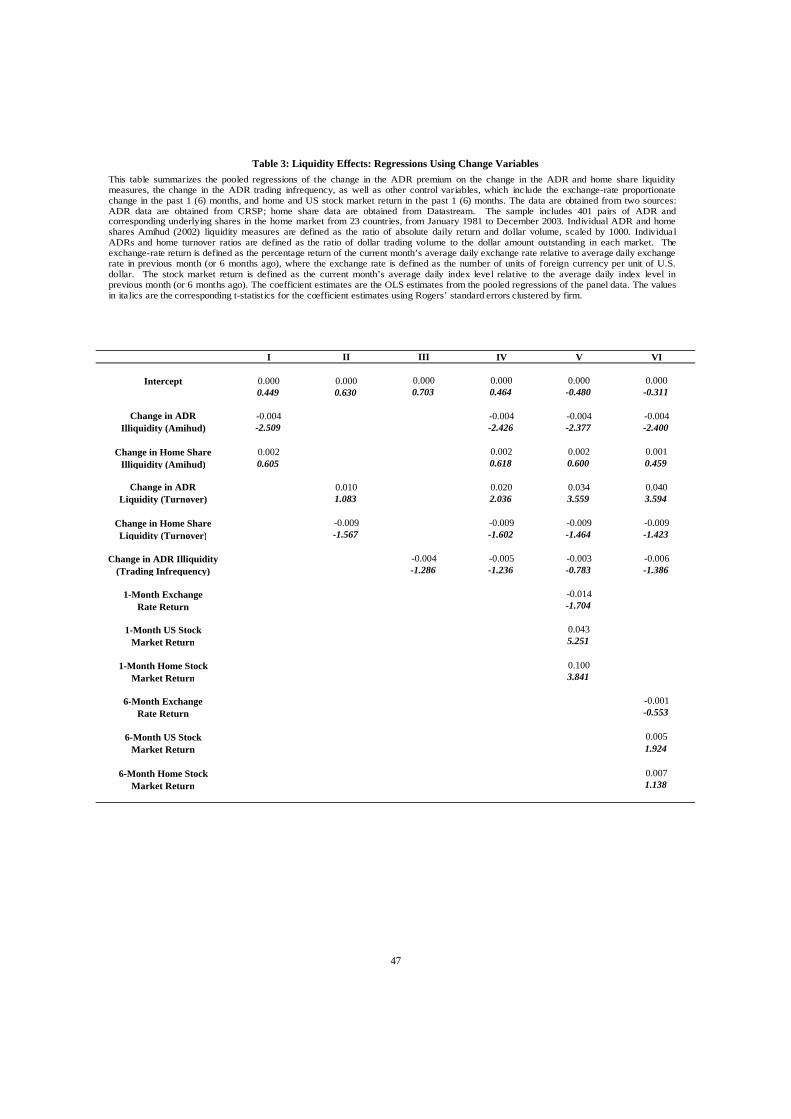
I II III IV V VI
0.000 0.000 0.000 0.000 0.000 0.0000.449 0.630 0.703 0.464 -0.480 -0.311
-0.004 -0.004 -0.004 -0.004-2.509 -2.426 -2.377 -2.400
0.002 0.002 0.002 0.0010.605 0.618 0.600 0.459
0.010 0.020 0.034 0.0401.083 2.036 3.559 3.594
-0.009 -0.009 -0.009 -0.009-1.567 -1.602 -1.464 -1.423
-0.004 -0.005 -0.003 -0.006-1.286 -1.236 -0.783 -1.386
-0.014-1.704
0.0435.251
0.1003.841
-0.001-0.553
0.0051.924
0.0071.138
1-Month Home Stock Market Return
6-Month US Stock Market Return
Change in Home Share Liquidity (Turnover)
Change in ADR Liquidity (Turnover)
Table 3: Liquidity Effects: Regressions Using Change Variables
Intercept
Change in ADR Illiquidity (Amihud)
47
6-Month ExchangeRate Return
6-Month Home Stock Market Return
Change in Home Share Illiquidity (Amihud)
Change in ADR Illiquidity(Trading Infrequency)
1-Month ExchangeRate Return
1-Month US StockMarket Return
This table summarizes the pooled regressions of the change in the ADR premium on the change in the ADR and home share liquidity measures, the change in the ADR trading infrequency, as well as other control variables, which include the exchange-rate proportionate change in the past 1 (6) months, and home and US stock market return in the past 1 (6) months. The data are obtained from two sources: ADR data are obtained from CRSP; home share data are obtained from Datastream. The sample includes 401 pairs of ADR and corresponding underlying shares in the home market from 23 countries, from January 1981 to December 2003. Individual ADR and home shares Amihud (2002) liquidity measures are defined as the ratio of absolute daily return and dollar volume, scaled by 1000. Individual ADRs and home turnover ratios are defined as the ratio of dollar trading volume to the dollar amount outstanding in each market. The exchange-rate return is defined as the percentage return of the current month’s average daily exchange rate relative to average daily exchange rate in previous month (or 6 months ago), where the exchange rate is defined as the number of units of foreign currency per unit of U.S. dollar. The stock market return is defined as the current month’s average daily index level relative to the average daily index level in previous month (or 6 months ago). The coefficient estimates are the OLS estimates from the pooled regressions of the panel data. The values in italics are the corresponding t-statistics for the coefficient estimates using Rogers’ standard errors clustered by firm.

I II III IV V VI VII VIII IX
0.003 0.002 0.001 0.004 0.002 0.001 0.015 0.0025.239 3.961 1.779 6.613 3.461 1.974 3.181 3.085
-0.006 -0.004 -0.003 -0.003 -0.003 -0.004 -0.003-2.948 -2.142 -1.993 -1.672 -2.098 -2.270 -1.862
0.007 0.008 0.008 0.006 0.006 0.003 0.0032.679 2.991 2.857 2.316 2.203 0.822 1.357
0.050 0.051 0.151 0.190 0.188 0.045 0.0511.533 1.528 4.952 6.398 6.370 4.346 1.558
-0.045 -0.046 -0.047 -0.037 -0.037 -0.037 -0.023-2.729 -2.747 -2.713 -2.327 -2.326 -2.275 -2.190
-0.012 -0.012 -0.005 -0.007 -0.011 0.001 -0.011-6.364 -5.112 -2.637 -3.243 -5.314 0.796 -4.288
-0.017 -0.009 -0.009 -0.007-0.913 -1.686 -1.604 -0.402
0.033 0.025 0.025 0.0482.848 4.899 4.856 1.504
-0.017 -0.014 -0.014 0.023-0.323 -1.102 -1.107 0.631
-0.001 0.002 0.000-2.719 6.287 7.287
-0.039-7.372
0.0154.067
0.0032.085
-0.006-1.005
-0.180-3.427
0.1120.639
0.1000.931
48
1- (or 6-) Month Exchange Rate Return
Table 4: Robustness Check: Regressions Using Level Variables
Accounting Standard
ADR Liquidity (Turnover)
Intercept
ADR Illiquidity (Amihud)
Home Share Illiquidity (Amihud)
Home Share Liquidity (Turnover)
ADR Illiquidity(Trading Infrequency)
Legality Index
1- (or 6-) Month US Stock Market Return
1- (or 6-) Month HomeStock Market Return
Log(ADR size)
Ownership Concentration
Short-sell Constraint
Synchronicity withUS Market
EWR
Anti-director Rights
This table summarizes the pooled regressions of the ADR premium on the liquidity measures of ADR, home share and the home market. The liquidity measures include the Amihud (2002) liquidity measure, the turnover ratio and the ADR trading infrequency. The regressions include other control variables, such as ADR size, the exchange-rate proportionate changes in the past 1 (6) months, and home and US stock market return in the past 1 (6) months. The control variables also include country characteristics variables such as short-sales constraints, the legality index, accounting standards, anti-director rights, ownership concentration, synchronicity with the US market and the EWR measure of capital control intensity. The data are obtained from multiple sources: ADR data are obtained from CRSP; home share data are obtained from Datastream. Short-sales constraint variables are presented as 0 or 1 for each country, taken from Bris, Goetzmann, and Zhu (2004). The legality index is obtained from Berkowitz et al (2000). Accounting standard, anti-director rights, and ownership concentration data are collected from La Porta et al (1998). Synchronicity with US market is adopted from Morck et al (2000). The EWR variable is a country’s openness measure developed by Edison and Warnock (2003). The sample includes 401 pairs of ADR and corresponding underlying shares in the home market from 23 countries, from January 1981 to December 2003. Individual ADR and home shares’ Amihud (2002) liquidity measures are defined as the ratio of absolute daily return and dollar volume, and are scaled by 1000. Individual ADR and home share turnover ratios are defined as the ratio of dollar trading volume to the dollar amount outstanding in each market. The exchange-rate return is defined as the percentage return of the current month’s average daily exchange rate, relative to average daily exchange rate in previous month (or 6 months ago), where the exchange rate is defined as the number of units of foreign currency per unit of U.S. dollar. The home stock market return is defined as the current month’s average daily index level relative to the average daily index level in the previous month (or 6 months ago). The values in italics are the corresponding t-statistics for the coefficient estimates. Regression V uses the 1-month exchange rate return and stock market return. Regressions VI, VII and VIII use the 6-month exchange rate return and stock market return.