a tale of two herbig ae stars, mwc 275 and ab...
TRANSCRIPT

A TALE OF TWO HERBIG Ae STARS, MWC 275 AND AB AURIGAE: COMPREHENSIVE MODELSFOR SPECTRAL ENERGY DISTRIBUTION AND INTERFEROMETRY
A. Tannirkulam,1J. D. Monnier,
1T. J. Harries,
2R. Millan-Gabet,
3Z. Zhu,
1E. Pedretti,
4M. Ireland,
5
P. Tuthill,5T. ten Brummelaar,
6H. McAlister,
6C. Farrington,
6P. J. Goldfinger,
6
J. Sturmann,6L. Sturmann,
6and N. Turner
6
Received 2008 May 19; accepted 2008 August 8
ABSTRACT
We present comprehensive models for the Herbig Ae stars MWC 275 and ABAur that aim to explain their spectralenergy distribution (from UV to millimeter) and long-baseline interferometry (from near-infrared to millimeter) si-multaneously. Data from the literature, combined with newmid-infrared (MIR) interferometry from the Keck SegmentTilting Experiment, are modeled using an axisymmetric Monte Carlo radiative transfer code. Models in which mostof the near-infrared (NIR) emission arises from a dust rim fail to fit the NIR spectral energy distribution (SED) andsub-milliarcsecond NIR CHARA interferometry. Following recent work, we include an additional gas emission com-ponent with similar size scale to the dust rim, inside the sublimation radius, to fit the NIR SED and long-baseline NIRinterferometry on MWC 275 and AB Aur. In the absence of shielding of starlight by gas, we show that the gas-dusttransition region in these YSOs will have to contain highly refractory dust, sublimating at ~1850 K. Despite havingnearly identical structure in the thermal NIR, the outer disks of MWC 275 and ABAur differ substantially. In contrastto the AB Aur disk, MWC 275 lacks small grains in the disk atmosphere capable of producing significant 10Y20 �memission beyond ~7 AU, forcing the outer regions into the ‘‘shadow’’ of the inner disk.
Subject headinggs: circumstellar matter — planetary systems: protoplanetary disks — radiative transfer —stars: preYmain-sequence — techniques: interferometric
Online material: color figure
1. INTRODUCTION
Herbig Ae (HAe) stars are preYmain-sequence stars of inter-mediate mass (1.5Y3M�). They exhibit a robust excess in emis-sion over stellar photospheric values from near-infrared (NIR) tothe millimeter wavelengths. This excess is now attributed to thepassive reprocessing of stellar light by dust in the circumstellarenvironment (Tuthill et al. 2001; Natta et al. 2001; Dullemondet al. 2001). The geometry of the circumstellar environment ofHAe stars has been actively debated in the astronomy commu-nity over the last two decades. Some of the early workers in thisfield (Hillenbrand et al. 1992) showed that the spectral energy dis-tribution (SED) of HAe stars could be explained by emission fromcircumstellarmatter in disklike geometry. Others (Miroshnichenkoet al. 1997) argued that the emission could also arise from dust ina spherical geometry around the star, proving the inadequacy ofSED modeling alone in uniquely fixing the geometry of the cir-cumstellar matter. The first observational evidence in favor of adisk geometry came from millimeter interferometry in the formof asymmetries detected (Mannings & Sargent 1997) in the mil-limeter images. Asymmetries in the NIR emission were also de-tected by the Palomar Test-Bed Interferometer (PTI; Eisner et al.2003, 2004), settling the debate in support of a disk geometry forcircumstellar material in Herbig Ae stars.
Most interferometric studies of HAe stars have relied on sim-ple geometric models (Mannings & Sargent 1997; Millan-Gabet
et al. 1999, 2001; Eisner et al. 2003, 2004; Monnier et al. 2005)that explain the emission geometry of the system in only narrowwavelength ranges. This method, albeit extremely useful in elu-cidating some of the morphology details, is not adequate for ex-ploring the interdependency in structure of the inner and outerparts of the disk. A number of studies (Dullemond et al. 2001;Dullemond & Dominik 2004; van Boekel et al. 2005a) haveshown that the structure of the inner disk at fractions of an AUscale clearly affects the structure of the outer disk. A completeunderstanding of the circumstellar disk structure in HAe starstherefore requires models that simultaneously explain the SEDand interferometry over a large wavelength range. Such modelshave begun to appear in the literature only recently (Pontoppidanet al. 2007; Kraus et al. 2008).
In this paper, we develop comprehensive disk models to ex-plain the SED and interferometry of the HAe stars MWC 275 andABAur.MWC275 and ABAur are prototype preYmain-sequencestars of similar ages and spectral type with extensive circumstellardisks. Due to the availability of photometric and interferometricdata over a large wavelength range, MWC 275 and AB Aur areideal candidates for testing disk models for young stellar objects(YSOs). The extent of their circumstellar-dust disks was firstmeasured byMannings & Sargent (1997) to be several hundredAU using the Owens Valley Radio Observatory (OWRO). Nattaet al. (2004) resolved the MWC 275 disk in the millimeter rangeand reported a de-convolved, projected dust-disk size of 300 AU ;180 AU.More recently, Isella et al. (2007) analyzed IRAM, SMA,and VLA continuum and 12CO, 13CO, and 18CO line data con-straining the gas-disk radius to be 540AUwith the gas in Keplerianrotation around the central star. Scattered light studies of MWC275(Grady et al. 2000) andABAur (Grady et al. 1999; Oppenheimeret al. 2008) show the presence of arcs and rings in the circumstel-lar disk. Corder et al. (2005) resolved the ABAur CO disk radiusto be �600 AU, finding strong evidence for Keplerian rotation
1 University of Michigan, Astronomy Department, 500 Church Street, 1017Dennison Building, Ann Arbor, MI 48109-1042; [email protected].
2 University of Exeter, School of Physics, Stocker Road, Exeter, EX4 4QL,UK.
3 Michelson Science Center, Pasadena, CA 91125.4 University of St. Andrews, Scotland, UK.5 School of Physics, Sydney University, NSW 2006, Australia.6 CHARA, Georgia State University, Atlanta, GA 30302-3969.
A
513
The Astrophysical Journal, 689:513Y531, 2008 December 10
# 2008. The American Astronomical Society. All rights reserved. Printed in U.S.A.

for the bulk of the disk. Corder et al. (2005) and Lin et al. (2006)detected spiral arms in CO emission with radii of �150 AU,while Fukagawa et al. (2004) detected similar structure in SubaruH-band scattered light images. AB Aur also has substantial en-velope material on scales larger then 600 AU (Grady et al. 1999;Semenov et al. 2005; Corder et al. 2005; Lin et al. 2006).
MIR emission probes giant planet formation region in cir-cumstellar disks (Calvet et al. 1992; Chiang & Goldreich 1997;Dullemond et al. 2001) with the emission arising fromwarm dust(T > 150 K). Meeus et al. (2001) and van Boekel et al. (2005b)used the 10 �m MIR silicate emission feature from MWC 275and AB Aur to show that dust grains in these systems had grownlarger than the typical interstellar medium grain sizes. Marinaset al. (2006) imaged ABAur at 11.7 �m and found the emissionFWHM size to be 17� 4 AU, consistent with the flared diskmodels of Dullemond&Dominik (2004). In this paper, we pre-sent new 10 �m measurements of AB Aur and MWC 275 withthe Keck Segment Tilting Experiment (Monnier et al. 2004; de-scribed in our x 2). In contrast to AB Aur, the MWC 275 disk isunresolved by the Segment Tilting Experiment (maximum base-line of 10 m), requiring the VLT Interferometer (100 m baseline)to probe its MIR structure (Leinert et al. 2004). These observa-tions suggest that MWC 275 disk differs considerably fromAB Aur, and we present a detailed comparison of the two diskstructures in the discussion (x 6).
Thermal NIR emission probes hot regions (typically the innerAU) of the disk with temperatures greater than 700 K. The NIRdisks of MWC 275 and ABAur were first resolved with InfraredOptical Telescope Array ( IOTA) by Millan-Gabet et al. (1999,2001) and subsequently observed at higher resolution with PTI(Eisner et al. 2004), Keck Interferometer (Monnier et al. 2005),and theCenter forHighAnglular ResolutionAstronomy (CHARA)interferometer array (Tannirkulam et al. 2008). In Tannirkulamet al. (2008, hereafter T08), we showed that inner-disk models inwhich the majority of the K-band emission arises in a dust rim(Dullemond et al. 2001; Isella & Natta 2005; Tannirkulam et al.2007) fail to fit the CHARA data at milliarcsecond resolution.We also demonstrated that the presence of additional NIR emis-sion (presumably from hot gas) inside the dust destruction radiuscan help explain the CHARA data and the NIR SED. First calcu-lations for the effects of gas on rim structure (Muzerolle et al.2004) showed that for plausible disk parameters, the presenceof gas does not modify dust-rim geometry significantly. Besidesa poorly understood interferometric visibility profile, MWC 275also displays as yet ill-understood NIR and MIR SED time vari-ability (Sitko et al. 2008), which has been interpreted as variationof the inner disk structure. In xx 4 and 5we present a detailed anal-ysis of the NIR visibility and SED for MWC 275 and AB Aur,placing constraints on the wavelength dependence of the opacitysource inside the dust destruction radius.
In this study, we focus on (1) explaining the inner-disk struc-ture and discussing important open problems and (2) modelingthe MIR emission morphology of the disks and the shape of theMIR spectrum. The paper is organized into seven sections, withx 2 detailing the observations. Section 3 explains the disk modeland the modeling strategy. Sections 4 and 5 analyze MWC 275and AB Aur SED and visibilities in relation to the disk models.We present a discussion on our results and our conclusions inxx 6 and 7, respectively.
2. NEW OBSERVATIONS AND LITERATURE DATA
The properties of the circumstellar disks in MWC 275 andAB Aur have been constrained using infrared and millimeterinterferometry and SEDs. We include new NIR interferometry
from the CHARA array, MIR interferometry from the Keck Seg-ment Tilting Experiment, and millimeter interferometry from theliterature in our analysis. Optical and NIR photometry obtainedat the MDM Observatories, and mid- and far-infrared data fromISO are also included to constrain model SED. We describe thedata in detail in the following paragraphs.K-band (central wavelength of 2.13 �m, �k 0.3 �m) inter-
ferometry on MWC 275 and AB Aur, first presented in T08, wasobtained using the CHARA array with the two-beam CHARA‘‘Classic’’ combiner at the back end (ten Brummelaar et al. 2005).The targets were observed with multiple baselines of CHARA ata variety of orientations in eight runs between 2004 June and2007 June. The longest baseline observation was 325 m (resolu-tion7 of 0.67 mas) for MWC 275 and 320 m (resolution of 0.68mas) for ABAur. The data were reduced using standard CHARAreduction software (ten Brummelaar et al. 2005) and these resultswere cross-checked with an independent code developed at Uni-versity of Michigan. HD 164031, HD 166295, and HD 156365,with uniform-disk (UD) diameters of 0:83� 0:08 mas, 1:274 �0:018mas, and 0:44� 0:06mas (Merand et al. [2005] and getCal8),were used as calibrators for MWC 275. AB Aur visibilities werecalibratedwithHD29645 (UDdiameter 0:54� 0:07mas, getCal)and HD 31233 (UD diameter 0:76� 0:13 mas, getCal). Duringthe reduction procedure the flux ratios between the two interfer-ometer telescopes were carefully monitored for the source andthe calibrators. Data points having a flux ratio variation greaterthan 10% of the mean, indicating large changes in instrumentalignment, were discarded. Three MWC 275 data points wereremoved by this criterion. The procedure was adopted to mini-mize calibration errors caused by differences in beam overlap inthe source and calibrator. The relative visibility errors, which in-clude calibration errors, statistics, and uncertainties in calibratorsize, are at the�6% level, typical for CHARA Classic. In T08,we showed the reduced data briefly in the form of visibilityinterferometric-baseline plots. Here we present the complete ob-serving logs with the uv coverage (see Figs. 1 and 2) and thecalibrated visibilities listed in Tables 1 and 2. NIR interferometryfrom IOTA (Monnier et al. 2006), PTI (Eisner et al. 2003, 2004),and the Keck Interferometer (Monnier et al. 2005) have alsobeen included to constrain the models.MWC 275 and ABAur were observed with the Keck Segment
Tilting Experiment (Monnier et al. 2004; Weiner et al. 2006)to study their MIR emission morphology. Four subsets of Keckprimary mirror segments were repointed and rephased so as toachieve four separate sparse aperture Fizeau interferometers,each with a separate pointing origin on the LWS detector (Jones& Puetter 1993). The details of the experiment and the data re-duction procedure are provided inMonnier et al. (2004) and J. D.Monnier et al. (2008, in preparation). The calibrated data are listedin Table 3. In addition to the Keck Segment Tilting data, we alsoinclude MWC 275 MIR interferometry from the Mid-Infraredinterferometric instrument for the Very Large Telescope Interfer-ometer (VLTI MIDI; Leinert et al. 2004) in our analysis.Millimeter interferometry from Mannings & Sargent (1997),
Natta et al. (2004), Semenov et al. (2005), Lin et al. (2006), andIsella et al. (2007) are used to constrain the circumstellar diskmasses and disk sizes and surface density profile. In conjunctionwith the interferometry, the shape of the millimeter SED providesinformation on sizes of the dust grains in the bulk of the circum-stellar disks.
7 Resolution is defined as k/2D, where k is wavelength of observation andDis the interferometer baseline length.
8 See http://mscweb.ipac.caltech.edu /gcWeb/gcWeb.jsp.
TANNIRKULAM ET AL.514 Vol. 689

To constrain the SED computed from radiative transfer mod-els we obtained optical and NIR photometry on MWC 275 andAB Aur with the MDM 2.4 m telescope at Kitt Peak. Due to thehigh brightness of our targets, we defocussed the telescope dur-ing observations to avoid camera saturation. After bias correction,flat fielding, and background subtraction, the reduced imageswere used to obtain source counts using ATV, an aperture pho-tometry code (Barth 2001). Targets were calibrated using Landoldtstandards (Landolt 1983). The calibrated UBVRIJHK photom-etry are listed in Tables 10 and 11 in the Appendix. We also in-clude photometry for a number of other YSOs that we observed.NIR photometry from Sitko et al. (2008), mid- and far-IR SEDfrom Meeus et al. (2001), and millimeter fluxes (Mannings &Sargent 1997; Natta et al. 2004; Semenov et al. 2005; Lin et al.2006) were also used in the model analysis. Van Boekel et al.(2005b)modeled the 10�m spectra of a large sample of Herbig Aestars and derived the mineralogy and typical grain sizes respon-sible for the emission.We use results fromvanBoekel et al. (2005b)for fixing the composition of dust grains in the atmosphere of theMWC 275 and ABAur disks. A compilation of stellar propertiesand circumstellar disk properties extracted from the literature islisted in Tables 4, 5, 6 and 7.
3. CIRCUMSTELLAR DISK MODELING
The circumstellar material around MWC 275 and AB Auris modeled as a passive dust disk reprocessing stellar radiation(Dullemond et al. 2001). The disk is in thermal and hydrostaticequilibrium and can be divided into three distinct regions (Fig. 3).
1. Curved Inner Rim.—Sufficiently close to the star (distancedepends on stellar luminosity and dust sublimation tempera-tures), dust in the circumstellar disk reaches sublimation temper-atures and evaporates. Inside of the evaporation radius, the diskis optically thin. The truncated dust disk is frontally illuminatedby the star and forms a ‘‘rim’’ whose shape depends sensitivelyon dust properties (Isella & Natta 2005; Tannirkulam et al. 2007).The rim puffs up, traps a significant fraction of stellar photons,
and reradiates predominantly in the NIR (Dullemond et al.2001).
2. Shadow Region.—The inner rim casts a geometric shadowon the region behind it (Dullemond et al. 2001; Dullemond &Dominik 2004), preventing it from receiving direct starlight. Theshadow is heated by scattered photons from the rim edge andthrough diffusion. The size of the shadow depends on the rim ge-ometry, mass of dust in the outer disk, and dust grain propertiesin the outer disk.
3. Flared Disk.—If sufficient dust is present in the outer disk,the disk eventually emerges from the shadow and ‘‘flares.’’ Theflared disk emits radiation in the MIR and longer wavelengths.
Details of the modeling procedure and comparison to data aredescribed below.
3.1. The Monte Carlo Transfer Code: TORUS
The calculations in this paper were performed using the TORUSMonte Carlo radiative-transfer code (Harries 2000; Harries et al.2004; Kurosawa et al. 2004; Tannirkulam et al. 2007). Radiativeequilibrium is computed using the Lucy (1999) algorithm on atwo-dimensional, cylindrical adaptive-mesh grid. The initial den-sity structure for the disk calculations is based on the canonicaldescription of the�-disk developed by Shakura&Sunyaev (1973),viz.,
�(r; z) ¼ �0r
r0
� ���
exp � 1
2
z2
h(r)2
� �; ð1Þ
where r is the radial distance in the midplane, r0 is some charac-teristic radius, z is the distance perpendicular to the midplane,and h(r) is the scale height, given by
h(r) ¼ h0r
r0
� ��
; ð2Þ
with parameters of � ¼ 2:125 and � ¼ 1:125, giving a radialdependence of the surface density of �(r) / r�1:0. Once the
Fig. 2.—The uv coverage for AB Aur. We include data from PTI (Eisneret al. 2004), IOTA, and CHARA (Tannirkulam et al. 2008) in our analysis. [Seethe electronic edition of the Journal for a color version of this figure.]
Fig. 1.—The uv coverage for MWC 275. We include data from KI (Monnieret al. 2005), IOTA (Monnier et al. 2006), and CHARA (Tannirkulam et al.2008) in our analysis. A position angle (measured east of north) of 136� forMWC 275 is marked with a dashed line. [See the electronic edition of the Journalfor a color version of this figure.]
MWC 275 AND AB AURIGAE DISK MODELS 515No. 1, 2008

temperature (we assume that the disk is in local thermodynamicequilibrium passively heated by the star, and gas and dust arethermally coupled) and dust sublimation (see next paragraph)structures have converged using the Lucy algorithm, the verticaldisk structure is modified via the equation of hydrostatic equilib-rium following a similar algorithm to that detailed by Walkeret al. (2004). A self-consistent calculation for dust sublimationand disk temperature followed by a hydrostatic equilibrium cal-culation is repeated until the disk density structure has converged.Convergence is typically achieved in four iterations. Images andSEDs are subsequently calculated using a separate Monte Carloalgorithm based on the dust emissivities and opacities (Harries2000).
The shape of the dust evaporation front is computed followingTannirkulam et al. (2007). The dust content is first reduced to avery low value in the computational grid for the circumstellardisk, to make each of the grid cells optically thin. Stellar photonsthen propagate through the disk and the temperature of grid cellsis determined. Dust is added to cells that are cooler (see eq. [3]for sublimation temperature parameterization) than the sublima-tion temperature in small steps of � . The step size is a � of 10�3
(computed at 5500 8) for the first five dust growth steps. Thestep size is then increased logarithmically, first to 10�2, then to10�1 and so on until a 100:1 gas to dust ratio is reached in eachgrid cell. The grid cell temperatures are recomputed after every
dust growth step and the process is repeated until the shape of thedust sublimation region converges.We use the Kurucz (1970) stellar atmosphere models as input
spectra for the stars.We consider a mixture of 0.1, 1.3, and 50 �mwarm silicates (Ossenkopf et al. 1992) and power-law opacitymillimeter grains (Mannings & Sargent 1997; Natta et al. 2004)tomodel the opacity in the disk. Themicron and submicron grainmixture is based on work by Meeus et al. (2001) and van Boekelet al. (2005b). To keep the analysis simple, the grain species areassumed to be well mixed with gas following a delta functionsize distribution. Dust scattering is not included in the models.Scattering does not seem to have significant impact on disk struc-ture and interpretation of infrared interferometry for HAe stars(Dullemond & Natta 2003; Pinte et al. 2008).During the course of our modeling, and as outlined in T08, we
realized that an additional emission component (Fig. 3), whichwe argue to be gas, is needed inside the dust destruction radiusto explain the NIR SED and interferometry of MWC 275 andAB Aur (see x 4.1.2 for discussion on gas opacity). This addi-tional component is not treated self-consistently in our modelingand is added after the dust-opacity-dominated circumstellar-diskmodel converges in structure. Calculations by Muzerolle et al.(2004) have shown that for parameters suitable toMWC 275 andAB Aur, gas does not significantly alter the structure of the dustrim, justifying our simple treatment for the NIR emission geometry.
TABLE 1
CHARA uv Coverage and Visibility Data for MWC 275
UT Date of Observation
u
(m)
v
(m) Telescope Pair Calibrated Visibility Calibrator Names
2004 Jul 9 ............................ �210.61 138.79 S1W1 0.150 � 0.008 HD 164031
�200.38 127.78 . . . 0.143 � 0.009 . . .
2005 Jul 22 .......................... 106.91 �11.88 W1W2 0.218 � 0.011 HD 164031
103.22 �18.38 . . . 0.227 � 0.009 . . .
2005 Jul 26 .......................... 102.45 5.03 W1W2 0.260 � 0.014 HD 164031
106.45 �1.61 . . . 0.241 � 0.011 . . .107.18 �10.26 . . . 0.201 � 0.011 . . .
105.94 �13.95 . . . 0.232 � 0.011 . . .
2006 Jun 22 ......................... �11.99 84.94 S2W2 0.345 � 0.016 HD 164031
�24.60 85.73 . . . 0.301 � 0.017 . . .�42.30 87.77 . . . 0.203 � 0.013 . . .
2006 Jun 23 ......................... �301.23 �85.20 E1W1 0.0715 � 0.0043 HD 164031
�302.93 �78.34 . . . 0.0730 � 0.0044 . . .
2006 Jun 23 ......................... �84.05 98.77 S2W2 0.0925 � 0.0041 HD 164031
2006 Aug 23........................ 60.15 125.48 E2S2 0.181 � 0.010 HD 164031, HD 166295
28.16 121.90 . . . 0.189 � 0.011 . . .
2007 Jun 17 ......................... �94.21 66.98 S2W1 0.232 � 0.013 HD 164031, HD 156365
�166.86 90.88 . . . 0.080 � 0.005 . . .�184.56 102.73 . . . 0.096 � 0.006 . . .
�195.84 114.04 . . . 0.110 � 0.007 . . .
Note.—The array geometry is illustrated in Fig. 1, and ten Brummelaar et al. (2005).
TABLE 2
CHARA uv Coverage and Visibility Data for AB Aur
UT Date of Observation
u
(m)
v
(m) Telescope Pair Calibrated Visibility Calibrator Names
2006 Aug 23.......................... 212.04 237.05 E1S1 0.095 � 0.005 HD 29645, HD 31233
203.79 251.87 . . . 0.120 � 0.006 . . .
197.53 259.95 . . . 0.123 � 0.007 . . .
2006 Dec 14 .......................... �5.77 �325.14 E1S1 0.115 � 0.007 HD 29645, HD 31233
2006 Dec 15 .......................... �93.57 8.26 E2W2 0.188 � 0.011 HD 29645, HD 31233
TANNIRKULAM ET AL.516 Vol. 689

In xx 4.1.1 and 5.1, we demonstrate that the NIR emittingregion in MWC 275 and AB Aur has a radius of �0.2 AU. Fur-thermore, long-baseline interferometry beyond the first visibilityminimum constrains the gas and dust emission to be on similarlength scales (Fig. 7). The two statements together imply that inthe absence of shielding of the evaporation front by gas, the mid-plane sublimation temperature in the dust rim is �1850 K (seex 4.1.1).
3.2. Comprehensive Models for SED and Interferometry
To fit the SED and visibilities of MWC 275 and AB Aur weadopted the following algorithm. First, we computed models forthe dust evaporation front as described in x 3.1. The inner edgeof the dust disk is assumed to be dominated by grains larger than1 �m (Tuthill et al. 2001; Isella et al. 2006) and the evaporationfront shape is set by the density dependence of dust sublimation
temperatures (Isella & Natta 2005; Tannirkulam et al. 2007). TheK-band visibilities are computed for the model and comparedwith data. The normalization of the dust evaporation law is thenadjusted so that the model visibilities fit the visibility data beforethe first visibility minimum. These models fail to fit the visibilitybeyond the minimum and do not have sufficient emission toexplain the observedNIR SED. Therefore an additional emissioncomponent has been added inside the dust sublimation radius toreconcile the model with the visibility data and NIR SED.
With the inner-rim parameters fixed, we next focus on MIRand themillimeter disk.Millimeter interferometry results from theliterature are used to fix diskmasses and sizes. Themajority of thedust mass is placed in millimeter-sized grains with a power-lawopacity function (Natta et al. 2004). A small fraction (�10%) ofthe dust mass is in micron and submicron (small) grains withtheir relative mass fractions based on literature results (Meeuset al. 2001; van Boekel et al. 2005b). The physical extent of smallgrains is constrained with MIR imaging and interferometry. Themodel is then allowed to run to convergence. The model SED is
TABLE 3
Keck Segment Tilting Experiment Baseline Coverage
and uv Averaged Visibility Data for MWC 275 and AB Aur
UT Date
of Observation
Baseline
(m)
Calibrated
Visibility
Calibrator
Names
MWC 275
2004 Sep 1.............................. 3.03 0.969 � 0.049 v3879 Sgr
4.72 0.944 � 0.040 v3879 Sgr
5.49 0.946 � 0.036 v3879 Sgr
7.21 0.942 � 0.033 v3879 Sgr
8.43 0.963 � 0.033 v3879 Sgr
AB Aur
2004 Aug 30, 2004 Aug 31,
& 2004 Sep 1 .....................
3.03 0.870 � 0.039 Iota Aur
4.72 0.823 � 0.027 Iota Aur
5.49 0.807 � 0.033 Iota Aur
7.21 0.753 � 0.047 Iota Aur
8.43 0.708 � 0.039 Iota Aur
TABLE 4
Basic Stellar Properties and Photometry
for MWC 275
Property Value
R.A. ................................... 17h 56m 21.29s
Decl. .................................. �21� 57 0 21.800
Spectral Type .................... A1 ea
Teff...................................... 9500 Ka
Luminosity ........................ 36 L�Distance............................. 122 pca
Mass .................................. 2.3 M�a
U........................................ . . .
B ........................................ 6.98 � 0.08b
V ........................................ 6.84 � 0.06b
R ........................................ 6.86 � 0.05b
I ......................................... 6.71 � 0.07b
J......................................... 6.20 � 0.08b
H........................................ 5.48 � 0.07b
K ........................................ 4.59 � 0.08b
a Stellar parameters fromMonnier et al. (2006),Natta et al. (2004), and references therein.
b Photometry obtained at MDM Observatories( longitude: �111.67�, latitude: 31.95�) in 2006 June.
TABLE 5
Basic Stellar Properties and Photometry
for AB Aur
Property Value
Spectral Type ........................ A0 pea
Teff.......................................... 9772 Ka
Luminosity ............................ 47 L�a
Distance................................. 144 pca
Mass ...................................... 2.4 M�a
U............................................ 7.18 � 0.08b
B ............................................ 7.14 � 0.04b
V ............................................ 7.01 � 0.04b
R ............................................ 6.96 � 0.05b
I ............................................. 6.70 � 0.09b
J............................................. 5.99 � 0.05b
H............................................ 5.28 � 0.05b
K ............................................ 4.37 � 0.05b
a Stellar parameters fromMonnier et al. (2006),Isella et al. (2006), and references therein.
b Photometry obtained at MDM Observatoriesin 2005 December.
TABLE 6
MWC 275 Disk Properties from the Literature
Property Value
Dust disk
Mass ......................................................... 0.0007 M�a
Dust to Gas Ratio .................................... 0.01
Surface Density Profile............................ r�1a,b
Outer Radius ............................................ 200 AUb
Inclination ................................................ 48� � 2�c
Position Angle ......................................... 136� � 2�c
Relative mass fractions of micron and submicron grains in the disk atmosphered
0.1 �m Silicates ....................................... 0:19þ0:009�0:018
1.5 �m Silicates ....................................... 0:8þ0:05�0:04
PAH.......................................................... 0:01þ0:001�0:001
a Natta et al. (2004).b Isella et al. (2007).c This work and Wassell et al. (2006).d van Boekel et al. (2005b).
MWC 275 AND AB AURIGAE DISK MODELS 517No. 1, 2008

compared with MIR and far-infrared data, the mass of the smallgrain population is then adjusted, and models are recomputeduntil a good fit to the MIR and far-infrared SED is obtained.
The MIR visibilities are computed for the SED-convergedmodel and compared with the data and the spatial distributionof the small grain component is adjusted until model visibilitiesmatch with data. The only free parameters in our models are theabsolute masses of the small grains, themasses of the 50 �m sili-cate grains, and their spatial distribution. Each of the models iscomputationally expensive. To achieve fast convergence, the pa-rameter space was varied by hand until a good fit was found forthe observable quantities.
4. MWC 275: ANALYSIS
MWC 275 is a Herbig Ae star (refer to Table 4 for basic prop-erties and photometry) with a total luminosity of 36 L�. The largestellar luminosity, coupled with the fact that the mass accretionrate is�10�7M� yr�1 (Garcia Lopez et al. 2006) allows us to ig-nore accretion heating and model the MWC 275 circumstellardisk as a passive disk, reprocessing stellar radiation (Chiang &Goldreich 1997; Dullemond et al. 2001). For our models, wechoose the MWC 275 disk mass to be between 0.05 and 0.1M�(Natta et al. 2004) and a surface density profile that varies ra-dially as r�1 ( Isella et al. 2007). The disk outer edge is truncatedat 200 AU and the bulk (�80%) of the dust mass is assumed toreside in millimeter grains having an opacity with a wavelengthdependence of k�1 at long wavelengths. Here, we describe in de-tail our modeling results for the NIR and MIR morphology ofMWC 275.
4.1. The Thermal NIR Disk
4.1.1. Visibilities
Like many other Herbig Ae stars, MWC 275 shows a strongNIR excess over stellar photospheric values (Hillenbrand et al.1992). This excess has been traditionally interpreted in terms of thedust disk being truncated by sublimation and forming a ‘‘rim.’’The rim intercepts stellar photons, reradiatiing predominantly inthe NIR (Dullemond et al. 2001; Isella & Natta 2005; Tannirkulamet al. 2007). However, in T08 we conclusively showed that mod-els in which all of the NIR excess arises from dust rims alonecannot explain the CHARA interferometry data on MWC 275.
Our arguments in T08 were necessarily brief. We present a moreelaborate analysis in this section.MWC 275 observations allow us to clearly detect the asym-
metry of the MWC 275 disk (see Appendix A.2), as havinginclination ¼ 48� � 2� and position angle (P:A:) ¼ 136� � 2�,consistent with the inclination of 51þ11
�9degrees and P.A. of
139� � 15� determined in Wassell et al. (2006) and the inclina-tion of 46� � 4�and P.A. of 128� � 4� determined in Isella et al.(2007). The complete visibility data along each of the baselinesare presented in Figure 4. Following T08, we show the data in aconcise manner in Figure 5 using the notion of an ‘‘effectivebaseline’’
BeA ¼ Bprojected
ffiffiffiffiffiffiffiffiffiffiffiffiffiffiffiffiffiffiffiffiffiffiffiffiffiffiffiffiffiffiffiffiffiffiffiffiffiffiffiffiffiffiffiffiffiffiffiffiffiffifficos2 (� )þ cos2 (�) sin2 (� )
q;
where � is the angle between the uv vector for the observationand the major axis of the disk and � is the inclination of the disk.Under the flat disk assumption, the effective baseline correctlyaccounts for the change in resolution due to the disk inclinationand P.A. (the geometry of thick disks is represented only approx-imately with optical depth effects and three-dimensional [3D]geometry of thick disks not being taken into account), allowingus to plot the visibility measurements as a function of one co-ordinate, simplifying presentation and analysis.We attempt to fit the visibilities with a curved inner-rim model
(the ‘‘standard’’ model) where the rim curvature (variation incylindrical radius between rimmidplane and the atmosphere) isset by the density dependence of dust sublimation temperatures,taken from Pollack et al. (1994). In this model, silicate grainssublimate at a higher temperature compared to other grains andhence fix the rim location. The rim is assumed to be composedof 1.3 �mgrains, as larger grains do not affect the rim shape andlocation significantly ( Isella & Natta 2005), at the same timemaking numerical convergence slower due to strong back-warmingeffects (Isella &Natta 2005; Tannirkulam et al. 2007). For silicate
TABLE 7
AB Aur disk properties from the literature
Property Value
Dust disk
Mass ....................................................... 0.0001 M�a
Dust to Gas Ratio .................................. 0.01
Surface Density Profile.......................... r�1b
Outer Radius .......................................... 300 AUa
Inclination .............................................. 21� � 0.5�b
Position Angle ....................................... 58.6� � 0.5
�b
Relative mass fractions of micron and submicron grains in the disk atmospherec
0.1 �m Silicates ..................................... 0:5þ0:03�0:03
1.5 �m Silicates ..................................... 0:48þ0:03�0:04
PAH........................................................ 0:02þ0:001�0:002
a Lin et al. (2006).b Corder et al. (2005).c van Boekel et al. (2005b).
Fig. 3.—Schematic of disk models. Top: Flared disk with a curved inner rim.Bottom: An additional ‘‘smooth’’ emission component ( presumably gas) hasbeen added inside the dust destruction radius to explain MWC 275 and AB AurNIR photometry and interferometry. Note that the models are not to scale. [Seethe electronic edition of the Journal for a color version of this figure.]
TANNIRKULAM ET AL.518 Vol. 689
dust, the evaporation temperature Tevp can be parameterizedas
Tevp ¼ G�gas(r; z)
1 g cm�3
� ��; ð3Þ
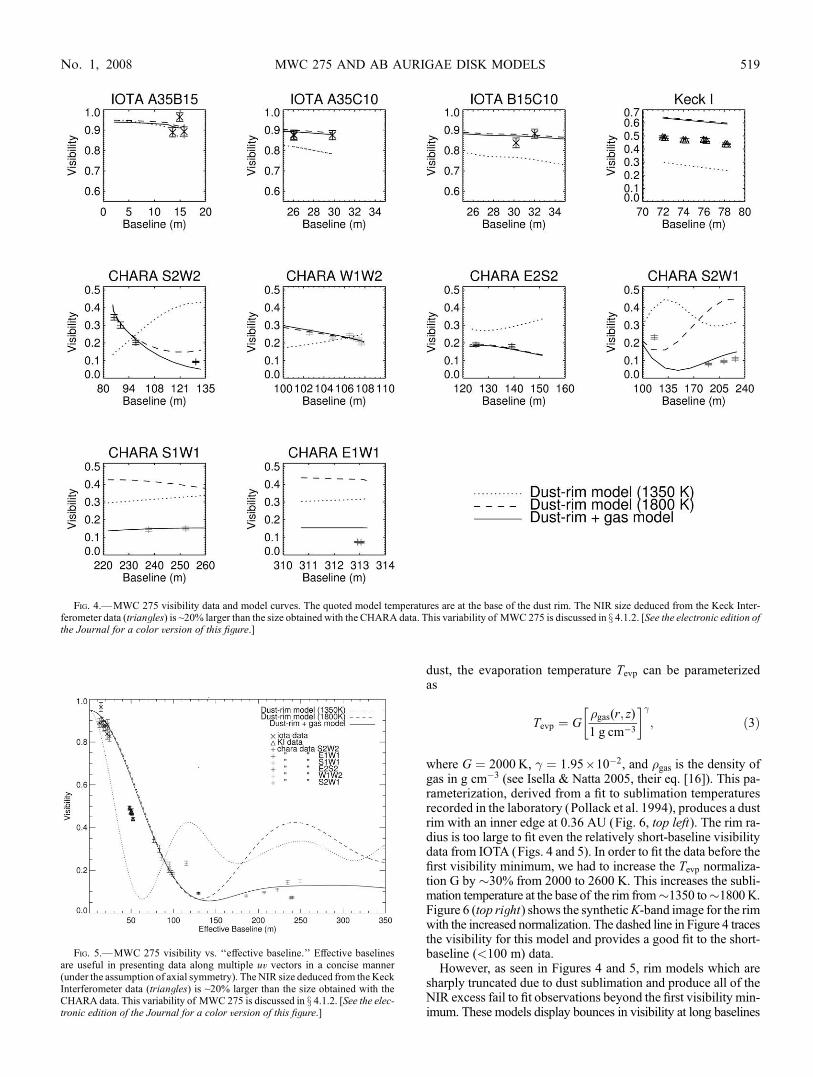
where G ¼ 2000 K, � ¼ 1:95 ; 10�2, and �gas is the density ofgas in g cm�3 (see Isella & Natta 2005, their eq. [16]). This pa-rameterization, derived from a fit to sublimation temperaturesrecorded in the laboratory (Pollack et al. 1994), produces a dustrim with an inner edge at 0.36 AU (Fig. 6, top left). The rim ra-dius is too large to fit even the relatively short-baseline visibilitydata from IOTA (Figs. 4 and 5). In order to fit the data before thefirst visibility minimum, we had to increase the Tevp normaliza-tion G by �30% from 2000 to 2600 K. This increases the subli-mation temperature at the base of the rim from�1350 to�1800K.Figure 6 (top right) shows the syntheticK-band image for the rimwith the increased normalization. The dashed line in Figure 4 tracesthe visibility for this model and provides a good fit to the short-baseline (<100 m) data.
However, as seen in Figures 4 and 5, rim models which aresharply truncated due to dust sublimation and produce all of theNIR excess fail to fit observations beyond the first visibility min-imum. These models display bounces in visibility at long baselines
Fig. 4.—MWC 275 visibility data and model curves. The quoted model temperatures are at the base of the dust rim. The NIR size deduced from the Keck Inter-ferometer data (triangles) is ~20% larger than the size obtained with the CHARA data. This variability of MWC 275 is discussed in x 4.1.2. [See the electronic edition ofthe Journal for a color version of this figure.]
Fig. 5.—MWC 275 visibility vs. ‘‘effective baseline.’’ Effective baselinesare useful in presenting data along multiple uv vectors in a concise manner(under the assumption of axial symmetry). The NIR size deduced from the KeckInterferometer data (triangles) is ~20% larger than the size obtained with theCHARA data. This variability of MWC 275 is discussed in x 4.1.2. [See the elec-tronic edition of the Journal for a color version of this figure.]
MWC 275 AND AB AURIGAE DISK MODELS 519No. 1, 2008

(not seen in the data) because of the presence of sharp ringlikefeatures with high spatial frequency components in the corre-sponding images, even for the smoothest rims physically plau-sible. In T08, we showed that the presence of a smooth emissioncomponent inside the dust destruction radius (Fig. 6, bottom)providing 56% of the totalK-band emission helps fit the data well(solid line in Figs. 4 and 5). The NIR visibility data cannot con-strain the surface brightness profile of the smooth emission com-ponent (we have adopted a constant surface brightness profile, auniform disk for simplicity), but can constrain the size scale ofthe emission fairly robustly. Figure 7 shows a series of visibilitycurves where the smooth emission component is fixed to be 56%of the total emission and the radius of the uniform disk compo-nent is decreased by 15% successively from the initial radius of0.23 AU radius. The model image is then rescaled to maintain agood visibility fit at baselines shorter than 100 m. It can be seen
in Figure 7 that for uniform disk (UD) radii smaller than 0.19AU,the model visibilities begin to deviate significantly from theobservations. Thus, the CHARA data constrains the smoothemission component to be on the same length scale as the dustsublimation rim filling the region between the disk and the cen-tral star.
4.1.2. SED
Figure 8 shows the NIR SED forMWC 275. Besides failing toexplain the NIR interferometry, the standard model also fails atproducing sufficient NIR emission to explain theMWC275 SEDeven in its ‘‘low’’state. InT08,we showed that binarity and sourcevariability cannot account for the discrepancy between the stan-dardmodel and data.We argued that the presence of smooth emis-sion inside the dust destruction radius can help explain the NIRvisibility and account for the ‘‘missing’’ NIR flux in standard
Fig. 6.—Inclined-disk models for NIR emission in MWC 275. The disk has an inclination of 48� and a P.A. of 136� (north is toward the top and east is on the left).The sense of the inclination is from Grady et al. (1999). Top left : Standard curved dust-rim-only model with rim-base temperature ~1350 K. Top right : Standard curveddust-rim-only model with rim-base temperature ~1800 K. Bottom: Curved dust-rim model with gas emission (modeled as a uniform disk centered on the star) inside thedust rim to smooth out the emission profile. [See the electronic edition of the Journal for a color version of this figure.]
TANNIRKULAM ET AL.520 Vol. 689

models. Opacity candidates for the smooth emission componentare (1) a dusty halo around the stars (Vinkovic et al. 2006a) and(2) gas inside the evaporation front. However, to fit the visibilitydata, the halo emission would have to be closer to the star thanthe dust destruction radius in the disk. This would require evenhigher dust-sublimation temperatures than the �1850 K we areadopting.
The most plausible physical mechanism for the smooth emis-sion is hot gas. The required emission levels to explain the long-baseline K-band visibility data can be obtained with opticallythin gas (� � 0:15) with a temperature range of 2000Y3000 K(Muzerolle et al. 2004; Eisner et al. 2007; Eisner 2007). Assum-ing that the gas has sufficient opacity to produce the difference influx between the standard model and the observed photometry,we can place limits on the wavelength dependence of gas opac-ity. Figure 9 plots limits on the gas opacity (normalized atK band)such that flux from the gas component + the standard model falls
Fig. 7.—Constraining the size scale of the smooth emission component in-terior to the dust destruction radius in MWC 275. The model visibilities begin todeviate significantly from the data when the radius of the smooth emission com-ponent becomes smaller than 0.19 AU. [See the electronic edition of the Journalfor a color version of this figure.]
Fig. 8.—NIR SED for MWC 275. The asterisks are photometry points fromMDM (Appendix, Table 4). The squares and diamonds are high- and lowstatemeasurements from Sitko et al. (2008). The solid line is the SED produced bythe star þ dust-rim-only model in the top right panel of Fig. 6. The dotted line isthe SED of the star.
Fig. 9.—Plus signs: Empirically derived gas opacities fromobserved photom-etry and NIR disk models for MWC 275 (see Fig. 6). Top: Asterisks representfiducial theoretical molecular absorption opacities smoothed over the photometryband for 2000 and 2500 K gas, respectively (Zhu et al. 2007). The opacity jumpat 5 �m is due to water vapor. Bottom: Gas absorption opacity at infrared wave-lengths is dominated by free-free and free-bound transitions of H� at 5000 Kand by hydrogen at 8000 K (Ferguson et al. 2005; Zhu et al. 2007).
Fig. 10.—MWC 275 SED from UV to millimeter. The mid, far-infrared, andsubmillimeter data are from Meeus et al. (2001) and references therein. Solidline: Dust-disk model SED (see x 4.2).Dotted line: Dust-disk + smooth-emissionSED. The smooth component is modeled as optically thin gray emission at2500K. The relative contributions of star, dust, and gas to the total integrated fluxare 0.79, 0.16, and 0.05, respectively.
MWC 275 AND AB AURIGAE DISK MODELS 521No. 1, 2008

within 10% of the observed photometry (we have assumed thatgas does not significantly alter the geometry of the dust rim). Inthe next two paragraphs we compare theoretical gas-opacity curveswith our empirically derived opacity from SED.
Figure 9 shows the wavelength dependence of molecular(Ferguson et al. 2005; Zhu et al. 2007) and free-freeþ free-bound(henceforth FF-BF) opacity, both good candidates for the gasemission (refer to T08). At 5000 K, FF-BF opacity (Fergusonet al. 2005) agrees well with the derived opacity at long wave-lengths but overshoots limits shortward of 2 �m. At temperaturesgreater than 8000K, FF-BF opacities rise quickly with wavelength,producing excessive MIR light.
Theoretical molecular opacities compare fairly well with theempirical derivation between 1 and 4 �m. Beyond 4 �m, theoret-ical molecular opacities rise rapidly with wavelength. However,the observed SED can be matched with models only if the gasopacity is flat between 4 and 9 �m. In addition, at 2000 and 2500 Kstrong opacity bands of CO and water vapor are present at 2.5
and 5 �m, respectively, which have not been observed in MWC275. This suggests that if molecules were contributing to the bulkof NIR opacity, then some of the species providing opacity be-tween 4 and 8 �m in Ferguson et al. (2005) and Zhu et al. (2007)are being destroyed in the vicinity of Herbig Ae star MWC 275.We note that FF-BF opacities seem to better fit the empiricallyderived values than molecular opacity.Sitko et al. (2008) have obtained fairly dense time coverage on
the NIR and MIR SED of MWC 275. The NIR SED shows vari-ability at the 20% level. During the same period, the flux in thevisible shows no detectable change, indicating that stellar lumi-nosity remained fairly constant. Sitko et al. (2008) interpret theirobservations as variations in the structure of the thermal NIRdisk. Avariation in the NIRmorphology of MWC 275 was alsodetected in the interferometry. The NIR disk size deduced fromthe Keck Interferometer data (2003 April epoch, Figs. 4 and 5) is�20% larger than the size obtained with the CHARA data (2004JuneY2006 August epochs). The size determined from the S2W1
Fig. 11.—MIR image and visibilities for MWC 275. The disk has an inclination of 48� and a P.A. of 136� (north is toward the top and east is on the left).Top: Synthetic 11 �m TORUS image. Bottom left : Azimuthally averaged 10.7 �m visibilities from the Keck Segment Tilting Experiment (Monnier et al. 2008). The‘‘stars’’ are measured values and the solid line is the model visibility. MWC 275 is not resolved by Keck. Bottom right : Model visibilities compared with MIDI (Leinertet al. 2004) data. The MIDI data was obtained at a projected baseline of ~99 m and a P.A. of 16�, nearly aligned with disk minor axis. [See the electronic edition of theJournal for a color version of this figure.]
TANNIRKULAM ET AL.522 Vol. 689

2007 June data also differs at the �25% level from the size ob-tained from earlier CHARA epochs. These variations are poorlyunderstood and could be caused by changes in size/geometry, massaccretion rate, and gas content in the inner disk. More evidencefor MWC 275 variability was recently reported by Wisniewskiet al. (2008), who found changes in scattered light intensity be-tween 1998 and 2003Y2004.
4.2. MIR SED and Emission Morphology
Van Boekel et al. (2005b) analyzed the MIR SED (Fig. 10) ofMWC 275 in detail and showed that the SED could be repro-duced well with a grain mixture of 1.5 and 0.1 �m silicates withmass ratio of 4 :1.We use results from van Boekel et al. (2005b)in fixing the small grain composition in our disk models.
As seen in Figure 10, theMWC 275 SED falls sharply between20 and 30 �m. This drop and the 10 �m silicate feature can besimultaneously reproduced only if the mass fraction of the smallgrain dust component relative to gas beyond 7 AU is less than 20%of themass fraction inside of 7AU. If the small grain componentis allowed to exist beyond 7 AU, then the model far-infrared spec-trumbecomesmuch stronger than observed SED. Figure 10 showsa TORUS model SED that fits the MIR and longer wavelengthspectrum of MWC 275 well. In this model, 40% of the 8 �memission arises from the dust rim, with the rim contribution de-clining to�20% at 13 �m. This model also fits the MIDI VLTIMIR visibilities (Leinert et al. 2004) and reproduces the 0:8 �0:1 AU 11 �m FWHMminor-axis size of MWC 275 (Fig. 11),naturally explaining why MWC 275 is unresolved by the KeckSegment Tilting Experiment. The quality of the SED and visi-bility fit in the 8Y15 �m region is only moderate, probably due tothe simple dust composition and distribution that we have as-sumed in the model. The initial model setup has been chosen toreproduce MWC 275 millimeter interferometry.
Table 8 lists disk parameters for the MWC 275 model andFigure 12 shows the radial distribution of the small grain fractions.The midplane temperature profile and the ‘‘flaring’’ geometry ofthe disk surface are shown in Figure 13. The dust rim ‘‘shadows’’(Dullemond et al. 2001; Dullemond&Dominik 2004) the regionof the disk between 0.3 and 1 AU, beyond which the disk beginsto flare. The � ¼ 1 surface drops down in scale height steeplyafter 6.5 AU, where the small grain fraction reduces sharply. Ourconclusions on dust-grain distribution in the MWC 275 disk areconsistent with those of Sitko et al. (2008).
5. AB AUR: ANALYSIS
AB Aur is a Herbig Ae star (refer to Table 5 for basic proper-ties and photometry) with a total luminosity of 47 L� ( Isella et al.2006). As in the case of MWC 275, AB Aur’s large stellar lu-minosity dominates the circumstellar disk’s energy budget (GarciaLopez et al. [2006] accretion rates� 10�7 M� yr�1). This allowsus to ignore accretion heating andmodel theABAur circumstellardisk as a passive disk, reprocessing stellar radiation (Chiang &Goldreich 1997; Dullemond et al. 2001). For our models, wechoose the ABAur disk mass to be between 0.007 and 0.013M�(Lin et al. 2006) and a surface density profile that falls radiallyas r�1 (Corder et al. 2005). The disk outer edge is truncated at300 AU and the bulk (�80%) of the dust mass is assumed to re-side in millimeter grains with an opacity that depends on wave-length as k�1 for long wavelengths. Here, we describe in detailour modeling results for the NIR andMIR morphology, and theSED of AB Aur.
5.1. The Thermal NIR Disk
We follow the procedure outlined in x 4.1.1 to model the SEDand visibilities of AB Aur. We first attempt to fit a standardcurved dust rim model (Fig. 14) to the NIR visibilities. The rimis assumed to be composed of 1.3 �m silicate grains and the dustevaporation temperature law is described by equation (3). Thisproduces rim radii too large to fit baselines shorter than 100 m,andwe had to increase the Tevp normalization to 2800 from 2000K.This increases the sublimation temperature at the base of the rimfrom�1350 to�1950 K. The dashed line in Figure 15 traces thevisibility for this model and provides a good fit to the data atbaselines shorter than 100 m.
The dust-rim-only model produces large bounces in visibilitybeyond 150 m and, as in the case of MWC 275, this bounce isnot observed.We have scanned the 150Y300m baseline (Fig. 15)range several timeswith CHARAand have failed to detect fringes,ruling out dust-rim-only models for the AB Aur NIR emission.
Fig. 12.—Mass fractions of dust components relative to gas. The micron andsubmicron grain fraction in MWC 275 (gray solid and dotted lines) have to bereduced below 20% of their values inside of 6.5 AU at larger radii to fit the SEDand interferometry. The silicate-grain opacities are from Ossenkopf et al. (1992)and the relative masses of dust grains are from van Boekel et al. (2005b). Be-tween 0.9 and 1.6 AU, 0.1 �m grains are added smoothly to avoid the formationof two distinct dust rims. The bulk of the dust mass is in millimeter-sized grainswith a power-law opacity profile (Natta et al. 2004). For AB Aur, we also add a50 �m silicate component to improve SED fits between 40 and 100 �m. The dustparameters are derived assuming gas and dust are well mixed. [See the electronicedition of the Journal for a color version of this figure.]
TABLE 8
MWC 275 Model-disk Properties Constrained by This Work
Property Value
Dust disk
Inner radius ................................................. 0.22 AUa
K-band flux contribution from dust rim..... 29%a
Mass fractions of dust components............ See Fig. 12
NIR gas disk
Surface brightness profile ........................... Constant ( poorly constrained)
Outer Radius ............................................... 0.22 AUa
K-band flux contribution ............................ 56%a
Temperature................................................. >1800 K
Vertical optical depth .................................. 0.15a
Gas-opacity profile...................................... See Fig. 9
a Tannirkulam et al. (2008). The star contributes 10% of the K-band flux andan extended envelope (Monnier et al. 2006) contributes 5%.
MWC 275 AND AB AURIGAE DISK MODELS 523No. 1, 2008

Fig. 14.—Face-on models for NIR emission in AB Aur. Top left: Standard curved dust-rim-only model with rim-base temperature ~1350 K. Top right: Standard curveddust-rim-only model with rim-base temperature ~1950 K. Bottom: Curved dust-rimmodel with gas emission (modeled as a uniform disk centered on the star) added inside thedust rim in to smooth out the emission profile. The central star has been suppressed in all the panels. [See the electronic edition of the Journal for a color version of this figure.]
Fig. 13.—Temperature profile and disk-surface shapes for MWC 275 and ABAur. Left: Midplane temperature profile forMWC 275 (dotted line) and ABAur (dashedline). Right: � ¼ 1 at 5500 8 surface of the disk measured along radial lines from the central star. The y-axis is the polar angle (0 is the equatorial plane) in radians.

The addition of a uniform disk of emission interior to the dust de-struction radius (Fig. 14, bottom) helps fit the data well (Fig. 15,solid line). The gas component also helps fit theNIRSED (Fig. 16).Parameters for the dust rim + uniform disk model are listed inTable 9.
5.2. MIR SED and Emission Morphology
Liu et al. (2007) resolved the AB Aur disk at 10.3 �m usingnulling interferometry andmeasured a disk is inclination of 45�Y65�
inconsistent with nearly face-on measurements in the millimeter(Corder et al. 2005) and the NIR (Millan-Gabet et al. 2001; Eisneret al. 2004) ranges. Liu et al. (2007) interpreted their result interms of the ABAur circumstellar environment beingmore com-plicated than a disk. Since AB Aur is well resolved by the KeckSegment Tilting Experiment (Fig. 17), a disk inclination of 45�Y65�
would have produced observable size difference between the ma-jor and minor axes of the disk. We do not find evidence for thissize variation in our Segment Tilting data, and hence support a
face-on model for the MIR disk around AB Aur consistent withthe NIR and millimeter results.
TheMIR spectrum of ABAur in the 10.7Y20�m range can bemodeled well with a dust grainmixture of 1.3 and 0.1�m silicateswith equal mass fractions (van Boekel et al. 2005b). In additionto the micron and submicron silicates, we include a 50 �m sili-cate component to model the relatively flat spectrum of AB Aurbetween 35 and 80 �m.
Figure 18 shows a TORUS model SED that fits the MIR andlonger wavelength spectrum of AB Aur well. In this model,�40%of the 8 �m emission arises from the dust rim, with the rim con-tribution declining to �10% at 13 �m. This model also fits theKeck Segment Tilting data visibilities reproducing the 10:5 �0:7 AU 10 �m FWHM size of AB Aur (Fig. 17). By initial de-sign, the model fits the AB Aur millimeter interferometry andSED.
Table 9 lists disk parameters for the AB Aur model and Fig-ure 12 shows the radial distribution of the small grain fractions.Themidplane temperature profile and the � ¼ 1 surface at 55008are shown in Figure 13. The inner rim shadows the disk between0.3 and 1 AU, beyond which the disk surface takes on a flaredgeometry.
6. DISCUSSION
The simultaneousmodeling of the infrared andmillimeter SEDand interferometry of MWC275 andABAur allows us to addressseveral important issues regarding the structure of their circum-stellar disks. To maintain clarity in our discussion we divide thedisk into two regions: (1) thermal NIR region (<0.3 AU), and(2) outer disk (between 0.3 AU and the disk outer edge).
6.1. The Thermal NIR Disk
Detailed modeling (xx 4.1.1 and 5.1) of the inner disk showsthat models where the bulk of the NIR emission arises in a dustrim truncated by sublimation fail to fit the long-baseline interfer-ometry data and underestimate the NIR emission by a factor of 2relative to observations. As mentioned in T08 and demonstratedin detail in this work, the presence of a gas emission componentinside the dust destruction radius can solve the interferometryand SED problem simultaneously.
This, however, opens up a number of new questions, namely,(1) what is the geometry of the gas dust transition region? To datethere has been no calculation of transition region structure that
Fig. 15.—AB Aur visibility vs. baseline. The arrows are upper limits on thevisibility. The quoted model temperatures are at the base of the dust rims. [Seethe electronic edition of the Journal for a color version of this figure.]
Fig. 16.—NIR SED for AB Aur. The ‘‘stars’’ are photometry points fromMDM (Table 5). The solid line is the SED produced by the star þ dust-rim-onlymodel in the top right panel of Fig. 14. The dashed line traces the stellar SED.The dotted line includes emission from gas at 2500 K, assuming that the gasopacity curve derived for MWC 275 (see Fig. 9) is valid for AB Aur as well.
TABLE 9
AB Aur Model-disk Properties Constrained by this Work
Property Value
Dust disk
Inner radius ................................................... 0.24 AUa
K-band flux contribution from dust rim....... 22%a
Mass fractions of dust components.............. Refer to Fig. 12
NIR gas disk
Surface brightness profile ............................. Constant ( poorly constrained)
Outer radius .................................................. 0.24 AUa
K-band flux contribution .............................. 65%
Temperature................................................... >1900 K
Vertical optical depth .................................... 0.14a
Gas-opacity profile........................................ Refer to Fig. 9
a Tannirkulam et al. (2008). The star contributes 8% of the K-band flux andan extended envelope (Monnier et al. 2006) contributes 5%.
MWC 275 AND AB AURIGAE DISK MODELS 525

treats both gas and dust simultaneously in a self consistent man-ner. (2) What are the relative contributions of accretion and stel-lar radiation to heating the gas? We have shown that an ad hocaddition of an NIR emission component inside the dust destruc-tion radius helps explain the data, but the current modeling doesnot shed any light on the energy budget question. (3) What arethe gas species that provide the NIR opacity? Is the opacity mo-lecular in nature or is it from free-free and free-bound processes?If a significant portion of the NIR emission were indeed arisingfrommolecular gas, then Figure 9 shows that theoretical gas opac-ities depend much more sensitively on wavelength between 4and 10 �m than what is observed. This suggests that some of themolecules providing the model opacities might be getting de-stroyed by the stellar UV radiation field.
In the course of modeling the MWC 275 and AB Aur disks,we realized (x 4.1.1) that the observed K-band sizes could be re-produced only if the dust sublimation temperature at the base of
the dust rims were increased to �1850 K from the experimen-tally measured silicate evaporation temperatures of �1400 K(Pollack et al. 1994). A simple treatment of the gas-dust transi-tion region by Muzerolle et al. (2004) suggests that gas is not ef-fective inmodifying rim geometry. In the absence of shielding bygas, the large dust sublimation temperatures indicate that the grainsin the inner disks of young stars are significantly more refractoryand/or optically transparent than has been assumed in the litera-ture. There is also the possibility that the gas gets optically thickalong the midplane, shielding the dust from direct stellar radia-tion and allowing the dust rim to exist closer to the star (Monnieret al. 2005; Isella et al. 2006). Future, high-resolution NIR spec-troscopic studies of MWC 275 and ABAur, combined with self-consistent models of the gas density and temperature structure,will help address many of the questions raised here.MWC 275 and AB Aur require gas emission to explain the
their SED interferometry. In contrast, past modeling work by Isellaet al. (2006) seems to suggest that dust rims alone are probablysufficient to explain the NIR data on the young stars V1295 Aql(A2 IVe) and CQ Tau (F2 IVe). A larger sample of young starswill therefore have to be observed with milliarcsecond interfer-ometry to establish and understand trends between spectral type,stellar mass, accretion rates, and the contribution of gas emissionto NIR SED.A new and exciting observational domain will be opened with
the commissioning of the fringe tracker (Berger et al. 2006) forCHARA MIRC (Monnier et al. 2007) in the summer of 2008.This will sufficiently improve CHARAMIRC sensitivities to com-bine light from three or more telescopes, allowing the first milli-arcsecond non-parametric imaging of MWC 275 and AB Aur inthe NIR. The snapshot multiple-baseline coverage will provideus a powerful tool in understanding the infrared time variabilityof YSO disks.
6.2. The Outer Disk
Our models for the MWC 275 and AB Aur MIR interferom-etry and SED suggest that the outer disks of these systems are atdifferent evolutionary stages. MWC 275 10 �m size and MIRSED can only be reproduced if the disk is depleted in micron andsubmicron sized grains beyond�7 AU (x 4.2). This meshes well
Fig. 17.—A 10.7 �m image and visibilities for AB Aur. Left : Synthetic 10.7 �m TORUS image. Right : Model visibilities (solid line) compared with azimuthallyaveraged Keck Segment Tilting data (Monnier et al. 2004). The model also includes 5% emission arising from an extended envelope. [See the electronic edition of theJournal for a color version of this figure.]
Fig. 18.—AB Aur SED from UV to millimeter. The MIR, far-infrared, andsubmillimeter data are from Meeus et al. (2001 and references therein). Thesolid line traces the dust-disk model SED (see x 5.2). The dotted line traces thedust-diskþ gas model. The relative contributions of star, dust, and gas to the totalintegrated flux are 0.67, 0.27, and 0.06, respectively.
TANNIRKULAM ET AL.526 Vol. 689

with the fact that the observed 10.7 �m size of MWC 275 is�3 times smaller than AB Aur. The depletion of small grainsbeyond 7 AU in the disk atmosphere indicates that the dustparticles inMWC 275 have undergone significant settling. How-ever, the presence of the 10 �m silicate feature in MWC 275 im-plies that there is some process ( like planetesimal collisions) thatmaintains the supply of micron-sized grains in the inner regionsof the disk.
Our models predict that the inner dust rim shadows (Dullemond& Dominik 2004) the region of the disk between 0.3 and 1 AU.The structure and size of the shadow depends sensitively on thecomposition of grains in the circumstellar disk (Tannirkulam et al.2007) and hence is an important probe of dust physics. The pres-ence of the shadow has not been observationally confirmed yet inanyYSO system, although some indirect evidence has been foundin VV Ser (Pontoppidan et al. 2007).
7. CONCLUSIONS
We have presented the first set of comprehensive disk modelsfor the SED and interferometry of Herbig Ae stars MWC 275and ABAur.We have shown that ‘‘standard’’ models for the dustevaporation front where the bulk of theNIR emission arises froma dust wall fail to explain the NIR SED and interferometry. Stan-dard models produce large bounces in visibility at high spatialfrequency, which is not observed in the data. We have conclusivelydemonstrated that the presence of an additional smooth emissioncomponent (presumably hot gas) inside the dust destruction ra-
dius and on a similar size scale to the dust rim can ameliorate thesituation. In the absence of shielding of starlight by gas, we haveestablished that dust grains in the gas-dust transition region willhave to be highly refractory, sublimating at 1850 K. The smallMIR size of MWC 275 relative to AB Aur shows that the dustgrains in the outer diskMWC 275 are significantly more evolved/settled than the grains in theABAur disk.We suggest that dynam-ical processes (such as planetesimal collisions) that maintain thepopulation of micron-sized grains producing the 10 �m feature inthe spectrum are operational only in the inner 7 AU of MWC275.However, in ABAur the small-dust producing mechanisms existat least out to 20 AU and maybe even beyond.
A. T. acknowledges contributions from Nuria Calvet, MichaelBusha, Marlin Whitaker, and Steve Golden. Research at theCHARA array is supported by the National Science Foundationthrough grants AST 06-06958 and AST 03-52723 and by theGeorgia State University through the offices of the Dean of theCollege of Arts and Sciences and the Vice President for Research.This project was partially supported byNASA grant 050283. Thispublication makes use of NASA’s Astrophysics Data System Ab-stract Service. CHARA visibility-calibrator sizes were obtainedwith the fBol module of getCal, a package made available by theMichelson Science Center, California Institute of Technology(http://msc.caltech.edu). Computations were performed on theLegato-Opus Cluster Network at the University of Michigan.
APPENDIX A
A1. PHOTOMETRY
Optical and near-infrared photometry for a number of YSOs, and a few main-sequence and evolved stars are presented in Tables 10and 11. The data were collected at the MDM Observatory between 2004 November and 2006 August.
TABLE 10
UBVRI Photometry
Target
R.A.
(J2000.0) Decl. U B V R I
UT Date
of Observation
HIP 2080.............................. 00 26 16.5 +03 49 33 . . . 6.72 � 0.05 6.81 � 0.04 6.94 � 0.06 6.93 � 0.04 2006 Aug 27
HIP 2370.............................. 00 30 16.4 �29 14 38 . . . 12.65 � 0.05 12.28 � 0.04 12.13 � 0.06 11.75 � 0.04 2006 Aug 27
HIP 3013.............................. 00 38 20.3 �14 59 54 . . . 10.67 � 0.05 10.86 � 0.04 6.95 � 0.06 11.07 � 0.04 2006 Aug 27
BP Tau ................................. 04 19 15.8 +29 06 27 13.20 � 0.15 13.36 � 0.03 12.32 � 0.04 11.45 � 0.04 10.60 � 0.04 2004 Nov 29
CI Cam................................. 04 19 42.1 +55 59 57 12.13 � 0.07 12.41 � 0.06 11.77 � 0.05 10.79 � 0.05 9.99 � 0.04 2004 Nov 27
12.32 � 0.08 12.70 � 0.04 11.75 � 0.05 10.64 � 0.05 9.82 � 0.09 2005 Dec 10
. . . 12.59 � 0.05 11.71 � 0.03 10.72 � 0.04 9.94 � 0.05 2006 Aug 28
DG Tau ................................ 04 27 04.7 +26 06 16 13.93 � 0.04 13.97 � 0.03 12.79 � 0.04 11.70 � 0.04 10.67 � 0.04 2004 Nov 29
DI Tau .................................. 04 29 42.5 +26 32 49 16.06 � 0.25 14.45 � 0.03 12.96 � 0.04 11.87 � 0.04 10.70 � 0.04 2004 Nov 29
V830 Tau ............................. 04 33 10.0 +24 33 43 14.66 � 0.15 13.52 � 0.03 12.21 � 0.04 11.26 � 0.04 10.44 � 0.04 2004 Nov 29
LkCa 15 ............................... 04 39 17.8 +22 21 03 13.98 � 0.07 13.30 � 0.03 12.09 � 0.04 11.26 � 0.04 10.52 � 0.04 2004 Nov 29
GM Aur................................ 04 55 11.0 +30 21 59 13.90 � 0.04 13.38 � 0.03 12.19 � 0.04 11.34 � 0.04 10.61 � 0.04 2004 Nov 29
AB Aur ................................ 04 55 45.8 +30 33 04 7.18 � 0.08 7.14 � 0.04 7.01 � 0.04 6.96 � 0.05 6.70 � 0.09 2005 Dec 10
. . . 7.19 � 0.05 7.05 � 0.05 7.01 � 0.06 6.80 � 0.04 2006 Aug 27
MWC 480 ............................ 04 58 46.3 +29 50 37 . . . 7.91 � 0.05 7.68 � 0.03 7.62 � 0.05 7.45 � 0.05 2006 Aug 28
UX Ori ................................. 05 04 30.0 �03 47 14 10.93 � 0.07 10.70 � 0.06 10.33 � 0.05 10.07 � 0.05 9.75 � 0.04 2004 Nov 29
10.43 � 0.08 10.22 � 0.04 9.97 � 0.04 9.87 � 0.05 9.56 � 0.09 2005 Dec 10
RW Aur ................................ 05 07 49.5 +30 24 05 10.86 � 0.04 11.07 � 0.03 10.32 � 0.04 9.78 � 0.04 9.17 � 0.04 2004 Nov 29
GW Ori ................................ 05 29 08.4 +11 52 13 11.60 � 0.04 11.29 � 0.03 10.16 � 0.04 9.38 � 0.04 8.75 � 0.04 2004 Nov 29
MWC 758 ............................ 05 30 27.5 +25 19 57 8.59 � 0.07 8.56 � 0.06 8.28 � 0.05 8.11 � 0.05 7.95 � 0.04 2004 Nov 29
. . . 8.58 � 0.05 8.28 � 0.03 8.15 � 0.04 7.92 � 0.05 2006 Aug 28
V380 Ori� ............................ 05 36 25.4 �06 42 58 10.29 � 0.07 10.43 � 0.06 10.06 � 0.05 9.67 � 0.05 8.99 � 0.04 2004 Nov 29
10.07 � 0.08 10.15 � 0.04 9.74 � 0.04 9.38 � 0.05 8.80 � 0.09 2008 Aug 27
MWC 275 AND AB AURIGAE DISK MODELS 527No. 1, 2008

TABLE 10—Continued
Target
R.A.
(J2000.0) Decl. U B V R I
UT Date
of Observation
FU Ori.................................. 05 45 22.4 +09 04 12 . . . 10.80 � 0.08 9.52 � 0.15 8.63 � 0.05 8.11 � 0.15 2004 Nov 29
11.57 � 0.08 10.81 � 0.04 9.47 � 0.04 8.60 � 0.05 7.89 � 0.09 2005 Dec 10
. . . 10.87 � 0.05 9.65 � 0.03 8.87 � 0.05 8.13 � 0.05 2006 Aug 28
HD 45677 ............................ 06 28 17.4 �13 03 11 7.03 � 0.07 7.56 � 0.06 7.51 � 0.05 7.33 � 0.05 7.24 � 0.04 2004 Nov 27
6.99 � 0.08 . . . 7.52 � 0.04 7.35 � 0.05 7.06 � 0.09 2005 Dec 10
MWC 147 ............................ 06 33 05.2 +10 19 20 8.45 � 0.07 8.87 � 0.06 8.65 � 0.05 8.30 � 0.05 8.02 � 0.04 2004 Nov 27
Z CMa.................................. 07 03 43.2 �11 33 06 9.78 � 0.07 9.86 � 0.06 9.17 � 0.05 8.50 � 0.05 7.75 � 0.04 2004 Nov 27
MWC 166 ............................ 07 04 25.5 �10 27 16 7.08 � 0.07 7.55 � 0.06 7.16 � 0.05 6.97 � 0.05 6.65 � 0.04 2004 Nov 27
HD 58647 ............................ 07 25 56.1 �14 10 44 6.66 � 0.07 6.874 � 0.06 6.73 � 0.05 6.76 � 0.05 6.67 � 0.04 2004 Nov 27
IRC+10216........................... 09 47 59.4 +13 16 44 . . . . . . >15.9 15.60 � 0.10 12.52 � 0.04 2004 Nov 27
Beta Leo............................... 11 49 03.6 +14 34 19 . . . 2.36 � 0.09 2.18 � 0.08 2.17 � 0.09 2.22 � 0.07 2006 Jun 9
HD 141569 .......................... 15 49 57.8 �03 55 16 . . . 7.32 � 0.09 7.16 � 0.08 7.14 � 0.09 7.15 � 0.07 2006 Jun 9
. . . 7.32 � 0.05 7.14 � 0.04 7.23 � 0.06 7.03 � 0.04 2006 Aug 27
HD 142666 .......................... 15 56 40.0 �22 01 40 . . . 9.70 � 0.05 9.05 � 0.04 8.77 � 0.06 8.32 � 0.04 2006 Aug 28
HD 143006 .......................... 15 58 36.9 �22 57 15 . . . 10.94 � 0.09 10.12 � 0.08 9.63 � 0.09 9.38 � 0.07 2006 Jun 9
. . . 10.95 � 0.05 10.14 � 0.04 9.75 � 0.06 9.22 � 0.04 2006 Aug 28
HD 144432 .......................... 16 06 58.0 �27 43 10 . . . 8.57 � 0.09 8.21 � 0.08 7.98 � 0.09 7.96 � 0.07 2006 Jun 9
. . . 8.62 � 0.05 8.20 � 0.03 7.97 � 0.04 7.83 � 0.04 2006 Aug 28
HD 150193 (MWC 863)..... 16 40 17.9 �23 53 45 . . . 9.43 � 0.09 8.87� 0.08 8.48 � 0.09 8.20 � 0.07 2006 Jun 9
. . . 9.42 � 0.05 8.87 � 0.04 8.58 � 0.06 8.04 � 0.04 2006 Aug 27
KKOph................................. 17 10 08.0 �27 15 18 . . . 12.77 � 0.09 12.11 � 0.08 11.61 � 0.09 11.16 � 0.07 2006 Jun 9
HD 158352 .......................... 17 28 49.7 +00 19 50 . . . 5.67 � 0.05 5.38 � 0.04 5.33 � 0.06 5.18 � 0.04 2006 Aug 27
HD 158643 .......................... 17 31 25.0 �23 57 45 . . . 4.81 � 0.09 4.78 � 0.08 4.80 � 0.09 4.73 � 0.07 2006 Jun 9
. . . 4.87 � 0.05 4.78 � 0.03 4.81 � 0.04 4.62 � 0.04 2006 Aug 28
RSOph.................................. 17 50 13.2 �06 42 28 . . . 12.65 � 0.08 11.43 � 0.06 10.21 � 0.05 9.51 � 0.07 2006 Jun 8
MWC 275 ............................ 17 56 21.3 �21 57 22 . . . 6.98 � 0.08 6.84 � 0.06 6.86 � 0.05 6.71 � 0.07 2006 Jun 8
. . . 7.01 � 0.05 6.86 � 0.04 6.90 � 0.06 6.72 � 0.04 2006 Aug 27
HD 169412 .......................... 18 21 33.5 +52 54 08 . . . 7.89 � 0.09 7.82 � 0.08 7.85 � 0.09 7.97 � 0.07 2006 Jun 9
MWC 297 ............................ 18 27 39.6 �03 49 52 . . . 14.38 � 0.09 12.26 � 0.08 10.29 � 0.09 9.10 � 0.07 2006 Jun 9
. . . 14.27 � 0.05 12.23 � 0.04 10.30 � 0.06 8.92 � 0.04 2006 Aug 27
VVSer................................... 18 28 47.9 +00 08 40 . . . 13.23 � 0.08 12.22 � 0.06 11.36 � 0.05 10.61 � 0.07 2006 Jun 8
MWC 300 ............................ 18 29 25.7 �06 04 37 . . . 12.87 � 0.09 11.82 � 0.08 11.01 � 0.09 10.56 � 0.07 2006 Jun 9
RCra ..................................... 19 01 53.7 �36 57 08 . . . 12.17 � 0.05 11.45 � 0.03 10.82 � 0.05 10.15 � 0.05 2006 Aug 28
TCra ..................................... 19 01 58.8 �36 57 50 . . . 13.67 � 0.05 12.50 � 0.03 11.87 � 0.05 11.23 � 0.05 2006 Aug 28
MWC 614 ............................ 19 11 11.3 +15 47 16 . . . 7.50 � 0.05 7.37 � 0.04 7.41 � 0.06 7.26 � 0.04 2006 Aug 27
HIP 96720............................ 19 39 41.4 +14 02 53 . . . 11.06 � 0.05 10.65 � 0.03 10.38 � 0.05 10.06 � 0.05 2006 Aug 28
V1295 Aql ........................... 20 03 02.5 +05 44 17 . . . 7.85 � 0.08 7.79 � 0.06 7.69 � 0.05 7.59 � 0.07 2006 Jun 8
. . . 7.93 � 0.05 7.80 � 0.04 7.77 � 0.06 7.58 � 0.04 2006 Aug 27
V1685Cyg............................ 20 20 28.2 +41 21 52 . . . 11.63 � 0.09 10.79 � 0.08 10.06 � 0.09 9.58 � 0.07 2006 Jun 9
MWC 342 ............................ 20 23 03.6 +39 29 50 . . . 11.88 � 0.09 10.57 � 0.08 9.44 � 0.09 8.72 � 0.07 2006 Jun 9
V1057 Cyg........................... 20 58 53.7 +44 15 28 16.00 � 0.28 14.32 � 0.06 12.50 � 0.05 11.18 � 0.05 9.78 � 0.04 2004 Nov 27
MWC 361 ............................ 21 01 36.9 +68 09 48 . . . 7.75 � 0.05 7.33 � 0.03 7.00 � 0.04 6.62 � 0.05 2006 Aug 28
AS 477 ................................. 21 52 33.9 +47 13 38 10.48 � 0.07 10.52 � 0.06 10.07 � 0.05 9.85 � 0.05 9.50 � 0.04 2004 Nov 27
HIP 113937.......................... 23 04 23.6 �24 06 56 . . . 9.12 � 0.05 9.07 � 0.04 9.18 � 0.06 9.08 � 0.04 2006 Aug 27
HIP 114547.......................... 23 12 09.4 �25 24 14 . . . 9.51 � 0.05 9.12 � 0.04 8.98 � 0.06 8.67 � 0.04 2006 Aug 27
HIP 115858.......................... 23 28 25.2 �25 25 14 . . . 7.09 � 0.05 6.88 � 0.04 6.92 � 0.06 6.72 � 0.04 2006 Aug 27
Notes.—Majority of the MDM targets are YSOs. Units of right ascension are hours, minutes, and seconds, and units of declination are degrees, arcminutes, andarcseconds.

A2. ‘‘EFFECTIVE BASELINES’’ AS A TOOL IN CHARACTERIZING VISIBILITY INFORMATION ON MWC 275
Let Bprojected be the projected interferometric baseline and let V (Bprojected) be the visibility for a circularly symmetric brightnessdistribution. For a flat disk inclined at angle � and oriented at some P.A., we plotted V (BeA) in Figure 5. The effective baseline BeA isdefined as
BeA ¼ Bprojected
ffiffiffiffiffiffiffiffiffiffiffiffiffiffiffiffiffiffiffiffiffiffiffiffiffiffiffiffiffiffiffiffiffiffiffiffiffiffiffiffiffiffiffiffiffiffiffiffiffiffifficos2 (� )þ cos2 (�) sin2 (� )
q;
where � is the angle between the uv vector for the observation and the major axis of the inclined disk and � is the inclination of the disk(0
�inclination is face-on). Effective baselines account for the decrease in interferometric resolution due to the inclination of the disk in
the sky. They capture the geometry of flat disks correctly, but the geometry of finitely thick disks is represented only approximately(optical depth effects and 3D geometry of thick disks are not taken into account). Here, we argue that effective baselines are good (albeitapproximate) tools for capturing details of the MWC 275 disk geometry.
In order to determine the inclination angle and sky orientation of the disk, we adopted the following procedure. MWC 275 visibilityvalues measured with W1W2, S2W2, and E2S2 CHARA telescope pairs are close to and just prior to the first minimum in the visibility
TABLE 11
JHK Photometry
Target
R.A.
(J2000.0) Decl. J H K UT Date of Observation
V892 Tau ...................................... 04 18 40.6 +28 19 16 8.61 � 0.05 7.08 � 0.05 5.86 � 0.05 2005 Dec 17
BP Tau .......................................... 04 19 15.8 +29 06 27 9.10 � 0.10 8.37 � 0.10 7.90 � 0.10 2004 Dec 1
9.05 � 0.05 8.32 � 0.05 7.85 � 0.05 2005 Dec 17
CI Cam.......................................... 04 19 42.1 +55 59 58 7.20 � 0.10 5.68 � 0.10 4.44 � 0.10 2004 Dec 1
7.01 � 0.05 5.63 � 0.05 4.35 � 0.05 2005 Dec 17
DG Tau ......................................... 04 27 04.7 +26 06 16 8.92 � 0.05 7.95 � 0.05 7.15 � 0.05 2005 Dec 17
V830 Tau ...................................... 04 33 10.0 +24 33 43 9.36 � 0.05 8.73 � 0.05 8.52 � 0.05 2005 Dec 17
LkCa 15 ........................................ 04 39 17.8 +22 21 04 9.33 � 0.05 8.72 � 0.05 8.23 � 0.05 2005 Dec 17
GM Aur......................................... 04 55 11.0 +30 22 00 9.40 � 0.05 8.80 � 0.05 8.52 � 0.05 2005 Dec 17
AB Aur ......................................... 04 55 45.8 +30 33 04 5.99 � 0.05 5.28 � 0.05 4.37 � 0.05 2005 Dec 17
MWC 480 ..................................... 04 58 46.3 +29 50 37.0 6.90 � 0.05 6.38 � 0.05 5.57 � 0.05 2005 Dec 17
RW Aur ......................................... 05 07 49.5 +30 24 05 8.22 � 0.05 7.67 � 0.05 7.16 � 0.05 2004 Dec 1
8.34 � 0.10 7.66 � 0.10 7.18 � 0.10 2005 Dec 17
GW Ori ......................................... 05 29 08.4 +11 52 13 7.42 � 0.05 6.67 � 0.05 5.83 � 0.05 2005 Dec 17
MWC 758 ..................................... 05 30 27.5 +25 19 57 7.20 � 0.10 6.55 � 0.10 5.80 � 0.10 2004 Dec 1
7.26 � 0.05 6.70 � 0.05 5.92 � 0.05 2005 Dec 17
MWC 120 ..................................... 05 41 02.3 �02 43 00 7.24 � 0.05 6.66 � 0.05 5.77 � 0.05 2005 Dec 17
FU Ori........................................... 05 45 22.4 +09 04 12 6.55 � 0.05 5.89 � 0.05 5.32 � 0.05 2005 Dec 17
HD 45677 ..................................... 06 28 17.4 �13 03 11 6.85 � 0.05 6.22 � 0.05 4.61 � 0.05 2005 Dec 17
MWC 147 ..................................... 06 33 05.2 +10 19 20 7.34 � 0.05 6.70 � 0.05 5.73 � 0.05 2005 Dec 17
Z CMa........................................... 07 03 43.2 �11 33 06 6.66 � 0.05 5.45 � 0.05 3.94 � 0.05 2005 Dec 17
MWC 166 ..................................... 07 04 25.5 �10 27 16 6.32 � 0.05 6.32 � 0.05 6.27 � 0.05 2005 Dec 17
Beta Leo........................................ 11 49 03.6 +14 34 19 1.92 � 0.08 1.96 � 0.07 1.90 � 0.08 2006 Jun 2
Lambda Vir ................................... 14 19 06.6 �13 22 16 4.26 � 0.08 4.25 � 0.07 4.20 � 0.08 2006 Jun 2
HD 141569 ................................... 15 49 57.8 �03 55 16 6.67 � 0.08 6.54 � 0.07 6.48 � 0.08 2006 Jun 2
HD 143006 ................................... 15 58 36.9 �22 57 15 8.18 � 0.08 7.57 � 0.07 5.94 � 0.08 2006 Jun 2
HD 144432 ................................... 16 06 58.0 �27 43 10 7.23 � 0.08 6.69 � 0.07 6.14 � 0.08 2006 Jun 2
HD 150193 (MWC 863).............. 16 40 17.9 �23 53 45 6.84 � 0.08 6.02 � 0.07 5.13 � 0.08 2006 Jun 2
KK Oph......................................... 17 10 08.1 �27 15 18 8.46 � 0.08 7.09 � 0.07 5.71 � 0.08 2006 Jun 2
HD 158643 ................................... 17 31 25.0 �23 57 46 4.76 � 0.08 4.63 � 0.07 4.34 � 0.08 2006 Jun 2
RS Oph ......................................... 17 50 13.2 �06 42 29 7.94 � 0.08 7.17 � 0.07 6.77 � 0.08 2006 Jun 4
MWC 275 ..................................... 17 56 21.3 �21 57 22 6.20 � 0.08 5.48 � 0.07 4.59 � 0.08 2006 Jun 2
HD 169412 ................................... 18 21 33.5 +52 54 08 7.77 � 0.08 7.78 � 0.07 7.79 � 0.08 2006 Jun 2
MWC 297 ..................................... 18 27 39.6 �03 49 52 6.06 � 0.08 4.54 � 0.07 3.12 � 0.08 2006 Jun 4
VV Ser .......................................... 18 28 47.9 +00 08 40 8.60 � 0.08 7.37 � 0.07 6.20 � 0.08 2006 Jun 2
MWC 614 ..................................... 19 11 11.3 +15 47 16 6.91 � 0.08 6.58 � 0.07 5.88 � 0.08 2006 Jun 3
V1295 Aql .................................... 20 03 02.5 +05 44 17 7.15 � 0.08 6.61 � 0.07 5.75 � 0.08 2006 Jun 2
V1685 Cyg.................................... 20 20 28.3 +41 21 52 7.97 � 0.05 7.01 � 0.05 5.86 � 0.05 2005 Dec 17
7.93 � 0.10 6.96 � 0.04 5.81 � 0.07 2006 Jun 3
MWC 342 ..................................... 20 23 03.6 +39 29 50 7.01 � 0.05 5.98 � 0.05 4.78 � 0.05 2005 Dec 17
6.94 � 0.08 5.92 � 0.08 4.65 � 0.08 2006 Jun 3
MWC 361 ..................................... 21 01 36.9 +68 09 48 6.12 � 0.05 5.58 � 0.05 4.77 � 0.05 2005 Dec 17
MWC 1080 ................................... 23 17 25.6 +60 50 43 7.38 � 0.05 6.04 � 0.05 4.68 � 0.05 2005 Dec 17
Notes.—Majority of the MDM targets are YSOs. Units of right ascension are hours, minutes, and seconds, and units of declination are degrees, arcminutes, andarcseconds.
MWC 275 AND AB AURIGAE DISK MODELS 529

curve (see Fig. 5). In this region the visibility-baseline relation for the emission models in Figure 6 can be approximated with a linearfunction. We calculated reduced 2 values for the best-fit line to theW1W2, S2W2, and E2S2 visibilities as a function of effective base-line, varying the assumed inclination and P.A. of the observed disk. Figure 19 shows the reduced 2 surface for the fits, plotted againstthe assumed disk inclination and P.A.. To further illustrate the change in quality of fits as inclination and P.A.s are varied, Figure 20shows the linear fits to the visibility versus effective baseline data set.
As seen in Figures 19 and 20, the quality of the fits show dramatic improvement at MWC 275 disk P.A. of 136� � 2
�and inclination
of 48� � 2�. These values are very close to a disk P.A. of 139� � 15� and inclination of 51þ11�9 degrees determined in Wassell et al.
(2006). The excellent agreement in inclination and P.A. values for MWC 275 from two independent methods strongly supports a diskmodel for MWC 275, validating the use of ‘‘effective baselines’’ to plot MWC 275 visibilities.
Fig. 19.—Reduced 2 surface for the linear fits to the observed visibilities (obtained with the W1W2, S2W2, and E2S2 CHARA telescope pairs) as a function ofeffective interferometric baseline. The solid curves are reduced 2 contours of 5, 3.5, and 1.5, respectively. [See the electronic edition of the Journal for a color versionof this figure.]
Fig. 20.—Linear fits to the observed visibilities (obtained with the W1W2, S2W2, and E2S2 CHARA telescope pairs) as a function of effective interferometricbaseline. The data symbols are explained in Fig. 3. [See the electronic edition of the Journal for a color version of this figure.]
TANNIRKULAM ET AL.530 Vol. 689

REFERENCES
Barth, A. J. 2001, ASP Conf. Ser. 238, Astronomical Data Analysis Softwareand Systems X, ed. F. R. Harnden, Jr., F. A. Primini, & H. E. Payne (SanFrancisco: ASP), 385
Berger, D. H., Monnier, J. D., Millan-Gabet, R., ten Brummelaar, T. A.,Muirhead, P., Pedretti, E., & Thureau, N. 2006, Proc. SPIE, 6268, 62683K
Calvet, N.,Magris, G. C., Patino, A., &D’Alessio, P. 1992, Rev.Mex. AA, 24, 27Chiang, E. I., & Goldreich, P. 1997, ApJ, 490, 368Corder, S., Eisner, J., & Sargent, A. 2005, ApJ, 622, L133Dullemond, C. P., & Dominik, C. 2004, A&A, 421, 1075Dullemond, C. P., Dominik, C., & Natta, A. 2001, ApJ, 560, 957Dullemond, C. P., & Natta, A. 2003, A&A, 408, 161Eisner, J. A. 2007, Nature, 447, 562Eisner, J. A., Chiang, E. I., Lane, B. F., & Akeson, R. L. 2007, ApJ, 657, 347Eisner, J. A., Lane, B. F., Akeson, R. L., Hillenbrand, L. A., & Sargent, A. I.2003, ApJ, 588, 360
Eisner, J. A., Lane, B. F., Hillenbrand, L. A., Akeson, R. L., & Sargent, A. I.2004, ApJ, 613, 1049
Ferguson, J. W., Alexander, D. R., Allard, F., Barman, T., Bodnarik, J. G.,Hauschildt, P. H., Heffner-Wong, A., & Tamanai, A. 2005, ApJ, 623, 585
Fukagawa, M., et al. 2004, ApJ, 605, L53Garcia Lopez, R., Natta, A., Testi, L., & Habart, E. 2006, A&A, 459, 837Grady, C. A., Woodgate, B., Bruhweiler, F. C., Boggess, A., Plait, P., Lindler,D. J., Clampin, M., & Kalas, P. 1999, ApJ, 523, L151
Grady, C. A., et al. 2000, ApJ, 544, 895Harries, T. J. 2000, MNRAS, 315, 722Harries, T. J., Monnier, J. D., Symington, N. H., & Kurosawa, R. 2004,MNRAS,350, 565
Hillenbrand, L. A., Strom, S. E., Vrba, F. J., & Keene, J. 1992, ApJ, 397, 613Isella, A., & Natta, A. 2005, A&A, 438, 899Isella, A., Natta, A., & Testi, L. 2007, A&A, 469, 213Isella, A., Testi, L., & Natta, A. 2006, A&A, 451, 951Jones, B., & Puetter, R. 1993, Proc. SPIE, 1946, 610Kraus, A., Preibisch, T., & Ohnaka, K. 2008, ApJ, 676, 490Kurosawa, R., Harries, T. J., Bate, M. R., & Symington, N. H. 2004, MNRAS,351, 1134
Kurucz, R. L. 1970, SAO Special Report 308 (Cambridge: SAO)Landolt, A. U. 1983, AJ, 88, 439Leinert, Ch., van Boekel, R., Waters, L. B. F. M., Chesneau, O., Malbet, F., &Kohler, R. 2004, A&A, 423, 537
Lin, S., Ohashi, N., Lim, J., Ho, P., Fukagawa,M., & Tamura,M. 2006, ApJ, 645,1297
Liu, W. M., Hinz, P. M., Meyer, M. R., Mamajek, E. E., Hoffmann, W. F.,Brusa, G., Miller, D., & Kenworthy, M. A. 2007, ApJ, 658, 1164
Lucy, L. B. 1999, A&A, 344, 282Mannings, V., & Sargent, A. I. 1997, ApJ, 490, 792Marinas, N., Telesco, C. M., Fisher, R. S., Packham, C., & Radomski, J. T.2006, ApJ, 653, 1353
Meeus, G., Waters, L. B. F. M., Bouwman, J., van den Ancker, M. E.,Waelkens, C., & Malfait, K. 2001, A&A, 365, 476
Merand, A., Borde, P., & Coude Du Foresto, V. 2005, A&A, 433, 1155Millan-Gabet, R., Schloerb, F. P., & Traub, W. A. 2001, ApJ, 546, 358Millan-Gabet, R., Schloerb, F. P., Traub, W. A., Malbet, F., Berger, J. P., &Bregman, J. D. 1999, ApJ, 513, L131
Miroshnichenko, A., Ivezic, Z., & Elitzur, E. 1997, ApJ, 475, L41Monnier, J. D., Tannirkulam, A., Tuthill, P. G., Ireland, M., Cohen, R., Danchi,W. C., & Baron, F. 2008, ApJ, 681, L97
Monnier, J. D., Tuthill, P. G., Ireland, M. J., Cohen, R., & Tannirkulam, A.2004, BAAS, 36, 1367
Monnier, J. D., et al. 2007, Science, 317, 342———. 2006, ApJ, 647, 444———. 2005, ApJ, 624, 832Muzerolle, J., D’Alessio, P., Calvet, N., & Hartmann, L. 2004, ApJ, 617, 406Natta, A., Prusti, T., Neri, R., Wooden, D., Grinin, V. P., & Mannings, V. 2001,A&A, 371, 186
Natta, A., Testi, L., Neri, R., Sheperd, D. S., &Wilner, D. J. 2004, A&A, 416, 179Oppenheimer, B. R., et al. 2008, ApJ, 679, 1574Ossenkopf, V., Henning, Th., Mathis, J. S. 1992, A&A, 261, 567Pinte, C.,Menard, F., Berger, J. P., Benisty,M., &Malbet, F. 2008, A&A, in pressPollack, J. B., Hollenbach, D., Beckwith, S., Simonelli, P. D., Roush, T., &Fong, W. 1994, ApJ, 421, 615
Pontoppidan, K. M., Dullemond, C. P., Blake, G. A., Adwin Boogert, A. C.,van Dishoeck, E. F., Evans, N. J., Kessler-Silacci, J., & Lahuis, F. 2007, ApJ,656, 980
Semenov, D., Pavlyuchenkov, Ya., Schreyer, K., Henning, Th., Dullemond, C.,& Bacmann, A. 2005, ApJ, 621, 853
Shakura, N. I., & Sunyaev, R. A. 1973, A&A, 24, 337Sitko, S. L., et al. 2008, ApJ, 678, 1070Tannirkulam, A. T., Harries, T. J., & Monnier, J. D. 2007, ApJ, 661, 374Tannirkulam, A. T., et al. 2008, ApJ, 677, L51 (T08)ten Brummelaar, T. A., et al. 2005, ApJ, 628, 453Tuthill, P. G., Monnier, J. D., & Danchi, W. C. 2001, Nature, 409, 1012van Boekel, R., Dullemond, C. P., & Dominik, C. 2005a, A&A, 441, 563van Boekel, R., Min, M., Waters, L. B. F. M., de Koter, A., Dominik, C., van denAncker, M. E., & Bouwman, J. 2005b, A&A, 437, 189
Vinkovic, D., Ivezic, Z., Jurkic, T., & Elitzur, M. 2006a, ApJ, 636, 348Walker, C., Wood, K., Lada, C. J., Robitaille, T., Bjorkman, J. E., &Whitney, B.2004, MNRAS, 351, 607
Wassell, E. J., Grady, C. A., Woodgate, B., Kimble, R. A., & Bruhweiler, F. C.2006, ApJ, 650, 985
Weiner, J., et al. 2006, ApJ, 636, 1067Wisniewski, J. P., Clampin, M., Grady, C. A, Ardila, D. R., Ford, H. C.,Gomilowski, D. A., Illingworth, G. D., & Krist, J. E. 2008, ApJ, 682, 548
Zhu, Z., Hartmann, L., Calvet, N., Hernandez, J., Muzerolle, J., & Tannirkulam,A. 2007, ApJ, 669, 483
MWC 275 AND AB AURIGAE DISK MODELS 531No. 1, 2008