a survey of longitudinal acceleration comfort studies in
TRANSCRIPT

A SURVEY OF LONGITUDINAL ACCELERATION COMFORT STUDIES IN GROUND TRANSPORTATION VEHICLES
l. l. HOBEROCK
RESEARCH REPORT 40
JULY 1976
.~ DEPARTMENT OF TRANSPORTATION ,;i.ii OFFICE OF UNIVERSITY RESEARCH sj WASHINGTON, D. C. 20590 ~4'
'rHE UnlVER/lTY OF TEXRI RT RUlTln

RESEARCH REPORTS PUBLISHED BY THE COUNCIL FOR ADVANCED TRANSPORTATION STUDIES
1 An Integrated Methodology for Estimating Demand for Essential Services with an Application to Hospital Care. Ronald Briggs, Wayne T. Enders, James Fitzsimmons, and Paul Jensen, April 1974 (DOT-TST-75-81). 2 Transportation Impact Studies: A Review with Emphasis on Rural Areas. Lidvard Skorpa, Richard Dodge, C Michael Walton, and
John Huddleston, October 1974 (DOT-TST-75-59). 4 Inventory of freight Transportation in the Southwest/Part I: Major Users of Transportation in the Dallas-fort Worth Area.
Eugene Robinson, December 1973 (DOT-TST-75-29). 5 Inventory of freight Transportation in the Southwest/Part II: Motor Common Carrier Service in the Dallas-fort Worth Area. J.
Bryan Adair and James S. Wilson, December 1973 (DOT-TST-75-30). 6 Inventory of freight Transportation in the Southwest/Part III: Air freight Service in the Dallas-fort Worth Area. J. Bryan Adair,
June 1974 (DOT -TST -75-31). 7 Political Decision Processes, Transportation Investment and Changes in Urban Land Use: A Selective Bibliography with Par
ticular Reference to Airports and Highways. William D. Chipman, Harry P. Wolfe, and Pat Burnett, March 1974 (DOT-TST-75-28). 9 Dissemination of Information to Increase Use of Austin Mass Transit: A Preliminary Study. Gene Burd, October 1973.
10 The University of Texas at Austin: A Campus Transportation Survey. Sandra Rosenbloom, Jane Sentilles Greig, and Lawrence Sullivan Ross, August 1973. 11 Carpool and Bus Matching Programs for The University of Texas at Austin. Sandra Rosenbloom and Nancy Shelton Bauer, September 1974. 12 A Pavement Design and Management System for forest Service Roads: A Conceptual Study. W. R. Hudson and Thomas G. McGarragh, July 1974. 13 Measurement of Roadway Roughness and Motion Spectra for the Automobile Highway System. Randall Bolding, Anthony Healey, and Ronald Stearman, December 1974. 14 Dynamic Modeling for Automobile Acceleration Response and Ride Quality Over Rough Roadways. Anthony Healey, Craig C Smith, Ronald Stearman, and Edward Nathman, December·1974. 15 Survey of Ground Transportation Patterns at the Dallas-fort Worth Regional Airport. William J. Dunlay, Jr., Thomas G. Caffery, Lyndon Henry, and Douglas Wiersig, August 1975. 16 The Prediction of Passenger Riding Comfort from Acceleration Data. Craig C Smith, David Y. McGehee, and Anthony J. Healey, March 1976. 17 The Transportation Problems of the Mentally Retarded. Shane Davies and John W. Carley, December 1974. 18 Transportation-Related Constructs of Activity Spaces of Small Town Residents. Pat Burnett, John Betak, David Chang, Wayne Enders, and Jose Montemayor, December 1974 (DOT-TST-75-135). 19 Marketing of Public Transportation: Method and Application. Mark I. Alpert and Shane Davies, January 1975. 20 The Problems of Implementing a 911 Emergency Telephone Number System in a Rural Region. Ronald T. Matthews, February 1975. 23 forecast of Truckload freight of Class I Motor Carriers of Property. Mary Lee Gorse, March 1975 (DOT-TST-75-138). 24 forecast of Revenue freight Carried by Rail in Texas to 1990. David L Williams, April 1975 (DOT-TST-75-139). 28 Pupil Transportation in Texas. Ronald Briggs, Kelly Hamby, and David Venhuizen, July 1975. 30 Passenger Response to Random Vibration in Transportation Vehicles. Anthony J. Healey, June 1975. 35 Perceived Environmental Utility under Alternative Transportation Systems: A framework for AnalYSis. Pat Burnett, March 1976. 36 Monitoring the Effects of the Dallas/fort Worth Regional Airport. Volume I: Ground Transportation Impacts. William J. Dunlay, Jr., Thomas G. Caffery, Lyndon Henry, Douglas W. Wiersig, and Waldo Zambrano, December 1976. 37 Monitoring the Effects of the Dallas/fort Worth Regional Airport. Volume II: Land Use and Travel Behavior. Pat Burnett, David Chang, Carl Gregory, Arthur Friedman, Jose Montemayor, and Donna Prestwood, July 1976. 38 Transportation and Community Deve/opment-A Manual for Small Communities: level I, Volume I-Executive Summary; Volume II-The Planning Process. Richard Dodge, John Betak, C Michael Walton, Charles Heimsath, and John Huddleston, July 1976. 39 An Evaluation of Promotional Tactics and Utility Measurement Methods for Public Transportation Systems. Mark Alpert, linda Golden, John Betak, James Story, and C Shane Davies, March 1977. 40 A Survey of Longitudinal Acceleration Comfort Studies in Ground Transportation Vehicles. l. l. Hoberock, July 1976. 41 Lateral Steering Dynamics Model for the Dallas/fort Worth AIRTRANS. Craig C Smith, December 1976 (Draft Report). 42 Guideway Sidewall Roughness and GuidewheelSpring Compressions of the Dallas/fort Worth AIRTRANS. William R. Murray and Craig C Smith, August 1976 (Draft Report). 43 A Pavement Design and Management System for forest Service Roads: A Working Model. Freddy L. Roberts, B. Frank McCullough, Hugh J. Williamson, William R. Wallin, February 1977. 44 A Tandem-Queue Algorithm for Evaluation of Overall Airport Capacity. Chang-Ho Park, April 1977 (Draft Report). 45 Characteristics of Local Passenger Transportation in Texas. Ronald Briggs, January 1977 (Draft Report).
RESEARCH MEMORANDA PUBLISHED BY THE COUNCIL FOR ADVANCED TRANSPORTATION STUDIES
1 Human Response in the Evaluation of Modal Choice Decisions. C. Shane Davies, Mark Alpert, and W. Ronald Hudson, April 1973.
2 Access to Essential Services. Ronald Briggs, Charlotte Clark, James Fitzsimmons, and Paul Jensen, April 1973. 3 Psychological and Physiological Responses to Stimulation. D. W. Wooldridge, A. J. Healey, and R. O. Stearman, August 1973. 4 An Intermodal Transportation System for the Southwest: A Preliminary Proposal. Charles P. Ziatkovich, September 1973. 5 Passenger Travel Patterns and Mode Selection. Shane Davies, Mark Alpert, Harry Wolfe, and Rebecca Gonzalez, October 1973. 6 Segmenting a Transportation Market by Determinant Attributes of Modal Choice. Shane Davies and Mark Alpert, October 1973. 7 The Interstate Rail System: A Proposal. Charles P. Ziatkovich, December 1973. 8 Literature Survey on Passenger and Seat Modeling for the Evaluation of Ride Quality. Bruce Shanahan, Ronald Stearman, and
Anthony Healey, November 1973. 9 The Definition of Essential Services and the Identification of Key Problem Areas. Ronald Briggs and James Fitzsimmons, January
1974. 10 A Procedure for Calculating Great Circle Distances Between Geographic Locations. J. Bryan Adair, March 1974. 11 MAPRINT: A Computer Program for Analyzing Changing Locations of Non-Residential Activities. Graham Hunter, Richard Dodge, and C. Michael Walton, March 1974. 12 A Method for Assessing the Impact of the Energy Crisis on Highway Accidents in Texas. E. L Frome and C. Michael Walton, February 1975. 13 State Regulation of Air Transportation in Texas. Robert C. Means and Barry Chasnoff, April 1974. 14 Transportation Atlas of the Southwest. Charles P. Ziatkovich, S. Michael Dildine, Eugene Robinson, James W. Wilson, and J. Bryan Adair, June 1974. 15 Local Governmental Decisions and Land-Use Change: An Introductory Bibliography. W. D. Chipman, May 1974. 16 An Analysis of the Truck Inventory and Use Survey Data for the West South Central States. Michael Dildine, July 1974. 17 Towards Estimating the Impact of the Dallas-Fort Worth Regional Airport on Ground Transportation. William J. Dunlay and lyndon Henry, September 1974. 18 The Attainment of Riding Comfort for a Tracked Air-Cushion Vehicle Through the Use of an Active Aerodynamic Suspension. Bruce Shanahan, Ronald Stearman, and Anthony Healey, September 1974. 19 Legal Obstacles to the Use of Texas School Buses for Public Transportation. Robert Means, Ronald Briggs, John E. Nelson, and Alan J. Thiemann, January 1975. 20 Pupil Transportation: A Cost Analysis and Predictive Model. Ronald Briggs and David Venhuizen, April 1975. 21 Variables in Rural Plant Location: A Case Study of Sealy, Texas. Ronald linehan, C. Michael Walton, and Richard Dodge, February 1975. 22 A Description of the Application of Factor Analysis to Land Use Change in Metropolitan Areas. John Sparks, Carl Gregory, and Jose Montemayor, December 1974. 23 A Forecasr of Air Cargo Originations in Texas to 1990. Mary lee Metzger Gorse, November 1974. 24 A Sysrems Analysis Procedure for Estimating rhe Capacity of an Airport: A Selected Bibliography. Chang-Ho Park, Edward V. Chambers, III, and William J. Dunlay, Jr., August 1975. 25 System 2000-Data Management for Transportation Impact Studies. Gordon Derr, Richard Dodge, and C. Michael Walton, September 1975. 26 Regional and Community Transportation Planning Issues: A Selected Bibliography. John Huddleston, Ronald linehan, Abdulla Sayyari, Richard Dodge, C. Michael Walton, and Marsha Hamby, September 1975. 27 A Sysrems Analysis Procedure for Estimating the Capacity of an Airport: System Definition, Capacity Definition, and Review of Available Models. Edward V. Chambers, III, Tommy Chmores, William J. Dunlay, Jr., Nicolau D. F. Gualda, B. F. McCullough, ChangHo Park, and John Zaniewski, October 1975. 28 The Application of Factor Analysis to Land Use Change in a Metropolitan Area. John Sparks and Jose Montemayor, November 1975. 29 Current Status of Motor Vehicle Inspection: A Survey of Available Literature and Information. John Walter Ehrfurth and David A. Sands, December 1975. 30 Executive Summary: Short Range Transit Improvement Study for The University of Texas at Austin. C. Michael Walton, May 1976. 31 A Preliminary Analysis of the Effects of the Dallas-Fort Worth Regional Airport on Surface Transportation and Land Use. Harry Wolfe, April 1974. 32 A Consideration of the Impact of Motor Common Carrier Service on the Development of Rural Central Texas. James Wilson, February 1975. 33 Modal Choice and the Value of Passenger Travel Time Literature: A Selective Bibliography. Shane Davies and Mark I. Alpert, March 1975. 34 Forecast of Air Cargo Originations in Arkansas, Louisiana, and Oklahoma to 1990. Deborah Goltra, April 1975. 35 Inventory of Freight Transportation in the Southwest/Part IV: Rail Service in the Dallas-Fort Worth Area. Charles P. Ziatkovich, Mary l. Gorse, Edward N. Kasparik, and Dianne Y. Priddy, April 1975. 36 Forecast of Waterborne Commerce Handled by Texas Ports to 1990. Stuart Metz Dudley, April 1975. 37 Forecast of Refinery Receipts of Domestic Crude Oil from Pipelines in the West South Central States to 1990. Mary l. Gorse, Dianne Y. Priddy, and Deborah J. Goltra, April 1975. 38 A Feasibility Study of Rail Piggyback Service Between Dallas-Fort Worth and San Antonio. Edward N. Kasparik, April 1975. 39 Land Value Modeling in Rural Communities. lidvard Skorpa, Richard Dodge, and C. Michael Walton, June 1974. 40 Toward Computer Simulation of Political Models of Urban Land Use Change. Carl Gregory, August 1975. 41 A Multivariate Analysis of Transportation Improvements and Manufacturing Growth in a Rural Region. Ronald linehan, C. Michael Walton, and Richard Dodge, October 1975. 42 A Transit Demand Model for Medium-Sized Cities. John Short reed, December 1975.

O"'iiiiijil~r L007895
A SURVEY OF LONGITUDINAL ACCELERATION COMFORT STUDIES
IN GROUND TRANSPORTATION VEHICLES
L. L. Hoberock
July 1976 Research Report
Document is Available to the Public Through the National Technical Information Service
Springfield, Virginia 22151
Prepared for
Council for Advanced Transportation Studies The University of Texas at Austin
Austin, Texas 78712
In Cooperation With
Department of Transportation Office of University Research
Washington, D. C. 20590

NOTICE
This document is disseminated under the sponsorship of the Department of Transportation, Office of University Research, in the interest of information exchange. The United States Government and The University of Texas Assume no liability for its contents or use thereof.

T ecluliccl R.,..t Doc ...... ti ... Pap
1 ........... 2. ..... .... _ Acc ... ion No. 3. R.cipo-,'& C....a ... No.
4. Titl .... Sodttltl. 5. R_f' Dote
July 1976 A SURVEY OF LONGITUDINAL ACCELERATION COMFORT 6. P .. fo .... "11 O,_lo.i_ c ..... STUDIES IN GROUND TRANSPORTATION VEHICLES
•. P ... to-i ... 0 ...... & ........ R ....... No. 7. ~a)
Research Report 40 L. L. Hoberock 9. , ......... 0 .... 1 • .-1 .. N_ .. 01 "" ...... 10. w .... Uni' No. (TRAIS)
Council for Advanced Transportation Studies 11. Centrod o. G._t No. The University of Texas at Austin DOT OS 30093 Austin, Texas 13. T".. of R_f' on" P ... lod Cove •• d
12. s.-._I •• ......,l'"- .... AM ....
Research Report Department of Transportation Office of University Research 14. Spon"orino Aoency Cod.
15. Suppl_,-l' No ...
1'6 ....... boct
Experimental studies of objective and subjective passenger response to various fore-and-aft, or longitudinal, vehicle acceleration transients are reviewed. It is found that the wide variability in type of study and form of results does not allow conclusive statements to be made regarding passenger acceptability of any specific acceleration - jerk profile in a given transportation system.
17. IC.." ........ II. Dlstrl"'li_ St .. _t
Passenger Comfort; Human Factors; Document is available through the Acceleration Profiles; Ride Quality; National Technical Information Vehicle Comfort Control. Service, Springfield, Virginia 22151.
It. $ewrity a ...... (of .1 ........ ' 3t. s.-It" Cl .... f. (.f this ,...) 21. N •• of p ..... 22.. Price
Unclassified Unclassified 40

EXECUTIVE SUMMARY
INTRODUCTION AND PROBLEM STATEMENT
This report surveys available experimental results on passenger comfort
due to changes in a vehicle's longitudinal direction. The purpose of the
study was to assess the state-of-the-art in passenger tolerances to longitud
inal acceleration and jerk loads. These effects bear on the design of vehicle
propulsion and braking systems, as well as central headway, speed, and sched
uling controls, for automated, high-capacity vehicle networks.
RESULTS AND CONCLUSION
The literature survey uncovered a total of eleven studies dealing with
passenger comfort due to longitudinal motion. Of these, six were "subjective"
studies, in which selected passengers were exposed to various motion changes
and asked to record their feelings about the motion on a questionnaire. The
remaining five studies attempted to objectively measure some comfort-related
parameters, such as loss of balance or severity of brake application. It is
found that the wide variability in type of study and form of results does not
allow conclusive statements to be made regarding passenger acceptability of
any specific acceleration-jerk profile in a given transportation system. The
survey did indicate, however, that for public mass transportation, steady
non-emergency accelerations in the range 0.11 g to 0.15 g fall in the "accept
able" range for most studies, and could be larger. It is unlikely that values
of jerk larger than 0.30 gls would be acceptable for most public transportation.

ACKNOWLEDGEMENT
The author expresses his appreciation to J. W. Gebhard for his suggestions
and assistance in locating some of the references. The work was supported
under the University Research Program of the U. S. Department of Transportation,
Contract DOT-OS-30093.

TABLE OF CONTENTS
ACKNOWLEDGEMENTS •
TABLE OF CONTENTS
LIST OF FIGURES
LIST OF TABLES •
INTRODUCTION . .
PART I: ACCELERATION AND DECELERATION LEVELS IN CURRENT USE . . . . . .
Objective Comfort Measurements
Subjective Comfort Measurements .
PART II: CONCLUSION.
REFERENCES
THE AUTHOR
ii
i
ii
iii
iv
1
3
3
20
37
38
. . . . 40
Figure 1.
LIST OF FIGURES
Frequency Distribution of Braking Decelerations (After Mortimer [7J) . . . . . . . . . . . . . .
Figure 2. Acceleration Histograms (After Torres [8])
Figure 3. Acceleration Noise vs. Volume (After Torres [8J) ....
Figure 4. Tentative Acceptance Curves for the Acceleration of a Floor (After Browning [10J) ....... .
iii
7
8
10
19
LIST OF TABLES
TABLE 1. ACCELERATION LEVELS FOR VARIOUS PASSENGER
TABLE 2.
TABLE 3.
TABLE 4.
TABLE 5
TABLE 6.
TABLE 7.
TABLE 8.
TABLE 9.
VEHICLES . • . . • . . . . . • . . . .
DECELERATION LEVELS FOR THREE VEHICLE SYSTEMS . • . . . . . . . . . . . . .
CONDITIONS USED FOR LOSS-OF-BALANCE TESTS (AFTER HIRSHFELD [9J AND GEBHARD [1J)
STARTING METHOD A: PERCENT OF TESTS IN WHICH BALANCE WAS RETAINED, UNSUPPORTED FORWARDFACING STANDEES (AFTER HIRSHFELD [9J AND GEBHARD [1 J ) . . . . . . . . . . . . . . . .
STARTING METHOD C: PERCENT OF TESTS IN WHICH BALANCE WAS RETAINED, UNSUPPORTED FORWARDFACING STANDEES (AFTER HIRSHFELD [9J AND GEBHARD [1 J) ............. .
STARTING METHOD A: AVERAGE ACCELERATION OBTAINED BEFORE LOSS OF BALANCE (AFTER HIRSHFELD [9J AND GEBHARD [1J) ..... .
EVALUATION OF 70 MPH STOPS IN AUTOMOBILES AT GM PROVING GROUND (AFTER WILSON [6J)
EVALUATION OF ELECTRIC TRAIN MOTIONS (AFTER LOACH [13J) ........ .
EVALUATION OF TROLLEY BUS MOTIONS (AFTER LOACH [13J) ....... .
TABLE 10. DESCRIPTORS USED FOR JUDGEMENTS ABOUT ACCELERATION AND DECELERATION IN JNR TESTS (AFTER GEBHARD [1J) ....
TABLE 11. DECELERATION AND JERK EVALUATIONS (AFTER MATSUI [17]) ...... .
TABLE 12. CONSTANT DECELERATION AND FINAL JERK VALUES MARKED "STRONG FEELING" BY THE INDICATED PERCENTAGE OF RATERS [19J
TABLE 13. CONSTANT DECELERATION AND FINAL JERK VALUES MARKED "NOT PERMISSIBLY UNCOMFORTABLE" BY THE INDICATED PERCENTAGES OF RATERS [19J
iv
4
5
12
14
15
17
23
24
25
27
29
31
32

TABLE 14. RIDE COMFORT SUMMARY FOR TWO PRT VEHICLES (AFTER CUSSIK AND MOORING [15J) .....
TABLE 15. RIDE QUALITY COMPARISONS OF "EXPERTS" AND "NORMALS" (AFTER CUSSIK AND MOORING [15J)
v
34
36

INTRODUCTION
Passenger comfort in public ground transportation is determined by the
changes in motion felt in all directions, as well as by other environmental
effects. This report, however, treats only comfort due to motion changes in
a vehicle's longitudinal direction, that is, in its direction of travel or
fore-and-aft direction. In automated or semi-automated vehicle network, fast
starts and stops will be necessary in order to merge vehicles into high speed
traffic at close headways. However, the limiting factor in operating a
vehicle network at high capacity, high velocity, and short trip times may in
fact be passenger intolerance of the high longitudinal acceleration and jerk
loads required. If passengers are unrestrained in the vehicle, the standees,
aged. infirm and children will be the critical passengers to consider. Pass
enger tolerances to longitudinal acceleration and jerk loads will thus affect
not only the design of the vehicle propulsion and braking system, but also
the central headway, speed, and scheduling controls for the entire network.
To assess the state-of-the-art in this area, the work that follows surveys
available experimental studies of longitudinal comfort.
1

!!!!!!!!!!!!!!!!!!!"#$%!&'()!*)&+',)%!'-!$-.)-.$/-'++0!1+'-2!&'()!$-!.#)!/*$($-'+3!
44!5"6!7$1*'*0!8$($.$9'.$/-!")':!

PART I
ACCELERATION AND DECELERATION LEVELS IN CURRENT USE
An excellent review of experimental longitudinal comfort studies prior
to 1970 can be found in the work by Gebhard [lJ*. He points out that conven
tional subways and commuter trains are designed to accelerate at about 3.0 mph/s
(4.830 kph/s) or .138 g. Long cross-country passenger trains accelerate less
than half this fast. Table 1 provides some acceleration data for a variety
of passenger vehicles. It should be observed that none of the acceleration
values for the public ground systems, in which passengers may be standing,
exceeds 0.16 g. On the other hand, if a passenger is properly seated (car or
airplane) or prepared (motorcycle), the acceleration levels can be as high as
1/2 g or larger.
Deceleration levels specified for various transportation vehicles depend
upon whether the braking is normal, called service braking, or emergency.
For electric rapid transit cars in the U.S., Reference [5J indicates normal
braking of 0.12 g to 0.14 g and emergency braking from 0.14 g to 0.30 g. An
automobile can decelerate at rates larger than 0.6 g [6J. Table 2 lists normal
and emergency deceleration capability for the first three vehicle systems of
Table 1.
Objective Comfort Measurements
Most of the known attempts to assess passenger comfort have used a
"questionnaire," or subjective approach. In these studies, which will be
reviewed in the next section, selected subjects were placed in vehicles or
laboratory devices, exposed to various motion changes, and asked to record
their feelings about the motion on a questionnaire. In this section, we re
view those few studies available in which some objective measurement of comfort
related parameters was attempted. Objective studies have the advantage that
results are less easily open to misinterpretation than are results of subject
ive studies.
* Numbers in brackets refer to references at the end.
3

TABLE 1.
ACCELERATION LEVELS FOR VARIOUS PASSENGER VEHICLES
Vehicle
Morgantown PRT System (Morgantown, West Virginia)
AI RTRAN S (Dallas-Fort Worth Airport)
BART (San Francisco)
Motor Cars
VW 1500
Ford Fairlane
Pontiac Grand Prix
Motorcycle
Norton 750
Commercial Jet
Aircraft Takeoff
Approximate
mph/s
3.0
2.5
3.3
4.5
7.9
10.0
13.0
11.0
Maximum
kph/s
4.8
4.1
5.3
7.2
12.7
16.1
20.9
17.7
Acceleration
g
.137
.116*
.152*
.205
.360
.456
.593
.501
Reference
2
3
4
1
1
1
1
1
*These vehicle systems have a number of acceleration and jerk specifications, depending on the operating condition. The values listed are the maximums.
4

TABLE 2.
DECELERATION LEVELS FOR THREE VEHICLE SYSTEMS
Vehicle Max. Normal Dec Max. Emergency Dec Reference
mph/s kph/s g mph/s kph/s g
Morgantown 3.0 4.8 .137 7.2 11.5 0.330 2
AI RTRAN S 2.5 4.1 .116 6.1 9.8 0.280 3
BART 3.3 5.3 .152 3.3 5.3 0.152 4
5
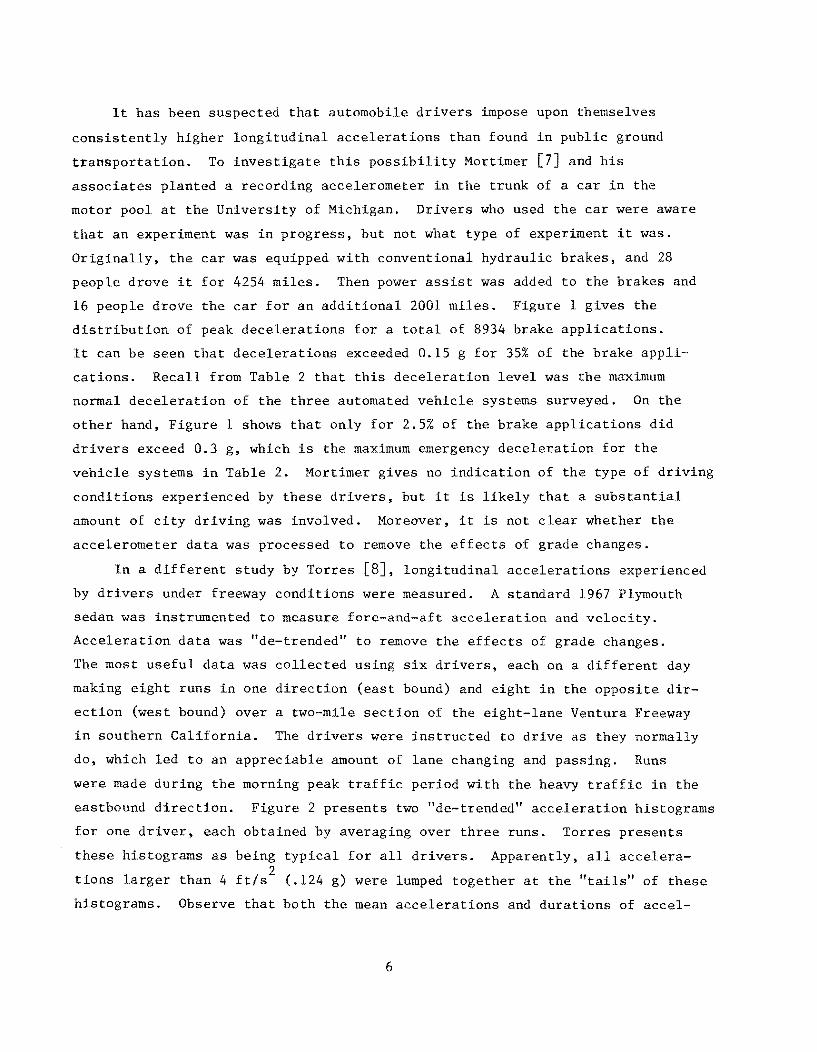
It has been suspected that automobile drivers impose upon themselves
consistently higher longitudinal accelerations than found in public ground
tratl.sportation. To investigate this possibility Mortimer [7] and his
associates planted a recording accelerometer in the trunk of a car in the
motor pool at the University of Michigan. Drivers who used the car were aware
that an experiment was in progress, but not what type of experiment it was.
Originally, the car was equipped with conventional hydraulic brakes, and 28
people drove it for 4254 miles. Then power assist was added to the brakes and
16 people drove the car for an additional 2001 miles. Figure 1 gives the
distribution of peak decelerations for a total of 8934 brake applications.
It can be seen that decelerations exceeded 0.15 g for 35% of the brake appli
cations. Recall from Table 2 that this deceleration level was the maximum
normal deceleration of the three automated vehicle systems surveyed. On the
other hand, Figure 1 shows that only for 2.5% of the brake applications did
drivers exceed 0.3 g, which is the maximum emergency deceleration for the
vehicle systems in Table 2. Mortimer gives no indication of the type of driving
conditions experienced by these drivers, but it is likely that a substantial
amount of city driving was involved. Moreover, it is not clear whether the
accelerometer data was processed to remove the effects of grade changes.
In a different study by Torres [8J, longitudinal accelerations experienced
by drivers under freeway conditions were measured. A standard 1967 Plymouth
sedan was instrumented to measure fore-and-aft acceleration and velocity.
Acceleration data was "de-trended" to remove the effects of grade changes.
The most useful data was collected using six drivers, each on a different day
making eight runs in one direction (east bound) and eight in the opposite dir
ection (west bound) over a two-mile section of the eight-lane Ventura Freeway
in southern California. The drivers were instructed to drive as they normally
do, which led to an appreciable amount of lane changing and passing. Runs
were made during the morning peak traffic period with the heavy traffic in the
eastbound direction. Figure 2 presents two "de-trended" acceleration histograms
for one driver, each obtained by averaging over three runs. Torres presents
these histograms as being typical for all drivers. Apparently, all accelera-2
tions larger than 4 ftls (.124 g) were lumped together at the "tails" of these
histograms. Observe that both the mean accelerations and durations of accel-
6

'-.I
0'
z o ~ 0:: W .J
0.6
0.4
~ 0.2 w a
o 100
. . . . . . . . .
. . .
10
PERCENT OF DECELERATIONS EXCEEDING 9
Figure 1. Frequency Distribution of Braking Decelerations
0.1 0.01
ter Mortimer [7J).

60
z ::> 50 a::
a:: w a..
Cf)
Cl Z o Q W
40
Cf) 30
l.L. o
a:: 20 w II)
~ ::> z
w 10 (!)
<t 0:: W
~
ACCELERATION (g)
-.12 -.08· -.04 0 .04 .08 .12
:- . .
00 -4 -3 -2 -I
~.
:....J .'
o
AVERAGE OVER RUNS
303,305,307
AVERAGE CONCENTRATION = 252 VEHICLES/MILE
AVERAGE 5min. VOLUME= 625 VEHICLES
AVERAGE ACCELERATION NOISE =
1.203 fl. /sec.2
AVERAGE OVER RUNS 308, 310,314
AVERAGE CONCENTRATION= 71.1 VEHICLES/MILE
AVERAGE 5min. VOLUME= 400 VEHICLES
AVERAGE ACCELERATION NOISE =
0.9Ift./sec. 2
2 3 400
ACCELERATION (ft/s 2)
Figure 2. Acceleration Histograms (After Torres [8J).
8

eration change dramatically with vehicle concentration. Unfortunately, mean
accelerations across the driver set for various traffic conditions were
apparently biased by calibration errors. However, the standard deviations of
the detrended acceleration data appear valid and were found to be related to
traffic volume, as shown in Figure 3. Torres calls this standard deviation
"acceleration noise" and considers it a measure of driver effort or stress.
As the geometry of the highway or prevailing traffic conditions change, the
driver is forced to adapt dynamically. Unfortunately, road-vehicle interact
ions and wind buffeting, rather than driver effects, may account for the
"acceleration" noise at higher speeds. These effects may also account for
some of the large dispersion of data in Figure 3. No attempt was made to
separate these effects from driver effects. As expected, higher speeds occur
at lower volumes, such that wind-buffeting and road-vehicle interaction effects
would be most severe at the lower volumes. If, as Torres suggests, "acceler
ation noise" i.s a measure of driver stress, one might support from these results
a suspicion that such stress increases with traffic volume. On the other
hand, the relationship between stress and acceleration noise has not been con
clusively established and remains a subjective assumption.
A different type of measurement was done by Hirschfeld [9J in the 1930's
to determine the effects of motion on loss of balance of standing passengers.
This investigation merits special consideration for several reasons: (1) stand
ing passengers may in fact be the critical elements in governing longitudinal
motion characteristics in public ground transportation; (2) the study uncover
ed evidence that different acceleration - jerk profiles produce different
results, such that single-number specifications for these quantities may be
incomplete. In what follows, we trace Gebhard's [lJ summary of Hirshfeld's
[9J results.
The experimental laboratory arrangement consisted of a small car riding
on a smooth track such that the car could accelerate from rest at any value
up to 12 ft/s2 (.373 g) with jerk at any value up to 50 ft/s3 (1.553 g/s).
The measured quantity for a standing passenger facing forward in the car was
"loss of balance," which was electrically recorded when the standee either
grabbed a handrail for support or moved either foot from the prescribed pos
ition: left heel eight inches (20.3 cm) in front of and ten inches (25.4 cm)
9
1.7
1.6 (;)
At) e
+
to -to
0
a to
1.5 lC
<6
~
1.4 WEST EAST DRIVER Co +
)( +0 <:>
to 'It
• 0 0 + q
1.3
(\I
• 1.2 ...... --+ • I
• a 2 . • 3 a ,. 4 .c JC 5
0 lc
+ 0
(i)
D ... 'It
)r ~
(!) -I&J 1.1 en 0 ...... z 1.0 0
z 2 0.9 ti ex: I&J 0.8 ..J I&J • (,) (,) 0.7 «
• .. + . ~
A 0
A/ (!)
)( leA
0 A
a <6
.~ ....
6> If GI
oX
~ -2
• ~ Z 0
It) ti 0 It:
I&J .j I&J
+ U
to U N « 0
N ~
0.6 I"A • ...
0.5 t ... • • 0.4
0.3
• ..
• •
• •
I
.. I
• .. •
•
to (5
0 jo 300 400 500 600 650
FIVE MINUTE VOLUME - NUMBER OF VEHICLES
3. Acceleration Noise vs. Volume (After Torres [8J)

to the left of the right heel, with electrical contacts at the left toe and
right heel.
A total of 110 subjects of both sexes of various ages (11 to 78 years),
heights (4'4" to 6'4"), weights (87 to 235 pounds), and backgrounds were test
ed under a variety of starting conditions. The most significant of these
conditions were as follows: A
A. Acceleration ~ was increased linearly from zero at constant jerk j, A A A
such that a = jt where t is time. Values of j ranged from less
than 1 to 10 ft/s3 (less than .031 g/s to 0.311 g/s) and t ranged
up to 7 secs.
B. Acceleration was increased from 0 very rapidly to a specified con
stant value. This was accomplished by suddenly releasing the brake
from a car having a specified pre-release force. This force yielded
jerk values of 10 ft/s3 (.311 g/s) or greater over a period of 1
second or less. Values for the final constant acceleration phase
ranged from 1.0 to 3.5 ft/s2 (.031 to .109 g). A
C. Jerk was increased linearly from 0 such that j = kIt. Thus, accelera-
tion increased parabolically from 0 according to a 0.5 k1t2. Values
of k1 ranged from 0.2 to 1.0 ft/s4 (.0062 to .031 g/s2) and t ranged
up to 7 seconds.
D. A short initial "warning" period of constant low acceleration for
3 seconds was followed by a parabolic increase in a as in Method C.
The initial value of a. ranging from 1 to 2 ft/s2 (.031 to .062 g).
was established by linearly increasing the acceleration from 0 at
values of j from 2 to 7 ft/s2 (.062 to .219 g/s).
Table 3 lists the number of subjects and tests run, together with the positions
of the subjects, for each of the four methods. A major difficulty with the
data reported by Hirshfeld is that the results for subjects are pooled, and
the data is given as the percentage of tests in which all riders maintained
balance to a given level of acceleration. Moreover, no attempt was made to
use the same subjects for all of the test conditions, or for that matter, for
all the various values for j or k1 in any one testing condition. Different
subjects and different numbers of subjects were used in the various tests.
11
l.
2.
3.
4.
5.
6.
7.
8.
9.
10.
TABLE 3.
CONDITIONS USED FOR LOSS-OF-BALANCE TESTS
(AFTER HIRSHFELD [9] AND GEBHARD ["' J)
Subject's Position
Facing Forward, Unsupported
Facing Forward, Unsupported
Facing Forward, Unsupported
Facing Forward, Unsupported
Facing Forward, Unsupported
Facing Sideways, Unsupported
Facing Forward, Holding Over-Head Strap
Facing Forward, Holding Vertical Stanchion
Facing Forward, Males on Low and High Heels
Facing Forward, Females On Low and High Heels
Starting Method
A
B
C
D
A
A
A
A
A
A
12
Number Of Subjects
79
25
44
15
23
22
26
27
6
3
Number Of Tests
489
236
133
81
98
74
123
87
37
9
Hirshfeld reports that a given subject was extremely variable in ability to
retain balance, although this variability is not quantified. Variability
between subjects was also large, but this variability was not related to any
subject characteristics such as sex, age, or height.
Results for several values of j are given in Table 4 for Method A with
unsupported subjects facing forward, Condition 1, Table 3. The only case for
which the number N of tests is mentioned is for j = 4.5 ft/s3 (.140 g/s), for
which N = 58. As may be seen from the table for values of ~ between 3 and 7
ft/s2 (.094 and .217 g), higher balance retention is obtained for the larger
jerk values. Hirshfeld suggests that this may be due to a subject's tendency
to qUickly sense and strongly adjust to high jerk values, carrying through the
adjusting posture to high values of a. Low jerk values, on the other hand,
are more casually accepted such that the subject does not have a strong compen
sating posture when high values of a are reached. However, Hirshfeld's data
suggests that the limit for this effect is approximately 7 ft/s3 (.217 g/s).
This conclusion tends to be supported by data from Method E, Condition 2,
Table 3, in which j was at least 10 ft/s3 (.311 g/s). No subject was able to
maintain balance for a = 3.5 ft/s2 (.109 g) under Method E, whereas in Method A / 2 A, 50% of all subjects maintained balance to a = 5 ft s (.155 g) or larger
A 3 when j was less than 7 ft/s (.217 g/s). Hirshfeld reports that for all tests
with forward facing standees in Method A, the average acceleration obtained
before loss of balance was 5.3 ft/s2 (.165 g).
Method C tested the possibility that "slower starts," with jerk increasing
linearly, would allow progressive adjustment by the subject, such that ultimately
higher values of a could be reached without losing balance. Results are given
in Table 5 for unsupported standees facing forward, Condition 3, Table 3, for A
several values of k1 in the formula j = kIt. As for Method A, the data shows
that "faster starts" (higher values of k1' in this case), do not lead to more
loss of balance. However, it can be seen by comparing data in Tables 4 and 5,
that no advantage is gained by using the slower start of Method C. In fact,
since minimizing the time to reach a desired acceleration ad is likely to be
important in automated transportation systems, Method A would be superior for
those cases of constant jerk j in which j2/ad
> k1/2. For ad = 3.0 ft/s2
(.093 g), 80 to 90 percent of the tests showed balance retention for the high-4 A 3
est values of k1 = 1.0 ft/s (.031 g/s) in Method C and j 6.5 ft/s (.202 g/s)
13
TABLE 4.
STARTING METHOD A:
PERCENT OF TESTS IN WHICH BALANCE WAS
RETAINED, UNSUPPORTED FORWARD-FACING STANDEES
(AFTER HIRSHFELD [9J AND GEBHARD [1J)
Avg. Acceleration Jerk Attained
ft/s3 ft/s3 g/s g/s
ft/sec 2 g
1 .031 99% 97%
2 .062 95 93
3 .093 87 81
4 .124 67 70
5 .155 42 55
6 .186 12 30
7 .217 4 18
8 .248 1 7
14
ft/s3 g/s
99%
93
85
80
70
60
20
-

...... \.Jl
Avg. Acceleration Attained
ft/sZ g
1 .031
2 .062
3 .093
4 .124
5 .155
6 .186
7 .217
TABLE 5.
STARTING METHOD C:
PERCENT OF TESTS IN WHICH BALANCE WAS RETAINED,
UNSUPPORTED FORWARD-FACING STANDEES
(AFTER HIRSHFELD [9J AND GEBHARD [1J)
k1' Rate of Change of Jerk
ft/s4 g/s2 ft/s4 g/s2 ft/s4 g/s2 ft/s4
0.2 .0062 0.4 .0124 0.6 .0186 0.8
98% 100% 100% 100%
92 100 100 100
71 75 90 98
48 42 55 56
41 15 32 31
16 8 9 13
1 3 5 -
g/s 2 ft/s 4 g/s Z
.0248 1.0 .0311
100%
99
86
75
47
15
3

in Method A. The inequality above is satisfied for this comparison, and the
corresponding times are 0.46 seconds for Method A and 2.45 seconds for Method C.
With Method D, Hirshfeld attempted to assess whether a short "warning
acceleration" would lead to better balance retention. However, the results
were no better than the more severe starting tests of Method A. On the average,
balance was lost for ~ 5.4 ft/s2 (.168 g) at t = 7.0 seconds. In Method A,
only 2.5 seconds were required for this average acceleration.
Results for the remaining test conditions 5 through 10 in Table 3 are
available only in the form of average accelerations attained before loss of
balance, and this data is given in Table 6. These results should be compared
with the average a = 5.3 ft/s2 (.165 g) obtained for Method A with forward
facing standees, Condition 1 in Table 3. As might be expected, facing sideways
unsupported, holding on overhead strap, and holding a vertical stanchion give
increasingly better results compared with the unsupported-forward condition.
Moreover, it might be possible to interpret the "facing backward, unsupported"
condition as equivalent to deceleration for forward facing, unsupported standees. 2
Under such an interpretation, the average from Table 6 of 4.2 ft/s (.130 g)
indicates that deceleration would be more critical than acceleration.
The problem addressed by Hirshfeld was also investigated by Browning [10J
in more recent work. Browning was interested in passenger tolerance to motion
of pedestrian conveyors moving at line speeds in the range 9.11 to 14.58 ft/s
(10 to 16 kph). The upsetting effect of accelerations was studied by filming
subjects standing on a trolley accelerated in a known fashion. The trolley
ran on pneumatic wheels and was guided along a single floor-mounted rail.
Power was provided by a battery electric towing trailer with provision to auto
matically control acceleration. The main testing stage "involved between 150
and 300 adult subjects drawn from all parts of the Royal Aircraft Establishment,
together with a similar number of people from families of employees and a num
ber of special subjects, i.e., groups of children and disabled people." All
subjects carried what was thought to be realistic amounts of luggage. Data
from these experiments were recorded in three ways: (a) edited films showing
many people taking part in the experiments; (b) an analysis of these films
made by the author or by a panel of experts; and (c) an analysis of the written
responses made by the passengers immediately after taking in the experiments.
Browning however, is suspicious of the subject opinions, and the bulk of the
16
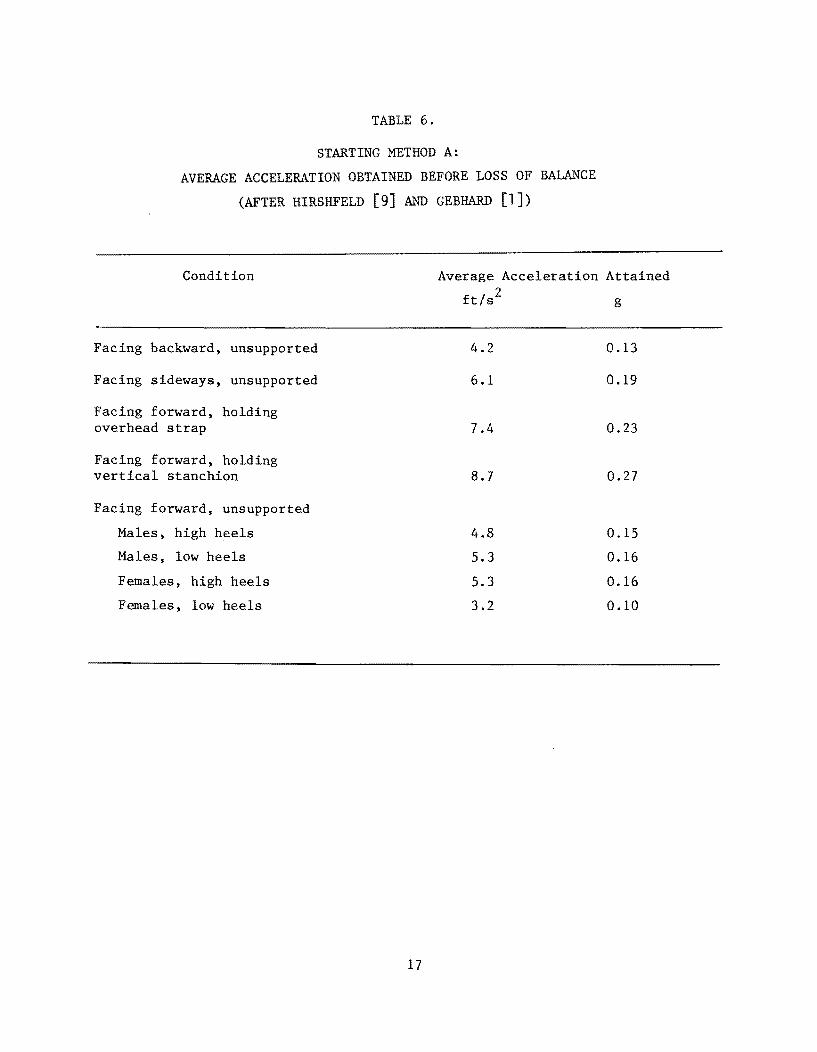
TABLE 6.
STARTING METHOD A:
AVERAGE ACCELERATION OBTAINED BEFORE LOSS OF BALANCE
(AFTER HIRSHFELD [9J AND GEBHARD [1J)
Condition Average Acceleration Attained
Facing backward, unsupported
Facing sideways, unsupported
Facing forward, holding overhead strap
Facing forward, holding vertical stanchion
Facing forward, unsupported
Males, high heels
Males, low heels
Females, high heels
Females, low heels
17
ft/s2 g
4.2
6.1
7.4
8.7
4.8
5.3
5.3
3.2
0.13
0.19
0.23
0.27
0.15
0.16
0.16
0.10

conclusions are based on Method B. Summarizing earlier work, but providing
no details, he reports that small amplitude fore-and-aft vibration of the
floor is effectively damped out by the legs of a standing person. Apparently,
the natural frequency of the balancing reaction is approximately 1 hz, and
fore-and-aft vibration of large amplitudes (several cm) near this frequency
makes balancing difficult unless the subject walks.
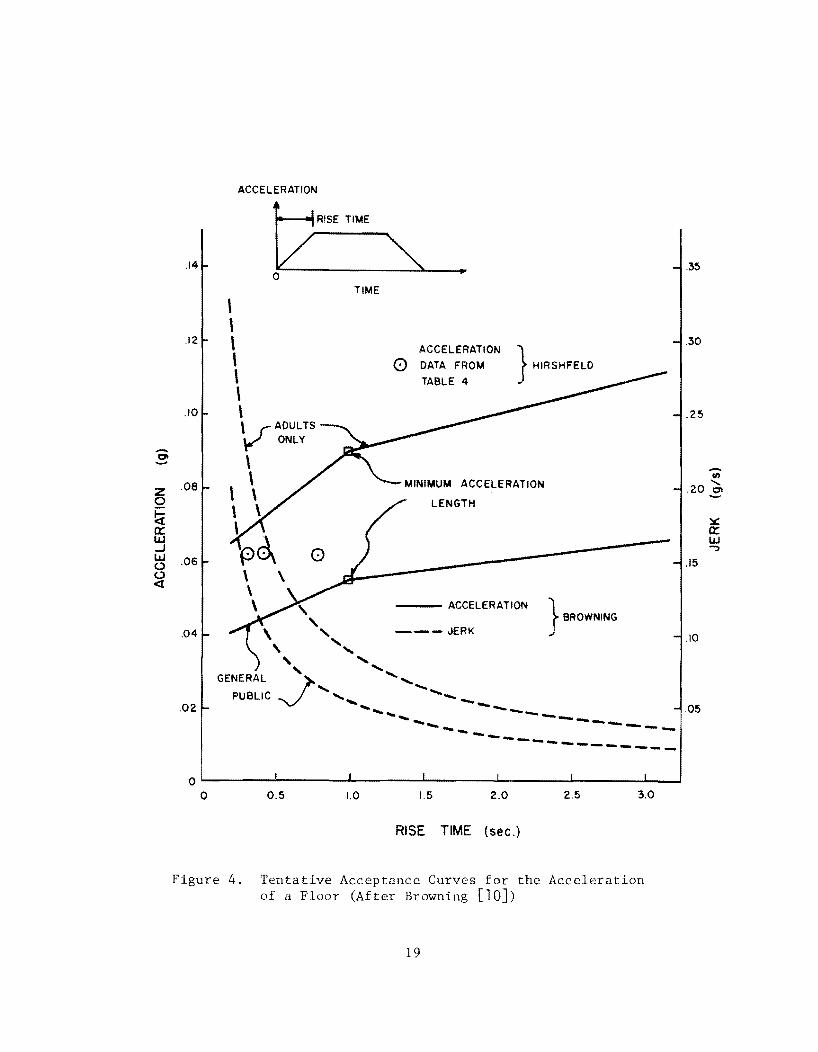
The upsetting effect of acceleration, Browning reports, depends not only
upon the level of acceleration, but also on the jerk, a conclusion also reach
ed by Hirshfeld. However, Browning's acceleration time profile, shown in the
inset of Figure 4, resulted in a constant steady velocity at the end of the
profile transient. whereas Hirshfeld's did not. A profile such as that shown
in the inset of Figure 4 has been called a "three-phase" start by Thurlow [llJ.
and for the case at hand. the constant decelerating jerk at the end of the
profile was made equal to the accelerating jerk at the beginning. Browning
assumes that the upsetting effect is applicable to the complete profile. Fig
ure 4 shows in solid lines the combinations of acceleration and "rise time,"
defined in the inset. judged by the panel to cause "slight relative movement"
for passengers and recommended by the panel as tentative "acceptance curves."
In dotted lines are shown corresponding curves of jerk versus rise time derived
from the solid line data. Observe that the jerk can be as high as .325 g/s
for fit adults. provided the acceleration is no larger than .065 g. Now con
sider Hirshfeld's implication that the first phase of the starting transient
is responsible for upsetting effects, rather than the complete transient.
Under this assumption, compare data in Figure 4. The three encircled points,
calculated from the second row of Table 4. represent the only acceleration -
rise time values from Table 4 that lie between the two acceleration curves
in Figure 4. Accordingly. if this assumption were valid. Browning's "slight
relative motion" corresponds to 93-95% balance retention in Hirshfeld's study.
On the other hand. the comparison is not strictly accurate. and caution must
be employed in drawing such conclusions.
Finally. for a given line speed, acceleration patterns that cause the
same upsetting effect are not equally attractive because they do not all require
the same acceleration length. Browning reports that the choice of values for
the three-phase start of Figure 4 to yield minimum lengths is virtually indepen
dent of the line speed in the range 10-16 kph, and are given as follows:
18
.14
.12
.10
-2
ACCELERATION
~RISE TIME
Lc: "'" ,.
\ \ \ \ \ \ \
o
'v ADULTS ONLY
\
TIME
ACCELERATION
o DATA FROM
TABLE 4
} HIRSHFELD
Z .08 o \ , \ \ \
MINIMUM ACCELERATION
LENGTH
fi a::: IJJ ..J IJJ (.)
~ .06
.04
,02
\
t:>c\ \ \ \
\ , , ,
, '" , ......
GENERAL ')-
PUBLIC -J .................. .... -
--- ACCELERATION } BROWNING
--- JERK
.... - - ... -- ......... ---.- ..... --. ...... _-----
.............. ------ --- .................. -------
O~------~-------L------~--------~------~-------L __ ~ o 0.5 1.0 1.5 2.0 2.5 3.0
RISE TIME (sec.)
Figure 4. Tentative Acceptance Curves for the Acceleration of a Floor (After Browning [10J)
19
.35
,30
.25
Ii)
.20 'C. -
.15
,10
05
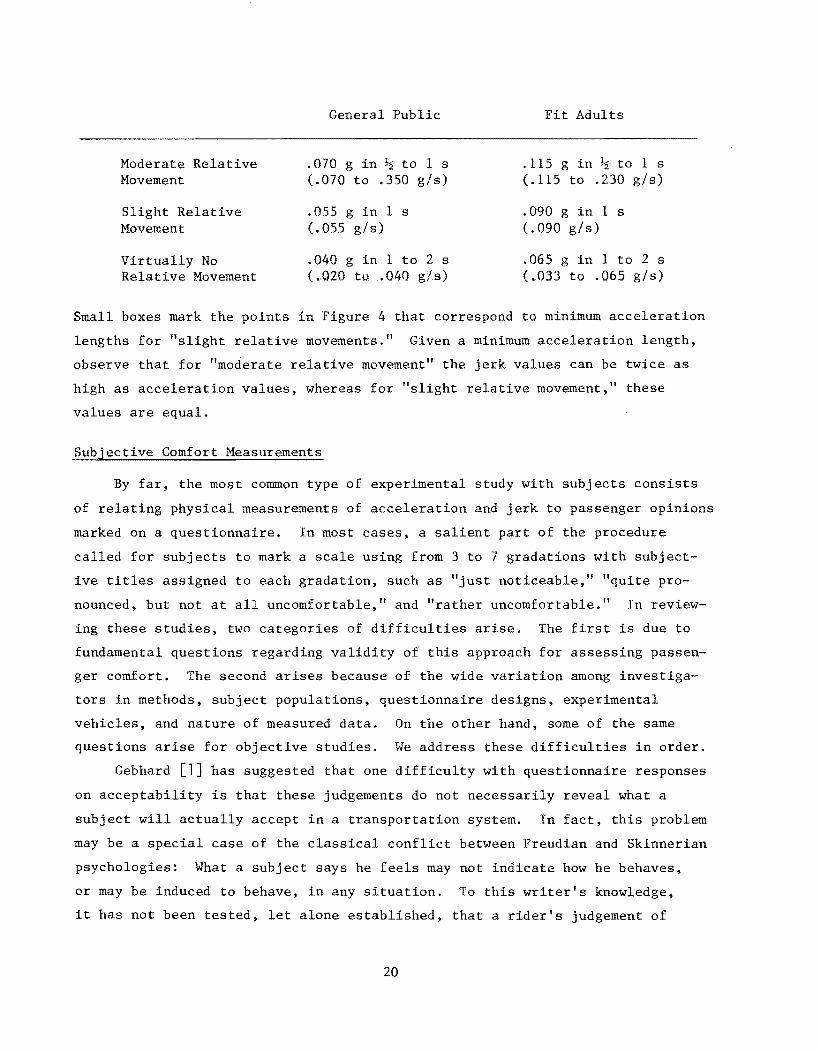
Moderate Relative Movement
Slight Relative Movement
Virtually No Relative Movement
General Public
.070 g in ~ to 1 s (.070 to .350 g/s)
.055 g in 1 s (.055 g/s)
.040 g in 1 to 2 s (.020 tu .04Q g/s)
Fit Adults
.115 g in ~ to 1 s (.115 to .230 g/s)
.090 g in 1 s (.090 g/s)
.065 g in 1 to 2 s (~033 to .065 g/s)
Small boxes mark the points in Figure 4 that correspond to minimum acceleration
lengths for "slight relative movements. f1 Given a minimum acceleration length,
observe that for "moderate relative movement" the jerk values can be twice as
high as acceleration values, whereas for "slight relative movement," these
values are equal.
Subjective Comfort Measurements
By far, the most common type of experimental study with subjects consists
of relating physical measurements of acceleration and jerk to passenger opinions
marked on a questionnaire. In most cases, a salient part of the procedure
called for subjects to mark a scale using from 3 to 7 gradations with subject
ive titles assigned to each gradation, such as "just noticeable," "quite pro
nounced, but not at all uncomfortable," and "rather uncomfortable." In review
ing these studies, two categories of difficulties arise. The first is due to
fundamental questions regarding validity of this approach for assessing passen
ger comfort. The second arises because of the wide variation among investiga
tors in methods, subject populations, questionnaire designs, experimental
vehicles, and nature of measured data. On the other hand, some of the same
questions arise for objective studies. We address these difficulties in order.
Gebhard [lJ has suggested that one difficulty with questionnaire responses
on acceptability is that these judgements do not necessarily reveal what a
subject will actually accept in a transportation system. In fact, this problem
may be a special case of the classical conflict between Freudian and Skinnerian
psychologies: What a subject says he feels may not indicate how he behaves,
or may be induced to behave, in any situation. To this writer's knowledge,
it has not been tested, let alone established, that a rider's judgement of
20
acceptability in a short experimental ride is adequate to define tolerance or
acceptability in daily commuting. It is more likely that this issue should
be treated as a trade-off between a number of variables, as for example, between
travel time, convenience and comfort. More simply put as an elementary example,
given two transportation systems operating between two points, one "uncomfort
able" but "fast" and the second "comfortable" but "slow," what are the percent
ages of people of various backgrounds that actually use (not say they will use)
one system over the other. As Gebhard states [1J, "Riders overwhelmingly accept
the automobile for travel to the center city, while damning the many annoyances
due to traffic and parking." A subject who regularly exceeds ~ g in his private
automobile may check 1/8 g as the upper limit of comfort on a questionnaire.
What is needed, it appears, is assessment of behavior itself (i.e. ridership),
rather than feelings about acceptability.
The second category of difficulties is not unrelated to the first. Hanes
[12J has defined the problem as the difficulty in determining exactly who did
what and how. Fundamentally, the responses made by a subject on a questior-naire
are likely to depend upon what he thinks is expected of him. Hence, variability
among results of different tests could be dependent upon instructions subjects
are given, number of gradations used for sealed judgements, and wording of des
criptions associated with the scale. For example, consider two questionnaires
each having five places for responses numbered 1, 2, •.. 5. Suppose for the
first questionnaire, the descriptions were (in order 1 to 5) "imperceptible,"
"just perceptible," "fairly perceptible," "perceptible," and "very perceptible."
For the second, let the descriptions be "not noticeable,1I "noticeable," "strong,"
"slightly uncomfortable," and "very uncomfortable." There exists the possibility
that a bias exists for the second questionnaire over the first at the suggest
ion that discomfort may be encountered during the test. Moreover, there is
no accurate method to relate the responses on one questionnaire to those of
the other.
Finally, the type of subject population used has an enormous effect on
the type of responses obtained. It is reasonable to expect a thorough study
to report responses with respect to various subject population variables, such
as age, sex, ridership history, and occupation (including transportation expert
ise). The parenthetical variable is included because in several instances
21
[6 13 14J complete tests have been done with the only subJ'ects being those , , with occupational affiliation with transportation. The bias introduced by such
a procedure has been analyzed in a recent study [15J and will be reviewed later.
Although all of the studies reported below exhibit some of these theoretical
limitations, it is nevertheless instructive to review the data.
Wilson [6J conducted tests on braking of automobiles using as subjects
eight department heads or their assistants from General Motors Proving Grounds.
Table 7 gives the average ratings in three categories of these eight for various
average decelerations. Wilson does not report how the average ratings were com
piled, but the average deceleration values were calculated from the distances
required to stop from 70 mph (112.7 kph), and thus are likely below the maximum
decelerations experienced during the stop. Also shown for comparison are two
other deceleration values. It is interesting to compare the first value in
Table 7, labeled "comfortable" and "preferred" with Mortimer's data in Figure 1.
From this figure we see that Mortimer's drivers equaled or exceeded 0.266 g for
less than 10% of the brake applications, pointing up a substantial descrepancy
between the objective and subjective measurements, particularly those that use
subjects having expertise in the area being investigated.
In a later study, Loach [13Jconducted exploratory tests on a two-car elec
tric train and an electric trolley bus. The subjects used were the 12 members
of the Track Committee of the Railway Executive of British Railways. For both
vehicles, the subjects sat on longitudinally oriented seats, or stood. No details
are given as to the type of acceleration or deceleration profile used, except
that the driver "endeavored to accelerate or decelerate at a constant rate."
The average judgements of the subjects are given in Table 8 for seated subjects
in the electric train. Apparently, the subjects were in fact experiencing lateral
acceleration and deceleration because of the seating arrangement, which may
account for the relatively low acceleration values reported. Loach reports that
in one or two tests with the subjects standing in unspecified orientation, eval
uations showed that .10 g was the approximate limit that could be attained with
out discomfort and that .123 g was somewhat uncomfortable. Results of decelera
tion tests with the trolley bus are "pooled," containing evaluations of both
sitting and standing subjects, and are given in Table 9. No explanation is
22

+1.
+2.
*3.
+4.
*5.
TABLE 7.
EVALUATION OF 70 MPH STOPS IN AUTOMOBILES
AT GM PROVING GROUND
(AFTER WILSON [6J)
Evaluation+ or Condition*
Comfortable to Passenger, Preferred by Driver.
Undesirable, but not alarming to Passenger; Driver would rather not use.
Design Deceleration for Pennsylvania Turnpike
Severe and Uncomfortable to Passengers, Slides Objects off Seats. Driver Classes as an Emergency Stop.
Maximum StoP. Car Stays in a 12-Foot Lane without skidding. Brakes in Best Condition.
Average Deceleration (g)
0.266
0.343
0.401
0.432
0.606
23
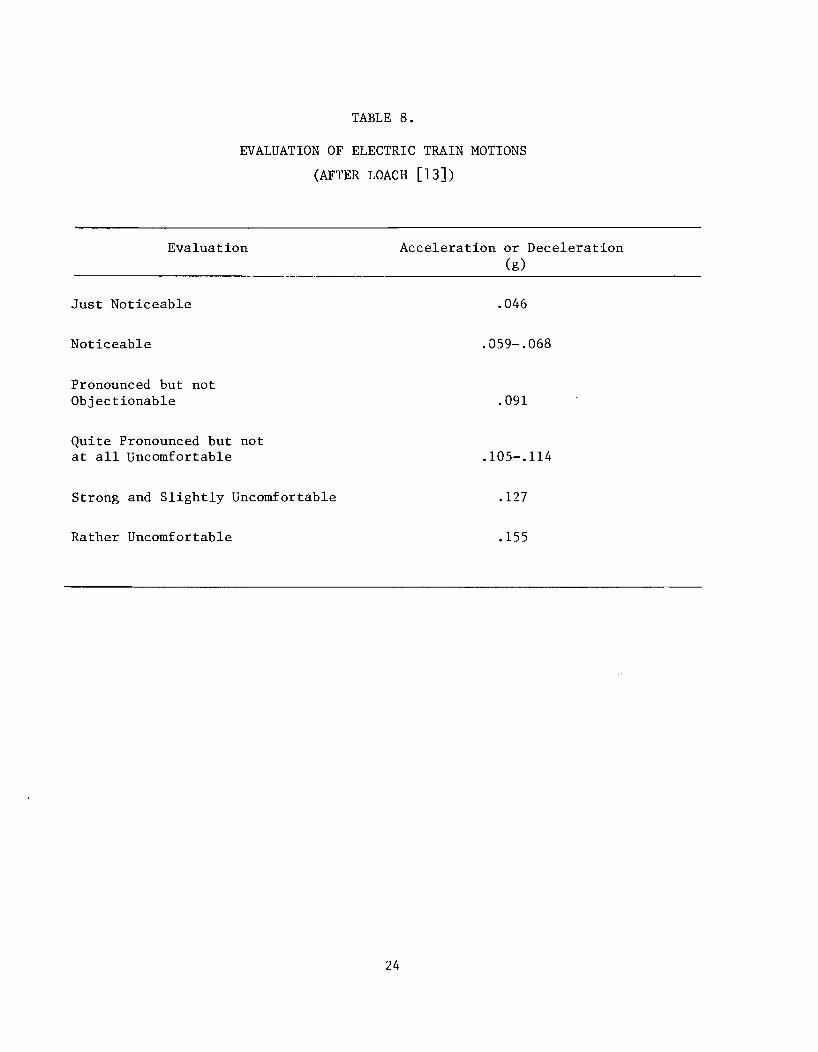
TABLE 8.
EVALUATION OF ELECTRIC TRAIN MOTIONS
(AFTER LOACH [13J)
Evaluation
Just Noticeable
Noticeable
Pronounced but not Objectionable
Quite Pronounced but not at all Uncomfortable
Strong and Slightly Uncomfortable
Rather Uncomfortable
24
Acceleration or Deceleration (g)
.046
.059-.068
.091
.105-.114
.127
.155

TABLE 9.
EVALUATION OF TROLLEY BUS MOTIONS
(AFTER LOACH [13J)
Evaluation
Pronounced and Barely Comfortable, especially when there had been a rapid increase in the deceleration to that value
Somewhat Uncomfortable
Uncomfortable
Deceleration (g)
.182
.228
.273
25

given by Loach for the lack of lower acceleration levels in the trolley bus test,
for the changes in subjective evaluation titles between the train and bus tests,
or for the apparent discrepancies in the results of the two tests. Moreover,
although jerk was not measured, Loach states that a given deceleration was more
easily withstood when lower values of jerk were used.
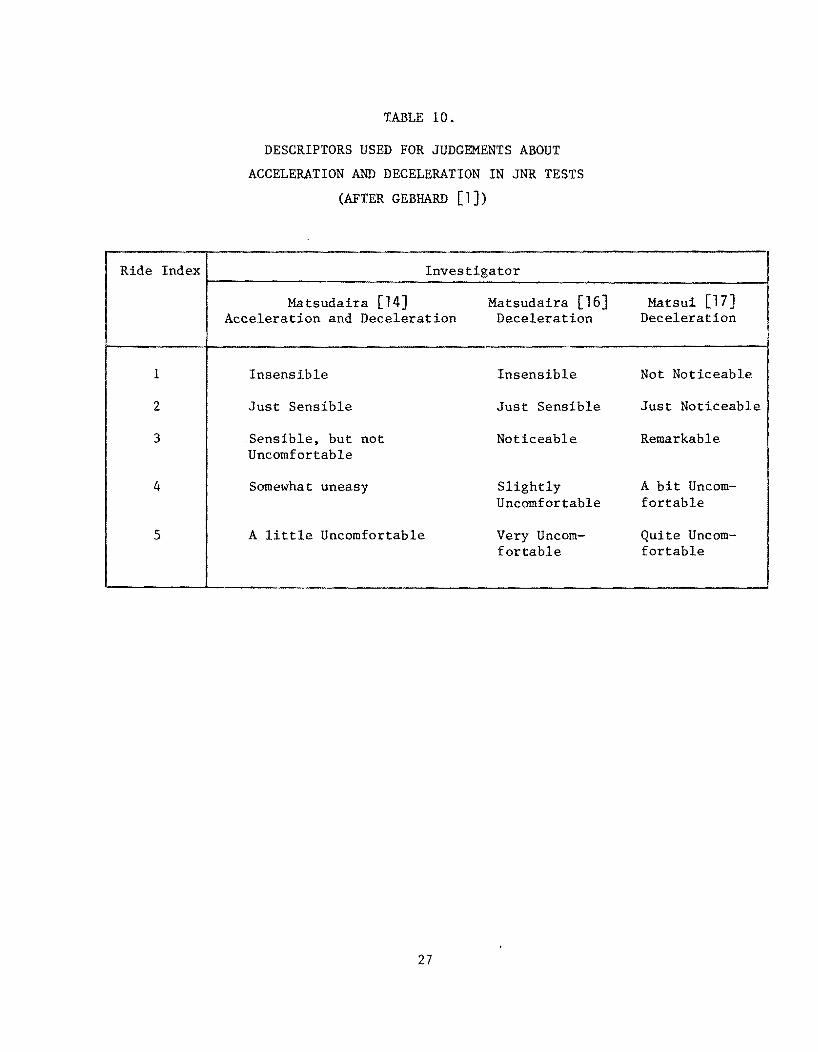
A more thorough series of studies have been conducted by various investiga
tors connected with the Japanese National Railways (JNR) [14, 16, 17, 18, 19J. The first three of these are related, and Gebhard [lJ has summarized the des
criptions used for a five-category rating scale, given in Table 10. The 1960
report by Matsudaira [14J covered a preliminary test using 20 engineers connect
ed with the JNR, whereas his 1962 report [16J apparently covers the same tests
as those described in more detail by Matsui [17J, in which approximately 40
college students were used. Accordingly, the slight variability in wording be
tween the second and third columns of Table 10 could be due to anomalies in
translation from Japanese to English. On the other hand, the substantial dif
ferences in descriptors in the first column from those of the other two could
not likely be attributed solely to translation problems and it is evident that
the meanings are very different for some of the categories. In the first study,
using the 20 JNR engineers or subjects, Matsudaira [14J found that starting
accelerations up to 0.15 g fell in Ride Index 3 (Table 10) or below for seated
passengers, although evidently seats were oriented both laterally and longitud
inally. In deceleration tests, judgements of seated and standing passengers
were pooled, and most subjects rated decelerations between 0.16 and 0.18 g under
Ride Index 4.
For the second series of tests reported by both Matsudaira [16J and Matsui
[17J. we follow the latter because of the detail available. Approximately 40
volunteer male students from two unjversities were used as subjects. Attempts
were made to assess independently the effects of constant deceleration, called
R tests for "retardation," and constant jerk, called J tests. The deceleration
profile used was similar to the three-phase profile used by Browning for acceler
ation in Figure 4, except that only the constant acceleration level in the second
phase &nd the jerk level in the final phase were controlled and held constant.
The initial jerk phase was not controlled. All tests were conducted with an
26
Ride Index
1
2
3
4
5
TABLE 10.
DESCRIPTORS USED FOR JUDGEMENTS ABOUT
ACCELERATION AND DECELERATION IN JNR TESTS
(AFTER GEBHARD [1])
Investigator
Matsudaira [14] Matsudaira [16] Acceleration and Deceleration Deceleration
Insensible Insensible
Just Sensible Just Sensible
Sensible, but not Noticeable Uncomfortable
Somewhat uneasy Slightly Uncomfortable
A little Uncomfortable Very Uncom-fortable
27
Matsui [17] Deceleration
Not Noticeable
Just Noticeable
Remarkable
A bit Uncom-fortable
Quite Uncom-fortable

initial speed of 70 kph in a special passenger car of a two-car train. An aud
ible signal was given during the second phase of constant deceleration so that
raters could concentrate their attention on either the constant value of deceler
ation or the constant value of J in the third phase, according to which category
of test, specified beforehand, was being conducted. Raters were told to close
their eyes before the first phase and open them 30 seconds after the car had
stopped. Standing raters could use overhead hand straps and faced sideways with
feet 30 cm apart. The form used for the evaluation actually provided for a
contiuum of evaluations in which the ride index number in Table 10 marked only
the upper boundaries of the categories described. That is, for example, a rater
could check anywhere between 2 and 3 on the scale to fall in Ride Index 3. Results
were presented of ride index averages for various postures plotted versus either
acceleration for R tests or log of jerk for J tests. Altogether, 169 tests were
made, producing 7000 ratings. During R tests, the final jerk value was held
constant and five values of deceleration, randomly chosen,. were used. For jerk
tests, four values of jerk were used, each with two different levels of constant
deceleration. Under a fixed condition of rater's posture in each of the Rand J
test series, the same combination of constant deceleration and constant jerk
appeared at least three times. Matsui presents the most useful condensation of
all this data to be that shown in Table 11. He considers Ride Index 3 as the
limit for normal service braking and Ride Index 4 as the limit for emergency
braking. Each of the tabular values represents either the acceleration (jerk)
for the Mean Ride Index shown, or the acceleration (jerk) for the mean index
plus one standard deviation (S.D.) in Index. Observe that for side facing,
sitting passengers, all acceleration values for both ride indices are consider
ably higher than Loach's values in Table 8 under the headings "Quite Pronounced
but not at all Uncomfortable" and "Strong and Slightly Uncomfortable." Moreover,
quick computation shows that the side-facing, standing passengers apparently
tolerated higher accelerations and jerks in Ride Index 3 than those recommended
by Browning for fit adults in Figure 4, although Browning's subjects were likely
facing forward without overhead straps. On the other hand, Hirshfeld's average
attained accelerations of 0.19 and 0.23 g for side-facing standees and front
facing standees using straps, respectively, in Table 6, correlates well with
28

Ride Index 3
Mean == 3
Mean + S.D. = 3
Ride Index 4
Mean = 4
Mean + S.D. 4
Ride Index 3
Mean = 3
Mean + S.S. = 3
Ride Index 4
Mean = 4
Mean + S.D. 4
TABLE 11.
DECELERATION AND JERK EVALUATIONS
(AFTER MATSUI [17J)
R-Tests Deceleration (g)
Sitting Sitting Sitting Front-faced Rear-faced Side-faced
.19 .19 .16
.14 .13 .13
.3 .3 .2
.22 .19 .18
J-Tests Jerk (g/s)
1.2 1.7 0.5
0.3 0.3 0.12
10.0 10.0 10.0
1-2 3-4 1-2
Ride Index 3: "Remarkable"
Ride Index 4: "A Bit Uncomfortable tl
29
Standing Side-faced
.15
.11
.2
.17
2.0
0.12
10.0
2-3
Matsui's mean of 0.2 g under Ride Index 4 for side-facing standees. Finally,
for front-facing, seated passengers, the value of 0.14 g under Ride Index 3 was
eqUalled or exceeded by Mortimer's [7J drivers 40-50% of the time (Figure 1).
In perhaps the most detailed subjective study, reported briefly by Matsudaira
[18J, and later in more detail by Urabe and Noruma [19], three categories were
used to obtain passenger evaluations: (l)"Sensation," with four levels: "No
feeling," "Indistinct feeling," "Distinct feeling," and "Strong feeling"; (2)
"Mood," with a continuum scale ranging from, 0 labeled "Comfortable" to,S,
labeled "Uncomfortable. 1I The continuum was scored in five levels by scoring "0"
for all marks between 0 and 1, "I" for all marks between 1 and 2, etc.; (3)
IIJudgement," with two levels labeled "Permissible comfort" and "Not Permissible
discomfort." The subjects consisted mainly of approximately 50 college students
[18J. supplemented with "some" JNR employees [19J, number unspecified. The
investigators conducted deceleration tests. starting at approximately 70 kph and
using a three-phase deceleration profile, in which the first and third phases
had constant jerk controlled at different values. The study was apparently
designed to obtain passenger ratings in each of the categories above for various
combinations of posture, initial jerk-phase value, constant deceleration value.
and final jerk-phase value. It is unclear, however, what different acceleration
and jerk values actually were used. Evidently, the critical parameters were
found to be deceleration and final jerk values. Tables 12 and 13 give the main
results, and it should be noted that all seated passengers faced sideways. thus
experiencing lateral deceleration. Table 12 presents data on the "Sensation"
category. and gives percentages of subjects who had "Strong feelings" for the
deceleration and final jerk values indicated. Table 13 gives data in the "Judge
ment" category, for "Not Pennissible discomfort. 11 Observe that at the lower end
of the rater population deceleration and jerk values judged "Not Permissibly
Uncomfortable l1 are lower than those "strongly felt." The opposite holds at the
high end of the rater population. It can be seen that tolerance to deceleration
and jerk values are greater in a crowded, seated position and least when standing
facing backward. Moreover. subjects who feel decelerations strongly do not
necessarily rate them as unacceptably uncomfortable.
The most recent study available, by Cussik and Mooring [15J, was conducted
30

Percent of Raters
ncrowded Sitting ideways
rowded Sitting ideways
tanding Facing orward
tanding Facing ,ackward
w .....
TABLE 12.
CONSTANT DECELERATION AND FINAL JERK VALUES
MARKED "STRONG FEELING" BY THE INDICATED PERCENTAGES OF RATERS [19]
Deceleration (g) Jerk (g/s)
o 5 10 20 30 40 50 60 80 100 o 5 10 20 30 40 50 60 80 100
.122 .125 .127 .133 .139 .147 .156 .164 .181 .204 I .074 .077 .082 .091 .099 .108 .119 .130 .158 .187
.136 .139 .142 .147 .156 .164 .170 .178 .195 .218 I .085 .088 .093 .102 .113 .125 .136 .150 .181 .224
.113 .116 .119 .127 .133 .142 .150 .158 .175 .198 I .054 .057 .062 .071 .079 .088 .099 .113 .142 .184
.085 .088 .091 .096 .102 .108 .113 .122 .139 .158 I .057 .059 .062 .071 .076 .085 .093 .105 .125 .153

W N
Percent of Raters
Jncrowded Sitting lideways
~rowded Sitting ;ideways
3tanding Facing i"orward
Standing Facing Backward
TABLE 13.
CONSTANT DECELERATION AND FINAL JERK VALUES
HARKED "NOT PERMISSIBLY UNCOMFORTABLE" BY THE INDICATED PERCENTAGES OF RATERS [19J
Deceleration (g) Jerk (g/s)
o 5 10 20 30 40 50 60 80 100 o 5 10 20 30 40 50 60 80 100
.085 .105 .130 .150 .164 .175 .187 .207 .221 .068.091 .122.147.451.184
.096 .119 .142 .161 .175 .187 .198 .215 .226 .074 .091 .113 .127 .139 .147
.079.096.119.130 .142.153.158.173.184 .074 .091 .113 .127 .139 .150
.071 .076 .091.102 .1l0 .116 .122 .133 .139 .027 .040 .059 .028 .091 .102 .113 .136

as part of a program for the development of new urban transportation systems.
Four prototype "Personal Rapid Transit (PRT) Systems" developed by different
companies were tested in conjunction with an exhibition called "TRANSPO '72" at
Dulles International Airport, Washington, D. C. Apparently, all subjects were
seated but the seating arrangements varied among the vehicles. The investigation
employed 94 "normal" subjects drawn from the staff of the Johns Hopkins University,
Applied Physics lab, none of whom was engaged in transportation-related work.
Detailed statistics on each subject were collected and care was taken to insure
statistical representation of the general population in each rating group. In
addition, 12 transportation specialists, called "experts," were used as subjects.
All were male engineers or technicians ranging in age from 25 to 50 years old.
Cussik and Mooring [15] report that although detailed physical measurements and
subjective responses were recorded and remain available, only limited and incon
clusive data analysis was done. In fact, the authors list references to 42
magnetic data tapes on ride quality alone. Only a sample of the subjective re
actions was chosen for correlation with measured acceleration and jerk, and only
for two of the vehicles did the sample deal with longitudinal acceleration and
jerk. Vehicle I had 12 side-facing seats, such that subjects experienced longi
tudinal accelerations as lateral accelerations. Vehicle II had six side-facing
seats, three forward-facing seats, and three backward-facing seats, but the data
presented is averaged over all passengers. Moreover, in the limited data avail
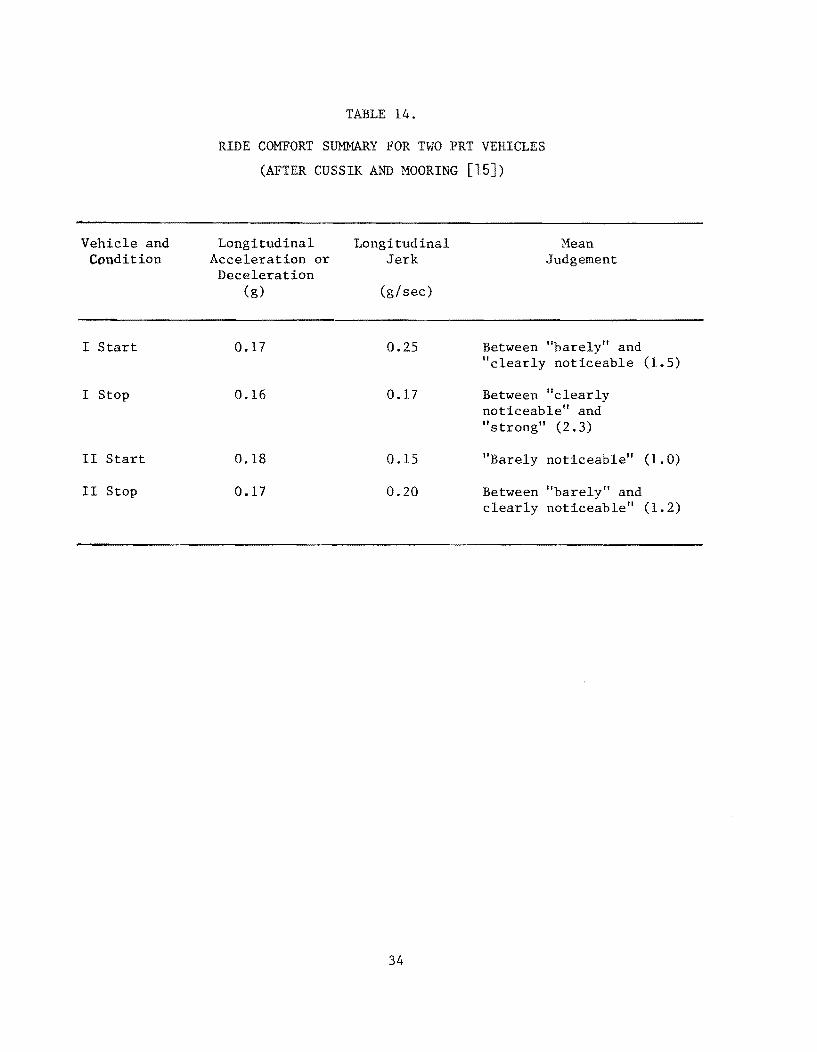
able, given in Table 14, it is unclear whether the "mean judgement" included the
"experts" as well as the "normals." The evaluation scale used was as follows:
o (not detectable), 1 (barely noticeable), 2 (clearly noticeable), 3 (strong),
and 4 (violent). It is unclear whether the starts and stops in Table 14 were of
the three-phase type discussed earlier, and no information is given as to what
points in the starting and stopping transients correspond to the acceleration
and jerk values listed. The values given were "manually scaled from the acceler
ation records, care being taken to exclude extremely sharp peaks (those that
peaked in less than about 0.1 record)." Cussik and Mooring note that the judge
ment for Vehicle I on stopping appears high when compared with the other data,
but no explanation is given.
In addition to the limited comfort data, Cussik and Mooring present a com-
33
Vehicle and Condition
I Start
I Stop
II Start
II Stop
TABLE 14.
RIDE COMFORT SUMMARY FOR TWO PRT VEHICLES
(AFTER CUSSIK AND MOORING [15])
Longitudinal Acceleration or Deceleration
(g)
0.17
0.16
0.18
0.17
Longitudinal Jerk
(g/sec)
0.25
0.17
0.15
0.20
34
Mean Judgement
Between "barely" and "clearly noticeable
Between "clearly noticeable" and "strong" (2.3)
"Barely noticeable"
Between "barely" and clearly noticeable"
(1. 5)
(1. 0)
(1. 2)
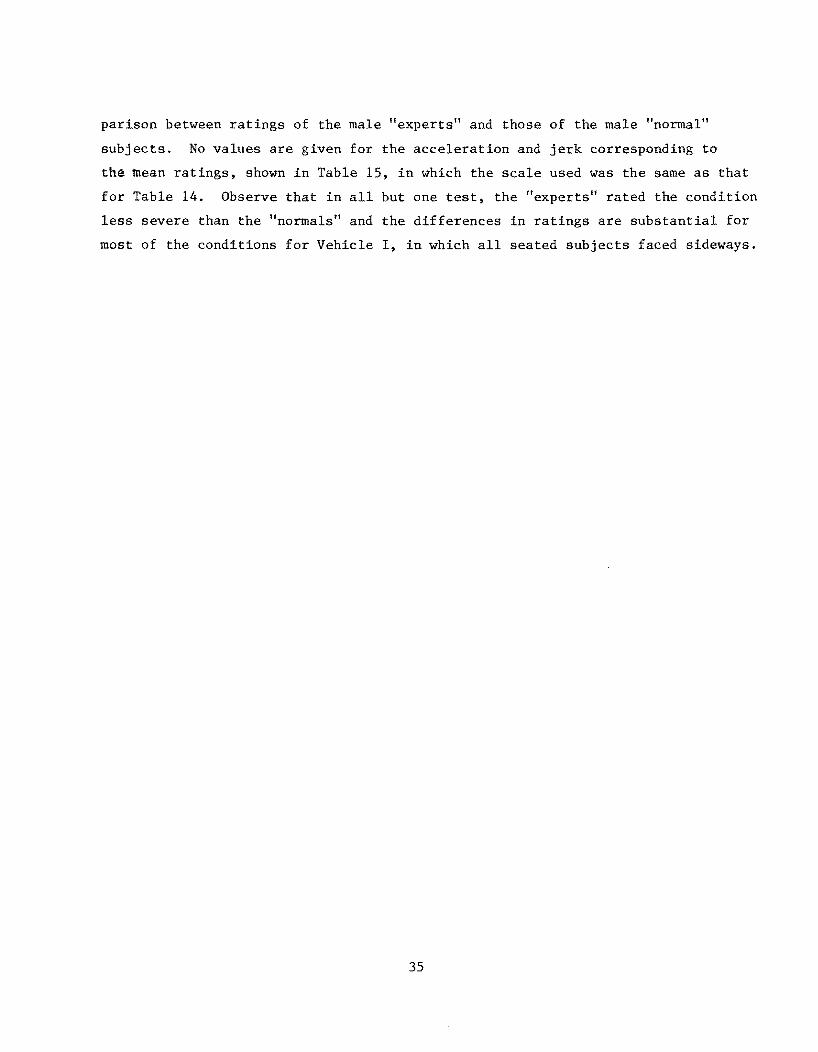
parison between ratings of the male "experts" and those of the male "normal"
subjects. No values are given for the acceleration and jerk corresponding to
the ~ean ratings, shown in Table 15, in which the scale used was the same as that
for Table 14. Observe that in all but one test, the "experts" rated the condition
less severe than the "normals" and the differences in ratings are substantial for
most of the conditions for Vehicle I, in which all seated subjects faced sideways.
35

TABLE 15.
RIDE QUALITY COMPARISONS OF "EXPERTS" AND "NORMALS"
(AFTER CUSSIK AND MOORING [15J)
Mean Judgement
Vehicle and Condition Male "Normal" Male "Experts"
I "J erk" at Start 1 1.7 1.2
"Jerk" at Start 2 1.7 1.1
"Jerk" at Start 3 1.5 0.9
I "Jerk" at Stop 1 2.3 1.9
"Jerk" at Stop 2 2.2 1.6
"Jerk" at Stop 3 2.3 1.5
II " Jerk" at Start 4 1.0 0.9
"Jerk" at Start 5 1.0 1.1
II tt Jerk" at Stop 4 1.2 0.8
"Jerk" at Stop 5 1.3 0.8
36

PART II
CONCLUSION
It is tempting to provide, as Gebhard [1] has done, a summary table of jerk
and acceleration values that might be taken as "nominal" or "acceptable" for var
ious types of vehicles and conditions. Certainly, for public mass transport,
steady non-emergency accelerations in the range 0.11 g to 0.15 g fall in the
"acceptablell range for most studies, and could be larger. It is unlikely that
values of jerk larger than 0.30 g/sec would be acceptable for most public trans
portation. Beyond this, however, the available results on comfort do not provide
a satisfactory basis for choosing any particular acceleration-jerk profile in
preference to any other. The wide variability in method and type of results
sought precludes a useful condensation of results. There appears to be extreme
sensitivity in the results to the environmental and test conditions and no study
has specifically addressed whether or not the results obtained are repeatable.
Moreover, the effect of different populations on test results has not been ade
quately reported, and difficulties with subjects who IIlearn" the test during the
experiment leave questions about reliability of the results. In addition, al
though the International Organization for Standards [20] has specifically includ
ed different comfort limits for different durations of exposure to whole-body
vibration, none of the studies surveyed here addressed the question of how the
extent and the duration of a test affected results. In fact, no studies have
been found that examined passenger response to frequency of start-stop motions,
such as occur in short-haul transportation systems. All studies found delt es
sentially with single-transient tests.
Finally, no large-scale studies have been found that show how well objective
or subjective test results correlate with ridership in actual transportation
systems.
37

REFERENCES
1. Gebhard, J. W., "Acceleration and Comfort in Public Ground Transportation," Transportation Programs Report 002, The Johns Hopkins University, Applied Physics Laboratory, Silver Spring, Maryland, February 1970, pp 1-20.
2. "Performance/Design and Qualification for the Morgantown Operational Personal Rapid Transit System," Specifications No. SSI91-90000-3C, The Boeing Company, Seattle, Washington, November 6, 1973, pp 75-76 (Ammended August 28, 1975), p 2.
3. "Performance Specifications for AIRTRANS (Airport Transportation System) at the Dallas-Fort Worth Regional Airport," The Dallas-Fort Worth Regional Airport Board, Dallas/Fort Worth, Texas, March 15, 1971, pp TP76-TP80.
4. "Bart Vehicle Specification 224601," Bay Area Rapid Transit District, Oakland, California, January 1967, pp Tl.2-1 to Tl.2-7.
5. Post-War Rapid Transit Cars: Data Book II (2nd Edition), Institute for Rapid Transit, Chicago, Illinois, April 1965 (with supplements of February 1967 and May 1968).
6. Wilson, E. E., "Deceleration Distances for High Speed Vehicles," Proceedings of the Highway Research Board, Wahington, D. C., 1940, pp 393-398.
7. Mortimer, R. G., "Hard Braking is More COlIDllon Than You Might Think," Automotive Engineering, Vol. 79, No.8, April 1971, p 32.
8. Torres, J. F., "Acceleration Noise, Power Spectra, and Other Statistics Derived From Instrumented Vehicle Measurements Under Freeway Driving Conditions,n Highway Research Record, No. 308 - Traffic Flow Characteristics, 1970, pp 13-33.
9. Hirshfeld, C. F., "Disturbing Effects of Horizontal Acceleration," Electric Railway President's Conference Committee, Bulletin No.3, September 1932, pp 1-30.
10. Browning, A. C., "Human Engineering Studies of High Speed Pedestrian Conveyors," Engineering Physics Department, Royal Aircraft Establishment, Farnborough; Aeronautical Research Council Current Papers No. 1278, June 1972.
11. Thurlow, V. S., "Effect of Jerk Rate on People Mover Operations," Working Paper WP-7531, The Mitre Corporation, Washington, D. C., April 1, 1972.
12. Hanes, R. M., "Human Sensitivity to Whole-Body Vibration in Urban Transportation Systems: A Literature Review," Transportation Programs Report 004,
38
The Johns Hopkins University, Applied Physics Laboratory, Silver Spring, Maryland, May 1970, pp 1-74.
13. Loach, J. C. and M. G. Maycock, "Recent Developments in Railway Curve DeSign," Proc. Inst. Civil Engineering, Part II, October 1952, pp 503-572.
14. Matsudaira, T., "Dynamics of High Speed Rolling Stock," Quarterly Report, Railway Technical Research Institute (TETSUDO GIJUTSU KENKUJO), Japanese National Railways, Special Issue, April 1960, pp 57-65.
15. Cussik, R. T., and E. E. Mooring, eds., "Post-Transpo Test Program, Summary Report Vol. I, "Transportation Programs Report 026, The Johns Hopkins University Applied Physics Laboratory, Silver Spring, Maryland, June 1973, pp IV 81-IV 160.
16. Matsudaira, T., "Dynamics of High Speed Rolling Stock," Quarterly Report, Railway Technical Research Institute (TETSUDO GlJUTSU KENKYUJO), Japanese National Railways, Special Issue, November 1961, pp 20-26.
17. Matsui, S., "Comfort Limits of Retardation and Its Changing Rate for Train Passengers," Japanese Railway_ Engineering, Vol. 3, No. 11, March 1962, pp 25-27.
18. Matsudaira, T., "Dynamics of High Speed Rolling Stock," Quarterly Report, Railway Technical Research Institute (TETSUDO GIJUTSU KENKYUJO), Japanese National Railways, Special Issue, 1963, pp 21-27.
19. Urabe, S. and Y. Noruma, "Evaluations of Train Riding Comfort Under Various Decelerations," Quarterly Report, Railway Technical Research Institute (TETSUDO GIJUTSU KENKYUJO), Japanese National Railways, June 1964, pp 28-34.
20. Von Gierke, H. E., "The ISO Standard: 'Guide for the Evaluation of Human Exposure to Whole-Body Vibration,'" Society of Automotive Engineers Paper No. 751009, 1975.
39
THE AUTHOR
Lawrence L. Hoberock was born in Wichita, Kansas on October 21, 1939. He
received the B. S. degree in mechanical engineering from the University of Mis
souri at Rolla in 1961 and the M. S. and Ph. D. degrees in mechanical engineering
from Purdue University in 1963 and 1966 respectively.
His industrial experience has been with Autonetics, Inc., Anaheim, California;
Hamilton-Standard, Inc., Windsor Locks, Connecticut; ARO, Inc., Arnold Air Force
Station, Tennessee; and the U. S. Army Ballistic Research Laboratories, Aberdeen
Proving Ground, Maryland. In August 1968 he joined the Mechanical Engineering
Department at the University of Texas. He specializes in automatic control, dy
namic systems analysis, and mechanical vibrations. His research interests include
high speed vehicle velocity and headway control, modeling and control of oil-well
fluid pressures, application of artificial intelligence in boundary value problems,
and nonlinear controller design techniques.
Dr. Hoberock is a member of the American Society of Mechanical Engineers,
American Association for the Advancement of Science, the American Society for
Engineering Education, Pi Tau Sigma, Tau Beta Pi, Phi Kappa Phi, Kappa Mu Epsilon,
and Sigma Xi. Hi is a registered professional engineer in Texas and is listed
in American Men of Science.
40

RESEARCH MEMORANDA PUBLISHED BY THE COUNCIL FOR ADVANCED TRANSPORTATION STUDIES
1 Human Response in the Evaluation of Modal Choice Decisions. C. Shane Davies, Mark Alpert, and W. Ronald Hudson, April 1973. 2 Access to Essential Services. Ronald Briggs, Charlotte Clark, James Fitzsimmons, and Paul Jensen, April 1973. 3 Psychological and Physiological Responses to Stimulation. D. W. Wooldridge, A. J. Healey, and R. O. Stearman, August 1973. 4 An Intermodal Transportation System for the Southwest: A Preliminary Proposal. Charles P. Ziatkovich, September 1973. 5 Passenger Travel Patterns and Mode Selection. Shane Davies, Mark Alpert, Harry Wolfe, and Rebecca Gonzalez, October 1973. 6 Segmenting a Transportation Market by Determinant Attributes of Modal Choice. Shane Davies and Mark Alpert, October 1973. 7 The Interstate Rail System: A Proposal. Charles P. Ziatkovich, December 1973. 8 Literature Survey on Passenger and Seat Modeling for the Evaluation of Ride Quality. Bruce Shanahan, Ronald Stearman, and
Anthony Healey, November 1973. 9 The Definition of Essential Services and the Identification of Key Problem Areas. Ronald Briggs and James Fitzsimmons, January
1974. 10 A Procedure for Calculating Great Circle Distances Between Geographic Lecations. J. Bryan Adair, March 1974. 11 MAPRINT: A Computer Program for Analyzing Changing Locations of Non-Residential Activities. Graham Hunter, Richard Dodge, and C. Michael Walton, March 1974. 12 A Method for Assessing the Impact of the Energy Crisis on Highway Accidents in Texas. E. L. Frome and C. Michael Walton, February 1975. 13 State Regulation of Air Transportation in Texas. Robert C. Means and Barry Chasnoff, April 1974. 14 Transportation Atlas of the Southwest Charles P. Ziatkovich, S. Michael Dildine, Eugene Robinson, James W. Wilson, and J. Bryan Adair, June 1974. 15 Local Governmental Decisions and Land-Use Change: An Introductory Bibliography. W. D. Chipman, May 1974. 16 An Analysis of the Truck Inventory and Use Survey Data for the West South Central States. Michael Dildine, July 1974. 17 Towards Estimating the Impact of the Dallas-Fort Worth Regional Airport on Ground Transportation. William J. Dunlay and Lyndon Henry, September 1974. 18 The Attainment of Riding Comfort for a Tracked Air-Cushion Vehicle Through the Use of an Active Aerodynamic Suspension. Bruce Shanahan, Ronald Stearman, and Anthony Healey, September 1974. 19 Legal Obstacles to the Use of Texas School Buses for Public Transportation. Robert Means, Ronald Briggs, John E. Nelson, and Alan J. Thiemann, January 1975. 20 Pupil Transportation: A Cost Analysis and Predictive Model. Ronald Briggs and David Venhuizen, April 1975. 21 Variables in Rural Plant Location: A Case Study of Sealy, Texas. Ronald Linehan, C. Michael Walton, and Richard Dodge, February 1975. 22 A Description of the Application of Factor Analysis to Land Use Change in Metropolitan Areas. John Sparks, Carl Gregory, and Jose Montemayor, December 1974. 23 A Forecast of Air Cargo Originations in Texas to 1990. Mary Lee Metzger Gorse, November 1974. 24 A Systems Analysis Procedure for Estimating the Capacity of an Airport: A Selected Bibliography. Chang-Ho Park, Edward V. Chambers, III, and William J. Dunlay, Jr., August 1975. 25 System 2000-Data Management for Transportation Impact Studies. Gordon Derr, Richard Dodge, and C. Michael Walton, September 1975. 26 Regional and Community Transportation Planning Issues: A Selected Bibliography. John Huddleston, Ronald Linehan, Abdulla Sayyari, Richard Dodge, C. Michael Walton, and Marsha Hamby, September 1975. 27 A Systems Analysis Procedure for Estimating the Capacity of an Airport: System Definition, Capacity Definition, and Review of Available Models. Edward V. Chambers, III, Tommy Chmores, William J. Dunlay, Jr., Nicolau D. F. Gualda, B. F. McCullough, ChangHo Park, and John Zaniewski, October 1975. 28 The Application of Factor Analysis to Land Use Change in a Metropolitan Area. John Sparks and Jose Montemayor, November 1975. 29 Current Status of Motor Vehicle Inspection: A Survey of Available Literature and Information. John Walter Ehrfurth and David A. Sands, December 1975. 30 Executive Summary: Short Range Transit Improvement Study for The University of Texas at Austin. C. Michael Walton, May 1976. 31 A Preliminary Analysis of the Effects of the Dallas-Fort Worth Regional Airport on Surface Transportation and Land Use. Harry Wolfe, April 1974. 32 A Consideration of the Impact of Motor Common Carrier Service on the Development of Rural Central Texas. James Wilson, February 1975. 33 Modal Choice and the Value of Passenger Travel Time Literature: A Selective Bibliography. Shane Davies and Mark I. Alpert, March 1975. 34 Forecast of Air Cargo Originations in Arkansas, Louisiana, and Oklahoma to 1990. Deborah Goltra, April 1975. 35 Inventory of Freight Transportation in the Southwest/Part IV: Rail Service in the Dallas-Fort Worth Area. Charles P. Ziatkovich, Mary L. Gorse, Edward N. Kasparik, and Dianne Y. Priddy, April 1975. 36 Forecast of Waterborne Commerce Handled by Texas Ports to 1990. Stuart Metz Dudley, April 1975. 37 Forecast of Refinery Receipts of Domestic Crude Oil from Pipelines in the West South Central States to 1990. Mary L. Gorse, Dianne Y. Priddy, and Deborah J. Goltra, April 1975. 38 A Feasibility Study of Rail Piggyback Service Between Dallas-Fort Worth and San Antonio. Edward N. Kasparik, April 1975. 39 Land Value Modeling in Rural Communities. Lidvard Skorpa, Richard Dodge, and C. Michael Walton, June 1974. 40 Toward Computer Simulation of Political Models of Urban Land Use Change. Carl Gregory, August 1975. 41 A Multivariate AnalysiS of Transportation Improvements and Manufacturing Growth in a Rural Region. Ronald Linehan, C. Michael Walton, and Richard Dodge, October 1975. 42 A Transit Demand Model for Medium-Sized Cities. John Shortreed, December 1975.
Council for Advanced Transportation Studies
THE UNIVERSITY OF TEXAS AT AUSTIN
> ~III e:e: c:ll:l -< """" 1110(
-0 z." C'l5 :II:I z 0C'l e:_ z ... ce: ... S! ~z zj!: III> "'CIn On ==PI >"" ... :11:1 -> 0 ... Z(5 <z ""n =0 p~ ""." 1110
r :c o • "" 3 n ,,::
==