a supplement to - advertising & marketing industry...
TRANSCRIPT

A SUPPLEMENT TO
3RD ANNUALGUIDE TOADVERTISING& MARKETING
SPONSORED BY
Published Feb. 28, 2005 © Copyright 2005 Crain Communications Inc.

FACT PACKTOP LINE DATA ON THE ADVERTISING AND MEDIA INDUSTRIESWHO ARE THE TOP marketers by ad spending in the U.S. and on a global basis? Whatads are the hottest and which TV shows command the highest prices for a :30 spot?Who are the big marketing organizations and how do their agency brands stack upagainst their competition? How big and far-reaching are those multifaceted mediagoliaths? It’s all in the FactPack, whether in print form on your desk, or a click awayon your computer or network.
The FactPack is presented in three sections:Advertising and Marketing section data were taken from Advertising Age’s 49th
annual 100 Leading National Advertisers, and the publication’s 200 Megabrand andGlobal Marketing reports. The 100 Leading National Advertisers report breaks outtotal ad spending by media for the largest U.S. advertisers and adds an Ad Age-pro-prietary unmeasured number to media spending for a comprehensive U.S. ad total.The LNA report also charts the hotly contested industry categories by market shareand brand spending.
The Media section’s primary sources are the 100 Leading Media Companies, anannual ranking of the nation’s media companies by net revenue, and the Ad AgeMagazine 300 report, an annual ranking by gross revenue of advertising and circula-tion combined that determines the 300 top magazines.
The Agency Report section, in its 60th version, ranks nearly 500 U.S. agencybrands, the world’s top agency brands, the world’s top 50 marketing organizations,and the top media specialist companies.
NEW THIS YEARNew to the FactPack this year are charts that show the big advertisers in rapidlygrowing Spanish-language TV, TV syndication’s leading shows by ad revenue, thenation’s top newspapers by circulation, media companies that generate the most rev-enue from free-standing inserts, and the telecommunications hierarchy by net rev-enue from their directory divisions.
FREE DIGITAL EDITIONA free pdf edition of the FactPack can be downloaded using Adobe Acrobat. Go toAAddAAggee..ccoomm and use QwikFIND aaq31n. Where indicated, a more comprehensive rank-ing is posted on AAddAAggee..ccoomm and can be purchased.
TO REACH USBy email: [email protected]; AdAge.com [email protected]; Postal mail: Advertising Age , 711 Third Ave.,New York, N.Y. 10017; Phone: (212) 210-0100. Subscription and print single copy sales (888) 288-5900;Advertising (212) 210-0159; Library services (312) 649-5476. DataCenter staff: R. Craig Endicott, Kevin Brown,Scott MacDonald, Mark Schumann, Mike Ryan, Jennie Sierra.
Last year,Paramount promised you
a sudden power surge in access.

Guess what, we're still surging.
How’s that for making a promiseand keeping it?
For more information call212-654-6931.

CONTENTSIn the pdf version, click anywhere on the items below to jump directly to the page.
ADVERTISING & MARKETINGTop five advertisers and their agencies . . . . . . . . . . . . . . . . . . . . . . . . .10-11Top U.S. advertisers . . . . . . . . . . . . . . . . . . . . . . . . . . . . . . . . . . . . . . . . . .12Top U.S. megabrands . . . . . . . . . . . . . . . . . . . . . . . . . . . . . . . . . . . . . . . . . .13U.S. ad spending totals by media . . . . . . . . . . . . . . . . . . . . . . . . . . . . . . . . .14Top U.S. advertisers by media . . . . . . . . . . . . . . . . . . . . . . . . . . . . . . . .15-17Top global marketers and spending in top 10 countries . . . . . . . . . . . . .18-19Consumer brand market share leaders in select categories . . . . . . . .20-23Most recalled and most liked ads of 2004 . . . . . . . . . . . . . . . . . . . . . .24-25
MEDIAProperties of the top 12 media companies . . . . . . . . . . . . . . . . . . . . .28-29Fall 2004 network prime-time pricing survey . . . . . . . . . . . . . . . . . . . .30-31Top U.S. media companies . . . . . . . . . . . . . . . . . . . . . . . . . . . . . . . . . . . . .32Top media companies by sector . . . . . . . . . . . . . . . . . . . . . . . . . . . . . .33-36Top magazines by ad pages and total gross revenue . . . . . . . . . . . . . . . . . .37Top newspapers by circulation and ad revenue . . . . . . . . . . . . . . . . . . . . . .38Top 10 syndicated TV shows by ad revenue . . . . . . . . . . . . . . . . . . . . . . . . .39Top 10 Web sites by ad revenue . . . . . . . . . . . . . . . . . . . . . . . . . . . . . . . . .39TV network ad revenue totals . . . . . . . . . . . . . . . . . . . . . . . . . . . . . . . . . . .41Super Bowl ad costs, ratings, viewers 1967-2005 . . . . . . . . . . . . . . . .42-43
AGENCY REPORTNetworks and agencies of the top 4 marketing organizations . . . . . . .46-47Top advertising organizations and market share pie chart . . . . . . . . .48-49Top core agency brands . . . . . . . . . . . . . . . . . . . . . . . . . . . . . . . . . . . .50-51Top independent agency networks . . . . . . . . . . . . . . . . . . . . . . . . . . . . . . . .51Top media specialist companies . . . . . . . . . . . . . . . . . . . . . . . . . . . . .52-53Top interactive and direct marketing agencies . . . . . . . . . . . . . . . . . .54-55Top sales promotion and healthcare agencies . . . . . . . . . . . . . . . . . . .56-57Top multicultural agencies . . . . . . . . . . . . . . . . . . . . . . . . . . . . . . . . . . . . .58
TM
©20
05 C
rain
Com
mun
icat
ions
Inc
.
DIRECTORY OFPRODUCTS & SERVICES
ADVERTISING AGE
Display advertising: Contact Paul Audino at 212-210-0280 or [email protected]
Classified advertising: Contact Angela Carola at 800-248-1299 or [email protected]
ADVERTISING AGE INTERACTIVE
AdAge.comAdvertising Age’s Web site, updated daily.
Ad Age’s AgencyPreview.com, in cooperation with AdForum.com. The largest searchable database of U.S. agencies on the Web.
MadisonandVine.comThe hottest site covering the convergence ofentertainment and advertising.
To advertise, contact Allison Arden at 212-210-0794 or [email protected]
AD AGE CUSTOM PROGRAMS
The Ad Age Group’s Custom Programs offer a wide variety of options to tailor your message to a specific market.
Contact Chiqui Cartagena at 212-210-0156or [email protected]
FEBRUARY 2005
SUPPLEMENT TO
McGOVERN& QUELCH
WHYCMOS
FAILSCOTT DAVIS HOW TO
AVOIDMARKETING
MYOPIAYANKELOVICHCOME TO
CONCURRENCE
P&G2005
STENGEL MAPSNEW WORLD
FOUR-STEP PROGRAM TO RE-BUILDMARKETING MODELS
MARKETING AT C-LEVEL
ADVERTISING&
MARKETINGTop U.S. marketer by ad expenditures
GENERAL MOTORS HITS $3.43 BILLIONTop U.S. megabrand
VERIZON REACHES $1.18 BILLIONBiggest U.S. ad medium
DIRECT MAIL DRAWS $48.37 BILLIONTop global marketer by ad spending
PROCTER & GAMBLE SPENDS $5.76 BILLION
Content, sources for marketer rankingsAD SPENDING BY THE WORLD’S TOP MARKETERS, from media tracked by domestic andglobal monitoring services to estimated non-media totals developed by Ad Age, is thethrust of this Advertising & Marketing section.
U.S. spending for the top U.S. marketers (Page 12) is a composite of media adver-tising measured in 13 national consumer media by TNS Media Intelligence, YellowPages from Yellow Pages Integrated Media Assn., and unmeasured spending (directmail, promotion, co-op, coupons, etc.,) estimated by Ad Age.
The 100 Leading National Advertisers report (AA, June 28, 2004) further breaks outa marketer’s dollar totals by ad medium and presents the methodology used to esti-mate unmeasured tallies. That same report isolates by media spending and share datacompetitive battles in major categories: Autos and beer (Page 20), limited service andcasual dining (Page 21), men’s toiletries (Page 22), top retailers (Page 23) and more.
Global marketers data (Pages 18-19) are provided by TNS, Nielsen MediaResearch, Ibope and others in 80 global markets.
Two reports a year feature top brands based on media spending from TNS that AdAge collates into “megabrands,” all brands, products and services bearing the samename. Spending by the top 200 megabrands (Page 13) account for one-third of allU.S. measured spending. A brand required media expenditures of $77.6 million tomake the top 200 list.
BECKER
FRAS
IER
Comedies with adult appeal have one thing in common.
They’re built around appealing adults.

FactPack | Advertising Age | 1110 | Advertising Age | FactPack
1. General Motors Corp.
Buick Motor DivisionMcCann Erickson Worldwide
Cadillac Motor Car Divisionchemistri
Chevrolet Motor DivisionCampbell-Ewald
GM Service & Parts OperationsCampbell-Ewald; chemistri
GMACCampbell-Ewald
HummerModernista!
OnStar Corp.Campbell-Ewald
Pontiac-GMC Divisionchemistri; Lowe Worldwide
Saab Cars USALowe Worldwide
Saturn Corp.Goodby, Silverstein & Partners
2. Procter & Gamble Co.
Clairol, Cover Girl, Downy, Febreze,Hydrience, Joy, Natural Instincts,Nice ‘n Easy, Pantene, Pringles, Sure,Torengos, Ultress, Zest
Grey Worldwide
Aussie, Daily Defense, Dawn, Herbal
Essences, Infusium 23, Renewal 5X,Swiffer
Kaplan Thaler Group
Always, Max Factor, Noxzema, PertPlus, Secret, Tampax, Vidal Sassoon
Leo Burnett Worldwide
Bounty, Charmin, DayQuil, Metamucil,NyQuil, Pepto-Bismol, Prilosec, Puffs,ThermaCare, Vicks
Publicis Worldwide
Cascade, Crest, Dreft, Eukanuba,Fixodent, Folgers, Head & Shoulders,Iams, Luvs, Millstone, Olay, Old Spice,Pampers, Pur, Safeguard, ScentExpression, Scope, Sunny Delight,Tide
Saatchi & Saatchi
3. Time Warner
America Online BBDO Worldwide; Martin Agency
Home Box OfficeBBDO Worldwide
Time Inc.Fallon Worldwide; Mullen; Deutsch
Time4 MediaIn-house
Time Warner CableOgilvy & Mather
Turner Broadcasting SystemAssigned on a project basis
Warner Bros. EntertainmentIn-house
4. Pfizer
PFIZER CONSUMER HEALTHCARE
Lubriderm, Nicotrol, Prograine,Rogaine
Atmosphere BBDO
Actifed, Anusol, Benadryl, Ben-Gay,Benylin, Cortisone, Desitin,Dramamine, Efferdent, e.p.t.,Kaopectate, Listerine, ListerinePocket Paks, Ludens, Neosporin,PediaCare, Rolaids, Sinutab, Sudafed,Tucks, Unisom, Visine, Zantac
JWT
PFIZER PHARMACEUTICALS GROUP
RelpaxArnold Worldwide
ZyrtecBerlin Cameron/Red Cell
DiflucanCline Davis & Mann
Bextra, Dostinex, Dynastat,Genotropin, Inspra, Pregabalin,
SomavertEuro RSCG Life LM&P
Celebrex, ZoloftKaplan Thaler Group
Bextra, ViagraMcCann Erickson Worldwide
LipitorMerkley & Partners
DetrolSaatchi & Saatchi Healthcare
EisaiTBWA Health
5. DaimlerChrysler
Chrysler DivisionBBDO Detroit
Dodge DivisionBBDO Detroit
Jeep DivisionBBDO Detroit
Mercedes-Benz USAMerkley & Partners
COLOR KEY FOR AGENCYHOLDING COMPANIESOmnicom GroupInterpublic Group of Cos.WPP GroupPublicis GroupHavas
MAJOR ACCOUNTS AND AGENCIESFOR THE FIVE LARGEST U.S. MARKETERSPRIMARY AGENCIES COLOR CODED BY PARENT COMPANY
Not all brands and divisions are listed. To purhcase more information on advertisers and their agencies, see Ad Age’sLeading National Advertisers pdf at AdAge.com QwikFIND aap76g or CLICK HERE

FactPack | Advertising Age | 13
TOP 25 U.S. MEGABRANDSFrom Megabrands (AA, July 19, 2004). Basic data from TNS Media Intelligence. Measured mediatotals are AA estimates in millions for calendar 2003. *Includes AT&T Wireless (now part ofCingular) and AT&T Corp. (which SBC Communications intends to purchase). **SBC owns 60% andBellSouth Corp. 40%. The next edition of this Special Report will be published July 18, 2005.
RANK MEGABRAND U.S. AD SPENDING % CHANGE
1 Verizon telecommunications $1,177.5 11.1
2 AT&T telecommunications* 1,035.9 -3.4
3 Ford vehicles 853.1 -3.2
4 Sprint telecommunications 805.4 23.9
5 Nissan vehicles 776.1 38.5
6 Toyota vehicles 757.4 7.5
7 Chevrolet vehicles 687.0 -19.4
8 Cingular wireless phone service** 645.0 24.3
9 Sears department stores 627.3 -0.6
10 McDonald’s restaurants 619.4 2.3
11 Dodge vehicles 584.9 17.3
12 Home Depot building supply stores 539.4 31.3
13 Chrysler vehicles 509.5 16.5
14 Honda vehicles 486.6 -8.2
15 Wal-Mart discount stores 467.7 11.2
16 Dell computers 466.9 10.6
17 Microsoft software 458.2 59.0
18 Target discount stores 442.7 20.1
19 IBM computers & services 423.1 6.5
20 Hewlett-Packard computers 409.3 38.0
21 J.C. Penney Co. department stores 402.3 5.2
22 General Motors corporate 378.6 50.5
23 American Express financial services 368.7 29.7
24 Volkswagen vehicles 367.2 -0.7
25 T-Mobile wireless phone service 364.5 1.9
To purchase a more comprehensive ranking, go to AdAge.com QwikFIND aap81z or CLICK HERE
12 | Advertising Age | FactPack
TOP 25 U.S. ADVERTISERSFrom 100 Leading National Advertisers (AA, June 28, 2004). Table ranks marketers by their 2003U.S. spending, the sum of measured media from TNS Media Intelligence and unmeasured estimatesby Ad Age that include promotion and direct marketing, etc. Dollars are in billions. The next edi-tion of this Special Report will be published June 27, 2005.
RANK MARKETER U.S. AD SPENDING % CHANGE
1 General Motors Corp. $3.43 -1.4
2 Procter & Gamble Co. 3.32 24.3
3 Time Warner 3.10 6.0
4 Pfizer 2.84 10.6
5 DaimlerChrysler 2.32 14.1
6 Ford Motor Co. 2.23 -0.8
7 Walt Disney Co. 2.13 18.1
8 Johnson & Johnson 2.00 10.9
9 Sony Corp. 1.81 12.0
10 Toyota Motor Corp. 1.68 8.4
11 Verizon Communications 1.67 9.6
12 Sears, Roebuck & Co. 1.63 -1.7
13 General Electric Co. 1.58 25.4
14 GlaxoSmithKline 1.55 0.0
15 SBC Communications 1.51 38.4
16 McDonald’s Corp. 1.37 2.4
17 Unilever 1.33 -18.8
18 Altria Group 1.31 8.7
19 Nissan Motor Co. 1.30 34.6
20 Merck & Co. 1.26 9.1
21 Viacom 1.25 -0.9
22 L’Oreal 1.24 10.9
23 PepsiCo 1.21 8.8
24 Home Depot 1.15 29.9
25 Microsoft Corp. 1.15 26.2
To purchase a more comprehensive ranking, go to AdAge.com QwikFIND aap76z or CLICK HERE

FactPack | Advertising Age | 1514 | Advertising Age | FactPack
To purchase a more comprehensive ranking, go to AdAge.com QwikFIND aap76x or CLICK HERE
U.S. AD SPENDING TOTALS BY MEDIAFrom Robert J. Coen’s Universal McCann U.S. Volume Report as reported in 100 Leading NatioalAdvertisers (AA, June, 28, 2004). This table shows advertising totals by media. Ad spending figuresare for calendar 2003 in billions and include all commissions as well as art, mechanical and produc-tion expenses. *Includes network, spot, syndicated and Spanish-language TV.
RANK MEDIUM U.S. AD SPENDING % CHANGE
1 Direct mail $48.37 5.0
2 Newspaper 44.84 1.8
3 Broadcast TV* 41.93 -0.3
4 Radio 19.10 1.2
5 Cable TV 18.81 15.4
6 Yellow Pages 13.90 0.9
7 Consumer magazine 11.44 4.0
8 Internet 5.65 15.7
9 Out of home 5.44 5.2
10 Business publications 4.00 0.7
11 All other 31.99 4.1
12 Total 245.48 3.6
Direct mail19.7%
Newspaper18.3%
Broadcast TV17.1% Radio
7.8%
Cable TV7.7%
Yellow Pages5.7%
Consumermagazines4.7%
All other 13.0%
Business pubs 1.6%
Out of home 2.2%Internet 2.3%
TOP U.S. ADVERTISERS BY MEDIAFrom 100 Leading National Advertisers (AA, June 28, 2004). Table ranks advertisers by measuredmedia in the U.S. Ad spending figures are for calendar 2003 from Ad Age and TNS MediaIntelligence. Dollars are in millions. Rankings continue on Pages 16 and 17.
RANK MARKETER AD SPENDING IN MEDIUM % CHANGE
NEWSPAPER1 Verizon Communications $513.7 36.3
2 AT&T Wireless 510.4 21.7
3 Federated Department Stores 493.7 -5.3
4 Sprint Corp. 477.0 75.6
5 SBC Communications 441.7 42.5
CONSUMER MAGAZINE1 Procter & Gamble Co. $582.3 16.7
2 General Motors Corp. 453.8 15.0
3 Altria Group 367.9 -4.1
4 Johnson & Johnson 306.9 19.3
5 DaimlerChrysler 299.0 11.4
SUNDAY MAGAZINE1 Dell $76.8 7.5
2 National Consumer Marketing 62.0 -53.5
3 Bradford Exchange 54.1 0.1
4 Bose Corp. 53.7 13.2
5 Sears, Roebuck & Co. 45.3 43.3
OUTDOOR1 Anheuser-Busch Cos. $57.0 15.7
2 McDonald’s Corp. 41.6 27.0
3 Time Warner 37.0 15.9
4 General Motors Corp. 32.3 11.6
5 Nissan Motor Co. 32.2 150.5
To purchase a more comprehensive ranking, go to AdAge.com QwikFIND aap76v or CLICK HERE

16 | Advertising Age | FactPack FactPack | Advertising Age | 17
TOP U.S. ADVERTISERS BY MEDIAFrom 100 Leading National Advertisers (AA, June 28, 2004). Tables rank advertisers by U.S.measured media. Ad spending, for calendar 2003, is from Ad Age and TNS Media Intelligence.Dollars are in millions. Media spending by top marketers is detailed in the 100 Leading National
RANK MARKETER EXPENDITURE IN MEDIUM % CHANGE
NETWORK TV1 Procter & Gamble Co. $833.6 15.2
2 General Motors Corp. 641.4 -11.8
3 Johnson & Johnson 527.5 3.7
4 Ford Motor Co. 449.6 2.7
5 Pfizer 442.4 3.1
CABLE TV1 Procter & Gamble Co. $514.6 33.2
2 General Motors Corp. 311.3 4.9
3 Time Warner 250.1 5.5
4 Altria Group 187.4 16.5
5 Walt Disney Co. 168.3 29.5
SPOT TV1 DaimlerChrysler $596.0 1.1
2 General Motors Corp. 393.0 -26.1
3 Honda Motor Co. 330.9 8.2
4 Nissan Motor Co. 320.1 33.3
5 Ford Motor Co. 277.8 -19.4
SPANISH-LANGUAGE NETWORK TV1 Lexicon Marketing Group $216.2 NA2 Procter & Gamble Co. 145.8 24.2
3 Sears, Roebuck & Co. 120.5 23.1
4 PepsiCo 76.3 37.7
5 General Motors Corp. 59.0 23.1
To purchase a more comprehensive ranking, go to AdAge.com QwikFIND aap76v or CLICK HERE
Advertisers Profile Edition, which can be purchased at QwikFIND aap76g. The supplement alsoincludes listings of top brands and key marketing personnel for each top 100 company. *Internetfigures are Ad Age estimates based on TNS data.
RANK MARKETER EXPENDITURE IN MEDIUM % CHANGE
SYNDICATED TV1 Procter & Gamble Co. $329.2 51.1
2 Johnson & Johnson 101.5 52.4
3 GlaxoSmithKline 93.7 -6.1
4 Pfizer 84.9 2.5
5 Mars Inc. 74.5 40.0
NETWORK RADIO1 General Motors Corp. $36.1 123.1
2 AutoZone 34.6 0.1
3 RadioShack Corp. 30.8 64.7
4 Pfizer 26.4 34.7
5 Procter & Gamble Co. 25.5 3.0
NATIONAL SPOT RADIO1 SBC Communications $144.2 32.7
2 Home Depot 102.5 63.2
3 Verizon Communications 79.2 11.2
4 Time Warner 73.4 45.9
5 News Corp. 67.9 38.9
INTERNET*1 Time Warner $120.2 -31.4
2 InterActiveCorp 77.2 50.2
3 Dell 48.9 74.1
4 General Motors Corp. 48.0 17.9
5 Toyota Motor Corp. 47.9 109.8
To purchase a more comprehensive ranking, go to AdAge.com QwikFIND aap76v or CLICK HERE

18 | Advertising Age | FactPack FactPack | Advertising Age | 19
TOP 25 GLOBAL MARKETERSFrom Global Marketing (AA, Nov. 8, 2004). Essential data from Nielsen Media Research, TNS MediaIntelligence, Ibope and others. Figures are Ad Age estimates in millions of U.S. dollars and includemeasured media only. The next edition of the Global Marketing special report will be published onNov. 14, 2005.
RANK GLOBAL MARKETER 2003 AD SPENDING % CHANGE
1 Procter & Gamble Co. $5,762 29.0
2 Unilever 3,540 13.3
3 General Motors Corp. 3,412 4.1
4 Toyota Motor Corp. 2,669 9.2
5 Ford Motor Co. 2,537 3.9
6 Time Warner 2,378 9.9
7 DaimlerChrysler 2,230 15.7
8 L’Oreal 2,180 37.3
9 Nestle 1,737 19.5
10 Sony Corp. 1,684 17.7
11 Walt Disney Co. 1,680 22.4
12 Nissan Motor Co. 1,674 27.7
13 Johnson & Johnson 1,665 14.1
14 Honda Motor Co. 1,542 6.9
15 Altria Group 1,514 9.2
16 Volkswagen 1,435 13.1
17 PepsiCo 1,255 9.5
18 Pfizer 1,229 9.0
19 McDonald’s Corp. 1,213 3.3
20 Coca-Cola Co. 1,195 0.8
21 GlaxoSmithKline 1,176 5.2
22 General Electric Co. 1,107 0.0
23 Reckitt Benckiser 1,097 36.7
24 Danone Group 1,018 47.8
25 News Corp. 1,005 9.8
To purchase a comprehensive pdf, go to AdAge.com QwikFIND aaq10o or CLICK HERE
TOP ADVERTISERS IN TOP 10COUNTRIES, EXCLUDING THE U.S.From Global Marketing (AA, Nov. 8, 2004). Estimated totals, in millions, are by country fromZenithOptimedia’s “Advertising Expenditure Forecasts,” December 2004 and 2003 editions. Data byadvertiser from Nielsen Media Research, TNS Media Intelligence, Ibope, Nikkei Advertising ResearchInstitute, Carat, Pan Arab Research Center and others. Advertiser figures are Ad Age estimates in mil-lions of U.S. dollars and include measured media only.
Figures are converted to U.S. dollars using average annual exchange rates on an historical basis. Bycomparison, the U.S. ranking (Page 12) is led by General Motors Corp. at $3.43 billion in measuredspending out of a national total of $128.36 billion, according to TNS. The next edition of this GlobalMarketing feature will be published Nov. 14, 2005.
RANK COUNTRY/LEAD MARKETER 2003 AD SPENDING % CHANGE
1 Japan $36,222 8.1
Toyota Motor Corp. $944 -3.8
2 Germany 18,036 6.3
Procter & Gamble Co. 312 23.8
3 United Kingdom 17,043 11.8
Unilever 370 30.8
4 France 10,789 19.5
Danone Group 523 81.4
5 Italy 8,831 24.6
Fiat 100 12.1
6 China 7,658 20.8
Procter & Gamble Co. 611 NA7 South Korea 6,785 12.8
Samsung Group 167 13.3
8 Spain 6,278 23.5
Telefonica 146 50
9 Canada 6,101 16.9
General Motors Corp. 271 12.3
10 Australia 5,433 32.6
Coles Myer 180 55.3
To purchase a more comprehensive ranking, go to AdAge.com QwikFIND aaq10o or CLICK HERE

20 | Advertising Age | FactPack FactPack | Advertising Age | 21
TOP 10 AUTOMOTIVE NAMEPLATESFrom 100 Leading National Advertisers (AA, June 28, 2004). Ad spending in 2003 in millions fromTNS Media Intelligence. Share, from Automotive News, a sibling publication of Advertising Age.,based on 16.7 million units sold in the U.S. in 2003.
RANK NAMEPLATE U.S. MARKET SHARE AD SPENDING
1 Ford Division 17.3% $757.0
2 Chevrolet 15.8 630.1
3 Toyota Division 9.6 651.9
4 Dodge 7.3 544.9
5 Honda Division 7.1 423.4
6 Nissan Division 4.1 758.0
7 GMC 3.4 176.0
8 Pontiac 2.9 164.0
9 Chrysler Division 2.8 472.3
10 Jeep 2.6 309.5To purchase a more comprehensive ranking, go to AdAge.com QwikFIND aap76u or CLICK HERE
TOP 10 BEER BRANDSFrom 100 Leading National Advertisers (AA, June 28, 2004). Ad spending is in millions from TNSMedia Intelligence for calendar 2003. Beer market share from Beer Marketer's Insights and basedon 208.2 million barrels of beer in 2003.
RANK BRAND U.S. MARKET SHARE AD SPENDING
1 Bud Light 18.3% $130.4
2 Budweiser 14.9 121.0
3 Coors Light 8.0 126.7
4 Miller Lite 7.6 122.6
5 Natural Light 4.0 0.2
6 Busch 3.4 10.9
7 Corona Extra 3.4 33.1
8 Busch Light 2.8 2.6
9 Miller High Life 2.6 21.5
10 Miller Genuine Draft 2.2 42.6To purchase a more comprehensive ranking, go to AdAge.com QwikFIND aap76q or CLICK HERE
TOP 10 LIMITED SERVICE RESTAURANTSFrom 100 Leading National Advertisers (AA, June 28, 2004). Ad spending in 2003 in millions fromTNS Media Intelligence. Share from Technomic's top 200 chains (57% of $288.4 billion U.S. restaurantsales).
RANK CHAIN U.S. MARKET SHARE AD SPENDING
1 McDonald’s Corp. 19.5% $551.5
2 Burger King 7.0 272.1
3 Wendy’s 6.5 297.5
4 Subway 5.0 249.5
5 Taco Bell 4.7 201.0
6 Pizza Hut 4.4 171.4
7 KFC 4.4 222.7
8 Starbucks 3.3 19.0
9 Domino’s Pizza 2.7 114.6
10 Dunkin’ Donuts 2.7 50.3To purchase a more comprehensive ranking, go to AdAge.com QwikFIND aap76p or CLICK HERE
TOP 10 CASUAL DINING RESTAURANTSFrom 100 Leading National Advertisers (AA, June 28, 2004). Ad spending in 2003 in millions fromTNS Media Intelligence. Share from Technomic's top 200 chains (57% of $288.4 billion U.S. restaurantsales).
RANK CHAIN U.S. MARKET SHARE AD SPENDING
1 Applebee’s 9.8% $106.1
2 Outback Steakhouse 6.9 56.3
3 Chili’s Grill & Bar 6.7 94.8
4 Red Lobster 6.6 91.5
5 Olive Garden 5.6 86.3
6 T.G.I. Friday’s 4.9 63.0
7 Ruby Tuesday 3.7 2.5
8 Cheesecake Factory 2.0 1.1
9 Romano’s Macaroni Grill 1.8 17.2
10 Bennigan’s 1.6 1.2To purchase a more comprehensive ranking, go to AdAge.com QwikFIND aap76p or CLICK HERE

22 | Advertising Age | FactPack FactPack | Advertising Age | 23
TOP 10 MEN’S DEODORANTS & LOTIONSFrom 100 Leading National Advertisers (AA, June 28, 2004). 2003 ad spending in millions from TNSMedia Intelligence. Chart merges deodorants, shaving lotions/colognes/talc, body washes and spraysand skincare creams to form a total market of $1.26 billion in sales. Share data from IRI.
RANK BRAND U.S. MARKET SHARE AD SPENDING
1 Old Spice 13.3% $40.3
2 Mennen 8.0 3.4
3 Right Guard 7.6 22.5
4 Degree 5.6 19.9
5 Axe 4.1 26.4
6 Gillette Series 3.5 1.8
7 Ban 2.9 12.9
8 Arrid Extra Dry 2.5 10.9
9 Arm & Hammer Ultramax 2.3 5.6
10 Mitchum 1.9 0.0To purchase a more comprehensive ranking, go to AdAge.com QwikFIND aap76s or CLICK HERE
TOP 10 AIR & RUG FRESHENERSFrom 100 Leading National Advertisers (AA, June 28, 2004). Ad spending is in millions from TNSfor calendar 2003. Combines $954.5 million market for in-home deodorizers, air fresheners/purifi-cation products, rug cleaners and scented household products like candles. Share from IRI.
RANK BRAND U.S. MARKET SHARE AD SPENDING
1 Glade 25.3% $58.2
2 Air Wick/Wizard 13.9 30.1
3 Febreze 8.9 41.4
4 Renuzit 7.7 0.0
5 Rug Doctor 6.5 0.0
6 Resolve 5.5 9.0
7 Oust 3.8 32.6
8 Woolite 3.5 6.3
9 Private label 2.3 0.0
10 Lysol NeutraAir 2.0 15.6To purchase a more comprehensive ranking, go to AdAge.com QwikFIND aap76r or CLICK HERE
TOP 10 FLAT PANEL TV MARKETERSFrom 100 Leading National Advertisers (AA, June 28, 2004). Shares from NPD Group are for plasmaand LCD flat-panel TVs by dollar volume for 52 weeks ending in March 2004. Ad spending, in mil-lions, from TNS Media Intelligence, is for calendar 2003.
RANK BRAND U.S. MARKET SHARE AD SPENDING
1 Sony 23.8% $10.5
2 Sharp 16.5 20.2
3 Panasonic 11.5 11.1
4 Pioneer 9.9 4.1
5 Samsung 9.0 14.6
6 Philips 5.2 13.6
7 Hitachi 4.0 2.4
8 Zenith 3.7 5.4
9 Toshiba 2.8 2.1
10 Fujitsu 1.9 0.2To purchase a more comprehensive ranking, go to AdAge.com QwikFIND aap76t or CLICK HERE
TOP 10 RETAILERSFrom 100 Leading National Advertisers (AA, June 28, 2004). Retailers are ranked by ad spending inmillions from TNS Media Intelligence for calendar 2003. Sales are in billions for 2003 from publicdocuments.
RANK RETAILER AD SPENDING SALES
1 Sears, Roebuck & Co. $634.7 $41.12
2 Federated Department Stores 604.8 15.26
3 Target Corp. 573.7 48.16
4 May Department Stores 543.4 13.34
5 Home Depot 522.7 64.82
6 J.C. Penney Co. 436.4 17.79
7 Wal-Mart Stores 428.6 256.33
8 Gap 356.0 15.85
9 Best Buy Co. 302.1 24.55
10 Lowe’s Cos. 299.2 30.84To purchase a more comprehensive ranking, go to AdAge.com QwikFIND aap76m or CLICK HERE

FactPack | Advertising Age | 2524 | Advertising Age | FactPack
MOST RECALLED: MOST LIKED:
IAG’S TOP SPOTS OF 2004The Ad Age/IAG 2004 Recall Report focuses exclusively on television ads breaking Jan 1 - Dec 31,2004 and ranks the spots based upon viewers' ability to recall the new ads and their associatedbrands/products. The Recall Ranking is derived from an ad's individual Recall Score and Recall Index.The Recall Score is the percentage of TV viewers who can recall within 24 hours the brand of the adthey were exposed to during the normal course of viewing TV.
These scores are then indexed against the mean score for all new ads during the time period(Recall Index). 100 equals average. The Overall ad performance ranking also includes an additionalmeasure of Likability, which is derived from an ad's Likability Score and Likability Index. TheLikability Score is the percentage of viewers who claim to like an ad "a lot" (among those who canrecall the ad and its associated brand). These scores are then indexed against the mean score for all newads during the time period (Likability Index). 100 equals average.
For same-length spots with minor variations, all versions are aggregated to yield one combinedscore. All ads under consideration must meet a minimum survey sample size of 200. The Overall Top10 Recall ranking is based on over 7.9 million surveys of TV viewers conducted between Jan 2, 2004and Jan 1, 2005. Total sample size varies across individual product category rankings.
MOST RECALLED ADS OF 2004RANK BRAND AD DESCRIPTION INDEX
1 Windex 30% better—birds sit on weather vane, other birdsfly into window, injured birds in casts
240
2 Pizza Hut 4 for All Pizza—Muppets argue over what toppingsthey want on pizza (:15)
237
3 DirecTV Fan Letter—Robert Duvall dramatically readsfan letter by Jason Steeg
237
4 Breathe Right Nasal Spray & Strips—couple makes fun of eachother’s snoring
235
5 Pizza Hut 4 for All Pizza—Muppets argue over whattoppings they want on pizza (:30)
232
6 M&M’s Wizard of Oz spoof, M&M’s & Dorothy helpthe M&M’s find their colors
232
7 Capital One No Hassle Rewards—David Spade says “no”to man on phone
232
8 Capital One PrimeLock—Huns charge through mall towardwoman paying for gifts with credit card
230
9 Oreo Boy dunks & eats Oreos with grandfather;milk’s favorite cookie
229
10 AFLAC Woman sees private investigator, duck outin rain, black-and-white film noir spoof
227
MOST LIKED ADS OF 2004RANK BRAND AD DESCRIPTION INDEX
1 Ford Kyle returns home from war, family greetshim at airport*
243
2 THQ WWE Smackdown vs. Raw—Torrie Wilson & StacyKeibler fight; scenes of game
220
3 Chevrolet SSR—kids with soap in their mouths, boycusses when he sees convertible
217
4 Bud Light Couple in horse-drawn sled, woman holdscandle and is flamed when horse passes gas
212
5 Lay’s Elderly couple fights over bag of chips, womanhas his dentures
211
6 Budweiser Football coach yells at ref, same ref gets yelledat by wife at home
197
7 Budweiser Donkey dreams of becoming a Clydesdale 196
8 Pepsi Bear tears apart cabin, then dresses up likehuman to buy soda
190
9 Nissan Maxima—woman wearing coat touches car insnowy winter weather
189
10 Chrysler 300—woman jogging on street imagines herselfin car as it passes; has bold style
188
*Spot aired following NBC's 11/21 "American Dreams" (4:50)

MEDIATop U.S. media company
TIME WARNER GAINS $29.25 BILLION FROM MEDIATop cable TV network in ad revenue
ESPN BAGS $1.16 BILLIONTop magazine by gross revenue from advertising, circulation
“PEOPLE” COUNTS $1.24 BILLIONTop newspaper by circulation
“USA TODAY” NABS AVERAGE DAILY CIRCULATIONOF 2.22 MILLION
Most expensive weekly TV show in prime time
“AMERICAN IDOL” PULLS $658,333 PER :30
Content, sources for media rankingsIN THIS SECTION, IT IS ALL ABOUT MEDIA, broadly defined as media distribution busi-nesses supported by advertising.
Properties of the nation’s 12 largest media monoliths, from Time Warner toEchoStar Communications Group, are shown on Pages 28-29. The companies wereranked in Ad Age’s 100 Leading Media Companies report (AA, Aug. 23, 2004).
That ranking was based on the flow of net revenue from each company’s U.S.media properties, which may or may not equate to a company’s total corporate rev-enue. Revenue streams from book publishing, book and record clubs, movie and TVproduction, media-buying services, electronic retailing, paper mills, wireless servic-es, and trade show divisions are excluded from media totals.
In preparing this annual list, Ad Age draws on public documents in general, BIAFinancial Network specifically for radio and TV and Kagan World Media for cablenetworks. Other informed sources also were used.
Gross revenue from advertising and circulation is the metric used to rank 300magazines in the Ad Age Magazine 300 report (AA, Sept. 20, 2004). The top 10 arepresented on Page 37. Other rankings—magazines and newspapers by circulation andgross ad revenue, web sites by ad revenue, TV networks and Spanish-language TV bytheir ad take—are from leading industry monitoring services such as PublishersInformation Bureau, TNS Media Intelligence and Audit Bureau of Circulations.
What do women see in our comedies? Mostly . . . themselves.
SABRINA, THE TEENAGE WITCH
THE PARKERS
GIRL
FRIEN
DS

FactPack | Advertising Age | 2928 | Advertising Age | FactPack
1. Time Warner
America OnlineHome Box Office Services
HBO, Cinemax
Time Inc.People, Sports Illustrated, Time, InStyle
Southern Progress Corp.Southern Living, Cooking Light, Sunset
Time4 MediaGolf Magazine, Field & Stream
Time Warner CableTime Warner Cable, Road Runner
Turner Broadcasting SystemTNT, CNN, CNN.com, TBS
Warner Bros. EntertainmentWB Television Network
2. Comcast Corp.
Comcast Cable CommunicationsCable Networks
Golf Channel, Outdoor Life, G4techTV
E! NetworksE! Entertainment Television, Style
3. Viacom
BET HoldingsBET, BET on Jazz
CBS TV NetworkWCBS-TV (New York)
Infinity Broadcasting Corp.WINS AM (New York)
MTV Networks
Nickelodeon, MTV, Comedy Central, SpikeTV
Showtime NetworksShowtime, Movie Channel, Flix
UPNKTXA-TV (Dallas-Fort Worth)
Viacom Outdoor
4. Walt Disney Co.
ABC Inc.A&E Television Networks
A&E, History Channel
ABC TV NetworkWABC-TV (New York)
ABC Radio NetworksWPLJ FM (New York)
Disney ABC Cable NetworksDisney Channel, ABC Family
ESPN Inc.ESPN, ESPN2, ESPN.com
Lifetime Entertainment ServicesLifetime Channel
Buena Vista MagazinesESPN Magazine, FamilyFun, Discover
Us Weekly (Wenner Media owns 50%)
5. NBC Universal General Electric Co.
NBC Television NetworkWNBC-TV (New York)
NBC Universal CableUSA Network, CNBC, Sci Fi, Bravo
MSNBCMSNBC, MSNBC.com
Paxson Communications Corp.WPXN-TV (New York)
Telemundo Communications GroupKVEA-TV (Los Angeles)
6. Cox Enterprises
Cox CommunicationsCox Cable, Cox High Speed Internet
Cox NewspapersAtlanta Journal-Constitution
Cox RadioWSB AM (Atlanta)
Cox TelevisionKTVU-TV (San Francisco)
7. DirecTV Group News Corp. 34%
DirecTV
8. News Corp.
Fox Entertainment GroupFox Broadcasting Co.
KTTV-TV (Los Angeles)
Fox Cable Networks GroupFox Sports Networks, FX, Fox News
Gemstar-TV Guide InternationalTV Guide, TV Guide Channel
New York PostNews America MarketingWeekly Standard
9. Gannett Co.USA Today, USA Weekend, Arizona Republic
Gannett BroadcastingKUSA-TV (Denver)
10. Clear Channel Communications
Clear Channel RadioWLTW-FM (New York)
Clear Channel TelevisionWKRC-TV (Cincinnati)
Clear Channel Outdoor
11. Advance Publications
Advance NewspapersThe Star-Ledger (Newark)
Bright House Networks
Conde Nast PublicationsVogue, Vanity Fair, Glamour, New Yorker
Fairchild PublicationsBride’s, W, Modern Bride, Jane, Details
Golf Digest Cos.Golf Digest, Golf World, Golf for Women
Parade PublicationsParade
12. EchoStarCommunications Group
DISH Network
MEDIA PROPERTY COLOR CODES
Division, Magazine, Newspaper, TV,Cable/Satellite, Internet, Radio
MAJOR DIVISIONS, PROPERTIES OFTHE NATION’S LEADING MEDIA COMPANIESPRIMARY PROPERTIES COLOR CODED BY MEDIA TYPE
The Top 12 are based on media revenue in 2003. Not all properties owned by the companies are shown. Properties shownmay be partly owned. A pullout poster illustrating ownership of properties of 15 top U.S. media companies appeared in the
100 Leading Media Companies Special Report (AA, Aug. 23, 2004) and can also be downloaded from AdAge.com QwikFINDaap90n. The family tree diagram includes revenue, circulation and some subscriber data.

AD AGE’S FALL 2004 PRIME TIMEPRICING SURVEYFrom an annual feature (AA, Sept. 27, 2004), average costs for a 30-second spot are compiled fromestimates of advertising agencies and media-buying companies. 1) Later fall shows: King of the Hill,Malcolm, Partner, Swan, Billionaire, House, Bernie Mac, O.C., Champ. 2) January shows: Sketch,King of the Hill, Malcolm, American Dad, ABC Monday Night Movie, Grey’s, Athens, “24”,American Idol, Related, Bernie Mac, Inside, Jonny Zero. 3) Mid-season shows: Alias, Blind Justice
FactPack | Advertising Age | 3130 | Advertising Age | FactPack
The Benefactor / Movie of Week2 Monday Night Football/Movie2 MNF/Grey’s Anatomy2
$79,752/NA $307,019/NA $323,000/NA
Still Standing Listen Up Raymond Two & Half Men CSI: Miami$152,801 $163,733 $315,850 $249,017 $256,760
Fear Factor Las Vegas LAX$138,972 $182,861 $139,967
North Shore / Athens2 The Swan1 / “24”2 No Fox programming$109,226/NA $118,200/NA
One on One Half and Half Girlfriends Second Time No UPN programming$45,582 $51,027 $62,500 $48,592
7th Heaven Everwood No WB programming$107,956 $76,263
MONDAY 8 p.m. 9 p.m. 10 p.m.
My Wife & Kids George Lopez According to Jim Rodney NYPD Blue/Blind Justice3
$167,956 NA $204,212 $108,260 $132,144/NA
NCIS Clubhouse Judging Amy$97,577 $102,053 $99,184
Last Comic /Avg. Joe/Contender Father of Pride Scrubs Law & Order: SVU$137,050/$117,500/$330,000 $156,500 $216,600 $181,494
Billionaire1/American Idol2 House1 No Fox programmingIdol2 $217,713/$620,000 $192,561
All of Us Eve Veronica Mars No UPN programming$48,080 $44,719 $23,556
Gilmore Girls One Tree Hill No WB programming$76,334 $102,820
TUESDAY 8 p.m. 9 p.m. 10 p.m.
Lost Bachelor/Bachelorette Wife Swap$133,514 $205,522 $129,969
60 Minutes King of Queens Center Universe CSI: New York$66,295 $143,302 $94,613 $161,548
Hawaii The West Wing / Revelations Law & Order$132,346 $213,538/$221,100 $227,500
That ’70s Show Quints/Related2 Mac1/ Idol2 Method/Mac2 No Fox programming$202,307 $177,825/$280,000 $158,000/$658,333 $149,295/$313,000
America’s Top Model Kevin Hill No UPN programming$92,045 $39,369
Smallville Blue Collar TV Green Screen No WB programming$111,700 $73,200 $42,000
WEDNESDAY 8 p.m. 9 p.m. 10 p.m.
Extreme Makeover Life As We Know It Prime Time Live$74,859 $49,322 $89,108
Survivor: Vanuatu CSI: Crime Scene Investigation Without a Trace$412,833 $374,231 $211,002
Joey Will & Grace The Apprentice ER$392,500 $359,546 $409,877 $479,250
The O.C.1 Tru Calling No Fox programming$164,990 $129,208
WWE Smackdown! No UPN programming$30,500
The Mountain Studio 7 No WB programming$77,182 $39,907
THURSDAY 8 p.m. 9 p.m. 10 p.m.
8 Rules Savages Hope & Faith Less Than Perf. 20/20$106,813 $102,187 $140,037 $117,700 $100,680
Joan of Arcadia JAG Dr. Vegas$95,325 $70,148 $76,763
Dateline Third Watch Medical Investigation$72,479 $90,858 $123,994
Specials /The Insider Next Great Champ/Jonny Zero2 No Fox programmingNA/$63,100 $85,000/$75,500
America’s Top Model (RPT) Enterprise No UPN programming$88,660 $31,180
What I Like Commando Nanny Reba Grounded No WB programming$49,661 $38,838 $59,705 $60,772
FRIDAY 8 p.m. 9 p.m. 10 p.m.
Wonderful World of Disney$69,610
The Amazing Race Crime Time Saturday 48 Hours Mysteries$91,139 $73,140 $46,489
The Apprentice (RPT) NBC Saturday Night Movie$63,500 $67,377
Cops Cops America’s Most Wanted No Fox programming$79,400 $73,900 $71,500
SATURDAY 8 p.m. 9 p.m. 10 p.m.
America’s Funniest Home Videos Extreme Makeover: Home Ed. Desperate Housewives/Alias3 The Practice: Fleet Street$81,136 $186,658 $156,542/NA $160,000
60 Minutes Cold Case CBS Sunday Movie$90,453 $153,305 $148,761
Dateline American Dreams Law & Order: Criminal Intent Crossing Jordan$62, 184 $94,040 $194,931 $164,918
King 1 Malcolm1 The Simpsons Arrested1 Partner1 No Fox programming$95,750 $281,800 $336,935 $211,133 $177,580
Steve Harvey’s Big Time Charmed Jack & Bobby No WB programming$39,970 $77,802 $82,415
SUNDAY 7 p.m. (ET) 8 p.m. 9 p.m. 10 p.m.

FactPack | Advertising Age | 3332 | Advertising Age | FactPack
TOP 25 U.S. MEDIA COMPANIESFrom 100 Leading Media Cos. (AA, Aug. 23, 2004). *Estimated 2003 media revenue in millions of dollarsis U.S.-only and solely from media distribution businesses supported by advertising. Many of thesemedia companies have non-media units. Sources: BIA Financial Network, Kagan World Media, TNSMedia Intelligence, Audit Bureau of Circulations. Next edition will be published Aug. 22, 2005.
RANK MEDIA COMPANY NET MEDIA REVENUE* % CHANGE
1 Time Warner $29,247 3.7
2 Comcast Corp. 17,492 9.3
3 Viacom 17,252 8.2
4 Walt Disney Co. 11,239 12.5
5 NBC Universal (General Electric Co.) 8,177 -1.8
6 Cox Enterprises 8,108 10.3
7 DirecTV Group 7,696 19.4
8 News Corp. 7,532 9.4
9 Gannett Co. 6,330 4.2
10 Clear Channel Communications 6,138 4.9
11 Advance Publications 5,909 9.2
12 EchoStar Communications Corp. 5,410 22.1
13 Tribune Co. 5,398 3.8
14 Charter Communications 4,819 5.5
15 Hearst Corp. 4,045 8.4
16 Cablevision Systems Corp. 3,694 12.2
17 Adelphia Communications Corp. 3,584 4.6
18 The New York Times Co. 3,227 4.8
19 Knight Ridder 2,848 0.4
20 Bloomberg 2,380 6.3
21 The Washington Post Co. 2,001 1.9
22 Dow Jones & Co. 1,549 -0.7
23 E.W. Scripps Co. 1,531 9.2
24 Belo 1,436 0.6
25 Univision Communications 1,392 7.7
To purchase a more comprehensive ranking, go to AdAge.com QwikFIND aap90x or CLICK HERE
TOP MEDIA COMPANIES BY SECTORFrom 100 Leading Media Cos. (AA, Aug. 23, 2004). Estimated 2003 media revenue in millions ofdollars is U.S.-only and from media distribution businesses supported by advertising. Sources includeBIA Financial Network, Kagan World Media, TNS Media Intelligence, Audit Bureau of Circulations.Companies by sector continue on Pages 34-36.
TOP 10 NEWSPAPER COMPANIESRANK MEDIA COMPANY NET NEWSPAPER REVENUE % CHANGE
1 Gannett Co. $5,610 5.8
2 Tribune Co. 4,017 2.4
3 The New York Times Co. 3,008 5.0
4 Knight Ridder 2,768 -0.4
5 Advance Publications 2,128 5.6
6 Hearst Corp. 1,458 10.5
7 Cox Enterprises 1,400 3.7
8 Dow Jones & Co. 1,227 -1.9
9 McClatchy Co. 1,098 2.8
10 The Washington Post Co. 873 3.7
To purchase a more comprehensive ranking, go to AdAge.com QwikFIND aap90z or CLICK HERE
TOP 10 MAGAZINE COMPANIESRANK MEDIA COMPANY NET MAGAZINE REVENUE % CHANGE
1 Time Warner $4,514 2.1
2 Advance Publications 2,197 13.3
3 Hearst Corp. 1,900 12.4
4 Primedia 1,079 -3.4
5 Reader’s Digest Association 835 -2.3
6 Meredith Corp. 808 15.0
7 Gruner & Jahr USA (Bertelsmann) 788 -5.0
8 International Data Group 760 -5.1
9 McGraw-Hill Cos. 668 -4.4
10 Reed Elsevier 601 -7.3
To purchase a more comprehensive ranking, go to AdAge.com QwikFIND aap91a or CLICK HERE

FactPack | Advertising Age | 3534 | Advertising Age | FactPack
TOP 10 CABLE NETWORK COMPANIESRANK MEDIA COMPANY NET CABLE REVENUE % CHANGE
1 Time Warner $7,774 10.0
2 Viacom 5,595 19.4
3 Walt Disney Co. 5,523 18.1
4 News Corp. 2,313 18.0
5 NBC Universal (General Electric Co.) 1,984 7.8
6 Discovery Communications 1,264 12.8
7 Cablevision Systems Corp. 979 12.2
8 Comcast Corp. 885 15.7
9 A&E Television Networks 882 7.2
10 Lifetime Entertainment Services 802 1.9To purchase a more comprehensive ranking, go to AdAge.com QwikFIND aap91c or CLICK HERE
TOP 10 CABLE SYSTEM/DBS COMPANIESRANK MEDIA COMPANY NET SYSTEM REVENUE SUBSCRIBERS
1 Comcast Corp. $16,607 21.5
2 Time Warner 7,699 10.9
3 DirecTV Group 7,696 12.2
4 Cox Enterprises 5,759 6.6
5 EchoStar Communications Corp. 5,410 9.4
6 Charter Communications 4,819 6.5
7 Adelphia Communications Corp. 3,584 5.4
8 Cablevision Systems Corp. 2,715 2.9
9 Advance Publications 1,585 2.1
10 MediaCom Communications Corp. 1,005 0.6To purchase a more comprehensive ranking, go to AdAge.com QwikFIND aap91c or CLICK HERE
TOP MEDIA COMPANIES BY SECTORFrom 100 Leading Media Cos. (AA, Aug. 23, 2004). Calendar 2003 media revenue are U.S.-onlymedia distribution businesses supported by advertising. Figures are estimates in millions of dollars.Primary sources include BIA Financial Network, Kagan World Media, TNS Media Intelligence, AuditBureau of Circulations and public documents.
From 100 Leading Media Cos. (AA, Aug. 23, 2004). Calendar 2003 media revenue are U.S.-onlymedia distribution businesses supported by advertising. Figures are estimates in millions of dollars.Primary sources include BIA Financial Network, Kagan World Media, TNS Media Intelligence, AuditBureau of Circulations and public documents.
TOP 10 BROADCAST TV COMPANIESRANK MEDIA COMPANY NET TV REVENUE % CHANGE
1 Viacom $7,761 4.1
2 NBC Universal (General Electric Co.) 6,193 -4.5
3 Walt Disney Co. 4,806 7.3
4 News Corp. 4,422 4.3
5 Tribune Co. 1,323 8.3
6 Univision Communications 1,059 6.7
7 Sinclair Broadcast Group 724 -1.0
8 Gannett Co. 720 -6.7
9 Hearst Corp. 687 -4.8
10 Time Warner 660 12.1To purchase a more comprehensive ranking, go to AdAge.com QwikFIND aap91b or CLICK HERE
TOP 10 RADIO COMPANIESRANK MEDIA COMPANY NET RADIO REVENUE % CHANGE
1 Clear Channel Communications $3,695 -0.6
2 Viacom 2,098 -1.1
3 Walt Disney Co. 612 5.7
4 Westwood One 539 -2.1
5 Cox Enterprises 426 1.2
6 Entercom Communications Corp. 401 2.5
7 Citadel Broadcasting Corp. 345 11.6
8 Radio One 303 2.5
9 Cumulus Media 282 11.6
10 Emmis Communications Corp. 280 9.8To purchase a more comprehensive ranking, go to AdAge.com QwikFIND aap91d or CLICK HERE

36 | Advertising Age | FactPack FactPack | Advertising Age | 37
TOP 10 MAGAZINES BY AD PAGESFrom the DataCenter (AA, Jan. 17, 2005). Ranks U.S. consumer magazines by ad pages Januarythrough December 2004 from Publishers Information Bureau. Published quarterly.
RANK MAGAZINE AD PAGES % CHANGE
1 People 3,622.82 -2.2
2 Forbes 3,469.95 11.3
3 The New York Times Magazine 3,467.89 3.1
4 Fortune 3,404.81 11.5
5 InStyle 3,368.93 10.6
6 BusinessWeek 3,163.53 4.2
7 Vogue 3,011.11 1.8
8 Bridal Guide 2,797.74 -10.6
9 New York Magazine 2,651.98 7.9
10 Time 2,612.48 10.3To purchase a more comprehensive ranking, go to AdAge.com QwikFIND aaq30v or CLICK HERE
TOP 10 MAGAZINES BY GROSS REVENUEFrom the Magazine 300 Special Report (AA, Sept. 20, 2004). Table ranks magazines by 2003 grossrevenue, the combination of circulation and ad revenue. Revenue figures are Ad Age estimates.Average paid subscribers for six months ending Dec. 31, 2003 from Audit Bureau of Circulations. Thenext edition of this Special Report will be published Sept. 26, 2005.
RANK MAGAZINE TOTAL GROSS REVENUE PAID SUBSCRIBERS
1 People $1,235.1 3,603,115
2 Sports Illustrated 936.2 3,210,040
3 Time 920.8 4,112,311
4 TV Guide 916.6 9,009,571
5 Better Homes & Gardens 836.3 7,606,820
6 Parade 617.2 34,286,728
7 Newsweek 597.9 3,122,407
8 Reader’s Digest 563.7 11,044,694
9 Good Housekeeping 520.0 4,755,893
10 Woman’s Day 440.1 4,279,375To purchase a more comprehensive ranking, go to AdAge.com QwikFIND aap97h or CLICK HERE
TOP MEDIA COMPANIES BY SECTORFrom 100 Leading Media Cos. (AA, Aug. 23, 2004). Estimated 2003 media revenue in millions ofdollars is U.S.-only and from media distribution businesses supported by advertising. Sources includeBIA Financial Network, Kagan World Media, TNS Media Intelligence, Audit Bureau of Circulations.Yellow Pages data are directory divisions (yellow and white pages) collected from annual reports.*Dex Media revenue is pro forma for 2003. Dex, formerly Qwest Dex, was purchased in late 2003by Carlyle Group and Welsh, Carson, Anderson & Stowe.
TOP 3 OUTDOOR COMPANIESRANK MEDIA COMPANY NET OUTDOOR REVENUE % CHANGE
1 Clear Channel Communications $2,175 16.9
2 Viacom 1,748 7.0
3 Lamar Advertising Co. 810 4.4To purchase a more comprehensive ranking, go to AdAge.com QwikFIND aap91h or CLICK HERE
TOP 3 INTERNET COMPANIESRANK MEDIA COMPANY NET INTERNET AD REVENUE % CHANGE
1 Time Warner $8,600 -5.4
2 Yahoo! Inc. 1,355 68.0
3 Google 962 176.5To purchase a more comprehensive ranking, go to AdAge.com QwikFIND aap91f or CLICK HERE
FREE-STANDING INSERT COMPANIESRANK MEDIA COMPANY NET FSI REVENUE % CHANGE
1 Valassis Communications $878 7.5
2 News America Marketing (News Corp.) 624 15.6To purchase a more comprehensive ranking, go to AdAge.com QwikFIND aap91h or CLICK HERE
YELLOW PAGES COMPANIESRANK COMPANY NET DIRECTORY REVENUE % CHANGE
1 SBC Comnunications $4,478 -4.4
2 Verizon Communications 4,114 -4.0
3 BellSouth 1,906 -5.6
4 Dex Media* 1,631 5.4
5 Yellow Book USA (Yell Group) 1,023 32.2
38 | Advertising Age | FactPack FactPack | Advertising Age | 39
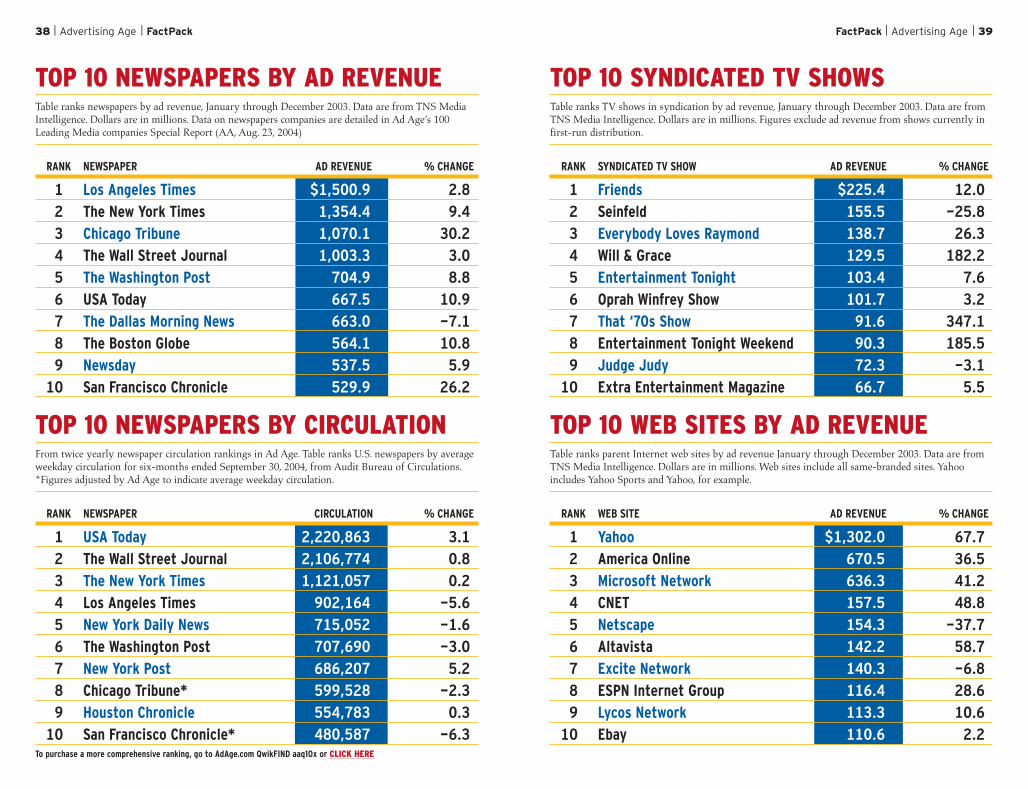
TOP 10 SYNDICATED TV SHOWS Table ranks TV shows in syndication by ad revenue, January through December 2003. Data are fromTNS Media Intelligence. Dollars are in millions. Figures exclude ad revenue from shows currently infirst-run distribution.
RANK SYNDICATED TV SHOW AD REVENUE % CHANGE
1 Friends $225.4 12.0
2 Seinfeld 155.5 -25.8
3 Everybody Loves Raymond 138.7 26.3
4 Will & Grace 129.5 182.2
5 Entertainment Tonight 103.4 7.6
6 Oprah Winfrey Show 101.7 3.2
7 That ‘70s Show 91.6 347.1
8 Entertainment Tonight Weekend 90.3 185.5
9 Judge Judy 72.3 -3.1
10 Extra Entertainment Magazine 66.7 5.5
TOP 10 WEB SITES BY AD REVENUETable ranks parent Internet web sites by ad revenue January through December 2003. Data are fromTNS Media Intelligence. Dollars are in millions. Web sites include all same-branded sites. Yahooincludes Yahoo Sports and Yahoo, for example.
RANK WEB SITE AD REVENUE % CHANGE
1 Yahoo $1,302.0 67.7
2 America Online 670.5 36.5
3 Microsoft Network 636.3 41.2
4 CNET 157.5 48.8
5 Netscape 154.3 -37.7
6 Altavista 142.2 58.7
7 Excite Network 140.3 -6.8
8 ESPN Internet Group 116.4 28.6
9 Lycos Network 113.3 10.6
10 Ebay 110.6 2.2
TOP 10 NEWSPAPERS BY AD REVENUETable ranks newspapers by ad revenue, January through December 2003. Data are from TNS MediaIntelligence. Dollars are in millions. Data on newspapers companies are detailed in Ad Age’s 100Leading Media companies Special Report (AA, Aug. 23, 2004)
RANK NEWSPAPER AD REVENUE % CHANGE
1 Los Angeles Times $1,500.9 2.8
2 The New York Times 1,354.4 9.4
3 Chicago Tribune 1,070.1 30.2
4 The Wall Street Journal 1,003.3 3.0
5 The Washington Post 704.9 8.8
6 USA Today 667.5 10.9
7 The Dallas Morning News 663.0 -7.1
8 The Boston Globe 564.1 10.8
9 Newsday 537.5 5.9
10 San Francisco Chronicle 529.9 26.2
TOP 10 NEWSPAPERS BY CIRCULATIONFrom twice yearly newspaper circulation rankings in Ad Age. Table ranks U.S. newspapers by averageweekday circulation for six-months ended September 30, 2004, from Audit Bureau of Circulations.*Figures adjusted by Ad Age to indicate average weekday circulation.
RANK NEWSPAPER CIRCULATION % CHANGE
1 USA Today 2,220,863 3.1
2 The Wall Street Journal 2,106,774 0.8
3 The New York Times 1,121,057 0.2
4 Los Angeles Times 902,164 -5.6
5 New York Daily News 715,052 -1.6
6 The Washington Post 707,690 -3.0
7 New York Post 686,207 5.2
8 Chicago Tribune* 599,528 -2.3
9 Houston Chronicle 554,783 0.3
10 San Francisco Chronicle* 480,587 -6.3To purchase a more comprehensive ranking, go to AdAge.com QwikFIND aaq10x or CLICK HERE

FactPack | Advertising Age | 41
TV NETWORK AD REVENUENetworks are ranked by ad revenue in millions for calendar 2003 from TNS Media Intelligence.*NBC Universal is owned by General Electric Co. which also owns 50% of PaxsonCommunications Corp. **22.3% of WB is owned by Tribune Co. ***From the Cable TV SpecialReport (AA, May 31, 2004). The next edition of this Special Report will be published June 6, 2005.
RANK NETWORK (PARENT) AD REVENUE % CHANGE
BROADCAST TV1 CBS (Viacom) $5,828 7.8
2 NBC* (NBC Universal) 5,576 -12.9
3 ABC (Walt Disney Co.) 5,127 14.3
4 FOX (News Corp.) 3,001 1.4
5 WB** (Time Warner) 1,024 19.5
6 UPN (Viacom) 505 8.0
7 PAX* (Paxson Communications Corp.) 162 -27.6
CABLE***1 ESPN (80% Walt Disney Co.; 20% Hearst Corp.) $1,164 26.4
2 Nickelodeon (Viacom) 844 12.9
3 MTV (Viacom) 836 13.3
4 Lifetime (50% Disney; 50% Hearst) 832 17.0
5 TBS (Time Warner) 753 12.8
6 TNT (Time Warner) 730 16.0
7 USA Network (NBC Universal) 567 33.3
8 CNN (Time Warner) 424 20.4
9 CNBC (NBC Universal) 423 -16.7
10 Discovery Channel (Discovery Communications) 413 4.9
SPANISH-LANGUAGE TV NETWORKS1 Univision (Univision Communications) $1,547 2.6
2 Telemundo (NBC Universal) 938 21.2
3 TeleFutura (Univision Communications) 241 183.8
There are many ways to reach women in daytime and early fringe.
But why bother with more than three?
JUDGE JOE BROWN
MONTEL
JUDG
E JU
DY

FactPack | Advertising Age | 4342 | Advertising Age | FactPack
YEAR AVERAGE :30 SPOT COST NETWORK RATING VIEWERS
2005 $2,400,000 FOX 41.1 86,100,000
2004 2,250,000 CBS 41.4 89,795,000
2003 2,100,000 ABC 40.7 88,637,000
2002 1,900,000 FOX 40.4 86,801,000
2001 2,050,000 CBS 40.4 84,335,000
2000 2,100,000 ABC 43.3 88,465,000
1999 1,600,000 FOX 40.2 83,720,000
1998 1,300,000 NBC 44.5 90,000,000
1997 1,200,000 FOX 43.3 87,870,000
1996 1,100,000 NBC 46.0 94,080,000
1995 1,000,000 ABC 41.3 83,420,000
1994 900,000 NBC 45.5 90,000,000
1993 850,000 NBC 45.1 90,990,000
1992 800,000 CBS 40.3 79,590,000
1991 800,000 ABC 41.9 79,510,000
1990 700,000 CBS 39.0 73,852,000
1989 675,000 NBC 43.5 81,590,000
1988 600,000 ABC 41.9 80,140,000
1987 575,000 CBS 45.8 87,190,000
1986 550,000 NBC 48.3 92,570,000
YEAR AVERAGE :30 SPOT COST NETWORK RATING VIEWERS
1985 $500,000 ABC 46.4 85,530,000
1984 450,000 CBS 46.4 77,620,000
1983 400,000 NBC 48.6 81,770,000
1982 345,000 CBS 49.1 85,230,000
1981 324,300 NBC 44.4 68,290,000
1980 275,000 CBS 46.3 76,240,000
1979 222,000 NBC 47.1 74,740,000
1978 185,000 CBS 47.2 78,940,000
1977 162,000 NBC 44.4 62,060,000
1976 125,000 CBS 42.3 57,710,000
1975 110,000 NBC 42.4 56,050,000
1974 107,000 CBS 41.6 51,700,000
1973 103,500 NBC 42.7 53,320,000
1972 86,000 CBS 44.2 56,640,000
1971 72,000 NBC 39.9 45,960,000
1970 78,200 CBS 39.4 44,270,000
1969 67,500 NBC 36.0 NA
1968 54,000 CBS 36.8 NA
1967 42,000 CBS+NBC 40.8 NA
To purchase a more comprehensive view of this table, go to AdAge.com QwikFIND aaq24y or CLICK HERE
SUPER BOWL SPOT COSTSFrom AdAge.com. Table presents average prices for 30-second spots in the Super Bowls. Rating ispercentage of U.S. households. Data from Ad Age reports and Nielsen Media Research. Ad costs in thistable are actual dollars. In 1967 the Super Bowl was shown on both CBS and NBC.

AGENCYREPORT
World’s top marketing organization by revenue
OMNICOM GROUP NOTCHES $8.62 BILLION IN ‘03Top core U.S. agency brand by revenue
JWT HITS $456.2 MILLIONWorld’s top core agency brand by revenue
DENTSU COLLECTS $1.86 BILLIONTop U.S. Hispanic agency by revenue
BROMLEY RECORDS $32.9 MILLIONTop media specialist company by worldwide billings
OMD WORLDWIDE BAGS $19.34 BILLIONTop marketing organization by worldwide media billings
PUBLICIS GROUPE AMASSES $34.40 BILLION
Content, methodologies for ad agenciesAMONG THE MANY CHARTS OF THE 60TH annual Agency Report are rankings of theworld’s top marketing organizations (Page 48); leading U.S. ad agency core “brands”(Page 50); and U.S. agency rankings by multicultural specialty (Page 58).
Marketing organizations are typically publicly-held holding companies; theirfinancial data are from public documents or supplied voluntarily. Agency brands ofthe world’s top four marketing organizations (Pages 46-47) hold more than 60% ofthe global agency business.
Agency brands in the U.S. include traditional ad agencies, healthcare and busi-ness-to-business shops. “Branding” identifies the core agency by stripping contribu-tions from subsidiaries and specialty units. Rankings of specialty units, interactive,direct marketing and sales promotion shops (Pages 54-57) come from Ad Age’sMarketing Services Report (AA, May 17, 2004).
Billings of media units at publicly-held companies (Pages 52-53) are RecmaInstitute estimates; billings for U.S. independents are considered Ad Age estimates.
There’s a reason why men call themselves “Weekend Warriors.”
MAX
IMUM
EXPO
SURE
STAR TREK: ENTERPRISE

46 | Advertising Age | FactPack FactPack | Advertising Age | 47
1. Omnicom Group
BBDO WorldwideAtmosphereBBDOBBDO Detroit CRM
DDB Worldwide Communications
TBWA Worldwide
Other Omnicom agenciesAgency.com1Health CommunicationsAlcone Marketing GroupArnell GroupBernard Hodes GroupCline, Davis & MannCorbett Accel Healthcare GroupDieste, Harmel & PartnersDoremus & Co.Eden Communications GroupElement 79 PartnersGMR MarketingGoodby, Silverstein & PartnersGrizzard Communications GroupGSD&MHarrison & Star Business GroupInteger GroupKetchum Directory AdvertisingKPRLieber, Levett, Koenig, Farese, BabcockLyons Lavey Nickel SwiftMartin/WilliamsMerkley & PartnersOMD WorldwideOrganicPHDRapp Collins WorldwideRuss Reid Co.Targetbase
TracyLockeU.S. Marketing & Promotions AgencyZimmerman & Partners
2. WPP GroupRed Cell
Berlin Cameron/Red CellCole & Weber/Red Cell
JWTConnect@jwtJWT Specialized CommunicationsJWT Technology
Ogilvy & Mather Worldwide141 WorldwideOgilvyOne Worldwide
Y&RBravo GroupKang & LeeMosaicaSicolaMartinSudler & HennesseyWunderman
Other WPP agenciesBrouillard CommunicationsCommonHealthEinson FreemanGlendinningMediaedge:ciaMendoza Dillon & AsociadosMindShareOgilvy HealthworldRTC Relationship MarketingUniWorld GroupVML
3. Interpublic Group of Cos.
Foote Cone & Belding Worldwide FCB HealthCareFCBiHacker GroupMarketing Drive WorldwideR/GA
Lowe & Draft PartnershipBerenter Greenhouse & WebsterDailey & AssociatesDraftLowe WorldwideLowe Healthcare WorldwideMedia First InternationalMullenTierney CommunicationsZipatoni Co.
McCann WorldgroupAdair-GreeneAustin KelleyAvrett, Free & GinsbergCampbell MithunCash Plus Media ServicesGillespieMcCann Erickson WorldwideMomentum WorldwideMRM PartnersNationwide Advertising ServiceTM AdvertisingTorre Lazur McCann Healthcare WorldwideUniversal McCann Worldwide
Other Interpublic agenciesAnalyticiBotsford GroupCampbell-Ewald
Carmichael LynchDeutschGothamHill, Holliday, Connors, CosmopulosInitiative Media WorldwideJack Morton WorldwideMartin AgencyOctagon
4. Publicis Groupe
Leo Burnett WorldwideArc WorldwideChemistriFrankelLapizSemaphore PartnersVigilanteWilliams-Labadie
Publicis WorldwidePublicis Dialog
Saatchi & SaatchiConill AdvertisingTeam One Advertising
Other Publicis Groupe agenciesFallon WorldwideKaplan Thaler GroupKlemtner AdvertisingMedicus Group InternationalNelson Communications WorldwideStarcom MediaVest WorldwideZenithOptimedia
COLOR CODES BY DISCPLINEGlobal NetworkTraditional agency Media specialistMulticultural specialist HealthcareDirect, promotion, & interactive
MAJOR NETWORKS, AGENCIES OFTOP FOUR MARKETING ORGANIZATIONSU.S.-BASED AGENCIES COLOR CODED BY DISCIPLINE
Not all agencies owned by the companies are shown. Agencies shown may be partly owned. A diagram illustrating owner-ship of agencies of the top 6 marketing organizations appeared as a pullout poster in the Agency Report (AA, April 19,
2004) and can be downloaded from AdAge.com QwikFIND aan55n. The diagram, presented as a family tree, includes rev-enue for agencies and media specialist companies, as well as ownership equity.

48 | Advertising Age | FactPack
TOP 25 MARKETING ORGANIZATIONSFrom the Agency Report (AA, April 19, 2004). Table ranks marketing organizations by their world-wide revenue in 2003. No. 2 WPP is expected to complete its acquisition of No. 7 Grey in the firstquarter of 2005. Dollars are in millions. The next edition of this Special Report will be publishedMay 2, 2005. *Figures are Ad Age estimates.
RANK MARKETING ORGANIZATION WORLDWIDE REVENUE % CHANGE
1 Omnicom Group $8,621.4 14.4
2 WPP Group 6,756.1 16.9
3 Interpublic Group of Cos. 5,863.4 -5.5
4 Publicis Groupe 4,408.9 7.3
5 Dentsu 2,545.0 11.0
6 Havas 1,877.5 -0.6
7 Grey Global Group 1,307.3 9.0
8 Hakuhodo DY Holdings* 1,208.1 NA9 Aegis Group 1,067.4 21.9
10 Asatsu-DK 413.9 16.8
11 Carlson Marketing Group 322.4 -1.9
12 Incepta Group 254.1 5.5
13 Monster Worldwide 241.5 -11.4
14 HealthSTAR Communications 233.0 29.4
15 Digitas 209.5 2.7
16 MDC Partners 193.7 12.8
17 Tokyu Agency 181.6 0.6
18 Cheil Communications 173.0 4.8
19 SBI Group 150.0 70.5
20 George P. Johnson Co. 150.0 0.5
21 Doner 137.0 12.8
22 Aspen Marketing Group 134.0 7.2
23 Alloy 128.0 26.5
24 Clemenger Communications 125.7 24.6
25 Select Communications* 120.0 9.1
To purchase a more comprehensive ranking, go to AdAge.com QwikFIND aap55f or CLICK HERE
AGENCY BUSINESS MARKET SHAREFrom the Agency Report (AA, April 19, 2004). Shares based on $20.54 billion worldwide revenuefrom core agency advertising and media activities. Disciplines such as direct marketing, sales pro-motion, healthcare, interactive, public relations, research and non-advertising units are excluded. Allfigures are Ad Age estimates for calendar 2003.
FIVE GROUPS DOMINATE GLOBAL ADVERTISING AND MEDIA
Interpublic Group of Cos.$3.75 billion; 18.3%
Omnicom Group$3.74 billion; 18.2%
Havas$1.14 billion
5.6%
Other$5.53 billion
25.9%
Publicis Groupe$3.39 billion; 16.5%
WPP Group$3.19 billion; 15.5%
To download this image, go to AdAge.com QwikFIND aap55o or CLICK HERE
FactPack | Advertising Age | 49

50 | Advertising Age | FactPack FactPack | Advertising Age | 51
TOP 25 U.S. AGENCY BRANDSFrom the Agency Report (AA, April 19, 2004). Table ranks core agencies by U.S. revenue in 2003(in millions). The agency “core” excludes revenue from billed media, and specialty subsidiaries.*Estimate. Parent company WPP is expected to complete its acquisition of Grey by the end of thefirst quarter of 2005.
RANK AGENCY BRAND U.S. REVENUE % CHANGE
1 JWT* (WPP) $456.2 15.9
2 Leo Burnett Worldwide* (Publicis) 404.2 6.6
3 McCann Erickson Worldwide* (Interpublic) 300.4 0.1
4 BBDO Worldwide* (Omnicom) 279.1 10.8
5 Grey Worldwide* (Grey) 270.5 14.5
6 DDB Worldwide Communications* (Omnicom) 252.3 6.9
7 Ogilvy & Mather Worldwide* (WPP) 235.6 17.7
8 Foote Cone & Belding Worldwide* (Interpublic) 221.6 0.6
9 Y&R* (WPP) 215.7 12.8
10 Publicis Worldwide* (Publicis) 200.9 12.2
11 Saatchi & Saatchi* (Publicis) 195.6 10.9
12 Euro RSCG Worldwide* (Havas) 194.1 1.4
13 Deutsch* (Interpublic) 167.2 5.7
14 Arnold Worldwide* (Havas) 150.2 -7.3
15 Campbell-Ewald* (Interpublic) 146.3 -3.3
16 Lowe Worldwide* (Interpublic) 133.8 -6.8
17 TBWA Worldwide* (Omnicom) 125.6 10.2
18 Doner 122.7 11.8
19 Richards Group 114.5 11.1
20 Hill, Holliday, Connors, Cosmopulos* (Interpublic) 102.6 1.6
21 Campbell Mithun* (Interpublic) 95.7 0.2
22 RPA 92.6 1.3
23 Dailey & Associates* (Interpublic) 89.2 -1.1
24 Zimmerman & Partners* (Omnicom) 85.6 6.5
25 Fallon Worldwide* (Publicis) 82.2 11.2
To purchase a more comprehensive ranking, go to AdAge.com QwikFIND aap55g or CLICK HERE
WORLD’S TOP 10 CORE AGENCY BRANDSFrom the Agency Report (AA, April 19, 2004). Table ranks ad agencies by estimated 2003 worldwiderevenue in millions. *Estimates exclude revenue from billed media and specialty subsidiaries.
RANK AGENCY WORLDWIDE REVENUE % CHANGE
1 Dentsu* $1,864.1 29.2
2 BBDO Worldwide* (Omnicom) 1,237.5 16.4
3 McCann Erickson Worldwide* (Interpublic) 1,220.1 3.7
4 JWT* (WPP) 1,178.5 18.2
5 Publicis Worldwide* (Publicis) 1,021.6 5.9
6 DDB Worldwide Communications* (Omnicom) 943.4 15.8
7 Leo Burnett Worldwide* (Publicis) 886.5 10.6
8 TBWA Worldwide* (Omnicom) 771.0 15.8
9 Euro RSCG Worldwide* (Havas) 756.1 3.1
10 Ogilvy & Mather Worldwide* (WPP) 706.3 19.8
To purchase a more comprehensive ranking, go to AdAge.com QwikFIND aap55n or CLICK HERE
WORLD’S TOP 10 INDIE NETWORKSFrom the Agency Report (AdAge.com, April 19, 2004). Table ranks worldwide independent agencynetworks. Dollars are in millions. Networks tend to have loosely affiliated structures with centralsecretariats. *ICP is estimated.
RANK INDEPENDENT NETWORK WORLDWIDE REVENUE % CHANGE
1 Worldwide Partners $556.0 22.8
2 ICOM (International Communications Agency Network) 363.0 19.8
3 AMIN (Advertising & Marketing Intl Network) 345.3 6.4
4 IN (Independent Network) 268.0 -5.0
5 MAGNET (Marketing & Advertising Global Network) 213.8 6.6
6 ComVort Group 137.0 NA7 BBN International Brand Communication 107.0 -0.9
8 TAAN (Transworld Advertising Agency Network) 101.0 2.1
9 Interpartners Communications 100.0 9.9
10 ICP* (Independent Creative Partners) 85.0 2.4
To purchase a more comprehensive ranking, go to AdAge.com QwikFIND AAP55L or CLICK HERE

52 | Advertising Age | FactPack FactPack | Advertising Age | 53
BY WORLDWIDE BILLINGSRANK MEDIA SPECIALIST COMPANY WORLDWIDE BILLINGS % CHANGE
1 OMD Worldwide $19.34 7.9
2 MindShare Worldwide 19.16 11.1
3 Starcom MediaVest Group 18.87 6.9
4 Carat 17.77 4.3
5 ZenithOptimedia 15.53 2.1
6 Universal McCann Worldwide 15.14 3.3
7 Mediaedge:cia Worldwide 14.63 8.8
8 MediaCom 13.56 7.2
9 Initiative Media Worldwide 12.55 -2.4
10 MPG 8.63 10.7
BY U.S. BILLINGSRANK MEDIA SPECIALIST COMPANY U.S. BILLINGS % CHANGE
1 MindShare Worldwide $9.40 8.7
2 OMD Worldwide 8.33 4.1
3 Starcom 7.51 3.1
4 Universal McCann Worldwide 7.40 4.2
5 Mediaedge:cia Worldwide 5.27 7.4
6 Initiative Media Worldwide 5.08 -11.7
7 MediaCom 5.00 7.0
8 Carat North America 4.72 4.1
9 MediaVest 4.36 11.7
10 Zenith Media 4.36 3.7
To purchase a more comprehensive ranking, go to AdAge.com QwikFIND aap55k or CLICK HERE
BY BILLINGS OUTSIDE THE U.S.RANK MEDIA SPECIALIST COMPANY BILLINGS OUTSIDE THE U.S. % CHANGE
1 Carat $13.05 4.4
2 OMD Worldwide 11.01 11.0
3 MindShare Worldwide 9.76 13.6
4 Mediaedge:cia Worldwide 9.36 9.7
5 ZenithOptimedia 8.75 1.1
6 MediaCom 8.56 7.4
7 Universal McCann Worldwide 7.75 2.6
8 Initiative Media Worldwide 7.47 5.1
9 Starcom MediaVest 7.01 0.8
10 MPG 5.78 16.8
PARENT COMPANIES OF MEDIA SPECIALISTSRANK COMPANY WORLDWIDE BILLINGS % CHANGE
1 Publicis Groupe $34.40 4.3
2 WPP Group 33.79 10.1
3 Interpublic Group of Cos. 29.39 0.6
4 Omnicom Group 24.26 7.3
5 Aegis Group 19.64 15.3
6 Grey Global Group 13.56 7.2
7 Havas 8.63 10.7
8 Horizon Media 0.99 9.4
9 Active International 0.86 14.0
10 R. J. Palmer 0.59 4.8
TOP MEDIA SPECIALIST COMPANIESFrom the Agency Report (AA, April 19, 2004). Tables rank media specialist companies by 2003billings in billions of dollars. Data are compiled by Recma Institute, Paris, which collects, analyzesand publishes intelligence on a worldwide basis on media specialist companies.

54 | Advertising Age | FactPack FactPack | Advertising Age | 55
TOP INTERACTIVE AGENCIESFrom the Marketing Services Rankings (AA, May 17, 2004). Tables on this page are rankings by2003 U.S. interactive revenue in thousands. *Indicates figures are Ad Age estimates. **aQuantivein July 2004 acquired SBI.Razorfish, creating a new agency brand called Avenue A/Razorfish.Leading marketing organizations (the top chart) do not break out revenue by agency, but they pro-vide discipline breakouts from which Ad Age estimates segments such as interactive.
FROM MARKETING ORGANIZATIONSRANK MARKETING ORGANIZATION U.S. INTERACTIVE REVENUE % CHANGE
1 Interpublic Group of Cos.* $129,000 2.1
2 WPP Group* 94,000 4.4
3 Havas* 89,000 2.8
4 Omnicom Group* 64,000 20.1
5 Grey Global Group* 55,000 1.9
FROM INDEPENDENT AGENCIESRANK AGENCY U.S. INTERACTIVE REVENUE % CHANGE
1 Digitas $84,000 17.5
2 SBI.Razorfish** 72,150 64.4
3 Modem Media* 49,000 -13.9
4 aQuantive (Avenue A)** 44,452 16.4
5 AKQA 36,000 20.0
6 Critical Mass* 34,000 6.3
7 TMP Worldwide 26,108 7.8
8 Carat Interactive 25,000 19.0
9 IconNicholson 24,000 14.3
10 IMC2 23,700 44.5
11 Macquarium Intelligent Communications 23,500 4.0
12 Planning Group International 22,000 36.6
13 Fry 21,000 0.0
14 Medical Broadcasting Co. 19,550 54.1
15 Blue Dingo 18,000 5.9To purchase a more comprehensive ranking, go to AdAge.com QwikFIND aap62i or CLICK HERE
TOP DIRECT MARKETING AGENCIESFrom the Marketing Services Rankings (AA, May 17, 2004). Tables are rankings by 2003 U.S. directmarketing revenue in thousands. *Indicates estimate. Leading marketing organizations (the topchart) do not break out revenue by agency, but they provide discipline breakouts from which AdAge estimates segments such as direct marketing. Thus two rankings are required for segmentoverview, the top by discipline representing multiple shops, and the lower by independent agencies.
FROM MARKETING ORGANIZATIONSRANK MARKETING ORGANIZATION U.S. DIRECT MARKETING REVENUE % CHANGE
1 WPP Group* $419,200 2.2
2 Omnicom Group* 376,000 6.2
3 Interpublic Group of Cos.* 335,000 0.1
4 Publicis Groupe* 161,500 0.4
5 Havas* 83,700 -3.7
FROM INDEPENDENT AGENCIESRANK AGENCY U.S. DIRECT MARKETING REVENUE % CHANGE
1 Digitas $125,500 -5.3
2 PGI 110,000 4.8
3 Aspen Marketing Services 99,000 8.8
4 ChoicePoint Precision Marketing 96,600 -8.7
5 SourceLink 90,000 0.0
6 TMP Worldwide 78,155 -6.0
7 Carlson Marketing Group 76,612 3.2
8 Protocol Direct Marketing 70,000 2.5
9 Merkle Direct Marketing 64,250 13.6
10 Harte-Hanks Direct 60,931 7.9
11 Data Marketing 57,000 11.8
12 Accent Marketing Services 45,830 40.0
13 Alloy 45,300 15.9
14 Ambrosi 42,000 16.7
15 MKTG Services* 40,000 2.6To purchase a more comprehensive ranking, go to AdAge.com QwikFIND aap62f or CLICK HERE

56 | Advertising Age | FactPack FactPack | Advertising Age | 57
TOP SALES PROMOTION AGENCIESFrom the Marketing Services Rankings (AA, May 17, 2004). Tables are rankings by 2003 U.S. salespromotion revenue in thousands. *Indicates estimate. Leading marketing organizations (the topchart) do not break out revenue by agency, but they provide discipline breakouts from which AdAge estimates segments such as sales promotion. Thus two rankings are required for segmentoverview, the top by discipline representing multiple shops, and the lower by independent agencies.
FROM MARKETING ORGANIZATIONSRANK MARKETING ORGANIZATION U.S. SALES PROMOTION REVENUE % CHANGE
1 Omnicom Group* $405,000 2.2
2 Interpublic Group of Cos.* 123,700 -11.7
3 Publicis Groupe* 75,500 -2.5
4 Havas* 70,000 -11.1
5 WPP Group* 57,000 6.5
FROM INDEPENDENT AGENCIESRANK AGENCY U.S. SALES PROMOTION REVENUE % CHANGE
1 Carlson Marketing Group $154,238 -11.4
2 George P. Johnson Co. 117,867 -2.1
3 SPAR Group 64,859 -6.8
4 AMP Agency (Alloy) 61,100 10.6
5 Equity Marketing* 40,203 9.0
6 DVC Worldwide 38,113 1.3
7 Flair Communications Agency* 36,800 -0.5
8 Ryan Partnership 35,537 -3.7
9 Marketing Store 35,416 1.2
10 Aspen Marketing Services 25,000 8.7
11 Gage 22,254 -38.8
12 Colangelo Synergy Marketing 20,196 9.2
13 Hawkeye Group 16,782 1.7
14 U.S. Motivation (TMP Worldwide) 13,520 2.7
15 CCM* 13,500 -10.0To purchase a more comprehensive ranking, go to AdAge.com QwikFIND aap62g or CLICK HERE
TOP HEALTHCARE AGENCIESFrom the Marketing Services Rankings (AA, May 17, 2004). Tables are rankings by 2003 U.S.healthcare revenue in thousands. *Indicates estimate. Leading marketing organizations (the topchart) do not break out revenue by agency, but they provide discipline breakouts from which AdAge estimates segments such as healthcare. Thus two rankings are required for segment overview,the top by discipline representing multiple shops, and the lower by independent agencies.
FROM MARKETING ORGANIZATIONSRANK MARKETING ORGANIZATION U.S. HEALTHCARE REVENUE % CHANGE
1 Interpublic Healthcare* $286,200 8.0
2 Publicis Healthcare* 274,600 6.0
3 WPP Healthcare* 272,800 9.0
4 Omnicom Healthcare* 220,500 7.5
5 Euro RSCG Life* 96,600 2.3
FROM INDEPENDENT AGENCIESRANK AGENCY U.S. HEALTHCARE REVENUE % CHANGE
1 Gerbig Snell/Weishemer $52,200 9.1
2 Abelson-Taylor 39,600 3.4
3 Medical Broadcasting Co. 27,900 7.8
4 Hal Lewis Group 18,200 1.5
5 Pacific Communications 17,700 -7.0
6 Dorland Global Health Communications 15,900 40.4
7 Vox Medica 15,900 -21.2
8 Palio Communications 15,500 37.1
9 Dudnyk Healthcare Group* 14,500 5.0
10 Donahoe Purohit Miller Advertising 13,800 -4.5
11 LehmanMillet 11,400 1.0
12 i-Frontier 9,700 31.6
13 Leverte Associates* 8,900 4.7
14 Strategic Medical Communications* 8,500 4.6
15 Natrel Communications 7,600 2.9To purchase a more comprehensive ranking, go to AdAge.com QwikFIND aap55i or CLICK HERE

58 | Advertising Age | FactPack
TOP MULTICULTURAL AGENCIESFrom the Agency Report (AA, April 19, 2004). Table ranks multicultural specialty agencies forcalendar 2003 by U.S. revenue. Dollars are in thousands. *Indicates figures are Ad Age estimates.GlobalHue is the largest overall multicultural specialist agency in the U.S. at an estimated $57 mil-lion in 2003—up 8.5% from $52.5 million in 2002—but GlobalHue could not be listed in thesesegmented tables because the agency does not break out its figures by cultural specialty.
BY REVENUE FROM MARKETING TO HISPANICSRANK AGENCY U.S. REVENUE % CHANGE
1 Bromley Communications* (Publicis) $32,937 10.0
2 Bravo Group* (WPP) 31,775 14.0
3 Dieste, Harmel & Partners* (Omnicom) 23,000 37.7
4 Zubi Advertising Services 16,400 10.1
5 La Agencia de Orci & Asociados 14,160 5.1
BY REVENUE FROM MARKETING TO AFRICAN-AMERICANSRANK AGENCY U.S. REVENUE % CHANGE
1 Burrell Communications Group* (Publicis) $26,072 5.0
2 Carol H. Williams Advertising 25,000 66.7
3 UniWorld Group (WPP) 20,148 -15.2
4 Anderson Communications 6,500 32.7
5 Fuse (WPP) 6,038 10.2
BY REVENUE FROM MARKETING TO ASIAN-AMERICANS RANK AGENCY U.S. REVENUE % CHANGE
1 A Partnership $9,712 12.4
2 Kang & Lee* (WPP) 7,660 17.0
3 PanCom 5,900 3.5
4 Time Advertising 5,693 -6.6
5 IW Group (Interpublic) 5,521 -12.0
To purchase a more comprehensive ranking, go to AdAge.com QwikFIND aap55j or CLICK HERE
Great movies give people a chanceto escape from everything...
except your messages, of course.
Blue Chips
Indecent Proposal
The Firm
Snake Eyes
K-2
True Colors
Beverly Hills Cop III
First Blood
Bob Roberts
Jimmy Hollywood
Addams Family Values
Wayne’s World 2
A Very Brady Christmas
White Christmas
Big Top Pee-Wee
Coneheads
Clear and Present Danger
Sliding Doors

Unlike other franchises, this one actually flies.
STAR TREK: ENTERPRISE
® & © 2005 Paramount Pictures.All rights reserved.