a study op socioeconomic factors which influence …
TRANSCRIPT

A STUDY OP SOCIOECONOMIC FACTORS WHICH INFLUENCE
RECYCLING PARTICIPATION IN TWO OREGON COMMUNITIES:
BEAV'ERTON AND CORVALLIS
by
GARY G. GUSTAFSON
A RESEARCH PAPER
submitted to
THE DEPARTMENT OF GEOGRAPHY
OREGON STATE UNIVERSITY
in partial fulfillment of
the requirements for the
degree of
MASTER OF ARTS
August 1973

ABSTRACT
Seven socioeconomic factors common to two Oregon
communities, Beaverton and Corvallis, were examined and
compared for the influences they might have on participa-
tion in recycling programs. Sampling technique involved
the use of a prepared survey questionnaire through which
the data necessary for the appropriate statistical method-
ology used in the study were collected. Findings revealed
significant differences between the two communities with
regard to probabilities in occupation, income per year,
age and level of education. No significant differences
were detected in probabilities for sex and marital status.
The personal philosophies for recycling in both communities
centered upon three primary reasonsz environmental concern,
stop unnecessary waste and conservation of natural resources.
Location analysis proved a correlation between distance of
home location to recycling center, and recycling partici-
pation. KEY WORDSz Socioeconomic factors, Recycling partici-
pation, Sampling technique, Survey questionnaire, Statistical
methodology.

TABLE OF CONTENTS
CHAPTER Page
I. Introduction . . . , . , 1
Statement of the Problem , . . . 2
PurposeoftheStudy ....,.. 1 3
Limitations of the Study . . . . . . . . 3
Research Hypotheses . . .. . . . . . . . . 5
II. Methodology and Procedure . . . . . . , . 7
DesignoftheStudy, ...... .. . 7
The Collection of Data , . . . . , 10
The Statistical Design . . . . . . . . . 11
III. Analysis of Data . , . . , . , . . . . 14
Sex . . . , . . . . , 14
Marital Status . . . . . . . . . . . . 15
Occupation . . . . . . . , . . . . . . . 16
Income Per Year . . . . . . . . . . . . 17
Age, Income, Education . . . . . . . . . 19
Personal Philosophy . . . . . . . . . . . 23
Location Analysis . . . . . . . . . . 25
IV. Summary and Conclusions . . . . . . . . . . . 29
S uminary . . . . . . . . . . , . . . . . 29
Conclusions . . . . . . . . . . . 31
Biblioaphy . . . . . . . . . . . . . , 36
Appendix A . . . , . . . . . . . . . . . . . . 38
Appendix B . . . . . . . . . . . . . . . . . . 39

LIST OF ILLUSTRATIONS
FIGURE Page
I. Occupational Categories . . . . . . . . . . . 18
II. Income Per Year Levels , , , , , 21
III. Levels of Education . . . , , 22
IV. Corvallis, Oregon
Recycling Participant Home Locations . . . . 27
V. Beaverton, Oregon
Recycling Participant Home Locations . . . . 28

A STUDY OF SOCIOECONOMIC FACTORS WHICH INFLUENCE
RECYCLING PARTICIPATION IN TWO OREGON COMMUNITIES:
BEAVERTON AND CORVALLIS
CHAPTER I
INTRODUCTION
American recycling programs have been in existence
in one form or another since the inception of this country.
Unfortunately, however, down through the years most U.S.
disposal practices have focused only on getting rid of
solid waste, Reuseability has been generally absent as an
objective. Only in the last ten years or so have large
scale public recycling programs been initiated. Until re-
cently, the idea that waste should be reclaimed was too
new to be widely received. Fortunately a new concept of
solid waste management involving widespread community re-
cycling programs is evolving. Public apathy, long one of
the main causes for today's crisis, has begun a gradual
transformation into public awareness. Evidence of this
trend in the state of Oregon appears through the establish-
ment of community recycling depots. Most of the larger
Oregon communities now have, or are in the process of adding,
2
at least one community recycling center. In the Portland
area alone there are now approximately 200 recycling depots.
Recycling has proven itself to be a feasible and utilitarian
solution to the problem of solid waste disposal in the United
States.
Statement of the Problem
The problem faced by this study has evolved from the
aforementioned trend of increasing public awareness of re-
cycling and the resultant increase in public recycling
participation. Several assumptions have been made with re-
gard to why people recycle, but not many studies have dealt
with the socioeconomic framework of a recycler and how
these factors might have affected his or her decision to
recycle. Specifically, this study is concerned with socio-
economic factors that are common to recycling participants
in two Oregon communities (Beaverton and Corvallis). These
same socioeconomic factors could be applied in communities
of any other section of the country.
This study was conceived and developed in order that
more information could be obtained about which types of
people recycle, which socioeconomic factors might have in-
fluenced their decision to recycle, and why they themselves
thought they recycled. In addition, the study was planned
so that recycling participants from two separate population

bases, belonging to two separate communities, could be
analyzed and compared.
Purpose of the Study
The general purpose of the study is to determine some
of the socioeconomic factors that influence recycling parti-
cipation in two Oregon communities. More specifically, the
purposes of this study are: 1) to determine which socioeconomic
factors may have been instrumental in affecting recycling
participation; 2) to compare and contrast the extent to
which these socioeconomic factors affect recycling partici-
pation in Beaverton and Corvallis; 3) to survey the reasons
why recycling participants think they recycle, and to com-
pare and contrast these reasons for Beaverton and Corvallis;
and 'i) to plot spatially the home locations of a random sample
of recyclers from each community so as to determine the geo-
graphic size and degree of attraction that each recycling
center asserts on its population base.
Limitations of the Study
The study was limited to a random sample of 200 recycl-
ing participants, 100 from each community, who filled out
a survey questionaire (Appendix A) at either the Beaverton
or Corvallis recycling center during the time period of

Ivlarch 1, 1973 to June 15, 1973. The study proceeded upon
the assumptions that the sample size, questionnaire format,
sampling technique, and statistical methods utilized were
appropriate for collection and analysis of the desired
data.
The study was limited by the fact that no pretest
was administered. The omission of a pretest allowed for
an important flaw in the questionnaire to escape undetect-
ed. This flaw was in the wording of question number six,
asking for the participant to check one of four categor-
ies under the heading income per year. The wording of the
question created considerable misinterpretation. Many of
the participants took the question to mean personal income
per year, while many others assumed that it referred to
family income per year. The effect of this error upon
the study is undetermined.
The study was further limited by the lack of homo-
geneity between the two recycling centers. The Beaverton
recycling center accepts newspaper, while the Corvallis
recycling center does not. However, the Corvallis recycl-
ing center accepts tin and other metals, while the Beaver-
ton recycling center does not. Certainly these facts have
affected recycling participation at both recycling centers.
Again, the extent to which these facts have affected the study
has not been determined. Finally, it is always possible

5
that some uncontrolled variables could have affected the
responses of the recycling participants.
Research Hypotheses
In order to facilitate the statistical treatment of
the data, the following research hypotheses were formul-
ated in null form:
1. There will be no significant difference between
the marital status of recycling participants in
Beaver-ton and those in Corvallis.
2. There will be no significant difference between
the sex of recycling participants in Beaverton
and those in Corvallis.
3. There will be no significant difference between
occupations of recycling participants in Beaver-
ton and those in Corvallis.
4, There will be no significant difference between
the income per year of recycling participants in
Beaverton and those in Corvallis.
5. There will be no significant difference between
the mean Beaverton income per year and the mean
Corvallis income per year of recycling participants.
6. There will be no significant difference between
the mean Beaver-ton age and the mean Corvallis age
of recycling participants.

7. There will be no significant difference between
the mean Beaverton level of education and the
mean Corvallis level of education of recycling
participants.

CHAPTER II
)LOGY AND PROCEDURE
gn of the Study
us study as outlined in Chapter I
nt to which certain socioeconomic
factors influence participation in recycling in the two
selected Oregon communities, Beaverton and Corvallis. The
data for the study were gathered by means of a prepared
questionnaire. The survey instrument contained eight ques-
tion items. The following socioeconomic factors were useds
age, sex, marital status, occupation, level of education,
income per year and address. These seven socioeconomic
factors were selected due to their simplicity, conformity,
and universality. In addition, one personal philosophical
question was included, which asked participants why they
recycle. The entire questionnaire format was designed to
be primarily expeditious, clear, and simplistic.
Preliminary steps in the design and development of
the questionnaire involved a review of the literature re-
lated to recycling. Other literature, such as directives
in social research, sampling techniques, and statistical
methods, provided supplementary information.
7
The questionnaire is included in Appendix A. The listed
groupings found in questions six and seven, dealing with

3
income per year and level of education, were selected
arbitrarily. The responses to question five, dealing with
occupation, were placed for data analysis in one of ten
categories. These ten categories were formalized by the
author as a modification of the ten occupational categor-
ies, divisions and groups, found in the 1965 Dictionary of
Occupational Titles (Appendix B). The author condensed five
of their categories and added five new categories, which
pertained to the study. The five new categories were:
student, retired, unemployed, homemaker and no response.
The sample size used in this study was 100 recycling
participants per community (N=100), or a total sample of
200 participants for both Beaverton and Corvallis. This
sample size mirrored several considerations.
1. A minimum sample size of 100 should be obtained
before any mean or proportion can be considered
to have a sufficiently normal distribution.
2. There was a degree of uncertainty concerning
the heterogeneity of both populations, necessit-
ating at least a N=100 sample size from both commun-
ities to properly reflect their populations.
3, The ease of data analysis using a N=100 sample
size was a consideration,
L, The limitations on time and travel expenses ex-
perienced by the sampler was a consideration.
The size of the population bases from which the two

recycling centers had drawn was a major consideration. The
following 1971 census figures were taken from the Estimates
of Incorporated Cities, prepared by the Center for Popula-
tion Research and Census, Portland State University, July 1,
1973:
Beaverton 19,580 people
Corvallis 36,850 people
However, these estimates are somewhat illusionary.
Beaverton is one of the fastest growing communities in
Oregon and receives a considerable population influx each
year. In addition, Beaverton has the proximity of populous
southwest Portland on its eastern fringe, an area from
which came a full 31 percent of the total surveyed partici-
pants at the Beaverton recycling center. Corvallis, mean-
while, has a somewhat transitory population, based to a
large extent on whether or not Oregon State University
is in session. After the previously mentioned factors were
taken into consideration, the population bases from which
the two recycling centers had drawn was not so dissimilar.
Another reason for the selection of Beaverton and Cor-
vallis was that the author, after having lived in both of
the communities, had accumulated a limited knowledge per-
taining to the geography of each location. Ease in data
collection with particular regard to travel time was another
important criteria in community selection.
Both Beaverton and Corvallis possess well established,

10
efficient recycling centers, which experience heavy and
continuous useage. The Beaverton recycling center, oper-
ated by Beaverton Recycling Corporation, is located at
Lombard and Broadway streets, and will handle all properly
prepared glass, newspaper, aluminum, cardboard and Kraft
paper. The Corvallis recycling center, operated by Eco-
Alliance Recycling, is located at 26th and Monroe streets,
and will handle all properly prepared glass, aluminum, tin
and other metals, cardboard and Kraft paper.
The Collection of Data
Data for the study were personally collected at each
recycling center through the use of the survey question-
naire (Appendix A). Data were collected as impartially and
unequivocally as was deemed feasible. All questionnaires
were personally distributed to the participants immediately
upon their arrival at the recycling center. The data collec-
tor initiated only the conversation appropriate for the intro-
duction of the questionnaire to the participant. The question-
naires were collected as soon as they had been completed.
The average amount of time taken by a participant to fill
out a questionnaire was approximately two to three minutes.
All participants who were contacted agreed to fill out the
questionnaire, although several participants declined to
answer one or more of the questions.

11
The collection of data at both recycling centers was
undertaken during the time period of March 1, 1973 to June 15,
1973. The questionnaires were distributed and collected at
random times, irrespective of hour or day. Variation in
time of data collection was necessary so as to avoid any
collections from the same population spectrum of partici-
pants, who might favor a particular day, or time of day,
for their recycling activity.
Certain time periods in certain days were observed to
receive significantly heavier useage than other time periods.
Weekends normally generated the heaviest recycling partici-
pational response. Particularly heavy participation time
periods were recorded for each recycling center. They were:
a) Beaverton: Saturday 9AM to 12 noon and 3PM to 6PM, Sunday
9AM to 2PM; b) Corvallis: Friday 3PM to 7PM, Saturday 9AM
to 12 noon and 3PM to 6PM.
The Statistical Design
The facilities and resources of the Oregon State Univer-
sity Computer Center were utilized in compiling the numer-
ical data collected through the questionnaire. In order to
statistically test the hypotheses, two tests were utilized:
a) Chi-square test; and b) Hotelling's T-square test.
1. Chi-square test
This test was used in the analysis of data for sex,
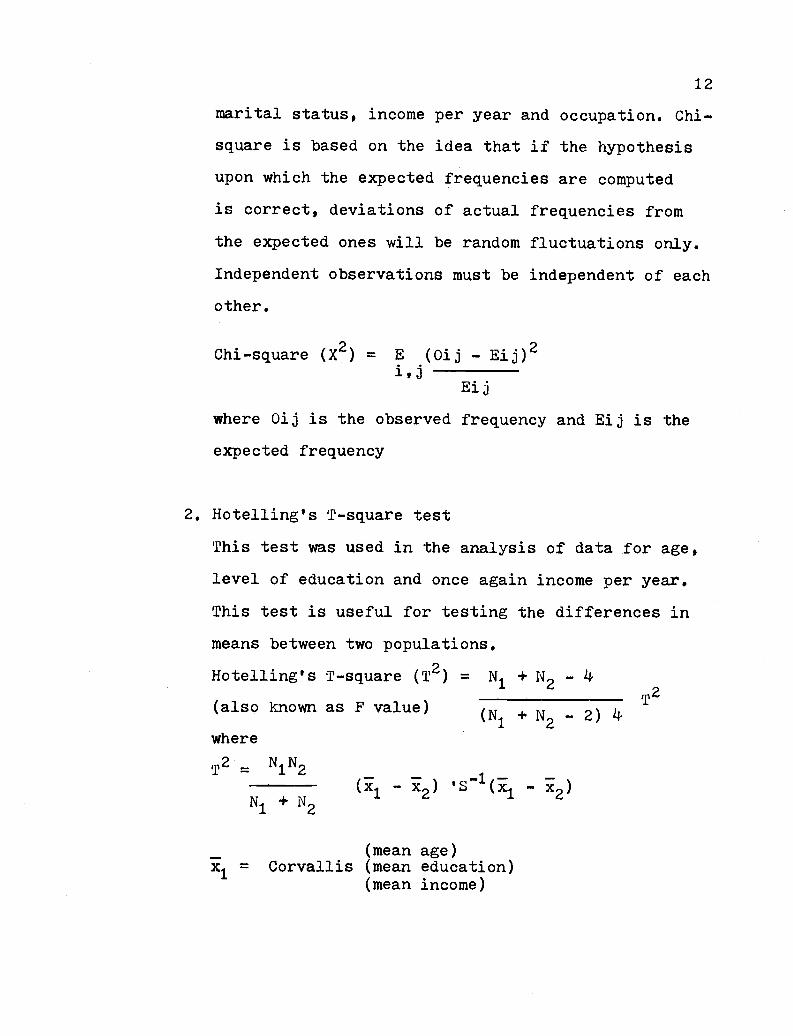
12
marital status, income per year and occupation. Chi-
square is based on the idea that if the hypothesis
upon which the expected frequencies are computed
is correct, deviations of actual frequencies from
the expected ones will be random fluctuations only.
Independent observations must be independent of each
other.
Chi-square (X2) = E (Oij - Eij)21,3
El j
where Oij is the observed frequency and E!j is the
expected frequency
2. Hotelling's T-square test
This test was used in the analysis of data for age,
level of education and once again income per year.
This test is useful for testing the differences in
means between two populations.
Hotelling's T-square (T2) = N1 + N2 -
(also known as F value)(N + N2 - 2) 4
where
T2 N1N2
X2) 's1(E X2)N1 + N2
(mean age)x = Corvallis (mean education)
(mean income)
T2

(mean age)x2 = Beaverton (mean education)
(mean income)
N1 = total sample size for Corvallis (100)
N2 = total sample size for Beaverton (100)
1
N1 + N2 - 2(N1S1 + N2s2)
13
= Corvallis
frvarience age) (coy age, income) (coy age, edu.)' (coy age, income)(var income) (coy income, edu.Jcov age, edu.) (coy income, edu,)(var education) J
S2 = Beaverton
Kvarience age) (coy age, income) (coy age, edu.) 1f (coy age, income)(var income) (coy income, edu.,jcov age, edu.) (coy income, edu.)(var education) J
Differences in confidence intervals for age, income
and education were calculated using:
a' (x1 - x2) V'Sa N1 + N2
N1N2
where
age
Income
education
a = (100)
a = (010)
a = (001)
p - 1
In order to obtain results with a high degree of accur-
acy, significance levels of both .05 and .01 were tested on
all data.

14
CHAPTEk III
ANALYSIS OF DATA
This chapter is divided into seven main sections. The
first four sections involve data analysis of sex, marital
status, occupation and income per year, based upon the
Chi-square test. Age, level of education and income per
year are considered together in section five, as necessi-
tated by the utilization of F[otellirtg's T-square test. Income
per year was tested by both Chi-square and i-Iotelling's 2-
square tests because assumptions of normality for Corvallis
and Beaverton income distributions were based upon only
four possible responses, so that the approximation of con-
tinuity could be imprecise. Section six on personal philosophy
is an analysis of the answers to questionnaire question number
eight (Appendix A). Section seven is a presentation of re-
cycling participation location analysis for each community,
aided by visual interpretation in the forms of two maps
(Figure 4 and Figure 5).
Sex
Null Hypothesis (H0) : Probability of a male in Corvallis =
probability of a male in Beaverton.

15
Female
Male
Total
Corv. Beav. Total
44 35 79
56 65 121
100 100 200
H0 s Oij = Eij for all i,j where
Oij is the observed frequency and
Eij is the expected frequency
x2= 1.68
Since 1.68 is less than X .05 = 5,99 and less than X .01 =
9.21, the H0 that there is no difference in the probabilities
is not rejected,
Marital Status
H0 : Probability of being single in Corvallis = probability
of being single in Beaverton,
Single
Married
Total
Corv. Beav. Total
32 16 48
68 81 149
100 97 197

16
(Note: Three participants failed to answer this question.)
H0 : Oij = EIj for all i,j where
Oij is the observed frequency and
Eij is the expected frequency
x = 6,30
Since 6.30 is less than X .01 = 9.21, and but slightly
greater -than X .05 = 5.99, it can be considered an insignif-
icant difference, thus, the H0 is not rejected at the .01
significance level.
Occupation
H0 Probability of being in a given occupational category
(1-10) in Corvallis = probability of being in a given
occupational category (1-10) in l3eaverton.
1
Occupation2
Code3
14.
Corv. Beav. Total
23 30 53
8 19 27
3 10 13
3 1 L.
6 8 114.
(continued)

17
0
7Occupation
Code 8
9
10
Total
Corv, Beav. Total
30 5 35
6 6 12
1 6
16 iL 30
0 6 6
100 100 200
(Refer to Figure 1 for Occupation Code a 1-10)
H0 a Oij = Eij for all i,j where
Oij is the observed frequency and
Eij is the expected frequency
X = 37.05
Since 37,05 is greater than X0 .05 = 18.31 and greater than
X .01 = 23.21, the H0 that there is no difference in the
probabilities is rejected.
Income Per Year
a Probability of being in a given income category (a-d)
in Corvallis = probability of being in a given income
category (a-d) in Beaverton.

50
00II
z
rl
0El
300
bOcd4,
a)
20a)
10
Corvallis
Beaverton
Occupation Code
1 Professional, Technical,Managerial
2 Clerical and Sales
3 Service
Lj Farming, Fishery, Forestry,and related
5 Processing, Machine Trades,Bench Work, Structural, andrelated
6 Student
7 Retired
8 Unemployed
9 Homemaker
10 No Response
1 2 3 5 6 7
Occupation Code
Figure 1 Occupational Categories
8 9 10
O:i

a.
b.
Income
Code c.
d.
Total
Corv. Beav. Total
37 14 51
24 13 37
20 30 50
9 35 44
90 92 182
19
(Note* 18 participants failed to answer this question)
(Refer to Figure 2 for Income Code)
H0 a Oij = Eij where
Oij is the observed frequency and
Eij is the expected frequency
X = 30.90
Since 30.90 is greater than X .05 = 9.49, and also greater
than .01 = 13.28, the l-E that there is no difference in
the probabilities rejected.
Age, Incomes Education
Age, income per year, and level of education were
tested together for differences in mean values, using
Hotelling's T2 test. After computation of the T2 and F
values, each factor (age, income, education) was then
tested individually for differences in confidence inter-
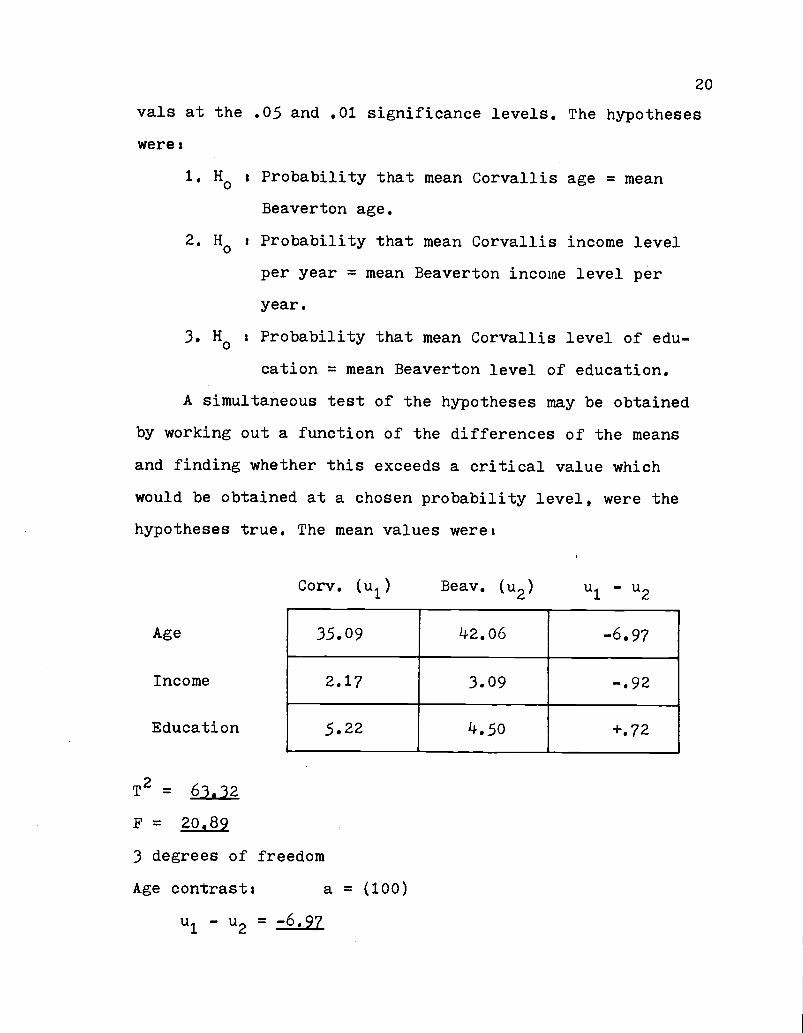
20
vals at the .05 and .01 significance levels. The hypotheses
were t
1. H0 : Probability that mean Corvallis age = mean
Beaverton age.
2. H0 Probability that mean Corvallis income level
per year = mean Beaverton income level per
year.
Probability that mean Corvallis level of edu-
cation = mean Beaverton level of education.
A simultaneous test of the hypotheses may be obtained
by working out a function of the differences of the means
and finding whether this exceeds a critical value which
would be obtained at a chosen probability level, were the
hypotheses true. The mean values were
Age
Income
Education
Corv. (u1) Beav. (u2) u1 - u2
35.09 L2.06 -6,97
2.17 3.09 -.92
5.22 k.5o +72
T2 = 63.32
F = 20,89
3 degrees of freedom
Age contrasts a = (100)
u1 - u2 = -6.97

00'-I
Uz
r4
+'0
Cf 4
0
0
4-)
0C)
5.4
0
20
10
a. b. c. d.
Income Level Per Year
Figure 2 Income Per Year Levels
Income Per Year
a. less than $ii.,999
b. 45,O00 to $9,999
c. $10,000 to $1L.,999
d. more than $15,000
riCorvallis
Beaverton
1-s)

00'-I
II
z
'-4
Cd
4.)
0El
CH0
bDCd4.)
0
a)
50
40
30
20
1.0
Level of Education
a, 8th grade or less
b. some high school
c. completed high school
d. some college
e, completed college
f. post-graduate work
a. b. c. d. e. f
Level Of Education
Figure 3 Levels of Education
[1 Corvallis
Beaverton
r)t)

23
Since .05 = -12.80 -6.97 1.114 and
.01 = -13.99 -6,97 +.05
The H0 is rejected, there are significant differences.
Income contrast: a = (010)
U1 - U2 = -.92
Since .05 = -1,28 -.92 -.36 and
.01 = -1.37 -.92 -.27
The H0 is rejected, there are significant differences.
Education contrast: a = (001)
U1 - U2 =
Since .05 = +,23 +,72 +1.21 and
.01 = +.17 +,72 +1.76
The H0 is rejected, there are significant differences.
Personal PhilosoDhy
The findings presented in this section are the analyzed
results to question number eight of the survey questionnaire
This question asked why the participant recycled. Analysis
of these data consisted of grouping all the responses
which followed a mutual theme into separate groups, after
which the number of responses in each group were totaled
and recorded. Many of the participants listed more than
one reason for recycling, so each reason was individually

2k
grouped arid recorded. Three main groups soon established them-
selves during the analysis of data. A majority of partici-
pants in both Beaverton and Corvallis listed environmental
concern, stop unnecessary waste, conservation of natural
resources or a combination of these groups in their re-
sponses. The groupings and number of responses recorded
for each group in both communities are as follows:
Beaverton:
environmental concern (29)
stop unnecessary waste (25)
conservation of natural resources (20)
save money (10)
no response (8)
get rid of unwanted items (7)
the need (k)
another person's idea (3)
convenience (2)
community project (1)
inadequate local garbage collection (1)
health reasons (1)
global economics (1)
to make terrariums (1)
don't know (1)
Corvallis:
conservation of natural resources (33)
environmental concern (32)
25
stop unnecessary waste (30)
conscience (7)
get rid of unwanted items (6)
save money (3)
the need (3)
no response (2)
community cooperation (2)
tired of noisy garbage truck in AM (1)
habit (1)
encourage others by example (1)
convenience (1)
save space at home (1)
advancement of society (1)
another person's idea (1)
logical idea (1)
help future generations (1)
Location Analysis
As previously discussed in Chapter II, each recycling
center draws from a specified population base. This section
is devoted to the spatial distribution, or location analysis,
of each population base. Data were compiled from survey
questionnaire question number one, asking for the address
(number, street, city) of the participant. A total of 97
Beaverton and 95 Corvallis recycling participants answered

26
the question. The number of participants living in different
cities who utilized each recycling center, were as follows:
Beaverton Recycling Center:
Beaverton (56)
Portland (34)
Hilisboro (3)
Aloha (2)
Forest Grove (1)
Tigard (1)
Corvallis Recycling Center:
Corvallis (89)
Albany (3)
Philomath (2)
Newport (1)
The locational data were then analyzed further so as
to plot, where possible, the individual home location of
each participant. The data were taken to the City of Beaver-
ton offices (4950 S.W. Hall Blvd.), and City of Corvallis
offices (501 S.W. Madison), where exact address locations
for the data were pinpointed on respective maps in each
tax assessor's office. Data were then transferred and plotted
on appropriate base maps. The results of this effort may be
viewed on Figures 4 and 5.

z 0ZE-
0.i
ciO
c'o
0
E-4
o 00 F
-i
-H
H 0 0
'-
\'t-
2N if
-I
\"&,OW.
a)-4
P1
C)
.c: 0
Cl,
L-&'
N
0o
0-H
Lt\
4) o
-i
0 HC)
-i
a)
4-)
a)H
00 Cl,
C.) o
4) p-I
-1 H 0 >
H 0 -H +
o a)S-i
(j
1r
NW
,rr'
JLM
NIN
LIY
ES
7U]J
MW
OO
o4\Jkb:
LO
w00
%
F\
1jg0
'-i.
000
DR
.
1
H
IN
W H
AM
MO
ND
SY
CA
MO
RI
-I
ETJ p..
NW
.
AN
C
ILD
IVI.I
ON
P1.
./
i1rh
r1T
.RT
AV
L// /
fl!L
a
1L1L!
rric. LUE
LLL1
TN.IrnL
Y'
NL
!"N-J S
.I.
IA
ri
LLW
JLU
IPI A
VE
7-_
--L!
,j/ HS. W. HIU.IOP
c\czI]
/1
15W LVI. COV*W.
-'iii L1,ui1
CO
Ul)ç
CA
CA
DI1
-
LLJ I
'I L? LJU L L
NC
rri
n
U In 1
r
.-
Oii., /
-/
so.
-p
WY
Af4
_20
34M
P.S
40S
. HW
Y W
FIT
u.
LW.
rN.w
.IP
ON
OC
RO
SA
I 0 z
NI.
CO
TT
O
NE
-II
NC
.
I
I!
If
7SW.
/'
S.W
b3iY
AvC
;I)
CR
YS
TA
L
j!A;4
-5.
1.V
IEW
MO
NT
AV
I.,I
TN
WQ
N A
VE
.
L.1
. RlC
'A
VE
.S
.C.
IC L
0..
AV
E.
0
0$.
. MA
RIN
AV
E.
IS
.C.
IEL1
. AW
LII
Li/S
.C.
PA
RK
L. A
YE
.I
::'.
WA
KE
RO
BIN
AV
LC
OIII
GH
TLY
E"1
H.P
.
AV
E.
ID A
VE
.
°ri
M

Figure 5 BEAVERTON, OREGONsurveyed by randomRECYCLING PARTICIPANT HOME LOCATIONS 'L.I Jj sample, March 1, 1973- -
to June 15, 1973-. -- iI i\-______
[ Re cycling centerI
1'r ii - 0 Participant home
_ __Scale:
1:1500
---c
__________ -1
LL.....J
:1!. 1 Tt
_____ __'N / i ___ ____ J -
-II _____
- -
,-
:if 1L.. - L--
H- /
C
T1I1!
--
F
Tr
lNIII
29
CHAPTER IV
SUMIVIARY AND CONCLUSIONS
This chapter consists of two sections. In the first
section, the purpose, problem, procedures and findings
based upon data analyzed in Chapter III are reviewed. The
second section presents the conclusions which were based
upon the findings.
Summary
The purpose of this study was to ascertain and com-
pare socioeconomic factors influencing recycling partici-
pation in two selected Oregon communities. The study was
formulated so that additional information would be avail-
able dealing with which types of people recycle, what
factors might have affected their decision to recycle,
and why they themselves thought they recycled. The study
provided an opportunity for comparison of data by selecting
two geographically distinct population bases for the study
areas. Data were collected by utilization of a prepared
questionnaire administered at each recycling center. The
sample size consisted of 100 recycling participants from
each community, or 200 total recycling participants. The
socioeconomic factors analyzed were: sex, marital status, occu-
pation, income per year, level of education, age and address.

I
30
Hypotheses were formulated and then tested statistically
by utilization of either Chi-square or Hotelling's T-square
tests. In addition, the personal recycling philosophies
of the participants in the two communities were analyzed
and compared. The following findings were based upon the
analysis of the statistical data gathered:
Hypothesis 1: The probability of a male recycling
participant in Corvallis is equal to the probability
of a male recycling participant in Beaverton.
There were no significant differences in the probabil-
ities tested. Therefore, the first null hypothesis was
accepted.
Hypothesis 2: The probability of a Corvallis recycl-
ing participant having single marital status is equal
to the probability of a Beaverton recycling partici-
pant having single marital status.
There were slight differences in the probabilities
tested at the .05 significance level and no differences
at the .01 significance level. Therefore, the second hypoth-
esis was accepted at the .01 significance level.
Hypothesis 3: The probability of a Corvallis recycling
participant being in a given occupational category is
equal to the probability of a Beaverton recycling
participant being in a given occupational category.
There were significant differences in the probabilities

31
tested. Therefore, the third null hypothesis was rejected.
Hypothesis k: The probability of a Corvallis recycl-
ing participant being in a given income category is
equal to the probability of a Beaverton recycling
participant being in a given income category.
There were significant differences in the probabilities
tested. Therefore, the fourth null hypothesis was rejected.
Hypothesis 5: The Corvallis recycling participant
mean income per year level is equal to the Beaverton
recycling participant mean income per year level.
There were significant differences in the probabilities
tested. Therefore, the fifth null hypothesis was rejected.
Hypothesis 6: The Corvallis recycling participant
mean age is equal to the Beaverton recycling partici-
pant mean age.
There were significant differences in the probabilities
tested, Therefore, the sixth null hypothesis was rejected.
Hypothesis 7: The Corvallis recycling participant
mean level of education is equal to the Beaverton re-
cycling participant mean level of education.
There were significant differences in the probabilities
tested, Therefore, the seventh null hypothesis was rejected.
Conclusions
om the findings of this study the following conclu-

32
sions were drawn about the surveyed populations of re-
cyclers from Beaverton and Corvallis.
1. It can be concluded that there are no significant
differences between the sex of recyclers in Beaver-.
ton and Corvallis.
The study also disclosed a slight tendency for the
average recycler to be a male. Beaverton participants were
65 percent male, while those of Corvallis were 56 percent
male, or a combined average of 60.5 percent male recyclers.
2. It can be concluded that there are no significant
differences between the marital status of recyclers
in Beaverton and Corvallis.
The study also disclosed a tendency for the average
recycler to be married. Beaverton participants were 81 per-
cent married, while those of Corvallis were 68 percent married,
or a combined average of 7L1..5 percent married recyclers.
3. It can be concluded that there are significant
differences between the occupational bases of re-
cyclers in Beaverton and Corvallis.
Beaverton participants exhibited a proclivity towards
four occupational categories. Heading the list were the parti-
cipants in category 1 (Professional, Technical and Manager-
ial), with 30 percent of the total. Category 1 was followed
by category 2 (Clerical and Sales) 19 percent, category 9
(Homemaker) 14 percent, and category 3 (Service) 10 percent.

33
Corvallis participants exhibited a somewhat different
occupational listing. Category 6 (Student) with 30 per-
cent led the list. Other categories of importance in
Corvallis were category 1 with 23 percent and category 9
with 16 percent. At this particular stage in time, partici-
pants in Beaverton proved -to be considerably more business
oriented than the student- and homemaker-dominated Cor-
vallis occupational listing.
4. It can be concluded that there are significant
differences in the income per year levels of re-
cyclers in Beaverton and Corvallis.
Income per year provided one of the most significant
differences between the two communities studied. The great-
est number of Beaverton participants (35 percent) fell into
level d. (more than $15,000). On the other hand, the great-
est number of Corvallis participants (37 percent) fell into
level a. (less than $4,999). Generally speaking, Beaverton
recyclers make more money per year than Corvallis recyclers.
5. It can be concluded that there are significant
differences between the Corvallis recycling partici-
pant mean income per year and the Beaverton recycl-
ing participant mean income per year.
As discussed above, this further testing proved that
Beaverton recycling participants make more money per year
than their counterparts in Corvallis.

34
6. It can be concluded that there are significant
differences between the Corvallis recycling partici-
pant mean age and the Beaverton recycling partici-
pant mean age.
Beaverton participants proved to be somewhat older
when compared with recyclers in Corvallis. The Beaverton
mean age was 42.06 years, while that of Corvallis was 35.09
years, or a difference in mean ages of almost 7 years.
7. It can be concluded that there are significant
differences between the Corvallis recycling partici-
pant mean level of education and the Beaverton
recycling participant mean level of education.
The study showed that Corvallis participants tended
to be somewhat better educated than those in Beaverton.
The majority of the Beaverton participants (55 percent)
fell either in level 4 (some college) or in level 5 (com-
pleted college). The greatest number of the Corvallis re-
cyclers (46 percent) fell into level 6 (post-graduate
work). However, these figures are disproportioned somewhat
by the location in Corvallis of Oregon State University.
8. It can be concluded that recycling participants
in both communities felt that they recycled for
much the same reasons.
Both Beaverton and Corvallis participants listed
primarily three reasons in response to the question ask-
ing why they recycled. The three reasons were environ-

35
mental concern (61 responses), stop unnecessary waste
(55 responses) and conservation of natural resources (53
responses). The reasons with the next highest response
totals, with just 13 each, were save money and get rid of
unwanted items.
9. It can be concluded that the degree of recycling
participation is in direct proportion to the dist-
ance the recycler lives from the recycling center.
Spatial analysis of data from question one proved, as
expected, that the number of recyclers using each center
diminished as the distance from home location to recycling
center became greater. Visual interpretation of Figure 14.
and Figure 5 confirms that the majority of the recycling
participants live within a three mile radius of the recycl-
ing center.

36
BIBLIOGRAPHY
Blalock, Hubert I1. and Anne B. Blalock. 1968. Methodology
in social research. New York, McGraw-Hill. 11.78 p.
Chase, Clinton I, 1967. Elementary statistical procedures.
New York, I1cGraw-Hill. 21.1 p.
Clark, Thomas D. 1971. Economic realities of reclaiming
natural resources in solid waste. Cincinnati, Environ-
mental Protection Agency Office of Solid Waste Manage-
ment Programs. 12 p.
Cochran, William G. 1967. Sampling techniques. 2d ed. New
York, Wiley. 1113 p.
Moroney, M,J. 1965. Facts from figures. London, Cox and
Wyman. 11.69 p.
National Association of Counties Research Foundation. 1970.
Community action program for solid waste management.
Washington, D.C., U.S. Government Printing Office. 182 p.
Office of Science and Technology. 1969. Solid waste manage-
mentz a comprehensive assessment of solid waste problems,
practices, and needs. Washington, D.C., U.S. Govern-
ment Printing Office. 122 p.
Meyers, Clay. 1973. Oregon blue book: 1973-1974. Portland,
Meyers,

37
Oregon Recycling Information and Organizing Network. 1972.
Recycling handbook. Portland, Oregon Environmental
Council. 15 p.
U.S. Department of Labor. 1965. Dictionary of occupational
titles. vol. II. 3d ed. Washington, D.C., U.S. Govern-
ment Printing Office.

APPENDI ES

APPENDIX A
Survey Questionnaire
RECYCLING PARTICIPATION SURVEY
This survey is being conducted as part of a research
project by a graduate student of geography at Oregon Stae
University. The purpose is to survey socioeconomic factors
determining recycling participation in two Oregon communities
(Beaverton and Corvallis), and to measure their relative import-
ance. Your cooperation will be appreciated, and all responses
will remain anonymous.
1. Your address (number, street, city):
2. Sex: M F
k. Marital status:
5. Occupation (be specific):
6. Income per year:a. less than $14.,999b. $5,000 to $9,999c. $10,000 to $14.,999d. more than $15,000
3. Age:
7. Leveia.b.C.
d.
e.f.
L of education:8th grade or lesssome high schoolcompleted high schoolsome collegecompleted collegepost-graduate work
8. Personally speaking, why do you recycle?

39
APPENDIX B
Occupational Categories
(Modified from 1965 Dictionary of Occupational Titles)
1. Professional, Technical and Managerial occupations
2. Clerical and Sales occupations
3. Service occupations
i.1 Farming, Fishery, Forestry and related occupations
5. Processing, Machine Trades, Bench Work, Structural
Work and related occupations
6. Student
7. Retired
8. Unemployed
9. Homemaker
10. No response
1. Professional, Technical and Managerial Occupations
Occupations in:
architecture and engineeringmathematics and physical scienceslife sciencessocial sciencesmedicine and healtheducationmuseum, library and archival scienceslaw and jurisprudencereligion and theologywritingartentertainment and recreationadministrative speciali zationsmanagers and of ficalsmiscellaneous professional, technical and managerial

LO
2. Clerical and Sales Occupations
Occupations in:
stenography, typing and relatedcomputing and account-recordingmaterial and production recordinginformation and message distributionmiscellaneous clericalsalesman, servicessalesmen and salespersons, commoditiesmerchandising occupations, except salesmen
3. Service Occupations
Occupations in:
domestic servicefood and beverage preparationlodging and related servicesbarbering, cosmetology and related servicesamusement and recreationmiscellaneous personal servicesapparel and furnishings serviceprotective servicesbuilding and related services
li. Farming, Fishery, Forestry and Related Occupations
Occupations in:
plant farminganimal farmingmiscellaneous farmingfishery and relatedfores tryhunting, trapping and relatedagricultural services
5. Processing, Machine Trades, Bench Work, Structural
and Related Occupations
Occupations in:

LI.1
processing of metalore refining and foundryprocessing of food, tobacco and related productsprocessing of paper and related productsprocessing of petroleum, coal, natural and manu-
factured gas and related productsprocessing of chemicals, plastics, synthetics,
rubber, paint and related productsprocessing of wood and wood productsprocessing of stone, clay, glass and related
productsprocessing of leather, textiles, and related
productsmetal machiningmetalworkingmechanics and machinery repairmenpaperworking occupationsprintingwood machiningmachining stone, clay, glass, and related
materialstextilesmachine tradesfabrication, assembly,.and repair of metal productsfabrication and repair of scientific and medical
apparatus, photographic and optical goods,watches and clocks and related products
assembly and repair of electrical equipmentfabrication and repair of products made from
assorted materialspainting, decorating and relatedfabrication and repair of plastics, synthetics,
rubber and related productsfabrication and repair of wood productsfabrication and repair of sand, stone, clay, and
glass productsfabrication and repair of textile, leather and
related productsbench workmetal fabricatingwelders, flame cutters and relatedelectrical assembling, installing and repairingpainting, plastering, waterproofing, cementing
and relatedexcavating, grading, paving and relatedconstruction occupationsstructural work
6, Student

42
7. Retired
8. Unemployed
9. Homemaker
10. No Response