a study on effectiveness of training and development …ijstre.com/publish/062016/65646623.pdf ·...
TRANSCRIPT

International journal of scientific and technical research in engineering (IJSTRE)
www.ijstre.com Volume 1 Issue 3 ǁ June 2016.
Manuscript id. 65646623 www.ijstre.com Page 69
A Study on Effectiveness of Training and Development
Programme in Airport Authority of India
Dr.S.Jansirani*, L.Tharani Scholar** *Associate Professor,Vels University & Senate Member Of University Of Madras, Sai Sathya, Assistant Profess
,Aas Tech,
ABSTRACT :The project entitled “A Study on Training and Development Program in Airport Authority of
India, Chennai” is our study. During the completion of the project, I had the honor of meeting more than 100
employees of the Airport Authority of India and studied the various training and development procedures they
went through from that we inferred that knowledge based training and development procedures escalate the
performance and overall efficiency of the employees. Training improves changes and moulds employee’s
knowledge, skills, behaviors, aptitude and attitude towards the requirement of the job and organization. The
research design adopted in this study is descriptive analysis. The opinion of the employees in the training programme was obtained through the structured questionnaire and interaction with them. A questionnaire is
prepared for the employees, to suit their expectation and needs.
Statistical tools used for the study are chi-square, ANOVA and correlation. From the study it is found that they
are enriching their knowledge with the training program and thus based on the analysis interpretation, the main
findings and suggestions were given. It has been observed that the training programme offered is good. Yet still
it is necessary to be tailored to meet the training needs of the employees.
I. STATEMENT OF PROBLEM The campus is facing the implementation of an unprecedented number “transformation” projects. These
projects will require technical and cross functional staff resources from organizations throughout the campus.
They will be scheduled to run both concurrently and in rapid succession. The successes of these projects will
dependet, in large part, on skilled project management and communication with the project team, and across the
campus. Project managers will need tools and support for early identification of risks, assumptions,
dependencies, and issues, and team resources that are garnered to partner the needs of a process with identical
constraints.
II. SCOPE OF THE STUDY The study is conducted with an intention to analyze the training plan done at Airport Authority of
India.
The study also helps to identify the satisfaction and interest of the trainees towards training.
It is done with the aim to provide recommendations for the improvement of identification of actual
needs of the employees and rendering effective programme.
The study also helps to identify the areas where the employees have improved after training.
III. NEED FOR THRE STUDY Training programme we plays a vital role among the employees in the AAI as it reflects in the form of increased
performance and efficiency of the workers which in turn leads to increased growth and development of the
company and also to find out the effectiveness of training programme.An effective training program can reduce the number of injuries and deaths, illness, worker‟s compensation claims, and missed time from work. Safety
training classes helps establish a safety culture in which employees themselves help promote proper safety
procedures while on the job. It is important that the new employees get trained and acquainted with the
importance of workplace safety as it is easy for seasoned workers to negatively influence the newly hired.
IV. OBJECTIVES OF THE STUDY To study the effectiveness of existing training program
To find out employees interest level and satisfaction in the training program.
To examine the growth and development of employee in Airport Authority of India.

A Study on Effectiveness of Training and Development Programme in Airport Authority of India
Manuscript id. 65646623 www.ijstre.com Page 70
V. LIMITATIONS OF THE STUDY The sample size was small and so the results may not be really accurate.
The period of the study have been very short, research was conducted on employees in only one
branch. The employees due to the fear of the management may not have disclosed all the facts. This might have
an impact on the findings in the study.
VI. REVIEW OF THE LITERATURE Training and development strategies require remodeling due to globalization and fast moving businesses. In
order to enhance performance with less cost and develop certain aspects of business, learning options
framework has been defined.
: Baird
„It‟s the identification, Stupid‟: Profiling Senior Public Service Managers for Training and Development.
: Salopek
A review of practices of senior management development across the upper echelons of the public services of
major jurisdictions shows that while the need to develop leaders is universally recognized by governments, there
are still considerable gaps in the development function. One of the key gaps the article argues that is central to
the training and development function is that of identification and targeting of individuals. A profiling protocol
is presented that is argued could be an appropriate tool for governments to considers as they seek to link the
desired competencies with the career aspirations of their public service senior managers.
: Gambhir Bhatta
National University of Singapore – there is a need to develop professionalism among the executives in order to
face the global competitive environment. Hence, every organization has to ask what are the competencies that
contribute for the effectiveness of executives; their competencies used to be sharpened and this needs
appropriate training. Effectiveness itself helps in the achievement of organizational goals.
: Gopal M. B. A., L.L.B
This article reports a study conducted to identify the needs for continuing professional development for life
insurance sales representatives and to examine the competencies needed by those sales representatives. A
modified Delphi technique was used. Mast life insurance companies in the USA implement an education and
training plan advocated by the Life Office Management Association. Insurance companies in Taiwan implement
similar education and training plans, but they do not seem to result in the successful performance of their sales
representatives. Besides augmenting knowledge of various financial products and marketing approaches, this
study also suggests that life insurance companies need to train their sales representatives to an adequate standard
in competencies of problem solving, communication, information technology utilization, culture compatibility,
emotional intelligence, collective competence and ethics.
: Chiang Ku Fan
The past decade of training reform in the Australian automotive industry has been driven by Government and
enterprise plans for the restructure of the industry. These plans have emphasized changes to manufacturing
practices and work practices, as the way to revitalize the manufacturing sectors of the industry. The provision of
workplace training has been a significant factor in the implementation of these plans and development of a
training system with distinctive industry features has been one outcome of this programme of industry
restructuring.
: Meliza, Larry L.

A Study on Effectiveness of Training and Development Programme in Airport Authority of India
Manuscript id. 65646623 www.ijstre.com Page 71
Training and developing employees has always been an important part of organizational success and with the
recent recognition of how critical learning is to such success there is every indication that employee learning
initiatives will require increased resource commitment. This chapter highlights the critical role that training and
development (T&D) must play in helping employees and their organizations “learn” at every opportunity. The
chapter considers what can be done to maximize learning for all employees by discussing what we know about
learning, types and levels of learning, adult learning theory and the role of learning styles in T & D initiatives,
and concludes with a look at two issues: individuals who resist learning and future learning styles models.
Ronald R. Sims
VII. RESEARCH METHODOLOGY
CONCEPT
Research methodology is a way to systematically solve the research problem. In it, we study the
various steps that are generally adopted by a researcher in studying the research problem along with the logic
behind them. It is not only necessary to know the research methods and techniques but also the methodology. It
is necessary to design the methodology for the problem because it differs from problem to problem. It helps us
to know the assumptions underlying various techniques and the applicability of the techniques and procedures to
the problems under study.
Research methodology has many dimensions and research methods constitute a part of this. The scope
of research methodology is wider than that of the research methods. Thus research methodology considers not
only the research methods but also the logic behind the methods that are used for the research studies and enable
us to evaluate the research results. There are various stages for the research methodology process, which are
discussed in detail below:
PERIOD OF THE STUDY
The study is conducted for a confined period of three months starting from JANAURY to JUNE 2011.
PRIMARY DATA
“Questionnaire” and the “Annexure” attached to it, which is quite a popular method used to collect
primary data. The data collected contributed to the primary data.
SECONDARY DATA
Secondary data means data that are already available i.e., they refer to the data which have already been
collected and analyzed by someone else. The secondary data may be either a published data or unpublished data.
In this case the secondary data was Age, Designation, Grade and Previous year training records and
manuals, etc. which were maintained by the organization.
DATA COLLECTION METHOD
The researcher collects the primary data from their original sources. In this case, the researcher
collected the required data precisely according to his research needs. But the collection of primary data is costly and time consuming. Yet for several types of social sciences research required data are not available from
secondary sources and they have to be directly gathered from the primary sources. In this study
QUESTIONNAIRE METHOD has been used to collect the data. The data are collected by asking to fill up
the questionnaire to employees who had previously attended the training program.

A Study on Effectiveness of Training and Development Programme in Airport Authority of India
Manuscript id. 65646623 www.ijstre.com Page 72
SAMPLING DESIGN
There are two types of sampling design-
1. Probability sampling
2. Non-probability sampling
The sampling technique used for this project is non-probability sampling called judgment sampling.
Judgment sampling was done because the questionnaire can be filled only by respondents who have
attended the training program.
Sample size:
The total population size is 1200 and a sample size of 120 was covered in this project. The
questionnaire was distributed only to employees who have attended the training program.
Research instrument:
The Questionnaire entitled “EMPLOYEES TRAINING PROGRAMME” is the main instrument
used to collect the data. The questionnaire is designed to elicit the information about the employees‟ feedback
about training programs that has been conducted and it is aimed to give a clear insight into their preferences regarding various training program and different training methods. It also gives an idea of whether any
modification is needed in the later existing training program.
Construction of the questionnaire:
The questionnaire was framed with both open-ended and closed-ended and with the help of 5 point
scale. Before administering to a large scale survey the questions were tested by a pilot survey with the help of
some selected questions. Through the pilot survey the researcher modified the questions which were difficult to
answer, or the respondents were unwilling to answer. The pilot study helped the researcher to modify the
questionnaire.
To rate the responses of the employees the five point rating scale is used in which consists of:
Strongly agree, Agree, Neutral, Disagree, Strongly disagree
The questionnaire contains demographical data of the respondents like age, gender, designation and
experience of the respondents.
STATISTICAL TOOLS
Chi-Square
Correlation
ANOVA
Simple percentage method:
The simple percentage method has been employed to present the proportion of respondents out of the
total population/sample for each of the response categories for a question.
Percentage of respondents = Number of respondents
Total population

A Study on Effectiveness of Training and Development Programme in Airport Authority of India
Manuscript id. 65646623 www.ijstre.com Page 73
From the above formula, we can get percentages of the data given by the respondents.
Chi- Square method: The chi-square is an important test among the several tests of significance developed by
statisticians. Chi-square symbolically written as χ2 is a statistical measure used in the context of sampling
analysis for comparing the variance to a theoretical variance. As a non-parametric test it can be used to
determine if categorical data shows dependency are the two classifications are independent. It can also be used
to make comparisons between theoretical population and actual data‟s when categories are used. Thus the chi-
square test is applicable in large number of problems.
The test is in fact, a technique through the use of which it is possible for the entire researcher to;
1. Test the goodness of fit;
2. Test the significance of association between two attributes and
3. Test the homogeneity or the significance of population variance.
In this study the researcher has also used the Chi-square test for analysis of data and it had been described
above. To conduct this test, the formula used is as given below:
Ψ² = ∑ (O-E) ²
E
O = Observed frequency
E = Expected frequency
On comparing the calculated value with the table value, if we find that the calculated value is less, then we
accept the null hypothesis.
Correlation method:
Correlation is a statistical measurement of the relationship between two variables. Possible correlations range
from +1 to –1. A zero correlation indicates that there is no relationship between the variables. A correlation of –1 indicates a perfect negative correlation, meaning that as one variable goes up, the other goes down. A
correlation of +1 indicates a perfect positive correlation, meaning that both variables move in the same direction
together.
FORMULA:
From the above formula use, we can find out whether the two variables are positively correlated or negatively
correlated.

A Study on Effectiveness of Training and Development Programme in Airport Authority of India
Manuscript id. 65646623 www.ijstre.com Page 74
ANOVA
The anova is designed to test whether a significant difference exsists among three or more sample means. In
this analysis, the total variance is a set of data is divided into variation within-groups and variation between
groups.
The significance of the difference between the means of two categories (e.g. males and females; two age slots) can be evaluated by the z-test or the t- test. But when the comparison about three or more categories or samples
have to be made simultaneously, the use of t-test is not only tedious, but also increases the probability of making
type -1 error. To overcome this difficulty, a method known as Analysis of Variance has been developed.
The ANOVA used for studying the differences among the influence of various categories of one independent
variable on a dependent variable is called One Way ANOVA and that used for studying the influence of two
independent variables on a dependent variable called Two Way ANOVA.
The following are the steps in carrying out the analysis of variance:
1. Set up null hypothesis 2. Find the total sum of all the items. It is by T.
3. Find the correction factor C.F.=T2 / N where N – the number of items.
4. Find the total sum of squares = Square of all items – C.F.
5. Find the sum of squares between columns
6. Find the sum of squares between rows
7. Find the residual variance
8. Construct analysis of variance table
9. Calculate the values of F as follows:
F – For variance between columns = Variance between columns Residual variance
F – For variance between rows = Variance between rows Residual variance
10. Find the tabulated value of F for their respective degrees of freedom.
11. If calculated F < Tabulated F, we accept the null hypothesis. 12. If calculated F < Tabulated F, we reject the null hypothesis.
TABLE-4.1.1
PERFORMANCE INCREASES AFTER ATTENDING THE TRAINING PROGRAM.
S.NO
OPTIONS NO. OF THE
RESPONDENTS
% OF THE
RESPONDENTS
1 Strongly agree 80
67
2 Agree 35 29
3 Neither agree nor
disagree
5 4
4 Disagree 0 0
5 Strongly disagree 0 0
Total 120 100
Source: Computed by primary data

A Study on Effectiveness of Training and Development Programme in Airport Authority of India
Manuscript id. 65646623 www.ijstre.com Page 75
CHART 4.1.1
PERFORMANCE INCREASES AFTER ATTENDING THE TRAINING PROGRAMME
0
10
20
30
40
50
60
70
80
Strongly
agree
Agree Neither
agree nor
disagree
Disagree Strongly
disagree
PERFORMANCE INCREASES
PE
RC
EN
TA
GE
INFERENCE
From the table 67% of the respondents strongly agreed that their performance increases after attending the
training program.29% of the respondents agreed and 4% of the respondents‟ neutral.
TABLE 4.1.2
TRAINING PROGRAMS ARE SUCCESSFUL IN IMPROVING THE SKILLS SUCH AS
TEAMWORK COMMUNICATION AND DECISION MAKING.
S.NO
OPTIONS NO. OF THE
RESPONDENTS
% OF THE
RESPONDENTS
1 Strongly agree 30 25
2 Agree 62 52
3 Neither agree nor
disagree
11 9
4 Disagree 13 11
5 Strongly disagree 4 3
Total 120 100
Source: Computed by primary data

A Study on Effectiveness of Training and Development Programme in Airport Authority of India
Manuscript id. 65646623 www.ijstre.com Page 76
CHART 4.1.2
THETRAINING PROGRAMS ARE SUCCESSFUL IN IMPROVING THE SKILLS SUCH AS
TEAMWORK COMMUNICATION AND DECISION MAKING.
0
10
20
30
40
50
60
Strongly
agree
Agree Neither
agree nor
disagree
Disagree Strongly
disagree
TEAMWORK & DECISION MAKING
PE
RC
EN
TA
GE
INFERENCE From the table 25% of the respondents strongly agreed.52% of the respondents‟ agreed.9% of the respondents
neither agreed nor disagreed.11% of the respondents‟ disagrees and 3% of the respondents strongly disagreed.
TABLE 4.1.3
THE ORGANIZATION CONSIDERS TRAINING AS A PART OF ORGANIZATIONAL STRATEGY
S.NO
OPTIONS NO. OF THE
RESPONDENTS
% OF THE
RESPONDENTS
1 Strongly agree 35 29
2 Agree 60 50
3 Neither agree nor
disagree
10 8
4 Disagree 15 13
5 Strongly disagree 0 0
Total 120 100
Source: Computed by primary data

A Study on Effectiveness of Training and Development Programme in Airport Authority of India
Manuscript id. 65646623 www.ijstre.com Page 77
CHART 4.1.3
THE ORGANIZATION CONSIDERS TRAINING AS A PART OF ORGANIZATIONAL STRATEGY
0
10
20
30
40
50
60
Strongly
agree
Agree Neither
agree nor
disagree
Disagree Strongly
disagree
TEAMWORK & DECISION MAKING
PE
RC
EN
TA
GE
INFERENCE
From the table 29% of the respondents strongly agreed.50% of the respondents‟ agreed.8% of the respondents
are neither agreed nor disagreed and 13% of the respondents disagreed.
TABLE 4.1.4
SATISFIED WITH THE SERVICES PROVIDED DURING THE TRAINING PROGRAM BY THE
ORGANIZATION.
S.NO
OPTIONS NO. OF THE
RESPONDENTS
% OF THE
RESPONDENTS
1 Highly satisfied 27 22
2 Satisfied 30 25
3 Neutral 25 21
4 Dissatisfied 18 15
5 Highly dissatisfied 20 17
Total 120 100
Source: Computed by primary data
A Study on Effectiveness of Training and Development Programme in Airport Authority of India
Manuscript id. 65646623 www.ijstre.com Page 78
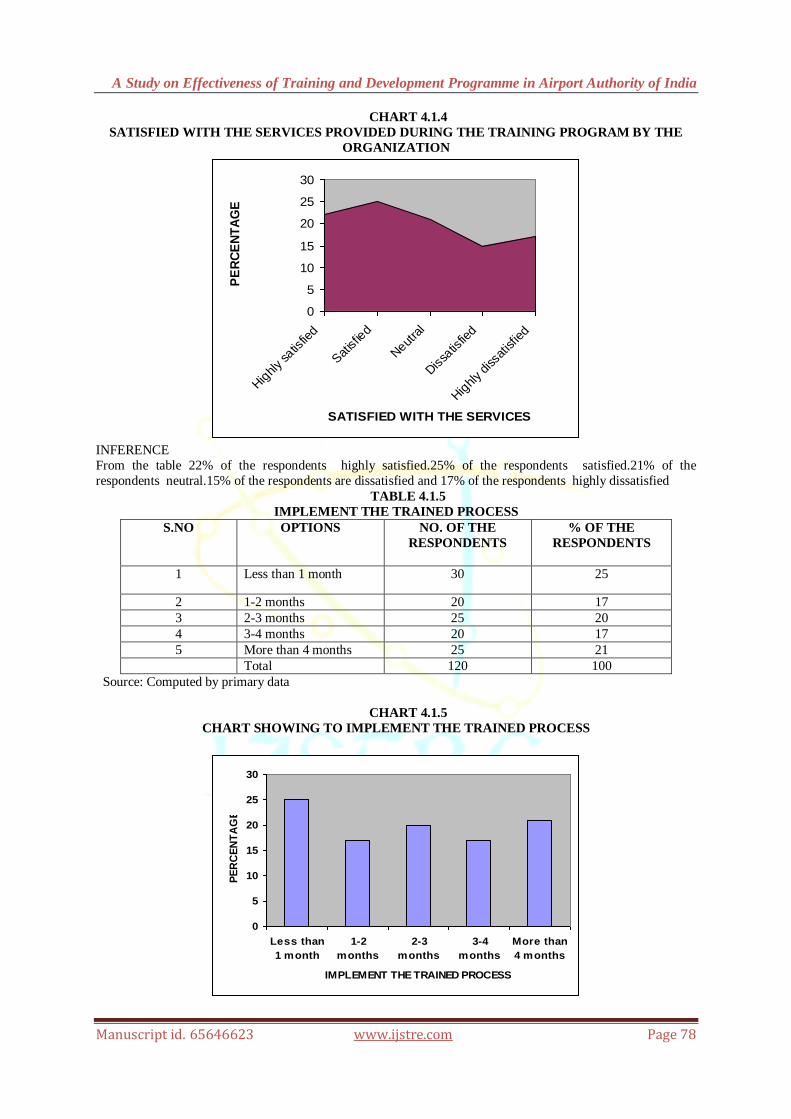
CHART 4.1.4
SATISFIED WITH THE SERVICES PROVIDED DURING THE TRAINING PROGRAM BY THE
ORGANIZATION
0
5
10
15
20
25
30
Hig
hly sa
tisfie
d
Sat
isfie
d
Neut
ral
Dis
satis
fied
Hig
hly di
ssat
isfie
d
SATISFIED WITH THE SERVICES
PE
RC
EN
TA
GE
INFERENCE
From the table 22% of the respondents highly satisfied.25% of the respondents satisfied.21% of the
respondents neutral.15% of the respondents are dissatisfied and 17% of the respondents highly dissatisfied
TABLE 4.1.5
IMPLEMENT THE TRAINED PROCESS
S.NO
OPTIONS NO. OF THE
RESPONDENTS
% OF THE
RESPONDENTS
1 Less than 1 month 30 25
2 1-2 months 20 17
3 2-3 months 25 20
4 3-4 months 20 17
5 More than 4 months 25 21
Total 120 100
Source: Computed by primary data
CHART 4.1.5
CHART SHOWING TO IMPLEMENT THE TRAINED PROCESS
0
5
10
15
20
25
30
Less than
1 month
1-2
months
2-3
months
3-4
months
More than
4 months
IMPLEMENT THE TRAINED PROCESS
PE
RC
EN
TA
GE

A Study on Effectiveness of Training and Development Programme in Airport Authority of India
Manuscript id. 65646623 www.ijstre.com Page 79
INFERENCE
From the table 23% of the respondents to take less than one month.25% of the respondents to take 1-2
months.24% of the respondents to take 2-3 months and 28% of the respondents to take 3-4 months.
TABLE 4.1.6
TYPE OF TRAINING IS BEING IMPARTED FOR NEW RECRUITMENTS IN YOUR
ORGANIZATION.
S.NO OPTIONS NO. OF THE
RESPONDENTS
% OF THE
RESPONDENTS
1 Technical 65 54
2 Management 35 29
3 Presentation skill 15 13
4 Other 5 4
Total 120 100
Source: Computed by primary data
CHART 4.1.6
TYPE OF TRAINING IS BEING IMPARTED FOR NEW RECRUITMENTS IN YOUR
ORGANIZATION.
0
10
20
30
40
50
60
Technic
al
Man
agem
ent
Prese
ntatio
n ski
ll
Oth
er
IMPLEMENT THE TRAINED PROCESS
PE
RC
EN
TA
GE
INFERENCE
From the table 54% of the respondents taking technical skill.29% of the respondents taking management
skill.13% of the respondents taking presentation skill and .4% of the respondents taking other skill.
TABLE 4.1.7
EMPLOYEES ARE GIVEN FREEDOM TO GIVE TRUE FEEDBACK ABOUT THE TRAINING
THEY ATTENDED
S.NO
OPTIONS NO. OF THE
RESPONDENTS
% OF THE
RESPONDENTS
1 Strongly agree 25 21
2 Agree 24 20
3 Neither agree nor
disagree
30 25
4 Disagree 23 19
5 Strongly disagree 18 15
Total 120 100
Source: Computed by primary data

A Study on Effectiveness of Training and Development Programme in Airport Authority of India
Manuscript id. 65646623 www.ijstre.com Page 80
CHART 4.1.8
EMPLOYEES ARE GIVEN FREEDOM TO GIVE TRUE FEEDBACK ABOUT THE TRAINING
THEY ATTENDED
0
5
10
15
20
25
30
Str
on
gly
ag
ree
Ag
ree
Ne
ith
er
ag
ree
no
r
Dis
ag
ree
Str
on
gly
dis
ag
ree
FREEDOM TO GIVE FEEDBACK
PE
RC
EN
TA
GE
INFERENCE
From the table 21% of the respondents strongly agreed.20% of the respondents‟ agreed.25% of the respondents
are neither agreed nor disagreed.19% of the respondents are disagreed and 15% of the respondents strongly
disagreed.
4.3 STATISTICAL ANALYSIS
CHI-SQUARE
TEST-1
To find out any significant difference between the employees experience they got and number of training
programs they attended in a year.
Hypothesis
Null Hypothesis (H0)-There is no significant relationship between the employees experience they got and
number of training programs they attended in a year.
Alternate Hypothesis (H1)-There is a significant relationship between the employees‟ experience they got
and number of training programs they attended in a year.
TABLE SHOWING THE EXPERIENCE AND NUMBER OF TRAINING PROGRAMS THEY
ATTENDED IN A YEAR
OPTION TRAINING PROGRAM ATTENTED TOTAL
YEAR LESS
THAN 5
5-10 10-15 15-20 20
ABOVE
EX
PE
RIE
NC
E
5-10 - 15 15 20 - 50
11-15 - 15 10 - - 25
16-20 15 10 - - - 25
21-25 10 - - - - 10
26 ABOVE 10 - - - - 10
TOTAL 35 40 25 20 - 120

A Study on Effectiveness of Training and Development Programme in Airport Authority of India
Manuscript id. 65646623 www.ijstre.com Page 81
E=R*C/N
Where R= Sum of row total
C= Sum of column total
N = Sample size
Calculated value:
Observed
Frequencies(O)
Expected
Frequencies(E)
(O-E)² (O-E)²/E
15 16.67 2.7889 0.17
15 10.42 20.9764 2.01
20 8.33 136.1889 16.35
15 8.33 44.4889 5.34
10 5.21 22.9441 4.40
15 7.29 55.5891 7.63
10 8.33 2.7889 0.33
10 2.92 50.1264 17.17
10 2.92 50.1264 17.17
CALCULATED VALUE 70.42
Calculated value of Chi-Square (Ψ²) = 70.42
Table value of Chi-Square:
Degrees of freedom = (row-1)*(col-1)
= (5-1)*(5-1)
= 4*4
= 16
Critical value: The table value of Ψ² at 5% and for 16 degrees of freedom is Ψ² (0.05, 16) = 26.296
INTERPRETATION
Since the calculated value of Ψ² = 70.42 is > Ψ² (0.05, 16) = 26.296, so the null hypothesis (H0) is rejected and
the alternate hypothesis (H1) is accepted.
RESULT
The significance value gives a clear picture that there is a relationship between the employees‟ experience they
got and number of training programs they attended in a year.
CORRELATION
TEST – 2
Hypothesis:
Null Hypothesis (H0) – There is no significant relationship between the satisfaction of training provided for
current job and the services provided during the training program by the organization.
Alternate Hypothesis (H1) - There is a significant relationship between the satisfaction of training provided
for current job and the services provided during the training program by the organization.

A Study on Effectiveness of Training and Development Programme in Airport Authority of India
Manuscript id. 65646623 www.ijstre.com Page 82
TABLE SHOWING THE SATISFACTION OF TRAINING PROVIDED FOR CURRENT JOB AND
THE SEVICES PROVIDED DURING THE TRAINING PROGRAM
X Y X² Y²
XY
27 37 729 1369
999
30
28 900 784 840
25
24 625 576 600
18
21 324 441 378
20 10 400 100 200
120 120 2978 3270 3017
FORMULA:
Where,
X = Satisfied with the services provided during the training program by the organization.
Y = Satisfied with the training provided for current job
TABLE VALUES
N = 120
∑XY= 3017
∑X =120
∑Y = 120
∑X² = 2978
∑Y²= 3270

A Study on Effectiveness of Training and Development Programme in Airport Authority of India
Manuscript id. 65646623 www.ijstre.com Page 83
CALCULATED VALUE
r = 0.92
INTERPRETATION:
Since the calculated value of r = 0.92 is > r (0.05) = 0.71, so the null hypothesis (H0) is rejected and the
alternate hypothesis (H1) is accepted.
VIII. RESULT
So, the correlation of 120 cases is 0.92, which is a fairly strong positive relationship. Since there is a relationship
between the satisfaction of training provided for current job and the services provided during the training
program by the organization.
ANOVA TABLE
SOURSES OF
VARIANCE
SUM OF SQUARES DEGREEOF
FREEDOM
VARIANCE F
Between rows 214 5 – 1 = 4 214 / 4
=53.5
53.5/49.75=1.07
Between columns 14 5– 1 = 4 14/4
=3.5
3.5/49.75= 0.07
Residual 796 (4) (4) = 16 796/16
= 49.75
-
Calculated value:
F1 = 1.07
F2 = 0.07
Table value:
Critical value: The table value of ANOVA at 5% and the degrees of freedom is (4, 16) = 3.01
RESULT
The table value of F1 at 0.05 level of significance is 3.01. Calculated value is 1.07.Hence calculated value is
lesser than table value, so H0 is accepted. Since there is no significant relationship between the experiences they
got ant also take the time to implement the trained process.
The table value of F2 at 0.05 level of significance is 3.01. Calculated value is 0.07. Hence calculated value is
lesser than table value, so H0 is accepted. Since there is no significant relationship between the experiences they
got and also take the time to implement the traing process.
FINDINGS
The study reveals that 22% of the respondents are between the age group of 21–30, 19%of the
respondents are between the age group of 51 and above.
63% of the respondents were categorized under Male. 37% of the respondents were categorized under the gender Female.
80% of the respondents are married. 20% of the respondents are unmarried.
25% of the respondents have experience 5-10 years, 17% of the respondents have experience 21-25
years, 11% of the respondents are having experience 26 and above years.
67% of the respondents strongly agreed that their performance increases after attending the training
program, which as 29% of the respondents agreed and.4% of the respondents neither agree nor
disagree.
In case of Chi–Square based on “Experience”, it has been found that there exists some significant
relationship between the employee‟s experience and number of training programs they attended in a
year.

A Study on Effectiveness of Training and Development Programme in Airport Authority of India
Manuscript id. 65646623 www.ijstre.com Page 84
In case of Correlation based on “satisfaction of providing training for current job” it has been
found that there exists some significant relationship between the satisfaction of training provided for
current job and the services provided during the training program by the organization.
In case of ANOVA based on “Experience”, it has been found that there is no significant relationship
between the experiences taken the time to implement the trained process.
SUGGESTIONS
From the responses collected it is clear that current training program conducted is effective.
As the trainee acquires new knowledge, skills and attitude and applies them in job situation, he should
be significantly rewarded for his efforts.
Training is necessary to the employees to improve their performance
The management should explain about usefulness of training and the importance of training to its
employees and organization to make it more effective.
The training method should be selected depending upon the suitability of the job and work
environment.
More soft skills need to be included in the training schedule.
Job rotation can help the organization that is any person can do any job.
Employees are different and hence further research has to be done to understand major learning
styles and incorporate this into the method of training. For example graphics, business games, images
have deeper impact on some learners, whereas statistics data and charts impress the other kind.
IX. CONCLUSION People are the greatest assets in any, organization, because through people all the other resources are
converted into utilities. This study focuses on the employees who attended the training programme and it has
been organized to examine the effectiveness of existing training programme in the organization considering
various parameters and received a mixed response from the respondents.
The result of this analysis has clearly shown that the existing training of Airport Authority of India has
satisfied the employees and it shows the level of effectiveness of training in increasing employees‟ performance
in the present job
. And yet the modification of some aspects of training like suitability of training methods with regards to
nature of work of employees, communication has to be taken into consideration and interpersonal skills need to
be enhanced and the employees should be informed why training need to be conducted (purpose of training) and
what employees can gain from a particular training programme. All the efforts in increasing the employees‟
potential have been a sensitive issue, in training and development. Also there is awareness among all cadres on
the importance of training. This has to be fostered. And relevant training modules should be developed.
REFERENCE BOOKS [1.] V.S.P Rao., Human Resource Management; Second edition; Excel publication.
[2.] Kothari CR, (Research methodology); Second Revised Edition;2004, New Age International Publishers
[3.] Arora (Statistics of Management) Sultan Chand & sons; New Delhi 2008
[4.] R.Senapathi (Research methodology); First edition; Lakshmi publication.
[5.] Personnel Management, Edwin B.Flippo, Sixth edition, McGraw Hills.
WEBSITES
www.airportsindia.org.in www.citehr.com
www.wikipedia.com
www.emeraldinsight.com
www.scribd.com
www.hrzone.com