a study on domestic water consumption in …...a study on domestic water consumption in lashkar gah...
TRANSCRIPT
International Journal of Scientific & Engineering Research, Volume 8, Issue 3, March-2017ISSN 2229-5518
IJSER © 2017http://www.ijser.org
A Study on Domestic Water Consumption inLashKar Gah City, Helmand, Afghanistan
Ahmad Ansari, Ahmed Hussein El-ShafieeFaculty of Civil Engineering, Helmand University, Lashkar Gah city, Afghanistan
Abstract— Water is vital natural resource and an essential component of life on earth. The availability of safe water and adequatesanitation is crucial not only for health reasons, but also for economic development (UNICEF & WHO, 2008). This study was conducted indistrict 1, 2 and 3 of Lashkar Gah city in Helmand province, Afghanistan, for the period of January 2014 to April 2014. The aim to assessvarious factors which affect domestic water consumption. Data from 100 households were collected from the three districts and analyzedusing IBM SPSS (Statistical Package for Social Sciences) and Microsoft Excel (spreadsheet) software. Household water consumption wasfound to be correlated with socioeconomic aspects such as size of household, distance of water source, household head’s age andeducational and the household income. Statistical analysis has been done utilizing a Pearson correlation matrix between water being usedas a socioeconomic factor with the objective of minimizing the complexity and simplifying the interpretation of data. Per capita consumptionwas found to vary from around 160 L/c.d in small households down to around 80 L/c.d in larger households. Per capita consumption alsovaried with household income with as little as 20 L/c.d being used in poor households .Only 8% of households surveyed had piped waterwhereas 76% of the households surveyed relied on private tube wells. It would be desirable to extend this work to cover different seasonsand to also include investigation of water quality.
Keywords: Domestic water consumption; urban household; source of water; Lashkar Gah city; Helmand, Afghanistan
—————————— u ——————————
1 INTRODUCTIONater is one of the vital and most fundamental naturalresources and an essential component of life on earth.The availability of safe water and adequate sanitation is
crucial not only for the health reasons, but also for economicdevelopment (WHO & UNICEF, 2008). Five critical require-ments for the existence of human are air, water, food, heat,and light. Contamination of each of these elements may causesevere health hazards not merely to man but also to animalsand plants life (Punmia et al., 1995). In nature the water is re-vival source and generate continuously. The water is availablein various forms such wells, streams, lakes and rivers etc. It isthe responsibility of any water supply utility engaged in thesupplying of water is to provide water resources to the dis-trict, city or a country by creating certain water tube wells,pipelines and other resources so that people can get pure andclean water for drinking purposes.
Yet the pressures on freshwater are rising continuously,from the expanding requirements of agriculture, food produc-tion and energy consumption to pollution and the weaknessesof water management. Climate change is a real and growingdanger. Without excellent planning and adaptation, hundredsof millions of people are at risk of hunger, disease, energyshortages, and poverty (WWDR, 2012). The United NationsEconomic and Social Council (ECOSOC, 2003) states that wa-ter shall be available and accessible to all human beings. With-in several of the UNs adopted documents, water shall addi-tionally be sufficient, affordable, safe, and acceptable, and con-tain a certain standard of quality.1.1 AFGHANISTAN’S WATER RESOURCESAfghanistan is well endowed with water resources, both sur-face and underground. The recent estimates show that Af-ghanistan has 75 billion (annual) cubic meters of potential wa-ter resources of which 55 BCM is surface water and 20 BCM isunderground water. The annual amount of water used forirrigation is measured to be 20 BCM, which is 99 % of all water
used in the city. It clearly depicts that 20BCM is the 99% ofwater that is being used whereas 1% is wasted. The amount ofgroundwater extraction is to some 3 BCM (Qureshi, 2002).Approximately 15 % of the total water volume used annuallyderived from alluvial groundwater aquifers (9 %) and spring(7%) and about 85 % from rivers and streams. Groundwaterconsumed from tube wells counts for less than 0.5 %. There-fore, the annual per capita water availability is approximately2500 cubic meters (Qureshi, 2002).1.2 WATER SUPPLY IN LASHKAR GAH CITYIn the 1960s, the US government engaged in major projectslike water management, water supply, major irrigation sys-tems inside Lashkar Gah city and surrounding districts, andhousing development along the Helmand River, indeed thecity (Lashkar Gah) earned the nickname “Little America orNew York of Afghanistan” (Cullather, 2002). But unfortunate-ly all the water supply system and infrastructure had beendamaged due to incident of conflict, war, and bombardmentor remained out of maintenance.
The water supply department was initially established in1960 in Lashkar Gah city. The Department of Helmand andArghandab Valley Authority used to be the in charge of watersupply services since 1960, and Lashkar Gah city municipalitywas in charge of sanitation services. But since 2013 the Lash-kar Gah city municipality has become the incharge of both,water supply and sanitation services for the Lashkar Gah city.The municipality supposed to provide service in terms ofcleaning the open drains, cleaning of streets, solid waste man-agement, water supply services, and irrigation of trees.
A small part of the city which is located along the Hel-mand River had modern water supply and sewerage systems,but the past 30 years of conflict and war has damaged all pub-lic infrastructures including drinking water supply utilitiesand sewerage system, Hence the system is no longer in use.Now the Lashkar Gah city households collect water from tube
W
1034
IJSER
International Journal of Scientific & Engineering Research, Volume 8, Issue 3, March-2017ISSN 2229-5518
IJSER © 2017http://www.ijser.org
wells, shallow wells, fetch and collect water from neighboringhouses, public hand pumps. A few numbers of householdshave access to piped water in district 1 of Lashkar Gah city.For the black water (toilet water or human excreta mixed withwater) disposal, each house has private septic tanks which areexcavated inside houses or, outside on the footpaths of thehouses. The septic tanks are not designed, built, and run ac-cording to the sanitary and environmental engineering crite-ria. The land is just excavated (3 or 4 m in depth and 2 × 4 m,width and length) with simple pipe connections to toilet.When the black water flows into the septic tank the leachatepenetrates to soil and from soil to groundwater. Therefore, theleachate contaminates the groundwater, which is the mainsource of drinking water in city.
As mentioned earlier, the area of this study is located in thegovernmental and residential region, namely district 1, 2 and 3or (Lashkar Gah city, Shaheed Ghaltan and Karta-e-Lagan dis-tricts) respectively. The city community consists of approxi-mately 297,200 population scattered over the area of approxi-mately 984 km2, the city is divided into 8 districts (LashkarGah Municipality. 2013). Lashkar Gah city municipality, In-ternational City/Country Management Association andCommercialization of Afghanistan water and sanitation activi-ty ICMA CAWSA programs are working jointly to providewater supply and sanitation services to the residents of thecity. But until now, they could not cover the mentioned area.The municipality just provides water for drinking purposes toa limited households and a limited time of the day throughelevated water towers. These water towers are not available inthe whole city and districts. These are available at some placesonly. Some of the water towers in district 1 were being de-signed and constructed at the beginnings of establishment ofthe city, and some others constructed by UN- HABITAT,UNICEF, MRRD and other NGOs in few past years. UN-Habitat had been carried out a preliminary assessment of wa-ter towers in Lashkar Gah city, which was just about the ca-pacity and location of water towers. Afterward, no assessmentor evaluation has been performed yet about the existing watertowers and water supply networks.
This study was carried out in Lashkar Gah city of Helmandprovince, covering district 1, 2 and 3 of city and population of201,546. The study was carried out at the period of January2014 to April 2014 for assessing various factors which affectmultiple uses of domestic water and their impact on the sus-tainability of traditional domestic water consumption. Datafrom 100 households were collected from three districts name-ly district 1, 2 and 3 or Lashkar Gah city, Shaheed Ghaltanrespectively. We considered 70 households from which 35were taken from district 2 while the remaining householdsbelong to district 3. The factors that were supposed to affecthousehold water consumption and were found to be correlat-ed with socioeconomic aspects were size of household, dis-tance of water source, household’s head age, educational levelof household and income.
The major objective of this study is to investigate and assessthe domestic water supply system and water consumption, in
Lashkar Gah City of Helmand province Afghanistan.
The below are the specific objectives of this study.1. To assess and analyze the existing condition of shal-
low, tube, WCN and piped water supply system.2. To investigate the factors influencing households’
domestic water consumption and households’ choiceof water source.
2. METHOD OF DATA COLLECTIONIn this study primary as well as secondary data were collected.In order to find out the exact figures of the domestic waterconsumption in the Lashkar Gah city of Helmand province,Afghanistan, both the primary and secondary data were col-lected from selected areas during the study.
2.1 PRIMARY DATA SOURCE (QUESTIONNAIRE SURVEY)The primary data source was the questionnaire survey andinterviews. Since the establishment of the city it has been thefirst time the residents were asked about the domestic waterconsumption through a questionnaire survey. The data com-prises of meetings with community elders, chief and officers,interview with local residents, discussion about sanitationwith department of public health, interview with municipalitystaffs about the domestic water consumption. During the pri-mary data collection on site it was observed that there wasmuch difference in water consumption between high incomefamilies and low income families. The wealthier families wereconsuming much water than poor families. There were manypoor families; even they did not have wells inside their housecompounds, so they had to collect the water from their neigh-bors or from the public water towers.
The current situation of water supply system in the citydepends on tube wells, shallow wells, public water towers,and piped water supply. The households which have pipedwater connection also possess a tube well in their house, be-cause the pipe water is not regular and have many watershortages. Even some families they did not have any watercollection source in their houses and some families, their waterwells were contaminated or the taste of the water was saltydue to the some mineral near to the water wells. Therefore, thementioned families collect water from their neighbors,mosques, and public water towers and hand pumps. The wa-ter from tube wells was extracted by electric submersible wa-ter pumps, hand pumps and by buckets from shallow wells.There was no any wastewater treatment facility. The seweragesystem of the city is in worse condition and sewage serviceswere in very low level, even it was considered zero. Eachhousehold simply used to flow their wastewater to the ditchesin front of their houses.
2.2 SECONDARY DATA SOURCESFor secondary data, the study began with a review of the liter-ature sources by reading library reference materials such asjournal papers, maps, reports, dissertations, articles, andbooks. Review of the relevant material sources that have been
1035
IJSER
International Journal of Scientific & Engineering Research, Volume 8, Issue 3, March-2017ISSN 2229-5518
IJSER © 2017http://www.ijser.org
published in the same field, also the governmental depart-ments and non-governmental organizations were requestedfor the data and figures. The secondary data were collectedfrom the below sources specifically:Governmental Departments:
· HAVA (Helmand Arghandab Valley Authority)· Lashkar Gah City Municipality, Irrigation department· Water Supply Department· Department of Urban Development Affairs· Department of Rural Rehabilitation and Development
Non-governmental Departments and NGOs:· RAMP UP-SOUTH (Regional Afghanistan Municipal-
ity Program for Urban Population)· UN- HABITAT (United Nations Human Settlements
Program)· ICMA CAWSA (International City/Country Man-
agement Association Commercialization of Afghani-stan Water and Sanitation Activity).
2.3. DATA ANALYSIS OF INITIAL INFORMATIONData from the 100 households were collected from three dis-tricts and analyzed using IBM SPSS (Statistical Package forSocial Sciences) and Excel software. Statistical analysis hasbeen done utilizing Pearson correlation matrix between socio-economic aspects with the objective of minimizing the com-plexity and interpretation of large sets of data.
3. RESULTS AND DISCUSSION3.1. EXISTING SOURCES OF DOMESTIC WATER IN LASH-KAR GAH CITY
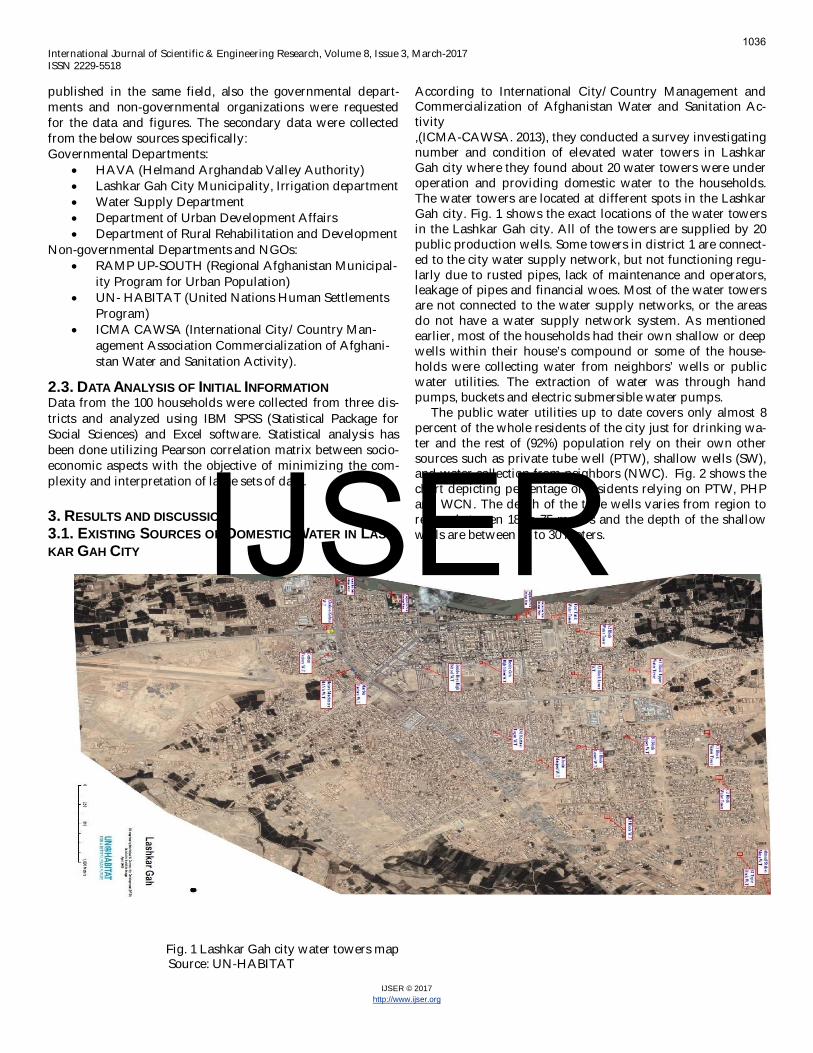
Fig. 1 Lashkar Gah city water towers map Source: UN-HABITAT
According to International City/Country Management andCommercialization of Afghanistan Water and Sanitation Ac-tivity,(ICMA-CAWSA. 2013), they conducted a survey investigatingnumber and condition of elevated water towers in LashkarGah city where they found about 20 water towers were underoperation and providing domestic water to the households.The water towers are located at different spots in the LashkarGah city. Fig. 1 shows the exact locations of the water towersin the Lashkar Gah city. All of the towers are supplied by 20public production wells. Some towers in district 1 are connect-ed to the city water supply network, but not functioning regu-larly due to rusted pipes, lack of maintenance and operators,leakage of pipes and financial woes. Most of the water towersare not connected to the water supply networks, or the areasdo not have a water supply network system. As mentionedearlier, most of the households had their own shallow or deepwells within their house’s compound or some of the house-holds were collecting water from neighbors’ wells or publicwater utilities. The extraction of water was through handpumps, buckets and electric submersible water pumps.
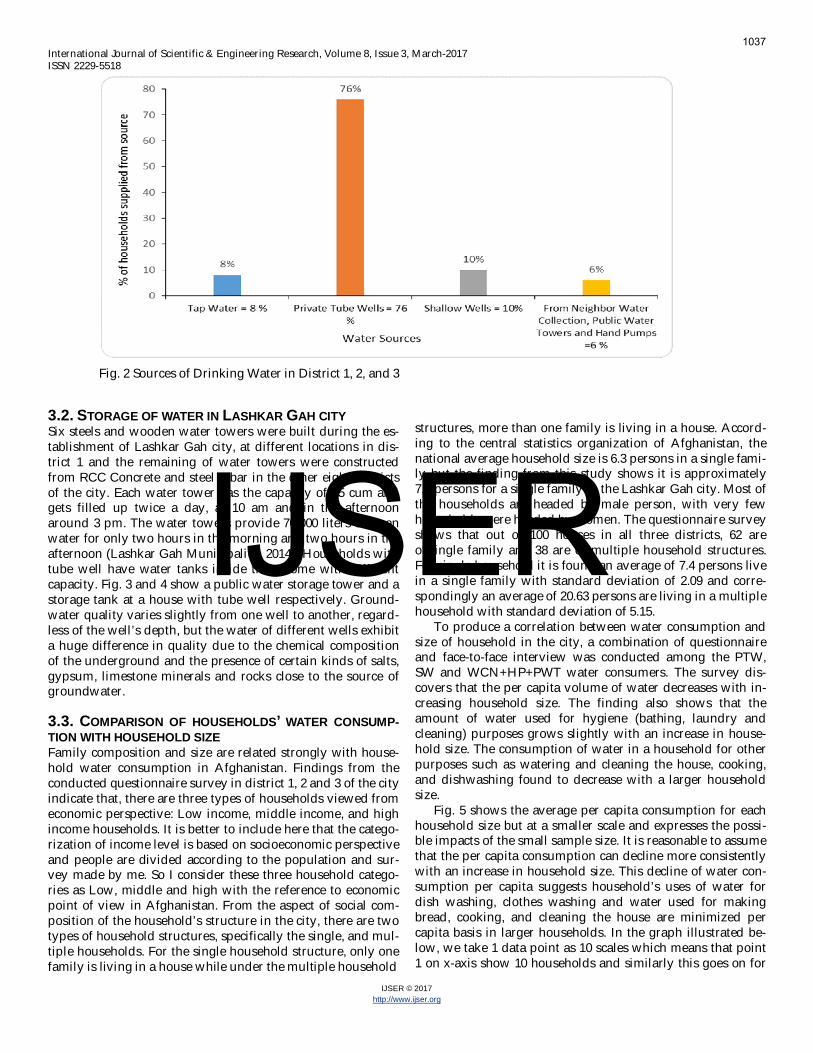
The public water utilities up to date covers only almost 8percent of the whole residents of the city just for drinking wa-ter and the rest of (92%) population rely on their own othersources such as private tube well (PTW), shallow wells (SW),and water collection from neighbors (NWC). Fig. 2 shows thechart depicting percentage of residents relying on PTW, PHPand WCN. The depth of the tube wells varies from region toregion between 18 to 75 meters and the depth of the shallowwells are between 15 to 30 meters.
1036
IJSER
International Journal of Scientific & Engineering Research, Volume 8, Issue 3, March-2017ISSN 2229-5518
IJSER © 2017http://www.ijser.org
Fig. 2 Sources of Drinking Water in District 1, 2, and 3
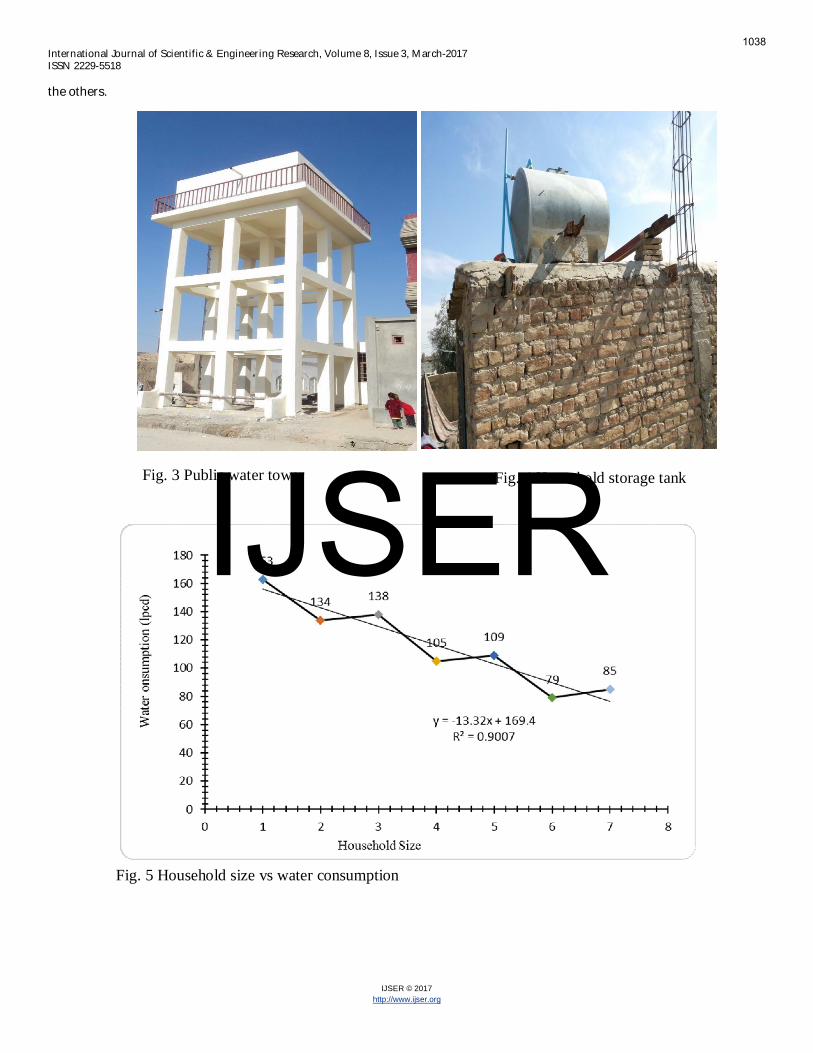
3.2. STORAGE OF WATER IN LASHKAR GAH CITYSix steels and wooden water towers were built during the es-tablishment of Lashkar Gah city, at different locations in dis-trict 1 and the remaining of water towers were constructedfrom RCC Concrete and steel rebar in the other eight districtsof the city. Each water tower has the capacity of 35 cum andgets filled up twice a day, at 10 am and in the afternoonaround 3 pm. The water towers provide 70,000 liters of cleanwater for only two hours in the morning and two hours in theafternoon (Lashkar Gah Municipality. 2014). Households withtube well have water tanks inside their home with differentcapacity. Fig. 3 and 4 show a public water storage tower and astorage tank at a house with tube well respectively. Ground-water quality varies slightly from one well to another, regard-less of the well’s depth, but the water of different wells exhibita huge difference in quality due to the chemical compositionof the underground and the presence of certain kinds of salts,gypsum, limestone minerals and rocks close to the source ofgroundwater.
3.3. COMPARISON OF HOUSEHOLDS’ WATER CONSUMP-TION WITH HOUSEHOLD SIZEFamily composition and size are related strongly with house-hold water consumption in Afghanistan. Findings from theconducted questionnaire survey in district 1, 2 and 3 of the cityindicate that, there are three types of households viewed fromeconomic perspective: Low income, middle income, and highincome households. It is better to include here that the catego-rization of income level is based on socioeconomic perspectiveand people are divided according to the population and sur-vey made by me. So I consider these three household catego-ries as Low, middle and high with the reference to economicpoint of view in Afghanistan. From the aspect of social com-position of the household’s structure in the city, there are twotypes of household structures, specifically the single, and mul-tiple households. For the single household structure, only onefamily is living in a house while under the multiple household
structures, more than one family is living in a house. Accord-ing to the central statistics organization of Afghanistan, thenational average household size is 6.3 persons in a single fami-ly but the finding from this study shows it is approximately7.4 persons for a single family in the Lashkar Gah city. Most ofthe households are headed by male person, with very fewhouseholds were headed by women. The questionnaire surveyshows that out of 100 houses in all three districts, 62 areof single family and 38 are of multiple household structures.For single household it is found an average of 7.4 persons livein a single family with standard deviation of 2.09 and corre-spondingly an average of 20.63 persons are living in a multiplehousehold with standard deviation of 5.15.
To produce a correlation between water consumption andsize of household in the city, a combination of questionnaireand face-to-face interview was conducted among the PTW,SW and WCN+HP+PWT water consumers. The survey dis-covers that the per capita volume of water decreases with in-creasing household size. The finding also shows that theamount of water used for hygiene (bathing, laundry andcleaning) purposes grows slightly with an increase in house-hold size. The consumption of water in a household for otherpurposes such as watering and cleaning the house, cooking,and dishwashing found to decrease with a larger householdsize.
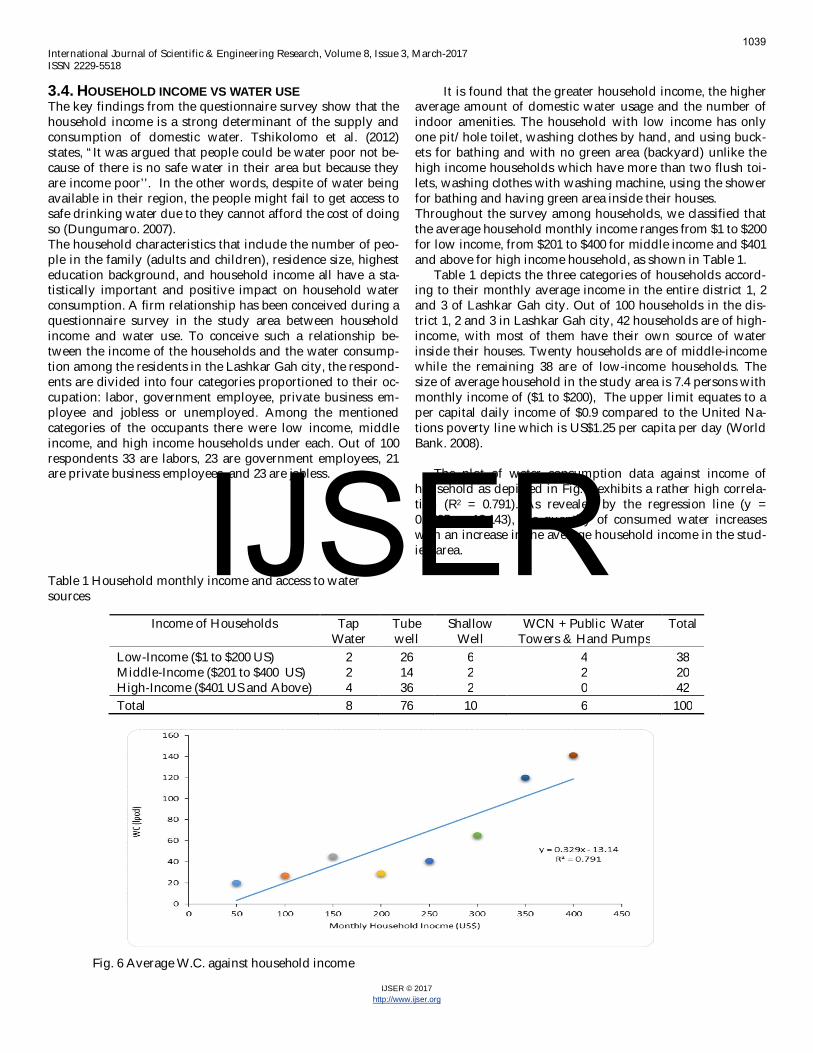
Fig. 5 shows the average per capita consumption for eachhousehold size but at a smaller scale and expresses the possi-ble impacts of the small sample size. It is reasonable to assumethat the per capita consumption can decline more consistentlywith an increase in household size. This decline of water con-sumption per capita suggests household’s uses of water fordish washing, clothes washing and water used for makingbread, cooking, and cleaning the house are minimized percapita basis in larger households. In the graph illustrated be-low, we take 1 data point as 10 scales which means that point1 on x-axis show 10 households and similarly this goes on for
1037
IJSER
International Journal of Scientific & Engineering Research, Volume 8, Issue 3, March-2017ISSN 2229-5518
IJSER © 2017http://www.ijser.org
the others.
Fig. 3 Public water tower
Fig. 5 Household size vs water consumption
Fig. 4 Household storage tank
1038
IJSER
International Journal of Scientific & Engineering Research, Volume 8, Issue 3, March-2017ISSN 2229-5518
IJSER © 2017http://www.ijser.org
3.4. HOUSEHOLD INCOME VS WATER USEThe key findings from the questionnaire survey show that thehousehold income is a strong determinant of the supply andconsumption of domestic water. Tshikolomo et al. (2012)states, “It was argued that people could be water poor not be-cause of there is no safe water in their area but because theyare income poor’’. In the other words, despite of water beingavailable in their region, the people might fail to get access tosafe drinking water due to they cannot afford the cost of doingso (Dungumaro. 2007).The household characteristics that include the number of peo-ple in the family (adults and children), residence size, highesteducation background, and household income all have a sta-tistically important and positive impact on household waterconsumption. A firm relationship has been conceived during aquestionnaire survey in the study area between householdincome and water use. To conceive such a relationship be-tween the income of the households and the water consump-tion among the residents in the Lashkar Gah city, the respond-ents are divided into four categories proportioned to their oc-cupation: labor, government employee, private business em-ployee and jobless or unemployed. Among the mentionedcategories of the occupants there were low income, middleincome, and high income households under each. Out of 100respondents 33 are labors, 23 are government employees, 21are private business employees, and 23 are jobless.
Table 1 Household monthly income and access to watersources
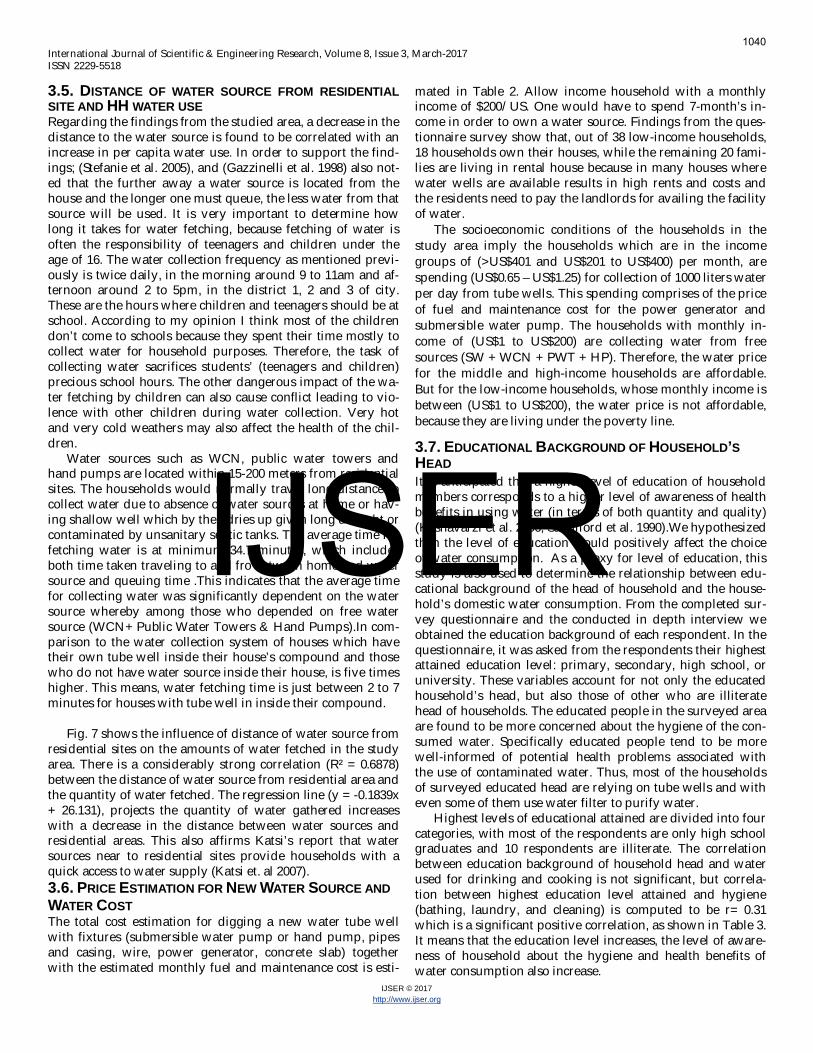
Fig. 6 Average W.C. against household income
It is found that the greater household income, the higheraverage amount of domestic water usage and the number ofindoor amenities. The household with low income has onlyone pit/hole toilet, washing clothes by hand, and using buck-ets for bathing and with no green area (backyard) unlike thehigh income households which have more than two flush toi-lets, washing clothes with washing machine, using the showerfor bathing and having green area inside their houses.Throughout the survey among households, we classified thatthe average household monthly income ranges from $1 to $200for low income, from $201 to $400 for middle income and $401and above for high income household, as shown in Table 1.
Table 1 depicts the three categories of households accord-ing to their monthly average income in the entire district 1, 2and 3 of Lashkar Gah city. Out of 100 households in the dis-trict 1, 2 and 3 in Lashkar Gah city, 42 households are of high-income, with most of them have their own source of waterinside their houses. Twenty households are of middle-incomewhile the remaining 38 are of low-income households. Thesize of average household in the study area is 7.4 persons withmonthly income of ($1 to $200), The upper limit equates to aper capital daily income of $0.9 compared to the United Na-tions poverty line which is US$1.25 per capita per day (WorldBank. 2008).
The plot of water consumption data against income ofhousehold as depicted in Fig. 6 exhibits a rather high correla-tion (R2 = 0.791). As revealed by the regression line (y =0.3295x - 13.143), the quantity of consumed water increaseswith an increase in the average household income in the stud-ied area.
Income of Households TapWater
Tubewell
ShallowWell
WCN + Public WaterTowers & Hand Pumps
Total
Low-Income ($1 to $200 US) 2 26 6 4 38Middle-Income ($201 to $400 US) 2 14 2 2 20High-Income ($401 US and Above) 4 36 2 0 42Total 8 76 10 6 100
1039
IJSER
International Journal of Scientific & Engineering Research, Volume 8, Issue 3, March-2017ISSN 2229-5518
IJSER © 2017http://www.ijser.org
3.5. DISTANCE OF WATER SOURCE FROM RESIDENTIALSITE AND HH WATER USERegarding the findings from the studied area, a decrease in thedistance to the water source is found to be correlated with anincrease in per capita water use. In order to support the find-ings; (Stefanie et al. 2005), and (Gazzinelli et al. 1998) also not-ed that the further away a water source is located from thehouse and the longer one must queue, the less water from thatsource will be used. It is very important to determine howlong it takes for water fetching, because fetching of water isoften the responsibility of teenagers and children under theage of 16. The water collection frequency as mentioned previ-ously is twice daily, in the morning around 9 to 11am and af-ternoon around 2 to 5pm, in the district 1, 2 and 3 of city.These are the hours where children and teenagers should be atschool. According to my opinion I think most of the childrendon’t come to schools because they spent their time mostly tocollect water for household purposes. Therefore, the task ofcollecting water sacrifices students’ (teenagers and children)precious school hours. The other dangerous impact of the wa-ter fetching by children can also cause conflict leading to vio-lence with other children during water collection. Very hotand very cold weathers may also affect the health of the chil-dren.
Water sources such as WCN, public water towers andhand pumps are located within 15-200 meters from residentialsites. The households would normally travel long distance tocollect water due to absence of water sources at home or hav-ing shallow well which by then dries up given long drought orcontaminated by unsanitary septic tanks. The average time forfetching water is at minimum 34.7 minutes, which includesboth time taken traveling to and fro between home and watersource and queuing time .This indicates that the average timefor collecting water was significantly dependent on the watersource whereby among those who depended on free watersource (WCN+ Public Water Towers & Hand Pumps).In com-parison to the water collection system of houses which havetheir own tube well inside their house’s compound and thosewho do not have water source inside their house, is five timeshigher. This means, water fetching time is just between 2 to 7minutes for houses with tube well in inside their compound.
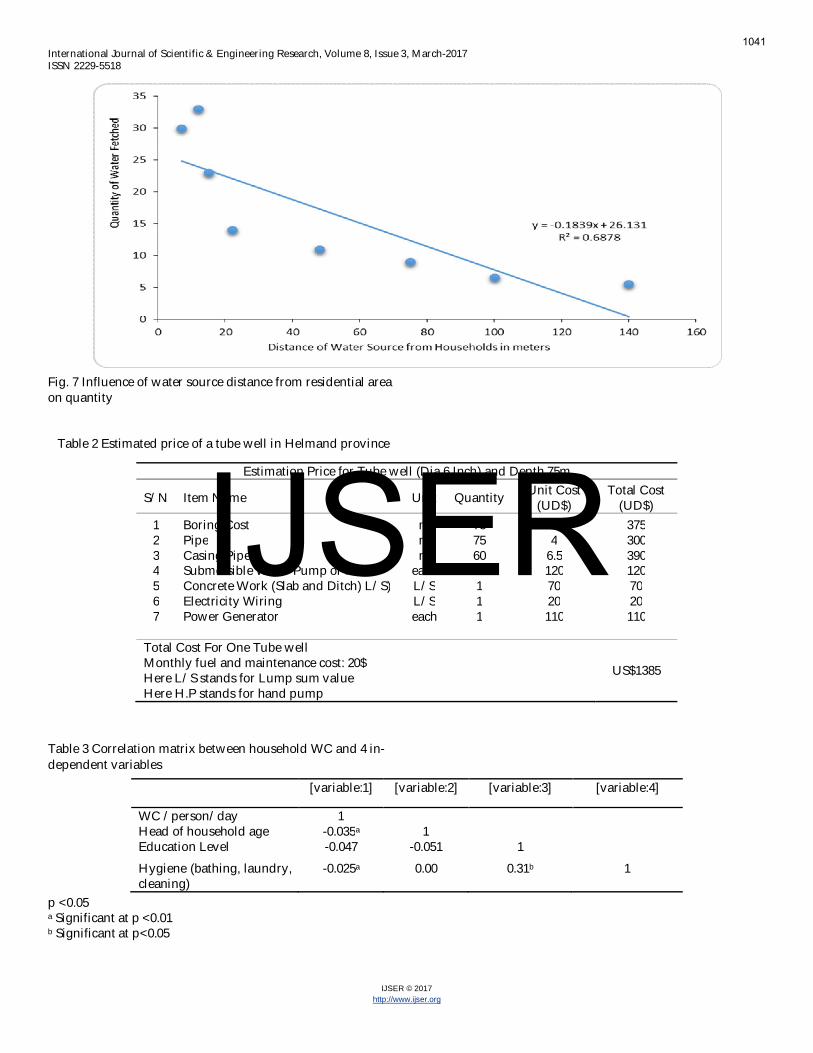
Fig. 7 shows the influence of distance of water source fromresidential sites on the amounts of water fetched in the studyarea. There is a considerably strong correlation (R² = 0.6878)between the distance of water source from residential area andthe quantity of water fetched. The regression line (y = -0.1839x+ 26.131), projects the quantity of water gathered increaseswith a decrease in the distance between water sources andresidential areas. This also affirms Katsi’s report that watersources near to residential sites provide households with aquick access to water supply (Katsi et. al 2007).3.6. PRICE ESTIMATION FOR NEW WATER SOURCE ANDWATER COSTThe total cost estimation for digging a new water tube wellwith fixtures (submersible water pump or hand pump, pipesand casing, wire, power generator, concrete slab) togetherwith the estimated monthly fuel and maintenance cost is esti-
mated in Table 2. Allow income household with a monthlyincome of $200/US. One would have to spend 7-month’s in-come in order to own a water source. Findings from the ques-tionnaire survey show that, out of 38 low-income households,18 households own their houses, while the remaining 20 fami-lies are living in rental house because in many houses wherewater wells are available results in high rents and costs andthe residents need to pay the landlords for availing the facilityof water.
The socioeconomic conditions of the households in thestudy area imply the households which are in the incomegroups of (>US$401 and US$201 to US$400) per month, arespending (US$0.65 – US$1.25) for collection of 1000 liters waterper day from tube wells. This spending comprises of the priceof fuel and maintenance cost for the power generator andsubmersible water pump. The households with monthly in-come of (US$1 to US$200) are collecting water from freesources (SW + WCN + PWT + HP). Therefore, the water pricefor the middle and high-income households are affordable.But for the low-income households, whose monthly income isbetween (US$1 to US$200), the water price is not affordable,because they are living under the poverty line.
3.7. EDUCATIONAL BACKGROUND OF HOUSEHOLD’SHEADIt is anticipated that a higher level of education of householdmembers corresponds to a higher level of awareness of healthbenefits in using water (in terms of both quantity and quality)(Keshavarzi et al. 2006; Sandiford et al. 1990).We hypothesizedthen the level of education would positively affect the choiceof water consumption. As a proxy for level of education, thisstudy is also used to determine the relationship between edu-cational background of the head of household and the house-hold’s domestic water consumption. From the completed sur-vey questionnaire and the conducted in depth interview weobtained the education background of each respondent. In thequestionnaire, it was asked from the respondents their highestattained education level: primary, secondary, high school, oruniversity. These variables account for not only the educatedhousehold’s head, but also those of other who are illiteratehead of households. The educated people in the surveyed areaare found to be more concerned about the hygiene of the con-sumed water. Specifically educated people tend to be morewell-informed of potential health problems associated withthe use of contaminated water. Thus, most of the householdsof surveyed educated head are relying on tube wells and witheven some of them use water filter to purify water.
Highest levels of educational attained are divided into fourcategories, with most of the respondents are only high schoolgraduates and 10 respondents are illiterate. The correlationbetween education background of household head and waterused for drinking and cooking is not significant, but correla-tion between highest education level attained and hygiene(bathing, laundry, and cleaning) is computed to be r= 0.31which is a significant positive correlation, as shown in Table 3.It means that the education level increases, the level of aware-ness of household about the hygiene and health benefits ofwater consumption also increase.
1040
IJSER
International Journal of Scientific & Engineering Research, Volume 8, Issue 3, March-2017ISSN 2229-5518
IJSER © 2017http://www.ijser.org
Fig. 7 Influence of water source distance from residential areaon quantity
Table 2 Estimated price of a tube well in Helmand province
Table 3 Correlation matrix between household WC and 4 in-dependent variables
p <0.05a Significant at p <0.01b Significant at p<0.05
Estimation Price for Tube well (Dia 6 Inch) and Depth 75m
S/N Item Name Unit Quantity Unit Cost(UD$)
Total Cost(UD$)
1 Boring Cost m 75 5 3752 Pipe m 75 4 3003 Casing Pipe m 60 6.5 3904 Submersible Water Pump or H.P each 1 120 1205 Concrete Work (Slab and Ditch) L/S) L/S 1 70 706 Electricity Wiring L/S 1 20 207 Power Generator each 1 110 110
Total Cost For One Tube wellMonthly fuel and maintenance cost: 20$Here L/S stands for Lump sum valueHere H.P stands for hand pump
US$1385
[variable:1] [variable:2] [variable:3] [variable:4]
WC /person/day 1Head of household age -0.035a 1Education Level -0.047 -0.051 1
Hygiene (bathing, laundry,cleaning)
-0.025a 0.00 0.31b 1
1041
IJSER
International Journal of Scientific & Engineering Research, Volume 8, Issue 3, March-2017ISSN 2229-5518
IJSER © 2017http://www.ijser.org
3.8. AGE OF HOUSEHOLD’S HEADA range of socioeconomic and demographic variables deter-mines a household’s quantity of water demand. An obviousone is occupancy and a more subtle one is occupant’s age (Foxet al. 2009). Keshavarzi et al. (2006) reported that there is apositive significant correlation (r=0.17, p<0.05) between thehead of household’s age and the amount of water used by thehousehold. This is probably the result of indifferent attitudestowards environmental issues, where an older head of a househas less grasp of the need for water preservation. Therefore,they hardly scrutinize their household’s water consumption.Nevertheless, it is found from the study area that elders arethriftier concerning the amount of water consumption espe-cially during the winter and do make it a priority the conser-vation of water. This implies instead a negative correlationbetween age of household head and the amount of water used.The factors may be the religious obligations or climate condi-tion.
3.9. WATER AND SANITATIONThe finding shows that the type and usage of toilet dependson the income of households in district 1, 2 and 3 of LashkarGah city. 10. 66% of household are using hand flush toilets,coincide with the middle income household. The 11% of thehigh-income households were utilizing flushed toilets and23% of low-income households are using pit/hole latrine.
4. CONCLUSION AND FUTURE RECOMMENDATION
4.1. CONCLUSIONSIt is obvious that understanding domestic water consumptionand factors which affect residential water demand and choiceof water source are vital for some planning purposes in theAfghanistan’s water supply sector. The main objective of thisstudy is to investigate and assess the current condition of do-mestic water supply system and drinking water consumptionin district 1, 2 and 3 of Lashkar Gah city.In order to achieve the objectives and know the condition ofexisting domestic water supply system and water consump-tion in district 1, 2 and 3 of Lashkar Gah city, combination ofdistribution of questionnaire and in-depth interview conduct-ed with water consumers in the three districts.
Currently the public water utilities constitute only 8percent of drinking water supply in Lashkar Gah city. Theremaining 92 percent drinking water supply is being relayedthrough other water sources like private tube wells (PTW),shallow well (SW), and collection of water from neighbors(NWC). A small percentage of poor households travel be-tween 20 to 140 meters a day for clean water collection there-fore, the wealthier households have greater access to cleanwater vice versa
Therefore, a medium correlation (R2 = 0.6878) wasfound between the distance of water source and quantity ofwater fetched, and a significant positive correlation was foundbetween household monthly income and water consumption.Two types of households were found during the study in thearea, single and multiple households. The study discovers that
the per capita volume of water consumed decreases with anincrease of household’s size. Digging a new water source liketube well normally costs US$1405, which is unaffordable forhouseholds living under the poverty line, i.e. with per capitaper day US$ 1.25. Another pair of variables of interest to thisstudy is between education level of the leader of householdand the households’ domestic water consumption. House-holds’ whose heads are highly educated, are more carefulabout the use of water for hygiene. Specifically educated peo-ple tend to be better informed of potential health problemsassociated with the use of unimproved water.
The findings show that the type and usage of toilet dependson the income of households in district 1, 2 and 3 of LashkarGah city. Out of 100 surveyed households, 66 households fallunder the category of middle income use hand flush toilet. All11 high-income respondents utilize flushed toilet and 23households of low-income rely on pit/hole latrine
4.2. FUTURE STUDY AND RECOMMENDATIONSThis study was carried out in district 1, 2 and 3 of Lashkar Gahcity of Helmand province. It will be great if in the future, asimilar study (survey for water consumption) can be carriedout covering the remaining 5 districts of the city. The surveywas conducted in the period of January 2014 to April 2014,while the water consumption can change in the other monthsof the year; therefore, it is also strongly suggested if the surveycould be conducted on periodic basis throughout the year.This study covers just the domestic water consumption pat-terns; it could be helpful if the quality of water for chemicaland physical parameters are also analyzed in the area.
ACKNOWLEDGMENTSI would like to express my deepest gratitude and owe mydeepest appreciation to the guidance and advice I have bene-fited from my supervisor, Dr. Muhammad Mukhlisin and myother lecturer, Assoc. Prof. Dr. Ahmed Hussein El-Shafieesince the beginning of the project. It is an honor for me to ex-press my gratitude to the Ministry of Higher Education of Af-ghanistan for their scholarship that has supported me finan-cially. I also would like to thank the leadership of HelmandUniversity for their encouragement and academic supportduring this study. I would like to thank the people of district1, 2 and 3 of Lashkar Gah city of Helmand province for theirassistance regarding to participating in the questionnaire sur-vey and giving their precious time for answering the questionsand face to face interview. This study would not worth with-out their cooperation.
1042
IJSER
International Journal of Scientific & Engineering Research, Volume 8, Issue 3, March-2017ISSN 2229-5518
IJSER © 2017http://www.ijser.org
1. References2. Cullather, N. 2002. Damming Afghanistan: moderni-
zation in a buffer state.The Journal of American His-tory, 89(2), 512-537.
3. DFID 1998. Guidance Manual on Water Supply andSanitation Programs. Farrington, J., Carney, D., Ash-ley, C. and Turton, C. (1999) Sustainable Livelihoodsin Practice: Early Applications of Concepts in RuralAreas.
4. Dharmaratna, D. and E. Harris. 2010. Estimating Res-idential Water Demand Using the Stone-Geary Func-tional Form: the Case of Sri Lanka
5. Dungumaro, E.W. (2007). Socioeconomic Differentialsand Availability of Domestic Water in South Africa.Physics and Chemistry of the Earth 32, 1141 – 1147
6. Fox, C., McIntosh, B.S. & and Jeffrey, P. 2009. Classify-ing Households for Water Demand Forecasting UsingPhysical Property Characteristics
7. Gazzinelli A, Souza MCC, Nascimento I et al1998. Domestic water use in a rural village in Mi-nas Gerais, Brazil, with an emphasis on spatial pat-terns, sharing of water, and factors in water use
8. ICMA CAWSA. (International City/County Man-agement Association Commercialization of Afghani-stan Water and Sanitation Activity
9. Katsi, L., Siwadi, J., Guzha, E., Makoni, F.S. & Smits,S. 2007. Assessment of Factors which Affect MultipleUses of Water Sources at Household Level in RuralZimbabwe – A Case Study of Marondera, Murehwaand Uzumba Maramba Pfungwe Districts
10. Keshavarzi AR, Sharifzadeh M, Haghighi AAK etal (2006). Rural domestic water consumption be-havior: a case study in Ramjerd, Fars province, I.R.Iran.
11. Kohlmann. 2003. What Is Ph, and How Is It Measured(A Technical Handbook for Industry
12. Lashkar Gah Municipality 2014. Hard Copy of annualreport
13. Nyong AO, Kanaroglou PS. 1999. Domestic water usein rural semiarid Africa: a case study of Katarko vil-lage in the Northeastern Nigeria. Hum Ecol 27(4):537-555
14. Parliamentary Commissioner for the Environment.2000. Ageing Pipes and Murky Waters-Urban watersystem issues for the 21st century. Wellington, Par-liamentary commissioner for the Environment, June2000
15. Punmia et al. 1995. Water supply engineering, secondedition, 1995, ISBN: 978-81-318-0703-3
16. Qureshi, 2002. Water Resources Management in Af-ghanistan: The Issues and Options Yamane (1973). Ta-ro Yamane formula (1973) calculation of sample size.
17. Sandiford P, Gorter AC, Orozco JG, Pauw JP 1990.Determinants of domestic water use in rural Nicara-gua.
18. Stefanie, E, Iskandarani, M, and Useche, M.P (2005)Improved Water Supply in the Ghanaian Volta Ba-sin:Who Uses it and Who Participates in Commu-nity Decision-Making
19. Tshikolomo et al. 2012. Water Supply and Require-ments of Households in the Luvuvhu-Letaba WaterManagement Area of South Africa, 2012
20. UNICEF AND World Health Organizaiton, 2008.Progress on drinking water and sanitation. ISBN 97892 806 4313 8
21. United Nations Economic and Social Council. 2003.General Document E/C.12/2002/11, Committee oneconomic, social and cultural rights, Geneva, 11-29Nov. 2002.
22. WHO (World Health Organization)/UNICEF (UnitedNations Children’s Fund). 2010. Progress on Sanita-tion and Drinking-Water: 2010 Update. Joint Monitor-ing Programmer for Water Supply and Sanitation.
23. World Bank. 2008. World Development Indicators.World Bank Key Development Data and Statistics
24. WWAP (World Water Assessment Programme). 2012.The United Nations World Water Development Re-port 4: Managing Water under Uncertainty and Risk.Paris, UNESCO.
1043
IJSER