methodology for deriving the series on domestic private ... · domestic private final consumption...
TRANSCRIPT
Methodology for Deriving the Domestic Private Final Consumption
Expenditure Series of Malaya, 1900-1939
Raja Nazrin Asia-Europe Institute University of Malaya
XIV International Economic History Congress
Helsinki
August 21-25, 2006
Session 103
New Experiences with Historical National Accounts: Methodologies and Analysis
Methodology for Deriving the Domestic Private Final Consumption Expenditure Series of Malaya, 1900-1939
1. Introduction 1 2. Past Estimates of Malaya's PFCE 2 3. Methodology 3 3.1. Direct Approach
a) Opium/Chandu 6
b) Health 6
c) Education 7
d) Utilities 7
e) Passenger transport (rail and ferry) 7 3.2. Indirect Approach Step 1: Population and Consumption Standards 8 i) Estimating Population of Malaya for 1900-39 8 ii) Consumption Standards 10 Step 2: Estimating per capita consumption expenditure of major objects of
consumption and standards in current prices for selected years 13
a) The European Standard 13 b) The Eurasian / Asiatic Clerical Standards 14
c) The Indian Labour Standard 14
d) The Malay and Chinese Labour Standards 16 i) Food 16 ii) Tobacco, Clothing and Rent 16 Step 3: Consumer Price Indices of Major Objects of Consumption, 1900–39 19 Step 4: Estimating the per capita final consumption expenditure of major objects
of consumption and standards in 1914 prices for selected years 22
Step 5: The Real Wage Index, 1900-39 23 The Wage Rate Series, 1900-14 23 a) The Agriculture Sector b) The Non-agriculture Sector
I

The Wage Rate Series, 1914-39 24 a) The Agriculture Sector b) The Non-agriculture Sector
Weights for Computing Nominal Wage Index, 1900-39 24 Steps 6-
11: Deriving Total Private Final Consumption Expenditure in Constant and Current Prices, 1900-39 (excluding miscellaneous expenditure)
26
Estimating Miscellaneous Items of Expenditure 29 4. Estimates of Total Private Final Consumption Expenditure 29 5. Observations and Concluding Remarks 35
Appendices
1. Brief Notes on the Conventional Methods of Estimating Private Consumption Expenditure
40
1. Direct Method (Household Expenditure Survey) 40 2. Commodity Flow Approach 41 3. Retail Valuation Method 42 4. Retail Sales Method 43 2. Population by Consumption Standard, Malaya, 1900-39 45 3. Estimates of Price Indices for Major Objects of Consumption and
Consumption Standards, Malaya, 1915-17 and 1939 46
◆ Food Price Indices for Asiatic Clerical Standard (1915-17 and 1939) 46 ◆ Food Price Indices for European and Eurasian Clerical Standards (1915-17 and
1939) 47
◆ Tobacco Price Index for All Standards (1915-17 and 1939) 48 ◆ Tobacco and Beverages Price Index for European Standard (1915-17 and 1939) 48 ◆ Clothing Price Index for All Standards (1915-17 and 1939) 49 ◆ Servant Price Index for Asiatic and Eurasian Clerical, and European Standards
(1915-17 and 1939) 49
◆ Transport Price Index for European, Asiatic and Eurasian Clerical Standards (1915-17 and 1939)
50
◆ Rent Price Index for Asiatic and Eurasian Clerical, and All Labour Standards (1915-17)
51
◆ Rent Price Index for European Standard (1915-17) 52 ◆ Rent Price Indices for All Standards (1939) 52
II
◆ Clubbing Price Index for the European Standard (1915-17 and 1939) 53 ◆ Summary of Price Indices of Major Objects of Consumption and Consumption
Standards, 1914-39 54
◆ Price Indices by Consumption Standard and Major Object of Consumption, (1914=100)–Malaya, 1914-39
55
4. Estimates of Price Indices for Major Objects of Consumption and
Consumption Standards, Malaya, 1900-14 56
◆ Food Price Indices and Weights for Food Items (1900-14) 57 ◆ Tobacco Price Index (1900-14) 62 ◆ Alcoholic Drink Price Index for European Standard (1900-14) 62 ◆ Tobacco and Beverages Price Index for European Standard (1900-14) 63 ◆ Clothing Price Index (1900-14) 63 ◆ Servants Price Index for European, Asiatic and Eurasian Clerical Standards
(1900-14) 64
◆ Transport Price Index for European, Asiatic and Eurasian Clerical Standards (1900-14)
64
◆ Rent Price Indices for All Standards (1900-14) 65 ◆ Clubbing Price Index for European Standard (1900-14) 65 ◆ Summary of Price Indices of Major Objects of Consumption and Consumption
Standards, 1900-14 65
◆ Price Indices by Consumption Standard and Major Object of Consumption, (1914=100)–Malaya, 1900-14
66
5. Summary – General Method of Computing CPI for Malaya, 1900-39 67
6. Computation of Consumer Price Indices by Major Object of Consumption (1914=100)-Malaya, 1914-39
68
7. Computation of Consumer Price Indices by Major Object of Consumption (1914=100)-Malaya, 1900-14
70
8. Total Private Final Consumption Expenditure by Major Object of Consumption and Standard in Current and Constant Prices, Malaya, 1900-39
73
9. Percentage Composition of Private Final Consumption Expenditure by Major Object of Consumption in Current Prices, Malaya (Selected Years)
76
10. Share (%) of Food, Beverages and Tobacco Consumption in Total Private Final Consumption Expenditure, Malaya and Selected Countries (Current Prices), 1900-39
77
11. Growth Rates (%) of Private Final Consumption Expenditure (Current Prices), Malaya and Selected Countries, 1900-39
78
Bibliography 79
III

Methodology for Deriving the Domestic Private Final Consumption
Expenditure Series of Malaya, 1900-1939*
Raja Nazrin
Asia-Europe Institute University of Malaya
1. Introduction
This paper presents the methodology employed in constructing the private final
consumption expenditure (PFCE) series of Malaya1 for the period 1900–39. It provides
details on how population estimates of different consumption standards 2 and their per
capita consumption are arrived at. In addition, the paper describes the use of income
elasticities of demand for the estimation of major objects of consumption, the
construction of consumer price indices and the estimation of nominal and real
household incomes and their movements over time. Finally, the paper explains how
these variables are combined to arrive at the PFCE series for 1900 – 39.
At this juncture, it is perhaps appropriate to define PFCE. Private final
consumption expenditure in the domestic market is the total value of the final
* This paper is very much a collaborative undertaking. I am grateful to the following colleagues at the Asia-Europe Institute for assistance: Professor Shaharil Talib (former Executive Director), Dr. Tan Eu Chye (Department of Economics), Gnasegarah Kandaiya, Harbans Singh and Ichiro Sugimoto. The research assistants at the AEI helped to assemble the data. Professor Riitta Hjerppe and Professor Thomas Lindblad made many helpful suggestions that greatly improved the paper. All remaining errors are mine. I would like to thank Dr. Pierre van der Eng for inviting me to the workshop. 1 There was no such entity as Malaya (Federation of Malaya) in existence during this period. Malaya, for purposes of this paper, comprise the Straits Settlements territories of Penang, Malacca and Dindings; the Federated Malay States of Perak, Selangor, Negeri Sembilan and Pahang and finally the states of Johore, Kedah, Perlis, Kelantan and Trengganu which came to be known as the Unfederated Malay States. 2 They comprise the Malay, Chinese and Indian labour standards, Asiatic and Eurasian clerical standards and the European standard.
1
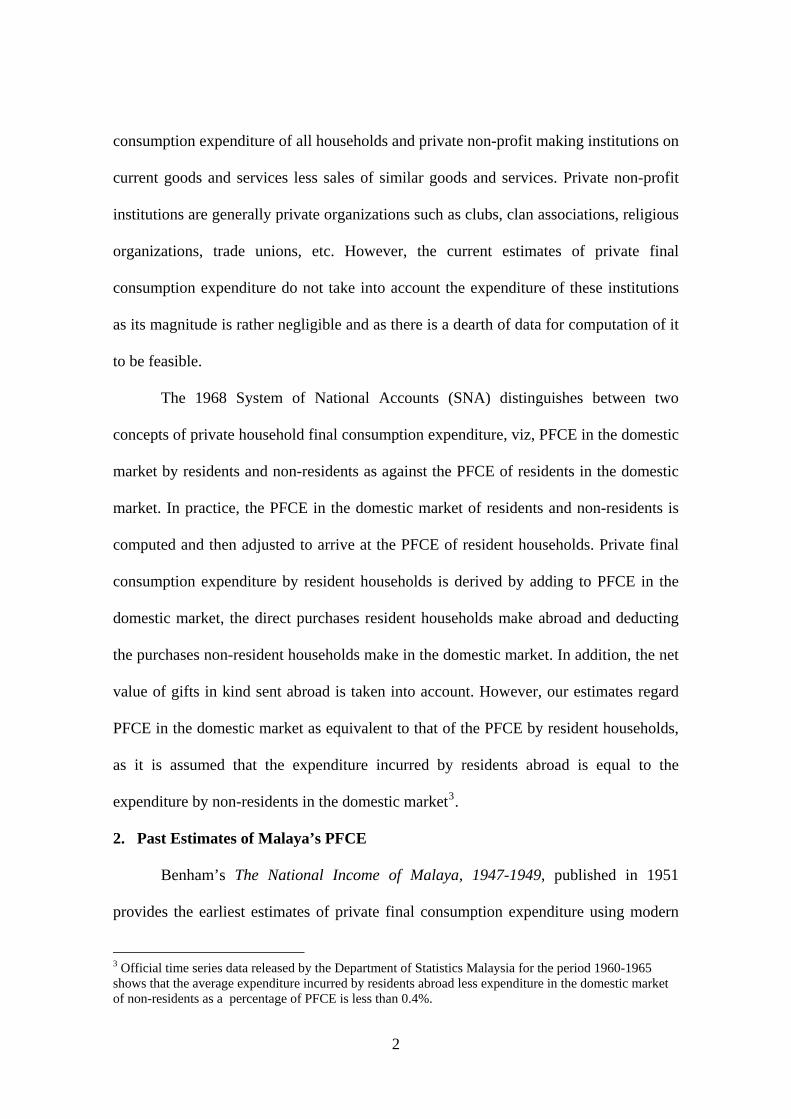
consumption expenditure of all households and private non-profit making institutions on
current goods and services less sales of similar goods and services. Private non-profit
institutions are generally private organizations such as clubs, clan associations, religious
organizations, trade unions, etc. However, the current estimates of private final
consumption expenditure do not take into account the expenditure of these institutions
as its magnitude is rather negligible and as there is a dearth of data for computation of it
to be feasible.
The 1968 System of National Accounts (SNA) distinguishes between two
concepts of private household final consumption expenditure, viz, PFCE in the domestic
market by residents and non-residents as against the PFCE of residents in the domestic
market. In practice, the PFCE in the domestic market of residents and non-residents is
computed and then adjusted to arrive at the PFCE of resident households. Private final
consumption expenditure by resident households is derived by adding to PFCE in the
domestic market, the direct purchases resident households make abroad and deducting
the purchases non-resident households make in the domestic market. In addition, the net
value of gifts in kind sent abroad is taken into account. However, our estimates regard
PFCE in the domestic market as equivalent to that of the PFCE by resident households,
as it is assumed that the expenditure incurred by residents abroad is equal to the
expenditure by non-residents in the domestic market3.
2. Past Estimates of Malaya’s PFCE
Benham’s The National Income of Malaya, 1947-1949, published in 1951
provides the earliest estimates of private final consumption expenditure using modern
3 Official time series data released by the Department of Statistics Malaysia for the period 1960-1965 shows that the average expenditure incurred by residents abroad less expenditure in the domestic market of non-residents as a percentage of PFCE is less than 0.4%.
2

concepts of national income accounting. In 1955, the World Bank (IBRD) produced a
report, The Economic Development of Malaya, which included PFCE estimates for
years 1949-53. But Benham’s estimates of PFCE for 1947–49 and the World Bank’s
estimates for 1949-53 were on a Pan-Malayan basis, which comprised the then
Federation of Malaya (present-day Peninsular Malaysia) and the then Crown Colony of
Singapore. No attempt was made in these studies to isolate the Malayan share from the
Pan-Malayan series. The first official estimates of PFCE in current prices for Peninsular
Malaysia (Malaya) for the period 1955-59 can only be found in Dorothy Walters' Report
on the National Accounts of the Federation of Malaya.4 Since then, PFCE in current
and constant prices have been regularly computed by the Department of Statistics
Malaysia (DOS).
3. Methodology
The absence of household expenditure surveys during the period under review
and the paucity of data preclude the use of the commodity flow, retail valuation and
retail sales methods (see Appendix 1 for a brief description of these methods).
Consequently, two approaches, dubbed as the direct approach and the indirect approach
have been used in combination herein to construct the PFCE series in constant and
current prices as illustrated in Figure 1. The direct approach was used wherever basic
data was generally available from official records. On the other hand, the indirect
approach was employed in instances where data was virtually non-existent.
Data on private final consumption expenditure on opium/chandu, education,
health, utilities and passenger transport (rail and ferry) was compiled for each year using
4 Dorothy Walters pioneered the construction of the national accounts of the Federation of Malaya.
3
4
the direct approach. Expenditure data on food and groceries, beverages and tobacco,
clothing, rent, domestic servants, passenger transport (other than rail and ferry) , clubs,
and other miscellaneous household expenditure was compiled using the indirect
approach. Summing up the consumption expenditure from these two approaches gives
us the total PFCE in both current and constant prices.

5
Figure 1: Flow Chart on the Construction of Private Final Consumption Expenditure in the Domestic Market-Malaya, 1900-39
Population /Consumption
Standards
IndirectApproach
1. Food and Groceries
2. Beverages and Tobacco
3. Clothing
4. Rent
5. Domestic Servants(Asiatic and EurasianClerical Standards andEuropean Standard only)
6. Passenger Transportother than rail and ferry(Asiatic and EurasianClerical Standards andEuropean Standard only)
7. Clubs (EuropeanStandard only)
Malay LabourStandard
EuropeanStandard
EurasianClericalStandard
AsiaticClericalStandard
Indian LabourStandard
ChineseLabour
Standard
Real WageIndex
(1914=100)
Per capita Private FinalConsumption
Expenditure of MajorObjects of Consumptionand Standards in 1914
prices
(1) (2)
Private FinalConsumption
Expenditure inDomesticMarket in
Current Prices
Per capitaConsumption
Expenditure ofMajor Objects ofConsumption and
Standards inCurrent Pricesfor Selected
Years
Income Elasticities ofDemand by Major Object ofConsumption and Standard
(Food =0.8)(Beverages and Tobacco =1.0)(Clothing =1.0)(Rent = 0.8)(Transport =1.0)(Domestic Servants =1.0)
(Club 1.0)
(6) (7)Consumer PriceIndices of Major
Objects ofConsumption(1914=100)
(5)Inflate real PFCEof Major Objectsof Consumptionby Price Indices
(1914 =100)
(3) (4)Per capita FinalConsumption
Expenditure ofMajor Objects ofConsumption andStandards in 1914
Prices for SelectedYears
(9)=(7) x (8)Population
Numbers byConsumption
Standard
(8)Private FinalConsumptionExpenditure
by MajorObject of
Consumptionand Standardin 1914 prices
(10)
Direct Approach (Current Prices)1. Opium / chandu2. Health3. Education4. Utilities5. Passenger Transport (rail and ferry)
Miscellaneous
1900-39 Series
1900-39 Series
1900-39 Series
1900-39 Series
1900-39 Series
1900-39 Series1930
1930
1930
(11)
1936
1936
1933
Note: It is assumed that the expenditure incurred by residents abroad is equal to the expenditure by non-residents in the domestic market.
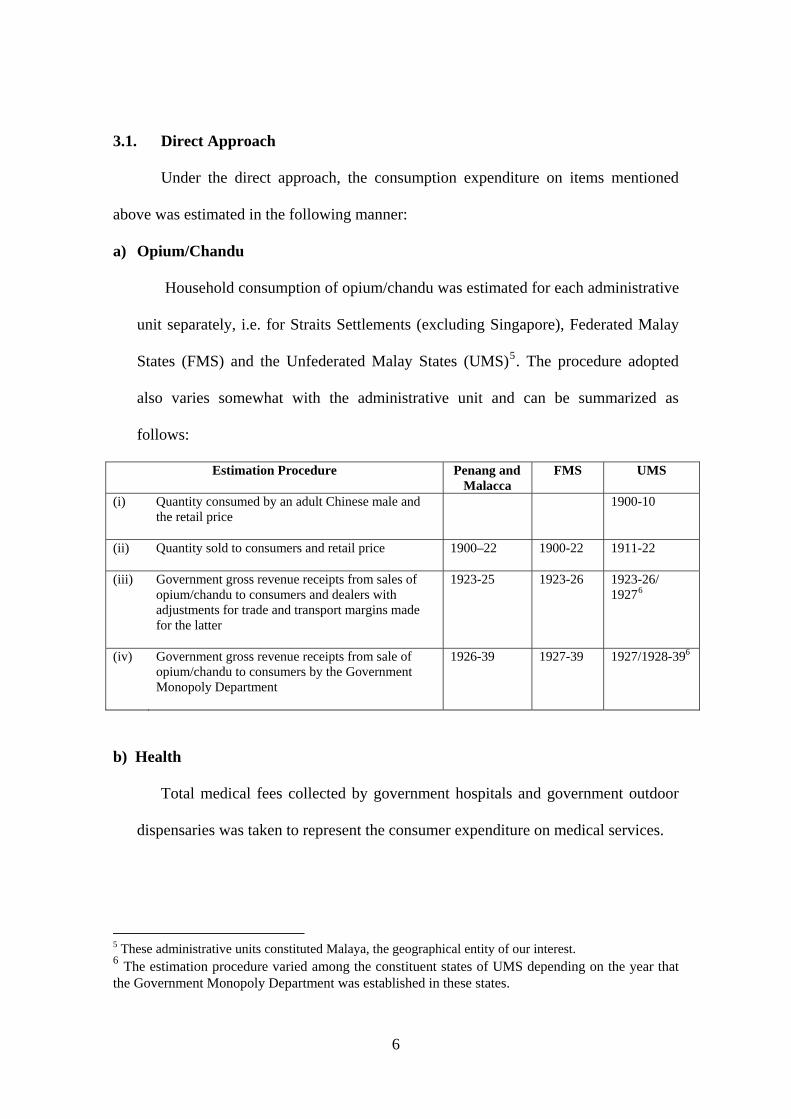
3.1. Direct Approach
Under the direct approach, the consumption expenditure on items mentioned
above was estimated in the following manner:
a) Opium/Chandu
Household consumption of opium/chandu was estimated for each administrative
unit separately, i.e. for Straits Settlements (excluding Singapore), Federated Malay
States (FMS) and the Unfederated Malay States (UMS)5. The procedure adopted
also varies somewhat with the administrative unit and can be summarized as
follows:
Estimation Procedure Penang and Malacca
FMS UMS
(i) Quantity consumed by an adult Chinese male and the retail price
1900-10
(ii) Quantity sold to consumers and retail price
1900–22 1900-22 1911-22
(iii) Government gross revenue receipts from sales of opium/chandu to consumers and dealers with adjustments for trade and transport margins made for the latter
1923-25 1923-26 1923-26/ 19276
(iv)
Government gross revenue receipts from sale of opium/chandu to consumers by the Government Monopoly Department
1926-39 1927-39 1927/1928-396
b) Health
Total medical fees collected by government hospitals and government outdoor
dispensaries was taken to represent the consumer expenditure on medical services.
5 These administrative units constituted Malaya, the geographical entity of our interest. 6 The estimation procedure varied among the constituent states of UMS depending on the year that the Government Monopoly Department was established in these states.
6

c) Education
Total school fees collected by government was taken to represent the private final
consumption expenditure on education.
d) Utilities
Revenue collected from households by electricity and water boards was taken as the
final consumption expenditure on utilities. For years for which such data was not
available, estimates were made based on the pattern of revenue collected for states
with similar levels of development in terms of the availability of electricity / water
supply facilities.
e) Passenger transport (rail and ferry)
Expenditure on passenger transport (rail and ferry) was estimated based on the
revenue collected by the Railway Department. The revenue collected in part could
be ascribed to PFCE while a certain portion to expenditure incurred as part of
intermediate inputs by industries and producers of government services. Due to the
dearth of data that could identify the expenditure incurred by the various end-users
of these services, apportioning to each of them was not possible. The total revenue
collected was therefore assigned to PFCE since the bulk of the revenue collected
would have been expenditure incurred by households for their own use.
3.2. Indirect Approach
The indirect approach in this paper essentially involves estimating private final
consumption expenditure on major consumption objects of each consumption standard.
This approach requires as inputs information pertaining to population of each
consumption standard, per capita consumption of each major object of consumption of
7
each consumption standard, consumer price indices, real wage index and income
elasticities of demand. The procedure shown in Figure 1 earlier involved the following
steps.
Step 1: Population and Consumption Standards
i) Estimating Population of Malaya for 1900-39
During this period, population census data was only available for 1901, 1911,
1921 and 1931. The geographical coverage, however, was not uniform across these
censuses. The census for 1901 covered only the FMS and the SS while the census for
1911 covered FMS, SS and a part of UMS (excluding Trengganu and Kelantan). For
1921 and 1931, information was available with respect to all the territories constituting
Malaya. Within the SS category, figures in respect of the Settlement of Singapore7 were
consistently isolated from the total to ensure that the estimates related to Malaya and not
British Malaya.
It was noted that population censuses were conducted either in the months of
March or April. However, it has been assumed that the data pertain to January 1 of the
corresponding year. It was felt that this procedure would largely neutralize the
phenomenon of under-counting of the population in the census years. The data for mid-
year (30 June) was then obtained by averaging the beginning-year population of two
consecutive years.
An attempt was then made to derive inter-censal year figures from the census
data. For each of the inter-censal years, information was generally available on births,
deaths, arrivals and departures. In the first stage, the annual inter-censal population
figures were computed by calculating the natural increase (i.e. excess of births over
7 Settlement of Singapore included Singapore, Labuan, Cocos-Keeling Islands and Christmas Island.
8

deaths). In cases where birth and death figures were not available, assumptions were
made that in general, a crude birth rate of 36 and a crude death rate of 26 per thousand
population prevailed. A review of a whole lot of evidence strongly suggested that these
were the most acceptable figures.
The second stage took into consideration data related to net immigration into
British Malaya. The difference between arrival and departure figures represents net
immigration. The arrival and departure data available was as follows. With respect to
the Chinese, arrival and departure information was available for the entry/exit points at
Singapore, Penang and Malacca. For Indians, information on both arrivals and
departures through the port of Penang was available. Thus, it was assumed that all
Indian arrivals and departures took place only via Penang. The first step was then to
calculate the net immigration of the Chinese at the three ports of Singapore, Penang and
Malacca. To this figure was added the figure of net immigration of the Indians at the
port of Penang. The figures thus obtained pertains to total net immigration into British
Malaya. The 1947 Population Census also provided some additional information on net
immigration into British Malaya for the years 1931 to 1939. This information has also
been factored into the estimates.
The figures of natural increase were then added to the net immigration figures to
derive the total population of British Malaya for each of the inter-censal years. With a
view to test the broad validity of the inter-censal population estimates thus derived, the
census population figures were compared with those based on inter-censal population
estimate for the same year. The difference between these two figures, usually termed as
“error of closure”, was considerable. For example, the 1921 inter-censal population
estimate was far in excess of the 1921 census figure. Since the census figures must be
9

given more credence than inter-censal estimates, the inter-censal figures were then
adjusted to bring them in line with the census figures. There was strong evidence to
suggest that the data on net immigration was extremely weak compared to the data on
births and deaths.8 It was therefore decided that the net immigration figures should be
adjusted rather than the birth and death figures for all inter-censal years.
The next step was to isolate the population of the Settlement of Singapore from
the total for British Malaya to obtain the population figures of Malaya for each of the
years 1900–39. Fortunately, it was easy to do so because the population figures for the
Settlement of Singapore were available. By deducting the Singapore figures from the
British Malayan figures, the population estimates of Malaya (residents and non-
residents) were thus arrived at.
ii) Consumption Standards
It is generally accepted that significant differences exist in the consumption
levels and expenditure patterns amongst different ethnic groups, between rural and
urban areas and amongst households of different occupational / income groups.
Consequently, in constructing the household final consumption expenditure series, an
attempt was made to take these differences in population characteristics into account.
To this end, Malaya’s annual population figures were decomposed into six different
consumption standards, namely the Malay labour standard, Chinese labour standard,
Indian labour standard, Asiatic clerical standard,9 Eurasian clerical standard and the
European standard. Inclusion in a particular standard was determined primarily by
ethnicity and also by occupation. For example, it was assumed that Eurasian manual
8 The arrival and departure figures were mere departmental records and not genuine migration statistics as has been alluded to in the 1947 Population Census Report. 9 Asiatic clerical standard encompasses Malay, Chinese and Indian clerical standards.
10

workers followed the lifestyle of their Indian counterparts, that Europeans irrespective
of occupation had a single consumption standard, that non-Europeans holding
professional/managerial positions shared the lifestyle of the Europeans, that other
Malayan manual workers adhered to the Malay, Chinese and Indian manual workers
lifestyle. It was also assumed that Malay, Chinese and Indian clerical workers followed
the lifestyle of Asiatic clerical workers. This classification scheme was then used
alongside information provided in population censuses to establish the number of
persons belonging to each standard. Figures for inter-censal years were obtained by
interpolation.
Altogether, four census years are involved that generally correspond with the
availability of data on the total number employed by occupation and by ethnic group in
the different administrative units of Malaya. Those years include 1901, 1911, 1921 and
1931. In this exercise, occupations were first classified into three, namely professional /
managerial, clerical and the related, and manual. This classification scheme was then
used alongside the information on ethnicity to establish the total number of persons
employed according to the various consumption standards mentioned above.
The percentage breakdown of the total number of employed into the different
consumption standards thus derived was then relied upon as a basis for estimating the
total number of persons (residents and non-residents) of different consumption
standards in Malaya. For example, if it is found that 2% of the total employed in 1931
belonged to the European consumption standard, then the total number of persons in
Malaya that correspond with this standard is established as 2% of the total Malayan
population during that year.
11

For intercensal years, the decomposition exercise was carried out based on
approximations from census years as no breakdown figures on employment were
available for those years. Hence, 1901 has been used as the reference year for the period
1900-10, 1911 for 1911-20, 1921 for 1921-30 and 1931 for 1931–39. However, data of
1901 and 1911 were not as complete as those of other census years. For 1901, data on
the total employed by occupation and by ethnic group were only available in respect of
the Federated Malay States. Thus it was assumed that the distribution of the total
employed in Kedah and Perlis across the different consumption standards in 1901
corresponds with the 1911 distribution pattern whilst in the case of Penang, Malacca,
Kelantan and Trengganu the 1901 distribution pattern was assumed to be the same as
that of 1921. In the case of Johore, it was assumed that its 1901 distribution pattern was
akin to that of Kedah and Perlis in 1911. As for 1911, data on the total number
employed by occupational and ethnic dimensions was only available in respect of the
Federated Malay States, Kedah and Perlis. Hence for Penang, Malacca, Johore,
Kelantan and Trengganu, the 1911 distribution pattern was assumed to be similar to that
of 1921.
Appendix 2 lists out the six consumption standards based on the above-
mentioned ethnicity-employment (occupational) data. Refinements were made on
numerous occasions to the data obtained from source documents when it was felt that
the number of persons of a specific ethnic group reported for a particular occupational
category was incredibly large. For instance of the total Malay employed as accountants
and bookkeepers, it would be deemed that not all of them were actually in the
professional/managerial category and thus were adopting the European lifestyle. Instead,
it would be assumed based on local knowledge that only a certain percentage of them
12
actually fell in the professional/managerial category (European standard) while the rest
were in the clerical category (Asiatic clerical standard).
Step 2: Estimating per capita consumption expenditure of major objects of consumption and standards in current prices for selected years
The second step involved the determination of the annual consumption
expenditure of a “representative” individual of each of the six standards. The
methodology involved for estimating the per capita consumption expenditure on major
objects of consumption of the various consumption standards may be described as
follows:
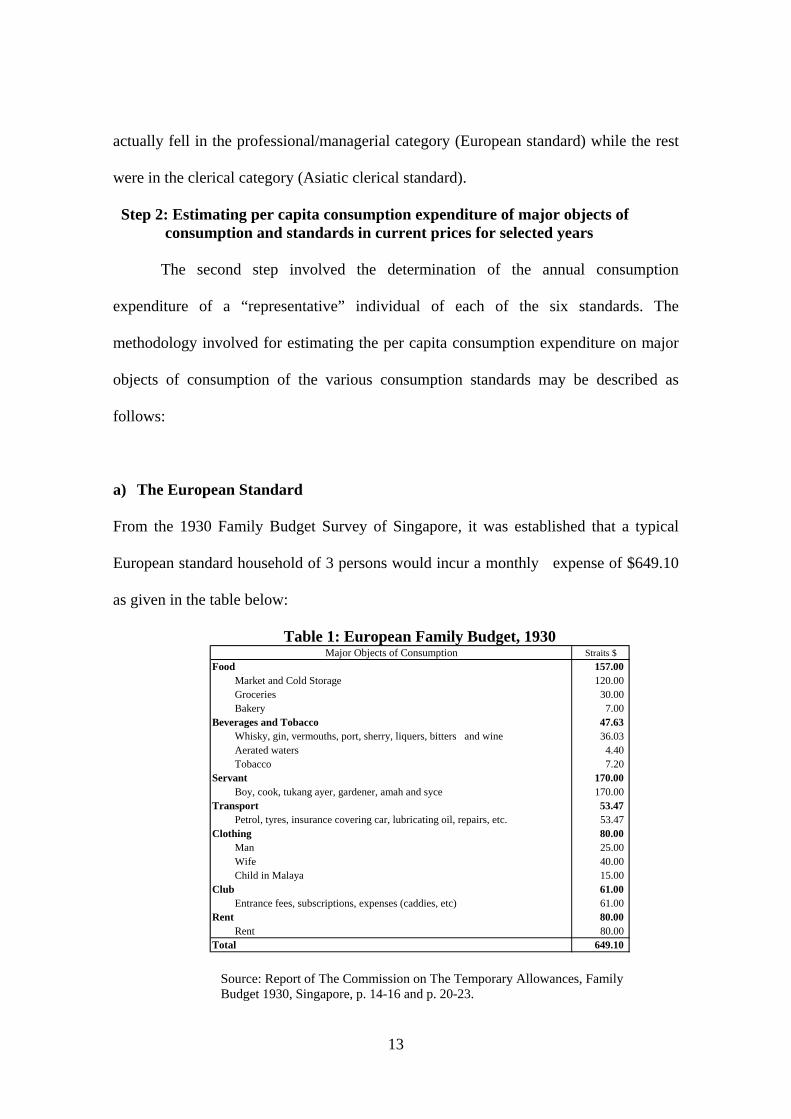
a) The European Standard
From the 1930 Family Budget Survey of Singapore, it was established that a typical
European standard household of 3 persons would incur a monthly expense of $649.10
as given in the table below:
Table 1: European Family Budget, 1930 Straits $
Food 157.00 Market and Cold Storage 120.00 Groceries 30.00 Bakery 7.00
Beverages and Tobacco 47.63 Whisky, gin, vermouths, port, sherry, liquers, bitters and wine 36.03 Aerated waters 4.40 Tobacco 7.20
Servant 170.00 Boy, cook, tukang ayer, gardener, amah and syce 170.00
Transport 53.47 Petrol, tyres, insurance covering car, lubricating oil, repairs, etc. 53.47
Clothing 80.00 Man 25.00 Wife 40.00 Child in Malaya 15.00
Club 61.00 Entrance fees, subscriptions, expenses (caddies, etc) 61.00
Rent 80.00 Rent 80.00
649.10
Major Objects of Consumption
Total
Source: Report of The Commission on The Temporary Allowances, Family Budget 1930, Singapore, p. 14-16 and p. 20-23.
13

The above figure ($649.10) excludes expenditure on consumption items (e.g.
education and utilities) that has already been estimated via the direct approach. This
European budget also excludes consumption of a non-resident family member. Not
included also is the miscellaneous expenditure which would be taken into account only
at the final stages in the computation of PFCE of all standards.
For purposes of this exercise, the household expenditure pattern of the European
standard in Malaya was assumed to be similar to that in Singapore. However, in
addition, it was assumed that a Malayan European standard household would incur only
90% of the expenditure incurred by its Singapore’s counterpart for all major items of
consumption. The monthly and yearly per capita consumption of this household were
subsequently derived.
b) The Eurasian / Asiatic Clerical Standards
It should be noted here that for the Eurasian and Asiatic clerical standards in
Malaya, the procedure of deriving monthly and yearly per capita consumption
expenditures was similar to that adopted for the European standard as described above.
The source data was again obtained from the Family Budget Survey of 1930 for
Singapore taking into account variations in household size.
c) The Indian Labour Standard
The consumption of an adult of this standard was obtained from the Indian
Labourer’s Specimen Monthly Budget, 1933 as contained in the Annual Report, Johore,
1933 which amounted to $4.525 per month as shown in Table 2.
14
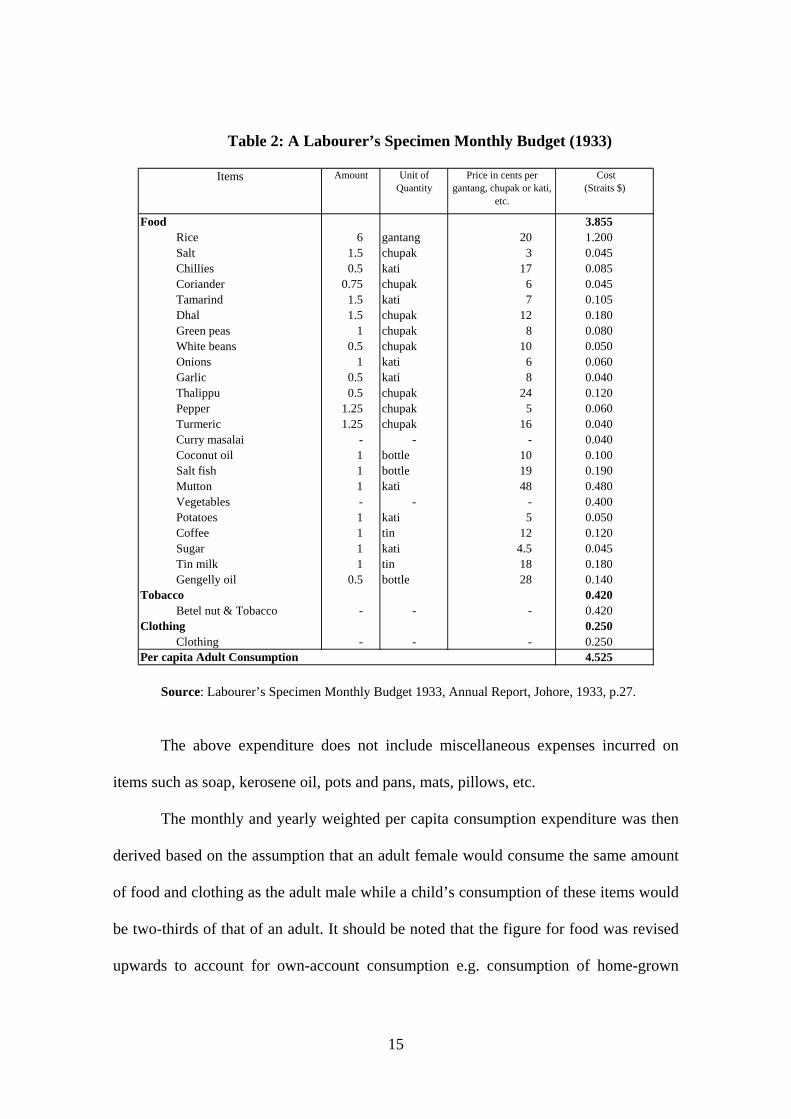
Table 2: A Labourer’s Specimen Monthly Budget (1933)
Unit ofQuantity
Food 3.855 Rice 6 gantang 20 1.200 Salt 1.5 chupak 3 0.045 Chillies 0.5 kati 17 0.085 Coriander 0.75 chupak 6 0.045 Tamarind 1.5 kati 7 0.105 Dhal 1.5 chupak 12 0.180 Green peas 1 chupak 8 0.080 White beans 0.5 chupak 10 0.050 Onions 1 kati 6 0.060 Garlic 0.5 kati 8 0.040 Thalippu 0.5 chupak 24 0.120 Pepper 1.25 chupak 5 0.060 Turmeric 1.25 chupak 16 0.040 Curry masalai - - - 0.040 Coconut oil 1 bottle 10 0.100 Salt fish 1 bottle 19 0.190 Mutton 1 kati 48 0.480 Vegetables - - - 0.400 Potatoes 1 kati 5 0.050 Coffee 1 tin 12 0.120 Sugar 1 kati 4.5 0.045 Tin milk 1 tin 18 0.180 Gengelly oil 0.5 bottle 28 0.140
Tobacco 0.420 Betel nut & Tobacco - - - 0.420
Clothing 0.250 Clothing - - - 0.250
4.525
Items Amount
Per capita Adult Consumption
Price in cents pergantang, chupak or kati,
etc.
Cost(Straits $)
Source: Labourer’s Specimen Monthly Budget 1933, Annual Report, Johore, 1933, p.27.
The above expenditure does not include miscellaneous expenses incurred on
items such as soap, kerosene oil, pots and pans, mats, pillows, etc.
The monthly and yearly weighted per capita consumption expenditure was then
derived based on the assumption that an adult female would consume the same amount
of food and clothing as the adult male while a child’s consumption of these items would
be two-thirds of that of an adult. It should be noted that the figure for food was revised
upwards to account for own-account consumption e.g. consumption of home-grown
15
poultry and livestock products, vegetables, etc. The per capita consumption of tobacco
was based solely on the consumption made by an adult male. Data on rent for the Indian
standard was not available for any one year during this period. Expenditure on rent was
therefore estimated based on surrogate data. The cost-of-living index of the Eurasian
Clerical standard, 1914-39 gave a weight of 8% for rentals for the base year in relation
to all goods and services consumed. This was taken into account and an assumption was
made that the rental expenditure for the Indian standard would account for about 5 % of
all goods and services consumed. The treatment of miscellaneous items was similar to
that of the European/Eurasian clerical/Asiatic clerical standards mentioned earlier.
d) The Malay and Chinese Labour Standards
(i) Food
The food consumption pattern of a full meat diet of a Malay and a Chinese adult
was based on the 1936 diet scale of government hospitals. Since food provisions in
government hospitals were deemed to be the minimum dietary requirements, the food
consumption data was adjusted upwards to reflect the normal intake of an adult.
Subsequently, the monthly and yearly weighted per capita consumption for the Malay
and Chinese standards were arrived at in a procedure similar to that as described for the
Indian labour standard.
(ii) Tobacco, Clothing and Rent
No data was available for 1936 on the per capita consumption of tobacco,
clothing and rent. Given this predicament, estimates for the various major objects of
consumption in 1936 were made based on per capita consumption of such objects
(except rent) in the year 1949 for which data was available. It was assumed that the
proportion of expenditure, in nominal terms on these major objects of consumption in
16
relation to food as observed in 1949 would remain unchanged in 1939. Based on this
assumption, the consumption of food in 1939 was computed. However, the changes in
real consumption due to changes in real income were not taken into account. Having
determined the per capita consumption of food in 1939, the per capita consumption of
tobacco and clothing for 1939 was computed based on the relationship of these major
objects of consumption to food in 1949. The data for 1936 was then obtained by
deflating each major object of consumption by the relevant price index to reflect price
changes for the two years (1936 and 1939) using 1914 as the base year.
Data on rent was not available for the year 1949. It was noted that rent
constituted 8% of the per capita expenditure of the Eurasian clerical standard in 1914. It
was then posited that the percentage of expenditure on rent for the Malay and Chinese
labour standards would certainly be less than the Eurasian clerical standard. An
assumption was therefore made that the percentage would only be about 5% for the
Malay labour standard and around 6% for the Chinese labour standard. As for the
miscellaneous items of consumption, its treatment is similar to that of the
European/Eurasian clerical/Asiatic clerical standards as described earlier.
I have so far described the manner in which annual per capita consumption
expenditure of a “representative” individual in each of the six consumption standards
has been constructed for each major object of consumption in current prices for the
selected years. The results of the above exercise are summarized in Table 3.
17

Table 3: Annual Per capita Private Final Consumption Expenditure in Current Prices for Selected years – Malaya
Consumption Standard
Major Object of Consumption
European Standard
(1930)
Eurasian Clerical Standard (1930)
Asiatic Clerical Standard (1930)
Indian Labour
Standard (1933)
Malay Labour
Standard (1936)
Chinese Labour
Standard (1936)
Food and Groceries
$565.201 $143.531 $133.701 $50.762 $51.805 $52.535
Beverages and Tobacco
$171.471 $7.781 $7.781 $2.653 $3.026 $2.816
Clothing
$288.001 $28.081 $28.081 $2.744 $8.517 $8.237
Rent
$288.001 $64.801 $64.801 $3.228 $3.138 $4.038
Domestic Servants
$612.001 $21.601 $21.601 Not Applicable
Not Applicable
Not Applicable
Passenger Transport (other than rail and ferry)
$192.491 $23.851 $23.851 Not Applicable
Not Applicable
Not Applicable
Clubs $219.601 Not Applicable
Not Applicable
Not Applicable
Not Applicable
Not Applicable
Notes:
1. Assumed that households in Malaya consumed 90% of amount consumed by respective Singapore households. Per capita consumption was derived based on household size of each standard household.
2. Consumption per capita is assumed to be 20% more than that of Labourer’s Specimen Monthly Budget, Johore, 1933. Male and female adults consumed the same amount whereas children consumed 2/3 of adult amount.
3. Based on Labourer’s Specimen Monthly Budget, Johore, 1933. 4. Based on Labourer’s Specimen Monthly Budget, Johore, 1933. Male and female adults consumed the
same amount whereas children consumed 2/3 of adult amount. 5.Consumption per capita was assumed to be 20% more than the full meat diet scale of adults in
government hospitals. Male and female adults consumed the same amount whereas children consumed 2/3 of adult amount.
6. Applied the ratio of beverages and tobacco to food in 1949 to 1939 and deflated to 1936. 7. Applied the ratio of clothing to food in 1949 to 1939 and deflated to 1936. 8. Computed as a percentage of expenditure on food, clothing, beverages and tobacco: Malay and
Indian Labour (5%), Chinese Labour (6%). Sources: (i) Report of The Commission on The Temporary Allowances, Family Budget 1930, Singapore,
p. 14-16 and p. 20-23. (ii) Labourer’s Specimen Monthly Budget 1933; Annual Report, Johore, 1933,p.27. (iii) Diet Scales of Government Hospitals 1936, Proclamations, Order, Notices, Regulations, Declarations,
Appointments, Forms and By-laws in force on 31st day of December 1935 – Cap 154, p.1705. (iv) Annual Report Labour Department, Federation of Malaya, 1949, p. 89-90, Appendix VB.
18
Step 3: Consumer Price Indices of Major Objects of Consumption, 1900-39
The construction of consumer price indices for Malaya for the period 1900-39
can conveniently be divided into two sub-periods, namely 1900-14 and 1914-39,
predicated mainly on the availability of price indices of Singapore. For 1914-39 (except
for the years 1915-17 and 1939), the price indices for Malaya were essentially based on
the officially published annual cost-of-living indices of Singapore which were available
for each major object of consumption, specifically for three consumption standards,
namely the European, Eurasian and Asiatic Clerical standards. For Malaya, where a
total of six consumption standards was defined, it was assumed that its European,
Eurasian and Asiatic Clerical standards followed the price movements of the
counterparts in Singapore. As for the remaining three standards, viz the Malay, Chinese
and Indian labour standards, it was assumed that they followed the price movements of
Singapore’s Asiatic Clerical standard. (See Appendix 3, page 55). The basic underlying
assumption was that price movements in Malaya would be the same as in Singapore. It
should be noted here that there was no overall consumer price index for Singapore for
these years. Another point worth noting is that in the absence of consumer price indices
for Singapore for the years 1915-17 and 1939, such indices for Malaya had to be
estimated for these years (See Appendix 3, for details on the estimating procedures).
For 1900-14, since no price indices were available at all even in Singapore, an
exercise was undertaken to construct for Malaya a fresh set of price indices for each
major object of consumption and each consumption standard (See Appendix 4). It
would be observed that the price index for any particular major object of consumption
was the same for all the six consumption standards with the exception of rent and
tobacco for the European standard (See Appendix 4, page 66).
19
Having arrived at the price indices for all major objects of consumption by
consumption standard for the two periods (1914-39 and 1900-14), the next step
involved the computation of a weighted overall consumer price index for the entire
period 1900-39. One important point that should be noted at this juncture is that the per
capita consumption in current prices for each major object of consumption in 1930
(European, Eurasian and Asiatic Clerical standards), 1933 (Indian labour standard) and
1936 (Malay and Chinese labour standards) was deflated by the respective price indices
using the base year (1914=100). This implicitly implied that the quantity consumed per
capita for each major object of consumption remained unchanged between 1914 and
1930 or 1933 or 1936 depending on the consumption standard. It is also important to
note here that the per capita consumption thus derived did not take into account income
changes over time.
The general procedure used for computing the price indices by major object of
consumption and consumption standard is outlined in Appendix 5. The results of the
computation of the consumer price index for the period 1914-39 and 1900-14 are shown
in Appendix 6 and Appendix 7 respectively. The consumer price indices of major
objects of consumption thus derived for Malaya for the period 1900-39 are presented in
Table 4 in the following page.
20

Table 4: Consumer Price Indices by Major Object of Consumption, Malaya, 1900-39 (1914=100)
Food &Groceries
Tobacco Clothing Rent Servants Transport Club
1899 87.36 68.34 83.22 73.72 69.64 109.66 90.65 85.57 1900 95.85 72.87 80.34 75.18 75.00 107.87 99.22 91.77 1901 90.79 68.47 98.09 76.66 73.21 107.44 96.47 89.99 1902 95.99 77.99 107.27 78.17 82.14 107.23 97.88 95.57 1903 97.73 82.25 104.00 79.71 82.14 107.34 104.12 96.75 1904 95.92 77.67 116.83 81.28 78.57 107.23 95.26 96.52 1905 93.60 65.66 109.35 82.88 78.57 107.12 93.25 93.63 1906 89.73 69.21 102.77 84.52 82.14 107.23 87.34 90.46 1907 95.21 65.67 108.12 86.19 91.07 105.07 85.90 95.21 1908 96.46 61.56 108.09 87.89 91.07 104.64 86.75 96.01 1909 92.15 60.63 96.68 86.05 91.07 103.67 84.68 91.50 1910 91.12 70.28 99.22 85.55 91.07 103.24 88.82 91.44 1911 98.31 81.46 101.13 85.16 91.07 102.91 95.84 97.20 1912 107.78 84.29 102.70 85.87 91.07 103.02 100.17 104.22 1913 108.17 99.28 99.53 93.25 91.07 99.46 104.62 104.96 1914 100.00 100.00 100.00 100.00 100.00 100.00 100.00 100.00 1915 104.15 96.87 138.32 101.59 103.82 101.83 91.31 107.35 1916 109.67 146.95 161.28 104.09 103.82 103.13 103.77 116.05 1917 118.00 129.11 144.02 104.62 113.09 108.64 113.88 120.12 1918 140.13 174.45 189.80 116.86 116.80 112.50 134.00 143.71 1919 189.06 201.25 229.60 127.17 116.80 122.90 147.40 184.61 1920 250.50 244.13 291.60 155.97 155.50 126.80 163.50 239.99 1921 167.78 239.32 237.20 161.86 155.50 122.80 176.70 175.90 1922 145.12 237.03 182.80 184.14 155.50 112.00 177.40 154.31 1923 145.00 200.98 163.60 212.91 155.50 94.80 169.20 151.22 1924 145.66 187.66 157.10 223.08 155.50 99.40 164.10 151.00 1925 150.94 186.01 158.10 232.88 155.50 105.30 164.20 155.40 1926 159.70 190.26 157.50 245.37 155.50 103.50 161.70 162.09 1927 154.81 182.73 155.40 267.02 155.50 94.20 159.50 158.72 1928 151.08 182.83 151.90 291.88 155.50 93.10 159.50 156.76 1929 149.12 179.98 141.00 293.90 155.50 89.70 155.30 153.94 1930 139.63 170.57 139.80 270.77 152.90 85.50 156.10 145.50 1931 103.46 173.54 134.52 233.00 138.00 96.20 160.50 117.68 1932 87.28 167.63 114.47 189.74 124.70 89.00 160.10 100.96 1933 79.84 150.58 110.35 166.42 115.80 85.40 158.40 93.00 1934 84.28 151.34 103.93 166.42 123.70 84.50 159.50 95.80 1935 94.13 140.19 103.67 166.42 127.40 82.40 157.70 102.35 1936 91.35 140.01 102.55 166.42 125.70 80.00 157.40 100.08 1937 101.58 140.01 108.55 168.86 130.00 81.40 157.70 108.32 1938 93.87 139.49 110.38 178.18 128.20 81.50 159.40 103.46 1939 92.52 150.61 119.99 193.56 128.20 82.18 152.87 104.62
Major Object of Consumption Overall CPI
It should be noted that in computing the overall consumer price index, the
consumption of opium/chandu as well as the consumption expenditure on electricity,
21
water and other miscellaneous items was not taken into account. These together
accounted for less than 15% of the total private final consumption expenditure.
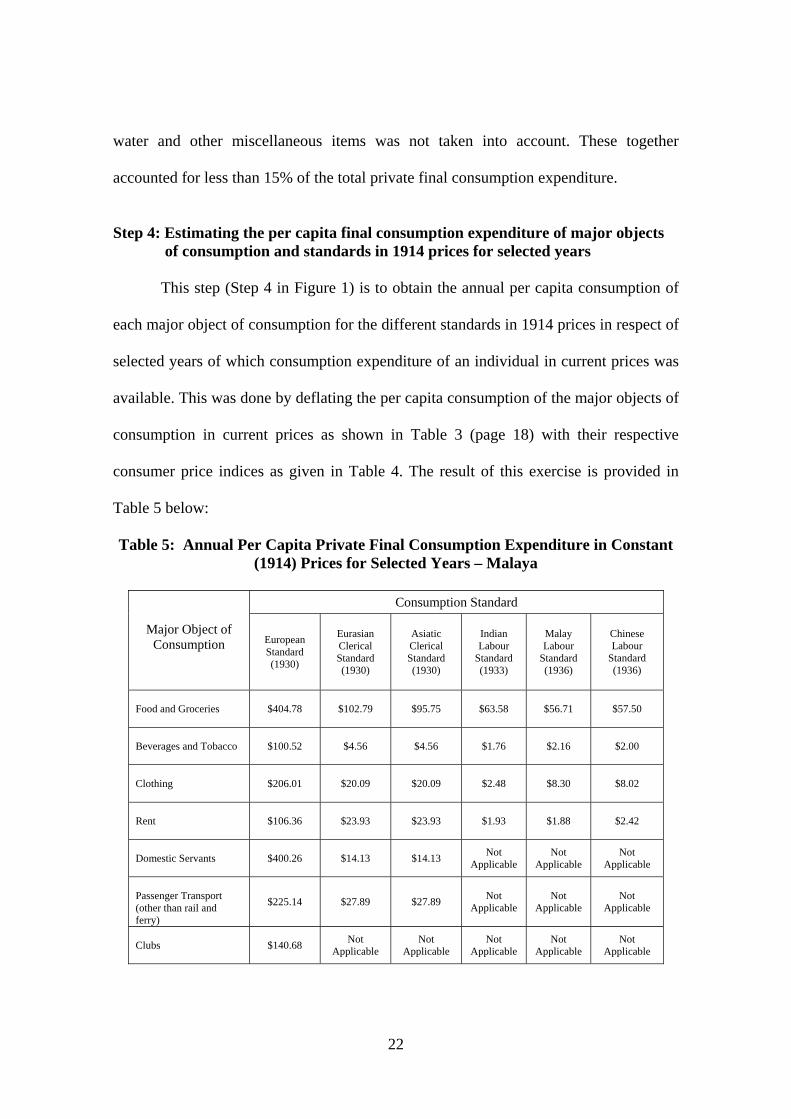
Step 4: Estimating the per capita final consumption expenditure of major objects of consumption and standards in 1914 prices for selected years
This step (Step 4 in Figure 1) is to obtain the annual per capita consumption of
each major object of consumption for the different standards in 1914 prices in respect of
selected years of which consumption expenditure of an individual in current prices was
available. This was done by deflating the per capita consumption of the major objects of
consumption in current prices as shown in Table 3 (page 18) with their respective
consumer price indices as given in Table 4. The result of this exercise is provided in
Table 5 below:
Table 5: Annual Per Capita Private Final Consumption Expenditure in Constant (1914) Prices for Selected Years – Malaya
Consumption Standard
Major Object of
Consumption European Standard (1930)
Eurasian Clerical Standard (1930)
Asiatic Clerical Standard (1930)
Indian Labour
Standard (1933)
Malay Labour
Standard (1936)
Chinese Labour
Standard (1936)
Food and Groceries
$404.78 $102.79 $95.75 $63.58 $56.71 $57.50
Beverages and Tobacco
$100.52
$4.56 $4.56 $1.76 $2.16 $2.00
Clothing
$206.01
$20.09 $20.09 $2.48 $8.30 $8.02
Rent
$106.36
$23.93 $23.93 $1.93 $1.88 $2.42
Domestic Servants
$400.26 $14.13 $14.13 Not Applicable
Not Applicable
Not Applicable
Passenger Transport (other than rail and ferry)
$225.14 $27.89 $27.89 Not Applicable
Not Applicable
Not Applicable
Clubs
$140.68 Not Applicable
Not Applicable
Not Applicable
Not Applicable
Not Applicable
22

Step 5: The Real Wage Index, 1900-39
It was noted that for the entire period 1900-39, no continuous wage series was
available. However, for 1900-14 and 1914-39 it was generally possible to construct a
continuous surrogate series of wage data for these sub-periods. In turn, the overlapping
year of 1914 made it possible to link the two sub-period series. It was felt that these two
sub-period series fairly reflected changes in household income over time. Household
income would generally include wages and salaries received by employees in both cash
and kind as well as the entrepreneurial income derived from self-employment, income
receipts of unpaid family workers and other income. However, such data was not
available and hence as a last resort, wage rate data series had to be relied upon.
The Wage Rate Series, 1900-14
(a) The Agriculture Sector
The wage index for this sector was based on two elements:
[i] Wage index of Chinese estate coolies and predial (field workers and gardeners); and
[ii] Wage index for “trades” (carpenters, joiners, blacksmiths and bricklayers).
The “trades” data were incorporated into the agriculture sector to represent the
entrepreneurial income accruing to the agriculture sector, since it was perceived that
their earnings would move in tandem with those in the “trades”. Moreover, self-
employed workers also played an equally important role as wage earners and our view
was that a simple arithmetic average of the two elements mentioned above would
provide a reasonable estimate of the movements of household income in the agriculture
sector.
23

(b) The Non-agriculture Sector
For the non-agriculture sector, the wage movements of the “trades” (carpenters,
joiners, blacksmiths and bricklayers) was used.
The Wage Rate Series, 1914-39
(a) The Agriculture Sector
The wage index for this sector was again based on two elements:
[i] Wage index of Indian adult male rubber tappers; and
[ii]Wage index of “trades” (carpenters, joiners, blacksmiths and bricklayers).
The inclusion of “trades” in the agriculture sector was necessary to take into account
changes in the entrepreneurial income of the self-employed as in the construction of the
1900-14 series. The average nominal wage was derived by taking the simple arithmetic
average of Indian adult male rubber tappers and those in “trades”.
(b) The Non-agriculture Sector
Wage movements were solely based on the wage index of those in “trades”
(carpenters, joiners, blacksmiths and bricklayers).
Weights for Computing Nominal Wage Index, 1900-39
The weighting of the nominal wage indices for agriculture and non-agriculture
sectors for both periods (1900-14 and 1914-39) was based solely on the 1921
Population Census data on employment across sectors given the absence of such data
for the base year, 1914. An analysis of such data from the 1931 Population Census also
showed that the weights were relatively stable as shown below:
24
Sector 1921 Census 1931 CensusAgriculture 66.1% 67.2% Non-agriculture 33.9% 32.8%
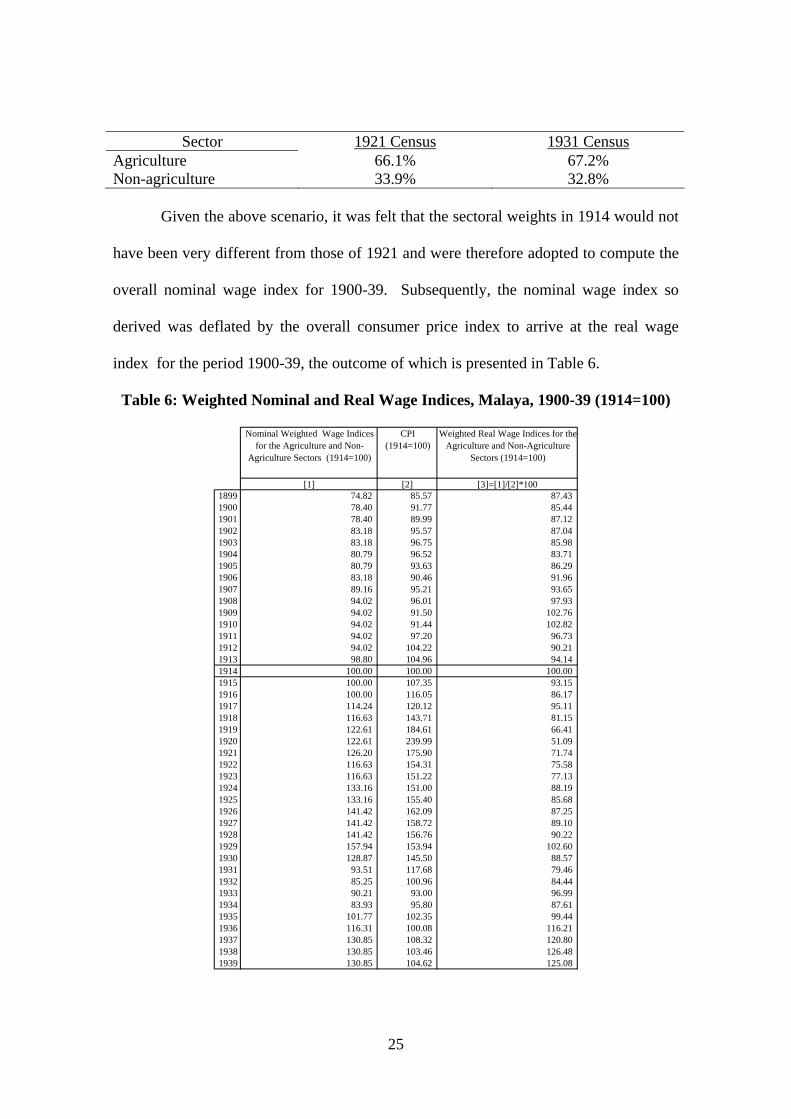
Given the above scenario, it was felt that the sectoral weights in 1914 would not
have been very different from those of 1921 and were therefore adopted to compute the
overall nominal wage index for 1900-39. Subsequently, the nominal wage index so
derived was deflated by the overall consumer price index to arrive at the real wage
index for the period 1900-39, the outcome of which is presented in Table 6.
Table 6: Weighted Nominal and Real Wage Indices, Malaya, 1900-39 (1914=100)
[1] [2] [3]=[1]/[2]*1001899 74.82 85.57 87.43 1900 78.40 91.77 85.44 1901 78.40 89.99 87.12 1902 83.18 95.57 87.04 1903 83.18 96.75 85.98 1904 80.79 96.52 83.71 1905 80.79 93.63 86.29 1906 83.18 90.46 91.96 1907 89.16 95.21 93.65 1908 94.02 96.01 97.93 1909 94.02 91.50 102.76 1910 94.02 91.44 102.82 1911 94.02 97.20 96.73 1912 94.02 104.22 90.21 1913 98.80 104.96 94.14 1914 100.00 100.00 100.00 1915 100.00 107.35 93.15 1916 100.00 116.05 86.17 1917 114.24 120.12 95.11 1918 116.63 143.71 81.15 1919 122.61 184.61 66.41 1920 122.61 239.99 51.09 1921 126.20 175.90 71.74 1922 116.63 154.31 75.58 1923 116.63 151.22 77.13 1924 133.16 151.00 88.19 1925 133.16 155.40 85.68 1926 141.42 162.09 87.25 1927 141.42 158.72 89.10 1928 141.42 156.76 90.22 1929 157.94 153.94 102.60 1930 128.87 145.50 88.57 1931 93.51 117.68 79.46 1932 85.25 100.96 84.44 1933 90.21 93.00 96.99 1934 83.93 95.80 87.61 1935 101.77 102.35 99.44 1936 116.31 100.08 116.21 1937 130.85 108.32 120.80 1938 130.85 103.46 126.48 1939 130.85 104.62 125.08
Nominal Weighted Wage Indicesfor the Agriculture and Non-
Agriculture Sectors (1914=100)
CPI(1914=100)
Weighted Real Wage Indices for theAgriculture and Non-Agriculture
Sectors (1914=100)
25

Steps 6-11: Deriving Total Private Final Consumption Expenditure in Constant and Current Prices, 1900-39 (excluding miscellaneous expenditure)
The computation of PFCE in this exercise requires information on population by
consumption standard, per capita consumption expenditure by major object of
consumption and standard in current prices, consumer price indices by major object of
consumption, per capita consumption expenditure by major object of consumption and
standard in 1914 prices, real wage index and income elasticities of demand by major
object of consumption and standards. These data requirements with the exception of
income elasticities of demand of major objects of consumption and standards have
already been dwelled upon in the preceding steps.
The following income elasticities of demand were then used to adjust our
expenditure series to capture the effect of real income changes over time: 0.8 for food
and groceries, 0.8 for rent and 1.0 for beverages and tobacco, clothing, passenger
transport other than rail and ferry, domestic servants and clubs (see Step 6 in Figure 1).
Given the above information, we are now in a position to compute the constant
per capita PFCE for the years 1900-39 taking the real annual per capita expenditure on
major objects of consumption for different consumption standards for selected years as
our starting point. This computation therefore takes into account changes in real wages
and income elasticities of demand (Step 7 in Figure 1).
For example, if for the selected year (t) the per capita expenditure on food
(PCF) is $Ft and if the real wage index increases from 1 in year (t) to 1.3 in year t+1, the
per capita expenditure on food in year t+1 is calculated as follows:
PCFt+1 = $Ft + [$Ft x (1.3-1)/1] x 0.8 = $B
26

If the real wage index then increases to 1.5 in year t+2, per capita final expenditure in
year t+2 is calculated as:
PCFt+2 = $B + [$B x (1.5-1.3)/1.3] x 0.8
The per capita consumption of each major object of consumption was then
multiplied by the total population of each consumption standard (Step 8 in Figure 1).
This provided us the total private final consumption expenditure on each major object of
consumption of each consumption standard in constant prices for each year [Step 9 in
Figure 1]. This was then inflated by the price indices of the major objects of
consumption [Step 10 in Figure 1] to obtain the total PFCE in current prices (Step 11 in
Figure 1). As an example, the calculation of private final consumption expenditure on
food of the European standard is provided in Table 7 for ease of understanding.
27
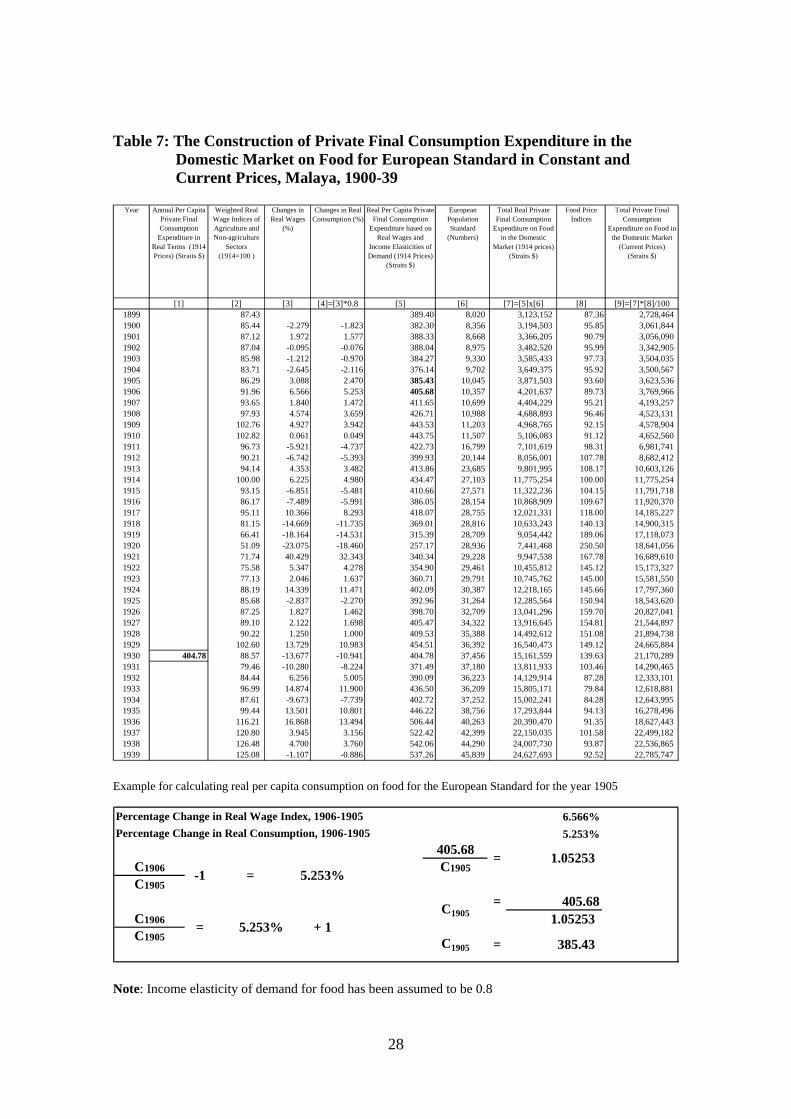
Table 7: The Construction of Private Final Consumption Expenditure in the Domestic Market on Food for European Standard in Constant and Current Prices, Malaya, 1900-39
Year Annual Per Capita
Private FinalConsumption
Expenditure inReal Terms (1914Prices) (Straits $)
Weighted RealWage Indices ofAgriculture andNon-agriculture
Sectors(1914=100 )
Changes inReal Wages
(%)
Changes in RealConsumption (%)
Real Per Capita PrivateFinal Consumption
Expenditure based onReal Wages and
Income Elasticities ofDemand (1914 Prices)
(Straits $)
EuropeanPopulationStandard
(Numbers)
Total Real PrivateFinal Consumption
Expenditure on Foodin the Domestic
Market (1914 prices)(Straits $)
Food PriceIndices
Total Private FinalConsumption
Expenditure on Food inthe Domestic Market
(Current Prices)(Straits $)
[1] [2] [3] [4]=[3]*0.8 [5] [6] [7]=[5]x[6] [8] [9]=[7]*[8]/1001899 87.43 389.40 8,020 3,123,152 87.36 2,728,464 1900 85.44 -2.279 -1.823 382.30 8,356 3,194,503 95.85 3,061,844 1901 87.12 1.972 1.577 388.33 8,668 3,366,205 90.79 3,056,090 1902 87.04 -0.095 -0.076 388.04 8,975 3,482,520 95.99 3,342,905 1903 85.98 -1.212 -0.970 384.27 9,330 3,585,433 97.73 3,504,035 1904 83.71 -2.645 -2.116 376.14 9,702 3,649,375 95.92 3,500,567 1905 86.29 3.088 2.470 385.43 10,045 3,871,503 93.60 3,623,536 1906 91.96 6.566 5.253 405.68 10,357 4,201,637 89.73 3,769,966 1907 93.65 1.840 1.472 411.65 10,699 4,404,229 95.21 4,193,257 1908 97.93 4.574 3.659 426.71 10,988 4,688,893 96.46 4,523,131 1909 102.76 4.927 3.942 443.53 11,203 4,968,765 92.15 4,578,904 1910 102.82 0.061 0.049 443.75 11,507 5,106,083 91.12 4,652,560 1911 96.73 -5.921 -4.737 422.73 16,799 7,101,619 98.31 6,981,741 1912 90.21 -6.742 -5.393 399.93 20,144 8,056,001 107.78 8,682,412 1913 94.14 4.353 3.482 413.86 23,685 9,801,995 108.17 10,603,126 1914 100.00 6.225 4.980 434.47 27,103 11,775,254 100.00 11,775,254 1915 93.15 -6.851 -5.481 410.66 27,571 11,322,236 104.15 11,791,718 1916 86.17 -7.489 -5.991 386.05 28,154 10,868,909 109.67 11,920,370 1917 95.11 10.366 8.293 418.07 28,755 12,021,331 118.00 14,185,227 1918 81.15 -14.669 -11.735 369.01 28,816 10,633,243 140.13 14,900,315 1919 66.41 -18.164 -14.531 315.39 28,709 9,054,442 189.06 17,118,073 1920 51.09 -23.075 -18.460 257.17 28,936 7,441,468 250.50 18,641,056 1921 71.74 40.429 32.343 340.34 29,228 9,947,538 167.78 16,689,610 1922 75.58 5.347 4.278 354.90 29,461 10,455,812 145.12 15,173,327 1923 77.13 2.046 1.637 360.71 29,791 10,745,762 145.00 15,581,550 1924 88.19 14.339 11.471 402.09 30,387 12,218,165 145.66 17,797,360 1925 85.68 -2.837 -2.270 392.96 31,264 12,285,564 150.94 18,543,620 1926 87.25 1.827 1.462 398.70 32,709 13,041,296 159.70 20,827,041 1927 89.10 2.122 1.698 405.47 34,322 13,916,645 154.81 21,544,897 1928 90.22 1.250 1.000 409.53 35,388 14,492,612 151.08 21,894,738 1929 102.60 13.729 10.983 454.51 36,392 16,540,473 149.12 24,665,884 1930 404.78 88.57 -13.677 -10.941 404.78 37,456 15,161,559 139.63 21,170,289 1931 79.46 -10.280 -8.224 371.49 37,180 13,811,933 103.46 14,290,465 1932 84.44 6.256 5.005 390.09 36,223 14,129,914 87.28 12,333,101 1933 96.99 14.874 11.900 436.50 36,209 15,805,171 79.84 12,618,881 1934 87.61 -9.673 -7.739 402.72 37,252 15,002,241 84.28 12,643,995 1935 99.44 13.501 10.801 446.22 38,756 17,293,844 94.13 16,278,496 1936 116.21 16.868 13.494 506.44 40,263 20,390,470 91.35 18,627,443 1937 120.80 3.945 3.156 522.42 42,399 22,150,035 101.58 22,499,182 1938 126.48 4.700 3.760 542.06 44,290 24,007,730 93.87 22,536,865 1939 125.08 -1.107 -0.886 537.26 45,839 24,627,693 92.52 22,785,747
Example for calculating real per capita consumption on food for the European Standard for the year 1905
Percentage Change in Real Wage Index, 1906-1905 6.566%Percentage Change in Real Consumption, 1906-1905 5.253%
405.68C1906 C1905
C1905
= 405.68C1906 1.05253C1905
5.253%
= 5.253% + 1
-1 == 1.05253
C1905 = 385.43
C1905
Note: Income elasticity of demand for food has been assumed to be 0.8
28

A similar procedure was applied to compute private final consumption
expenditure on tobacco, clothing, rent, domestic servants, passenger transport (other
than rail and ferry) and clubs for each consumption standard in both constant and
current prices using the appropriate income elasticities of demand. A summation of the
major objects of consumption across consumption standards in constant and current
prices gives us the total private final consumption expenditure in both constant and
current prices respectively (See Appendix 8).
Estimating Miscellaneous Items of Expenditure
The expenditure on miscellaneous items was computed for each year based on
the total private final consumption expenditure in current prices as derived via the
indirect approach. The miscellaneous items would include amongst others, household
equipment and operations such as furniture, curtains, cooking appliances, glassware,
tableware, household utensils and other non-durables, e.g. matches, soap, candles, shoe
polish, etc. It would also include cultural and other services such as personal care.
Based on statistical evidence, the miscellaneous expenditure was taken to be 7% of the
total private final consumption expenditure in current prices based on PFCE derived
from the indirect approach. The miscellaneous expenditure in constant terms for each
year was then derived by deflating the miscellaneous expenditure in nominal terms by
the overall consumer price index.
4. Estimates of Total Private Final Consumption Expenditure
The overall private final consumption expenditure in the domestic market for
each year in nominal and real terms was then derived by summing up the consumption
29
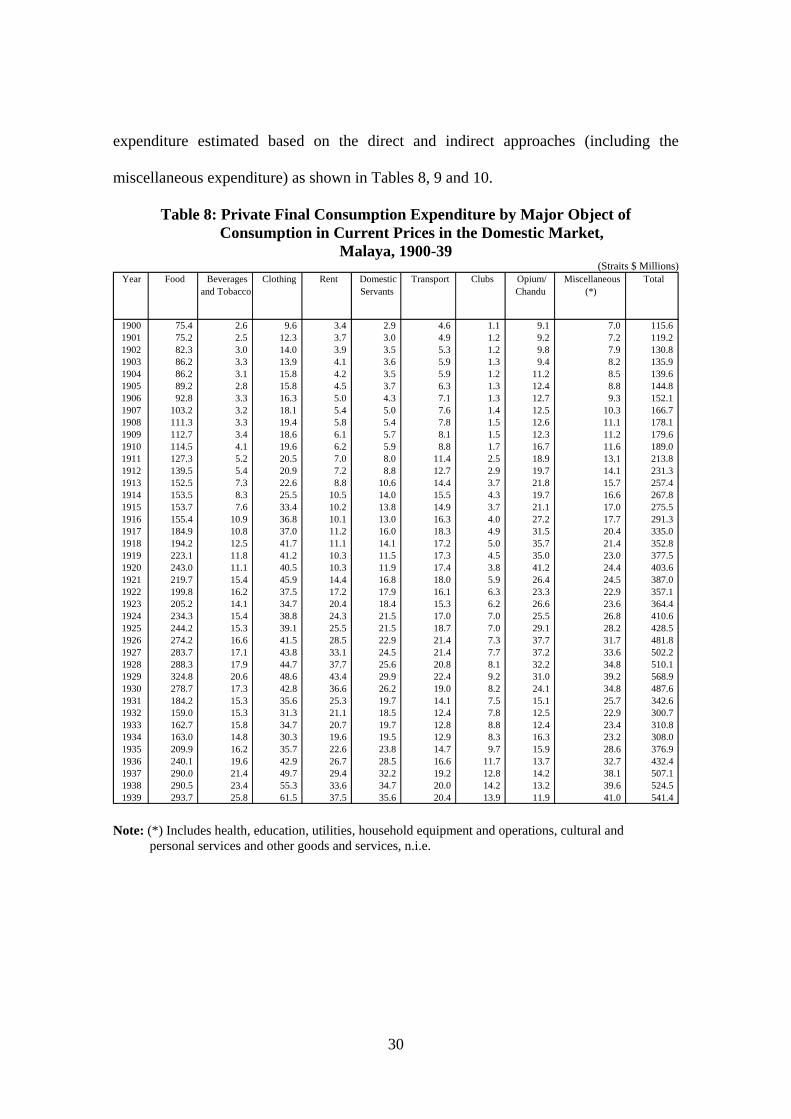
expenditure estimated based on the direct and indirect approaches (including the
miscellaneous expenditure) as shown in Tables 8, 9 and 10.
Table 8: Private Final Consumption Expenditure by Major Object of Consumption in Current Prices in the Domestic Market,
Malaya, 1900-39 (Straits $ Millions)
1900 75.4 2.6 9.6 3.4 2.9 4.6 1.1 9.1 7.0 115.6 1901 75.2 2.5 12.3 3.7 3.0 4.9 1.2 9.2 7.2 119.2 1902 82.3 3.0 14.0 3.9 3.5 5.3 1.2 9.8 7.9 130.8 1903 86.2 3.3 13.9 4.1 3.6 5.9 1.3 9.4 8.2 135.9 1904 86.2 3.1 15.8 4.2 3.5 5.9 1.2 11.2 8.5 139.6 1905 89.2 2.8 15.8 4.5 3.7 6.3 1.3 12.4 8.8 144.8 1906 92.8 3.3 16.3 5.0 4.3 7.1 1.3 12.7 9.3 152.1 1907 103.2 3.2 18.1 5.4 5.0 7.6 1.4 12.5 10.3 166.7 1908 111.3 3.3 19.4 5.8 5.4 7.8 1.5 12.6 11.1 178.1 1909 112.7 3.4 18.6 6.1 5.7 8.1 1.5 12.3 11.2 179.6 1910 114.5 4.1 19.6 6.2 5.9 8.8 1.7 16.7 11.6 189.0 1911 127.3 5.2 20.5 7.0 8.0 11.4 2.5 18.9 13.1 213.8 1912 139.5 5.4 20.9 7.2 8.8 12.7 2.9 19.7 14.1 231.3 1913 152.5 7.3 22.6 8.8 10.6 14.4 3.7 21.8 15.7 257.4 1914 153.5 8.3 25.5 10.5 14.0 15.5 4.3 19.7 16.6 267.8 1915 153.7 7.6 33.4 10.2 13.8 14.9 3.7 21.1 17.0 275.5 1916 155.4 10.9 36.8 10.1 13.0 16.3 4.0 27.2 17.7 291.3 1917 184.9 10.8 37.0 11.2 16.0 18.3 4.9 31.5 20.4 335.0 1918 194.2 12.5 41.7 11.1 14.1 17.2 5.0 35.7 21.4 352.8 1919 223.1 11.8 41.2 10.3 11.5 17.3 4.5 35.0 23.0 377.5 1920 243.0 11.1 40.5 10.3 11.9 17.4 3.8 41.2 24.4 403.6 1921 219.7 15.4 45.9 14.4 16.8 18.0 5.9 26.4 24.5 387.0 1922 199.8 16.2 37.5 17.2 17.9 16.1 6.3 23.3 22.9 357.1 1923 205.2 14.1 34.7 20.4 18.4 15.3 6.2 26.6 23.6 364.4 1924 234.3 15.4 38.8 24.3 21.5 17.0 7.0 25.5 26.8 410.6 1925 244.2 15.3 39.1 25.5 21.5 18.7 7.0 29.1 28.2 428.5 1926 274.2 16.6 41.5 28.5 22.9 21.4 7.3 37.7 31.7 481.8 1927 283.7 17.1 43.8 33.1 24.5 21.4 7.7 37.2 33.6 502.2 1928 288.3 17.9 44.7 37.7 25.6 20.8 8.1 32.2 34.8 510.1 1929 324.8 20.6 48.6 43.4 29.9 22.4 9.2 31.0 39.2 568.9 1930 278.7 17.3 42.8 36.6 26.2 19.0 8.2 24.1 34.8 487.6 1931 184.2 15.3 35.6 25.3 19.7 14.1 7.5 15.1 25.7 342.6 1932 159.0 15.3 31.3 21.1 18.5 12.4 7.8 12.5 22.9 300.7 1933 162.7 15.8 34.7 20.7 19.7 12.8 8.8 12.4 23.4 310.8 1934 163.0 14.8 30.3 19.6 19.5 12.9 8.3 16.3 23.2 308.0 1935 209.9 16.2 35.7 22.6 23.8 14.7 9.7 15.9 28.6 376.9 1936 240.1 19.6 42.9 26.7 28.5 16.6 11.7 13.7 32.7 432.4 1937 290.0 21.4 49.7 29.4 32.2 19.2 12.8 14.2 38.1 507.1 1938 290.5 23.4 55.3 33.6 34.7 20.0 14.2 13.2 39.6 524.5 1939 293.7 25.8 61.5 37.5 35.6 20.4 13.9 11.9 41.0 541.4
Miscellaneous(*)
RentYear Food Beveragesand Tobacco
Clothing DomesticServants
Transport Clubs Opium/Chandu
Total
Note: (*) Includes health, education, utilities, household equipment and operations, cultural and personal services and other goods and services, n.i.e.
30

Table 9: Percentage Distribution of Private Final Consumption Expenditure by Major Object of Consumption in Current Prices in the Domestic Market, Malaya,1900-39
(Percentage)
1900 65.2 2.2 8.3 2.9 2.5 4.0 1.0 7.8 6.0 100.0 1901 63.1 2.1 10.4 3.1 2.5 4.1 1.0 7.7 6.0 100.0 1902 62.9 2.3 10.7 2.9 2.7 4.0 0.9 7.5 6.0 100.0 1903 63.4 2.4 10.2 3.0 2.7 4.4 1.0 6.9 6.1 100.0 1904 61.7 2.2 11.3 3.0 2.5 4.2 0.9 8.0 6.1 100.0 1905 61.6 1.9 10.9 3.1 2.6 4.4 0.9 8.5 6.1 100.0 1906 61.0 2.1 10.7 3.3 2.8 4.7 0.9 8.4 6.1 100.0 1907 61.9 1.9 10.8 3.2 3.0 4.6 0.8 7.5 6.2 100.0 1908 62.5 1.8 10.9 3.3 3.0 4.4 0.8 7.1 6.2 100.0 1909 62.8 1.9 10.3 3.4 3.2 4.5 0.9 6.8 6.2 100.0 1910 60.6 2.2 10.4 3.3 3.1 4.7 0.9 8.9 6.1 100.0 1911 59.6 2.4 9.6 3.3 3.8 5.3 1.2 8.8 6.1 100.0 1912 60.3 2.4 9.0 3.1 3.8 5.5 1.3 8.5 6.1 100.0 1913 59.3 2.8 8.8 3.4 4.1 5.6 1.4 8.5 6.1 100.0 1914 57.3 3.1 9.5 3.9 5.2 5.8 1.6 7.4 6.2 100.0 1915 55.8 2.8 12.1 3.7 5.0 5.4 1.4 7.7 6.2 100.0 1916 53.3 3.7 12.6 3.5 4.5 5.6 1.4 9.3 6.1 100.0 1917 55.2 3.2 11.1 3.3 4.8 5.5 1.5 9.4 6.1 100.0 1918 55.0 3.5 11.8 3.1 4.0 4.9 1.4 10.1 6.1 100.0 1919 59.1 3.1 10.9 2.7 3.0 4.6 1.2 9.3 6.1 100.0 1920 60.2 2.7 10.0 2.6 2.9 4.3 1.0 10.2 6.0 100.0 1921 56.8 4.0 11.9 3.7 4.3 4.7 1.5 6.8 6.3 100.0 1922 56.0 4.5 10.5 4.8 5.0 4.5 1.8 6.5 6.4 100.0 1923 56.3 3.9 9.5 5.6 5.1 4.2 1.7 7.3 6.5 100.0 1924 57.1 3.8 9.5 5.9 5.2 4.1 1.7 6.2 6.5 100.0 1925 57.0 3.6 9.1 6.0 5.0 4.4 1.6 6.8 6.6 100.0 1926 56.9 3.5 8.6 5.9 4.8 4.4 1.5 7.8 6.6 100.0 1927 56.5 3.4 8.7 6.6 4.9 4.3 1.5 7.4 6.7 100.0 1928 56.5 3.5 8.8 7.4 5.0 4.1 1.6 6.3 6.8 100.0 1929 57.1 3.6 8.5 7.6 5.3 3.9 1.6 5.4 6.9 100.0 1930 57.2 3.6 8.8 7.5 5.4 3.9 1.7 4.9 7.1 100.0 1931 53.8 4.5 10.4 7.4 5.8 4.1 2.2 4.4 7.5 100.0 1932 52.9 5.1 10.4 7.0 6.1 4.1 2.6 4.1 7.6 100.0 1933 52.3 5.1 11.2 6.6 6.3 4.1 2.8 4.0 7.5 100.0 1934 52.9 4.8 9.9 6.4 6.3 4.2 2.7 5.3 7.5 100.0 1935 55.7 4.3 9.5 6.0 6.3 3.9 2.6 4.2 7.6 100.0 1936 55.5 4.5 9.9 6.2 6.6 3.8 2.7 3.2 7.6 100.0 1937 57.2 4.2 9.8 5.8 6.4 3.8 2.5 2.8 7.5 100.0 1938 55.4 4.5 10.5 6.4 6.6 3.8 2.7 2.5 7.5 100.0 1939 54.3 4.8 11.4 6.9 6.6 3.8 2.6 2.2 7.6 100.0
Year Rent DomesticServants
Transport Clubs Miscellaneous(*)
Total Food Beveragesand Tobacco
Clothing Opium/Chandu
Note: (*) Includes health, education, utilities, household equipment and operations, cultural and personal services and other goods and services, n.i.e.
31
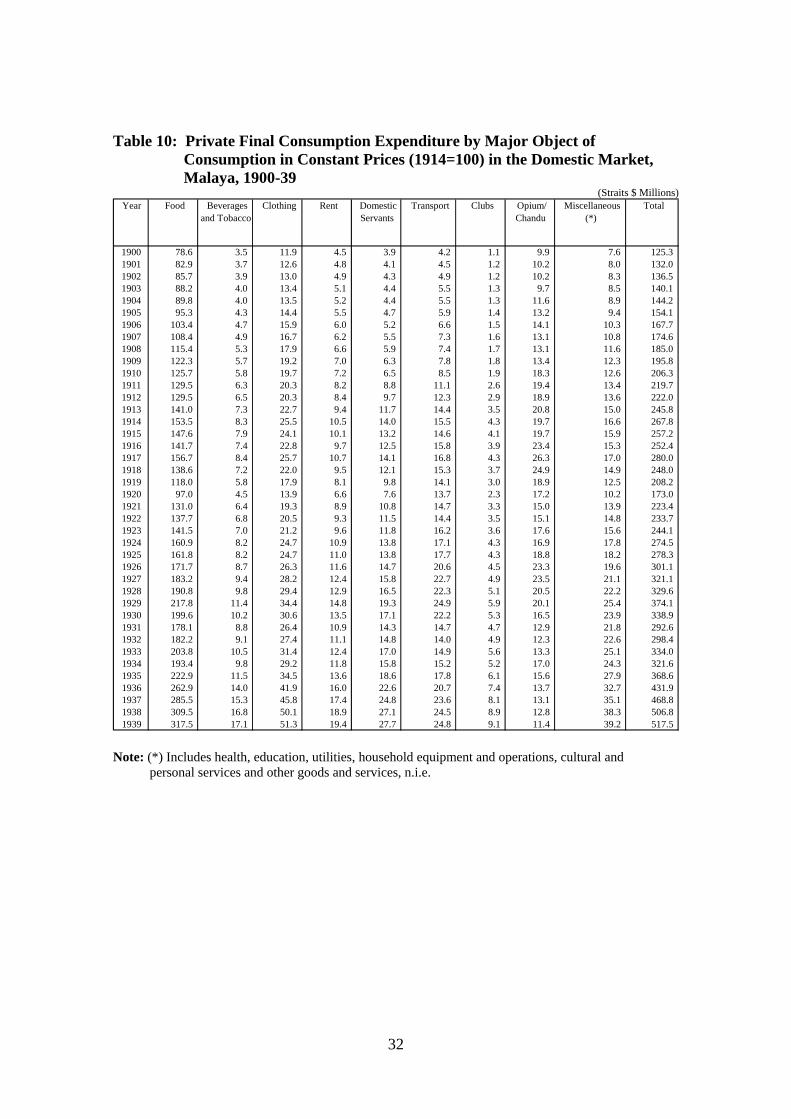
Table 10: Private Final Consumption Expenditure by Major Object of Consumption in Constant Prices (1914=100) in the Domestic Market, Malaya, 1900-39
(Straits $ Millions)
1900 78.6 3.5 11.9 4.5 3.9 4.2 1.1 9.9 7.6 125.3 1901 82.9 3.7 12.6 4.8 4.1 4.5 1.2 10.2 8.0 132.0 1902 85.7 3.9 13.0 4.9 4.3 4.9 1.2 10.2 8.3 136.5 1903 88.2 4.0 13.4 5.1 4.4 5.5 1.3 9.7 8.5 140.1 1904 89.8 4.0 13.5 5.2 4.4 5.5 1.3 11.6 8.9 144.2 1905 95.3 4.3 14.4 5.5 4.7 5.9 1.4 13.2 9.4 154.1 1906 103.4 4.7 15.9 6.0 5.2 6.6 1.5 14.1 10.3 167.7 1907 108.4 4.9 16.7 6.2 5.5 7.3 1.6 13.1 10.8 174.6 1908 115.4 5.3 17.9 6.6 5.9 7.4 1.7 13.1 11.6 185.0 1909 122.3 5.7 19.2 7.0 6.3 7.8 1.8 13.4 12.3 195.8 1910 125.7 5.8 19.7 7.2 6.5 8.5 1.9 18.3 12.6 206.3 1911 129.5 6.3 20.3 8.2 8.8 11.1 2.6 19.4 13.4 219.7 1912 129.5 6.5 20.3 8.4 9.7 12.3 2.9 18.9 13.6 222.0 1913 141.0 7.3 22.7 9.4 11.7 14.4 3.5 20.8 15.0 245.8 1914 153.5 8.3 25.5 10.5 14.0 15.5 4.3 19.7 16.6 267.8 1915 147.6 7.9 24.1 10.1 13.2 14.6 4.1 19.7 15.9 257.2 1916 141.7 7.4 22.8 9.7 12.5 15.8 3.9 23.4 15.3 252.4 1917 156.7 8.4 25.7 10.7 14.1 16.8 4.3 26.3 17.0 280.0 1918 138.6 7.2 22.0 9.5 12.1 15.3 3.7 24.9 14.9 248.0 1919 118.0 5.8 17.9 8.1 9.8 14.1 3.0 18.9 12.5 208.2 1920 97.0 4.5 13.9 6.6 7.6 13.7 2.3 17.2 10.2 173.0 1921 131.0 6.4 19.3 8.9 10.8 14.7 3.3 15.0 13.9 223.4 1922 137.7 6.8 20.5 9.3 11.5 14.4 3.5 15.1 14.8 233.7 1923 141.5 7.0 21.2 9.6 11.8 16.2 3.6 17.6 15.6 244.1 1924 160.9 8.2 24.7 10.9 13.8 17.1 4.3 16.9 17.8 274.5 1925 161.8 8.2 24.7 11.0 13.8 17.7 4.3 18.8 18.2 278.3 1926 171.7 8.7 26.3 11.6 14.7 20.6 4.5 23.3 19.6 301.1 1927 183.2 9.4 28.2 12.4 15.8 22.7 4.9 23.5 21.1 321.1 1928 190.8 9.8 29.4 12.9 16.5 22.3 5.1 20.5 22.2 329.6 1929 217.8 11.4 34.4 14.8 19.3 24.9 5.9 20.1 25.4 374.1 1930 199.6 10.2 30.6 13.5 17.1 22.2 5.3 16.5 23.9 338.9 1931 178.1 8.8 26.4 10.9 14.3 14.7 4.7 12.9 21.8 292.6 1932 182.2 9.1 27.4 11.1 14.8 14.0 4.9 12.3 22.6 298.4 1933 203.8 10.5 31.4 12.4 17.0 14.9 5.6 13.3 25.1 334.0 1934 193.4 9.8 29.2 11.8 15.8 15.2 5.2 17.0 24.3 321.6 1935 222.9 11.5 34.5 13.6 18.6 17.8 6.1 15.6 27.9 368.6 1936 262.9 14.0 41.9 16.0 22.6 20.7 7.4 13.7 32.7 431.9 1937 285.5 15.3 45.8 17.4 24.8 23.6 8.1 13.1 35.1 468.8 1938 309.5 16.8 50.1 18.9 27.1 24.5 8.9 12.8 38.3 506.8 1939 317.5 17.1 51.3 19.4 27.7 24.8 9.1 11.4 39.2 517.5
Year Opium/Chandu
Miscellaneous(*)
Total Food Beveragesand Tobacco
Clothing Rent DomesticServants
Transport Clubs
Note: (*) Includes health, education, utilities, household equipment and operations, cultural and personal services and other goods and services, n.i.e.
32

The growth rates of private final consumption expenditure and per capita private
final consumption expenditure in the domestic market in both current and constant
prices are given in Table 11.
Table 11: Growth Rate of Private Final Consumption Expenditure and Per Capita Private Final Consumption Expenditure in Current and Constant Prices (1914=100), Malaya, 1900-39
Straits $(millions)
GrowthRate (%)
Straits $(millions)
GrowthRate (%)
Straits $ GrowthRate (%)
Straits $ GrowthRate (%)
1900 115.6 125.3 69.15 75.00 1901 119.2 3.2 132.0 5.3 68.77 -0.6 76.15 1.51902 130.8 9.7 136.5 3.4 72.87 6.0 76.02 -0.21903 135.9 3.9 140.1 2.6 72.85 0.0 75.06 -1.31904 139.6 2.7 144.2 3.0 71.96 -1.2 74.32 -1.01905 144.8 3.7 154.1 6.9 72.09 0.2 76.72 3.21906 152.1 5.1 167.7 8.8 73.45 1.9 80.94 5.51907 166.7 9.6 174.6 4.1 77.90 6.1 81.58 0.81908 178.1 6.9 185.0 6.0 81.04 4.0 84.16 3.21909 179.6 0.8 195.8 5.8 80.16 -1.1 87.38 3.81910 189.0 5.3 206.3 5.4 82.14 2.5 89.64 2.61911 213.8 13.1 219.7 6.5 89.10 8.5 91.54 2.11912 231.3 8.1 222.0 1.0 91.84 3.1 88.15 -3.71913 257.4 11.3 245.8 10.8 97.80 6.5 93.41 6.01914 267.8 4.1 267.8 8.9 98.81 1.0 98.81 5.81915 275.5 2.9 257.2 -4.0 99.92 1.1 93.28 -5.61916 291.3 5.7 252.4 -1.8 103.48 3.6 89.66 -3.91917 335.0 15.0 280.0 10.9 116.51 12.6 97.36 8.61918 352.8 5.3 248.0 -11.4 122.44 5.1 86.05 -11.61919 377.5 7.0 208.2 -16.0 131.49 7.4 72.51 -15.71920 403.6 6.9 173.0 -16.9 139.46 6.1 59.80 -17.51921 387.0 -4.1 223.4 29.1 132.39 -5.1 76.42 27.81922 357.1 -7.7 233.7 4.6 121.20 -8.5 79.31 3.81923 364.4 2.1 244.1 4.5 122.33 0.9 81.94 3.31924 410.6 12.7 274.5 12.5 135.14 10.5 90.34 10.21925 428.5 4.3 278.3 1.4 137.06 1.4 89.03 -1.41926 481.8 12.4 301.1 8.2 147.30 7.5 92.05 3.41927 502.2 4.2 321.1 6.7 146.32 -0.7 93.57 1.61928 510.1 1.6 329.6 2.6 144.14 -1.5 93.13 -0.51929 568.9 11.5 374.1 13.5 156.33 8.5 102.79 10.41930 487.6 -14.3 338.9 -9.4 130.19 -16.7 90.48 -12.01931 342.6 -29.7 292.6 -13.7 92.15 -29.2 78.69 -13.01932 300.7 -12.2 298.4 2.0 83.01 -9.9 82.37 4.71933 310.8 3.4 334.0 11.9 85.85 3.4 92.25 12.01934 308.0 -0.9 321.6 -3.7 82.67 -3.7 86.34 -6.41935 376.9 22.4 368.6 14.6 97.26 17.7 95.11 10.11936 432.4 14.7 431.9 17.2 107.40 10.4 107.26 12.81937 507.1 17.3 468.8 8.6 119.61 11.4 110.58 3.11938 524.5 3.4 506.8 8.1 118.43 -1.0 114.42 3.51939 541.4 3.2 517.5 2.1 118.10 -0.3 112.90 -1.3
Current Prices Constant Prices(1914=100)
Current Prices Constant Prices(1914=100)
PFCE Per capita PYear FCE
33

Figures 2 and 3 provide in a graphical form the private final consumption
expenditure and per capita consumption expenditure in the domestic market in current
and constant prices.
Figure 2: Private Final Consumption Expenditure in the Domestic Market in Current and Constant Prices (1914=100), Malaya, 1900-39
-
100
200
300
400
500
600
1900
1901
1902
1903
1904
1905
1906
1907
1908
1909
1910
1911
1912
1913
1914
1915
1916
1917
1918
1919
1920
1921
1922
1923
1924
1925
1926
1927
1928
1929
1930
1931
1932
1933
1934
1935
1936
1937
1938
1939
Year
Stra
its $
(mill
ions
)
Current Prices 1914 Prices
Figure 3: Per Capita Private Final Consumption Expenditure in the Domestic Market in Current and Constant Prices (1914=100), Malaya, 1900-39
-
20
40
60
80
100
120
140
160
180
1900
1901
1902
1903
1904
1905
1906
1907
1908
1909
1910
1911
1912
1913
1914
1915
1916
1917
1918
1919
1920
1921
1922
1923
1924
1925
1926
1927
1928
1929
1930
1931
1932
1933
1934
1935
1936
1937
1938
1939
Year
Stra
its $
Current Prices 1914 Prices
34

5. Observations and Concluding Remarks
Private final consumption expenditure (PFCE)of resident households in the
domestic market, which represents one of the major components of gross domestic
product of Malaya, registered an average annual growth rate of 4.5% and 4.1% in
current and constant terms respectively during the first four decades of the twentieth
century (See Table 12 below). In nominal terms, the PFCE in the first half (1900-19) of
the forty-year period under review recorded an average annual growth rate of 6.5%
which was more than double the rate of 2.6% recorded in the second half (1920-39). In
real terms the average annual growth rate was 3.0% in 1900-19 as against 5.2% in
1920-39.
An analysis of per capita PFCE of Malaya for each of the periods mentioned
above reveals that the pattern of average annual growth rates, both in current and
constant prices, was similar to that of total PFCE. There was practically no growth in
real per capita PFCE during the first half (1900-19). However, the second half recorded
an average annual growth of 2.7%.
Notwithstanding all this, the trend rate of growth of total real private final
consumption expenditure increased from 4.1% in 1900-19 to 4.3% in 1920-39 and in
per capita terms from 1% to 2%.
Table 12: Average annual and trend growth rates (%) of Total PFCE and Per Capita PFCE in Current and Constant terms, Malaya, 1900-39
Current Constant Current Constant Current Constant Current Constant1900-39 4.5 4.1 1.7 1.4 3.7 3.0 1.4 0.71900-19 6.5 3.0 3.5 0.0 6.3 4.1 3.2 1.01920-39 2.6 5.2 0.1 2.7 0.6 4.3 -1.7 2.0
PeriodAverage Annual Growth Trend Growth
PFCE Per Capita PFCEPFCE Per Capita PFCE
35

A closer examination of the annual growth rates of total and per capita private
final consumption expenditure in nominal or in real terms reveals that there was greater
volatility during the second half of the forty-year period. In particular, the standard
deviation of the annual growth rate of total real private consumption expenditure rose
from 49.9 in 1900-19 to 92.1 in 1920-39 and from 8.3 to 13.6 in per capita terms. The
inter-temporal rise in standard deviation is however less spectacular in nominal terms.
The standard deviation of total nominal private final consumption expenditure merely
increased from 81.6 to 83.6 while in per capita terms from 18.7 to 22.8.
The higher volatility during the 1920-39 period merits a closer examination of
the factors that possibly contributed to the exceptionally low or high annual growth
rates seen in certain years. In particular, the focus of our attention in this respect will be
on: (i) the year 1920 which witnessed high negative growth rates of real total PFCE and
per capita PFCE though in nominal terms the rates recorded were positive, (ii) the Great
Depression years (1930-32) in which the total PFCE and per capita PFCE, both in
nominal and real terms, generally recorded negative growth rates running well into
double digits and (iii) finally, the year 1937 which recorded extremely high growth rates
in the total PFCE and per capita PFCE, particularly in current terms.
In the immediate post World War I year of 1920, although the total PFCE and
per capita PFCE grew by about 6% in current terms, their growth rates in real terms was
well into the negative territory recording the lowest rates during the forty-year period
under review. This state of affairs could mainly be attributed to the sharp increase in the
CPI by some 30 per cent in 1920, a follow-through from the increase of 29% recorded a
year earlier. This increase in CPI was mainly fuelled by the sharp increases in the prices
of nearly all major objects of consumption during this year. This sharp increase in CPI
36
in 1920 was not a phenomenon peculiar to Malaya but was consistent with the world-
wide increase in prices experienced by most countries after the end of World War I.
The sharp decline in the growth rates of total PFCE and per capita PFCE (both
in nominal and real terms) for Malaya during the Great Depression years of 1930-32
was only to be expected. During this period, the Malayan economy was in poor shape
since one of the many results of the world-wide slump, then at its worst, was a
catastrophic fall in the price of rubber, an industry in which one third of the working
population was engaged. This combined with the then relatively low price ruling for tin,
resulted in widespread unemployment and consequently led to considerable emigration
of Chinese and Indians to their countries of origin. The population growth consequently
registered its sharpest decline during the forty-year period, recording a negative growth
of 2.6% in 1932. Nominal and real wages of those fortunate enough to be employed fell
sharply, registering double digit negative growth rates especially in 1930 and 1931. A
case in point is that of the Malayan Indian adult nominal minimum daily wage rate for
rubber tappers which dropped from 50 cents in 1929 to 40 cents and 30 cents in 1930
and 1931, thus registering a drop of 20% and 25% respectively. 10
The year 1937 presented a silver lining for the economy of Malaya. During this
year, Malaya recorded one of the highest growth rates in total PFCE and per capita
PFCE especially in nominal terms for the entire forty-year period under review.
Malaya’s population growth rate reached its zenith during this period in 1937, recording
a figure of 5.2%. During this year there was an increase in the production of rubber,
accompanied by increases in wage rates sparked off by increased demand for labour
from the mining and planting industries especially rubber. An increase in demand for
10 Srinivasa Sastri V.S.,(1937), p.3.
37
labour in rubber estates followed increased releases of rubber under the International
Rubber Regulation Scheme. The average price of rubber in 1937 was 32 cents per
pound with a minimum wage rate of 45 cents a day compared to 10 cents and 28 cents
respectively in 1933. Consequently, net immigration of Chinese and Indians in 1937
was the highest for any one year in pre World War II Malaya.
The data on PFCE and per capita PFCE upon which the above observations and
analysis are based has been derived using various surrogates in the absence of any
household expenditure and income surveys, retail trade surveys as well as reliable data
on production and import statistics by commodities during the period under review. Not
withstanding this, the data on PFCE and per capita PFCE of Malaya derived using the
various methodologies, assumptions and surrogate data, seems to be fairly reasonable
when compared over time as well as with other selected countries.
The reasonableness of data derived for PFCE in terms of major objects of
consumption for Malaya is demonstrated in Appendix 9. For example, the data on the
percentage consumption expenditure on food, representing the biggest item, was
congruent with the general expectation that the proportion of consumption expenditure
on food decreases as income increases over time. The percentage of consumption
expenditure on food in Malaya estimated at 65.2% in 1900 declined to 56.3% in 1923,
54.3% in 1939, 46.7% at the time of Independence in 1957 and further to 37.7 in 1970.
A comparison in terms of the percentage of consumption expenditure incurred
on food, beverages and tobacco for Malaya and selected countries (Taiwan, Korea,
Japan, Finland and UK) all displayed, in general, a downward trend over the period
under review (See Appendix 10). In the case of total PFCE the sharp decline
experienced by Malaya in 1921 and 1922 paralleled similar declines in Korea, Taiwan
38
and UK. During the Great Depression years of 1930 and 1931, all selected countries
along with Malaya experienced negative growth in their PFCE. Malaya continued to
display negative growth in PFCE in 1932 along with UK and Finland (See Appendix
11).
39
APPENDIX 1 Brief Notes on the Conventional Methods of Estimating Private Consumption Expenditure 1. Direct Method (Household Expenditure Survey)
In this method, the PFCE is estimated by inflating the data collected in a sample
survey of household consumption expenditure covering all households, amongst others,
by means of ratio estimates. The household data is compiled to provide a measure of the
flow of goods and services purchased by households at purchasers’ or market prices, not
only according to the class of commodity but also the object of consumption. This
method also provides classification of expenditure according to household
characteristics, such as the level of household income and socio-economic status.
However, the use of data from the household expenditure survey is subject to some
limitations as given below:-
(i) The survey is based on a small sample of households and / or may refer to particular
groups of the population only. Normally, the institutional population is not covered.
(ii) Biases in the data may arise because of non-response or because of difficulty in
gathering reliable information about expenses on items purchased infrequently or
socially disapproved. Respondents generally understate their expenditure on items such
as alcoholic drinks, tobacco, gambling and other entertainment due to religious and
cultural reasons. They are also reluctant to reveal how much they spend on socially
unacceptable activities. This is certainly evident when we compare the consumption of
these items recorded against relatively reliable production and import statistics.
(iii) The household surveys do not, in general, cover the rent of owner-occupied
dwellings. In addition, the imputed service charge for casualty and life insurance cannot
be properly estimated by respondents. The national accountants using data from
40

household surveys and other sources of data would impute the service charge for
casualty and life insurance for households.
2. Commodity Flow Approach
The commodity flow approach would provide fairly reliable estimates of the
PFCE of commodities by households. However, it can only be adopted if we have fairly
good statistics on production, imports, exports, capital formation, intermediate
consumption, stocks and other related statistics. The commodity flow table traces the
use of a particular commodity by various end-users, e.g. household consumers,
intermediate consumption by industries (agriculture, forestry, fishing, livestock, mining
and quarrying, construction, wholesale, retail and catering trades and other services
sector), producers of government services or other final demands. Based on the
commodity flow table, it is relatively easy to construct an input-output table using the
“make” and “absorption” matrices. This input-output table can then be used to
determine the PFCE based on the movements of production of commodities, imports,
etc. However, the coefficients of the input-output tables should be revised from time to
time, at least once in 5-10 years. It should be recognized that the construction of a
commodity flow table is rather tedious and time consuming. The commodity flow tables
would be as good as the basic data used to construct it. A number of adjustments have to
be made to the basic data to match the supply of and demand for goods and services.
For example, production /output statistics may be based on basic or producer prices,
import statistics are in basic prices while private final consumption are in market prices.
In order to match supply of and demand for goods and services in value terms to
estimate PFCE, it is imperative that the supply and demand statistics should be adjusted
to be in line with market prices. For example, if supply statistics are based on producer
41

prices, then it should be converted to market prices by assigning the trade and transport
margins to the producer prices to match the demand statistics in market prices.
3. Retail Valuation Method
This method is utilized when primary information on household consumption is
available in terms of quantities. The household expenditure is then computed by
multiplying the quantity consumed by the households by the retail prices paid by them.
Quantity data of various commodities purchased by households may be based on
official statistics of the supply of goods and services, changes in the commodity stocks,
data from trade associations or data from household expenditure surveys.
The retail valuation method is normally used in estimating household purchases
of non-durable goods such as food, beverages, clothing, fuel, electricity and specific
durables such as automobiles, radio and television sets. The quantities of such items
purchased by households could be obtained from government authorities in charge of
taxation or registration which provide basic information on the users of such items.
One of the advantages of the retail valuation method as compared to the
commodity flow approach is that purchases of goods may be valued at purchasers’
prices. The available quantity may also be more reliable than the value data generated.
On the other hand, the compilation of appropriate average retail prices to value the
quantities of commodities that households consume or acquire may be difficult to obtain.
Correct weights for geographical price differences, adjustments for variations in quality,
etc, are not available. In practice, only simple averages of the prices utilized in
computing indices of retail or consumer prices are used.
42
4. Retail Sales Method
This method takes into account data on sales gathered from retailers and other
outlets selling goods and services direct to household consumers. The results of the
comprehensive but infrequent censuses of wholesale, retail, catering and services
industries usually form the basis for the benchmark estimate by this method. Less
comprehensive annual and more frequent inquires are used to extrapolate from the
benchmark estimates. Retail purchases are made from retail outlets. In estimating
household consumption expenditure from retail trade surveys it is essential that
adjustments are made to eliminate retail purchases for uses other than household
consumption. Retail purchases for other uses can often be identified based on the nature
of the commodity concerned. A good example would be building and construction
materials and office equipment that should be excluded though some of these items may
be acquired for household final consumption. Purchases of cars, gasoline and a host of
other commodities should be assigned between household use and other end-users.
Issues of apportioning expenditure items between final consumption of households and
the intermediate consumption or gross capital formation of industries arise in instances
of goods utilized both by professional practitioners and other individual proprietors in
production and by households. Such problems arise for example, in the case of motor-
cars and outlays on rent, fuel, lighting, etc. and of dwellings used for both production
and household purposes. The basis for dividing the expenditure in question among
multiple end-users in this instance may be decided by the degree of utilization measured
in terms of kilometres run by the automobiles and the number of hours utilized for other
items used for dual purposes.
43

Estimates of household final consumption should also take into account retail
purchases of households made directly from wholesalers, manufacturers or the farmers.
Independent estimates of imputed rent of owner-occupied dwellings, imputed service
charges for casualty and life insurance, goods and services received as income in kind
and commodities produced for own-account household consumption have to be
provided for. Other services consumed are also to be incorporated into this approach to
derive the total PFCE in the domestic market.
It must be noted that the retail sales method, like the direct method, measures the
household consumption expenditure at the time of purchase and at prices actually paid
by the household. However, difficulties are encountered in using the retail sales method
for estimating household consumption expenditure as the retail sales and other outlets
would not be able to provide even annual estimates on sales classified according to kind
of commodity. As a result, annual estimates are derived by extrapolating from the
benchmark estimates. The indicators used in the extrapolation process are normally
constructed from relatively frequent inquiries on sales by retail outlets classified
according to their “main kind of business”. Indicators of this nature are only
approximate measures of trends of given goods or services. The increasing tendency of
retail outlets to become less specialized and to sell a wide range of commodities without
maintaining separate records for each sales department makes these indicators a less
reliable means of extrapolating from benchmark estimates for the various classes of
commodities.
44
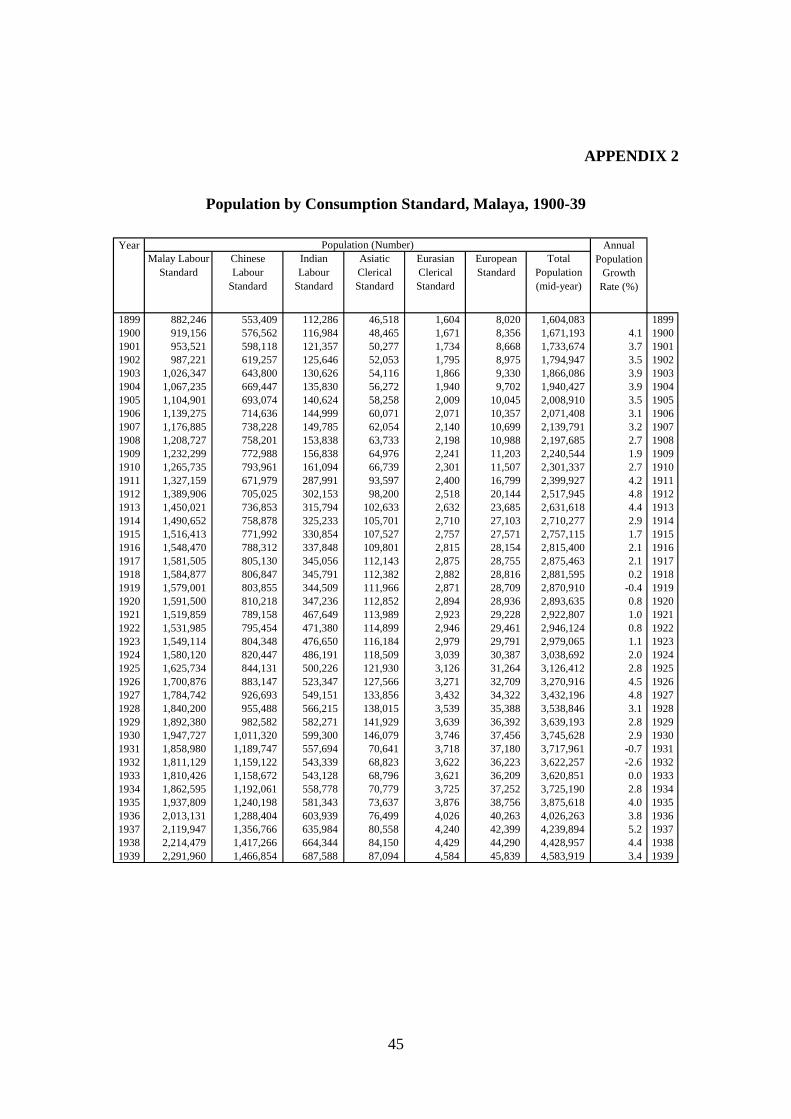
APPENDIX 2
Population by Consumption Standard, Malaya, 1900-39
Malay LabourStandard
ChineseLabour
Standard
IndianLabour
Standard
AsiaticClericalStandard
EurasianClericalStandard
EuropeanStandard
TotalPopulation(mid-year)
1899 882,246 553,409 112,286 46,518 1,604 8,020 1,604,083 18991900 919,156 576,562 116,984 48,465 1,671 8,356 1,671,193 4.1 19001901 953,521 598,118 121,357 50,277 1,734 8,668 1,733,674 3.7 19011902 987,221 619,257 125,646 52,053 1,795 8,975 1,794,947 3.5 19021903 1,026,347 643,800 130,626 54,116 1,866 9,330 1,866,086 3.9 19031904 1,067,235 669,447 135,830 56,272 1,940 9,702 1,940,427 3.9 19041905 1,104,901 693,074 140,624 58,258 2,009 10,045 2,008,910 3.5 19051906 1,139,275 714,636 144,999 60,071 2,071 10,357 2,071,408 3.1 19061907 1,176,885 738,228 149,785 62,054 2,140 10,699 2,139,791 3.2 19071908 1,208,727 758,201 153,838 63,733 2,198 10,988 2,197,685 2.7 19081909 1,232,299 772,988 156,838 64,976 2,241 11,203 2,240,544 1.9 19091910 1,265,735 793,961 161,094 66,739 2,301 11,507 2,301,337 2.7 19101911 1,327,159 671,979 287,991 93,597 2,400 16,799 2,399,927 4.2 19111912 1,389,906 705,025 302,153 98,200 2,518 20,144 2,517,945 4.8 19121913 1,450,021 736,853 315,794 102,633 2,632 23,685 2,631,618 4.4 19131914 1,490,652 758,878 325,233 105,701 2,710 27,103 2,710,277 2.9 19141915 1,516,413 771,992 330,854 107,527 2,757 27,571 2,757,115 1.7 19151916 1,548,470 788,312 337,848 109,801 2,815 28,154 2,815,400 2.1 19161917 1,581,505 805,130 345,056 112,143 2,875 28,755 2,875,463 2.1 19171918 1,584,877 806,847 345,791 112,382 2,882 28,816 2,881,595 0.2 19181919 1,579,001 803,855 344,509 111,966 2,871 28,709 2,870,910 -0.4 19191920 1,591,500 810,218 347,236 112,852 2,894 28,936 2,893,635 0.8 19201921 1,519,859 789,158 467,649 113,989 2,923 29,228 2,922,807 1.0 19211922 1,531,985 795,454 471,380 114,899 2,946 29,461 2,946,124 0.8 19221923 1,549,114 804,348 476,650 116,184 2,979 29,791 2,979,065 1.1 19231924 1,580,120 820,447 486,191 118,509 3,039 30,387 3,038,692 2.0 19241925 1,625,734 844,131 500,226 121,930 3,126 31,264 3,126,412 2.8 19251926 1,700,876 883,147 523,347 127,566 3,271 32,709 3,270,916 4.5 19261927 1,784,742 926,693 549,151 133,856 3,432 34,322 3,432,196 4.8 19271928 1,840,200 955,488 566,215 138,015 3,539 35,388 3,538,846 3.1 19281929 1,892,380 982,582 582,271 141,929 3,639 36,392 3,639,193 2.8 19291930 1,947,727 1,011,320 599,300 146,079 3,746 37,456 3,745,628 2.9 19301931 1,858,980 1,189,747 557,694 70,641 3,718 37,180 3,717,961 -0.7 19311932 1,811,129 1,159,122 543,339 68,823 3,622 36,223 3,622,257 -2.6 19321933 1,810,426 1,158,672 543,128 68,796 3,621 36,209 3,620,851 0.0 19331934 1,862,595 1,192,061 558,778 70,779 3,725 37,252 3,725,190 2.8 19341935 1,937,809 1,240,198 581,343 73,637 3,876 38,756 3,875,618 4.0 19351936 2,013,131 1,288,404 603,939 76,499 4,026 40,263 4,026,263 3.8 19361937 2,119,947 1,356,766 635,984 80,558 4,240 42,399 4,239,894 5.2 19371938 2,214,479 1,417,266 664,344 84,150 4,429 44,290 4,428,957 4.4 19381939 2,291,960 1,466,854 687,588 87,094 4,584 45,839 4,583,919 3.4 1939
Year AnnualPopulation
GrowthRate (%)
Population (Number)
45
APPENDIX 3 Estimates of Price Indices for Major Objects of Consumption and Consumption Standards, Malaya, 1915-17 and 1939. Food Price Indices for Asiatic Clerical Standard11 (1915-17 and 1939)
For this purpose, the full meat diet scale data in quantity terms of Malay and
Chinese labour standards in 1936 and that of Indian labourer’s specimen monthly
budget (1933) were used. We then applied the relevant 1914 unit market price of every
food item in these baskets. We were then able to establish the base year weights (1914)
for each of the items in the baskets based on the weighted per capita consumption. A
unit market price series for each expenditure item of each standard was then constructed
for the years 1914-39. The unit market price series was then converted to an index with
base year 1914=100 for each item of expenditure and for each standard. Using the
weights of private final consumption expenditure in 1914 and the relevant price index of
each labour standard we arrived at the weighted price index for each year for the period
1914-39 for the respective labour standards. The overall price index was then calculated
taking into account the base weights (1914) of private final consumption expenditure on
food of each of the labour standards. An examination of the price index thus derived
showed that in 1918, the index stood at 142.43 as against Singapore’s cost-of-living
index of the Asiatic Clerical Standard of 140.40 for 1918 using 1914 as the base year. It
was observed therefore that our estimates of price index in 1918 seemed to have been a
slight overstatement (by 1.4%) compared to Singapore’s price index. Based on this
observation, it was felt that the over-estimation for the years 1915-17 would also be of
the same magnitude and therefore applied an adjustment factor of 0.986 to bring it in
line with that of the Singapore’s cost-of-living index of food. The price index for the
11 To recapitulate, this applies to Malay, Chinese and Indian Labour Standards as well.
46
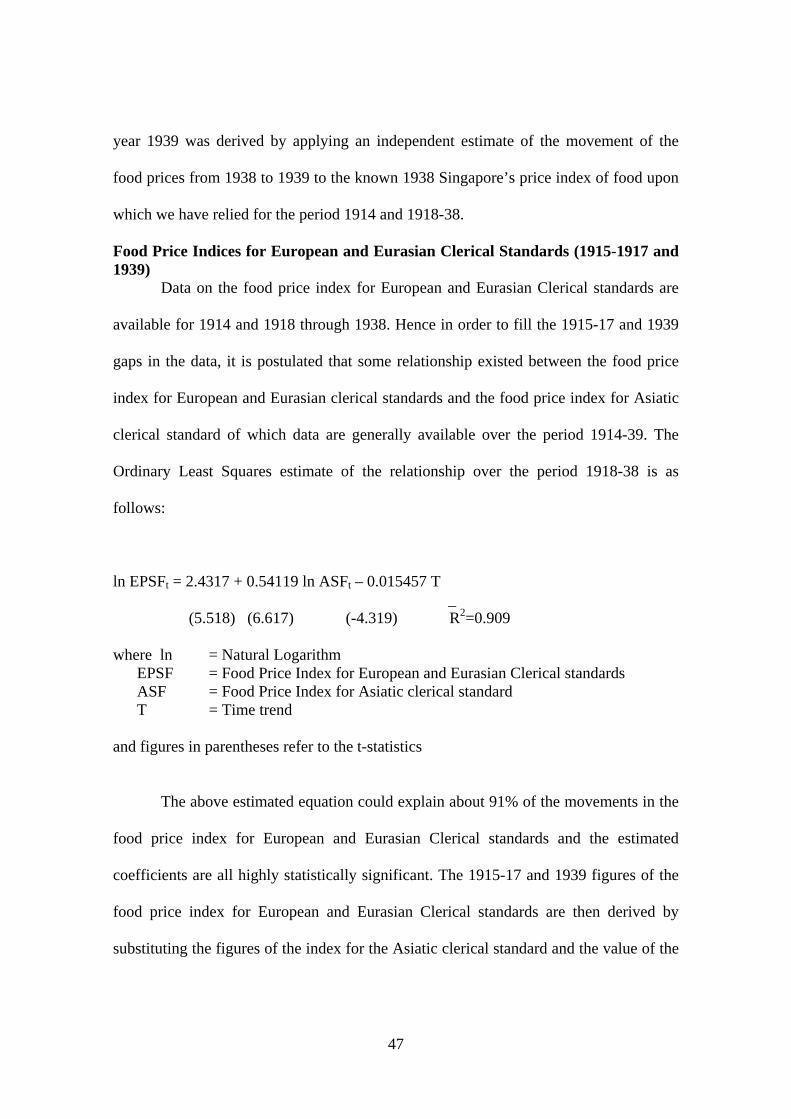
year 1939 was derived by applying an independent estimate of the movement of the
food prices from 1938 to 1939 to the known 1938 Singapore’s price index of food upon
which we have relied for the period 1914 and 1918-38.
Food Price Indices for European and Eurasian Clerical Standards (1915-1917 and 1939)
Data on the food price index for European and Eurasian Clerical standards are
available for 1914 and 1918 through 1938. Hence in order to fill the 1915-17 and 1939
gaps in the data, it is postulated that some relationship existed between the food price
index for European and Eurasian clerical standards and the food price index for Asiatic
clerical standard of which data are generally available over the period 1914-39. The
Ordinary Least Squares estimate of the relationship over the period 1918-38 is as
follows:
ln EPSFt = 2.4317 + 0.54119 ln ASFt – 0.015457 T _
(5.518) (6.617) (-4.319) R2=0.909 where ln = Natural Logarithm
EPSF = Food Price Index for European and Eurasian Clerical standards ASF = Food Price Index for Asiatic clerical standard T = Time trend and figures in parentheses refer to the t-statistics
The above estimated equation could explain about 91% of the movements in the
food price index for European and Eurasian Clerical standards and the estimated
coefficients are all highly statistically significant. The 1915-17 and 1939 figures of the
food price index for European and Eurasian Clerical standards are then derived by
substituting the figures of the index for the Asiatic clerical standard and the value of the
47
time trend variable for the corresponding years in the equation and then taking the anti-
logs of the so derived figures.
Tobacco Price Index for All Standards (1915-17 and 1939)
The price index of tobacco was based on the import unit value of tobacco. It was
observed that the estimates were understated compared to Singapore’s tobacco price
index in 1918. Based on this observation, it was felt that the under-estimation was also
true for the years 1915-17. To ensure this import unit value index was in line with
Singapore’s cost-of-living index for tobacco, the estimates were adjusted accordingly.
For the year 1939, the estimates were solely based on the price movement of
imports of unmanufactured tobacco from 1938-39, the only relevant information that
was available.
Tobacco and Beverages Price Index for European Standard (1915-17 and 1939)
The approach taken to determine the tobacco price index for European Standard
was similar to that referred to above. It was noted that for the European Standard, there
was no index solely for tobacco. Index was only available for tobacco and beverages
combined for the years 1914 and 1918-38. Therefore, there was a need to compute a
combined tobacco and beverages price index for the European Standard for the other
years. The weights for expenditure on beverages (85%) and tobacco (15%) were based
on the 1930 Family Budget for the European Standard in Singapore. The price index for
beverages for 1914-18 was based on the simple arithmetic average of import unit values
of brandy, gin, whisky and wine while for the years 1938 and 1939 on beer, ale, brandy
and whisky. The weighted index for tobacco and beverages was then computed. For the
year 1918, the estimate based on the import unit value was an overstatement when
compared to Singapore’s cost-of-living index for tobacco and beverages. This over-
48
estimation was then addressed by adjusting the 1915-17 figures accordingly. For the
price increase from 1938 to 1939, the increase in the weighted (tobacco and beverages)
import unit value price index was used.
Clothing Price Index for All Standards (1915-17 and 1939)
Detailed statistics on prices of clothing (c.i.f. values or market prices) were not
available for these years. The only information available was the import unit values of
“sarongs and selendangs” and “woolen cloth”. Appropriate weights to each of these
items could not be assigned as detailed information on the consumption of these
clothing items by households was absent. Therefore, a simple arithmetic average of the
two groups of commodities was taken to determine the price movement of clothing. The
computation procedure for the price index of clothing for these years was similar to that
used for deriving the price index of tobacco mentioned earlier.
Servant Price Index for Asiatic and Eurasian Clerical, and European Standards (1915-17 and 1939)
Data on the servant price index for the period 1915-17 and 1939 were rather
weak. An attempt was made to establish whether there was a relationship between
Singapore’s cost-of-living index on servants and the nominal wage indices of non-
agriculture sector (“trades”) and agriculture sector (simple arithmetic average of Indian
adult male rubber tappers and “trades”). It was noted that during 1920-29, the nominal
wage rate of non-agriculture workers and Singapore’s cost-of-living index on servants
remained rather stable though the levels differed. By and large, the nominal wage of
non-agriculture workers appeared to move in the same direction as Singapore’s cost-of-
living index on servants in 1920-38. The correlation between Singapore’s cost-of-living
index on servants and the wage index in the non-agriculture sector for the period 1920-
49
38 was 0.952 whereas that of agriculture was 0.487. Taking into account the stable
relationship between the movements of non-agricultural workers’ wage index and
Singapore’s cost-of-living index on servants, in particular 1920-29, it was felt that the
ratio of the wage index of non-agriculture workers to the Singapore’s cost-of-living
index on servants in 1918 could be applied for the period 1915-17.
It was noted that the nominal wage rate indices of agriculture and non-
agriculture workers in 1937 and 1938 remained relatively stable. The Singapore cost-of-
living index on servants also remained relatively stable in 1937 and 1938. The wage
indices in 1939 for agriculture and non-agricultural workers remained as in 1937 and
1938. Therefore, it was felt that the servants index would also remain the same in 1939
as in 1938.
Transport Price Index for European, Asiatic and Eurasian Clerical Standards (1915-17 and 1939)
In the absence of any reliable data pertaining to the transport price index during
this period, it was felt that the United Kingdom (UK) travel and vehicle price index be
used in general to reflect the changes in the transport index for Malaya. The rationale
for using the UK index was that a large proportion of items of transport were imported
from UK, e.g. motor cars, parts and related items and these would in general reflect
price changes in Malaya.
However, for 1917 and 1918 it was observed that there were notable increases in
the UK travel and vehicles price index due mainly to World War I. It was felt that the
war would not have affected Malaya to the same degree as the United Kingdom.
Supporting evidence showed that for the year 1918, the Singapore transport index
(1914=100) recorded an increase to only 112.5 compared to United Kingdom’s 138.4. It
50
was felt that adjustments ought to be made to the UK index to reflect actual price
movements in Malaya. An adjustment factor of 1.23 based on the 1918 difference
between the UK and the Singapore indices was then used to establish the index for
Malaya for reference year 1917. However, for the years 1915 and 1916 the figures of
United Kingdom were adopted for Malaya without any change. In the absence of any
official price index for transport services in UK and Singapore for 1939, an estimate
was made based on the movement of wholesale prices of petrol12 in UK for this year.
Rent Price Index for Asiatic and Eurasian Clerical, and All Labour Standards (1915-17)
There were no comprehensive housing censuses prior to World War I. No data
was available on the total number of dwellings by type e.g. bungalows, semi-detached,
etc. Only scanty data was available on rental values of dwellings from 1908-19 in the
urban areas of Singapore. However, information on the rental values ranging from
Straits $25- Straits $60 per month for 26 housing units was available. Based on these
data, it was assumed that the movements of the rental values of these types of units
would provide a fairly reliable picture of the movements in the price of rentals of
dwellings of the Asiatic clerical and all labour standards in Malaya. The rental price
index for dwellings from 1908-19 (1914=100) was then computed. Figures on the
Asiatic rental price index of dwellings from the Singapore cost-of-living index were
available for the years 1918 and 1919. A comparison was made between the Singapore
rental price index and data computed using the 26 sample houses from the Bucknill
Report for these years. The results are presented below.
12 London Chamber of Commerce Journal.
51

1918 1919 Bucknill Report Singapore Cost-of-Living Indices (rental of dwellings)
117.40
120.00
130.60
130.00
The fact that the 1918 and 1919 rental indices from these two sources are close
to each other, buttressed our confidence that the index computed from the 26 housing
units would also provide a fairly reliable estimate of the rental price of dwellings for the
period 1908-17. Consequently, it was decided that for the Asiatic clerical and all labour
standards, the rental price index computed in this manner be used for Malaya.
Rent Price Index for European Standard (1915-17)
The Bucknill Report listed the rental price index of 23 units of dwellings of
which rentals ranged from Straits $65 a month to Straits $ 170. It was noted that for the
years 1918 and 1919 the estimates based on 23 dwelling units from the Bucknill Report
far exceeded the Singapore cost-of-living index on rent. Hence, it was decided that an
alternative approach was necessary to identify and compute the rental of dwelling index
that would conform to the 1918 and 1919 Singapore’s cost-of-living index. Data on
seven selected housing units provided a series in which the 1918 and 1919 data
conformed to the 1918 and 1919 cost-of-living index on rentals of dwellings in
Singapore. It was felt that this exercise would provide the most reliable estimates for the
years 1908-17 for the European Standard.
Rent Price Indices for All Standards (1939)
The cost-of-living indices on rent for the various standards were not available
for the year 1939. Therefore, surrogate data had to be used. It was felt that changes in
the assessment values from 1938 to 1939 would provide a reliable estimate of changes
52

in the rental prices from 1938 to 1939. The movement of prices of rentals in Kuala
Lumpur was studied and it was noted that over a period of time the movements of these
rentals were in tandem with those in Singapore although the levels differed. An
adjustment factor was then applied to bring the price movements of rentals in Kuala
Lumpur to be in line with those in Singapore. For the European Standard, the average
assessment value of Group III houses (assessment values ranging from Straits $ 100-200
per month) was taken. For the Eurasian and Asiatic Clerical and all Labour Standards
the average assessment value of Group I houses (assessment values ranging from Straits
$ 1-49 per month) was adopted as the basis for obtaining these indices.
Clubbing Price Index for the European Standard (1915-17 and 1939)
The price index for expenditure on clubs was based on the simple arithmetic
average of prices of food and tobacco and beverages consumed by the European
Standard. The estimates of food and tobacco and beverages price indices have already
been discussed earlier. Adjustment factors were applied to the 1915-17 estimated series
based on the observation made with regard to Singapore’s cost-of-living index for 1918
compared to the derived estimates for the same year. The price index for the year 1939
was solely based on the simple arithmetic average of estimated price movements of
food and tobacco and beverages from 1938 to 1939.
53

54
Summary of Price Indices of Major Objects of Consumption and Consumption Standards, 1914-1939
The results of the computation of price indices for major objects of consumption and
consumption standards are given in the following page.

Consumption StandardMalay Labour Standard 1914 1915 1916 1917 1918 1919 1920 1921 1922 1923 1924 1925 1926 1927 1928 1929 1930 1931 1932 1933 1934 1935 1936 1937 1938 1939
1 Food & Groceries 100.00 101.87 107.66 116.34 140.40 191.20 253.20 167.70 145.50 145.30 146.10 151.50 160.20 154.80 151.20 149.70 140.20 103.00 86.50 78.80 83.40 93.90 91.00 101.50 93.70 92.83
2 Tobacco 100.00 105.44 165.69 131.26 174.30 200.00 257.10 242.90 242.90 200.00 185.70 185.70 194.20 185.70 185.70 185.70 171.40 171.40 165.70 142.90 142.90 128.60 128.60 128.60 128.60 144.68
3 Clothing 100.00 138.32 161.28 144.02 189.80 229.60 291.60 237.20 182.80 163.60 157.10 158.10 157.50 155.40 151.90 141.00 139.80 133.20 110.00 106.90 99.50 99.70 98.30 105.80 108.10 117.50
4 Rent 100.00 103.23 106.15 107.53 120.00 130.00 150.00 154.00 181.00 217.00 230.00 242.00 257.00 284.00 312.00 314.50 289.70 247.40 200.40 175.60 175.60 175.60 175.60 177.70 188.90 207.65
Chinese Labour Standard 1914 1915 1916 1917 1918 1919 1920 1921 1922 1923 1924 1925 1926 1927 1928 1929 1930 1931 1932 1933 1934 1935 1936 1937 1938 1939
1 Food & Groceries 100.00 101.87 107.66 116.34 140.40 191.20 253.20 167.70 145.50 145.30 146.10 151.50 160.20 154.80 151.20 149.70 140.20 103.00 86.50 78.80 83.40 93.90 91.00 101.50 93.70 92.83
2 Tobacco 100.00 105.44 165.69 131.26 174.30 200.00 257.10 242.90 242.90 200.00 185.70 185.70 194.20 185.70 185.70 185.70 171.40 171.40 165.70 142.90 142.90 128.60 128.60 128.60 128.60 144.68
3 Clothing 100.00 138.32 161.28 144.02 189.80 229.60 291.60 237.20 182.80 163.60 157.10 158.10 157.50 155.40 151.90 141.00 139.80 133.20 110.00 106.90 99.50 99.70 98.30 105.80 108.10 117.50
4 Rent 100.00 103.23 106.15 107.53 120.00 130.00 150.00 154.00 181.00 217.00 230.00 242.00 257.00 284.00 312.00 314.50 289.70 247.40 200.40 175.60 175.60 175.60 175.60 177.70 188.90 207.65
Indian Labour Standard 1914 1915 1916 1917 1918 1919 1920 1921 1922 1923 1924 1925 1926 1927 1928 1929 1930 1931 1932 1933 1934 1935 1936 1937 1938 1939
1 Food & Groceries 100.00 101.87 107.66 116.34 140.40 191.20 253.20 167.70 145.50 145.30 146.10 151.50 160.20 154.80 151.20 149.70 140.20 103.00 86.50 78.80 83.40 93.90 91.00 101.50 93.70 92.83
2 Tobacco 100.00 105.44 165.69 131.26 174.30 200.00 257.10 242.90 242.90 200.00 185.70 185.70 194.20 185.70 185.70 185.70 171.40 171.40 165.70 142.90 142.90 128.60 128.60 128.60 128.60 144.68
3 Clothing 100.00 138.32 161.28 144.02 189.80 229.60 291.60 237.20 182.80 163.60 157.10 158.10 157.50 155.40 151.90 141.00 139.80 133.20 110.00 106.90 99.50 99.70 98.30 105.80 108.10 117.50
4 Rent 100.00 103.23 106.15 107.53 120.00 130.00 150.00 154.00 181.00 217.00 230.00 242.00 257.00 284.00 312.00 314.50 289.70 247.40 200.40 175.60 175.60 175.60 175.60 177.70 188.90 207.65
Asiatic Clerical Standard 1914 1915 1916 1917 1918 1919 1920 1921 1922 1923 1924 1925 1926 1927 1928 1929 1930 1931 1932 1933 1934 1935 1936 1937 1938 1939
1 Food & Groceries 100.00 101.87 107.66 116.34 140.40 191.20 253.20 167.70 145.50 145.30 146.10 151.50 160.20 154.80 151.20 149.70 140.20 103.00 86.50 78.80 83.40 93.90 91.00 101.50 93.70 92.83
2 Tobacco 100.00 105.44 165.69 131.26 174.30 200.00 257.10 242.90 242.90 200.00 185.70 185.70 194.20 185.70 185.70 185.70 171.40 171.40 165.70 142.90 142.90 128.60 128.60 128.60 128.60 144.68
3 Servant 100.00 103.82 103.82 113.09 116.80 116.80 155.50 155.50 155.50 155.50 155.50 155.50 155.50 155.50 155.50 155.50 152.90 138.00 124.70 115.80 123.70 127.40 125.70 130.00 128.20 128.20
4 Transport 100.00 101.83 103.13 108.64 112.50 122.90 126.80 122.80 112.00 94.80 99.40 105.30 103.50 94.20 93.10 89.70 85.50 96.20 89.00 85.40 84.50 82.40 80.00 81.40 81.50 82.18
5 Clothing 100.00 138.32 161.28 144.02 189.80 229.60 291.60 237.20 182.80 163.60 157.10 158.10 157.50 155.40 151.90 141.00 139.80 133.20 110.00 106.90 99.50 99.70 98.30 105.80 108.10 117.50
6 Rent 100.00 103.23 106.15 107.53 120.00 130.00 150.00 154.00 181.00 217.00 230.00 242.00 257.00 284.00 312.00 314.50 289.70 247.40 200.40 175.60 175.60 175.60 175.60 177.70 188.90 207.65
Eurasian Clerical Standard 1914 1915 1916 1917 1918 1919 1920 1921 1922 1923 1924 1925 1926 1927 1928 1929 1930 1931 1932 1933 1934 1935 1936 1937 1938 1939
1 Food & Groceries 100.00 134.70 136.67 140.34 136.50 160.30 214.30 168.80 140.00 141.00 139.80 143.40 153.00 155.00 149.40 141.40 132.00 109.70 97.80 93.80 96.10 97.20 96.10 102.60 96.20 88.39
2 Tobacco 100.00 105.44 165.69 131.26 174.30 200.00 257.10 242.90 242.90 200.00 185.70 185.70 194.20 185.70 185.70 185.70 171.40 171.40 165.70 142.90 142.90 128.60 128.60 128.60 128.60 144.68
3 Servant 100.00 103.82 103.82 113.09 116.80 116.80 155.50 155.50 155.50 155.50 155.50 155.50 155.50 155.50 155.50 155.50 152.90 138.00 124.70 115.80 123.70 127.40 125.70 130.00 128.20 128.20
4 Transport 100.00 101.83 103.13 108.64 112.50 122.90 126.80 122.80 112.00 94.80 99.40 105.30 103.50 94.20 93.10 89.70 85.50 96.20 89.00 85.40 84.50 82.40 80.00 81.40 81.50 82.18
5 Clothing 100.00 138.32 161.28 144.02 189.80 229.60 291.60 237.20 182.80 163.60 157.10 158.10 157.50 155.40 151.90 141.00 139.80 133.20 110.00 106.90 99.50 99.70 98.30 105.80 108.10 117.50
6 Rent 100.00 103.23 106.15 107.53 120.00 130.00 150.00 154.00 181.00 217.00 230.00 242.00 257.00 284.00 312.00 314.50 289.70 247.40 200.40 175.60 175.60 175.60 175.60 177.70 188.90 207.65
European Standard 1914 1915 1916 1917 1918 1919 1920 1921 1922 1923 1924 1925 1926 1927 1928 1929 1930 1931 1932 1933 1934 1935 1936 1937 1938 1939
1 Food & Groceries 100.00 134.70 136.67 140.34 136.50 160.30 214.30 168.80 140.00 141.00 139.80 143.40 153.00 155.00 149.40 141.40 132.00 109.70 97.80 93.80 96.10 97.20 96.10 102.60 96.20 88.39
2 Beverages and Tobacco 100.00 77.42 104.40 124.22 174.80 204.10 214.70 231.20 223.70 203.20 192.10 186.70 181.30 176.00 176.30 167.00 168.70 178.40 172.00 168.00 170.50 166.50 165.90 165.90 164.20 164.07
3 Servant 100.00 103.82 103.82 113.09 116.80 116.80 155.50 155.50 155.50 155.50 155.50 155.50 155.50 155.50 155.50 155.50 152.90 138.00 124.70 115.80 123.70 127.40 125.70 130.00 128.20 128.20
4 Transport 100.00 101.83 103.13 108.64 112.50 122.90 126.80 122.80 112.00 94.80 99.40 105.30 103.50 94.20 93.10 89.70 85.50 96.20 89.00 85.40 84.50 82.40 80.00 81.40 81.50 82.18
5 Clothing 100.00 138.32 161.28 144.02 189.80 229.60 291.60 237.20 182.80 163.60 157.10 158.10 157.50 155.40 151.90 141.00 139.80 139.80 132.30 124.10 121.60 119.50 119.50 119.50 119.50 129.90
6 Clubs 100.00 91.31 103.77 113.88 134.00 147.40 163.50 176.70 177.40 169.20 164.10 164.20 161.70 159.50 159.50 155.30 156.10 160.50 160.10 158.40 159.50 157.70 157.40 157.70 159.40 152.87
7 Rent 100.00 98.02 99.61 98.27 110.00 121.00 169.00 179.00 191.00 204.00 208.00 213.00 220.00 230.00 248.00 249.00 229.50 201.60 166.50 146.40 146.40 146.40 146.40 149.60 154.80 162.83
Year
Price Indices by Consumption Standard and Major Object of Consumption, (1914=100) – Malaya, 1914-39
55

APPENDIX 4 Estimates of Price Indices for Major Objects of Consumption and Consumption Standards, Malaya, 1900-14
The Consumer Price Indices computed for this period have 1914 as the base year.
For the period 1914-39, it was fortunate that cost-of-living indices for some standards
were available though weights for the private final consumption expenditure for each of
these standards in value terms for the year 1914 were not available. Given these
limitations, certain methodologies were adopted to identify the weights for the various
standards for private final consumption expenditure for the reference year 1914. The
scenario for the period 1900-14 was even worse. Not a single price index of any of the
major objects of consumption by standard was available. Neither were household
surveys carried out during this period. Detailed price information of various objects of
private final consumption expenditure were not available for those goods and services
consumed, be they locally produced or imported. In the absence of a retail price series
and the accompanying weights, some creative procedures had to be resorted to in order
to construct the consumer price indices.
For the construction of the food price indices, various options based on the
import unit values and market price indices of food were explored. Weights within food
items were determined taking into account amongst others, (i) the weights as reported in
the 1958 Household Expenditure Survey, (ii) the per capita private final consumption
expenditure on food in 1949 in the domestic market of Malay, Chinese and Indian
Labour Standards and, (iii) weights on food items based on the consumption of food per
male adult for Malay (1936), Chinese (1936) and Indian (1933) Labour Standards.
Based on these data sources it was felt that the appropriate weights to be assigned to the
various food items for the construction of the CPI are as follows:
56
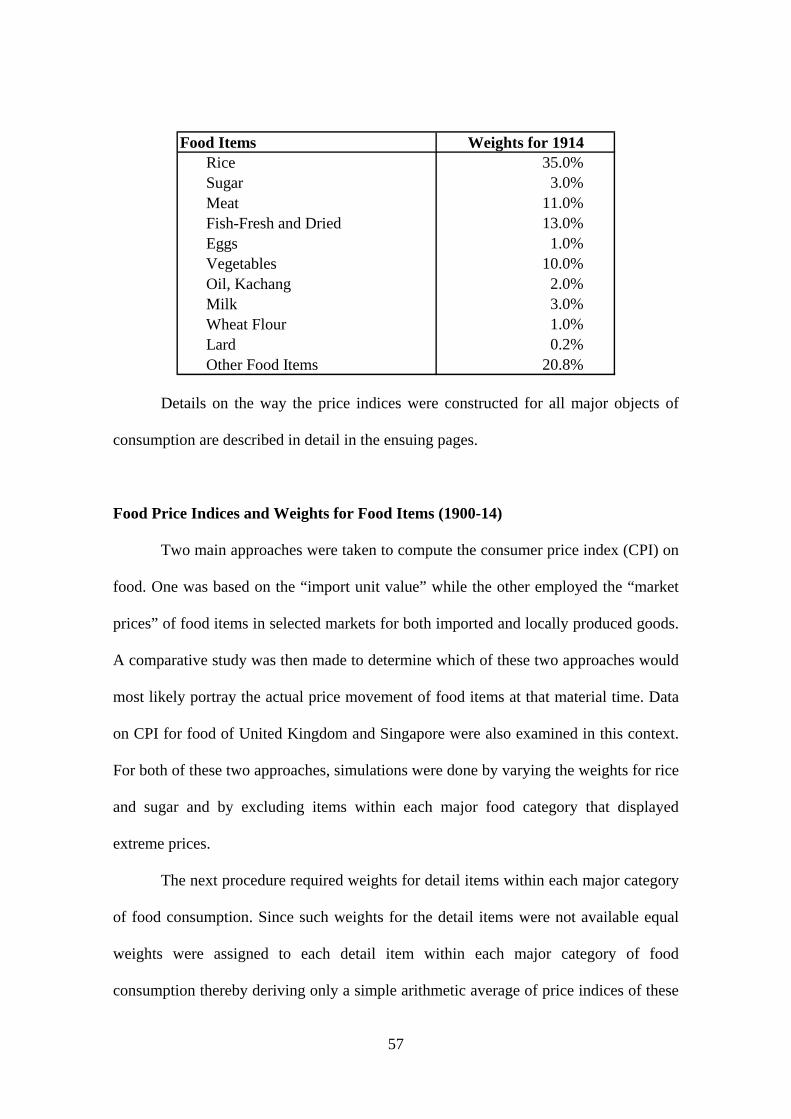
Food ItemsRice 35.0%Sugar 3.0%Meat 11.0%Fish-Fresh and Dried 13.0%Eggs 1.0%Vegetables 10.0%Oil, Kachang 2.0%Milk 3.0%Wheat Flour 1.0%Lard 0.2%Other Food Items 20.8%
Weights for 1914
Details on the way the price indices were constructed for all major objects of
consumption are described in detail in the ensuing pages.
Food Price Indices and Weights for Food Items (1900-14)
Two main approaches were taken to compute the consumer price index (CPI) on
food. One was based on the “import unit value” while the other employed the “market
prices” of food items in selected markets for both imported and locally produced goods.
A comparative study was then made to determine which of these two approaches would
most likely portray the actual price movement of food items at that material time. Data
on CPI for food of United Kingdom and Singapore were also examined in this context.
For both of these two approaches, simulations were done by varying the weights for rice
and sugar and by excluding items within each major food category that displayed
extreme prices.
The next procedure required weights for detail items within each major category
of food consumption. Since such weights for the detail items were not available equal
weights were assigned to each detail item within each major category of food
consumption thereby deriving only a simple arithmetic average of price indices of these
57
items within each major category. With regard to “other food items” of which no price
data was available, a number of options were experimented with to arrive at a reliable
price series viz (i) rice price index, (ii) simple arithmetic average of all food items
except rice, (iii) simple arithmetic average of all food items including rice and (iv)
weighted average of price of all major food categories including and excluding rice.
In the “market price” approach, difficulties were encountered in establishing the
market price movements of rice. Consequently, the import unit value of rice was used in
this approach. In addition, the Singapore annual average market price of sugar was
applied as it was felt that sugar price movements in Singapore would move in tandem
with those of Malaya. This was because sugar prices were available for only selected
markets in Malaya. In addition, voluminous amount of computations had to be done for
every year as data was only available on a monthly basis. Moreover, for some years data
for only a few months were available. As such it was felt that using the readily available
annual average market price of sugar in Singapore would be a better option to capture
price movements of sugar in Malaya.
Given all the options available from these two approaches and based on
statistical and other surrogate evidence, it was felt that the best option that would reflect
actual food price movements in Malaya would be the one based on the “market price”
approach with the assumed weights as shown in the Table on page 57 with the price
index for “other food items” assumed to be the weighted arithmetic average of prices of
all major food categories (including rice). The details on the calculation of food indices
are given in the next page.
58

Calculation of Food Price Indices Based on Market Prices, (1914=100) – Malaya, 1900-1914
Rice Rice per ton 76.84 78.98 74.21 84.14 71.75 67.56 Rice Rice Price Indices 1914=100 92.65 95.23 89.48 101.46 86.51 81.46
Sugar Sugar per kati 0.10 0.10 0.10 0.10 0.10 0.10 Sugar Sugar Price Indices 1914=100 100.00 100.00 100.00 100.00 100.00 100.00
Beef per kati 0.32 0.26 0.29 0.31 0.30 0.30 Beef, buffalo per kati 0.24 0.27 0.28 0.27 0.28 0.25 Mutton per kati 0.48 0.58 0.55 0.58 0.59 0.60 Pork per kati 0.35 0.37 0.35 0.35 0.31 0.35 Chicken each 0.35 0.30 0.36 0.39 0.42 0.42 Beef Price Indices (1914=100) 110.52 89.11 100.16 107.06 103.61 103.61 Beef, buffalo Price Indices (1914=100) 85.44 96.12 97.90 94.66 99.68 89.00 Mutton Price Indices (1914=100) 116.65 139.01 132.10 140.88 141.55 144.45 Pork Price Indices (1914=100) 81.53 86.96 82.82 81.53 73.25 81.53 Chicken Price Indices (1914=100) 94.33 80.00 96.00 105.27 112.00 112.67 Simple Arithmetic Average Price Indices (1914=100) 97.69 98.24 101.80 105.88 106.02 106.25
Fish Fish, Fresh per kati 0.21 0.29 0.25 0.23 0.31 0.32 Fish Fish, Fresh Price Indices 1914=100 68.95 92.58 81.52 73.26 98.83 101.83
Eggs Ducks, salted each 0.02 0.03 0.03 0.03 0.03 0.03 Eggs Ducks, salted Price Indices 1914=100 76.00 96.00 90.63 96.00 93.09 96.00
Chillies, dried per kati 0.16 0.19 0.12 0.13 0.18 0.21 Coconuts, fresh each 0.06 0.06 0.06 0.07 0.07 0.07 Cucumber per kati 0.03 0.04 0.04 0.04 0.06 0.06 Onions per kati 0.06 0.10 0.07 0.07 0.10 0.10 Potatoes per kati 0.06 0.06 0.07 0.08 0.08 0.08 Pumpkin, white per kati 0.03 0.03 0.03 0.04 0.04 0.04 Radish, salted per kati 0.07 0.09 0.08 0.07 0.09 0.09 Chillies, dried Price Indices 1914=100 60.59 75.44 48.47 50.31 68.58 80.52 Coconuts, fresh Price Indices 1914=100 117.86 123.21 133.93 158.93 150.00 155.54 Cucumber Price Indices 1914=100 61.53 80.54 85.76 83.90 141.36 124.36 Onions Price Indices 1914=100 63.56 98.64 71.84 69.41 102.16 97.63 Potatoes Price Indices 1914=100 70.66 80.93 88.46 97.71 108.61 96.56 Pumpkin, white Price Indices 1914=100 55.56 66.67 74.44 80.39 89.90 86.67 Radish, salted Price Indices 1914=100 158.33 195.56 183.52 152.36 188.89 188.89 Simple Arithmetic Average Price Indices (1914=100) 84.01 103.00 98.06 99.00 121.36 118.59
Oil Oil, Kachang per kati 0.16 0.18 0.18 0.20 0.21 0.22 Oil Oil, Kachang Price Indices 1914=100 86.49 96.22 95.60 109.34 113.02 116.76
Milk, condensed per tin 0.23 0.27 0.24 0.24 0.27 0.24 Milk, fresh 1 paun(1/2 pint) 0.13 0.15 0.13 0.13 0.20 0.22 Milk, condensed Price Indices 1914=100 83.28 99.39 89.45 89.29 99.22 88.71 Milk, fresh Price Indices 1914=100 63.89 76.25 63.75 63.75 100.00 109.17 Simple Arithmetic Average Price Indices (1914=100) 73.59 87.82 76.60 76.52 99.61 98.94
Wheat Flour Flour, Wheat, 1st Quality per bag 2.29 2.17 2.01 2.38 3.09 3.42 Wheat Flour Flour, Wheat, 1st Quality Price Indices 1914=100 76.89 72.77 67.72 79.90 103.90 115.03
Lard Lard per kati 0.23 0.24 0.23 0.25 0.32 0.32 Lard Lard Price Indices 1914=100 92.86 96.73 95.74 101.11 129.87 130.61
Price Index(1914=100)
WeightedIndex
Price Index(1914=100)
WeightedIndex
Price Index(1914=100)
WeightedIndex
Price Index(1914=100)
WeightedIndex
Price Index(1914=100)
WeightedIndex
Price Index(1914=100)
WeightedIndex
Rice Price Indices 1914=100 0.4419 92.65 40.94 95.23 42.08 89.48 39.54 101.46 44.84 86.51 38.23 81.46 36.00 Sugar Price Indices 1914=100 0.0379 100.00 3.79 100.00 3.79 100.00 3.79 100.00 3.79 100.00 3.79 100.00 3.79 Meat Price Indices 1914=100 0.1389 97.69 13.57 98.24 13.64 101.80 14.14 105.88 14.71 106.02 14.72 106.25 14.76 Fish-Fresh and Dried Price Indices 1914=100 0.1641 68.95 11.32 92.58 15.20 81.52 13.38 73.26 12.03 98.83 16.22 101.83 16.71 Eggs Price Indices 1914=100 0.0126 76.00 0.96 96.00 1.21 90.63 1.14 96.00 1.21 93.09 1.18 96.00 1.21 Vegetables Price Indices 1914=100 0.1263 84.01 10.61 103.00 13.00 98.06 12.38 99.00 12.50 121.36 15.32 118.59 14.97 Oil, Kachang Price Indices 1914=100 0.0253 86.49 2.18 96.22 2.43 95.60 2.41 109.34 2.76 113.02 2.85 116.76 2.95 Milk Price Indices 1914=100 0.0379 73.59 2.79 87.82 3.33 76.60 2.90 76.52 2.90 99.61 3.77 98.94 3.75 Wheat Flour Price Indices 1914=100 0.0126 76.89 0.97 72.77 0.92 67.72 0.86 79.90 1.01 103.90 1.31 115.03 1.45 Lard Price Indices 1914=100 0.0025 92.86 0.23 96.73 0.24 95.74 0.24 101.11 0.26 129.87 0.33 130.61 0.33
1.0000 87.36 95.85 90.79 95.99 97.73 95.92
[C] Computation of Consumer Price Indices for Food
Price Index(1914=100)
WeightedIndex
Price Index(1914=100)
WeightedIndex
Price Index(1914=100)
WeightedIndex
Price Index(1914=100)
WeightedIndex
Price Index(1914=100)
WeightedIndex
Price Index(1914=100)
WeightedIndex
Rice Price Indices 1914=100 0.3500 92.65 32.43 95.23 33.33 89.48 31.32 101.46 35.51 86.51 30.28 81.46 28.51 Sugar Price Indices 1914=100 0.0300 100.00 3.00 100.00 3.00 100.00 3.00 100.00 3.00 100.00 3.00 100.00 3.00 Meat Price Indices 1914=100 0.1100 97.69 10.75 98.24 10.81 101.80 11.20 105.88 11.65 106.02 11.66 106.25 11.69 Fish-Fresh and Dried Price Indices 1914=100 0.1300 68.95 8.96 92.58 12.04 81.52 10.60 73.26 9.52 98.83 12.85 101.83 13.24 Eggs Price Indices 1914=100 0.0100 76.00 0.76 96.00 0.96 90.63 0.91 96.00 0.96 93.09 0.93 96.00 0.96 Vegetables Price Indices 1914=100 0.1000 84.01 8.40 103.00 10.30 98.06 9.81 99.00 9.90 121.36 12.14 118.59 11.86 Oil, Kachang Price Indices 1914=100 0.0200 86.49 1.73 96.22 1.92 95.60 1.91 109.34 2.19 113.02 2.26 116.76 2.34 Milk Price Indices 1914=100 0.0300 73.59 2.21 87.82 2.63 76.60 2.30 76.52 2.30 99.61 2.99 98.94 2.97 Wheat Flour Price Indices 1914=100 0.0100 76.89 0.77 72.77 0.73 67.72 0.68 79.90 0.80 103.90 1.04 115.03 1.15 Lard Price Indices 1914=100 0.0020 92.86 0.19 96.73 0.19 95.74 0.19 101.11 0.20 129.87 0.26 130.61 0.26 Other Food Items Price Indices 1914=100 0.2080 87.36 18.17 95.85 19.94 90.79 18.88 95.99 19.97 97.73 20.33 95.92 19.95 Consumer Price Indices for food, 1914=100 1.0000 87.36 95.85 90.79 95.99 97.73 95.92
1903 19041899 1900 1901 1902
1903 19041899 1900 1901 1902
1903 19041899 1900 1901 1902
1903 19041899 1900 1901 1902
1903 19041899 1900 1901 1902
1903 19041899 1900 1901 1902
1903 19041899 1900 1901 1902
1903 19041899 1900 1901 1902
1903 19041899 1900 1901 1902
1903 19041899 1900 1901 1902
1899 1900 1901 1902 1903 1904
190119001899 190419031902
Vegetables
Weighted PriceIndices
Price Indices
Weighted Price Indices for OFI, 1914=100
[B] Computation of price indices for "Other Food Items" (OFI)based on weights of household expenditure on food items otherthan OFI
[A] Computation of price indices for household expenditure on"Food" items
Weights for1914
Weights for1914
Vegetables
Milk
Milk
Meat
Meat
Note: Rice is based on import prices of FMS and sugar based on market price of Singapore.
59
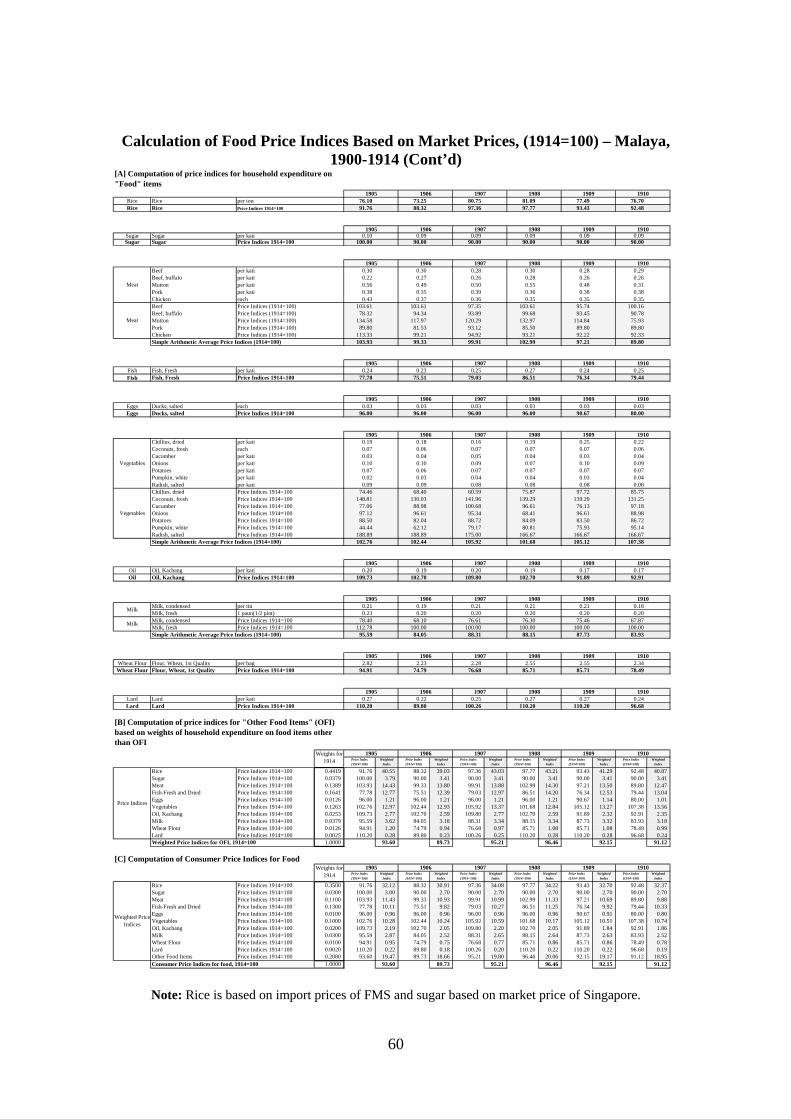
Calculation of Food Price Indices Based on Market Prices, (1914=100) – Malaya, 1900-1914 (Cont’d)
Rice Rice per ton 76.10 73.25 80.75 81.09 77.49 76.70 Rice Rice Price Indices 1914=100 91.76 88.32 97.36 97.77 93.43 92.48
Sugar Sugar per kati 0.10 0.09 0.09 0.09 0.09 0.09 Sugar Sugar Price Indices 1914=100 100.00 90.00 90.00 90.00 90.00 90.00
Beef per kati 0.30 0.30 0.28 0.30 0.28 0.29 Beef, buffalo per kati 0.22 0.27 0.26 0.28 0.26 0.26 Mutton per kati 0.56 0.49 0.50 0.55 0.48 0.31 Pork per kati 0.38 0.35 0.39 0.36 0.38 0.38 Chicken each 0.43 0.37 0.36 0.35 0.35 0.35 Beef Price Indices (1914=100) 103.61 103.61 97.35 103.61 95.74 100.16 Beef, buffalo Price Indices (1914=100) 78.32 94.34 93.89 99.68 93.45 90.78 Mutton Price Indices (1914=100) 134.58 117.97 120.29 132.97 114.84 75.93 Pork Price Indices (1914=100) 89.80 81.53 93.12 85.50 89.80 89.80 Chicken Price Indices (1914=100) 113.33 99.21 94.92 93.21 92.22 92.33 Simple Arithmetic Average Price Indices (1914=100) 103.93 99.33 99.91 102.99 97.21 89.80
Fish Fish, Fresh per kati 0.24 0.23 0.25 0.27 0.24 0.25 Fish Fish, Fresh Price Indices 1914=100 77.78 75.51 79.03 86.51 76.34 79.44
Eggs Ducks, salted each 0.03 0.03 0.03 0.03 0.03 0.03 Eggs Ducks, salted Price Indices 1914=100 96.00 96.00 96.00 96.00 90.67 80.00
Chillies, dried per kati 0.19 0.18 0.16 0.19 0.25 0.22 Coconuts, fresh each 0.07 0.06 0.07 0.07 0.07 0.06 Cucumber per kati 0.03 0.04 0.05 0.04 0.03 0.04 Onions per kati 0.10 0.10 0.09 0.07 0.10 0.09 Potatoes per kati 0.07 0.06 0.07 0.07 0.07 0.07 Pumpkin, white per kati 0.02 0.03 0.04 0.04 0.03 0.04 Radish, salted per kati 0.09 0.09 0.08 0.08 0.08 0.08 Chillies, dried Price Indices 1914=100 74.46 68.40 60.59 75.87 97.72 85.75 Coconuts, fresh Price Indices 1914=100 148.81 130.03 141.96 139.29 139.29 131.25 Cucumber Price Indices 1914=100 77.06 88.98 100.68 96.61 76.13 97.18 Onions Price Indices 1914=100 97.12 96.61 95.34 68.41 96.61 88.98 Potatoes Price Indices 1914=100 88.50 82.04 88.72 84.09 83.50 86.72 Pumpkin, white Price Indices 1914=100 44.44 62.12 79.17 80.81 75.93 95.14 Radish, salted Price Indices 1914=100 188.89 188.89 175.00 166.67 166.67 166.67 Simple Arithmetic Average Price Indices (1914=100) 102.76 102.44 105.92 101.68 105.12 107.38
Oil Oil, Kachang per kati 0.20 0.19 0.20 0.19 0.17 0.17 Oil Oil, Kachang Price Indices 1914=100 109.73 102.70 109.80 102.70 91.89 92.91
Milk, condensed per tin 0.21 0.19 0.21 0.21 0.21 0.18 Milk, fresh 1 paun(1/2 pint) 0.23 0.20 0.20 0.20 0.20 0.20 Milk, condensed Price Indices 1914=100 78.40 68.10 76.61 76.30 75.46 67.87 Milk, fresh Price Indices 1914=100 112.78 100.00 100.00 100.00 100.00 100.00 Simple Arithmetic Average Price Indices (1914=100) 95.59 84.05 88.31 88.15 87.73 83.93
Wheat Flour Flour, Wheat, 1st Quality per bag 2.82 2.23 2.28 2.55 2.55 2.34 Wheat Flour Flour, Wheat, 1st Quality Price Indices 1914=100 94.91 74.79 76.68 85.71 85.71 78.49
Lard Lard per kati 0.27 0.22 0.25 0.27 0.27 0.24 Lard Lard Price Indices 1914=100 110.20 89.80 100.26 110.20 110.20 96.68
Price Index(1914=100)
WeightedIndex
Price Index(1914=100)
WeightedIndex
Price Index(1914=100)
WeightedIndex
Price Index(1914=100)
WeightedIndex
Price Index(1914=100)
WeightedIndex
Price Index(1914=100)
WeightedIndex
Rice Price Indices 1914=100 0.4419 91.76 40.55 88.32 39.03 97.36 43.03 97.77 43.21 93.43 41.29 92.48 40.87 Sugar Price Indices 1914=100 0.0379 100.00 3.79 90.00 3.41 90.00 3.41 90.00 3.41 90.00 3.41 90.00 3.41 Meat Price Indices 1914=100 0.1389 103.93 14.43 99.33 13.80 99.91 13.88 102.99 14.30 97.21 13.50 89.80 12.47 Fish-Fresh and Dried Price Indices 1914=100 0.1641 77.78 12.77 75.51 12.39 79.03 12.97 86.51 14.20 76.34 12.53 79.44 13.04 Eggs Price Indices 1914=100 0.0126 96.00 1.21 96.00 1.21 96.00 1.21 96.00 1.21 90.67 1.14 80.00 1.01 Vegetables Price Indices 1914=100 0.1263 102.76 12.97 102.44 12.93 105.92 13.37 101.68 12.84 105.12 13.27 107.38 13.56 Oil, Kachang Price Indices 1914=100 0.0253 109.73 2.77 102.70 2.59 109.80 2.77 102.70 2.59 91.89 2.32 92.91 2.35 Milk Price Indices 1914=100 0.0379 95.59 3.62 84.05 3.18 88.31 3.34 88.15 3.34 87.73 3.32 83.93 3.18 Wheat Flour Price Indices 1914=100 0.0126 94.91 1.20 74.79 0.94 76.68 0.97 85.71 1.08 85.71 1.08 78.49 0.99 Lard Price Indices 1914=100 0.0025 110.20 0.28 89.80 0.23 100.26 0.25 110.20 0.28 110.20 0.28 96.68 0.24
1.0000 93.60 89.73 95.21 96.46 92.15 91.12
[C] Computation of Consumer Price Indices for FoodPrice Index(1914=100)
WeightedIndex
Price Index(1914=100)
WeightedIndex
Price Index(1914=100)
WeightedIndex
Price Index(1914=100)
WeightedIndex
Price Index(1914=100)
WeightedIndex
Price Index(1914=100)
WeightedIndex
Rice Price Indices 1914=100 0.3500 91.76 32.12 88.32 30.91 97.36 34.08 97.77 34.22 93.43 32.70 92.48 32.37 Sugar Price Indices 1914=100 0.0300 100.00 3.00 90.00 2.70 90.00 2.70 90.00 2.70 90.00 2.70 90.00 2.70 Meat Price Indices 1914=100 0.1100 103.93 11.43 99.33 10.93 99.91 10.99 102.99 11.33 97.21 10.69 89.80 9.88 Fish-Fresh and Dried Price Indices 1914=100 0.1300 77.78 10.11 75.51 9.82 79.03 10.27 86.51 11.25 76.34 9.92 79.44 10.33 Eggs Price Indices 1914=100 0.0100 96.00 0.96 96.00 0.96 96.00 0.96 96.00 0.96 90.67 0.91 80.00 0.80 Vegetables Price Indices 1914=100 0.1000 102.76 10.28 102.44 10.24 105.92 10.59 101.68 10.17 105.12 10.51 107.38 10.74 Oil, Kachang Price Indices 1914=100 0.0200 109.73 2.19 102.70 2.05 109.80 2.20 102.70 2.05 91.89 1.84 92.91 1.86 Milk Price Indices 1914=100 0.0300 95.59 2.87 84.05 2.52 88.31 2.65 88.15 2.64 87.73 2.63 83.93 2.52 Wheat Flour Price Indices 1914=100 0.0100 94.91 0.95 74.79 0.75 76.68 0.77 85.71 0.86 85.71 0.86 78.49 0.78 Lard Price Indices 1914=100 0.0020 110.20 0.22 89.80 0.18 100.26 0.20 110.20 0.22 110.20 0.22 96.68 0.19 Other Food Items Price Indices 1914=100 0.2080 93.60 19.47 89.73 18.66 95.21 19.80 96.46 20.06 92.15 19.17 91.12 18.95 Consumer Price Indices for food, 1914=100 1.0000 93.60 89.73 95.21 96.46 92.15 91.12
1907 1908 1909 19101905 1906
1907 1908 1909 19101905 1906
1907 1908 1909 19101905 1906
1907 1908 1909 19101905 1906
1907 1908 1909 19101905 1906
1907 1908 1909 19101905 1906
1907 1908 1909 19101905 1906
1907 1908 1909 19101905 1906
1907 1908 1909 19101905 1906
1907 1908 1909 19101905 1906
1907 1908 1909 1910
19071906
1905 1906
1910190919081905
Vegetables
Weighted PriceIndices
Price Indices
Weighted Price Indices for OFI, 1914=100
[B] Computation of price indices for "Other Food Items" (OFI)based on weights of household expenditure on food items otherthan OFI
[A] Computation of price indices for household expenditure on"Food" items
Weights for1914
Weights for1914
Vegetables
Milk
Milk
Meat
Meat
Note: Rice is based on import prices of FMS and sugar based on market price of Singapore.
60
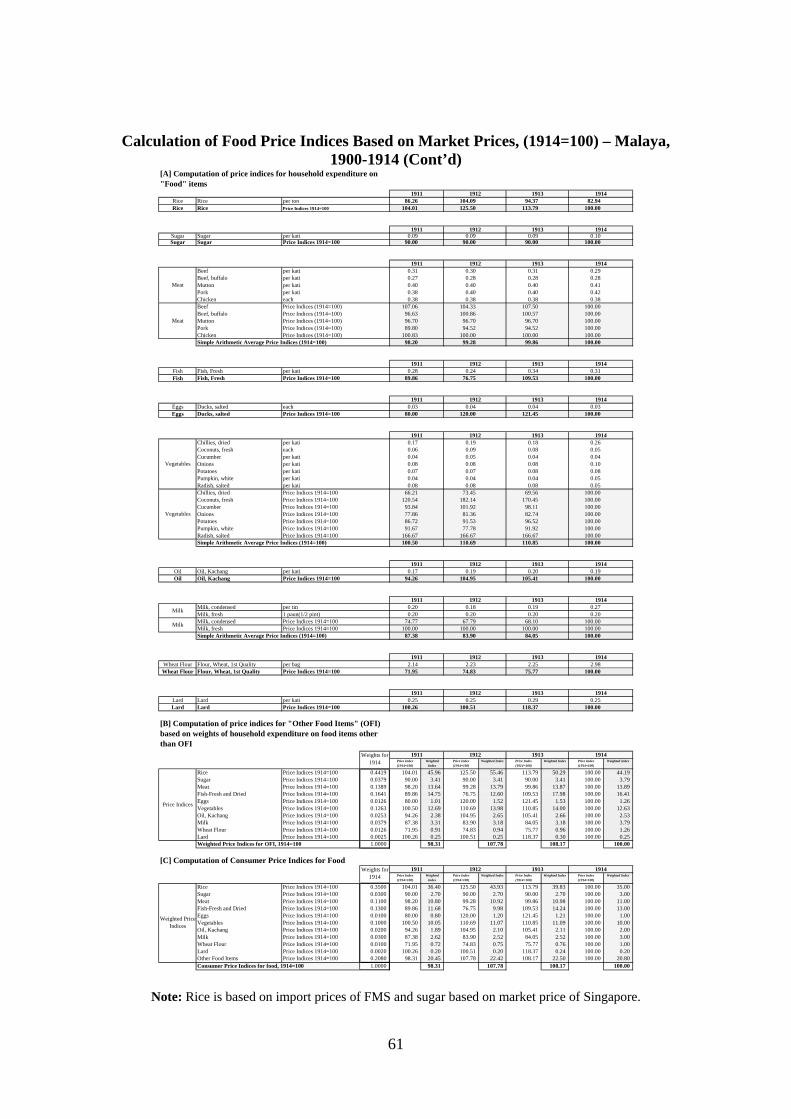
Calculation of Food Price Indices Based on Market Prices, (1914=100) – Malaya, 1900-1914 (Cont’d)
Rice Rice per ton 86.26 104.09 94.37 82.94 Rice Rice Price Indices 1914=100 104.01 125.50 113.79 100.00
Sugar Sugar per kati 0.09 0.09 0.09 0.10 Sugar Sugar Price Indices 1914=100 90.00 90.00 90.00 100.00
Beef per kati 0.31 0.30 0.31 0.29 Beef, buffalo per kati 0.27 0.28 0.28 0.28 Mutton per kati 0.40 0.40 0.40 0.41 Pork per kati 0.38 0.40 0.40 0.42 Chicken each 0.38 0.38 0.38 0.38 Beef Price Indices (1914=100) 107.06 104.33 107.50 100.00 Beef, buffalo Price Indices (1914=100) 96.63 100.86 100.57 100.00 Mutton Price Indices (1914=100) 96.70 96.70 96.70 100.00 Pork Price Indices (1914=100) 89.80 94.52 94.52 100.00 Chicken Price Indices (1914=100) 100.83 100.00 100.00 100.00 Simple Arithmetic Average Price Indices (1914=100) 98.20 99.28 99.86 100.00
Fish Fish, Fresh per kati 0.28 0.24 0.34 0.31 Fish Fish, Fresh Price Indices 1914=100 89.86 76.75 109.53 100.00
Eggs Ducks, salted each 0.03 0.04 0.04 0.03 Eggs Ducks, salted Price Indices 1914=100 80.00 120.00 121.45 100.00
Chillies, dried per kati 0.17 0.19 0.18 0.26 Coconuts, fresh each 0.06 0.09 0.08 0.05 Cucumber per kati 0.04 0.05 0.04 0.04 Onions per kati 0.08 0.08 0.08 0.10 Potatoes per kati 0.07 0.07 0.08 0.08 Pumpkin, white per kati 0.04 0.04 0.04 0.05 Radish, salted per kati 0.08 0.08 0.08 0.05 Chillies, dried Price Indices 1914=100 66.21 73.45 69.56 100.00 Coconuts, fresh Price Indices 1914=100 120.54 182.14 170.45 100.00 Cucumber Price Indices 1914=100 93.84 101.92 98.11 100.00 Onions Price Indices 1914=100 77.86 81.36 82.74 100.00 Potatoes Price Indices 1914=100 86.72 91.53 96.52 100.00 Pumpkin, white Price Indices 1914=100 91.67 77.78 91.92 100.00 Radish, salted Price Indices 1914=100 166.67 166.67 166.67 100.00 Simple Arithmetic Average Price Indices (1914=100) 100.50 110.69 110.85 100.00
Oil Oil, Kachang per kati 0.17 0.19 0.20 0.19 Oil Oil, Kachang Price Indices 1914=100 94.26 104.95 105.41 100.00
Milk, condensed per tin 0.20 0.18 0.19 0.27 Milk, fresh 1 paun(1/2 pint) 0.20 0.20 0.20 0.20 Milk, condensed Price Indices 1914=100 74.77 67.79 68.10 100.00 Milk, fresh Price Indices 1914=100 100.00 100.00 100.00 100.00 Simple Arithmetic Average Price Indices (1914=100) 87.38 83.90 84.05 100.00
Wheat Flour Flour, Wheat, 1st Quality per bag 2.14 2.23 2.25 2.98 Wheat Flour Flour, Wheat, 1st Quality Price Indices 1914=100 71.95 74.83 75.77 100.00
Lard Lard per kati 0.25 0.25 0.29 0.25 Lard Lard Price Indices 1914=100 100.26 100.51 118.37 100.00
Price Index(1914=100)
WeightedIndex
Price Index(1914=100)
Weighted Index Price Index(1914=100)
Weighted Index Price Index(1914=100)
Weighted Index
Rice Price Indices 1914=100 0.4419 104.01 45.96 125.50 55.46 113.79 50.29 100.00 44.19 Sugar Price Indices 1914=100 0.0379 90.00 3.41 90.00 3.41 90.00 3.41 100.00 3.79 Meat Price Indices 1914=100 0.1389 98.20 13.64 99.28 13.79 99.86 13.87 100.00 13.89 Fish-Fresh and Dried Price Indices 1914=100 0.1641 89.86 14.75 76.75 12.60 109.53 17.98 100.00 16.41 Eggs Price Indices 1914=100 0.0126 80.00 1.01 120.00 1.52 121.45 1.53 100.00 1.26 Vegetables Price Indices 1914=100 0.1263 100.50 12.69 110.69 13.98 110.85 14.00 100.00 12.63 Oil, Kachang Price Indices 1914=100 0.0253 94.26 2.38 104.95 2.65 105.41 2.66 100.00 2.53 Milk Price Indices 1914=100 0.0379 87.38 3.31 83.90 3.18 84.05 3.18 100.00 3.79 Wheat Flour Price Indices 1914=100 0.0126 71.95 0.91 74.83 0.94 75.77 0.96 100.00 1.26 Lard Price Indices 1914=100 0.0025 100.26 0.25 100.51 0.25 118.37 0.30 100.00 0.25
1.0000 98.31 107.78 108.17 100.00
[C] Computation of Consumer Price Indices for Food
Price Index(1914=100)
WeightedIndex
Price Index(1914=100)
Weighted Index Price Index(1914=100)
Weighted Index Price Index(1914=100)
Weighted Index
Rice Price Indices 1914=100 0.3500 104.01 36.40 125.50 43.93 113.79 39.83 100.00 35.00 Sugar Price Indices 1914=100 0.0300 90.00 2.70 90.00 2.70 90.00 2.70 100.00 3.00 Meat Price Indices 1914=100 0.1100 98.20 10.80 99.28 10.92 99.86 10.98 100.00 11.00 Fish-Fresh and Dried Price Indices 1914=100 0.1300 89.86 11.68 76.75 9.98 109.53 14.24 100.00 13.00 Eggs Price Indices 1914=100 0.0100 80.00 0.80 120.00 1.20 121.45 1.21 100.00 1.00 Vegetables Price Indices 1914=100 0.1000 100.50 10.05 110.69 11.07 110.85 11.09 100.00 10.00 Oil, Kachang Price Indices 1914=100 0.0200 94.26 1.89 104.95 2.10 105.41 2.11 100.00 2.00 Milk Price Indices 1914=100 0.0300 87.38 2.62 83.90 2.52 84.05 2.52 100.00 3.00 Wheat Flour Price Indices 1914=100 0.0100 71.95 0.72 74.83 0.75 75.77 0.76 100.00 1.00 Lard Price Indices 1914=100 0.0020 100.26 0.20 100.51 0.20 118.37 0.24 100.00 0.20 Other Food Items Price Indices 1914=100 0.2080 98.31 20.45 107.78 22.42 108.17 22.50 100.00 20.80 Consumer Price Indices for food, 1914=100 1.0000 98.31 107.78 108.17 100.00
1911 1912 1913 1914
1911 1912 1913 1914
1911 1912 1913 1914
1911 1912 1913 1914
1911 1912 1913 1914
1911 1912 1913 1914
1911 1912 1913 1914
1911 1912 1913 1914
1911 1912 1913 1914
1911 1912 1913 1914
1911 1912 1913 1914
1914191319121911
Vegetables
Weighted PriceIndices
Price Indices
Weighted Price Indices for OFI, 1914=100
[B] Computation of price indices for "Other Food Items" (OFI)based on weights of household expenditure on food items otherthan OFI
[A] Computation of price indices for household expenditure on"Food" items
Weights for1914
Weights for1914
Vegetables
Milk
Milk
Meat
Meat
Note: Rice is based on import prices of FMS and sugar based on market price of Singapore.
61
Tobacco Price Index (1900-14)
No official consumer price index for tobacco was available. The construction of
the tobacco price index was therefore based on the import unit value. Import unit value
data was available in the FMSCT13 annual reports for the years 1903-14. However, the
import unit value for the year 1903 was found to be incorrect. It was quite obvious that
the quantity figure ought to have been 24,746 piculs and not 4,746 piculs. If the revised
figure was to be used, then the import unit value for the year 1903 would have been
56.49 and this seems to be in line with the figure of 56.83 in 1904. This was supported
by data on native tobacco (minimum or highest market prices) which showed that there
were no price changes from 1903 to 1904. This evidence provides us the confidence that
the unit value of 56.49 in 1903 and 56.83 in 1904 do in fact reflect the true price
changes between the two years in question. For 1899-1902 period where no such data
was available in the FMSCT annual reports, the price movement data for tobacco
(Chinese) recorded for Pahang was taken to reflect the price movement for these years.
Alcoholic Drink Price Index for European Standard (1900-14)
The alcoholic drink price index took into account the price movements of four
types of liquor, namely brandy, gin, whisky and wine. These indices were constructed
for the years 1900-02 based on the import unit value available for individual FMS states.
For the years 1903-14, the price index for each type of liquor mentioned above was
constructed based on the import unit value of the consolidated FMS import trade data.
Care was taken to ensure that the data series from 1900-02 was compatible with that of
1903-14. The overall price index was computed based on the 1914 weight of each type
of liquor mentioned above. A study was also undertaken to determine the weight of
13 Federated Malay States, Reports on Customs and Trade
62

each type of liquor for a number of years. The weight for each of the four alcoholic
beverages in general did not differ across years. Such being the case, it was decided that
the FMS 1914 weights of imported alcoholic drinks be used to represent the pattern of
alcohol consumption of the European Standard.
Tobacco and Beverages Price Index for European Standard (1900-14)
It should be noted that the 1914-based consumer price index provides a
consolidated price index for tobacco and beverages for the European Standard.
Estimates of the consolidated price index of these two items were also made for
1915-17 and 1939 as described in Appendix 3. Since 1914 was used as the base year
for the price index from 1900 to 1914, it is imperative that we should also provide a
consolidated price index for tobacco and beverages for the European Standard. The
weights for the expenditure on beverages (85%) and tobacco (15%) were then used for
computing the price index for the years 1900-14.
Clothing Price Index (1900-14)
Price index on clothing was difficult to construct as the available statistics do not
provide detailed information on prices per se on specific clothing such as shirts, trousers,
sarongs, etc. The only information available was the import unit value of cotton piece
goods in Penang and in FMS states individually or collectively. In addition, where some
statistics on clothing were available, the unit of quantity was not additive. Finally, it was
decided that the movement of the import unit value of cotton piece (plain) in Penang be
used to reflect the price movement of clothing in Malaya as a whole. However, such
statistics were only available for 1900-12. For 1913-14, the estimates of price
movements of clothing were based on the price change of cotton piece goods in FMS
63

for the years 1912-14. Based on this time series, we were then able to construct a price
index for clothing with 1914=100.
Servants Price Index for European, Asiatic and Eurasian Clerical Standards (1900-14)
It was noted that the wage index of non-agricultural workers seemed to move in
the same direction as Singapore’s cost-of-living index on servants from 1920-38.
Taking into account this close relationship in the movements of these two indices, it was
assumed that this relationship would hold good for the period 1900-13 and the servants
price index was calculated accordingly.
Transport Price Index for European, Asiatic and Eurasian Clerical Standards (1900-14)
An initial attempt was made to estimate the transport price index based on
information pertaining to transport and travelling allowances paid to all Straits
Settlements civil servants. The transport price index derived from this source of
information, however, yielded figures that fluctuated rather unusually over the period.
These fluctuations were largely due to the fact that the figures not only included the cost
of transport but also allowances for hotels and meals. In addition, the composition of the
yearly transport and travelling allowances that was available on a consolidated basis
could have varied from year to year and therefore the transport price index derived did
not portray the “true” price changes of transport. Furthermore, the derived figures did
not take into account any real changes in the allowances. Given this predicament and in
the absence of any reliable data, the only reasonable data source that could be used with
some degree of confidence would be that of the UK. The rationale for using the UK
index has been explained earlier in Appendix 3.
64

65
Rent Price Indices for All Standards (1900-14)
For the years 1900-07, no surrogate data was available to estimate the annual
changes in rent of dwellings. Therefore, the average growth rate of rents for the Asiatic
Clerical and European Standards for the period 1900-07 was estimated based on the
average annual growth rate of rent for the period 1908-14 for these standards as
described in page 51. The Asiatic standard was then taken to represent the movement of
rent for all labour standards. Owing to the weakness of the underlying data, the
computation of these indices is inevitably subject to large errors.
Clubbing Price Index for European Standard (1900-14)
The price index for expenditure on clubs was based on the simple arithmetic
average prices of food and tobacco and beverages consumed by those of the European
Standard. A detailed description on the construction of the food and tobacco and
beverages price indices was given earlier.
Summary of Price Indices of Major Objects of Consumption and Consumption Standards, 1900-14 The results of the computation of price indices for major objects of consumption and
consumption standards are given in the following page.
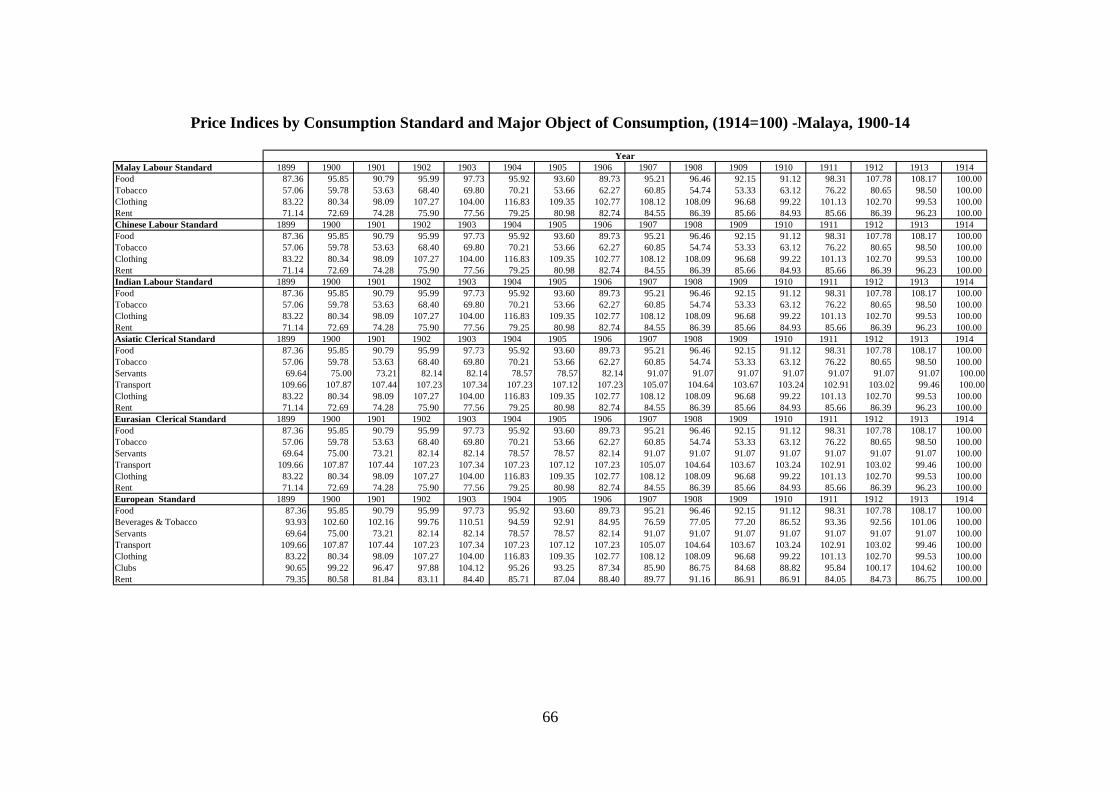
66
Price Indices by Consumption Standard and Major Object of Consumption, (1914=100) -Malaya, 1900-14
Malay Labour Standard 1899 1900 1901 1902 1903 1904 1905 1906 1907 1908 1909 1910 1911 1912 1913 1914Food 87.36 95.85 90.79 95.99 97.73 95.92 93.60 89.73 95.21 96.46 92.15 91.12 98.31 107.78 108.17 100.00 Tobacco 57.06 59.78 53.63 68.40 69.80 70.21 53.66 62.27 60.85 54.74 53.33 63.12 76.22 80.65 98.50 100.00 Clothing 83.22 80.34 98.09 107.27 104.00 116.83 109.35 102.77 108.12 108.09 96.68 99.22 101.13 102.70 99.53 100.00 Rent 71.14 72.69 74.28 75.90 77.56 79.25 80.98 82.74 84.55 86.39 85.66 84.93 85.66 86.39 96.23 100.00 Chinese Labour Standard 1899 1900 1901 1902 1903 1904 1905 1906 1907 1908 1909 1910 1911 1912 1913 1914Food 87.36 95.85 90.79 95.99 97.73 95.92 93.60 89.73 95.21 96.46 92.15 91.12 98.31 107.78 108.17 100.00 Tobacco 57.06 59.78 53.63 68.40 69.80 70.21 53.66 62.27 60.85 54.74 53.33 63.12 76.22 80.65 98.50 100.00 Clothing 83.22 80.34 98.09 107.27 104.00 116.83 109.35 102.77 108.12 108.09 96.68 99.22 101.13 102.70 99.53 100.00 Rent 71.14 72.69 74.28 75.90 77.56 79.25 80.98 82.74 84.55 86.39 85.66 84.93 85.66 86.39 96.23 100.00 Indian Labour Standard 1899 1900 1901 1902 1903 1904 1905 1906 1907 1908 1909 1910 1911 1912 1913 1914Food 87.36 95.85 90.79 95.99 97.73 95.92 93.60 89.73 95.21 96.46 92.15 91.12 98.31 107.78 108.17 100.00 Tobacco 57.06 59.78 53.63 68.40 69.80 70.21 53.66 62.27 60.85 54.74 53.33 63.12 76.22 80.65 98.50 100.00 Clothing 83.22 80.34 98.09 107.27 104.00 116.83 109.35 102.77 108.12 108.09 96.68 99.22 101.13 102.70 99.53 100.00 Rent 71.14 72.69 74.28 75.90 77.56 79.25 80.98 82.74 84.55 86.39 85.66 84.93 85.66 86.39 96.23 100.00 Asiatic Clerical Standard 1899 1900 1901 1902 1903 1904 1905 1906 1907 1908 1909 1910 1911 1912 1913 1914Food 87.36 95.85 90.79 95.99 97.73 95.92 93.60 89.73 95.21 96.46 92.15 91.12 98.31 107.78 108.17 100.00 Tobacco 57.06 59.78 53.63 68.40 69.80 70.21 53.66 62.27 60.85 54.74 53.33 63.12 76.22 80.65 98.50 100.00 Servants 69.64 75.00 73.21 82.14 82.14 78.57 78.57 82.14 91.07 91.07 91.07 91.07 91.07 91.07 91.07 100.00Transport 109.66 107.87 107.44 107.23 107.34 107.23 107.12 107.23 105.07 104.64 103.67 103.24 102.91 103.02 99.46 100.00Clothing 83.22 80.34 98.09 107.27 104.00 116.83 109.35 102.77 108.12 108.09 96.68 99.22 101.13 102.70 99.53 100.00 Rent 71.14 72.69 74.28 75.90 77.56 79.25 80.98 82.74 84.55 86.39 85.66 84.93 85.66 86.39 96.23 100.00 Eurasian Clerical Standard 1899 1900 1901 1902 1903 1904 1905 1906 1907 1908 1909 1910 1911 1912 1913 1914Food 87.36 95.85 90.79 95.99 97.73 95.92 93.60 89.73 95.21 96.46 92.15 91.12 98.31 107.78 108.17 100.00 Tobacco 57.06 59.78 53.63 68.40 69.80 70.21 53.66 62.27 60.85 54.74 53.33 63.12 76.22 80.65 98.50 100.00 Servants 69.64 75.00 73.21 82.14 82.14 78.57 78.57 82.14 91.07 91.07 91.07 91.07 91.07 91.07 91.07 100.00 Transport 109.66 107.87 107.44 107.23 107.34 107.23 107.12 107.23 105.07 104.64 103.67 103.24 102.91 103.02 99.46 100.00 Clothing 83.22 80.34 98.09 107.27 104.00 116.83 109.35 102.77 108.12 108.09 96.68 99.22 101.13 102.70 99.53 100.00 Rent 71.14 72.69 74.28 75.90 77.56 79.25 80.98 82.74 84.55 86.39 85.66 84.93 85.66 86.39 96.23 100.00 European Standard 1899 1900 1901 1902 1903 1904 1905 1906 1907 1908 1909 1910 1911 1912 1913 1914Food 87.36 95.85 90.79 95.99 97.73 95.92 93.60 89.73 95.21 96.46 92.15 91.12 98.31 107.78 108.17 100.00 Beverages & Tobacco 93.93 102.60 102.16 99.76 110.51 94.59 92.91 84.95 76.59 77.05 77.20 86.52 93.36 92.56 101.06 100.00 Servants 69.64 75.00 73.21 82.14 82.14 78.57 78.57 82.14 91.07 91.07 91.07 91.07 91.07 91.07 91.07 100.00 Transport 109.66 107.87 107.44 107.23 107.34 107.23 107.12 107.23 105.07 104.64 103.67 103.24 102.91 103.02 99.46 100.00 Clothing 83.22 80.34 98.09 107.27 104.00 116.83 109.35 102.77 108.12 108.09 96.68 99.22 101.13 102.70 99.53 100.00 Clubs 90.65 99.22 96.47 97.88 104.12 95.26 93.25 87.34 85.90 86.75 84.68 88.82 95.84 100.17 104.62 100.00 Rent 79.35 80.58 81.84 83.11 84.40 85.71 87.04 88.40 89.77 91.16 86.91 86.91 84.05 84.73 86.75 100.00
Year

67
APPENDIX 5 Summary – General Method of Computing CPI for Malaya, 1900-39 [1] Estimate the private final consumption expenditure of each major object of
consumption for each consumption standard for the base year (1914 = 100).
[2] Compute the base weights of private final consumption using the total private final
consumption expenditure of each major object of consumption by each consumption
standard. The weights of private final consumption of each consumption standard within
a particular major object of consumption should add up to unity.
[3] Multiply the base weights of private final consumption of each consumption
standard within a particular major object of consumption by the relevant price indices of
each year.
[4] Derive the overall price index of each major object of consumption by adding up the
weighted index of each standard. This would give you the overall price index for each
major object of consumption for each year.
[5] Compute the weights of private final consumption expenditure in the base year of
each major object of consumption (irrespective of standard) using the total private final
consumption expenditure. These weights should add up to unity.
[6] Multiply the base weights so derived by the price indices of each major object of
consumption for each year.
[7] Derive the overall price index by adding up the base weighted index for each major
object of consumption for each year.
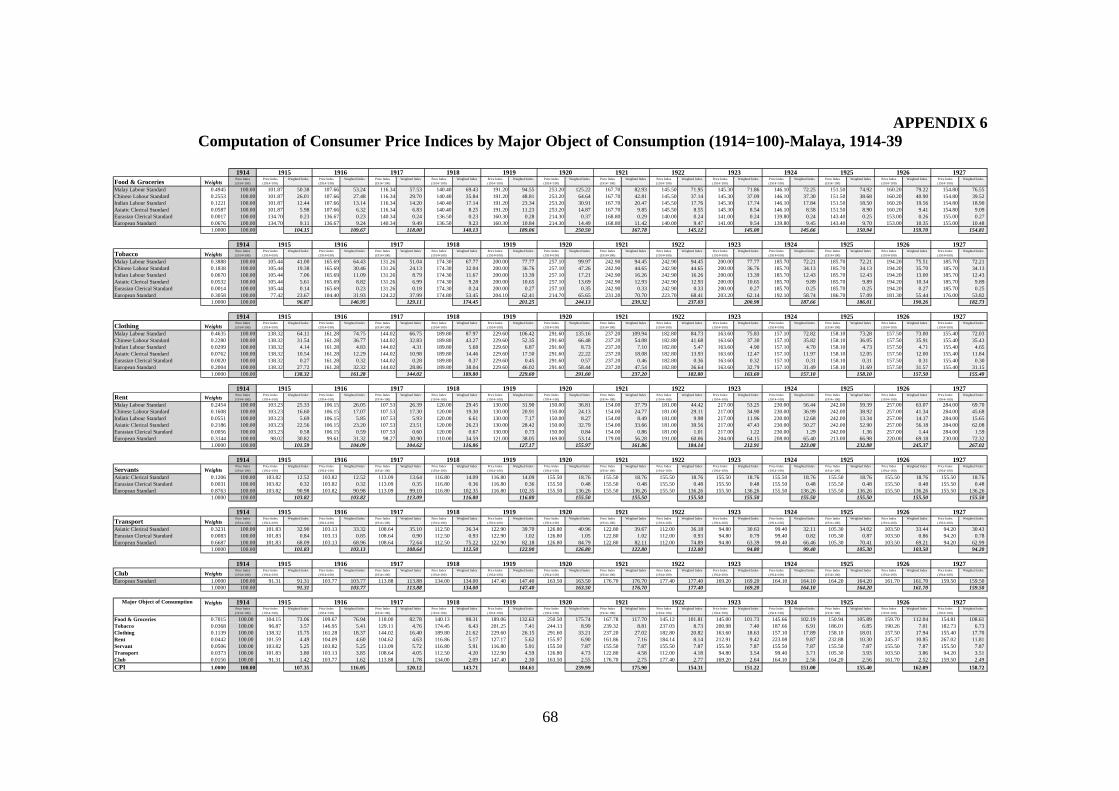
APPENDIX 6 Computation of Consumer Price Indices by Major Object of Consumption (1914=100)-Malaya, 1914-39
1914Food & Groceries Weights
Price Index(1914=100)
Price Index(1914=100)
Weighted Index Price Index(1914=100)
Weighted Index Price Index(1914=100)
Weighted Index Price Index(1914=100)
Weighted Index Price Index(1914=100)
Weighted Index Price Index(1914=100)
Weighted Index Price Index(1914=100)
Weighted Index Price Index(1914=100)
Weighted Index Price Index(1914=100)
Weighted Index Price Index(1914=100)
Weighted Index Price Index(1914=100)
Weighted Index Price Index(1914=100)
Weighted Index Price Index(1914=100)
Weighted Index
Malay Labour Standard 0.4945 100.00 101.87 50.38 107.66 53.24 116.34 57.53 140.40 69.43 191.20 94.55 253.20 125.22 167.70 82.93 145.50 71.95 145.30 71.86 146.10 72.25 151.50 74.92 160.20 79.22 154.80 76.55 Chinese Labour Standard 0.2553 100.00 101.87 26.01 107.66 27.48 116.34 29.70 140.40 35.84 191.20 48.81 253.20 64.64 167.70 42.81 145.50 37.14 145.30 37.09 146.10 37.30 151.50 38.68 160.20 40.90 154.80 39.52 Indian Labour Standard 0.1221 100.00 101.87 12.44 107.66 13.14 116.34 14.20 140.40 17.14 191.20 23.34 253.20 30.91 167.70 20.47 145.50 17.76 145.30 17.74 146.10 17.84 151.50 18.50 160.20 19.56 154.80 18.90 Asiatic Clerical Standard 0.0587 100.00 101.87 5.98 107.66 6.32 116.34 6.83 140.40 8.25 191.20 11.23 253.20 14.87 167.70 9.85 145.50 8.55 145.30 8.54 146.10 8.58 151.50 8.90 160.20 9.41 154.80 9.09 Eurasian Clerical Standard 0.0017 100.00 134.70 0.23 136.67 0.23 140.34 0.24 136.50 0.23 160.30 0.28 214.30 0.37 168.80 0.29 140.00 0.24 141.00 0.24 139.80 0.24 143.40 0.25 153.00 0.26 155.00 0.27 European Standard 0.0676 100.00 134.70 9.11 136.67 9.24 140.34 9.49 136.50 9.23 160.30 10.84 214.30 14.49 168.80 11.42 140.00 9.47 141.00 9.54 139.80 9.45 143.40 9.70 153.00 10.35 155.00 10.48
1.0000 100.00 104.15 109.67 118.00 140.13 189.06 250.50 167.78 145.12 145.00 145.66 150.94 159.70 154.81
1914Tobacco Weights
Price Index(1914=100)
Price Index(1914=100)
Weighted Index Price Index(1914=100)
Weighted Index Price Index(1914=100)
Weighted Index Price Index(1914=100)
Weighted Index Price Index(1914=100)
Weighted Index Price Index(1914=100)
Weighted Index Price Index(1914=100)
Weighted Index Price Index(1914=100)
Weighted Index Price Index(1914=100)
Weighted Index Price Index(1914=100)
Weighted Index Price Index(1914=100)
Weighted Index Price Index(1914=100)
Weighted Index Price Index(1914=100)
Weighted Index
Malay Labour Standard 0.3888 100.00 105.44 41.00 165.69 64.43 131.26 51.04 174.30 67.77 200.00 77.77 257.10 99.97 242.90 94.45 242.90 94.45 200.00 77.77 185.70 72.21 185.70 72.21 194.20 75.51 185.70 72.21 Chinese Labour Standard 0.1838 100.00 105.44 19.38 165.69 30.46 131.26 24.13 174.30 32.04 200.00 36.76 257.10 47.26 242.90 44.65 242.90 44.65 200.00 36.76 185.70 34.13 185.70 34.13 194.20 35.70 185.70 34.13 Indian Labour Standard 0.0670 100.00 105.44 7.06 165.69 11.09 131.26 8.79 174.30 11.67 200.00 13.39 257.10 17.21 242.90 16.26 242.90 16.26 200.00 13.39 185.70 12.43 185.70 12.43 194.20 13.00 185.70 12.43 Asiatic Clerical Standard 0.0532 100.00 105.44 5.61 165.69 8.82 131.26 6.99 174.30 9.28 200.00 10.65 257.10 13.69 242.90 12.93 242.90 12.93 200.00 10.65 185.70 9.89 185.70 9.89 194.20 10.34 185.70 9.89 Eurasian Clerical Standard 0.0014 100.00 105.44 0.14 165.69 0.23 131.26 0.18 174.30 0.24 200.00 0.27 257.10 0.35 242.90 0.33 242.90 0.33 200.00 0.27 185.70 0.25 185.70 0.25 194.20 0.27 185.70 0.25 European Standard 0.3058 100.00 77.42 23.67 104.40 31.93 124.22 37.99 174.80 53.45 204.10 62.41 214.70 65.65 231.20 70.70 223.70 68.41 203.20 62.14 192.10 58.74 186.70 57.09 181.30 55.44 176.00 53.82
1.0000 100.00 96.87 146.95 129.11 174.45 201.25 244.13 239.32 237.03 200.98 187.66 186.01 190.26 182.73
1914Clothing Weights
Price Index(1914=100)
Price Index(1914=100)
Weighted Index Price Index(1914=100)
Weighted Index Price Index(1914=100)
Weighted Index Price Index(1914=100)
Weighted Index Price Index(1914=100)
Weighted Index Price Index(1914=100)
Weighted Index Price Index(1914=100)
Weighted Index Price Index(1914=100)
Weighted Index Price Index(1914=100)
Weighted Index Price Index(1914=100)
Weighted Index Price Index(1914=100)
Weighted Index Price Index(1914=100)
Weighted Index Price Index(1914=100)
Weighted Index
Malay Labour Standard 0.4635 100.00 138.32 64.11 161.28 74.75 144.02 66.75 189.80 87.97 229.60 106.42 291.60 135.16 237.20 109.94 182.80 84.73 163.60 75.83 157.10 72.82 158.10 73.28 157.50 73.00 155.40 72.03 Chinese Labour Standard 0.2280 100.00 138.32 31.54 161.28 36.77 144.02 32.83 189.80 43.27 229.60 52.35 291.60 66.48 237.20 54.08 182.80 41.68 163.60 37.30 157.10 35.82 158.10 36.05 157.50 35.91 155.40 35.43 Indian Labour Standard 0.0299 100.00 138.32 4.14 161.28 4.83 144.02 4.31 189.80 5.68 229.60 6.87 291.60 8.73 237.20 7.10 182.80 5.47 163.60 4.90 157.10 4.70 158.10 4.73 157.50 4.71 155.40 4.65 Asiatic Clerical Standard 0.0762 100.00 138.32 10.54 161.28 12.29 144.02 10.98 189.80 14.46 229.60 17.50 291.60 22.22 237.20 18.08 182.80 13.93 163.60 12.47 157.10 11.97 158.10 12.05 157.50 12.00 155.40 11.84 Eurasian Clerical Standard 0.0020 100.00 138.32 0.27 161.28 0.32 144.02 0.28 189.80 0.37 229.60 0.45 291.60 0.57 237.20 0.46 182.80 0.36 163.60 0.32 157.10 0.31 158.10 0.31 157.50 0.31 155.40 0.30 European Standard 0.2004 100.00 138.32 27.72 161.28 32.32 144.02 28.86 189.80 38.04 229.60 46.02 291.60 58.44 237.20 47.54 182.80 36.64 163.60 32.79 157.10 31.49 158.10 31.69 157.50 31.57 155.40 31.15
1.0000 100.00 138.32 161.28 144.02 189.80 229.60 291.60 237.20 182.80 163.60 157.10 158.10 157.50 155.40
1914Rent Weights Price Index
(1914=100)Price Index(1914=100)
Weighted Index Price Index(1914=100)
Weighted Index Price Index(1914=100)
Weighted Index Price Index(1914=100)
Weighted Index Price Index(1914=100)
Weighted Index Price Index(1914=100)
Weighted Index Price Index(1914=100)
Weighted Index Price Index(1914=100)
Weighted Index Price Index(1914=100)
Weighted Index Price Index(1914=100)
Weighted Index Price Index(1914=100)
Weighted Index Price Index(1914=100)
Weighted Index Price Index(1914=100)
Weighted Index
Malay Labour Standard 0.2454 100.00 103.23 25.33 106.15 26.05 107.53 26.39 120.00 29.45 130.00 31.90 150.00 36.81 154.00 37.79 181.00 44.42 217.00 53.25 230.00 56.44 242.00 59.39 257.00 63.07 284.00 69.70 Chinese Labour Standard 0.1608 100.00 103.23 16.60 106.15 17.07 107.53 17.30 120.00 19.30 130.00 20.91 150.00 24.13 154.00 24.77 181.00 29.11 217.00 34.90 230.00 36.99 242.00 38.92 257.00 41.34 284.00 45.68 Indian Labour Standard 0.0551 100.00 103.23 5.69 106.15 5.85 107.53 5.93 120.00 6.61 130.00 7.17 150.00 8.27 154.00 8.49 181.00 9.98 217.00 11.96 230.00 12.68 242.00 13.34 257.00 14.17 284.00 15.65 Asiatic Clerical Standard 0.2186 100.00 103.23 22.56 106.15 23.20 107.53 23.51 120.00 26.23 130.00 28.42 150.00 32.79 154.00 33.66 181.00 39.56 217.00 47.43 230.00 50.27 242.00 52.90 257.00 56.18 284.00 62.08 Eurasian Clerical Standard 0.0056 100.00 103.23 0.58 106.15 0.59 107.53 0.60 120.00 0.67 130.00 0.73 150.00 0.84 154.00 0.86 181.00 1.01 217.00 1.22 230.00 1.29 242.00 1.36 257.00 1.44 284.00 1.59 European Standard 0.3144 100.00 98.02 30.82 99.61 31.32 98.27 30.90 110.00 34.59 121.00 38.05 169.00 53.14 179.00 56.28 191.00 60.06 204.00 64.15 208.00 65.40 213.00 66.98 220.00 69.18 230.00 72.32
1.0000 100.00 101.59 104.09 104.62 116.86 127.17 155.97 161.86 184.14 212.91 223.08 232.88 245.37 267.02
1914Servants Weights
Price Index(1914=100)
Price Index(1914=100)
Weighted Index Price Index(1914=100)
Weighted Index Price Index(1914=100)
Weighted Index Price Index(1914=100)
Weighted Index Price Index(1914=100)
Weighted Index Price Index(1914=100)
Weighted Index Price Index(1914=100)
Weighted Index Price Index(1914=100)
Weighted Index Price Index(1914=100)
Weighted Index Price Index(1914=100)
Weighted Index Price Index(1914=100)
Weighted Index Price Index(1914=100)
Weighted Index Price Index(1914=100)
Weighted Index
Asiatic Clerical Standard 0.1206 100.00 103.82 12.52 103.82 12.52 113.09 13.64 116.80 14.09 116.80 14.09 155.50 18.76 155.50 18.76 155.50 18.76 155.50 18.76 155.50 18.76 155.50 18.76 155.50 18.76 155.50 18.76 Eurasian Clerical Standard 0.0031 100.00 103.82 0.32 103.82 0.32 113.09 0.35 116.80 0.36 116.80 0.36 155.50 0.48 155.50 0.48 155.50 0.48 155.50 0.48 155.50 0.48 155.50 0.48 155.50 0.48 155.50 0.48 European Standard 0.8763 100.00 103.82 90.98 103.82 90.98 113.09 99.10 116.80 102.35 116.80 102.35 155.50 136.26 155.50 136.26 155.50 136.26 155.50 136.26 155.50 136.26 155.50 136.26 155.50 136.26 155.50 136.26
1.0000 100.00 103.82 103.82 113.09 116.80 116.80 155.50 155.50 155.50 155.50 155.50 155.50 155.50 155.50
1914Transport Weights
Price Index(1914=100)
Price Index(1914=100)
Weighted Index Price Index(1914=100)
Weighted Index Price Index(1914=100)
Weighted Index Price Index(1914=100)
Weighted Index Price Index(1914=100)
Weighted Index Price Index(1914=100)
Weighted Index Price Index(1914=100)
Weighted Index Price Index(1914=100)
Weighted Index Price Index(1914=100)
Weighted Index Price Index(1914=100)
Weighted Index Price Index(1914=100)
Weighted Index Price Index(1914=100)
Weighted Index Price Index(1914=100)
Weighted Index
Asiatic Clerical Standard 0.3231 100.00 101.83 32.90 103.13 33.32 108.64 35.10 112.50 36.34 122.90 39.70 126.80 40.96 122.80 39.67 112.00 36.18 94.80 30.63 99.40 32.11 105.30 34.02 103.50 33.44 94.20 30.43 Eurasian Clerical Standard 0.0083 100.00 101.83 0.84 103.13 0.85 108.64 0.90 112.50 0.93 122.90 1.02 126.80 1.05 122.80 1.02 112.00 0.93 94.80 0.79 99.40 0.82 105.30 0.87 103.50 0.86 94.20 0.78 European Standard 0.6687 100.00 101.83 68.09 103.13 68.96 108.64 72.64 112.50 75.22 122.90 82.18 126.80 84.79 122.80 82.11 112.00 74.89 94.80 63.39 99.40 66.46 105.30 70.41 103.50 69.21 94.20 62.99
1.0000 100.00 101.83 103.13 108.64 112.50 122.90 126.80 122.80 112.00 94.80 99.40 105.30 103.50 94.20
1914Club Weights
Price Index(1914=100)
Price Index(1914=100)
Weighted Index Price Index(1914=100)
Weighted Index Price Index(1914=100)
Weighted Index Price Index(1914=100)
Weighted Index Price Index(1914=100)
Weighted Index Price Index(1914=100)
Weighted Index Price Index(1914=100)
Weighted Index Price Index(1914=100)
Weighted Index Price Index(1914=100)
Weighted Index Price Index(1914=100)
Weighted Index Price Index(1914=100)
Weighted Index Price Index(1914=100)
Weighted Index Price Index(1914=100)
Weighted Index
European Standard 1.0000 100.00 91.31 91.31 103.77 103.77 113.88 113.88 134.00 134.00 147.40 147.40 163.50 163.50 176.70 176.70 177.40 177.40 169.20 169.20 164.10 164.10 164.20 164.20 161.70 161.70 159.50 159.50 1.0000 100.00 91.31 103.77 113.88 134.00 147.40 163.50 176.70 177.40 169.20 164.10 164.20 161.70 159.50
Weights 1914Price Index(1914=100)
Price Index(1914=100)
Weighted Index Price Index(1914=100)
Weighted Index Price Index(1914=100)
Weighted Index Price Index(1914=100)
Weighted Index Price Index(1914=100)
Weighted Index Price Index(1914=100)
Weighted Index Price Index(1914=100)
Weighted Index Price Index(1914=100)
Weighted Index Price Index(1914=100)
Weighted Index Price Index(1914=100)
Weighted Index Price Index(1914=100)
Weighted Index Price Index(1914=100)
Weighted Index Price Index(1914=100)
Weighted Index
Food & Groceries 0.7015 100.00 104.15 73.06 109.67 76.94 118.00 82.78 140.13 98.31 189.06 132.63 250.50 175.74 167.78 117.70 145.12 101.81 145.00 101.73 145.66 102.19 150.94 105.89 159.70 112.04 154.81 108.61 Tobacco 0.0368 100.00 96.87 3.57 146.95 5.41 129.11 4.76 174.45 6.43 201.25 7.41 244.13 8.99 239.32 8.81 237.03 8.73 200.98 7.40 187.66 6.91 186.01 6.85 190.26 7.01 182.73 6.73 Clothing 0.1139 100.00 138.32 15.75 161.28 18.37 144.02 16.40 189.80 21.62 229.60 26.15 291.60 33.21 237.20 27.02 182.80 20.82 163.60 18.63 157.10 17.89 158.10 18.01 157.50 17.94 155.40 17.70 Rent 0.0442 100.00 101.59 4.49 104.09 4.60 104.62 4.63 116.86 5.17 127.17 5.62 155.97 6.90 161.86 7.16 184.14 8.14 212.91 9.42 223.08 9.87 232.88 10.30 245.37 10.85 267.02 11.81 Servant 0.0506 100.00 103.82 5.25 103.82 5.25 113.09 5.72 116.80 5.91 116.80 5.91 155.50 7.87 155.50 7.87 155.50 7.87 155.50 7.87 155.50 7.87 155.50 7.87 155.50 7.87 155.50 7.87 Transport 0.0373 100.00 101.83 3.80 103.13 3.85 108.64 4.05 112.50 4.20 122.90 4.59 126.80 4.73 122.80 4.58 112.00 4.18 94.80 3.54 99.40 3.71 105.30 3.93 103.50 3.86 94.20 3.51 Club 0.0156 100.00 91.31 1.42 103.77 1.62 113.88 1.78 134.00 2.09 147.40 2.30 163.50 2.55 176.70 2.75 177.40 2.77 169.20 2.64 164.10 2.56 164.20 2.56 161.70 2.52 159.50 2.49 CPI 1.0000 100.00 107.35 116.05 120.12 143.71 184.61 239.99 175.90 154.31 151.22 151.00 155.40 162.09 158.72
1924 1925 1926 19271915 1916 1917 1918 1919 1920 1921 1922 1923
19271923 1924 1925 19261919 1920 1921 19221915 1916 1917 1918
1924 1925 1926 19271915 1916 1917 1918 1919 1920 1921 1922 1923
19271923 1924 1925 19261919 1920 1921 19221915 1916 1917 1918
1924 1925 1926 19271915 1916 1917 1918 1919 1920 1921 1922 1923
19271923 1924 1925 19261919 1920 1921 19221915 1916 1917 1918
1924 1925 1926 19271920 1921 1922 19231916 1917 1918 1919
192519241923 19271926
Major Object of Consumption
19221921192019191918191719161915
1915
68

APPENDIX 6 Computation of Consumer Price Indices by Major Object of Consumption (1914=100)-Malaya, 1914-39 (Cont’d)
1914Food & Groceries Weights
Price Index(1914=100)
Price Index(1914=100)
Weighted Index Price Index(1914=100)
Weighted Index Price Index(1914=100)
Weighted Index Price Index(1914=100)
Weighted Index Price Index(1914=100)
Weighted Index Price Index(1914=100)
Weighted Index Price Index(1914=100)
Weighted Index Price Index(1914=100)
Weighted Index Price Index(1914=100)
Weighted Index Price Index(1914=100)
Weighted Index Price Index(1914=100)
Weighted Index Price Index(1914=100)
Weighted Index
Malay Labour Standard 0.4945 100.00 151.20 74.77 149.70 74.03 140.20 69.33 103.00 50.94 86.50 42.78 78.80 38.97 83.40 41.24 93.90 46.44 91.00 45.00 101.50 50.20 93.70 46.34 92.83 45.91 Chinese Labour Standard 0.2553 100.00 151.20 38.60 149.70 38.22 140.20 35.79 103.00 26.29 86.50 22.08 78.80 20.12 83.40 21.29 93.90 23.97 91.00 23.23 101.50 25.91 93.70 23.92 92.83 23.70 Indian Labour Standard 0.1221 100.00 151.20 18.46 149.70 18.28 140.20 17.12 103.00 12.58 86.50 10.56 78.80 9.62 83.40 10.18 93.90 11.46 91.00 11.11 101.50 12.39 93.70 11.44 92.83 11.33 Asiatic Clerical Standard 0.0587 100.00 151.20 8.88 149.70 8.79 140.20 8.24 103.00 6.05 86.50 5.08 78.80 4.63 83.40 4.90 93.90 5.52 91.00 5.35 101.50 5.96 93.70 5.50 92.83 5.45 Eurasian Clerical Standard 0.0017 100.00 149.40 0.26 141.40 0.24 132.00 0.23 109.70 0.19 97.80 0.17 93.80 0.16 96.10 0.17 97.20 0.17 96.10 0.17 102.60 0.18 96.20 0.17 88.39 0.15 European Standard 0.0676 100.00 149.40 10.10 141.40 9.56 132.00 8.93 109.70 7.42 97.80 6.61 93.80 6.34 96.10 6.50 97.20 6.57 96.10 6.50 102.60 6.94 96.20 6.51 88.39 5.98
1.0000 100.00 151.08 149.12 139.63 103.46 87.28 79.84 84.28 94.13 91.35 101.58 93.87 92.52
1914Tobacco Weights
Price Index(1914=100)
Price Index(1914=100)
Weighted Index Price Index(1914=100)
Weighted Index Price Index(1914=100)
Weighted Index Price Index(1914=100)
Weighted Index Price Index(1914=100)
Weighted Index Price Index(1914=100)
Weighted Index Price Index(1914=100)
Weighted Index Price Index(1914=100)
Weighted Index Price Index(1914=100)
Weighted Index Price Index(1914=100)
Weighted Index Price Index(1914=100)
Weighted Index Price Index(1914=100)
Weighted Index
Malay Labour Standard 0.3888 100.00 185.70 72.21 185.70 72.21 171.40 66.65 171.40 66.65 165.70 64.43 142.90 55.57 142.90 55.57 128.60 50.00 128.60 50.00 128.60 50.00 128.60 50.00 144.68 56.26 Chinese Labour Standard 0.1838 100.00 185.70 34.13 185.70 34.13 171.40 31.51 171.40 31.51 165.70 30.46 142.90 26.27 142.90 26.27 128.60 23.64 128.60 23.64 128.60 23.64 128.60 23.64 144.68 26.59 Indian Labour Standard 0.0670 100.00 185.70 12.43 185.70 12.43 171.40 11.48 171.40 11.48 165.70 11.09 142.90 9.57 142.90 9.57 128.60 8.61 128.60 8.61 128.60 8.61 128.60 8.61 144.68 9.69 Asiatic Clerical Standard 0.0532 100.00 185.70 9.89 185.70 9.89 171.40 9.12 171.40 9.12 165.70 8.82 142.90 7.61 142.90 7.61 128.60 6.85 128.60 6.85 128.60 6.85 128.60 6.85 144.68 7.70 Eurasian Clerical Standard 0.0014 100.00 185.70 0.25 185.70 0.25 171.40 0.23 171.40 0.23 165.70 0.23 142.90 0.20 142.90 0.20 128.60 0.18 128.60 0.18 128.60 0.18 128.60 0.18 144.68 0.20 European Standard 0.3058 100.00 176.30 53.91 167.00 51.07 168.70 51.59 178.40 54.55 172.00 52.60 168.00 51.37 170.50 52.14 166.50 50.92 165.90 50.73 165.90 50.73 164.20 50.21 164.07 50.17
1.0000 100.00 182.83 179.98 170.57 173.54 167.63 150.58 151.34 140.19 140.01 140.01 139.49 150.61
1914Clothing Weights
Price Index(1914=100)
Price Index(1914=100)
Weighted Index Price Index(1914=100)
Weighted Index Price Index(1914=100)
Weighted Index Price Index(1914=100)
Weighted Index Price Index(1914=100)
Weighted Index Price Index(1914=100)
Weighted Index Price Index(1914=100)
Weighted Index Price Index(1914=100)
Weighted Index Price Index(1914=100)
Weighted Index Price Index(1914=100)
Weighted Index Price Index(1914=100)
Weighted Index Price Index(1914=100)
Weighted Index
Malay Labour Standard 0.4635 100.00 151.90 70.41 141.00 65.35 139.80 64.80 133.20 61.74 110.00 50.98 106.90 49.55 99.50 46.12 99.70 46.21 98.30 45.56 105.80 49.04 108.10 50.10 117.50 54.46 Chinese Labour Standard 0.2280 100.00 151.90 34.63 141.00 32.15 139.80 31.87 133.20 30.37 110.00 25.08 106.90 24.37 99.50 22.69 99.70 22.73 98.30 22.41 105.80 24.12 108.10 24.65 117.50 26.79 Indian Labour Standard 0.0299 100.00 151.90 4.55 141.00 4.22 139.80 4.18 133.20 3.99 110.00 3.29 106.90 3.20 99.50 2.98 99.70 2.98 98.30 2.94 105.80 3.17 108.10 3.23 117.50 3.52 Asiatic Clerical Standard 0.0762 100.00 151.90 11.58 141.00 10.75 139.80 10.65 133.20 10.15 110.00 8.38 106.90 8.15 99.50 7.58 99.70 7.60 98.30 7.49 105.80 8.06 108.10 8.24 117.50 8.96 Eurasian Clerical Standard 0.0020 100.00 151.90 0.30 141.00 0.28 139.80 0.27 133.20 0.26 110.00 0.21 106.90 0.21 99.50 0.19 99.70 0.19 98.30 0.19 105.80 0.21 108.10 0.21 117.50 0.23 European Standard 0.2004 100.00 151.90 30.44 141.00 28.26 139.80 28.02 139.80 28.02 132.30 26.52 124.10 24.87 121.60 24.37 119.50 23.95 119.50 23.95 119.50 23.95 119.50 23.95 129.90 26.03
1.0000 100.00 151.90 141.00 139.80 134.52 114.47 110.35 103.93 103.67 102.55 108.55 110.38 119.99
1914Rent Weights Price Index
(1914=100)Price Index(1914=100)
Weighted Index Price Index(1914=100)
Weighted Index Price Index(1914=100)
Weighted Index Price Index(1914=100)
Weighted Index Price Index(1914=100)
Weighted Index Price Index(1914=100)
Weighted Index Price Index(1914=100)
Weighted Index Price Index(1914=100)
Weighted Index Price Index(1914=100)
Weighted Index Price Index(1914=100)
Weighted Index Price Index(1914=100)
Weighted Index Price Index(1914=100)
Weighted Index
Malay Labour Standard 0.2454 100.00 312.00 76.57 314.50 77.18 289.70 71.10 247.40 60.71 200.40 49.18 175.60 43.09 175.60 43.09 175.60 43.09 175.60 43.09 177.70 43.61 188.90 46.36 207.65 50.96 Chinese Labour Standard 0.1608 100.00 312.00 50.18 314.50 50.58 289.70 46.60 247.40 39.79 200.40 32.23 175.60 28.24 175.60 28.24 175.60 28.24 175.60 28.24 177.70 28.58 188.90 30.38 207.65 33.40 Indian Labour Standard 0.0551 100.00 312.00 17.20 314.50 17.34 289.70 15.97 247.40 13.64 200.40 11.05 175.60 9.68 175.60 9.68 175.60 9.68 175.60 9.68 177.70 9.79 188.90 10.41 207.65 11.45 Asiatic Clerical Standard 0.2186 100.00 312.00 68.20 314.50 68.75 289.70 63.32 247.40 54.08 200.40 43.80 175.60 38.38 175.60 38.38 175.60 38.38 175.60 38.38 177.70 38.84 188.90 41.29 207.65 45.39 Eurasian Clerical Standard 0.0056 100.00 312.00 1.75 314.50 1.76 289.70 1.62 247.40 1.39 200.40 1.12 175.60 0.98 175.60 0.98 175.60 0.98 175.60 0.98 177.70 1.00 188.90 1.06 207.65 1.16 European Standard 0.3144 100.00 248.00 77.98 249.00 78.30 229.50 72.16 201.60 63.39 166.50 52.35 146.40 46.03 146.40 46.03 146.40 46.03 146.40 46.03 149.60 47.04 154.80 48.68 162.83 51.20
1.0000 100.00 291.88 293.90 270.77 233.00 189.74 166.42 166.42 166.42 166.42 168.86 178.18 193.56
1914Servants Weights
Price Index(1914=100)
Price Index(1914=100)
Weighted Index Price Index(1914=100)
Weighted Index Price Index(1914=100)
Weighted Index Price Index(1914=100)
Weighted Index Price Index(1914=100)
Weighted Index Price Index(1914=100)
Weighted Index Price Index(1914=100)
Weighted Index Price Index(1914=100)
Weighted Index Price Index(1914=100)
Weighted Index Price Index(1914=100)
Weighted Index Price Index(1914=100)
Weighted Index Price Index(1914=100)
Weighted Index
Asiatic Clerical Standard 0.1206 100.00 155.50 18.76 155.50 18.76 152.90 18.44 138.00 16.65 124.70 15.04 115.80 13.97 123.70 14.92 127.40 15.37 125.70 15.16 130.00 15.68 128.20 15.46 128.20 15.46 Eurasian Clerical Standard 0.0031 100.00 155.50 0.48 155.50 0.48 152.90 0.47 138.00 0.43 124.70 0.39 115.80 0.36 123.70 0.38 127.40 0.39 125.70 0.39 130.00 0.40 128.20 0.40 128.20 0.40 European Standard 0.8763 100.00 155.50 136.26 155.50 136.26 152.90 133.98 138.00 120.93 124.70 109.27 115.80 101.47 123.70 108.40 127.40 111.64 125.70 110.15 130.00 113.92 128.20 112.34 128.20 112.34
1.0000 100.00 155.50 155.50 152.90 138.00 124.70 115.80 123.70 127.40 125.70 130.00 128.20 128.20
1914Transport Weights
Price Index(1914=100)
Price Index(1914=100)
Weighted Index Price Index(1914=100)
Weighted Index Price Index(1914=100)
Weighted Index Price Index(1914=100)
Weighted Index Price Index(1914=100)
Weighted Index Price Index(1914=100)
Weighted Index Price Index(1914=100)
Weighted Index Price Index(1914=100)
Weighted Index Price Index(1914=100)
Weighted Index Price Index(1914=100)
Weighted Index Price Index(1914=100)
Weighted Index Price Index(1914=100)
Weighted Index
Asiatic Clerical Standard 0.3231 100.00 93.10 30.08 89.70 28.98 85.50 27.62 96.20 31.08 89.00 28.75 85.40 27.59 84.50 27.30 82.40 26.62 80.00 25.84 81.40 26.30 81.50 26.33 82.18 26.55 Eurasian Clerical Standard 0.0083 100.00 93.10 0.77 89.70 0.74 85.50 0.71 96.20 0.80 89.00 0.74 85.40 0.71 84.50 0.70 82.40 0.68 80.00 0.66 81.40 0.67 81.50 0.68 82.18 0.68 European Standard 0.6687 100.00 93.10 62.25 89.70 59.98 85.50 57.17 96.20 64.33 89.00 59.51 85.40 57.10 84.50 56.50 82.40 55.10 80.00 53.49 81.40 54.43 81.50 54.50 82.18 54.95
1.0000 100.00 93.10 89.70 85.50 96.20 89.00 85.40 84.50 82.40 80.00 81.40 81.50 82.18
1914Club Weights
Price Index(1914=100)
Price Index(1914=100)
Weighted Index Price Index(1914=100)
Weighted Index Price Index(1914=100)
Weighted Index Price Index(1914=100)
Weighted Index Price Index(1914=100)
Weighted Index Price Index(1914=100)
Weighted Index Price Index(1914=100)
Weighted Index Price Index(1914=100)
Weighted Index Price Index(1914=100)
Weighted Index Price Index(1914=100)
Weighted Index Price Index(1914=100)
Weighted Index Price Index(1914=100)
Weighted Index
European Standard 1.0000 100.00 159.50 159.50 155.30 155.30 156.10 156.10 160.50 160.50 160.10 160.10 158.40 158.40 159.50 159.50 157.70 157.70 157.40 157.40 157.70 157.70 159.40 159.40 152.87 152.87 1.0000 100.00 159.50 155.30 156.10 160.50 160.10 158.40 159.50 157.70 157.40 157.70 159.40 152.87
Weights 1914Price Index(1914=100)
Price Index(1914=100)
Weighted Index Price Index(1914=100)
Weighted Index Price Index(1914=100)
Weighted Index Price Index(1914=100)
Weighted Index Price Index(1914=100)
Weighted Index Price Index(1914=100)
Weighted Index Price Index(1914=100)
Weighted Index Price Index(1914=100)
Weighted Index Price Index(1914=100)
Weighted Index Price Index(1914=100)
Weighted Index Price Index(1914=100)
Weighted Index Price Index(1914=100)
Weighted Index
Food & Groceries 0.7015 100.00 151.08 105.99 149.12 104.62 139.63 97.96 103.46 72.59 87.28 61.23 79.84 56.01 84.28 59.13 94.13 66.04 91.35 64.09 101.58 71.26 93.87 65.86 92.52 64.91 Tobacco 0.0368 100.00 182.83 6.73 179.98 6.63 170.57 6.28 173.54 6.39 167.63 6.17 150.58 5.55 151.34 5.57 140.19 5.16 140.01 5.16 140.01 5.16 139.49 5.14 150.61 5.55 Clothing 0.1139 100.00 151.90 17.30 141.00 16.06 139.80 15.92 134.52 15.32 114.47 13.04 110.35 12.57 103.93 11.84 103.67 11.81 102.55 11.68 108.55 12.36 110.38 12.57 119.99 13.67 Rent 0.0442 100.00 291.88 12.91 293.90 13.00 270.77 11.97 233.00 10.30 189.74 8.39 166.42 7.36 166.42 7.36 166.42 7.36 166.42 7.36 168.86 7.47 178.18 7.88 193.56 8.56 Servant 0.0506 100.00 155.50 7.87 155.50 7.87 152.90 7.74 138.00 6.98 124.70 6.31 115.80 5.86 123.70 6.26 127.40 6.45 125.70 6.36 130.00 6.58 128.20 6.49 128.20 6.49 Transport 0.0373 100.00 93.10 3.47 89.70 3.35 85.50 3.19 96.20 3.59 89.00 3.32 85.40 3.19 84.50 3.15 82.40 3.07 80.00 2.98 81.40 3.04 81.50 3.04 82.18 3.07 Club 0.0156 100.00 159.50 2.49 155.30 2.42 156.10 2.43 160.50 2.50 160.10 2.50 158.40 2.47 159.50 2.49 157.70 2.46 157.40 2.45 157.70 2.46 159.40 2.48 152.87 2.38 CPI 1.0000 100.00 156.76 153.94 145.50 117.68 100.96 93.00 95.80 102.35 100.08 108.32 103.46 104.62
1936 1937 1938 19391932 1933 1934 19351928 1929 1930 1931
19391935 1936 1937 19381931 1932 1933 19341928 1929 1930
1936 1937 1938 19391932 1933 1934 19351928 1929 1930 1931
19391935 1936 1937 19381931 1932 1933 19341928 1929 1930
1936 1937 1938 19391932 1933 1934 19351928 1929 1930 1931
19391935 1936 1937 19381931 1932 1933 19341928 1929 1930
1936 1937 1938 19391932 1933 1934 19351928 1929 1930 1931
193419331932 193919381937193619351931193019291928
Major Object of Consumption
69

APPENDIX 7 Computation of Consumer Price Indices by Major Object of Consumption
(1914=100)-Malaya, 1900-14
1914Food & Groceries Weights
Price Index(1914=100)
Price Index(1914=100)
Weighted Index Price Index(1914=100)
Weighted Index Price Index(1914=100)
Weighted Index Price Index(1914=100)
Weighted Index Price Index(1914=100)
Weighted Index
Malay Labour Standard 0.4945 100.00 87.36 43.20 95.85 47.40 90.79 44.90 95.99 47.47 97.73 48.33 Chinese Labour Standard 0.2553 100.00 87.36 22.30 95.85 24.47 90.79 23.18 95.99 24.50 97.73 24.95 Indian Labour Standard 0.1221 100.00 87.36 10.67 95.85 11.70 90.79 11.08 95.99 11.72 97.73 11.93 Asiatic Clerical Standard 0.0587 100.00 87.36 5.13 95.85 5.63 90.79 5.33 95.99 5.64 97.73 5.74 Eurasian Clerical Standard 0.0017 100.00 87.36 0.15 95.85 0.16 90.79 0.16 95.99 0.16 97.73 0.17 European Standard 0.0676 100.00 87.36 5.91 95.85 6.48 90.79 6.14 95.99 6.49 97.73 6.61
1.0000 100.00 - 87.36 95.85 90.79 95.99 97.73
1914Tobacco Weights
Price Index(1914=100)
Price Index(1914=100)
Weighted Index Price Index(1914=100)
Weighted Index Price Index(1914=100)
Weighted Index Price Index(1914=100)
Weighted Index Price Index(1914=100)
Weighted Index
Malay Labour Standard 0.3888 100.00 57.06 22.19 59.78 23.25 53.63 20.85 68.40 26.59 69.80 27.14 Chinese Labour Standard 0.1838 100.00 57.06 10.49 59.78 10.99 53.63 9.86 68.40 12.57 69.80 12.83 Indian Labour Standard 0.0670 100.00 57.06 3.82 59.78 4.00 53.63 3.59 68.40 4.58 69.80 4.67 Asiatic Clerical Standard 0.0532 100.00 57.06 3.04 59.78 3.18 53.63 2.85 68.40 3.64 69.80 3.72 Eurasian Clerical Standard 0.0014 100.00 57.06 0.08 59.78 0.08 53.63 0.07 68.40 0.09 69.80 0.10 European Standard 0.3058 100.00 93.93 28.72 102.60 31.37 102.16 31.24 99.76 30.51 110.51 33.79
1.0000 100.00 - 68.34 72.87 68.47 77.99 82.25
1914Clothing Weights
Price Index(1914=100)
Price Index(1914=100)
Weighted Index Price Index(1914=100)
Weighted Index Price Index(1914=100)
Weighted Index Price Index(1914=100)
Weighted Index Price Index(1914=100)
Weighted Index
Malay Labour Standard 0.4635 100.00 83.22 38.57 80.34 37.24 98.09 45.46 107.27 49.72 104.00 48.20 Chinese Labour Standard 0.2280 100.00 83.22 18.97 80.34 18.32 98.09 22.36 107.27 24.46 104.00 23.71 Indian Labour Standard 0.0299 100.00 83.22 2.49 80.34 2.40 98.09 2.94 107.27 3.21 104.00 3.11 Asiatic Clerical Standard 0.0762 100.00 83.22 6.34 80.34 6.12 98.09 7.48 107.27 8.18 104.00 7.93 Eurasian Clerical Standard 0.0020 100.00 83.22 0.16 80.34 0.16 98.09 0.19 107.27 0.21 104.00 0.20 European Standard 0.2004 100.00 83.22 16.68 80.34 16.10 98.09 19.66 107.27 21.50 104.00 20.84
1.0000 100.00 - 83.22 80.34 98.09 107.27 104.00
1914Rent Weights
Price Index(1914=100)
Price Index(1914=100)
Weighted Index Price Index(1914=100)
Weighted Index Price Index(1914=100)
Weighted Index Price Index(1914=100)
Weighted Index Price Index(1914=100)
Weighted Index
Malay Labour Standard 0.2454 100.00 71.14 17.46 72.69 17.84 74.28 18.23 75.90 18.63 77.56 19.03 Chinese Labour Standard 0.1608 100.00 71.14 11.44 72.69 11.69 74.28 11.95 75.90 12.21 77.56 12.47 Indian Labour Standard 0.0551 100.00 71.14 3.92 72.69 4.01 74.28 4.09 75.90 4.18 77.56 4.27 Asiatic Clerical Standard 0.2186 100.00 71.14 15.55 72.69 15.89 74.28 16.24 75.90 16.59 77.56 16.95 Eurasian Clerical Standard 0.0056 100.00 71.14 0.40 72.69 0.41 74.28 0.42 75.90 0.43 77.56 0.43 European Standard 0.3144 100.00 79.35 24.95 80.58 25.34 81.84 25.73 83.11 26.13 84.40 26.54
1.0000 100.00 - 73.72 75.18 76.66 78.17 79.71
1914Servants Weights
Price Index(1914=100)
Price Index(1914=100)
Weighted Index Price Index(1914=100)
Weighted Index Price Index(1914=100)
Weighted Index Price Index(1914=100)
Weighted Index Price Index(1914=100)
Weighted Index
Asiatic Clerical Standard 0.1206 100.00 69.64 8.40 75.00 9.05 73.21 8.83 82.14 9.91 82.14 9.91 Eurasian Clerical Standard 0.0031 100.00 69.64 0.22 75.00 0.23 73.21 0.23 82.14 0.25 82.14 0.25 European Standard 0.8763 100.00 69.64 61.03 75.00 65.72 73.21 64.16 82.14 71.98 82.14 71.98
1.0000 100.00 - 69.64 75.00 73.21 82.14 82.14
1914Transport Weights
Price Index(1914=100)
Price Index(1914=100)
Weighted Index Price Index(1914=100)
Weighted Index Price Index(1914=100)
Weighted Index Price Index(1914=100)
Weighted Index Price Index(1914=100)
Weighted Index
Asiatic Clerical Standard 0.3231 100.00 109.66 35.43 107.87 34.85 107.44 34.71 107.23 34.64 107.34 34.68 Eurasian Clerical Standard 0.0083 100.00 109.66 0.91 107.87 0.89 107.44 0.89 107.23 0.89 107.34 0.89 European Standard 0.6687 100.00 109.66 73.33 107.87 72.13 107.44 71.84 107.23 71.70 107.34 71.77
1.0000 100.00 - 109.66 107.87 107.44 107.23 107.34
1914Club Weights
Price Index(1914=100)
Price Index(1914=100)
Weighted Index Price Index(1914=100)
Weighted Index Price Index(1914=100)
Weighted Index Price Index(1914=100)
Weighted Index Price Index(1914=100)
Weighted Index
European Standard 1.0000 100.00 90.65 90.65 99.22 99.22 96.47 96.47 97.88 97.88 104.12 104.12 1.0000 100.00 - 90.65 99.22 96.47 97.88 104.12
Weights 1914Price Index(1914=100)
Price Index(1914=100)
Weighted Index Price Index(1914=100)
Weighted Index Price Index(1914=100)
Weighted Index Price Index(1914=100)
Weighted Index Price Index(1914=100)
Weighted Index
Food & Groceries 0.7015 100.00 87.36 61.29 95.85 67.24 90.79 63.69 95.99 67.34 97.73 68.56 Tobacco 0.0368 100.00 68.34 2.52 72.87 2.68 68.47 2.52 77.99 2.87 82.25 3.03 Clothing 0.1139 100.00 83.22 9.48 80.34 9.15 98.09 11.17 107.27 12.22 104.00 11.84 Rent 0.0442 100.00 73.72 3.26 75.18 3.32 76.66 3.39 78.17 3.46 79.71 3.52 Servant 0.0506 100.00 69.64 3.52 75.00 3.80 73.21 3.71 82.14 4.16 82.14 4.16 Transport 0.0373 100.00 109.66 4.09 107.87 4.02 107.44 4.01 107.23 4.00 107.34 4.00 Club 0.0156 100.00 90.65 1.41 99.22 1.55 96.47 1.50 97.88 1.53 104.12 1.62 CPI 1.0000 100.00 85.57 91.77 89.99 95.57 96.75
Major Object of Consumption 1899 1900 1901 1902 1903
19031899 1900 1901 1902
1899 1900 1901 1902 1903
19031899 1900 1901 1902
1899 1900 1901 1902 1903
19031899 1900 1901 1902
1899 1900 1901 1902 1903
19031899 1900 1901 1902
70
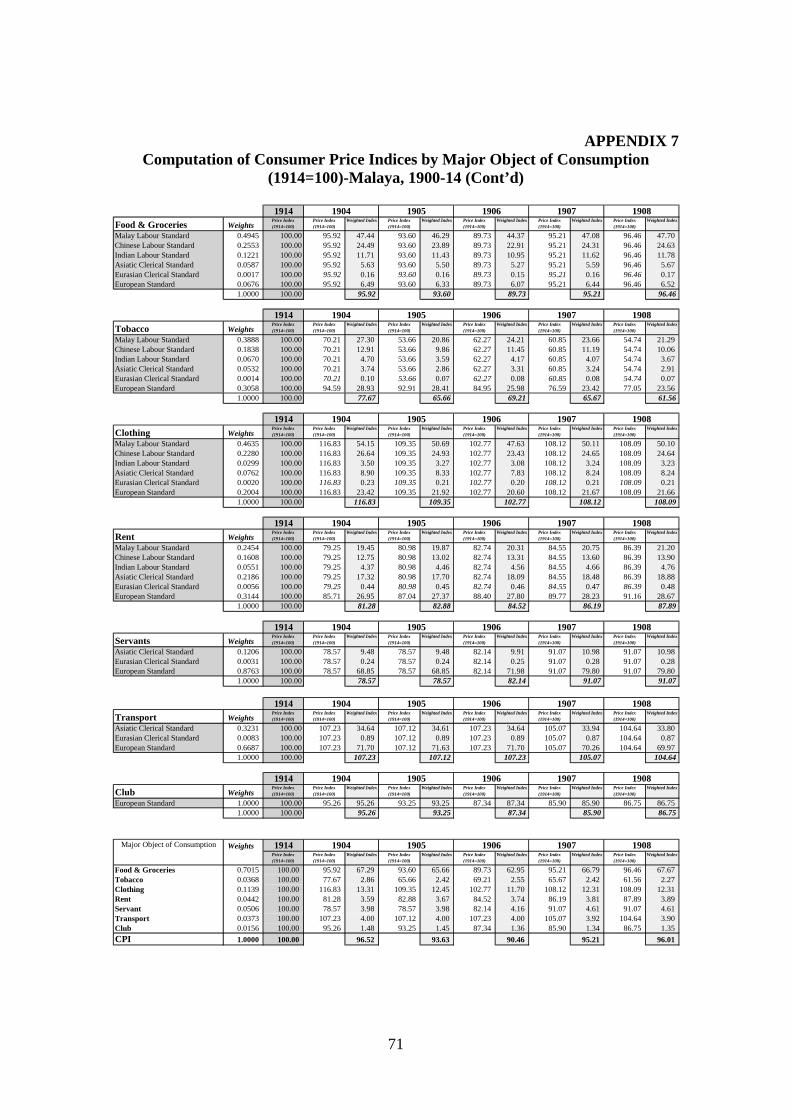
APPENDIX 7 Computation of Consumer Price Indices by Major Object of Consumption
(1914=100)-Malaya, 1900-14 (Cont’d)
1914Food & Groceries Weights
Price Index(1914=100)
Price Index(1914=100)
Weighted Index Price Index(1914=100)
Weighted Index Price Index(1914=100)
Weighted Index Price Index(1914=100)
Weighted Index Price Index(1914=100)
Weighted Index
Malay Labour Standard 0.4945 100.00 95.92 47.44 93.60 46.29 89.73 44.37 95.21 47.08 96.46 47.70 Chinese Labour Standard 0.2553 100.00 95.92 24.49 93.60 23.89 89.73 22.91 95.21 24.31 96.46 24.63 Indian Labour Standard 0.1221 100.00 95.92 11.71 93.60 11.43 89.73 10.95 95.21 11.62 96.46 11.78 Asiatic Clerical Standard 0.0587 100.00 95.92 5.63 93.60 5.50 89.73 5.27 95.21 5.59 96.46 5.67 Eurasian Clerical Standard 0.0017 100.00 95.92 0.16 93.60 0.16 89.73 0.15 95.21 0.16 96.46 0.17 European Standard 0.0676 100.00 95.92 6.49 93.60 6.33 89.73 6.07 95.21 6.44 96.46 6.52
1.0000 100.00 95.92 93.60 89.73 95.21 96.46
1914Tobacco Weights
Price Index(1914=100)
Price Index(1914=100)
Weighted Index Price Index(1914=100)
Weighted Index Price Index(1914=100)
Weighted Index Price Index(1914=100)
Weighted Index Price Index(1914=100)
Weighted Index
Malay Labour Standard 0.3888 100.00 70.21 27.30 53.66 20.86 62.27 24.21 60.85 23.66 54.74 21.29 Chinese Labour Standard 0.1838 100.00 70.21 12.91 53.66 9.86 62.27 11.45 60.85 11.19 54.74 10.06 Indian Labour Standard 0.0670 100.00 70.21 4.70 53.66 3.59 62.27 4.17 60.85 4.07 54.74 3.67 Asiatic Clerical Standard 0.0532 100.00 70.21 3.74 53.66 2.86 62.27 3.31 60.85 3.24 54.74 2.91 Eurasian Clerical Standard 0.0014 100.00 70.21 0.10 53.66 0.07 62.27 0.08 60.85 0.08 54.74 0.07 European Standard 0.3058 100.00 94.59 28.93 92.91 28.41 84.95 25.98 76.59 23.42 77.05 23.56
1.0000 100.00 77.67 65.66 69.21 65.67 61.56
1914Clothing Weights
Price Index(1914=100)
Price Index(1914=100)
Weighted Index Price Index(1914=100)
Weighted Index Price Index(1914=100)
Weighted Index Price Index(1914=100)
Weighted Index Price Index(1914=100)
Weighted Index
Malay Labour Standard 0.4635 100.00 116.83 54.15 109.35 50.69 102.77 47.63 108.12 50.11 108.09 50.10 Chinese Labour Standard 0.2280 100.00 116.83 26.64 109.35 24.93 102.77 23.43 108.12 24.65 108.09 24.64 Indian Labour Standard 0.0299 100.00 116.83 3.50 109.35 3.27 102.77 3.08 108.12 3.24 108.09 3.23 Asiatic Clerical Standard 0.0762 100.00 116.83 8.90 109.35 8.33 102.77 7.83 108.12 8.24 108.09 8.24 Eurasian Clerical Standard 0.0020 100.00 116.83 0.23 109.35 0.21 102.77 0.20 108.12 0.21 108.09 0.21 European Standard 0.2004 100.00 116.83 23.42 109.35 21.92 102.77 20.60 108.12 21.67 108.09 21.66
1.0000 100.00 116.83 109.35 102.77 108.12 108.09
1914Rent Weights
Price Index(1914=100)
Price Index(1914=100)
Weighted Index Price Index(1914=100)
Weighted Index Price Index(1914=100)
Weighted Index Price Index(1914=100)
Weighted Index Price Index(1914=100)
Weighted Index
Malay Labour Standard 0.2454 100.00 79.25 19.45 80.98 19.87 82.74 20.31 84.55 20.75 86.39 21.20 Chinese Labour Standard 0.1608 100.00 79.25 12.75 80.98 13.02 82.74 13.31 84.55 13.60 86.39 13.90 Indian Labour Standard 0.0551 100.00 79.25 4.37 80.98 4.46 82.74 4.56 84.55 4.66 86.39 4.76 Asiatic Clerical Standard 0.2186 100.00 79.25 17.32 80.98 17.70 82.74 18.09 84.55 18.48 86.39 18.88 Eurasian Clerical Standard 0.0056 100.00 79.25 0.44 80.98 0.45 82.74 0.46 84.55 0.47 86.39 0.48 European Standard 0.3144 100.00 85.71 26.95 87.04 27.37 88.40 27.80 89.77 28.23 91.16 28.67
1.0000 100.00 81.28 82.88 84.52 86.19 87.89
1914Servants Weights
Price Index(1914=100)
Price Index(1914=100)
Weighted Index Price Index(1914=100)
Weighted Index Price Index(1914=100)
Weighted Index Price Index(1914=100)
Weighted Index Price Index(1914=100)
Weighted Index
Asiatic Clerical Standard 0.1206 100.00 78.57 9.48 78.57 9.48 82.14 9.91 91.07 10.98 91.07 10.98 Eurasian Clerical Standard 0.0031 100.00 78.57 0.24 78.57 0.24 82.14 0.25 91.07 0.28 91.07 0.28 European Standard 0.8763 100.00 78.57 68.85 78.57 68.85 82.14 71.98 91.07 79.80 91.07 79.80
1.0000 100.00 78.57 78.57 82.14 91.07 91.07
1914Transport Weights
Price Index(1914=100)
Price Index(1914=100)
Weighted Index Price Index(1914=100)
Weighted Index Price Index(1914=100)
Weighted Index Price Index(1914=100)
Weighted Index Price Index(1914=100)
Weighted Index
Asiatic Clerical Standard 0.3231 100.00 107.23 34.64 107.12 34.61 107.23 34.64 105.07 33.94 104.64 33.80 Eurasian Clerical Standard 0.0083 100.00 107.23 0.89 107.12 0.89 107.23 0.89 105.07 0.87 104.64 0.87 European Standard 0.6687 100.00 107.23 71.70 107.12 71.63 107.23 71.70 105.07 70.26 104.64 69.97
1.0000 100.00 107.23 107.12 107.23 105.07 104.64
1914Club Weights
Price Index(1914=100)
Price Index(1914=100)
Weighted Index Price Index(1914=100)
Weighted Index Price Index(1914=100)
Weighted Index Price Index(1914=100)
Weighted Index Price Index(1914=100)
Weighted Index
European Standard 1.0000 100.00 95.26 95.26 93.25 93.25 87.34 87.34 85.90 85.90 86.75 86.75 1.0000 100.00 95.26 93.25 87.34 85.90 86.75
Weights 1914Price Index(1914=100)
Price Index(1914=100)
Weighted Index Price Index(1914=100)
Weighted Index Price Index(1914=100)
Weighted Index Price Index(1914=100)
Weighted Index Price Index(1914=100)
Weighted Index
Food & Groceries 0.7015 100.00 95.92 67.29 93.60 65.66 89.73 62.95 95.21 66.79 96.46 67.67 Tobacco 0.0368 100.00 77.67 2.86 65.66 2.42 69.21 2.55 65.67 2.42 61.56 2.27 Clothing 0.1139 100.00 116.83 13.31 109.35 12.45 102.77 11.70 108.12 12.31 108.09 12.31 Rent 0.0442 100.00 81.28 3.59 82.88 3.67 84.52 3.74 86.19 3.81 87.89 3.89 Servant 0.0506 100.00 78.57 3.98 78.57 3.98 82.14 4.16 91.07 4.61 91.07 4.61 Transport 0.0373 100.00 107.23 4.00 107.12 4.00 107.23 4.00 105.07 3.92 104.64 3.90 Club 0.0156 100.00 95.26 1.48 93.25 1.45 87.34 1.36 85.90 1.34 86.75 1.35 CPI 1.0000 100.00 96.52 93.63 90.46 95.21 96.01
1905 1906 1907 1908Major Object of Consumption 1904
1907 19081904 1905 1906
1906 1907 19081904 1905
1907 19081904 1905 1906
1906 1907 19081904 1905
1907 19081904 1905 1906
1906 1907 19081904 1905
1907 19081904 1905 1906
71

APPENDIX 7 Computation of Consumer Price Indices by Major Object of Consumption
(1914=100)-Malaya, 1900-14 (Cont’d)
1914Food & Groceries Weights
Price Index(1914=100)
Price Index(1914=100)
Weighted Index Price Index(1914=100)
Weighted Index Price Index(1914=100)
Weighted Index Price Index(1914=100)
Weighted Index Price Index(1914=100)
Weighted Index
Malay Labour Standard 0.4945 100.00 92.15 45.57 91.12 45.06 98.31 48.62 107.78 53.30 108.17 53.50 Chinese Labour Standard 0.2553 100.00 92.15 23.53 91.12 23.26 98.31 25.10 107.78 27.51 108.17 27.61 Indian Labour Standard 0.1221 100.00 92.15 11.25 91.12 11.12 98.31 12.00 107.78 13.16 108.17 13.21 Asiatic Clerical Standard 0.0587 100.00 92.15 5.41 91.12 5.35 98.31 5.78 107.78 6.33 108.17 6.35 Eurasian Clerical Standard 0.0017 100.00 92.15 0.16 91.12 0.16 98.31 0.17 107.78 0.19 108.17 0.19 European Standard 0.0676 100.00 92.15 6.23 91.12 6.16 98.31 6.65 107.78 7.29 108.17 7.32
1.0000 100.00 92.15 91.12 98.31 107.78 108.17
1914Tobacco Weights
Price Index(1914=100)
Price Index(1914=100)
Weighted Index Price Index(1914=100)
Weighted Index Price Index(1914=100)
Weighted Index Price Index(1914=100)
Weighted Index Price Index(1914=100)
Weighted Index
Malay Labour Standard 0.3888 100.00 53.33 20.74 63.12 24.54 76.22 29.64 80.65 31.36 98.50 38.30 Chinese Labour Standard 0.1838 100.00 53.33 9.80 63.12 11.60 76.22 14.01 80.65 14.82 98.50 18.10 Indian Labour Standard 0.0670 100.00 53.33 3.57 63.12 4.23 76.22 5.10 80.65 5.40 98.50 6.59 Asiatic Clerical Standard 0.0532 100.00 53.33 2.84 63.12 3.36 76.22 4.06 80.65 4.29 98.50 5.24 Eurasian Clerical Standard 0.0014 100.00 53.33 0.07 63.12 0.09 76.22 0.10 80.65 0.11 98.50 0.13 European Standard 0.3058 100.00 77.20 23.61 86.52 26.46 93.36 28.55 92.56 28.31 101.06 30.91
1.0000 100.00 60.63 70.28 81.46 84.29 99.28
1914Clothing Weights
Price Index(1914=100)
Price Index(1914=100)
Weighted Index Price Index(1914=100)
Weighted Index Price Index(1914=100)
Weighted Index Price Index(1914=100)
Weighted Index Price Index(1914=100)
Weighted Index
Malay Labour Standard 0.4635 100.00 96.68 44.81 99.22 45.99 101.13 46.87 102.70 47.60 99.53 46.13 Chinese Labour Standard 0.2280 100.00 96.68 22.04 99.22 22.62 101.13 23.06 102.70 23.42 99.53 22.69 Indian Labour Standard 0.0299 100.00 96.68 2.89 99.22 2.97 101.13 3.03 102.70 3.07 99.53 2.98 Asiatic Clerical Standard 0.0762 100.00 96.68 7.37 99.22 7.56 101.13 7.71 102.70 7.83 99.53 7.59 Eurasian Clerical Standard 0.0020 100.00 96.68 0.19 99.22 0.19 101.13 0.20 102.70 0.20 99.53 0.19 European Standard 0.2004 100.00 96.68 19.38 99.22 19.89 101.13 20.27 102.70 20.58 99.53 19.95
1.0000 100.00 96.68 99.22 101.13 102.70 99.53
1914Rent Weights
Price Index(1914=100)
Price Index(1914=100)
Weighted Index Price Index(1914=100)
Weighted Index Price Index(1914=100)
Weighted Index Price Index(1914=100)
Weighted Index Price Index(1914=100)
Weighted Index
Malay Labour Standard 0.2454 100.00 85.66 21.02 84.93 20.84 85.66 21.02 86.39 21.20 96.23 23.62 Chinese Labour Standard 0.1608 100.00 85.66 13.78 84.93 13.66 85.66 13.78 86.39 13.90 96.23 15.48 Indian Labour Standard 0.0551 100.00 85.66 4.72 84.93 4.68 85.66 4.72 86.39 4.76 96.23 5.30 Asiatic Clerical Standard 0.2186 100.00 85.66 18.72 84.93 18.57 85.66 18.72 86.39 18.88 96.23 21.04 Eurasian Clerical Standard 0.0056 100.00 85.66 0.48 84.93 0.48 85.66 0.48 86.39 0.48 96.23 0.54 European Standard 0.3144 100.00 86.91 27.33 86.91 27.33 84.05 26.43 84.73 26.64 86.75 27.28
1.0000 100.00 86.05 85.55 85.16 85.87 93.25
1914Servants Weights
Price Index(1914=100)
Price Index(1914=100)
Weighted Index Price Index(1914=100)
Weighted Index Price Index(1914=100)
Weighted Index Price Index(1914=100)
Weighted Index Price Index(1914=100)
Weighted Index
Asiatic Clerical Standard 0.1206 100.00 91.07 10.98 91.07 10.98 91.07 10.98 91.07 10.98 91.07 10.98 Eurasian Clerical Standard 0.0031 100.00 91.07 0.28 91.07 0.28 91.07 0.28 91.07 0.28 91.07 0.28 European Standard 0.8763 100.00 91.07 79.80 91.07 79.80 91.07 79.80 91.07 79.80 91.07 79.80
1.0000 100.00 91.07 91.07 91.07 91.07 91.07
1914Transport Weights
Price Index(1914=100)
Price Index(1914=100)
Weighted Index Price Index(1914=100)
Weighted Index Price Index(1914=100)
Weighted Index Price Index(1914=100)
Weighted Index Price Index(1914=100)
Weighted Index
Asiatic Clerical Standard 0.3231 100.00 103.67 33.49 103.24 33.35 102.91 33.25 103.02 33.28 99.46 32.13 Eurasian Clerical Standard 0.0083 100.00 103.67 0.86 103.24 0.86 102.91 0.85 103.02 0.85 99.46 0.82 European Standard 0.6687 100.00 103.67 69.32 103.24 69.03 102.91 68.81 103.02 68.89 99.46 66.51
1.0000 100.00 103.67 103.24 102.91 103.02 99.46
1914Club Weights
Price Index(1914=100)
Price Index(1914=100)
Weighted Index Price Index(1914=100)
Weighted Index Price Index(1914=100)
Weighted Index Price Index(1914=100)
Weighted Index Price Index(1914=100)
Weighted Index
European Standard 1.0000 100.00 84.68 84.68 88.82 88.82 95.84 95.84 100.17 100.17 104.62 104.62 1.0000 100.00 84.68 88.82 95.84 100.17 104.62
Weights 1914Price Index(1914=100)
Price Index(1914=100)
Weighted Index Price Index(1914=100)
Weighted Index Price Index(1914=100)
Weighted Index Price Index(1914=100)
Weighted Index Price Index(1914=100)
Weighted Index
Food & Groceries 0.7015 100.00 92.15 64.65 91.12 63.92 98.31 68.97 107.78 75.61 108.17 75.89 Tobacco 0.0368 100.00 60.63 2.23 70.28 2.59 81.46 3.00 84.29 3.10 99.28 3.66 Clothing 0.1139 100.00 96.68 11.01 99.22 11.30 101.13 11.52 102.70 11.70 99.53 11.34 Rent 0.0442 100.00 86.05 3.81 85.55 3.78 85.16 3.77 85.87 3.80 93.25 4.12 Servant 0.0506 100.00 91.07 4.61 91.07 4.61 91.07 4.61 91.07 4.61 91.07 4.61 Transport 0.0373 100.00 103.67 3.87 103.24 3.85 102.91 3.84 103.02 3.84 99.46 3.71 Club 0.0156 100.00 84.68 1.32 88.82 1.38 95.84 1.49 100.17 1.56 104.62 1.63 CPI 1.0000 100.00 91.50 91.44 97.20 104.22 104.96
19131909 1910 1911 1912
1911 1912 1913
Major Object of Consumption
1909 1910
1910 1911 1912 19131909
1911 1912 19131909 1910
1910 1911 1912 19131909
1911 1912 19131909 1910
1910 1911 1912 19131909
1911 1912 19131909 1910
72
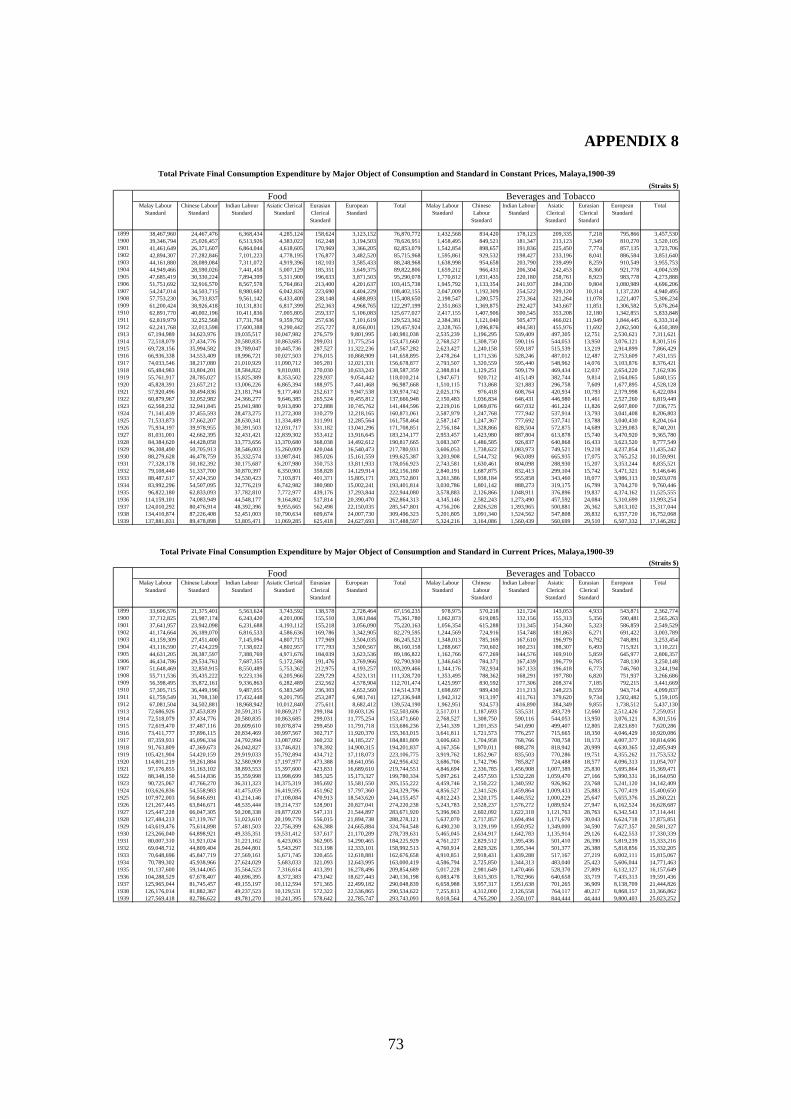
APPENDIX 8
(Straits $)
Malay LabourStandard
Chinese LabourStandard
Indian LabourStandard
Asiatic ClericalStandard
EurasianClericalStandard
EuropeanStandard
Total Malay LabourStandard
ChineseLabour
Standard
Indian LabourStandard
AsiaticClericalStandard
EurasianClericalStandard
EuropeanStandard
Total
1899 38,467,960 24,467,476 6,368,434 4,285,124 158,624 3,123,152 76,870,772 1,432,568 834,420 178,123 209,335 7,218 795,866 3,457,5301900 39,346,794 25,026,457 6,513,926 4,383,022 162,248 3,194,503 78,626,951 1,458,495 849,521 181,347 213,123 7,349 810,270 3,520,1051901 41,461,649 26,371,607 6,864,044 4,618,605 170,969 3,366,205 82,853,079 1,542,854 898,657 191,836 225,450 7,774 857,135 3,723,7061902 42,894,307 27,282,846 7,101,223 4,778,195 176,877 3,482,520 85,715,968 1,595,861 929,532 198,427 233,196 8,041 886,584 3,851,6401903 44,161,880 28,089,084 7,311,072 4,919,396 182,103 3,585,433 88,248,968 1,638,998 954,658 203,790 239,499 8,259 910,549 3,955,7531904 44,949,466 28,590,026 7,441,458 5,007,129 185,351 3,649,375 89,822,806 1,659,212 966,431 206,304 242,453 8,360 921,778 4,004,5391905 47,685,419 30,330,224 7,894,399 5,311,900 196,633 3,871,503 95,290,078 1,770,812 1,031,435 220,180 258,761 8,923 983,778 4,273,8881906 51,751,692 32,916,570 8,567,578 5,764,861 213,400 4,201,637 103,415,738 1,945,792 1,133,354 241,937 284,330 9,804 1,080,989 4,696,2061907 54,247,014 34,503,715 8,980,682 6,042,826 223,690 4,404,229 108,402,155 2,047,009 1,192,309 254,522 299,120 10,314 1,137,220 4,940,4951908 57,753,230 36,733,837 9,561,142 6,433,400 238,148 4,688,893 115,408,650 2,198,547 1,280,575 273,364 321,264 11,078 1,221,407 5,306,2341909 61,200,424 38,926,418 10,131,831 6,817,399 252,363 4,968,765 122,297,199 2,351,863 1,369,875 292,427 343,667 11,851 1,306,582 5,676,2641910 62,891,770 40,002,196 10,411,836 7,005,805 259,337 5,106,083 125,677,027 2,417,155 1,407,906 300,545 353,208 12,180 1,342,855 5,833,8481911 62,819,979 32,252,568 17,731,768 9,359,792 257,636 7,101,619 129,523,362 2,384,381 1,121,040 505,477 466,021 11,949 1,844,445 6,333,3141912 62,241,768 32,013,598 17,600,388 9,290,442 255,727 8,056,001 129,457,924 2,328,765 1,096,876 494,581 455,976 11,692 2,062,500 6,450,3891913 67,194,989 34,623,976 19,035,517 10,047,982 276,579 9,801,995 140,981,038 2,535,239 1,196,295 539,409 497,305 12,751 2,530,621 7,311,621 1914 72,518,079 37,434,776 20,580,835 10,863,685 299,031 11,775,254 153,471,660 2,768,527 1,308,750 590,116 544,053 13,950 3,076,121 8,301,516 1915 69,728,156 35,994,582 19,789,047 10,445,736 287,527 11,322,236 147,567,282 2,623,427 1,240,158 559,187 515,539 13,219 2,914,899 7,866,429 1916 66,936,338 34,553,409 18,996,721 10,027,503 276,015 10,868,909 141,658,895 2,478,264 1,171,536 528,246 487,012 12,487 2,753,609 7,431,155 1917 74,033,546 38,217,080 21,010,929 11,090,712 305,281 12,021,331 156,678,877 2,793,507 1,320,559 595,440 548,962 14,076 3,103,876 8,376,421 1918 65,484,983 33,804,201 18,584,822 9,810,081 270,030 10,633,243 138,587,359 2,388,814 1,129,251 509,179 469,434 12,037 2,654,220 7,162,936 1919 55,761,917 28,785,027 15,825,389 8,353,502 229,937 9,054,442 118,010,214 1,947,671 920,712 415,149 382,744 9,814 2,164,065 5,840,155 1920 45,828,391 23,657,212 13,006,226 6,865,394 188,975 7,441,468 96,987,668 1,510,115 713,868 321,883 296,758 7,609 1,677,895 4,528,128 1921 57,920,496 30,494,836 23,181,794 9,177,460 252,617 9,947,538 130,974,742 2,025,176 976,418 608,764 420,934 10,793 2,379,998 6,422,084 1922 60,879,967 32,052,982 24,366,277 9,646,385 265,524 10,455,812 137,666,948 2,150,483 1,036,834 646,431 446,980 11,461 2,527,260 6,819,449 1923 62,568,232 32,941,845 25,041,980 9,913,890 272,888 10,745,762 141,484,596 2,219,016 1,069,876 667,032 461,224 11,826 2,607,800 7,036,775 1924 71,141,439 37,455,593 28,473,275 11,272,308 310,279 12,218,165 160,871,061 2,587,979 1,247,768 777,942 537,914 13,793 3,041,408 8,206,803 1925 71,533,873 37,662,207 28,630,341 11,334,489 311,991 12,285,564 161,758,464 2,587,147 1,247,367 777,692 537,741 13,788 3,040,430 8,204,164 1926 75,934,197 39,978,955 30,391,503 12,031,717 331,182 13,041,296 171,708,851 2,756,184 1,328,866 828,504 572,875 14,689 3,239,083 8,740,201 1927 81,031,001 42,662,395 32,431,421 12,839,302 353,412 13,916,645 183,234,177 2,953,457 1,423,980 887,804 613,878 15,740 3,470,920 9,365,780 1928 84,384,620 44,428,058 33,773,656 13,370,680 368,038 14,492,612 190,817,665 3,083,307 1,486,585 926,837 640,868 16,433 3,623,520 9,777,549 1929 96,308,490 50,705,913 38,546,003 15,260,009 420,044 16,540,473 217,780,931 3,606,053 1,738,622 1,083,973 749,521 19,218 4,237,854 11,435,242 1930 88,279,628 46,478,759 35,332,574 13,987,841 385,026 15,161,559 199,625,387 3,203,908 1,544,732 963,089 665,935 17,075 3,765,252 10,159,991 1931 77,328,178 50,182,392 30,175,687 6,207,980 350,753 13,811,933 178,056,923 2,743,581 1,630,461 804,098 288,930 15,207 3,353,244 8,835,521 1932 79,108,440 51,337,700 30,870,397 6,350,901 358,828 14,129,914 182,156,180 2,840,191 1,687,875 832,413 299,104 15,742 3,471,321 9,146,646 1933 88,487,617 57,424,350 34,530,423 7,103,871 401,371 15,805,171 203,752,801 3,261,386 1,938,184 955,858 343,460 18,077 3,986,113 10,503,078 1934 83,992,296 54,507,095 32,776,219 6,742,982 380,980 15,002,241 193,401,814 3,030,786 1,801,142 888,273 319,175 16,799 3,704,270 9,760,446 1935 96,822,180 62,833,093 37,782,810 7,772,977 439,176 17,293,844 222,944,080 3,578,883 2,126,866 1,048,911 376,896 19,837 4,374,162 11,525,555 1936 114,159,101 74,083,949 44,548,177 9,164,802 517,814 20,390,470 262,864,313 4,345,146 2,582,243 1,273,490 457,592 24,084 5,310,699 13,993,254 1937 124,010,292 80,476,914 48,392,396 9,955,665 562,498 22,150,035 285,547,801 4,756,206 2,826,528 1,393,965 500,881 26,362 5,813,102 15,317,044 1938 134,410,874 87,226,408 52,451,003 10,790,634 609,674 24,007,730 309,496,323 5,201,805 3,091,340 1,524,562 547,808 28,832 6,357,720 16,752,068 1939 137,881,831 89,478,898 53,805,471 11,069,285 625,418 24,627,693 317,488,597 5,324,216 3,164,086 1,560,439 560,699 29,510 6,507,332 17,146,282
(Straits $)
Malay LabourStandard
Chinese LabourStandard
Indian LabourStandard
Asiatic ClericalStandard
EurasianClericalStandard
EuropeanStandard
Total Malay LabourStandard
ChineseLabour
Standard
Indian LabourStandard
AsiaticClericalStandard
EurasianClericalStandard
EuropeanStandard
Total
1899 33,606,576 21,375,401 5,563,624 3,743,592 138,578 2,728,464 67,156,235 978,975 570,218 121,724 143,053 4,933 543,871 2,362,7741900 37,712,825 23,987,174 6,243,420 4,201,006 155,510 3,061,844 75,361,780 1,062,873 619,085 132,156 155,313 5,356 590,481 2,565,2631901 37,641,957 23,942,098 6,231,688 4,193,112 155,218 3,056,090 75,220,163 1,056,354 615,288 131,345 154,360 5,323 586,859 2,549,5291902 41,174,664 26,189,070 6,816,533 4,586,636 169,786 3,342,905 82,279,595 1,244,569 724,916 154,748 181,863 6,271 691,422 3,003,7891903 43,159,309 27,451,400 7,145,094 4,807,715 177,969 3,504,035 86,245,523 1,348,013 785,169 167,610 196,979 6,792 748,891 3,253,4541904 43,116,590 27,424,229 7,138,022 4,802,957 177,793 3,500,567 86,160,158 1,288,667 750,602 160,231 188,307 6,493 715,921 3,110,2211905 44,631,205 28,387,597 7,388,769 4,971,676 184,039 3,623,536 89,186,822 1,162,766 677,269 144,576 169,910 5,859 645,977 2,806,3571906 46,434,786 29,534,761 7,687,355 5,172,586 191,476 3,769,966 92,790,930 1,346,643 784,371 167,439 196,779 6,785 748,130 3,250,1481907 51,648,469 32,850,915 8,550,489 5,753,362 212,975 4,193,257 103,209,466 1,344,176 782,934 167,133 196,418 6,773 746,760 3,244,1941908 55,711,536 35,435,222 9,223,136 6,205,966 229,729 4,523,131 111,328,720 1,353,495 788,362 168,291 197,780 6,820 751,937 3,266,6861909 56,398,495 35,872,161 9,336,863 6,282,489 232,562 4,578,904 112,701,474 1,425,997 830,592 177,306 208,374 7,185 792,215 3,441,6691910 57,305,715 36,449,196 9,487,055 6,383,549 236,303 4,652,560 114,514,378 1,698,697 989,430 211,213 248,223 8,559 943,714 4,099,8371911 61,759,549 31,708,130 17,432,448 9,201,795 253,287 6,981,741 127,336,948 1,942,312 913,197 411,761 379,620 9,734 1,502,482 5,159,1051912 67,081,504 34,502,881 18,968,942 10,012,840 275,611 8,682,412 139,524,190 1,962,951 924,573 416,890 384,349 9,855 1,738,512 5,437,1301913 72,686,926 37,453,839 20,591,315 10,869,217 299,184 10,603,126 152,503,606 2,517,011 1,187,693 535,531 493,729 12,660 2,512,426 7,259,051 1914 72,518,079 37,434,776 20,580,835 10,863,685 299,031 11,775,254 153,471,660 2,768,527 1,308,750 590,116 544,053 13,950 3,076,121 8,301,516 1915 72,619,470 37,487,116 20,609,610 10,878,874 299,450 11,791,718 153,686,236 2,541,339 1,201,353 541,690 499,407 12,805 2,823,691 7,620,286 1916 73,411,777 37,896,115 20,834,469 10,997,567 302,717 11,920,370 155,363,015 3,641,811 1,721,573 776,257 715,665 18,350 4,046,429 10,920,086 1917 87,359,931 45,096,334 24,792,994 13,087,092 360,232 14,185,227 184,881,809 3,606,663 1,704,958 768,766 708,758 18,173 4,007,377 10,814,696 1918 91,763,809 47,369,673 26,042,827 13,746,821 378,392 14,900,315 194,201,837 4,167,356 1,970,011 888,278 818,942 20,999 4,630,365 12,495,949 1919 105,421,904 54,420,159 29,919,033 15,792,894 434,712 17,118,073 223,106,775 3,919,762 1,852,967 835,503 770,286 19,751 4,355,262 11,753,532 1920 114,801,219 59,261,884 32,580,909 17,197,977 473,388 18,641,056 242,956,432 3,686,706 1,742,796 785,827 724,488 18,577 4,096,313 11,054,707 1921 97,176,855 51,163,102 38,893,553 15,397,600 423,831 16,689,610 219,744,551 4,846,694 2,336,785 1,456,908 1,007,389 25,830 5,695,864 15,369,471 1922 88,348,150 46,514,836 35,359,998 13,998,699 385,325 15,173,327 199,780,334 5,097,261 2,457,593 1,532,228 1,059,470 27,166 5,990,331 16,164,050 1923 90,725,067 47,766,270 36,311,323 14,375,319 395,692 15,581,550 205,155,222 4,459,746 2,150,222 1,340,592 926,962 23,768 5,241,120 14,142,409 1924 103,626,836 54,558,983 41,475,059 16,419,595 451,962 17,797,360 234,329,796 4,856,527 2,341,526 1,459,864 1,009,433 25,883 5,707,419 15,400,650 1925 107,972,003 56,846,691 43,214,146 17,108,084 470,913 18,543,620 244,155,457 4,812,243 2,320,175 1,446,552 1,000,229 25,647 5,655,376 15,260,221 1926 121,267,445 63,846,671 48,535,444 19,214,737 528,901 20,827,041 274,220,238 5,243,783 2,528,237 1,576,272 1,089,924 27,947 6,162,524 16,628,687 1927 125,447,228 66,047,305 50,208,338 19,877,020 547,131 21,544,897 283,671,920 5,396,963 2,602,092 1,622,318 1,121,763 28,763 6,342,543 17,114,441 1928 127,484,213 67,119,767 51,023,610 20,199,779 556,015 21,894,738 288,278,121 5,637,070 2,717,857 1,694,494 1,171,670 30,043 6,624,718 17,875,851 1929 143,619,476 75,614,898 57,481,503 22,756,399 626,388 24,665,884 324,764,548 6,490,230 3,129,199 1,950,952 1,349,000 34,590 7,627,357 20,581,327 1930 123,266,040 64,898,921 49,335,351 19,531,412 537,617 21,170,289 278,739,631 5,465,045 2,634,917 1,642,783 1,135,914 29,126 6,422,553 17,330,339 1931 80,007,310 51,921,024 31,221,162 6,423,063 362,905 14,290,465 184,225,929 4,761,227 2,829,512 1,395,436 501,410 26,390 5,819,239 15,333,216 1932 69,048,712 44,809,404 26,944,801 5,543,297 313,198 12,333,101 158,992,513 4,760,914 2,829,326 1,395,344 501,377 26,388 5,818,856 15,332,205 1933 70,648,696 45,847,719 27,569,161 5,671,745 320,455 12,618,881 162,676,658 4,910,851 2,918,431 1,439,288 517,167 27,219 6,002,111 15,815,067 1934 70,789,302 45,938,966 27,624,029 5,683,033 321,093 12,643,995 163,000,419 4,586,794 2,725,850 1,344,313 483,040 25,423 5,606,044 14,771,463 1935 91,137,600 59,144,065 35,564,523 7,316,614 413,391 16,278,496 209,854,689 5,017,228 2,981,649 1,470,466 528,370 27,809 6,132,127 16,157,649 1936 104,288,529 67,678,407 40,696,395 8,372,383 473,042 18,627,443 240,136,198 6,083,478 3,615,303 1,782,966 640,658 33,719 7,435,313 19,591,436 1937 125,965,044 81,745,457 49,155,197 10,112,594 571,365 22,499,182 290,048,839 6,658,988 3,957,317 1,951,638 701,265 36,909 8,138,709 21,444,826 1938 126,176,014 81,882,367 49,237,523 10,129,531 572,322 22,536,865 290,534,622 7,255,813 4,312,000 2,126,558 764,117 40,217 8,868,157 23,366,862 1939 127,569,418 82,786,622 49,781,270 10,241,395 578,642 22,785,747 293,743,093 8,018,564 4,765,290 2,350,107 844,444 44,444 9,800,403 25,823,252
Total Private Final Consumption Expenditure by Major Object of Consumption and Standard in Constant Prices, Malaya,1900-39
Total Private Final Consumption Expenditure by Major Object of Consumption and Standard in Current Prices, Malaya,1900-39
Food Beverages and Tobacco
Food Beverages and Tobacco
73

APPENDIX 8 (Cont’d)
(Straits $)
Malay LabourStandard
Chinese LabourStandard
Indian LabourStandard
AsiaticClericalStandard
EurasianClericalStandard
EuropeanStandard
Total Malay LabourStandard
ChineseLabour
Standard
Indian LabourStandard
Asiatic ClericalStandard
EurasianClericalStandard
EuropeanStandard
Total
1899 5,510,948 3,340,079 251,315 922,335 31,805 1,631,007 11,687,488 1,274,626 1,029,313 193,755 1,070,965 36,930 820,663 4,426,2521900 5,610,685 3,400,528 255,863 939,027 32,380 1,660,525 11,899,009 1,303,746 1,052,829 198,181 1,095,432 37,774 839,412 4,527,3741901 5,935,205 3,597,213 270,662 993,340 34,253 1,756,570 12,587,243 1,373,821 1,109,418 208,833 1,154,311 39,804 884,529 4,770,7161902 6,139,118 3,720,801 279,961 1,027,468 35,430 1,816,919 13,019,697 1,421,291 1,147,752 216,049 1,194,197 41,179 915,093 4,935,5621903 6,305,063 3,821,376 287,529 1,055,241 36,388 1,866,032 13,371,629 1,463,292 1,181,669 222,434 1,229,487 42,396 942,135 5,081,4131904 6,382,824 3,868,506 291,075 1,068,255 36,836 1,889,046 13,536,542 1,489,389 1,202,743 226,401 1,251,413 43,152 958,937 5,172,0361905 6,812,139 4,128,705 310,653 1,140,107 39,314 2,016,105 14,447,022 1,580,044 1,275,951 240,181 1,327,583 45,779 1,017,305 5,486,8431906 7,485,270 4,536,677 341,349 1,252,765 43,199 2,215,323 15,874,583 1,714,779 1,384,755 260,662 1,440,790 49,682 1,104,054 5,954,7221907 7,874,641 4,772,667 359,106 1,317,932 45,446 2,330,561 16,700,352 1,797,460 1,451,524 273,231 1,510,261 52,078 1,157,288 6,241,8421908 8,457,591 5,125,982 385,690 1,415,497 48,810 2,503,089 17,936,660 1,913,638 1,545,342 290,891 1,607,876 55,444 1,232,089 6,645,2791909 9,047,382 5,483,443 412,586 1,514,207 52,214 2,677,642 19,187,473 2,027,860 1,637,581 308,253 1,703,847 58,753 1,305,630 7,041,9251910 9,298,554 5,635,674 424,040 1,556,244 53,664 2,751,979 19,720,155 2,083,902 1,682,838 316,772 1,750,935 60,377 1,341,713 7,236,5371911 9,172,475 4,487,386 713,180 2,053,303 52,649 3,779,913 20,258,905 2,081,523 1,356,822 539,476 2,339,258 59,981 1,866,075 8,243,1351912 8,958,528 4,390,658 697,807 2,009,042 51,514 4,226,782 20,334,330 2,062,364 1,346,768 535,479 2,321,926 59,537 2,116,856 8,442,9291913 9,752,813 4,788,619 761,055 2,191,139 56,183 5,186,127 22,735,936 2,226,488 1,456,583 579,141 2,511,255 64,391 2,575,646 9,413,505 1914 10,650,247 5,238,766 832,597 2,397,113 61,464 6,304,045 25,484,232 2,402,867 1,574,830 626,156 2,715,121 69,618 3,094,155 10,482,747 1915 10,092,062 4,964,199 788,960 2,271,479 58,243 5,973,647 24,148,590 2,310,424 1,514,243 602,067 2,610,664 66,940 2,975,116 10,079,454 1916 9,533,636 4,689,515 745,304 2,145,791 55,020 5,643,106 22,812,371 2,217,918 1,453,615 577,961 2,506,137 64,260 2,855,996 9,675,887 1917 10,746,344 5,286,035 840,109 2,418,742 62,019 6,360,926 25,714,175 2,453,082 1,607,740 639,242 2,771,861 71,073 3,158,815 10,701,813 1918 9,189,530 4,520,252 718,403 2,068,341 53,034 5,439,424 21,988,985 2,169,827 1,422,097 565,429 2,451,797 62,867 2,794,071 9,466,088 1919 7,492,497 3,685,496 585,736 1,686,380 43,241 4,434,924 17,928,274 1,847,656 1,210,947 481,476 2,087,760 53,532 2,379,213 8,060,584 1920 5,809,262 2,857,527 454,146 1,307,524 33,526 3,438,592 13,900,578 1,518,512 995,227 395,705 1,715,843 43,996 1,955,376 6,624,658 1921 7,790,649 3,908,481 858,908 1,854,649 47,555 4,877,448 19,337,691 1,919,180 1,282,876 705,289 2,293,689 58,813 2,613,890 8,873,736 1922 8,272,694 4,150,318 912,053 1,969,405 50,498 5,179,239 20,534,206 2,017,241 1,348,425 741,326 2,410,885 61,818 2,747,448 9,327,143 1923 8,536,333 4,282,582 941,119 2,032,168 52,107 5,344,293 21,188,601 2,073,182 1,385,818 761,883 2,477,742 63,532 2,823,637 9,585,795 1924 9,955,697 4,994,662 1,097,602 2,370,063 60,771 6,232,907 24,711,701 2,357,253 1,575,706 866,278 2,817,246 72,237 3,210,537 10,899,257 1925 9,952,495 4,993,055 1,097,249 2,369,301 60,751 6,230,902 24,703,754 2,370,256 1,584,398 871,057 2,832,787 72,636 3,228,247 10,959,380 1926 10,602,764 5,319,288 1,168,940 2,524,104 64,721 6,638,012 26,317,828 2,516,059 1,681,860 924,639 3,007,043 77,104 3,426,829 11,633,534 1927 11,361,655 5,700,015 1,252,606 2,704,767 69,353 7,113,127 28,201,523 2,684,941 1,794,749 986,702 3,208,879 82,279 3,656,843 12,414,392 1928 11,861,173 5,950,618 1,307,678 2,823,682 72,402 7,425,857 29,441,410 2,796,062 1,869,028 1,027,538 3,341,685 85,684 3,808,188 12,928,185 1929 13,872,125 6,959,490 1,529,382 3,302,412 84,677 8,684,843 34,432,929 3,191,156 2,133,129 1,172,733 3,813,878 97,792 4,346,299 14,754,987 1930 12,325,115 6,183,372 1,358,827 2,934,129 75,234 7,716,315 30,592,992 2,925,122 1,955,298 1,074,967 3,495,930 89,639 3,983,965 13,524,921 1931 10,554,284 6,526,536 1,134,505 1,273,032 67,002 6,871,967 26,427,326 2,562,249 2,111,105 918,073 1,551,538 81,660 3,629,328 10,853,951 1932 10,925,931 6,756,355 1,174,454 1,317,859 69,361 7,113,950 27,357,910 2,621,237 2,159,707 939,209 1,587,257 83,540 3,712,883 11,103,833 1933 12,546,229 7,758,311 1,348,624 1,513,295 79,647 8,168,936 31,415,042 2,932,014 2,415,764 1,050,562 1,775,444 93,444 4,153,086 12,420,314 1934 11,659,133 7,209,750 1,253,268 1,406,296 74,016 7,591,342 29,193,806 2,783,062 2,293,039 997,192 1,685,249 88,697 3,942,102 11,789,341 1935 13,767,607 8,513,584 1,479,913 1,660,615 87,401 8,964,184 34,473,304 3,208,177 2,643,303 1,149,514 1,942,671 102,246 4,544,261 13,590,172 1936 16,715,345 10,336,400 1,796,772 2,016,164 106,114 10,883,476 41,854,271 3,782,631 3,116,611 1,355,345 2,290,525 120,554 5,357,953 16,023,619 1937 18,296,650 11,314,244 1,966,750 2,206,897 116,152 11,913,075 45,813,769 4,109,048 3,385,554 1,472,302 2,488,183 130,957 5,820,310 17,406,354 1938 20,010,827 12,374,253 2,151,011 2,413,657 127,035 13,029,188 50,105,971 4,453,669 3,669,496 1,595,782 2,696,863 141,940 6,308,452 18,866,202 1939 20,481,727 12,665,447 2,201,629 2,470,456 130,024 13,335,794 51,285,078 4,568,678 3,764,255 1,636,991 2,766,506 145,606 6,471,358 19,353,393
(Straits $)
Malay LabourStandard
Chinese LabourStandard
Indian LabourStandard
AsiaticClericalStandard
EurasianClericalStandard
EuropeanStandard
Total Malay LabourStandard
ChineseLabour
Standard
Indian LabourStandard
Asiatic ClericalStandard
EurasianClericalStandard
EuropeanStandard
Total
1899 4,586,301 2,779,668 209,148 767,582 26,468 1,357,351 9,726,520 939,702 758,848 142,843 789,556 27,226 605,024 3,263,1991900 4,507,450 2,731,878 205,552 754,385 26,013 1,334,015 9,559,294 980,095 791,467 148,983 823,495 28,396 631,030 3,403,4671901 5,821,647 3,528,387 265,484 974,335 33,598 1,722,961 12,346,411 1,053,117 850,436 160,083 884,849 30,512 678,046 3,657,0431902 6,585,732 3,991,485 300,328 1,102,215 38,007 1,949,098 13,966,865 1,110,976 897,160 168,879 933,464 32,188 715,298 3,857,9651903 6,557,005 3,974,074 299,018 1,097,407 37,842 1,940,596 13,905,941 1,166,357 941,882 177,297 979,996 33,793 750,955 4,050,2791904 7,457,255 4,519,698 340,072 1,248,077 43,037 2,207,032 15,815,170 1,210,572 977,588 184,018 1,017,147 35,074 779,423 4,203,8221905 7,449,328 4,514,893 339,710 1,246,750 42,991 2,204,686 15,798,358 1,309,598 1,057,555 199,071 1,100,349 37,943 843,180 4,547,6961906 7,692,612 4,662,343 350,805 1,287,467 44,395 2,276,688 16,314,310 1,449,328 1,170,392 220,311 1,217,753 41,991 933,144 5,032,9201907 8,514,088 5,160,224 388,266 1,424,952 49,136 2,519,810 18,056,477 1,549,213 1,251,054 235,495 1,301,679 44,885 997,455 5,379,7811908 9,142,170 5,540,892 416,909 1,530,071 52,761 2,705,696 19,388,499 1,681,932 1,358,231 255,669 1,413,192 48,731 1,082,906 5,840,6611909 8,747,198 5,301,507 398,897 1,463,967 50,482 2,588,801 18,550,852 1,745,064 1,409,212 265,266 1,466,237 50,560 1,123,553 6,059,8931910 9,226,063 5,591,738 420,735 1,544,111 53,245 2,730,524 19,566,416 1,782,876 1,439,747 271,014 1,498,007 51,655 1,147,898 6,191,1971911 9,275,702 4,537,887 721,206 2,076,410 53,241 3,822,452 20,486,898 1,772,527 1,155,405 459,392 1,992,002 51,077 1,589,061 7,019,4641912 9,200,723 4,509,360 716,672 2,063,357 52,907 4,341,054 20,884,073 1,770,898 1,156,435 459,801 1,993,777 51,122 1,817,689 7,249,7231913 9,706,906 4,766,079 757,472 2,180,825 55,919 5,161,715 22,628,916 2,076,237 1,358,288 540,059 2,341,786 60,046 2,401,832 8,778,248 1914 10,650,247 5,238,766 832,597 2,397,113 61,464 6,304,045 25,484,232 2,402,867 1,574,830 626,156 2,715,121 69,618 3,094,155 10,482,747 1915 13,959,225 6,866,424 1,091,280 3,141,884 80,561 8,262,680 33,402,055 2,347,201 1,538,347 611,651 2,652,221 68,006 3,022,474 10,239,899 1916 15,375,842 7,563,246 1,202,026 3,460,730 88,737 9,101,197 36,791,778 2,308,668 1,513,092 601,609 2,608,681 66,889 2,972,855 10,071,796 1917 15,476,451 7,612,735 1,209,891 3,483,375 89,317 9,160,749 37,032,519 2,566,456 1,682,045 668,786 2,899,967 74,358 3,304,806 11,196,418 1918 17,441,729 8,579,438 1,363,529 3,925,711 100,659 10,324,027 41,735,094 2,535,565 1,661,799 660,736 2,865,062 73,463 3,265,028 11,061,653 1919 17,202,774 8,461,899 1,344,849 3,871,929 99,280 10,182,587 41,163,317 2,349,665 1,539,961 612,293 2,655,005 68,077 3,025,646 10,250,647 1920 16,939,809 8,332,548 1,324,291 3,812,741 97,763 10,026,933 40,534,085 2,368,489 1,552,299 617,198 2,676,275 68,622 3,049,886 10,332,769 1921 18,479,420 9,270,918 2,037,330 4,399,229 112,801 11,569,306 45,869,003 3,106,405 2,076,477 1,141,588 3,712,588 95,195 4,230,869 14,363,121 1922 15,122,484 7,586,781 1,667,233 3,600,073 92,310 9,467,648 37,536,529 3,714,637 2,483,050 1,365,110 4,439,511 113,834 5,059,272 17,175,413 1923 13,965,440 7,006,305 1,539,670 3,324,626 85,247 8,743,264 34,664,552 4,414,058 2,950,577 1,622,143 5,275,416 135,267 6,011,871 20,409,333 1924 15,640,400 7,846,614 1,724,332 3,723,369 95,471 9,791,897 38,822,083 5,258,613 3,515,120 1,932,513 6,284,778 161,148 7,162,140 24,314,313 1925 15,734,895 7,894,021 1,734,750 3,745,864 96,048 9,851,057 39,056,635 5,519,880 3,689,764 2,028,527 6,597,029 169,155 7,517,981 25,522,337 1926 16,699,353 8,377,878 1,841,080 3,975,464 101,935 10,454,869 41,450,579 6,173,546 4,126,707 2,268,746 7,378,251 189,186 8,408,263 28,544,699 1927 17,656,012 8,857,823 1,946,550 4,203,207 107,775 11,053,799 43,825,166 7,169,333 4,792,341 2,634,693 8,568,355 219,701 9,764,508 33,148,932 1928 18,017,121 9,038,988 1,986,362 4,289,173 109,979 11,279,877 44,721,501 8,161,027 5,455,239 2,999,135 9,753,568 250,091 11,115,177 37,734,239 1929 19,559,697 9,812,881 2,156,429 4,656,400 119,395 12,245,629 48,550,430 9,378,939 6,269,353 3,446,711 11,209,143 287,414 12,773,952 43,365,512 1930 17,230,511 8,644,355 1,899,640 4,101,912 105,177 10,787,409 42,769,003 7,920,372 5,294,373 2,910,695 9,465,951 242,717 10,787,409 36,621,516 1931 14,197,918 8,779,679 1,526,168 1,712,518 90,133 9,244,363 35,550,778 5,970,003 4,918,845 2,139,096 3,615,061 190,266 8,456,282 25,289,554 1932 12,506,853 7,733,962 1,344,391 1,508,546 79,397 8,143,298 31,316,448 4,973,547 4,097,838 1,782,059 3,011,669 158,509 7,044,840 21,068,462 1933 13,844,423 8,561,085 1,488,170 1,669,880 87,888 9,014,199 34,665,646 4,879,408 4,020,274 1,748,328 2,954,664 155,509 6,911,495 20,669,678 1934 12,117,263 7,493,047 1,302,513 1,461,555 76,924 7,889,634 30,340,936 4,631,526 3,816,037 1,659,510 2,804,562 147,609 6,560,380 19,619,624 1935 14,272,656 8,825,895 1,534,202 1,721,533 90,607 9,293,025 35,737,918 5,338,995 4,398,940 1,913,001 3,232,961 170,156 7,562,483 22,616,535 1936 17,141,415 10,599,872 1,842,571 2,067,556 108,819 11,160,894 42,921,127 6,294,992 5,186,611 2,255,542 3,811,853 200,624 8,916,616 26,666,238 1937 19,860,246 12,281,137 2,134,825 2,395,494 126,079 12,931,143 49,728,924 6,938,711 5,716,989 2,486,192 4,201,650 221,139 9,828,420 29,393,101 1938 22,088,917 13,659,298 2,374,390 2,664,311 140,227 14,382,246 55,309,390 7,935,438 6,538,218 2,843,326 4,805,205 252,906 11,240,246 33,615,339 1939 24,575,678 15,197,056 2,641,698 2,964,258 156,014 16,001,394 61,536,097 8,842,931 7,285,926 3,168,488 5,354,726 281,828 12,525,676 37,459,575
Total Private Final Consumption Expenditure by Major Object of Consumption and Standard in Constant Prices, Malaya,1900-39
Total Private Final Consumption Expenditure by Major Object of Consumption and Standard in Current Prices, Malaya,1900-39
Clothing Rent
Clothing Rent
74
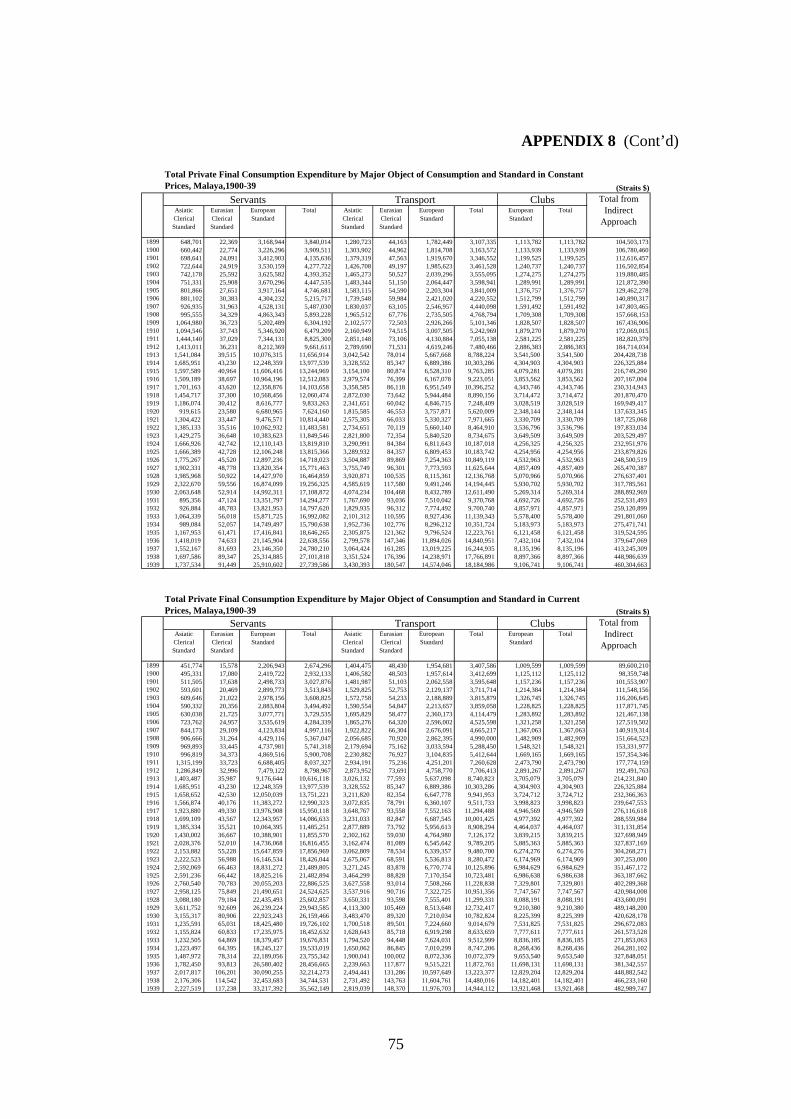
APPENDIX 8 (Cont’d)
(Straits $)
AsiaticClericalStandard
EurasianClericalStandard
EuropeanStandard
Total AsiaticClericalStandard
EurasianClericalStandard
EuropeanStandard
Total EuropeanStandard
Total
1899 648,701 22,369 3,168,944 3,840,014 1,280,723 44,163 1,782,449 3,107,335 1,113,782 1,113,782 104,503,1731900 660,442 22,774 3,226,296 3,909,511 1,303,902 44,962 1,814,708 3,163,572 1,133,939 1,133,939 106,780,4601901 698,641 24,091 3,412,903 4,135,636 1,379,319 47,563 1,919,670 3,346,552 1,199,525 1,199,525 112,616,4571902 722,644 24,919 3,530,159 4,277,722 1,426,708 49,197 1,985,623 3,461,528 1,240,737 1,240,737 116,502,8541903 742,178 25,592 3,625,582 4,393,352 1,465,273 50,527 2,039,296 3,555,095 1,274,275 1,274,275 119,880,4851904 751,331 25,908 3,670,296 4,447,535 1,483,344 51,150 2,064,447 3,598,941 1,289,991 1,289,991 121,872,3901905 801,866 27,651 3,917,164 4,746,681 1,583,115 54,590 2,203,304 3,841,009 1,376,757 1,376,757 129,462,2781906 881,102 30,383 4,304,232 5,215,717 1,739,548 59,984 2,421,020 4,220,552 1,512,799 1,512,799 140,890,3171907 926,935 31,963 4,528,131 5,487,030 1,830,037 63,105 2,546,957 4,440,098 1,591,492 1,591,492 147,803,4651908 995,555 34,329 4,863,343 5,893,228 1,965,512 67,776 2,735,505 4,768,794 1,709,308 1,709,308 157,668,1531909 1,064,980 36,723 5,202,489 6,304,192 2,102,577 72,503 2,926,266 5,101,346 1,828,507 1,828,507 167,436,9061910 1,094,546 37,743 5,346,920 6,479,209 2,160,949 74,515 3,007,505 5,242,969 1,879,270 1,879,270 172,069,0151911 1,444,140 37,029 7,344,131 8,825,300 2,851,148 73,106 4,130,884 7,055,138 2,581,225 2,581,225 182,820,3791912 1,413,011 36,231 8,212,369 9,661,611 2,789,690 71,531 4,619,246 7,480,466 2,886,383 2,886,383 184,714,0341913 1,541,084 39,515 10,076,315 11,656,914 3,042,542 78,014 5,667,668 8,788,224 3,541,500 3,541,500 204,428,738 1914 1,685,951 43,230 12,248,359 13,977,539 3,328,552 85,347 6,889,386 10,303,286 4,304,903 4,304,903 226,325,884 1915 1,597,589 40,964 11,606,416 13,244,969 3,154,100 80,874 6,528,310 9,763,285 4,079,281 4,079,281 216,749,290 1916 1,509,189 38,697 10,964,196 12,512,083 2,979,574 76,399 6,167,078 9,223,051 3,853,562 3,853,562 207,167,004 1917 1,701,163 43,620 12,358,876 14,103,658 3,358,585 86,118 6,951,549 10,396,252 4,343,746 4,343,746 230,314,943 1918 1,454,717 37,300 10,568,456 12,060,474 2,872,030 73,642 5,944,484 8,890,156 3,714,472 3,714,472 201,870,470 1919 1,186,074 30,412 8,616,777 9,833,263 2,341,651 60,042 4,846,715 7,248,409 3,028,519 3,028,519 169,949,417 1920 919,615 23,580 6,680,965 7,624,160 1,815,585 46,553 3,757,871 5,620,009 2,348,144 2,348,144 137,633,345 1921 1,304,422 33,447 9,476,571 10,814,440 2,575,305 66,033 5,330,327 7,971,665 3,330,709 3,330,709 187,725,068 1922 1,385,133 35,516 10,062,932 11,483,581 2,734,651 70,119 5,660,140 8,464,910 3,536,796 3,536,796 197,833,034 1923 1,429,275 36,648 10,383,623 11,849,546 2,821,800 72,354 5,840,520 8,734,675 3,649,509 3,649,509 203,529,497 1924 1,666,926 42,742 12,110,143 13,819,810 3,290,991 84,384 6,811,643 10,187,018 4,256,325 4,256,325 232,951,976 1925 1,666,389 42,728 12,106,248 13,815,366 3,289,932 84,357 6,809,453 10,183,742 4,254,956 4,254,956 233,879,826 1926 1,775,267 45,520 12,897,236 14,718,023 3,504,887 89,869 7,254,363 10,849,119 4,532,963 4,532,963 248,500,519 1927 1,902,331 48,778 13,820,354 15,771,463 3,755,749 96,301 7,773,593 11,625,644 4,857,409 4,857,409 265,470,387 1928 1,985,968 50,922 14,427,970 16,464,859 3,920,871 100,535 8,115,361 12,136,768 5,070,966 5,070,966 276,637,401 1929 2,322,670 59,556 16,874,099 19,256,325 4,585,619 117,580 9,491,246 14,194,445 5,930,702 5,930,702 317,785,561 1930 2,063,648 52,914 14,992,311 17,108,872 4,074,234 104,468 8,432,789 12,611,490 5,269,314 5,269,314 288,892,969 1931 895,356 47,124 13,351,797 14,294,277 1,767,690 93,036 7,510,042 9,370,768 4,692,726 4,692,726 252,531,493 1932 926,884 48,783 13,821,953 14,797,620 1,829,935 96,312 7,774,492 9,700,740 4,857,971 4,857,971 259,120,899 1933 1,064,339 56,018 15,871,725 16,992,082 2,101,312 110,595 8,927,436 11,139,343 5,578,400 5,578,400 291,801,060 1934 989,084 52,057 14,749,497 15,790,638 1,952,736 102,776 8,296,212 10,351,724 5,183,973 5,183,973 275,471,741 1935 1,167,953 61,471 17,416,841 18,646,265 2,305,875 121,362 9,796,524 12,223,761 6,121,458 6,121,458 319,524,595 1936 1,418,019 74,633 21,145,904 22,638,556 2,799,578 147,346 11,894,026 14,840,951 7,432,104 7,432,104 379,647,069 1937 1,552,167 81,693 23,146,350 24,780,210 3,064,424 161,285 13,019,225 16,244,935 8,135,196 8,135,196 413,245,309 1938 1,697,586 89,347 25,314,885 27,101,818 3,351,524 176,396 14,238,971 17,766,891 8,897,366 8,897,366 448,986,639 1939 1,737,534 91,449 25,910,602 27,739,586 3,430,393 180,547 14,574,046 18,184,986 9,106,741 9,106,741 460,304,663
(Straits $)
AsiaticClericalStandard
EurasianClericalStandard
EuropeanStandard
Total AsiaticClericalStandard
EurasianClericalStandard
EuropeanStandard
Total EuropeanStandard
Total
1899 451,774 15,578 2,206,943 2,674,296 1,404,475 48,430 1,954,681 3,407,586 1,009,599 1,009,599 89,600,2101900 495,331 17,080 2,419,722 2,932,133 1,406,582 48,503 1,957,614 3,412,699 1,125,112 1,125,112 98,359,7481901 511,505 17,638 2,498,733 3,027,876 1,481,987 51,103 2,062,558 3,595,648 1,157,236 1,157,236 101,553,9071902 593,601 20,469 2,899,773 3,513,843 1,529,825 52,753 2,129,137 3,711,714 1,214,384 1,214,384 111,548,1561903 609,646 21,022 2,978,156 3,608,825 1,572,758 54,233 2,188,889 3,815,879 1,326,745 1,326,745 116,206,6451904 590,332 20,356 2,883,804 3,494,492 1,590,554 54,847 2,213,657 3,859,058 1,228,825 1,228,825 117,871,7451905 630,038 21,725 3,077,771 3,729,535 1,695,829 58,477 2,360,173 4,114,479 1,283,892 1,283,892 121,467,1381906 723,762 24,957 3,535,619 4,284,339 1,865,276 64,320 2,596,002 4,525,598 1,321,258 1,321,258 127,519,5021907 844,173 29,109 4,123,834 4,997,116 1,922,822 66,304 2,676,091 4,665,217 1,367,063 1,367,063 140,919,3141908 906,666 31,264 4,429,116 5,367,047 2,056,685 70,920 2,862,395 4,990,000 1,482,909 1,482,909 151,664,5231909 969,893 33,445 4,737,981 5,741,318 2,179,694 75,162 3,033,594 5,288,450 1,548,321 1,548,321 153,331,9771910 996,819 34,373 4,869,516 5,900,708 2,230,882 76,927 3,104,835 5,412,644 1,669,165 1,669,165 157,354,3461911 1,315,199 33,723 6,688,405 8,037,327 2,934,191 75,236 4,251,201 7,260,628 2,473,790 2,473,790 177,774,1591912 1,286,849 32,996 7,479,122 8,798,967 2,873,952 73,691 4,758,770 7,706,413 2,891,267 2,891,267 192,491,7631913 1,403,487 35,987 9,176,644 10,616,118 3,026,132 77,593 5,637,098 8,740,823 3,705,079 3,705,079 214,231,840 1914 1,685,951 43,230 12,248,359 13,977,539 3,328,552 85,347 6,889,386 10,303,286 4,304,903 4,304,903 226,325,884 1915 1,658,652 42,530 12,050,039 13,751,221 3,211,820 82,354 6,647,778 9,941,953 3,724,712 3,724,712 232,366,363 1916 1,566,874 40,176 11,383,272 12,990,323 3,072,835 78,791 6,360,107 9,511,733 3,998,823 3,998,823 239,647,553 1917 1,923,880 49,330 13,976,908 15,950,118 3,648,767 93,558 7,552,163 11,294,488 4,946,569 4,946,569 276,116,618 1918 1,699,109 43,567 12,343,957 14,086,633 3,231,033 82,847 6,687,545 10,001,425 4,977,392 4,977,392 288,559,984 1919 1,385,334 35,521 10,064,395 11,485,251 2,877,889 73,792 5,956,613 8,908,294 4,464,037 4,464,037 311,131,854 1920 1,430,002 36,667 10,388,901 11,855,570 2,302,162 59,030 4,764,980 7,126,172 3,839,215 3,839,215 327,698,949 1921 2,028,376 52,010 14,736,068 16,816,455 3,162,474 81,089 6,545,642 9,789,205 5,885,363 5,885,363 327,837,169 1922 2,153,882 55,228 15,647,859 17,856,969 3,062,809 78,534 6,339,357 9,480,700 6,274,276 6,274,276 304,268,271 1923 2,222,523 56,988 16,146,534 18,426,044 2,675,067 68,591 5,536,813 8,280,472 6,174,969 6,174,969 307,253,000 1924 2,592,069 66,463 18,831,272 21,489,805 3,271,245 83,878 6,770,774 10,125,896 6,984,629 6,984,629 351,467,172 1925 2,591,236 66,442 18,825,216 21,482,894 3,464,299 88,828 7,170,354 10,723,481 6,986,638 6,986,638 363,187,662 1926 2,760,540 70,783 20,055,203 22,886,525 3,627,558 93,014 7,508,266 11,228,838 7,329,801 7,329,801 402,289,368 1927 2,958,125 75,849 21,490,651 24,524,625 3,537,916 90,716 7,322,725 10,951,356 7,747,567 7,747,567 420,984,008 1928 3,088,180 79,184 22,435,493 25,602,857 3,650,331 93,598 7,555,401 11,299,331 8,088,191 8,088,191 433,600,091 1929 3,611,752 92,609 26,239,224 29,943,585 4,113,300 105,469 8,513,648 12,732,417 9,210,380 9,210,380 489,148,200 1930 3,155,317 80,906 22,923,243 26,159,466 3,483,470 89,320 7,210,034 10,782,824 8,225,399 8,225,399 420,628,178 1931 1,235,591 65,031 18,425,480 19,726,102 1,700,518 89,501 7,224,660 9,014,679 7,531,825 7,531,825 296,672,083 1932 1,155,824 60,833 17,235,975 18,452,632 1,628,643 85,718 6,919,298 8,633,659 7,777,611 7,777,611 261,573,528 1933 1,232,505 64,869 18,379,457 19,676,831 1,794,520 94,448 7,624,031 9,512,999 8,836,185 8,836,185 271,853,063 1934 1,223,497 64,395 18,245,127 19,533,019 1,650,062 86,845 7,010,299 8,747,206 8,268,436 8,268,436 264,281,102 1935 1,487,972 78,314 22,189,056 23,755,342 1,900,041 100,002 8,072,336 10,072,379 9,653,540 9,653,540 327,848,051 1936 1,782,450 93,813 26,580,402 28,456,665 2,239,663 117,877 9,515,221 11,872,761 11,698,131 11,698,131 381,342,557 1937 2,017,817 106,201 30,090,255 32,214,273 2,494,441 131,286 10,597,649 13,223,377 12,829,204 12,829,204 448,882,542 1938 2,176,306 114,542 32,453,683 34,744,531 2,731,492 143,763 11,604,761 14,480,016 14,182,401 14,182,401 466,233,160 1939 2,227,519 117,238 33,217,392 35,562,149 2,819,039 148,370 11,976,703 14,944,112 13,921,468 13,921,468 482,989,747
Clubs
Total Private Final Consumption Expenditure by Major Object of Consumption and Standard in ConstantPrices, Malaya,1900-39
Total Private Final Consumption Expenditure by Major Object of Consumption and Standard in CurrentPrices, Malaya,1900-39
Servants
Servants Transport
Total fromIndirect
Approach
Total fromIndirect
Approach
Transport Clubs
75
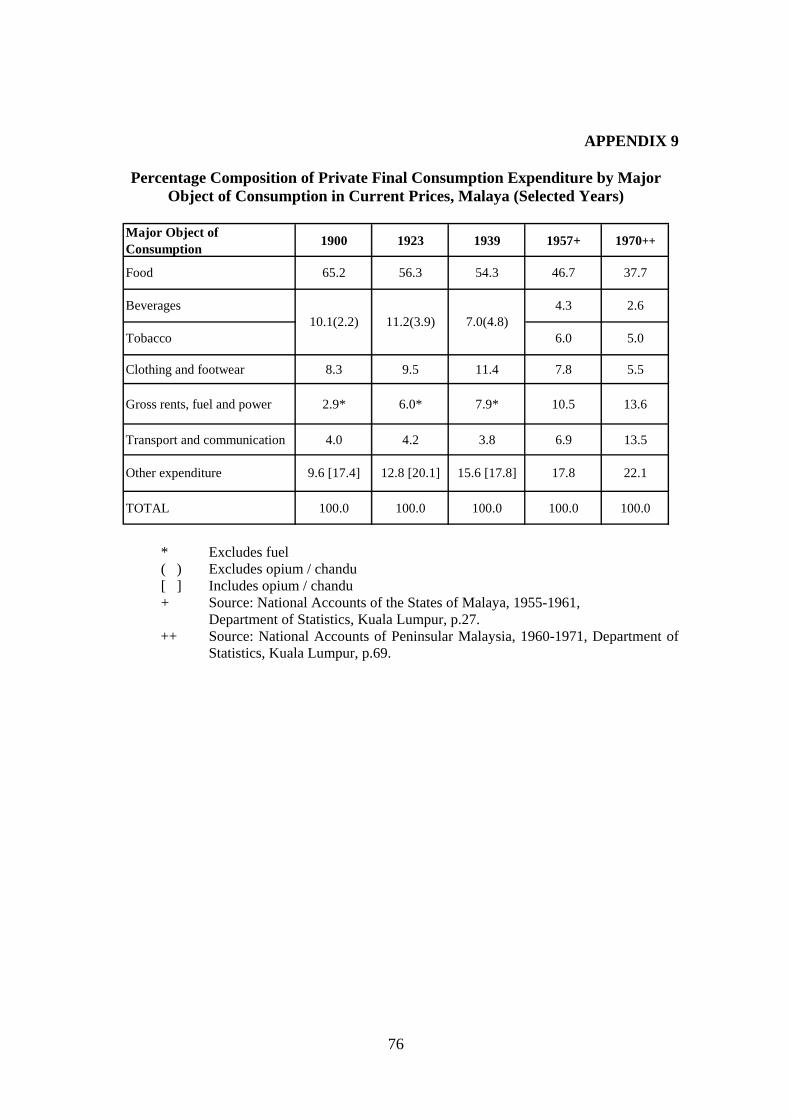
APPENDIX 9
Percentage Composition of Private Final Consumption Expenditure by Major Object of Consumption in Current Prices, Malaya (Selected Years)
Major Object ofConsumption 1900 1923 1939 1957+ 1970++
Clothing and footwear 8.3 9.5 11.4 7.8 5.5
Gross rents, fuel and power 2.9* 6.0* 7.9* 10.5 13.6
Transport and communication 4.0 4.2 3.8 6.9 13.5
TOTAL 100.0 100.0 100.0 100.0 100.0
37.7
2.6
5.0
22.1Other expenditure
Food
6.0Tobacco
4.3Beverages10.1(2.2) 11.2(3.9)
65.2
17.815.6 [17.8]12.8 [20.1]9.6 [17.4]
7.0(4.8)
46.754.356.3
* Excludes fuel ( ) Excludes opium / chandu [ ] Includes opium / chandu + Source: National Accounts of the States of Malaya, 1955-1961, Department of Statistics, Kuala Lumpur, p.27. ++ Source: National Accounts of Peninsular Malaysia, 1960-1971, Department of Statistics, Kuala Lumpur, p.69.
76

77
APPENDIX 10
Share (%) of Food, Beverages and Tobacco Consumption in Total Private Final Consumption Expenditure, Malaya and Selected Countries (Current Prices), 1900-39
1900 67.4 61.7 45.8 56.9 1901 65.2 63.1 45.5 1902 65.2 63.8 45.7 1903 65.8 67.2 46.0 1904 63.9 66.6 45.3 1905 63.5 63.5 45.2 53.1 1906 63.1 61.9 45.0 1907 63.9 65.7 44.5 1908 64.3 64.2 44.3 1909 64.7 62.2 44.2 1910 62.7 61.3 44.4 51.6 1911 62.0 62.9 44.4 1912 62.7 73.6 64.2 44.4 1913 62.1 72.1 59.7 65.3 44.1 1914 60.4 70.9 59.4 60.6 44.7 1915 58.5 69.9 54.3 59.9 47.4 50.0 1916 57.1 66.7 52.8 56.8 50.4 1917 58.4 72.5 55.8 58.8 51.0 1918 58.6 72.9 57.8 1919 62.2 78.4 59.7 1920 62.9 68.7 57.5 1921 60.8 67.7 54.6 1922 60.5 69.3 56.1 1923 60.2 69.7 54.1 1924 60.8 66.1 56.1 1925 60.5 71.6 56.9 1926 60.4 70.0 56.7 1927 59.9 67.7 56.0 1928 60.0 68.8 54.5 1929 60.7 68.9 53.1 1930 60.7 66.6 51.5 1931 58.2 62.9 54.3 1932 58.0 68.3 56.4 1933 57.4 64.8 53.0 1934 57.7 63.7 53.4 1935 60.0 69.8 54.7 1936 60.1 66.9 56.3 1937 61.4 64.3 55.5 1938 59.8 64.0 1939 59.0
FinlandCountryYear
Malaya Japan UK Taiwan Korea
60.0 48.2 59.4 45.7 61.8 45.2 56.6 59.3 47.3 58.1 45.2 57.7 45.8 58.1 45.5 59.1 45.4 46.9 57.5 44.9 56.0 43.9 54.3 43.7 54.5 43.3 53.5 42.7 39.7 50.2 42.0 50.9 41.5 51.0 40.5 49.7 40.2 50.3 40.1 40.5 50.2 39.9 48.3 39.9 49.4 39.7 49.6 42.5
-
10.0
20.0
1900
1902
1904
1906
1908
1910
1912
1914
1916
1918
1920
1922
1924
1926
1928
1930
1932
1934
1936
1938
Year
Sources: Feinstein, C.H. (1972); Ohkawa, K., M. Shinohara and M. Umemura (eds.) (1974); Mizoguchi, T and M. Umemura (eds.) (1988); Hjerppe, Riitta (1996).
30.0
40.0
50.0
60.0
70.0
80.0
90.0
Per c
ent
Malaya Taiwan Korea
Japan UK Finland
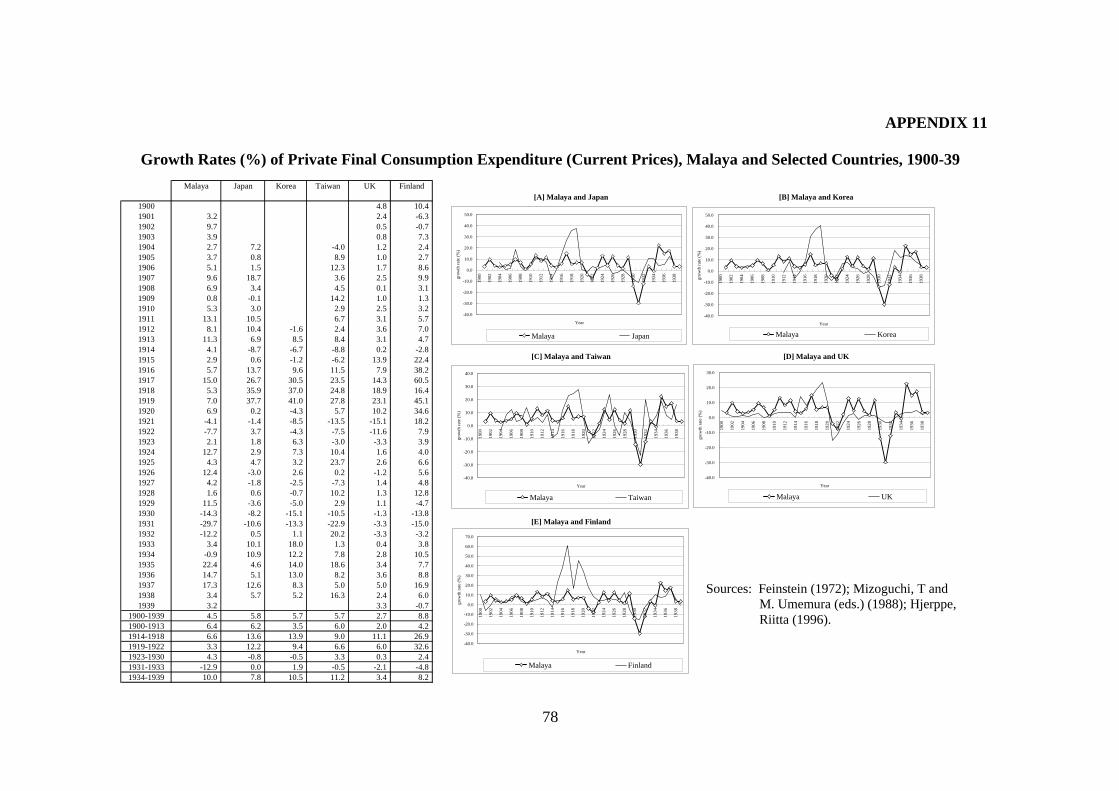
APPENDIX 11
[E] Malaya and Finland
[A] Malaya and Japan [B] Malaya and Korea
[D] Malaya and UK[C] Malaya and Taiwan
-40.0
-30.0
-20.0
-10.0
0.0
10.0
20.0
30.0
40.0
50.0
1900
1902
1904
1906
1908
1910
1912
1914
1916
1918
1920
1922
1924
1926
1928
1930
1932
1934
1936
1938
Year
grow
th ra
te (%
)
Malaya Japan
-40.0
-30.0
-20.0
-10.0
0.0
10.0
20.0
30.0
40.0
50.0
1900
1902
1904
1906
1908
1910
1912
1914
1916
1918
1920
1922
1924
1926
1928
1930
1932
1934
1936
1938
Year
grow
th ra
te (%
)
Malaya Korea
-40.0
-30.0
-20.0
-10.0
0.0
10.0
20.0
30.0
40.0
1900
1902
1904
1906
1908
1910
1912
1914
1916
1918
1920
1922
1924
1926
1928
1930
1932
1934
1936
1938
Year
grow
th ra
te (%
)
Malaya Taiwan
-40.0
-30.0
-20.0
-10.0
0.0
10.0
20.0
30.0
1900
1902
1904
1906
1908
1910
1912
1914
1916
1918
1920
1922
1924
1926
1928
1930
1932
1934
1936
1938
Year
grow
th ra
te (%
)
Malaya UK
-40.0
-30.0
-20.0
-10.0
0.0
10.0
20.0
30.0
40.0
50.0
60.0
70.0
1900
1902
1904
1906
1908
1910
1912
1914
1916
1918
1920
1922
1924
1926
1928
1930
1932
1934
1936
1938
Year
grow
th ra
te (%
)
Malaya Finland
Sources: Feinstein (1972); Mizoguchi, T and M. Umemura (eds.) (1988); Hjerppe, Riitta (1996).
Growth Rates (%) of Private Final Consumption Expenditure (Current Prices), Malaya and Selected Countries, 1900-39
78
1900 4.8 10.41901 3.2 2.4 -6.31902 9.7 0.5 -0.71903 3.9 0.8 7.31904 2.7 7.2 -4.0 1.2 2.41905 3.7 0.8 8.9 1.0 2.71906 5.1 1.5 12.3 1.7 8.61907 9.6 18.7 3.6 2.5 9.91908 6.9 3.4 4.5 0.1 3.11909 0.8 -0.1 14.2 1.0 1.31910 5.3 3.0 2.9 2.5 3.21911 13.1 10.5 6.7 3.1 5.71912 8.1 10.4 -1.6 2.4 3.6 7.01913 11.3 6.9 8.5 8.4 3.1 4.71914 4.1 -8.7 -6.7 -8.8 0.2 -2.81915 2.9 0.6 -1.2 -6.2 13.9 22.41916 5.7 13.7 9.6 11.5 7.9 38.21917 15.0 26.7 30.5 23.5 14.3 60.51918 5.3 35.9 37.0 24.8 18.9 16.41919 7.0 37.7 41.0 27.8 23.1 45.11920 6.9 0.2 -4.3 5.7 10.2 34.61921 -4.1 -1.4 -8.5 -13.5 -15.1 18.21922 -7.7 3.7 -4.3 -7.5 -11.6 7.91923 2.1 1.8 6.3 -3.0 -3.3 3.91924 12.7 2.9 7.3 10.4 1.6 4.01925 4.3 4.7 3.2 23.7 2.6 6.61926 12.4 -3.0 2.6 0.2 -1.2 5.61927 4.2 -1.8 -2.5 -7.3 1.4 4.81928 1.6 0.6 -0.7 10.2 1.3 12.81929 11.5 -3.6 -5.0 2.9 1.1 -4.71930 -14.3 -8.2 -15.1 -10.5 -1.3 -13.81931 -29.7 -10.6 -13.3 -22.9 -3.3 -15.01932 -12.2 0.5 1.1 20.2 -3.3 -3.21933 3.4 10.1 18.0 1.3 0.4 3.81934 -0.9 10.9 12.2 7.8 2.8 10.51935 22.4 4.6 14.0 18.6 3.4 7.71936 14.7 5.1 13.0 8.2 3.6 8.81937 17.3 12.6 8.3 5.0 5.0 16.91938 3.4 5.7 5.2 16.3 2.4 6.01939 3.2 3.3 -0.7
1900-1939 4.5 5.8 5.7 5.7 2.7 8.81900-1913 6.4 6.2 3.5 6.0 2.0 4.21914-1918 6.6 13.6 13.9 9.0 11.1 26.91919-1922 3.3 12.2 9.4 6.6 6.0 32.61923-1930 4.3 -0.8 -0.5 3.3 0.3 2.41931-1933 -12.9 0.0 1.9 -0.5 -2.1 -4.81934-1939 10.0 7.8 10.5 11.2 3.4 8.2
UK FinlandMalaya Japan Korea Taiwan
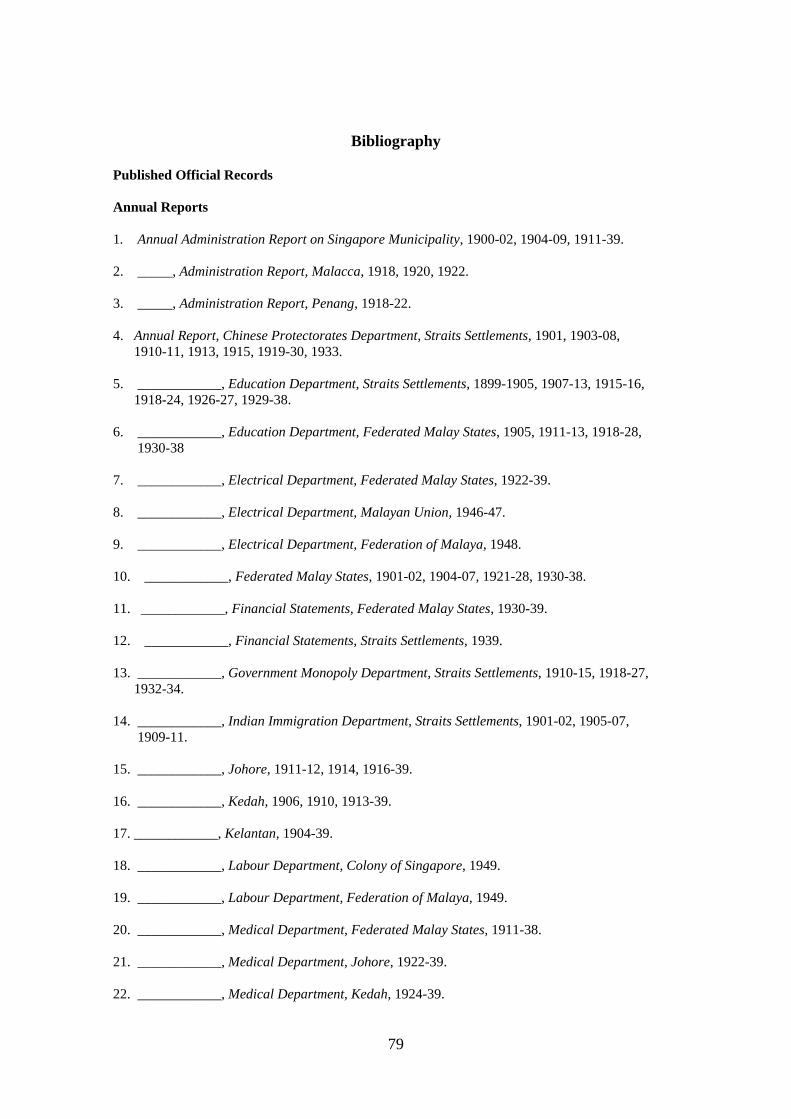
Bibliography Published Official Records Annual Reports 1. Annual Administration Report on Singapore Municipality, 1900-02, 1904-09, 1911-39. 2. _____, Administration Report, Malacca, 1918, 1920, 1922. 3. _____, Administration Report, Penang, 1918-22. 4. Annual Report, Chinese Protectorates Department, Straits Settlements, 1901, 1903-08, 1910-11, 1913, 1915, 1919-30, 1933. 5. ____________, Education Department, Straits Settlements, 1899-1905, 1907-13, 1915-16, 1918-24, 1926-27, 1929-38. 6. ____________, Education Department, Federated Malay States, 1905, 1911-13, 1918-28, 1930-38 7. ____________, Electrical Department, Federated Malay States, 1922-39. 8. ____________, Electrical Department, Malayan Union, 1946-47. 9. ____________, Electrical Department, Federation of Malaya, 1948. 10. ____________, Federated Malay States, 1901-02, 1904-07, 1921-28, 1930-38. 11. ____________, Financial Statements, Federated Malay States, 1930-39. 12. ____________, Financial Statements, Straits Settlements, 1939. 13. ____________, Government Monopoly Department, Straits Settlements, 1910-15, 1918-27, 1932-34. 14. ____________, Indian Immigration Department, Straits Settlements, 1901-02, 1905-07, 1909-11. 15. ____________, Johore, 1911-12, 1914, 1916-39. 16. ____________, Kedah, 1906, 1910, 1913-39. 17. ____________, Kelantan, 1904-39. 18. ____________, Labour Department, Colony of Singapore, 1949. 19. ____________, Labour Department, Federation of Malaya, 1949. 20. ____________, Medical Department, Federated Malay States, 1911-38. 21. ____________, Medical Department, Johore, 1922-39. 22. ____________, Medical Department, Kedah, 1924-39.
79
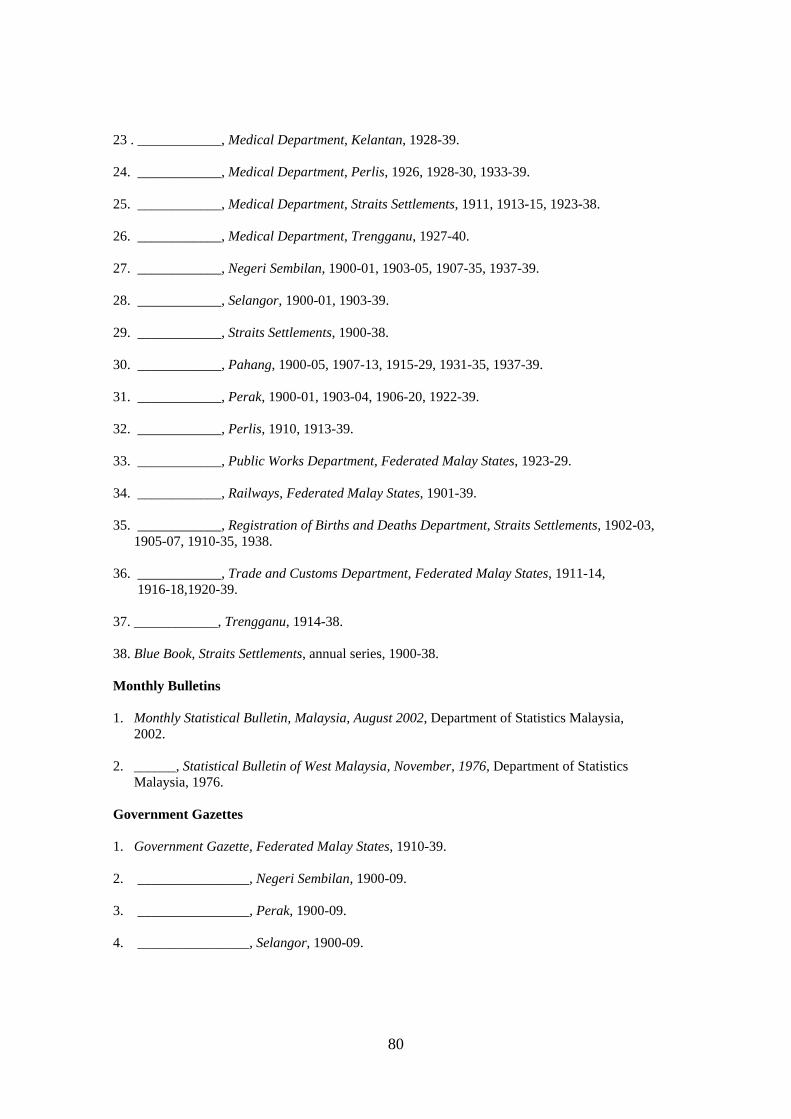
23 . ____________, Medical Department, Kelantan, 1928-39. 24. ____________, Medical Department, Perlis, 1926, 1928-30, 1933-39. 25. ____________, Medical Department, Straits Settlements, 1911, 1913-15, 1923-38. 26. ____________, Medical Department, Trengganu, 1927-40. 27. ____________, Negeri Sembilan, 1900-01, 1903-05, 1907-35, 1937-39. 28. ____________, Selangor, 1900-01, 1903-39. 29. ____________, Straits Settlements, 1900-38. 30. ____________, Pahang, 1900-05, 1907-13, 1915-29, 1931-35, 1937-39. 31. ____________, Perak, 1900-01, 1903-04, 1906-20, 1922-39. 32. ____________, Perlis, 1910, 1913-39. 33. ____________, Public Works Department, Federated Malay States, 1923-29. 34. ____________, Railways, Federated Malay States, 1901-39. 35. ____________, Registration of Births and Deaths Department, Straits Settlements, 1902-03, 1905-07, 1910-35, 1938. 36. ____________, Trade and Customs Department, Federated Malay States, 1911-14, 1916-18,1920-39. 37. ____________, Trengganu, 1914-38. 38. Blue Book, Straits Settlements, annual series, 1900-38. Monthly Bulletins 1. Monthly Statistical Bulletin, Malaysia, August 2002, Department of Statistics Malaysia, 2002. 2. ______, Statistical Bulletin of West Malaysia, November, 1976, Department of Statistics Malaysia, 1976. Government Gazettes 1. Government Gazette, Federated Malay States, 1910-39. 2. ________________, Negeri Sembilan, 1900-09. 3. ________________, Perak, 1900-09. 4. ________________, Selangor, 1900-09.
80
Population Census Reports 1. Cavendish, A., Report on the Census of Kedah and Perlis, 1911, Penang, The Criterion Press Ltd., 1911. 2. Del Tufo, M. V., A Report on the 1947 Census of Population, Malaya (Comprising Federation of Malaya and the Colony of Singapore), London, The Crown Agents for The Colonies, 1949. 3. Hare, G. T., Census of The Population 1901, The Federated Malay States, Kuala Lumpur, Government Printers,1902. 4. Innes, J.R., Report on the Census of the Straits Settlements, 1901, Singapore, Government Printing Office, 1901. 5. Marriot, Hayes, Census Report of the Straits Settlements, 1911, Singapore, Government Printing Office, 1911. 6. _____________, Report on the Census of the State of Johore, 1911, Johore Bahru, Government Printing Office, 1911. 7. Nathan, J. E., The Census of British Malaya (The Straits Settlements, Federated Malay States
and Protected States of Johore, Kedah, Perlis, Kelantan, Trengganu and Brunei), 1921, London, Waterloo & Sons Limited, 1922.
8. Pountney, A .M., The Census of The Federated Malay States, 1911, London, His Majesty’s Stationery Office, 1911. 9. Vlieland, C.A., A Report On The 1931 Census and On Certain Problems of Vital Statistics, BritishMalaya (The Colony of The Straits Settlements and the Malay States under British Protection, namely The Federated Malay States of Perak, Selangor, Negeri Sembilan and Pahang and the States of Johore, Kedah, Kelantan, Trengganu, Perlis and Brunei), London, The Crown Agents For The Colonies, 1932. Special Reports 1. Allen, L.A., Proclamations, Order, Notices, Rules, Regulations, Declarations, Appointments, Forms and By-laws in force on 31st day of December 1935 made under the Laws of the Federated Malay States and of each of them prepared under the Authority of the Revised Edition of the Laws Enactment, 1932, Vol. V containing the Subsidiary Legislation made under Enactments, Chapters 138-161, Kuala Lumpur, Government Printer, 1938, (Diet Scales of Government Hospitals 1936 – Chapter 154.). 2. Average Prices, Declared Trade Values, Exchange and Currency for the year 1939, Malaya, Department of Statistics, Straits Settlements and Federated Malay States, Singapore, Government Printing Office, 1940. 3. Average Prices, Declared Trade Values, Exchange and Currency, Volume and Average Values of Imports and Exports, Market Prices, and Cost of Living for the year 1951, Malaya, Department of Statistics, Singapore, Government Printing Office,1952. 4. Household Budget Survey of the Federation of Malaya, 1957-58, Department of Statistics, Kuala Lumpur, Federation of Malaya.
81
5. Malaysia Economic Statistics- Time Series, 1999, Department of Statistics Malaysia, December 1999. 6. Marjoribanks, N.E. and Ahmad Tambi Marakkayar, A.K.G., Report on Indian Labour Emigrating to Ceylon and Malaya, Madras, The Superintendent Government Press, 1917. 7. Milles, J.I., Report of The Commission on The Temporary Allowances, Family Budget, 1930, Singapore, Government Printing Office, 1931. 8. National Accounts of Peninsular Malaysia, 1960-1971, Department of Statistics, Kuala Lumpur 9. National Accounts of the States of Malaya, 1955-1961, Department of Statistics, Kuala
Lumpur.
10. Report of the Commissions appointed by His Excellency the Governor of the Straits Settlements and the High Commissioner of the Federated Malay States to Enquire into Certain Matters Relating to the Public Service, To Wit, the salaries, and the conditions of service as affecting such salaries of certain officers in the Public Service of the Straits Settlements and the Federated Malay States, and the provision of free passages to such officers and to their wives and children when proceeding from and returning to the Straits Settlements and Federated Malay States on leave of absence, 1919, Singapore, Government Printing Office, 1919.
11. Report of the Executive of the General Labour Committee, British Malaya on Indian Labour and Labourers, Kuala Lumpur, 1920. 12. Report on the Registration of Births and Deaths, Malayan Union, 1940-1946, Kuala Lumpur, Government Press. 13. Srinivasa Sastri V.S., Reprint of Report on the Conditions of Indian Labour in Malaya, 1937. 14. Straits Settlements and Federated Malay States Opium Commission, Proceedings of the Commission Appointed to Inquire into Matters Relating to the Use of Opium in the Straits Settlements and the Federated Malay States, Singapore, Government Printing Office, 1908. 15. The Selangor Indian Association, Kuala Lumpur, The Young Men’s Indian Association, Sentul and The Coastal Indian Association, Klang, Memorandum presented to the Rt. Hon. V.S. Srinivasa Sastri on Deputation to Malaya, on behalf of the Government of India, Kuala Lumpur, Malayan Printers, 1937. 16. Vital Statistics Time Series, Peninsular Malaysia, 1911-1985, Kuala Lumpur, Department of Statistics Malaysia, 1991. 17. Vital Statistics Time Series, Malaysia, 1963-1998, Department of Statistics Malaysia, 2001. Books and Articles 1. A.R. Prest and A.A. Adams, Consumers’ Expenditure in the United Kingdom, 1900-1919, Cambridge, Cambridge University Press,1954. 2. Department of International Economic and Social Affairs, Statistical Office, Studies in Methods, Series F No. 39, Handbook of National Accounting, Accounting for Production: Sources and Methods, United Nations, New York, 1986.
82
3. Department of Economic and Social Affairs, Statistical Office of the United Nations, Studies in Methods, Series F No.2 Rev. 3, A System of National Accounts, United Nations, New York, 1968. 4. Derksen, J.B.D. and Tinbergen, J., 'Berekeningen over de economische betekenis van Nederlandsch–Indi·voor Nederland' ['Calculations of the economic significance of the Netherlands Indies to the Netherlands] Maandschrift van het Centraal Bureau voor de Statistiek [Monthly bulletin of the Central Bureau of Statistics] 40, (1945), pp.210-216. 5. Feinstein, C. H., National Income, Expenditure and Output of the United Kingdom, 1855- 1965,Cambridge, Cambridge University Press,1972. 6. Hjerppe, Riitta, Finland’s Historical National Accounts 1860-1994: Calculation Methods and Statistical Tables, Jyväskylän Yliopisto, Historian Laitos, Suomen Historian, Julkaisuja, 24, 1996. 7. Mizoguchi, T. and M. Umemura (eds.), Basic Economic Statistics of Former Japanese Colonies 1895-1938, Estimates and Findings, Tokyo, Toyo Keizai Shinposha,1988. 8. Ohkawa, K., M. Shinohara and M. Umemura (eds.), Estimates of Long-Term Economic
Statistics of Japan since 1868, Vol. No. 1, National Income, Tokyo, Toyo Keizai Shinposha, 1974.
9. Saw Swee-Hock, The Population of Peninsular Malaysia, Singapore, Singapore University Press, 1988. 10. National Electricity Board of the States of Malaya : Silver Jubilee : 1st Sept. 1949 - 1st Sept. 1974, Jabatan Penerangan, Lembagan Letrik Negara Tanah Melayu, 1974. 11. Stone, R., et al., The Measurement of Consumers’ Expenditure and Behaviour in the United Kingdom, 1920-1938, Volume II, Cambridge, Cambridge University Press, 1966. 12. Tate, Muzaffar, Power builds the Nation: The National Electricity Board of the States of Malaya and Its Predecessors, Vol.1, The National Electricity Board of the State of Malaya, Kuala Lumpur, 1989. 13. Yeh, Stephen H.K, Public Housing in Singapore: A Multi-disciplinary Study, Singapore University Press, Singapore, 1975.
83