a study on customer satisfaction in airways - coimbatore … · a study on customer satisfaction in...
TRANSCRIPT
International Journal of Scientific and Research Publications, Volume 4, Issue 12, December 2014 1 ISSN 2250-3153
www.ijsrp.org
A Study on Customer Satisfaction in Airways -
Coimbatore City
R. Rajeswari
Teaching Associate, PSG Institute of Management
Abstract- Air transport being the most and the quickest mode of
transport have been gaining popularity. However, the exorbitant
rates have made it the mode of travel of the rich or of the
business community for whom time is more expensive than air
travel. The main objective of the study was to find out the
customer satisfaction in airways in various objects like price,
quality, services& source of booking.
Index Terms- Airport, Source of Booking, Customer Satisfaction
I. INDIAN AIR TRANSPORT INFRASTRUCTURE
ndian air transport is one of the fastest developing aviation
sectors of the world. In recent years, Indian air transport has
witnessed a boom which has given rise to the need for improving
Indian air transport infrastructure like never before.
The reason for that is an upsurge in demand for air travel,
much of which owes to the opening of a host of low-cost airlines
by the private sector.
Airlines in India
Kingfisher Airlines, Air India and Jet Airways are the most
popular brands in domestic air travel in order of their market
share. These airlines connect more than 80 cities across India and
also operate overseas routes after the liberalization of Indian
aviation. However, a large section of country's air transport
system remains untapped, even though the Mumbai-Delhi air
corridor was ranked 6th by the Official Airline Guide in 2007
among the world's busiest routes.
India's vast unutilized air transport network has attracted
several investments in the Indian air industry in the past few
years. More than half a dozen low-cost carriers entered the
Indian market in 2004-05. Major new entrants include Air
Deccan, Kingfisher Airlines, SpiceJet, GoAir, Paramount
Airways and IndiGo Airlines. To meet India's rapidly increasing
demand for air travel, Air India recently placed orders for more
than 68 jets from Boeing for 7.5 billion USD while Indian placed
orders for 43 jets from Airbus for 2.5 billion USD. Jet Airways,
India's largest private carrier, has invested millions of dollars to
increase its fleet, but this has been put on hold due to the recent
economic slowdown. This trend is not restricted to traditional air
carriers in India. IndiGo Airlines entered the limelight when it
announced orders for 100 Airbus A320s worth 6 billion USD
during the Paris Air Show; the highest by any Asian domestic
carrier. Kingfisher Airlines became the first Indian air carrier in
June 15, 2005 to order Airbus A380 aircraft. The total deal with
Airbus was worth 3 billion USD.
Airports in India
Thirty major airports and infinite air terminal are genuinely
trying to make India an easily air accessible place from several
years. India is a massive country with excellent internal flight
routes that reaches almost every nooks and corner of the country.
Airport Authority of India administers all the prominent airports
throughout the country. Airport Authority was come into being
on 1st April 1995, which comprises of international as well as
domestic airports in India. To accelerate the integrated progress,
extension and modernization of the amenities of airport that
meets the needs of the international standard is the only objective
of the Airport Authority of India (AAI).
In the last few decades the infrastructure of the country has
undergone severe change and development especially in the civil
aviation sector of India. To manage the enormous growth in the
airline industry of India modern airports have introduced in all
over the country. Thus in the recent years several investments
have been made in the air industry to make use of its large
unutilized air transport network. Low cost air terminal have also
introduced in the Indian Market in last few years. This creates a
boom in the Indian economy and thus causes huge benefits in the
tourism industry in India.
II. EXISTING POSITION
There are 449 airports/airstrips in the country. Among
these, the AAI owns and manages 5 international
airports, 87 domestic airports and 28 civil enclaves at
Defence airfields and provides air traffic services over
the entire Indian airspace and adjoining oceanic areas.
In 1998-99, these 120 airports/civil enclaves handled
4.20 lakh aircraft movements involving 24.17 million
domestic and 12.83 million international passengers and
221 thousand metric tons of domestic cargo and 468
thousand metric tons of international cargo. 51 percent
of traffic was handled at the international airports at
Mumbai and Delhi. Presently various airlines are
operating only through 61 airports. The remaining are
lying unutilised at best handling occasional aircraft
operations.
The turnover of the Authority was Rs.1591.27 crores for
the year ended March, 1999 and under audit figure of
the Post Tax Profits for the year ended is Rs.208.41
crores as against Rs.196.14 crores for the year ended
March, 1998.
Historically, air traffic at Indian airports has broadly
followed a particular distribution pattern, except that
I

International Journal of Scientific and Research Publications, Volume 4, Issue 12, December 2014 2
ISSN 2250-3153
www.ijsrp.org
some airports have changed their inter-se position vis-a-
vis volume of traffic.
Air Traffic Control (ATC)
Air traffic control (ATC) involves communication with
aircraft to help maintain separation — that is, they ensure that
aircraft are sufficiently far enough apart horizontally or vertically
for no risk of collision. Controllers may co-ordinate position
reports provided by pilots, or in high traffic areas (such as the
United States) they may use radar to see aircraft positions.
There are generally four different types of ATC:
center controllers, who control aircraft en route between
airports
Control towers (including tower, ground control,
clearance delivery, and other services), which control
aircraft within a small distance (typically 10–15 km
horizontal, and 1,000 m vertical) of an airport.
Oceanic controllers, who control aircraft over
international waters between continents, generally
without radar service.
terminal controllers, who control aircraft in a wider area
(typically 50–80 km) around busy airports.
Airports Authority of India
The Airports Authority of India (AAI) is an organization
working under the Ministry of Civil Aviation that manages all
the airports in India. The AAI manages and operates 126 airports
including 12 international airports, 89 domestic airports and 26
civil enclaves. The corporate headquarters(CHQ) are at Rajiv
Gandhi Bhawan, Safdarjung Airport, New Delhi. V.P Agrawal is
the current chairman of the AAI.
History
The AAI was formed on 1 April 1995 by merging the
National Airports Authority (NAA) and the International
Airports Authority of India (IAAI), to create a centralized
organization that could effectively manage both the international
and domestic airports. Presently, it is owned 100% by the
Government of India.
Main Functions of AAI
Control and management of the Indian airspace
extending beyond the territorial limits of the country, as
accepted by ICAO
Design, Development, Operation and Maintenance of
International and Domestic Airports and Civil Enclaves.
Construction, Modification and Management of
Passenger Terminals
Development and Management of Cargo Terminals at
International and Domestic airports.
Provision of Passenger Facilities and Information
System at the Passenger Terminals at airports.
Expansion and strengthening of operation area viz.
Runways, Aprons, Taxiway, etc.
Provision of visual aids.
Provision of Communication and Navigational aids viz.
ILS, DVOR, DME, Radar, etc.
III. AIRPORT CLASSIFICATION
Airports are presently classified in the following manner:
International Airports: - These are declared as
international airports and are available for scheduled
international operations by Indian and foreign carriers.
Presently, Mumbai, Delhi, Chennai, Calcutta and
Thiruvananthapuram are in this category.
Domestic Airports:
a) Customs Airports with limited
international operations: - These
have customs and immigration facilities
for limited international operations by
national carriers and for foreign tourist and
cargo charter flights. These include
Bangalore (CE), Hyderabad, Ahmedabad,
Calicut, Goa (CE Varanasi,
Patna, Agra (CE), Jaipur, Amritsar,
Tiruchirapally, Coimbatore, Lucknow. (CE -
Civil Enclave)
b) Model Airports:- These domestic airports
have minimum runway length of 7500
feet and adequate terminal capacity (400
passengers or more) to handle Airbus 320
type of aircraft. These can cater to limited
international traffic also, if required. These
include Bhubaneswar, Guwahati,
Nagpur, Vadodara, Imphal and Indore.
Rest 6 Nos. of airports, developed under
Model Airports concept have graduated to
the classification of Customs Airports,
given above.
c) Other Domestic Airports:- All other 71
domestic airports are covered in this
category.
d) Civil Enclaves in Defence Airport:- There are 28
civil enclaves in Defence airfields. Twenty civil enclaves are in
operation.
Coimbatore Airport
Coimbatore Airport is an accomplished airport of the city of
Coimbatore and is located in the Peelamedu region of the city. In
the earlier years it was known as the Peelamedu or Coimbatore
Civil Aerodrome and is at a distance of 13 Miles (21 kilometers)
from the city center. The airport had its commencement in the
1940’s in the form of a civil aerodrome with just a few airplanes
of the Indian Airlines. From that period for a considerable phase
the air services were restricted to the cities of Chennai and
Mumbai. However, in the later years services to Cochin and
Bangalore were also added. The airport in the 80s had a
thorough transformation when it was closed down for runway
expansion so as to enable modern day’s jets like Boeing 737 and
Airbus to operate. The year 1987 is a landmark in the history of
this airport since on that year the project of runway expansion
was completed and a new terminal started operation.
Nowadays, the airport is served by 10 airlines and 5 more
are likely to initiate their operations in the coming years. In the
meanwhile, two reputed international airlines SilkAir and
SriLankan Airlines started operations to Coimbatore, linking
International Journal of Scientific and Research Publications, Volume 4, Issue 12, December 2014 3
ISSN 2250-3153
www.ijsrp.org
Coimbatore with Singapore and Colombo. The other two
international airlines that are operating from here are Air Arabia
and Air India-Express. In the airport there is also a runway that is
10,000 feet in length and it is destined that the final expansion
will expand it to12,500 ft in length. This will be done to handle
wide bodied aircrafts in a better manner.
The airport is on the verge of expansion and projects are
being chalked out in this direction. The airport authority is
pondering over the construction of a parallel taxiway to reduce
the runway occupancy time and turnaround of aircraft. In
addition, plans for modernizing the present terminal with all
modern facilities are sought after.
History
The airport commenced operations in 1940 as a civil
aerodrome with Indian Airlines operating Fokker F27, Douglas
DC-3 and later Hawker Siddeley HS 748 aircraft.[6] Beginning
with services to Chennai and Bangalore, other destinations like
Cochin and Mumbai were added later. The airport was
modernized with an extended runway to accommodate larger
aircraft like the Boeing 737 and was reopened in 1987. The Sulur
Air Force Base located further east of Coimbatore was
temporarily used for civil aviation during this period. As of 2012,
the airport is served by more than ten domestic and international
carriers.
The Prime Minister of India declared the government's
intention to upgrade Coimbatore Airport to International status in
a meeting with senior ministers on 6 June 2012 and the Union
Cabinet granted it the status of international airport on October 2,
2012.
Infrastructure
The airport has one runway that is 9,760 feet (2,970 m) in
length extended from 8,500 ft (2,600 m) to accommodate larger
aircraft. The runway is further slated to be extended to 12,500
feet (3,800 m) to handle wide bodied aircraft such as the Airbus
A380. New domestic and international divisions were added in
2010 to the already existing common terminal and an Instrument
Landing System (ILS) is in place since 2008.[9] The airport has a
parking management system with a capacity to accommodate
nearly 300 cars.[10] There are two hangars in the airport; one
provides housing for the planes of Coimbatore Flying Club, the
other provides shelter for private carriers.
Although the status of International airport was conferred
only in 2012, the airport has had provisions for, and has been
receiving, international flights (primarily from Sharjah) since the
1990s and Silk Air from Singapore Changi airport since 2006.
Srilankan Airlines from Colombo operated for a short period.
The service was stopped due to security reasons. FluDudai is
planning to start their operations in some time
Airport Structure
The airport has one runway that is 9,760 feet (2,970 m) in
length - previously the runway was 8,500 ft (2,600 m) in length.
Because of this runway expansion, the airport can accommodate
aircraft such as the Boeing 747 and Airbus A330. An Instrument
Landing System (ILS) is also being installed
The further proposed expansion of the airport includes the
construction of a parallel taxiway to the runway. This will
minimise the runway occupancy time and turnaround of aircraft,
as aircraft currently taxi on the runway. Two more parking bays
will be added, raising the total number to eight. The terminal will
also be modernized with sliding doors, aero-bridges, and modern
systems for baggage-handling.
Proposed Expansion
The further proposed expansion of the airport includes
extension of runway to 12,500 ft (3,800 m) to accommodate
larger aircraft such as the Boeing 747 and Airbus A380 and
construction of a parallel taxiway to the runway to minimize
runway occupancy time and turnaround time of aircraft. Two
more parking bays will be added, raising the total number of bays
to 10.Now the airport can accommodate a330 aircraft though no
airline flys one. The airport is expected to accommodate a380
and 747 when expansion is complete. The airport has received
approval for expansion but work has been postponed due to some
local problems.
Airlines in Coimbatore airport
Airlines Destinations
Air Arabia
Air Costa
Air India
IndiGo
Jet Konnect
Silkair
SpiceJet
Blue Dart Aviation
Yanda Airlines
Sharjah
Bangalore, Hyderabad, Vijayawada, Tirupati
Delhi, Kozhikode, Mumbai
Bhubaneswar, Chennai, Delhi, Mumbai
Bangalore, Chennai, Mumbai
Singapore
Ahmedabad, Chennai, Delhi, Hyderabad, Mumbai
Chennai, Delhi
Bangkok-Suvamabhumi, Sharjah
International Journal of Scientific and Research Publications, Volume 4, Issue 12, December 2014 4
ISSN 2250-3153
www.ijsrp.org
Boarding Systems
Analytical and simulation results show that group/zone
boarding can speed up the airplane boarding process. Airlines use
a number of different group/zone boarding systems or boarding
rules, the idea (there are numerous variations) of some of them,
are shown below. By pressing play you can view a simulation of
different airplane boarding strategies. Note, random boarding
(i.e. boarding all rows at the same time) is faster than back-to-
front boarding. Hence, you will actually speed up the boarding
process if you board before your turn in back-to-front boarding.
Airline meal
An airline meal or in-flight meal is a meal served to
passengers on board a commercial airliner. These meals are
prepared by airline catering services.
IV. ENTERTAINMENT
Interior modification and refurbishment work provides an
ideal opportunity to improve passenger flight enjoyment with an
upgrade to your entertainment systems. With little or no increase
in downtime, we can enhance your cabin's entertainment system
with state-of-the-art CD/DVD players, flat screen monitors,
speakers & headsets, and Airshow moving maps.
Airline complaints
Airline complaints are any type of formal complaint filed by
an airline customer either to the airline responsible for the
grievance or the government office responsible for overseeing
the airlines national industry. Airline complaints generally arise
out of problems experienced during air travel that were left
unresolved.
Air safety
Air safety is a term encompassing the theory, investigation
and categorization of flight failures, and the prevention of such
failures through regulation, education and training. It can also be
applied in the context of campaigns that inform the public as to
the safety of air travel.
Some of the air safety topics are:
Lighting
Ice and snow
Engine failure
Fire
Bird strike
Ground damage
Human factor
Booking of Airline Tickets
Booking airline tickets has become an art form. One day too
late, or choose the wrong layover, and you're paying hundreds
more than you need to. It takes a lot of sleuthing and a bit of
finesse to get the seat you want, the price you need and the dates
you prefer. Here's how to get from point A to point B--on your
own terms.
Instructions
1] Start your search at least 21 days ahead of time to take
advantage of advance-booking fares. Travel midweek and stay
over a Saturday night whenever possible. Stay on your toes: The
cheap seats always sell out first.
2] Look for flights on your frequent-flier carrier first and
compare its cheapest rate to those on sites such as Priceline.com,
Expedia.com and Travelocity.com. Also check out consolidators
such as AirTravelCenter.com and auction sites. Many airline
Web sites offer lower Internet-only fares.
3] Consider flying through a secondary airport. Orange
County and Burbank are alternatives to LAX, and Newark
International can substitute for the busier and oft-delayed JFK or
LaGuardia airports. You may have to drive further, but if flights
are impossible to get or impossibly expensive, you might be
surprised by the ease of use and friendlier prices of smaller
airports.
4] Request your seat preference (aisle or window) when
buying your ticket. You could find yourself with a middle seat if
you wait until check-in. SeatGuru.com has detailed maps of the
best and worst seats on specific planes, so you can avoid seats
that don't recline and keep an eye out for those with extra leg
room.
5] Request any special assistance or equipment (such as a
wheelchair) for disabled travelers prior to arriving at the airport.
6] Keep the length of the flight, the layovers, the amount of
gear you're carrying and the time of day in mind when deciding
whether to buy a seat (often discounted) for an infant. Domestic
carriers permit you to hold children under 2 years of age on your
lap, while international flights require a ticket and a seat for
every passenger.
7] Place special meal orders at no extra charge, if they are
offered on your flight. For example, United offers diabetic, low
fat and low cholesterol, low-calorie, high-fiber, low-protein, low-
sodium, kosher and vegan meals. There are also meals for
children. These special meals are often tastier than the regular
fare.
8] Find out whether tickets are refundable, transferable or
changeable (and at what cost) before you buy. Get e-tickets when
possible. Having paper tickets mailed usually involves an extra
fee, and they're like cash: If you lose them, they're gone.
V. REVIEW OF LITERATURE
Vasu Krishnasami on 6 may 2006 the review of Coimbatore
airport is tiny! Too many passengers use this airport. The
potential of this City is enormous! Government needs to show
some care for Coimbatore.
Sharon Wilson on 28 April 2006 Contrary to what I had
expected to find at a small, domestic airport, the terminal was
beautifully clean well laid out with the benefit of some shops,
friendly staff who helped us through the security and check- in
process. Ladies toilets (both Indian and Western style) were
acceptably clean. A/C was okay if you were standing under it. I
would have no hesitation in travelling through this airport again
on future visits to India. Well done to those who maintain the
Airport - keep up the good work.
Coimbatore airport expansion to take off soon By V.S.
Palaniappan in his review Coimbatore Aug. 20. With the district
administration gearing for the land acquisition process, the
International Journal of Scientific and Research Publications, Volume 4, Issue 12, December 2014 5
ISSN 2250-3153
www.ijsrp.org
much-awaited expansion of the Coimbatore Airport at
Peelamedu is set to take off shortly. The preliminary work of
land acquisition for airport expansion might get under way
before September-end.
The Collector, N. Muruganandam, said an exclusive revenue
team would be formed to acquire almost 114 acres most of which
are private ``patta lands'' lying contiguous to the airport.
The administrative sanction which the district administration
had sought from the State Government for setting up a team for
acquisition is expected any time within a month.
On obtaining it, the land acquisition process would get under
way, he said. The entire exercise might take a minimum of six
months to a year.
The cost involved had been put at Rs. 3.72 crores and the
Airports Authority of India had already given an assurance that it
would deposit the money with the Government the moment
acquisition process begins, the Airport Director, N.K. Sinha,
told The Hindu.
The AAI had been keenly pushing through the land
acquisition process as the runway expansion and widening would
be a pre-requisite for enhancing the airport's capacity in terms of
passenger flow and cargo handling.
The main constraint in increasing the passenger/cargo
capacity was the length of the runway.
The present 7500 feet runway is inadequate to operate bigger
and wider-bodied aircraft especially the higher version of the
Boeing or Jet aircraft.
Bigger runways are a must for the Airbus 300 type of
aircraft.
The runway length had to be increased to 9000 feet and
corresponding strengthening needed to make it suitable to take
on higher aircraft load.
The trade and industry in the Coimbatore region has been
seeking expansion for handling future increase in passenger as
well as cargo traffic considering the growing business potential
including the export/import of cargo to and from Coimbatore.
The airport authorities view that lack of infrastructure in
general and inadequate runway in particular at airports in a way
responsible for the limited freight operation.
The AAI's renewed effort on runway expansion got a fillip
after the visit by the Parliamentary Consultative Committee on
Civil Aviation to the Coimbatore airport recently.
Once the expansion work is completed, the AAI would be in
a position to lure various airliners to operate international flights
from Coimbatore, which again depended largely on the
passenger traffic potential that Coimbatore could generate, AAI
officials pointed out.
Sujay Mehdudia in his review, a new integrated terminal
building was being constructed at the Madurai airport and the
Coimbatore airport terminal building would be expanded by May
2010.
A master plan for upgrading the Tuticorin airport in phases
had been prepared and the Tamil Nadu government asked to
provide 586 acres of land free and without encumbrances to the
Airports Authority of India, he said.
VI. RESEARCH METHODOLOGY
SCOPE OF THE STUDY:
The project aims to study the customer’s satisfaction level in
airways in various objects. For this purpose primary data were
collected by questionnaire method.
OBJECTIVE OF THE STUDY:
To study about the consumers opinion on price,
quality, services & sources of booking.
To study the consumers level of satisfaction
towards various factors of airline services.
To study the effectiveness of quality & service
of the airlines.
To study the consumers satisfaction level in the
boarding efficiency & baggage delivery timings.
To study the consumers satisfaction in overall
courteous & helpfulness.
LIMITATIONS:
This study covers only the customers who travel in the
air, sample of 75 was selected together.
As the questionnaire method was used the analysis was
carried out based on the information provided by the
respondents.
TOOLS USED:
The following tools are used to analyse the data for the
various objective of the study.
Percentage analysis
Chi-square test
Rank analysis
PERCENTAGE ANALYSIS
In this section different table formed for all the data
available from this sample. Further interpretation is given for the
entries given in table. This analysis helps a common man to
understand, what percentage of respondents belongs to each
category. Also by giving information in term of percentage we
use the standardization. The results are given one after another.
CHI-SQUARE ANALYSIS
This chi-square test is the study of finding whether any one
factors has association with other. The chi-square tests were
carried out at 5% level significance. Under the hypothesis of
independent of attributes the expected frequencies for any of the
frequencies can be obtained on modifying in the dividing the
product by the total frequency N.
Chi-square formulae, which is used in this study is given
below.
International Journal of Scientific and Research Publications, Volume 4, Issue 12, December 2014 6
ISSN 2250-3153
www.ijsrp.org
i
ii
E
EO 2
2 )(
If p value is less than the α value , the Null hypothesis may
be rejected.
VII. ANALYSIS AND INTERPRETATION
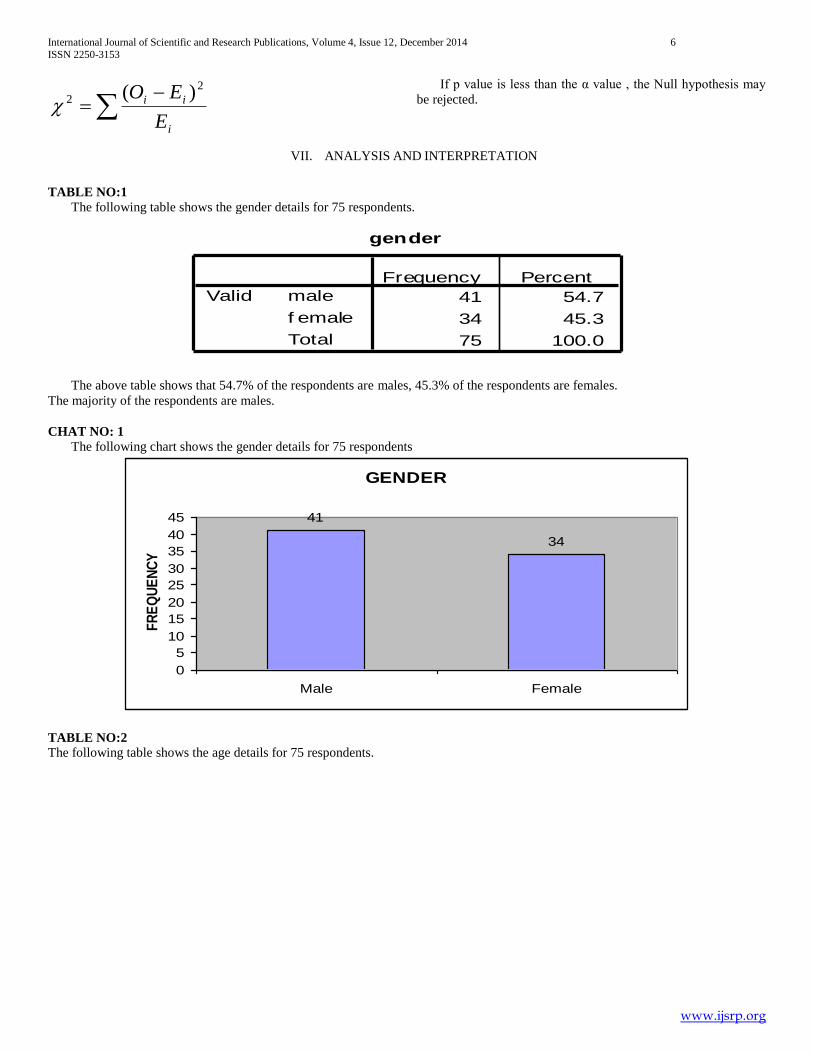
TABLE NO:1
The following table shows the gender details for 75 respondents.
gender
41 54.7
34 45.3
75 100.0
male
f emale
Total
Valid
Frequency Percent
The above table shows that 54.7% of the respondents are males, 45.3% of the respondents are females.
The majority of the respondents are males.
CHAT NO: 1
The following chart shows the gender details for 75 respondents
GENDER
41
34
0
5
10
15
20
25
30
35
40
45
Male Female
FR
EQ
UE
NC
Y
TABLE NO:2
The following table shows the age details for 75 respondents.

International Journal of Scientific and Research Publications, Volume 4, Issue 12, December 2014 7
ISSN 2250-3153
www.ijsrp.org
age
6 8.0
48 64.0
20 26.7
1 1.3
75 100.0
<20
20-40
40-60
>60
Total
Valid
Frequency Percent
The following table shows that 8% of the respondents belongs to the age group below 20 years, 64% of the respondents belong to
the age group of 20-40 years, 26.7% of the respondents are belong to the age group 40-60, and 1.3% of the respondents belong to the
age group above 60 years.
The majority of the respondents are in the age group of 20-40 years.
CHART NO: 2
The following table shows the age details for the 75 respondents.
AGE
0
6
48
20
1
0
10
20
30
40
50
60
Age <20 20 - 40 40 - 60 >60
freq
uen
cy
TABLE NO: 3
The following table shows the marital status for 75 respondents.

International Journal of Scientific and Research Publications, Volume 4, Issue 12, December 2014 8
ISSN 2250-3153
www.ijsrp.org
marital status
38 50.7
37 49.3
75 100.0
married
unmarried
Total
Valid
Frequency Percent
The above table shows that 50.7% of the respondents were married and 49.3% of the respondents were unmarried.
The majority of the respondents are married people.
CHART NO:3
The following chart shows the marital status for 75 respondents.
MARITAL STATUS
Married, 38Unmarried, 37
TABLE NO: 4
The following table shows the educational qualification of the respondents.
educational quali fication
11 14.7
31 41.3
19 25.3
14 18.7
75 100.0
sslc
under graduate
post graduate
others
Total
Valid
Frequency Percent

International Journal of Scientific and Research Publications, Volume 4, Issue 12, December 2014 9
ISSN 2250-3153
www.ijsrp.org
The above table shows that the 14.7% of the respondents belongs to SSLC, 41.3% of the respondents belongs to under graduates,
25.3% of the respondents are belongs to post graduates, & 18.7 percentage of the respondents belongs to other streams.
The majority of the respondents are under graduates.
CHART NO: 4
The following chart shows the details of educational qualification of the respondents.
EDUCATIONAL QUALIFICATION
11
31
19
14
0
5
10
15
20
25
30
35
sslc ug pg others
Fre
qu
en
cy
TABLE NO: 5
The following table shows the occupation details of the 75 respondents.
occupation
15 20.0
15 20.0
16 21.3
15 20.0
14 18.7
75 100.0
student
private
government
business
others
Total
Valid
Frequency Percent
The above table shows that 20% of the respondents are students, 20 % of the respondents are private working people, 21.3% of
the respondents are working in government sector, 20% of the people are doing business & 18.7% of the respondents are in other jobs.
The majority of the respondents are government sector people.
CHART NO: 5
The following table shows the occupation details of the 75 respondents.
International Journal of Scientific and Research Publications, Volume 4, Issue 12, December 2014 10
ISSN 2250-3153
www.ijsrp.org
occupation
0
15 15 16 1514
02468
1012141618
occu
patio
n
stud
ent
priva
te
gove
rnm
ent
busin
ess
othe
rs
freq
uen
cy
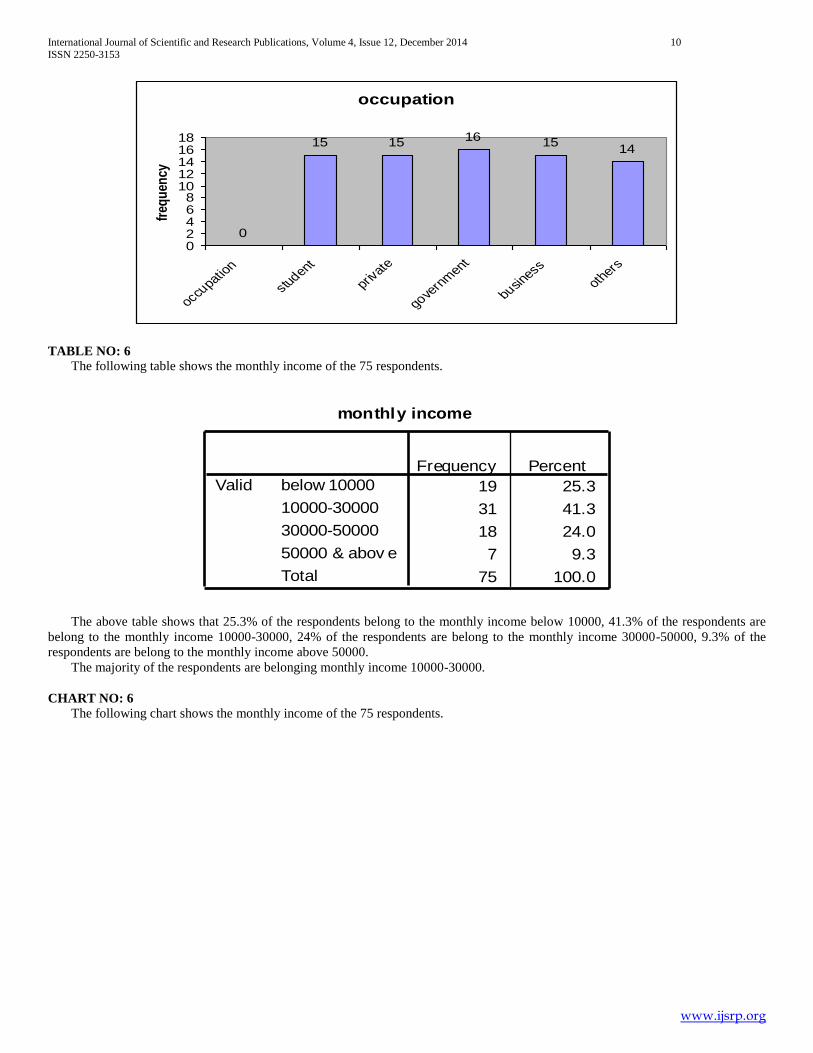
TABLE NO: 6
The following table shows the monthly income of the 75 respondents.
monthly income
19 25.3
31 41.3
18 24.0
7 9.3
75 100.0
below 10000
10000-30000
30000-50000
50000 & abov e
Total
Valid
Frequency Percent
The above table shows that 25.3% of the respondents belong to the monthly income below 10000, 41.3% of the respondents are
belong to the monthly income 10000-30000, 24% of the respondents are belong to the monthly income 30000-50000, 9.3% of the
respondents are belong to the monthly income above 50000.
The majority of the respondents are belonging monthly income 10000-30000.
CHART NO: 6
The following chart shows the monthly income of the 75 respondents.

International Journal of Scientific and Research Publications, Volume 4, Issue 12, December 2014 11
ISSN 2250-3153
www.ijsrp.org
MONTHLY INCOME
19
31
18
7
0
5
10
15
20
25
30
35
below 10000 10000-30000 30000-50000 50000 & above
freq
uen
cy
TABLE NO: 7
The following table shows the residence of the 75 respondents.
area
25 33.3
50 66.7
75 100.0
rural
urban
Total
Valid
Frequency Percent
The above table shows that 33.3% of the respondents were rural area and 66.7% of the respondents were urban area.
The majority of the respondents are belonging urban area.
CHART NO: 7
The following chart shows the residence of the 75 respondents.

International Journal of Scientific and Research Publications, Volume 4, Issue 12, December 2014 12
ISSN 2250-3153
www.ijsrp.org
frequency
rural, 25
urban, 50
TABLE NO: 8
The following table shows the purpose of traveling of the 75 respondents.
purpose of travelling
16 21.3
30 40.0
16 21.3
13 17.3
75 100.0
business
personal/vocation
eduation
others
Total
Valid
Frequency Percent
The above table shows that 21.3% of the respondents are travelling for the purpose of business, 40% of the respondents are
travelling for the purpose of personal/vocation 21.3% of the respondents are travelling for the purpose of education and 13% of the
respondents are traveling for other purposes .
The majority of the respondents are travelling for the purpose of personal/vocation.
CHART NO: 8
The following chart shows the purpose of traveling of the 75 respondents.

International Journal of Scientific and Research Publications, Volume 4, Issue 12, December 2014 13
ISSN 2250-3153
www.ijsrp.org
PURPOSE OF TRAVELLING
business, 16
personal/voca
tion, 30
education, 16
others, 13
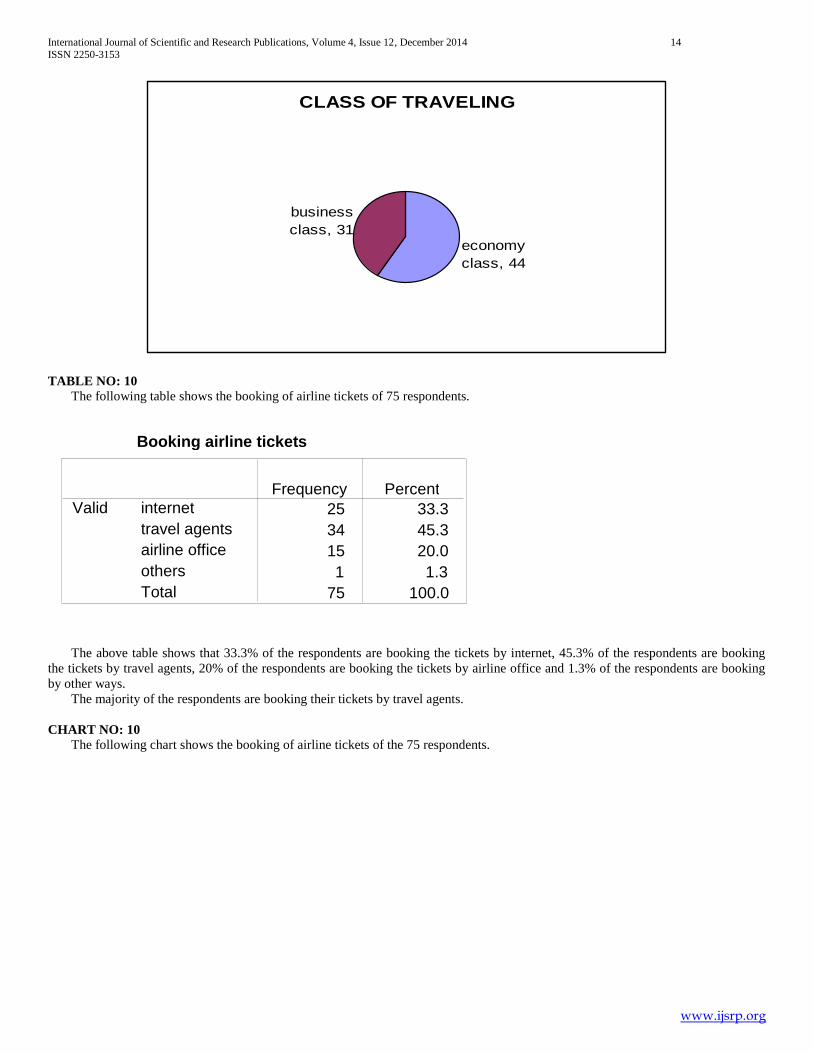
TABLE NO: 9
The following table shows the class in which the respondents are travelling.
class of travel ling
44 58.7
31 41.3
75 100.0
economy class
business class
Total
Valid
Frequency Percent
The above table shows that 58.7% of the respondents are travelling in economy class and 41.3% of the respondents are travelling
in business class.
The majority of the respondents are travelling in economy class.
CHART NO: 9
The following chart shows the class in which the respondents are travelling.
International Journal of Scientific and Research Publications, Volume 4, Issue 12, December 2014 14
ISSN 2250-3153
www.ijsrp.org
CLASS OF TRAVELING
economy
class, 44
business
class, 31
TABLE NO: 10
The following table shows the booking of airline tickets of 75 respondents.
The above table shows that 33.3% of the respondents are booking the tickets by internet, 45.3% of the respondents are booking
the tickets by travel agents, 20% of the respondents are booking the tickets by airline office and 1.3% of the respondents are booking
by other ways.
The majority of the respondents are booking their tickets by travel agents.
CHART NO: 10
The following chart shows the booking of airline tickets of the 75 respondents.
Booking airline tickets
25 33.3
34 45.3
15 20.0
1 1.3
75 100.0
internet
travel agents
airline office
others
Total
Valid
Frequency Percent

International Journal of Scientific and Research Publications, Volume 4, Issue 12, December 2014 15
ISSN 2250-3153
www.ijsrp.org
BOOKING OF AIR TICKETS
25
34
15
1
0
5
10
15
20
25
30
35
40
internet travel agents airline office others
freq
uen
cy
TABLE NO: 11
The following table shows the number of times the respondents travel by air during last year.
The above table shows that 14.7% of the respondents are travelled once during the last year, 53.3% of the respondents are
travelled 2-5 times in the last year, 22.7% of the respondents are travel 6-10 times in the last year, 5.3% of the respondents are
travelled more than 20times in the last year.
The majority of the respondents are travelled 2-5 times by air in the last year.
CHART NO: 11
The following chart shows the number of times travel by air during last year of the 75 respondents.
Number of times travelled during last year
11 14.7
40 53.3
17 22.7
3 4.0
4 5.3
75 100.0
1
2-5
6-10
10-20
20 & above
Total
Valid
Frequency Percent
International Journal of Scientific and Research Publications, Volume 4, Issue 12, December 2014 16
ISSN 2250-3153
www.ijsrp.org
NUMBER OF TIMES TRAVEL BY AIR
DURING LAST YEAR
11
40
17
3 4
0
10
20
30
40
50
1 2-5 6-10 10-20 20 & above
freq
uen
cy
TABLE NO: 12
The following table shows the satisfaction level of the price of the airline selected.
rating the price of the airline
5 6.7
36 48.0
33 44.0
1 1.3
75 100.0
very high
high
moderate
very low
Total
Valid
Frequency Percent
The above table shows that 6.7% of the respondents are rate that the price of the airline is very high, 48% of the respondents are
rate that the price of the airline is high, 44% of the respondents are rate that the price of the airline is moderate & 1.3% of the
respondents are rate that the price of the airline is very low.
The majority of the respondents are rate that the price of the airline is high.
CHART NO: 12
The following chart shows the satisfaction level of the price of the airline selected.

International Journal of Scientific and Research Publications, Volume 4, Issue 12, December 2014 17
ISSN 2250-3153
www.ijsrp.org
PRICE OF THE AIRLINE
5
3633
1
0
5
10
15
20
25
30
35
40
very high high moderate very low
freq
uen
cy
TABLE NO: 13
The following table shows the satisfaction level of the quality & service of the airline selected.
The above table shows that 12% of the respondents are highly satisfied with the quality and service provided by the airlines,
78.7% of the respondents are satisfied with the quality and service provided by the airlines, 8% of the respondents are feeling
moderate with the quality and service provided by the airlines, 1.3% of the respondents are highly dissatisfied with the quality and
service provided by the airlines,
The majority of the respondents are satisfied with the quality and service provided by the airlines.
CHART NO: 13
The following chart shows the satisfaction level of the quality & service of the airline selected.
Rating the quality and service of the airline
9 12.0
59 78.7
6 8.0
1 1.3
75 100.0
highly satisfied
satisfied
moderate
highly dissatisfied
Total
Valid Frequency Percent

International Journal of Scientific and Research Publications, Volume 4, Issue 12, December 2014 18
ISSN 2250-3153
www.ijsrp.org
QUALITY AND SERVICE OF THE AIRLINES
5
3633
1
0
5
10
15
20
25
30
35
40
very high high moderate very low
freq
uen
cy
TABLE NO: 14
The following table shows the safety of the airline selected.
rating the safety of the airline
12 16.0
50 66.7
12 16.0
1 1.3
75 100.0
highly satisf ied
satisf ied
moderate
highly dissatisf ied
Total
Valid
Frequency Percent
The above table shows that 16% of the respondents are highly satisfied with the safety provided by the airlines, 78.7% of the
respondents are satisfied with the safety provided by the airlines, 8% of the respondents are feeling moderate with the safety provided
by the airlines, 1.3% of the respondents are highly dissatisfied with the safety provided by the airlines.
The majority of the respondents are satisfied with the safety provided by the airlines.
CHART NO: 14
The following chart shows the safety of the airline selected.
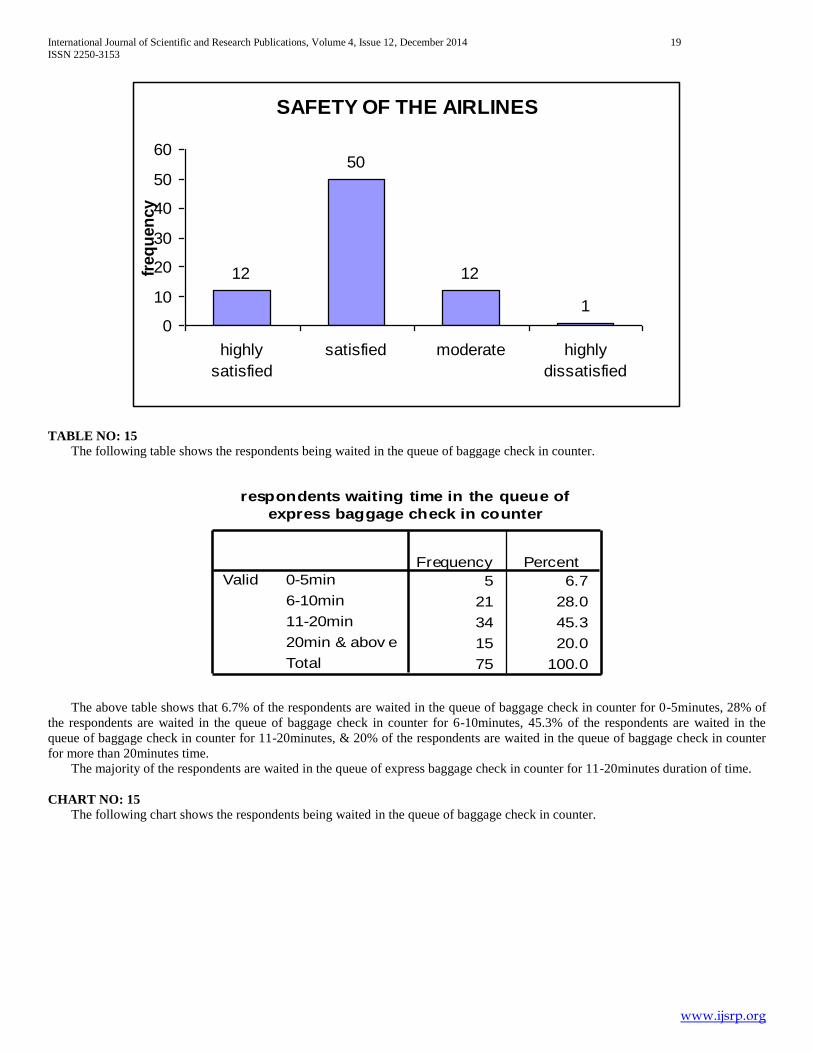
International Journal of Scientific and Research Publications, Volume 4, Issue 12, December 2014 19
ISSN 2250-3153
www.ijsrp.org
SAFETY OF THE AIRLINES
12
50
12
1
0
10
20
30
40
50
60
highly
satisfied
satisfied moderate highly
dissatisfied
freq
uen
cy
TABLE NO: 15
The following table shows the respondents being waited in the queue of baggage check in counter.
respondents waiting time in the queue of
express baggage check in counter
5 6.7
21 28.0
34 45.3
15 20.0
75 100.0
0-5min
6-10min
11-20min
20min & abov e
Total
Valid
Frequency Percent
The above table shows that 6.7% of the respondents are waited in the queue of baggage check in counter for 0-5minutes, 28% of
the respondents are waited in the queue of baggage check in counter for 6-10minutes, 45.3% of the respondents are waited in the
queue of baggage check in counter for 11-20minutes, & 20% of the respondents are waited in the queue of baggage check in counter
for more than 20minutes time.
The majority of the respondents are waited in the queue of express baggage check in counter for 11-20minutes duration of time.
CHART NO: 15
The following chart shows the respondents being waited in the queue of baggage check in counter.
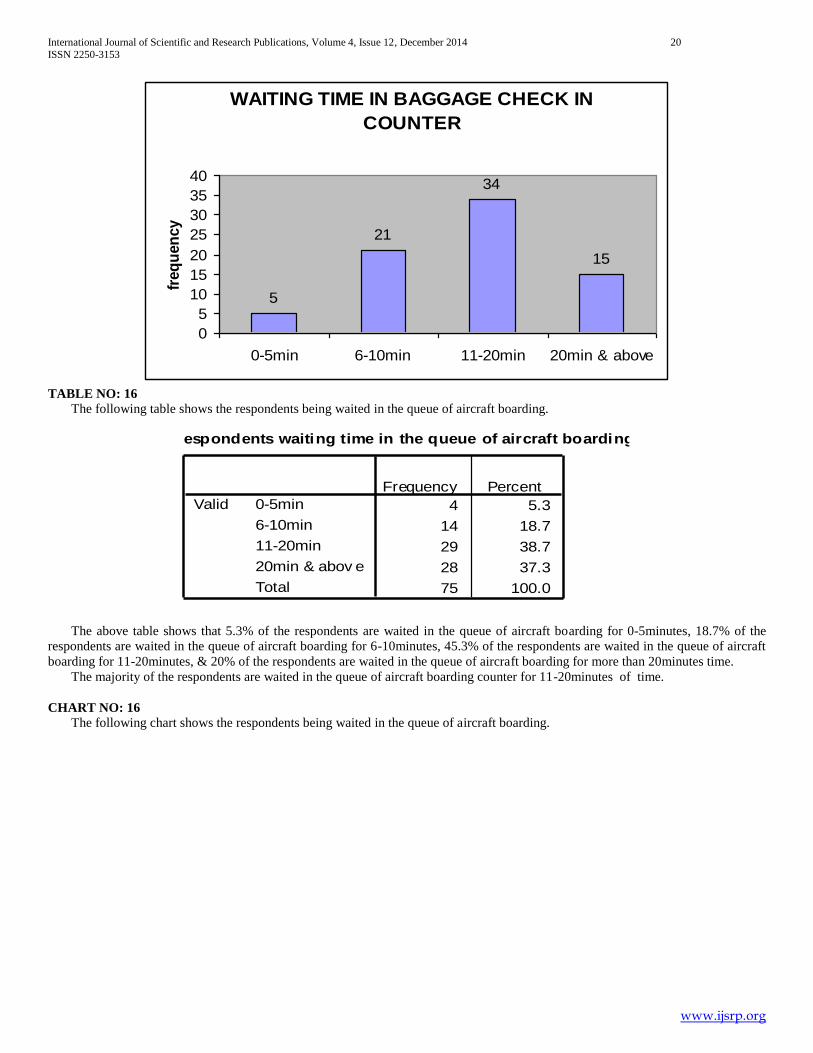
International Journal of Scientific and Research Publications, Volume 4, Issue 12, December 2014 20
ISSN 2250-3153
www.ijsrp.org
WAITING TIME IN BAGGAGE CHECK IN
COUNTER
5
21
34
15
0
5
10
15
20
25
30
35
40
0-5min 6-10min 11-20min 20min & above
freq
uen
cy
TABLE NO: 16
The following table shows the respondents being waited in the queue of aircraft boarding.
respondents waiting time in the queue of aircraft boarding
4 5.3
14 18.7
29 38.7
28 37.3
75 100.0
0-5min
6-10min
11-20min
20min & abov e
Total
Valid
Frequency Percent
The above table shows that 5.3% of the respondents are waited in the queue of aircraft boarding for 0-5minutes, 18.7% of the
respondents are waited in the queue of aircraft boarding for 6-10minutes, 45.3% of the respondents are waited in the queue of aircraft
boarding for 11-20minutes, & 20% of the respondents are waited in the queue of aircraft boarding for more than 20minutes time.
The majority of the respondents are waited in the queue of aircraft boarding counter for 11-20minutes of time.
CHART NO: 16
The following chart shows the respondents being waited in the queue of aircraft boarding.

International Journal of Scientific and Research Publications, Volume 4, Issue 12, December 2014 21
ISSN 2250-3153
www.ijsrp.org
AIRCRAFT BOARDING WAITING TIME
4
14
29 28
0
5
10
15
20
25
30
35
0-5min 6-10min 11-20min 20min & above
freq
uen
cy
TABLE NO: 17
The following table shows the respondents being waited in the queue of security check point.
respondents waiting time in the queue of
security check point
8 10.7
31 41.3
20 26.7
16 21.3
75 100.0
0-5min
6-10min
11-20min
20min & abov e
Total
Valid
Frequency Percent
The above table shows that 10.7% of the respondents are waited in the queue of security check point for 0-5minutes, 41.3% of the
respondents are waited in the queue of security check point for 6-10minutes, 26.7% of the respondents are waited in the queue of
security check point for 11-20minutes, & 21.3% of the respondents are waited in the queue of security check point for more than
20minutes time.
The majority of the respondents are waited in the queue of security check point counter for 6-10minutes duration of time.
CHART NO: 17
The following chart shows the respondents being waited in the queue of aircraft boarding.

International Journal of Scientific and Research Publications, Volume 4, Issue 12, December 2014 22
ISSN 2250-3153
www.ijsrp.org
WAITING TIME IN SECURITY CHECK POINT
8
31
20
16
0
5
10
15
20
25
30
35
0-5min 6-10min 11-20min 20min & above
freq
uen
cy
TABLE NO: 18
The following table shows how much important the departure or arrival time while making a decision to choose the airline.
importance of departure & arrival time
5 6.7
32 42.7
38 50.7
75 100.0
not at all important
somewhat important
very important
Total
Valid
Frequency Percent
The above table shows that 6.7% of the respondents are think that the departure or arrival time was not at all important, 42.7% of
the respondents are think that the departure or arrival time was somewhat important, & 50.7% of the respondents are think that the
departure or arrival time was very important.
The majority of the respondents are think that the departure or arrival time was very important while making a decision to choose
the airline.
CHART NO: 18
The following chart shows how much important the departure or arrival time while making a decision to choose the airline.

International Journal of Scientific and Research Publications, Volume 4, Issue 12, December 2014 23
ISSN 2250-3153
www.ijsrp.org
DEPARTURE OR ARRIVAL TIME
not at all
important, 5
somewhat
important, 32
very
important, 38
TABLE NO: 19
The following table shows how much important the stops of the flight while making a decision to choose the airline.
importance of stops or better connections of the fl ights
10 13.3
28 37.3
37 49.3
75 100.0
not at all important
somewhat important
very important
Total
Valid
Frequency Percent
The above table shows that 13.3% of the respondents are think that the fewer stops of flight and better connection was not at all
important, 37.3% of the respondents are think that the fewer stops of flight and better connection was somewhat important, & 49.3%
of the respondents are think that the fewer stops of flight and better connection was very important.
The majority of the respondents are think that the fewer stops of flight and better connection was very important while making a
decision to choose the airline.
CHART NO: 19
The following chart shows how much important the stops of the flight while making a decision to choose the airline.
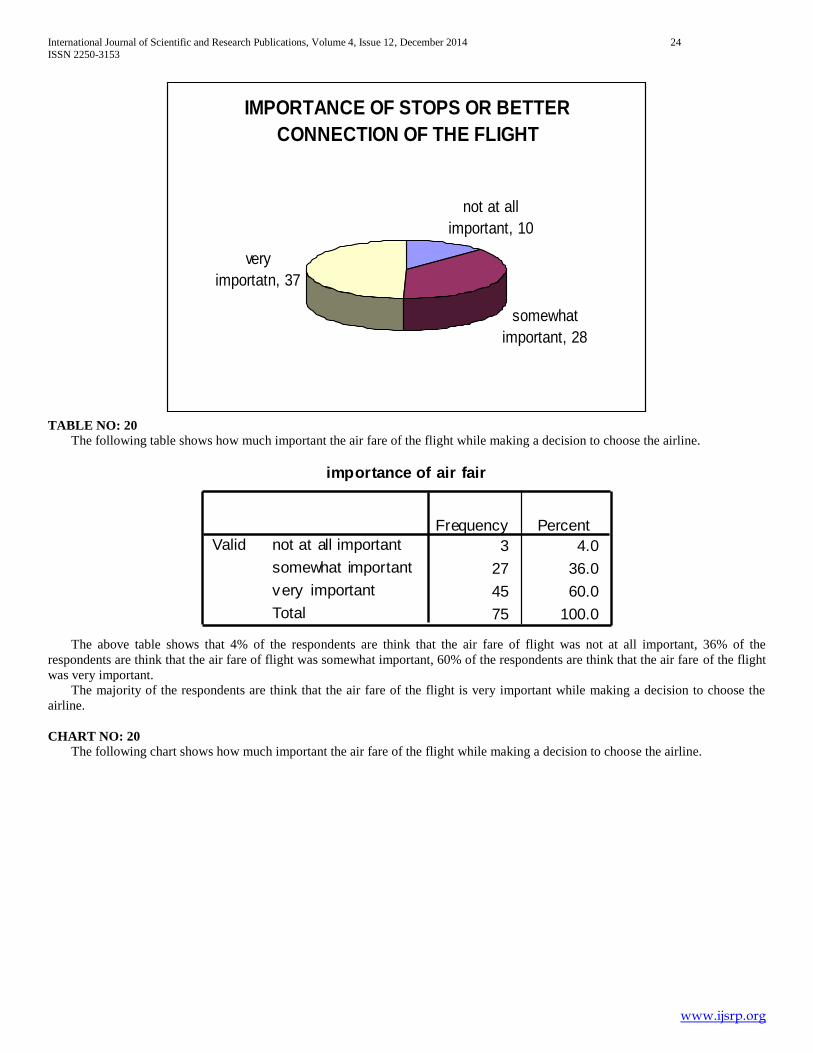
International Journal of Scientific and Research Publications, Volume 4, Issue 12, December 2014 24
ISSN 2250-3153
www.ijsrp.org
IMPORTANCE OF STOPS OR BETTER
CONNECTION OF THE FLIGHT
not at all
important, 10
somewhat
important, 28
very
importatn, 37
TABLE NO: 20
The following table shows how much important the air fare of the flight while making a decision to choose the airline.
importance of air fair
3 4.0
27 36.0
45 60.0
75 100.0
not at all important
somewhat important
very important
Total
Valid
Frequency Percent
The above table shows that 4% of the respondents are think that the air fare of flight was not at all important, 36% of the
respondents are think that the air fare of flight was somewhat important, 60% of the respondents are think that the air fare of the flight
was very important.
The majority of the respondents are think that the air fare of the flight is very important while making a decision to choose the
airline.
CHART NO: 20
The following chart shows how much important the air fare of the flight while making a decision to choose the airline.
International Journal of Scientific and Research Publications, Volume 4, Issue 12, December 2014 25
ISSN 2250-3153
www.ijsrp.org
IMPORTANCE OF AIR FARE
not at all
important, 3
somewhat
important, 27
very
importatn, 45
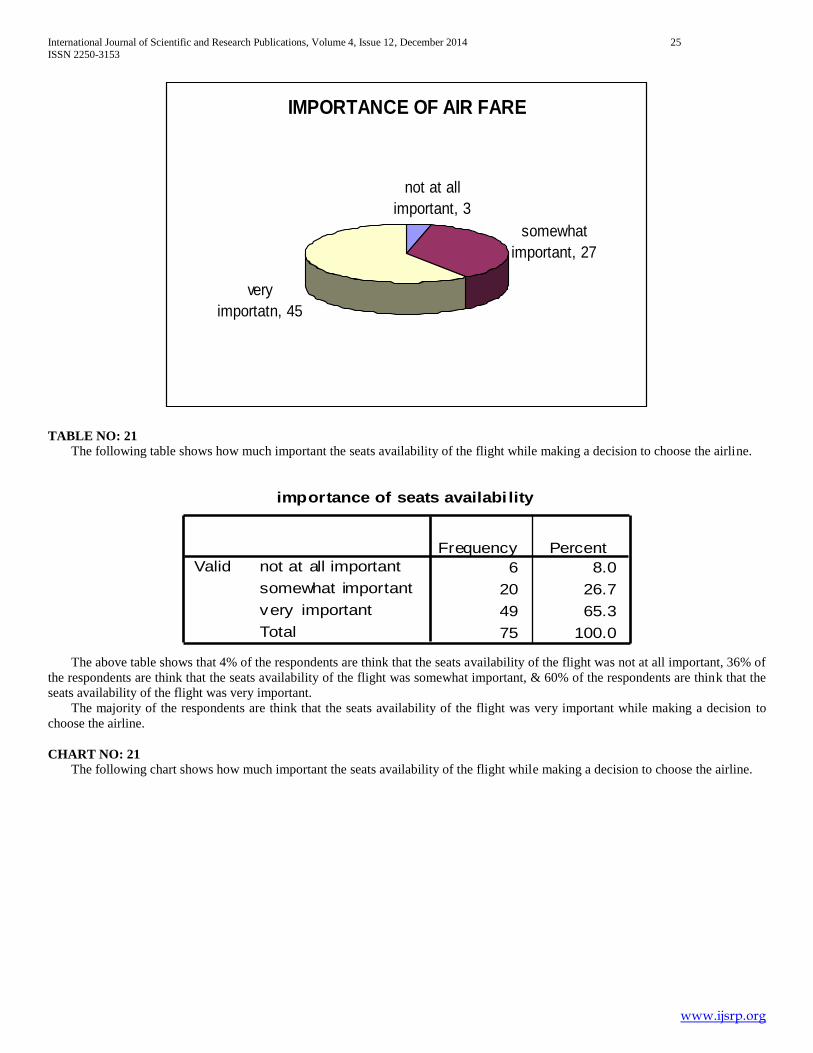
TABLE NO: 21
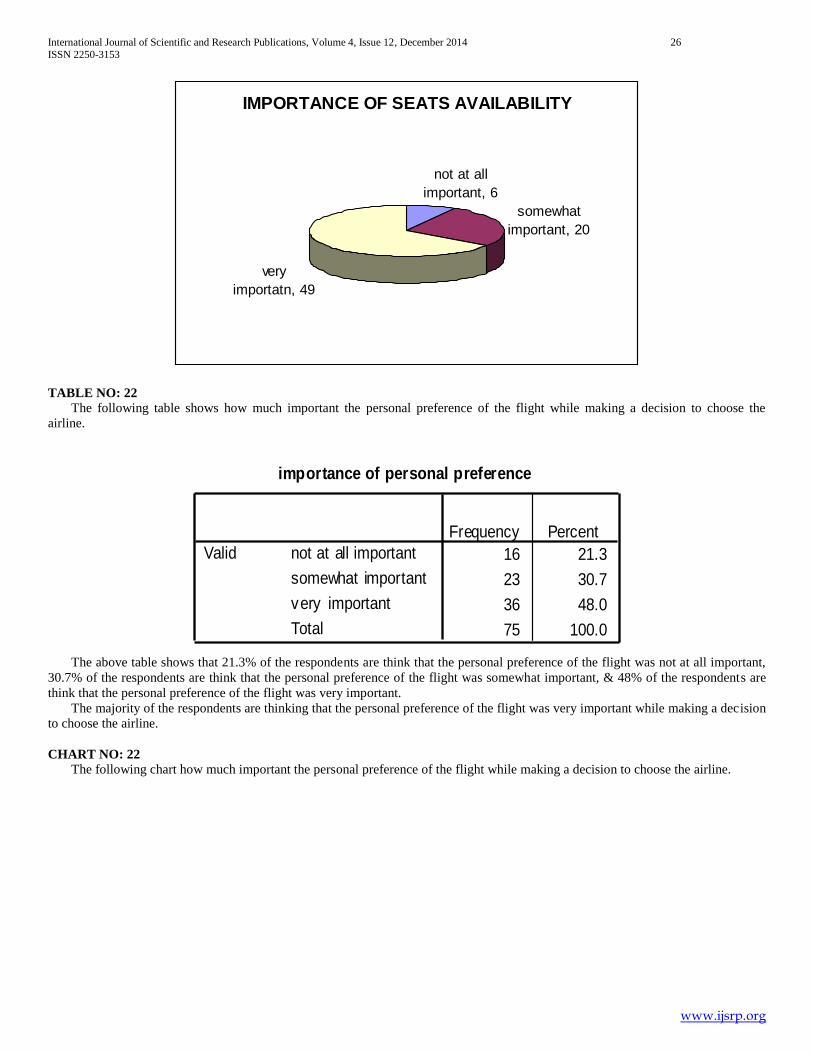
The following table shows how much important the seats availability of the flight while making a decision to choose the airline.
importance of seats availabi lity
6 8.0
20 26.7
49 65.3
75 100.0
not at all important
somewhat important
very important
Total
Valid
Frequency Percent
The above table shows that 4% of the respondents are think that the seats availability of the flight was not at all important, 36% of
the respondents are think that the seats availability of the flight was somewhat important, & 60% of the respondents are think that the
seats availability of the flight was very important.
The majority of the respondents are think that the seats availability of the flight was very important while making a decision to
choose the airline.
CHART NO: 21
The following chart shows how much important the seats availability of the flight while making a decision to choose the airline.
International Journal of Scientific and Research Publications, Volume 4, Issue 12, December 2014 26
ISSN 2250-3153
www.ijsrp.org
IMPORTANCE OF SEATS AVAILABILITY
not at all
important, 6
somewhat
important, 20
very
importatn, 49
TABLE NO: 22
The following table shows how much important the personal preference of the flight while making a decision to choose the
airline.
importance of personal preference
16 21.3
23 30.7
36 48.0
75 100.0
not at all important
somewhat important
very important
Total
Valid
Frequency Percent
The above table shows that 21.3% of the respondents are think that the personal preference of the flight was not at all important,
30.7% of the respondents are think that the personal preference of the flight was somewhat important, & 48% of the respondents are
think that the personal preference of the flight was very important.
The majority of the respondents are thinking that the personal preference of the flight was very important while making a decision
to choose the airline.
CHART NO: 22
The following chart how much important the personal preference of the flight while making a decision to choose the airline.

International Journal of Scientific and Research Publications, Volume 4, Issue 12, December 2014 27
ISSN 2250-3153
www.ijsrp.org
IMPORTANCE OF PERSONAL
PREFERENCE
not at all
important, 16
somewhat
important, 23
very
importatn, 36
TABLE NO: 23
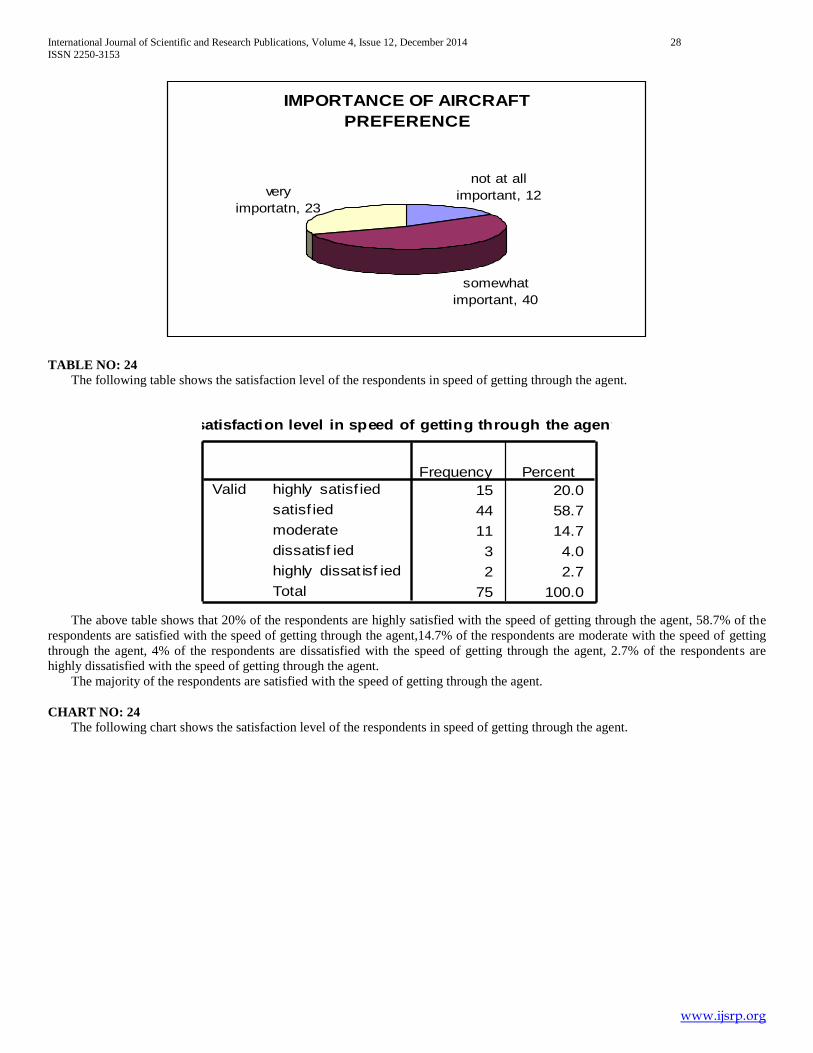
The following table shows how much important the aircraft preference of the flight while making a decision to choose the airline.
importance of aircraft preference
12 16.0
40 53.3
23 30.7
75 100.0
not at all important
somewhat important
very important
Total
Valid
Frequency Percent
The above table shows that 16% of the respondents are think that the aircraft preference of the flight was not at all important,
53.3% of the respondents are think that the aircraft preference of the flight was somewhat important, & 30.7% of the respondents are
think that the aircraft preference of the flight was very important.
The majority of the respondents are think that the aircraft preference of the flight was very important while making a decision to
choose the airline.
CHART NO: 23
The following chart shows how much important the aircraft preference of the flight while making a decision to choose the airline.
International Journal of Scientific and Research Publications, Volume 4, Issue 12, December 2014 28
ISSN 2250-3153
www.ijsrp.org
IMPORTANCE OF AIRCRAFT
PREFERENCE
not at all
important, 12
somewhat
important, 40
very
importatn, 23
TABLE NO: 24
The following table shows the satisfaction level of the respondents in speed of getting through the agent.
satisfaction level in speed of getting through the agent
15 20.0
44 58.7
11 14.7
3 4.0
2 2.7
75 100.0
highly satisf ied
satisf ied
moderate
dissatisf ied
highly dissat isf ied
Total
Valid
Frequency Percent
The above table shows that 20% of the respondents are highly satisfied with the speed of getting through the agent, 58.7% of the
respondents are satisfied with the speed of getting through the agent,14.7% of the respondents are moderate with the speed of getting
through the agent, 4% of the respondents are dissatisfied with the speed of getting through the agent, 2.7% of the respondents are
highly dissatisfied with the speed of getting through the agent.
The majority of the respondents are satisfied with the speed of getting through the agent.
CHART NO: 24
The following chart shows the satisfaction level of the respondents in speed of getting through the agent.

International Journal of Scientific and Research Publications, Volume 4, Issue 12, December 2014 29
ISSN 2250-3153
www.ijsrp.org
SATISFACTION LEVEL IN SPEED OF
GETTING THROUGH THE AGENT
15
44
113 2
0
10
20
30
40
50
hig
hly
satisfied
satisfied
modera
te
dis
satisfied
hig
hly
dis
satisfied
freq
uen
cy
TABLE NO: 25
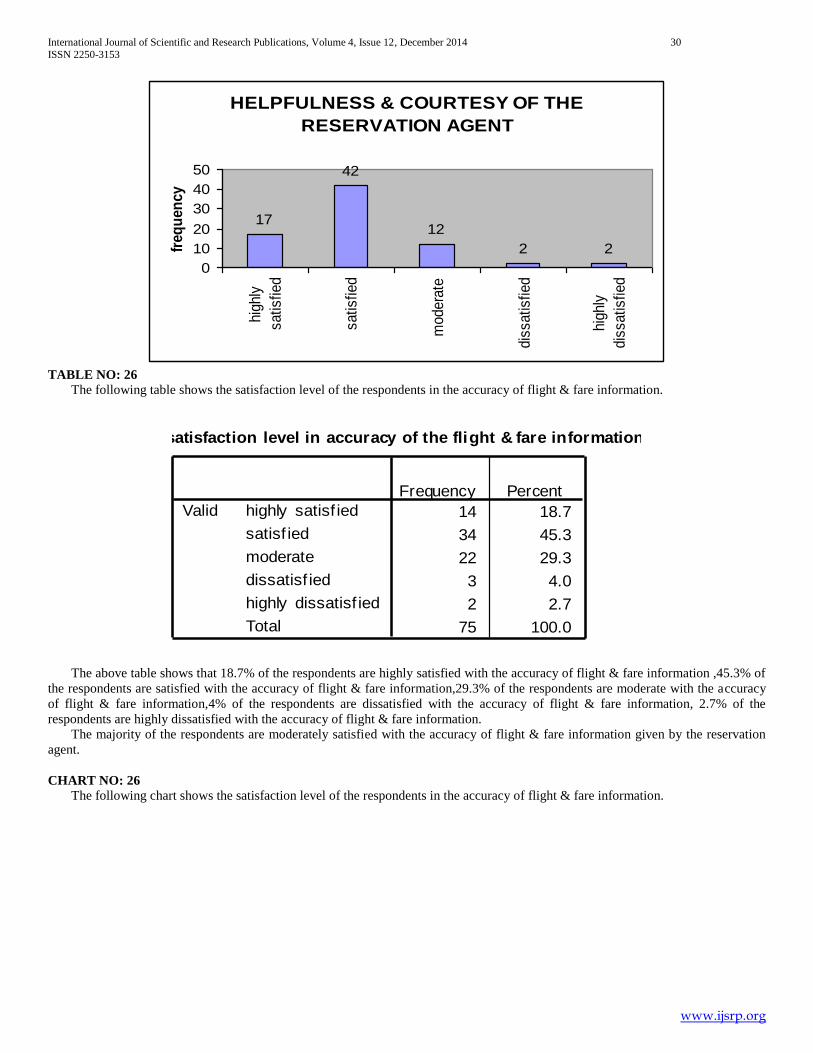
The following table shows the satisfaction level of the respondents in the helpfulness & courtesy of the reservation agent.
satisfaction level in helpfulness & courtesy of the
reservation agent
17 22.7
42 56.0
12 16.0
2 2.7
2 2.7
75 100.0
highly satisf ied
satisf ied
moderate
dissatisf ied
highly dissatisf ied
Total
Valid
Frequency Percent
The above table shows that 22.7% of the respondents are highly satisfied with the helpfulness & courtesy of the reservation
agent,56% of the respondents are satisfied with the helpfulness & courtesy of the reservation agent,16% of the respondents are
moderate with the helpfulness & courtesy of the reservation agent,2.7% of the respondents are dissatisfied with the helpfulness &
courtesy of the reservation agent, 2.7% of the respondents are highly dissatisfied with the helpfulness & courtesy of the reservation
agent.
The majority of the respondents are satisfied with the helpfulness & courtesy of the reservation agent.
CHART NO: 25
The following chart shows the satisfaction level of the respondents in the helpfulness & courtesy of the reservation agent.
International Journal of Scientific and Research Publications, Volume 4, Issue 12, December 2014 30
ISSN 2250-3153
www.ijsrp.org
HELPFULNESS & COURTESY OF THE
RESERVATION AGENT
17
42
12
2 2
0
10
20
30
40
50
hig
hly
satisfied
satisfied
modera
te
dis
satisfied
hig
hly
dis
satisfied
freq
uen
cy
TABLE NO: 26
The following table shows the satisfaction level of the respondents in the accuracy of flight & fare information.
satisfaction level in accuracy of the flight & fare information
14 18.7
34 45.3
22 29.3
3 4.0
2 2.7
75 100.0
highly satisf ied
satisf ied
moderate
dissatisf ied
highly dissatisf ied
Total
Valid
Frequency Percent
The above table shows that 18.7% of the respondents are highly satisfied with the accuracy of flight & fare information ,45.3% of
the respondents are satisfied with the accuracy of flight & fare information,29.3% of the respondents are moderate with the accuracy
of flight & fare information,4% of the respondents are dissatisfied with the accuracy of flight & fare information, 2.7% of the
respondents are highly dissatisfied with the accuracy of flight & fare information.
The majority of the respondents are moderately satisfied with the accuracy of flight & fare information given by the reservation
agent.
CHART NO: 26
The following chart shows the satisfaction level of the respondents in the accuracy of flight & fare information.

International Journal of Scientific and Research Publications, Volume 4, Issue 12, December 2014 31
ISSN 2250-3153
www.ijsrp.org
SATISFACTION LEVEL IN ACCURACY OF
FLIGHT & FARE INFORMATION
14
34
22
3 2
05
10152025303540
high
ly
satis
fied
satis
fied
mod
erat
e
diss
atis
fied
high
ly
diss
atis
fied
freq
uen
cy
TABLE NO: 27
The following table shows the satisfaction level of the respondents in the cabin cleanliness.
satisfaction level in cabin cleanliness/ cabin condition
19 25.3
44 58.7
8 10.7
2 2.7
2 2.7
75 100.0
highly satisf ied
satisf ied
moderate
dissatisf ied
highly dissatisf ied
Total
Valid
Frequency Percent
The above table shows that 25.3% of the respondents are highly satisfied with the cabin cleanliness,58.7% of the respondents are
satisfied with the cabin cleanliness,10.7% of the respondents are moderate with the cabin cleanliness,2.7% of the respondents are
dissatisfied with the cabin cleanliness, 2.7% of the respondents are highly dissatisfied with the cabin cleanliness.
The majority of the respondents are satisfied with the cabin cleanliness of the flight.
CHART NO: 27
The following chart shows the satisfaction level of the respondents in the cabin cleanliness.

International Journal of Scientific and Research Publications, Volume 4, Issue 12, December 2014 32
ISSN 2250-3153
www.ijsrp.org
SATISFACTION LEVEL IN CABIN
CLEANLINESS
19
44
82 2
0
10
20
30
40
50
hig
hly
satisfied
satisfied
modera
te
dis
satisfied
hig
hly
dis
satisfied
freq
uen
cy
TABLE NO: 28
The following table shows the satisfaction level of the respondents in the in-flight entertainment.
satisfaction level in in-fl ight entertainment(movies,
magazine, etc)
12 16.0
38 50.7
18 24.0
4 5.3
3 4.0
75 100.0
highly satisf ied
satisf ied
moderate
dissatisf ied
highly dissatisf ied
Total
Valid
Frequency Percent
The above table shows that 16% of the respondents are highly satisfied with the in-flight entertainment,50.7% of the respondents
are satisfied with the in-flight entertainment,24% of the respondents are moderate with the in-flight entertainment,5.3% of the
respondents are dissatisfied with the in-flight entertainment, 4% of the respondents are highly dissatisfied with the in-flight
entertainment.
The majority of the respondents are satisfied with the in-flight entertainment of the flight.
CHART NO: 28
The following chart shows the satisfaction level of the respondents in the in-flight entertainment.
International Journal of Scientific and Research Publications, Volume 4, Issue 12, December 2014 33
ISSN 2250-3153
www.ijsrp.org
SATISFACTION LEVEL IN IN-FLIGHT
ENTERTAINMENT
12
38
18
4 3
05
10152025303540
hig
hly
satisfied
satisfied
modera
te
dis
satisfied
hig
hly
dis
satisfied
freq
uen
cy
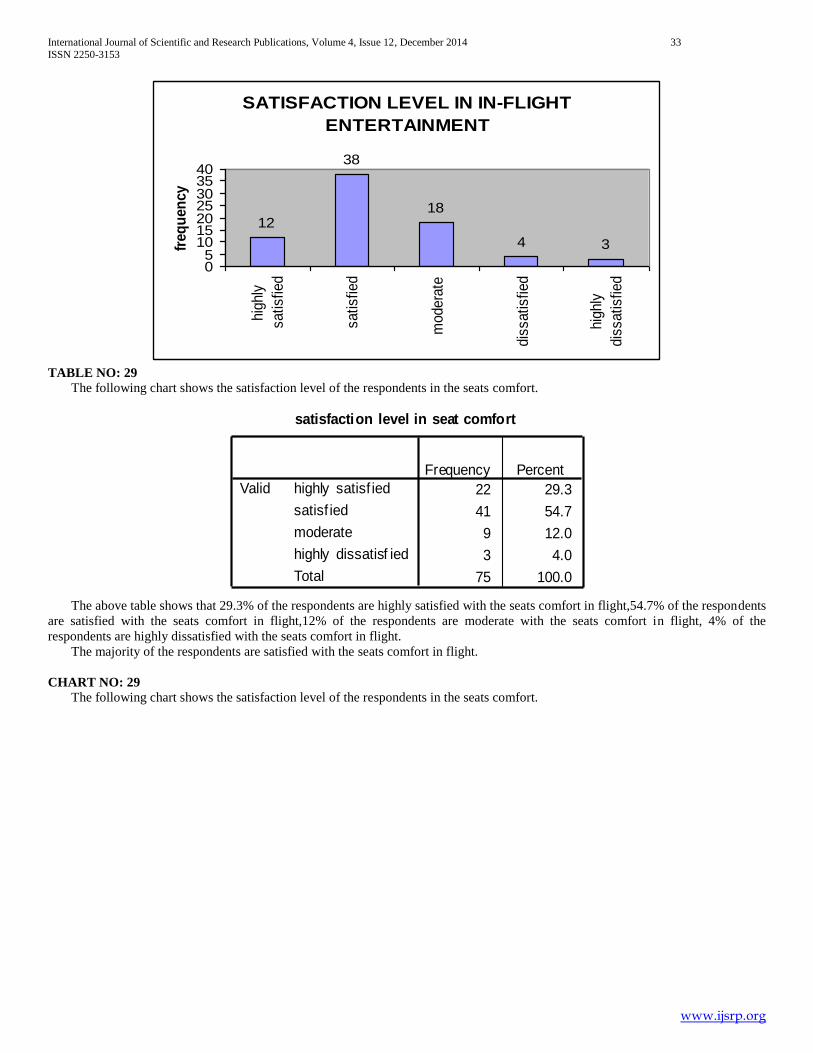
TABLE NO: 29
The following chart shows the satisfaction level of the respondents in the seats comfort.
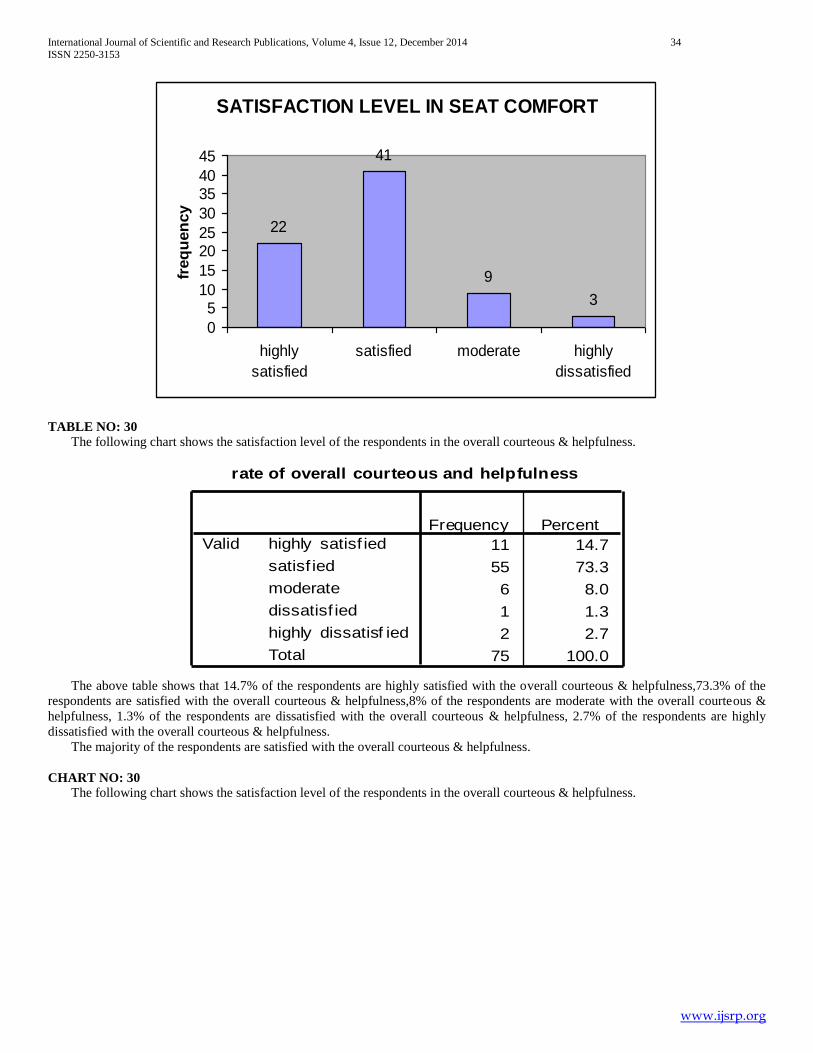
satisfaction level in seat comfort
22 29.3
41 54.7
9 12.0
3 4.0
75 100.0
highly satisf ied
satisf ied
moderate
highly dissatisf ied
Total
Valid
Frequency Percent
The above table shows that 29.3% of the respondents are highly satisfied with the seats comfort in flight,54.7% of the respondents
are satisfied with the seats comfort in flight,12% of the respondents are moderate with the seats comfort in flight, 4% of the
respondents are highly dissatisfied with the seats comfort in flight.
The majority of the respondents are satisfied with the seats comfort in flight.
CHART NO: 29
The following chart shows the satisfaction level of the respondents in the seats comfort.
International Journal of Scientific and Research Publications, Volume 4, Issue 12, December 2014 34
ISSN 2250-3153
www.ijsrp.org
SATISFACTION LEVEL IN SEAT COMFORT
22
41
9
3
0
510
15
2025
30
3540
45
highly
satisfied
satisfied moderate highly
dissatisfied
freq
uen
cy
TABLE NO: 30
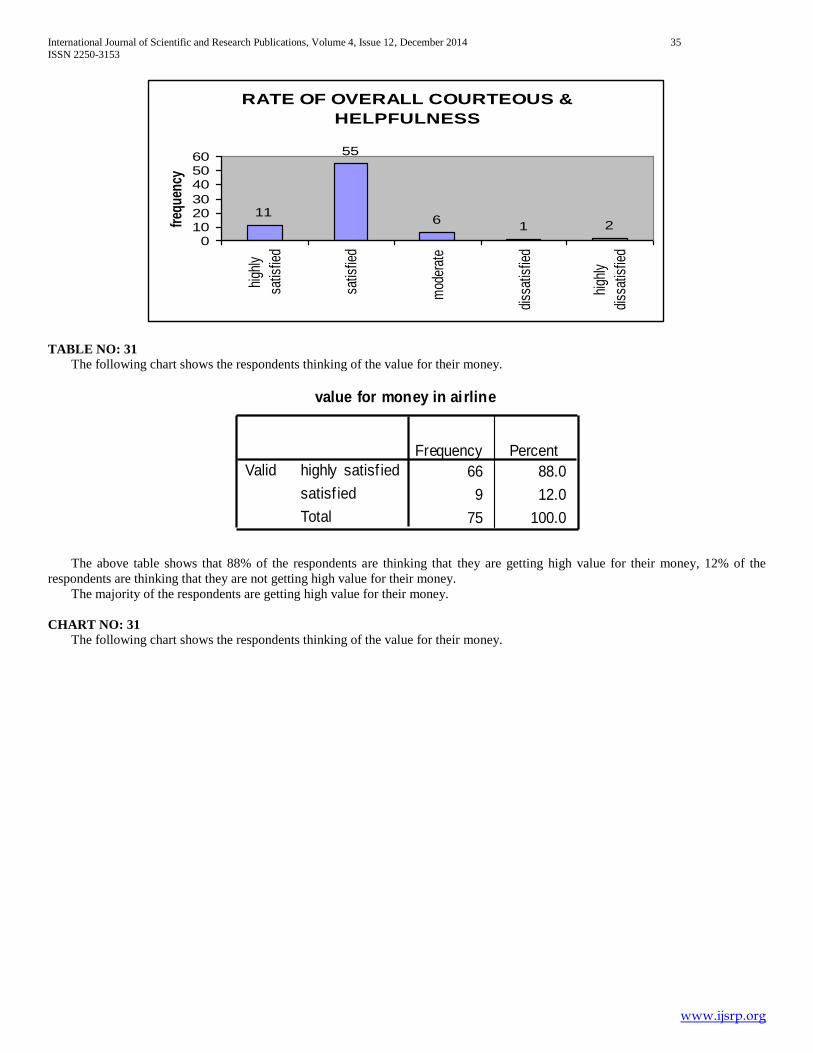
The following chart shows the satisfaction level of the respondents in the overall courteous & helpfulness.
rate of overall courteous and helpfulness
11 14.7
55 73.3
6 8.0
1 1.3
2 2.7
75 100.0
highly satisf ied
satisf ied
moderate
dissatisf ied
highly dissatisf ied
Total
Valid
Frequency Percent
The above table shows that 14.7% of the respondents are highly satisfied with the overall courteous & helpfulness,73.3% of the
respondents are satisfied with the overall courteous & helpfulness,8% of the respondents are moderate with the overall courteous &
helpfulness, 1.3% of the respondents are dissatisfied with the overall courteous & helpfulness, 2.7% of the respondents are highly
dissatisfied with the overall courteous & helpfulness.
The majority of the respondents are satisfied with the overall courteous & helpfulness.
CHART NO: 30
The following chart shows the satisfaction level of the respondents in the overall courteous & helpfulness.
International Journal of Scientific and Research Publications, Volume 4, Issue 12, December 2014 35
ISSN 2250-3153
www.ijsrp.org
RATE OF OVERALL COURTEOUS &
HELPFULNESS
11
55
61 2
0102030
405060
high
ly
satis
fied
satis
fied
mod
erat
e
diss
atis
fied
high
ly
diss
atis
fied
freq
uen
cy
TABLE NO: 31
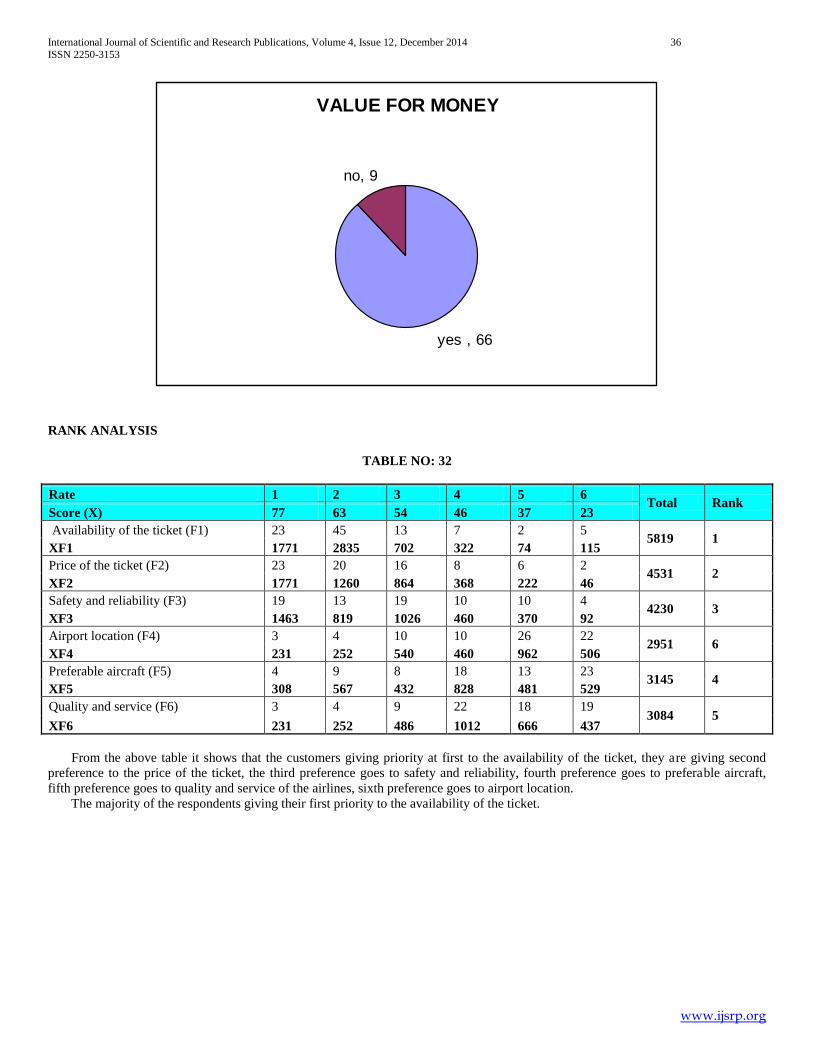
The following chart shows the respondents thinking of the value for their money.
value for money in airline
66 88.0
9 12.0
75 100.0
highly satisf ied
satisf ied
Total
Valid
Frequency Percent
The above table shows that 88% of the respondents are thinking that they are getting high value for their money, 12% of the
respondents are thinking that they are not getting high value for their money.
The majority of the respondents are getting high value for their money.
CHART NO: 31
The following chart shows the respondents thinking of the value for their money.
International Journal of Scientific and Research Publications, Volume 4, Issue 12, December 2014 36
ISSN 2250-3153
www.ijsrp.org
VALUE FOR MONEY
yes , 66
no, 9
RANK ANALYSIS
TABLE NO: 32
Rate 1 2 3 4 5 6 Total Rank
Score (X) 77 63 54 46 37 23
Availability of the ticket (F1) 23 45 13 7 2 5 5819 1
XF1 1771 2835 702 322 74 115
Price of the ticket (F2) 23 20 16 8 6 2 4531 2
XF2 1771 1260 864 368 222 46
Safety and reliability (F3) 19 13 19 10 10 4 4230 3
XF3 1463 819 1026 460 370 92
Airport location (F4) 3 4 10 10 26 22 2951 6
XF4 231 252 540 460 962 506
Preferable aircraft (F5) 4 9 8 18 13 23 3145 4
XF5 308 567 432 828 481 529
Quality and service (F6) 3 4 9 22 18 19 3084 5
XF6 231 252 486 1012 666 437
From the above table it shows that the customers giving priority at first to the availability of the ticket, they are giving second
preference to the price of the ticket, the third preference goes to safety and reliability, fourth preference goes to preferable aircraft,
fifth preference goes to quality and service of the airlines, sixth preference goes to airport location.
The majority of the respondents giving their first priority to the availability of the ticket.
International Journal of Scientific and Research Publications, Volume 4, Issue 12, December 2014 37
ISSN 2250-3153
www.ijsrp.org
CHI-SQUARE
TABLE NO:33
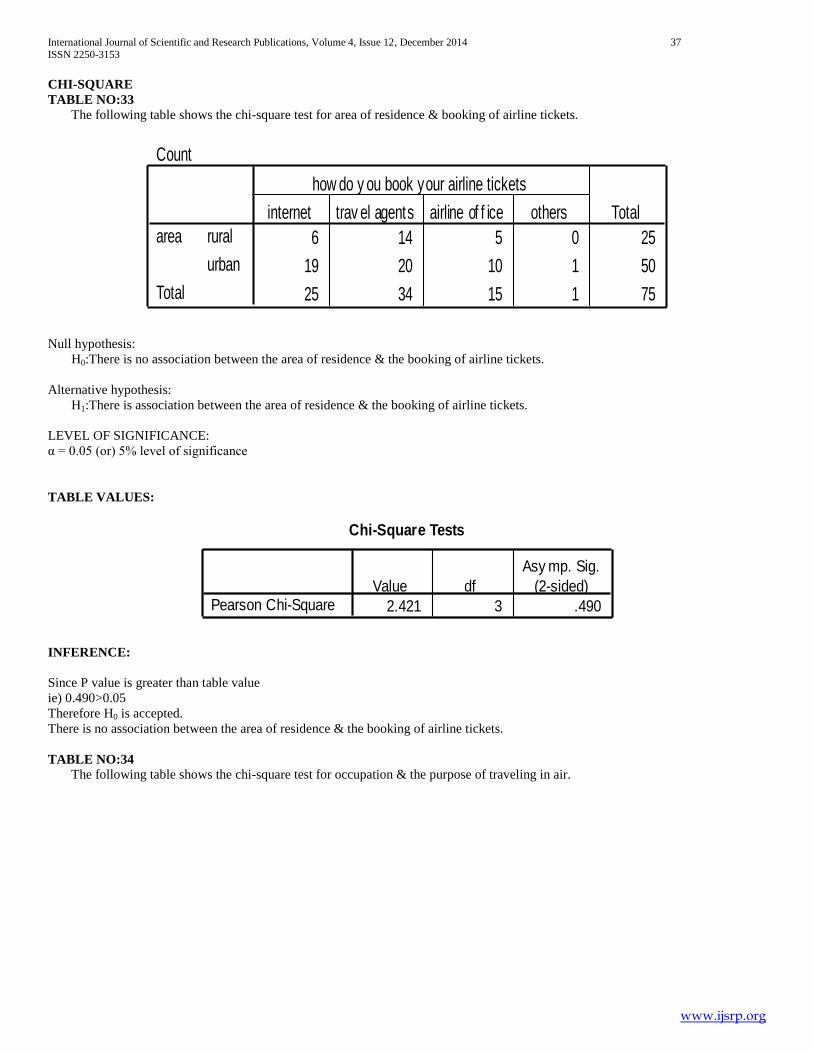
The following table shows the chi-square test for area of residence & booking of airline tickets.
Count
6 14 5 0 25
19 20 10 1 50
25 34 15 1 75
rural
urban
area
Total
internet trav el agents airline of f ice others
how do y ou book your airline tickets
Total
Null hypothesis:
H0:There is no association between the area of residence & the booking of airline tickets.
Alternative hypothesis:
H1:There is association between the area of residence & the booking of airline tickets.
LEVEL OF SIGNIFICANCE:
α = 0.05 (or) 5% level of significance
TABLE VALUES:
Chi-Square Tests
2.421 3 .490Pearson Chi-SquareValue df
Asy mp. Sig.
(2-sided)
INFERENCE:
Since P value is greater than table value
ie) 0.490>0.05
Therefore H0 is accepted.
There is no association between the area of residence & the booking of airline tickets.
TABLE NO:34
The following table shows the chi-square test for occupation & the purpose of traveling in air.
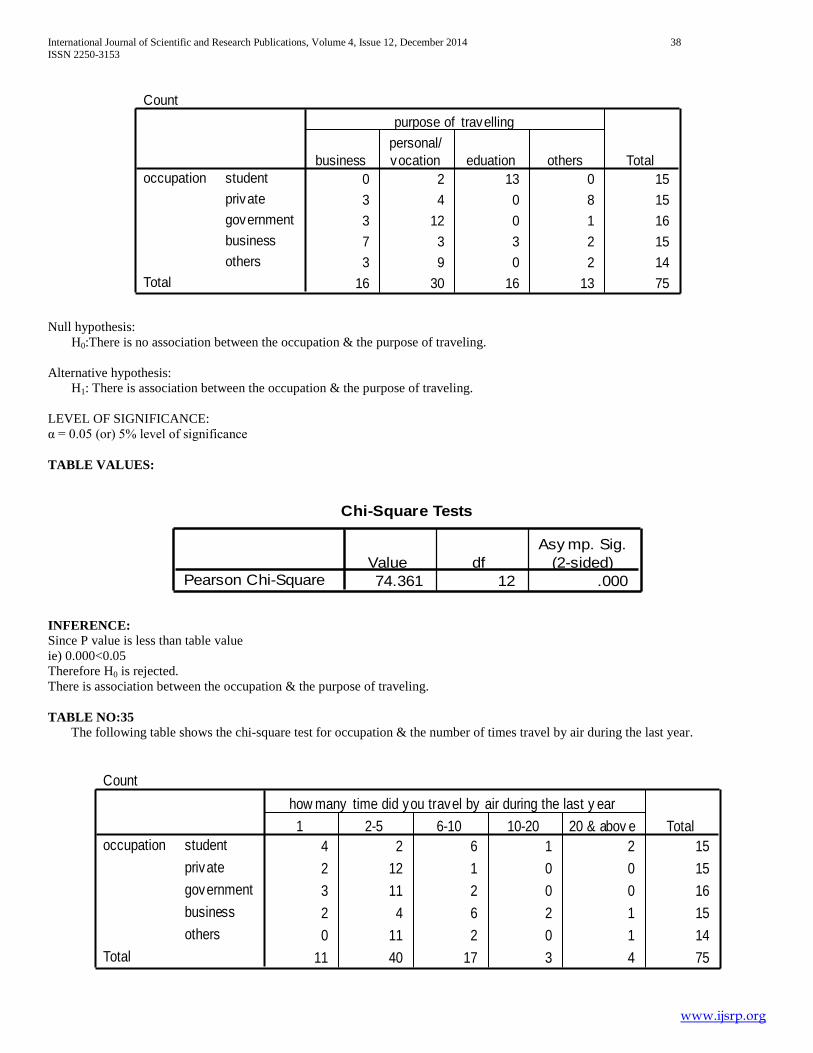
International Journal of Scientific and Research Publications, Volume 4, Issue 12, December 2014 38
ISSN 2250-3153
www.ijsrp.org
Count
0 2 13 0 15
3 4 0 8 15
3 12 0 1 16
7 3 3 2 15
3 9 0 2 14
16 30 16 13 75
student
private
government
business
others
occupation
Total
business
personal/
vocation eduation others
purpose of travelling
Total
Null hypothesis:
H0:There is no association between the occupation & the purpose of traveling.
Alternative hypothesis:
H1: There is association between the occupation & the purpose of traveling.
LEVEL OF SIGNIFICANCE:
α = 0.05 (or) 5% level of significance
TABLE VALUES:
Chi-Square Tests
74.361 12 .000Pearson Chi-SquareValue df
Asy mp. Sig.
(2-sided)
INFERENCE:
Since P value is less than table value
ie) 0.000<0.05
Therefore H0 is rejected.
There is association between the occupation & the purpose of traveling.
TABLE NO:35
The following table shows the chi-square test for occupation & the number of times travel by air during the last year.
Count
4 2 6 1 2 15
2 12 1 0 0 15
3 11 2 0 0 16
2 4 6 2 1 15
0 11 2 0 1 14
11 40 17 3 4 75
student
private
government
business
others
occupation
Total
1 2-5 6-10 10-20 20 & abov e
how many time did you travel by air during the last y ear
Total
International Journal of Scientific and Research Publications, Volume 4, Issue 12, December 2014 39
ISSN 2250-3153
www.ijsrp.org
Null hypothesis:
H0:There is no association between the occupation & the number of times travelled by air during the last year.
Alternative hypothesis:
H1: There is association between the occupation & the number of times travelled by air during the last year.
LEVEL OF SIGNIFICANCE:
α = 0.05 (or) 5% level of significance
TABLE VALUES:
Chi-Square Tests
30.386 16 .016Pearson Chi-SquareValue df
Asy mp. Sig.
(2-sided)
INFERENCE:
Since P value is less than table value
ie) 0.016<0.05
Therefore H0 is rejected.
There is association between the occupation & the number of times travelled by air during the last year.
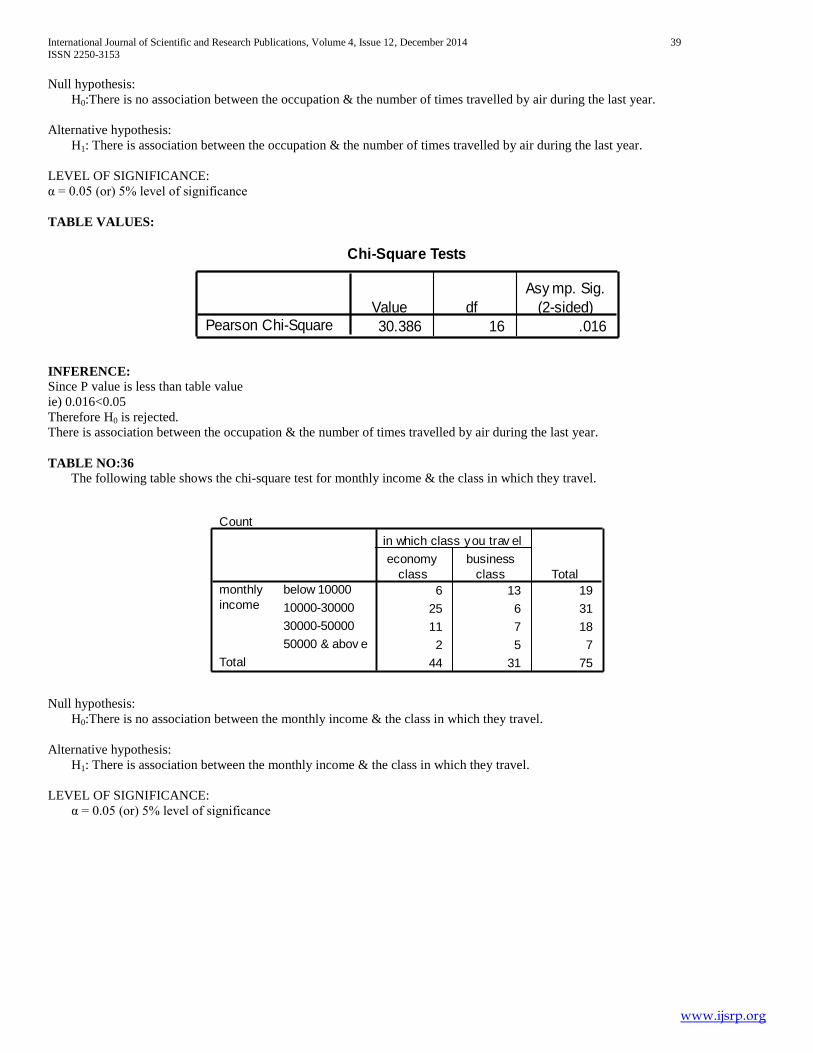
TABLE NO:36
The following table shows the chi-square test for monthly income & the class in which they travel.
Count
6 13 19
25 6 31
11 7 18
2 5 7
44 31 75
below 10000
10000-30000
30000-50000
50000 & abov e
monthly
income
Total
economy
class
business
class
in which class you trav el
Total
Null hypothesis:
H0:There is no association between the monthly income & the class in which they travel.
Alternative hypothesis:
H1: There is association between the monthly income & the class in which they travel.
LEVEL OF SIGNIFICANCE:
α = 0.05 (or) 5% level of significance
International Journal of Scientific and Research Publications, Volume 4, Issue 12, December 2014 40
ISSN 2250-3153
www.ijsrp.org
TABLE VALUES:
Chi-Square Tests
14.584 3 .002Pearson Chi-SquareValue df
Asy mp. Sig.
(2-sided)
INFERENCE:
Since P value is less than table value
ie) 0.002<0.05
Therefore H0 is rejected.
There is association between the monthly income & the class in which they travel.
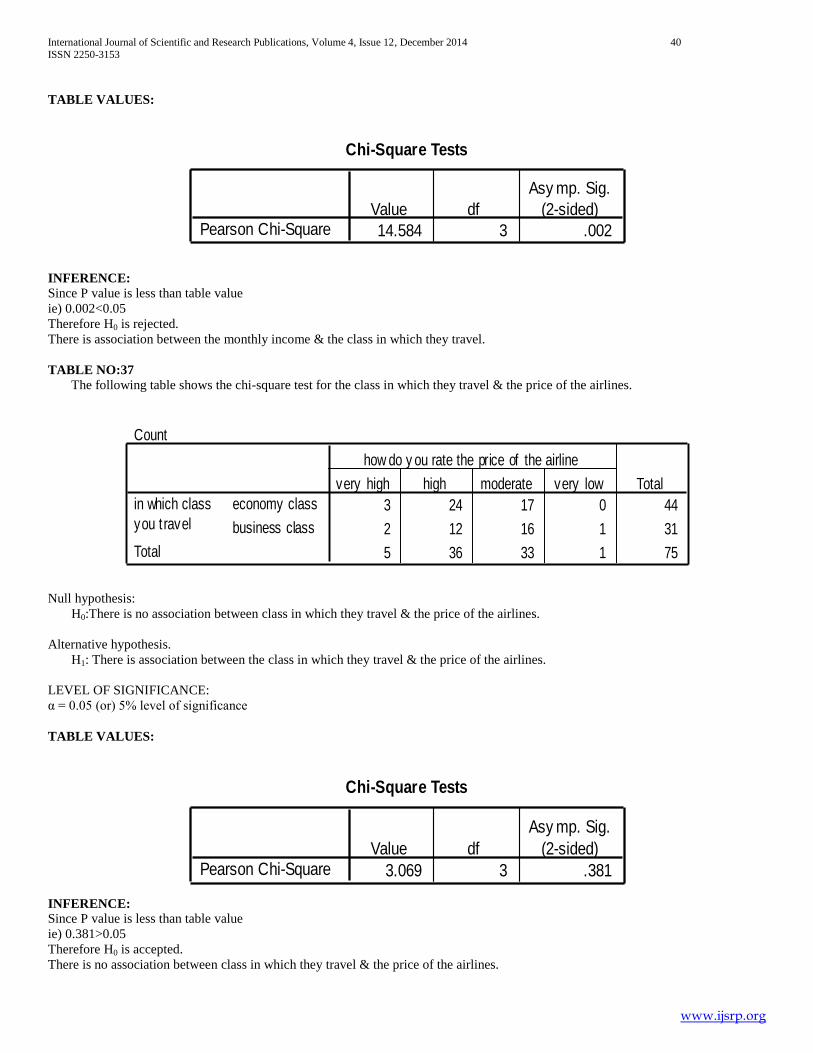
TABLE NO:37
The following table shows the chi-square test for the class in which they travel & the price of the airlines.
Count
3 24 17 0 44
2 12 16 1 31
5 36 33 1 75
economy class
business class
in which class
you travel
Total
very high high moderate very low
how do y ou rate the price of the airline
Total
Null hypothesis:
H0:There is no association between class in which they travel & the price of the airlines.
Alternative hypothesis.
H1: There is association between the class in which they travel & the price of the airlines.
LEVEL OF SIGNIFICANCE:
α = 0.05 (or) 5% level of significance
TABLE VALUES:
Chi-Square Tests
3.069 3 .381Pearson Chi-SquareValue df
Asy mp. Sig.
(2-sided)
INFERENCE:
Since P value is less than table value
ie) 0.381>0.05
Therefore H0 is accepted.
There is no association between class in which they travel & the price of the airlines.

International Journal of Scientific and Research Publications, Volume 4, Issue 12, December 2014 41
ISSN 2250-3153
www.ijsrp.org
TABLE NO:38
The following table shows the chi-square test for the class in which they travel & the quality & service of the airlines.
Null hypothesis:
H0:There is no association between class in which they travel & the quality & service of the airlines.
Alternative hypothesis:
H1: There is association between the class in which they travel & the quality & service of the airlines.
LEVEL OF SIGNIFICANCE:
α = 0.05 (or) 5% level of significance
TABLE VALUES:
Chi-Square Tests
4.602 3 .203Pearson Chi-SquareValue df
Asy mp. Sig.
(2-sided)
INFERENCE:
Since P value is less than table value
ie) 0.203>0.05
Therefore H0 is accepted.
There is no association between class in which they travel & the quality & service of the airlines.
TABLE NO:39
The following table shows the chi-square test for age & the purpose of traveling.
Count
3 35 5 1 44
6 24 1 0 31
9 59 6 1 75
economy class
business class
in which class
you travel
Total
highly
satisfied satisfied moderate
highly
dissatisfied
how do you rate the quality and service of the airline
Total
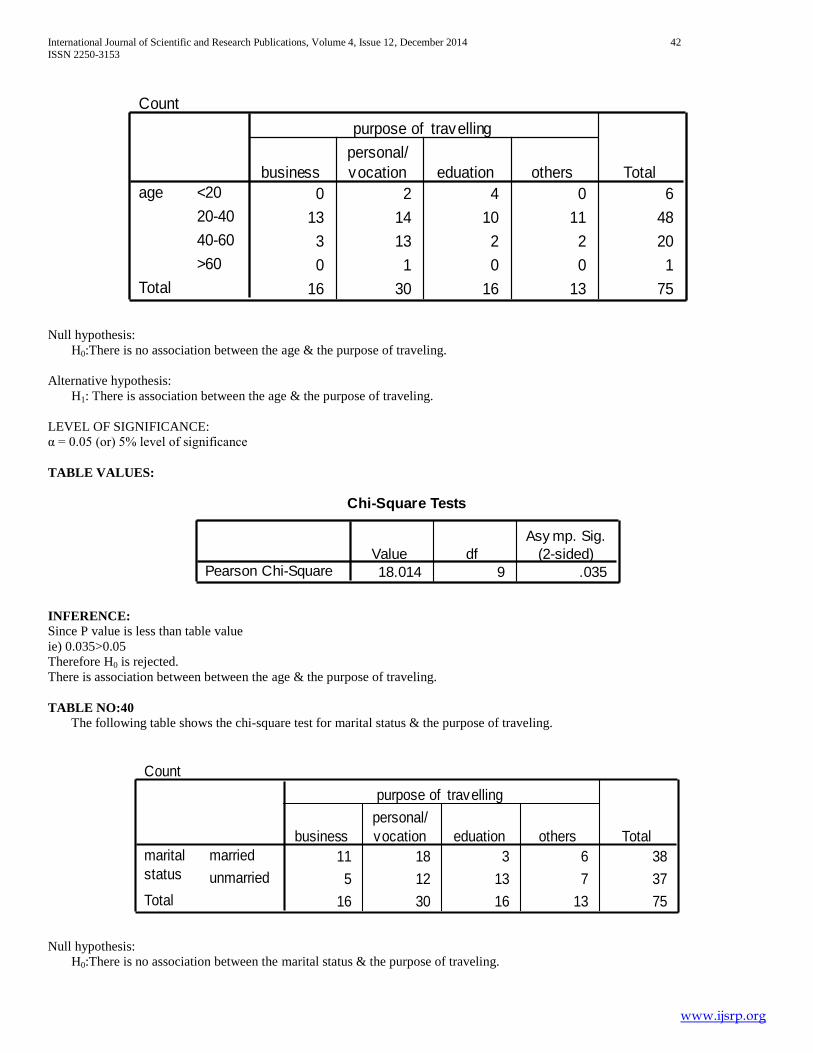
International Journal of Scientific and Research Publications, Volume 4, Issue 12, December 2014 42
ISSN 2250-3153
www.ijsrp.org
Count
0 2 4 0 6
13 14 10 11 48
3 13 2 2 20
0 1 0 0 1
16 30 16 13 75
<20
20-40
40-60
>60
age
Total
business
personal/
vocation eduation others
purpose of travelling
Total
Null hypothesis:
H0:There is no association between the age & the purpose of traveling.
Alternative hypothesis:
H1: There is association between the age & the purpose of traveling.
LEVEL OF SIGNIFICANCE:
α = 0.05 (or) 5% level of significance
TABLE VALUES:
Chi-Square Tests
18.014 9 .035Pearson Chi-SquareValue df
Asy mp. Sig.
(2-sided)
INFERENCE:
Since P value is less than table value
ie) 0.035>0.05
Therefore H0 is rejected.
There is association between between the age & the purpose of traveling.
TABLE NO:40
The following table shows the chi-square test for marital status & the purpose of traveling.
Count
11 18 3 6 38
5 12 13 7 37
16 30 16 13 75
married
unmarried
marital
status
Total
business
personal/
vocation eduation others
purpose of travelling
Total
Null hypothesis:
H0:There is no association between the marital status & the purpose of traveling.
International Journal of Scientific and Research Publications, Volume 4, Issue 12, December 2014 43
ISSN 2250-3153
www.ijsrp.org
Alternative hypothesis:
H1: There is association between the the marital status & the purpose of traveling.
LEVEL OF SIGNIFICANCE:
α = 0.05 (or) 5% level of significance
TABLE VALUES:
Chi-Square Tests
9.765 3 .021Pearson Chi-SquareValue df
Asy mp. Sig.
(2-sided)
INFERENCE:
Since P value is less than table value
ie) 0.021>0.05
Therefore H0 is rejected.
There is association between the the marital status & the purpose of traveling.
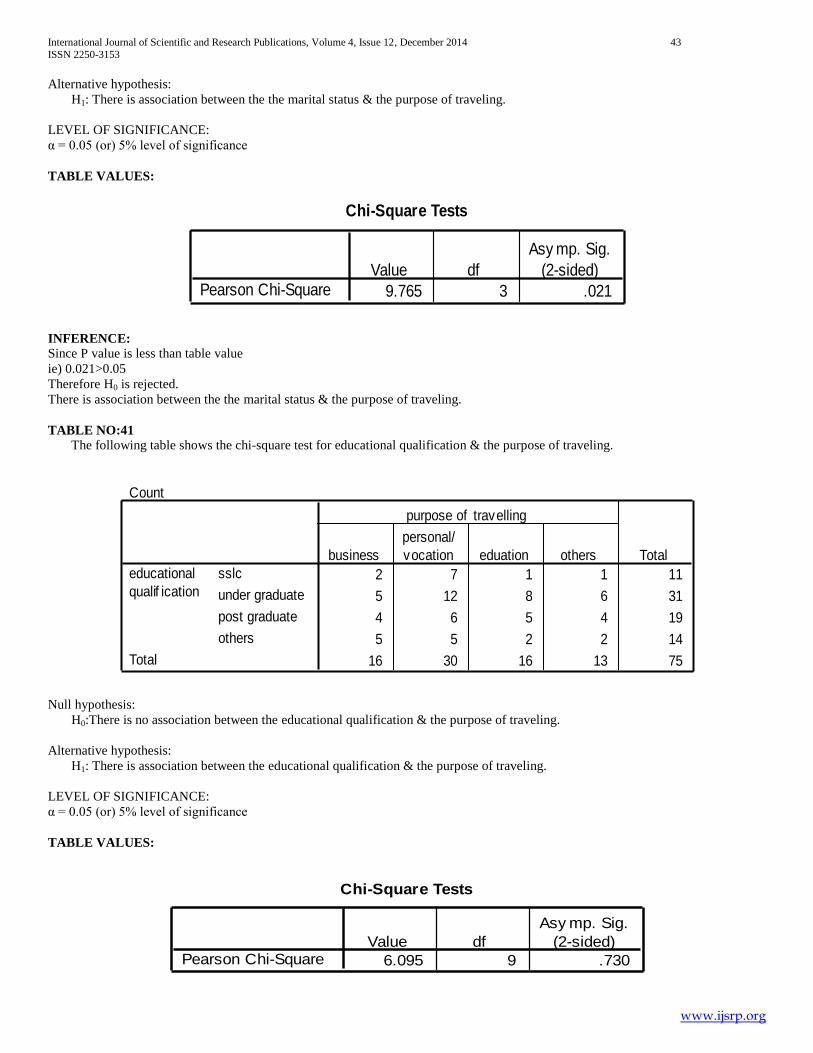
TABLE NO:41
The following table shows the chi-square test for educational qualification & the purpose of traveling.
Count
2 7 1 1 11
5 12 8 6 31
4 6 5 4 19
5 5 2 2 14
16 30 16 13 75
sslc
under graduate
post graduate
others
educational
qualif ication
Total
business
personal/
vocation eduation others
purpose of travelling
Total
Null hypothesis:
H0:There is no association between the educational qualification & the purpose of traveling.
Alternative hypothesis:
H1: There is association between the educational qualification & the purpose of traveling.
LEVEL OF SIGNIFICANCE:
α = 0.05 (or) 5% level of significance
TABLE VALUES:
Chi-Square Tests
6.095 9 .730Pearson Chi-SquareValue df
Asy mp. Sig.
(2-sided)
International Journal of Scientific and Research Publications, Volume 4, Issue 12, December 2014 44
ISSN 2250-3153
www.ijsrp.org
INFERENCE:
Since P value is greater than table value
ie) 0.730>0.05
Therefore H0 is accepted.
There is no association between the educational qualification & the purpose of traveling.
VIII. FINDINGS
The project is concerned with the survey of the customers
travel by air in Coimbatore districts. In this study the following
findings and conclusions were made after analyzing the collected
data carefully.
The majority of the respondents are males.
The majority of the respondents are in the age group of
20-40 years.
The majority of the respondents are married people.
The majority of the respondents are UG students.
The majority of the respondents are government sector
people.
The majority of the respondents are belonging monthly
income 10000-30000.
The majority of the respondents are belonging to urban
area.
The majority of the respondents are travelling for the
purpose of personal/vocation.
The majority of the respondents are travelling in
economy class.
The majority of the respondents are booking their
tickets by travel agents.
The majority of the respondents are travelled 2-5 times
by air in the last year.
The majority of the respondents are rate that the price of
the airline is high.
The majority of the respondents are satisfied with the
quality and service provided by the airlines.
The majority of the respondents are satisfied with the
safety provided by the airlines.
The majority of the respondents are waited in the queue
of express baggage check in counter for 11-20minutes
duration of time.
The majority of the respondents are waited in the queue
of aircraft boarding counter for 11-20minutes duration
of time.
The majority of the respondents are waited in the queue
of security check point counter for 6-10minutes duration
of time.
The majority of the respondents are think that the
departure or arrival time was very important while
making a decision to choose the airline.
The majority of the respondents are think that the fewer
stops of flight and better connection was very important
while making a decision to choose the airline.
The majority of the respondents are think that the air
fare of the flight is very important while making a
decision to choose the airline.
The majority of the respondents are think that the seats
availability of the flight was very important while
making a decision to choose the airline.
The majority of the respondents are think that the
personal preference of the flight was very important
while making a decision to choose the airline.
The majority of the respondents are think that the
aircraft preference of the flight was very important
while making a decision to choose the airline.
The majority of the respondents are satisfied with the
speed of getting through the agent.
The majority of the respondents are satisfied with the
helpfulness & courtesy of the reservation agent.
The majority of the respondents are moderate with the
accuracy of flight & fare information given by the
reservation agent.
The majority of the respondents are satisfied with the
cabin cleanliness of the flight.
The majority of the respondents are satisfied with the
in-flight entertainment of the flight.
The majority of the respondents are satisfied with the
seats comfort in flight.
The majority of the respondents are satisfied with the
overall courteous & helpfulness.
The majority of the respondents are getting high value
for their money.
The majority of the respondents giving their first
priority to the availability of the ticket.
IX. CONCLUSION
It is concluded from the study that customers are satisfied
with the quality ,service and, safety provided by the airlines.
Customers are also satisfied with the cabin cleanliness , in-flight
entertainment, and the seats comfort in flight. Customers are
think that they are getting high value for their money and
satisfied with the overall courteous & helpfulness.
X. SUGGESTION
From the above analysis the following suggestions are made.
The airlines may particularly concentrate in the time of
boarding and baggage check-in counter.
The airlines should give importance to the departure &
arrival time.
The airlines should reduce the ticket price.
The reservation agent should give the accuracy of flight
& should provide full information about the air fare.
AUTHORS
First Author – R. Rajeswari, Teaching Associate, PSG Institute
of Management

International Journal of Scientific and Research Publications, Volume 4, Issue 12, December 2014 45
ISSN 2250-3153
www.ijsrp.org