passengers’ satisfaction with service...
TRANSCRIPT

PASSENGERSrsquo SATISFACTION WITH SERVICE QUALITY
A CASE STUDY OF THAI AIRWAYS INTERNATIONALrsquoS DOMESTIC FLIGHTS
A MASTERrsquoS PROJECT
BY
WILAS MANKONGVANICHKUL
Presented in Partial Fulfillment of the Requirements for the
Master of Arts Degree in Business English for International Communication
at Srinakharinwirot University
May 2010
Copyright 2010 by Srinakharinwirot University
PASSENGERSrsquo SATISFACTION WITH SERVICE QUALITY
A CASE STUDY OF THAI AIRWAYS INTERNATIONALrsquoS DOMESTIC FLIGHTS
AN ABSTRACT
BY
WILAS MANKONGVANICHKUL
Presented in Partial Fulfillment of the Requirements for the
Master of Arts Degree in Business English for International Communication
at Srinakharinwirot University
May 2010
Wilas Mankongvanichkul (2010) Passengersrsquo Satisfaction with Service Quality A
Case Study of Thai Airways Internationalrsquos Domestic Flights Masterrsquos Project
MA (Business English for International Communication) Bangkok Graduate
School Srinakharinwirot University Project Advisor Assistant Professor
Sirinna Boonyasaquan
This study aimed at exploring passengersrsquo satisfaction on service quality in the
airline business and examining the connection of their satisfaction with their demographic
profiles The data were gained from the questionnaire based on the SERVQUAL
instrument which is a tool used to assess the service quality The research participants
were 150 passengers of TGrsquos domestic flights on Bangkok ndash Chiangmai route The
results showed that the passengersrsquo were moderately satisfied with TGrsquos in-flight service
in all the five dimensions The highest satisfaction level was placed on the assurance
dimension followed by tangibles empathy reliability and responsiveness respectively
The demographic data were analyzed in relationship with passengersrsquo
satisfaction It was revealed that among the five SERVQUAL dimensions the assurance
dimension was also rated at the highest level in terms of all the five demographic profiles
age occupation monthly income purpose of travel and frequency of travel Passengers
who were at the age range of 20 -40 years those whose occupations were not identified
those whose monthly income were about 60001 or higher those whose purpose of travel
was for holiday trips and lastly those who traveled via TG more than ten times in the past
12 months were satisfied with the service quality in terms of the assurance dimension at
the highest level at the mean scores of 378 348 350 353 and 360 respectively
ความพงพอใจของผโดยสารทมตอคณภาพงานบรการ
กรณศกษาเทยวบนภายในประเทศของการบนไทย
บทคดยอ
ของ
วลาศ มนคงวณชกล
เสนอตอบณฑตวทยาลย มหาวทยาลยศรนครนทรวโรฒ เพอเปนสวนหนงของการศกษา
ตามหลกสตรปรญญาศลปศาสตรมหาบณฑต สาขาวชาภาษาองกฤษธรกจเพอการสอสารนานาชาต
พฤษภาคม 2553
วลาศ มนคงวณชกล (2553) ความพงพอใจของผโดยสารทมตอคณภาพงานบรการ กรณศกษา
เทยวบนภายในประเทศของการบนไทย สารนพนธ ศศม (ภาษาองกฤษธรกจเพอการ
สอสารนานาชาต) กรงเทพฯ บณฑตวทยาลย มหาวทยาลยศรนครนทรวโรฒ
อาจารยทปรกษาสารนพนธ ผชวยศาสตราจารย ศรนนา บณยสงวน
การศกษาครงนมวตถประสงคเพอการประเมนความพงพอใจของผโดยสารทมตอคณภาพ
ของสายการบน และศกษาความสมพนธของขอมลสวนบคคลกบความพงพอใจของผโดยสาร
การศกษาครงนใชแบบสอบถามทอางองหลกการของเครองมอสารวจคณภาพของงานบรการ
SERVQUAL กลมตวอยางคอผโดยสารของเทยวบนภายในประเทศ เสนทางกรงเทพ ndash เชยงใหม
จานวน 150 คน ผลจากการศกษาพบวา ผโดยสารมความพงพอใจตอการบรการทง 5 ดาน
ในระดบปานกลาง ทงนพบวา ดานความเชอมน ไดรบความพงพอใจจากผโดยสารมากทสด
รองลงมาคอ ดานการบรการทเปนรปธรรม การเขาถงจตใจ ความเชอถอได และการตอบสนอง
ตามลาดบ
การศกษาครงนยงสามารถสรปไดวาขอมลสวนตวของผโดยสารมความสมพนธกบระดบ
ความพงพอใจดงน ในการบรการทง 5 ดาน ดานความเชอมนไดรบการจดอนดบสงสด ในแตละดาน
ของขอมลสวนบคคลทง 5 ประการ ไดแก อาย อาชพ รายไดตอเดอน จดประสงคในการเดนทาง
และความถในการเดนทาง โดยทผโดยสารกลมอายระหวาง 20-40 ป กลมทไมไดระบอาชพ
กลมทมรายไดตอเดอนมากกวา 60000 บาท กลมทเดนทางทองเทยว และกลมทเดนทาง
กบการบนไทยมากกวา 10 ครงตอป มความพอใจดานบรการในดานความเชอมน ในระดบสงสด
ทคาเฉลย 378 348 350 353 และ 360 ตามลาดบ
The Masterrsquos Project Advisor Chair of Business English for International
Communication Program and Oral Defense Committee have approved this Masterrsquos
Project Passengersrsquo Satisfaction with Service Quality A Case Study of Thai Airways
Internationalrsquos Domestic Flights by Mr Wilas Mankongvanichkul as partial fulfillment
of the requirements for the Master of Arts Degree in Business English for International
Communication of Srinakharinwirot University
Masterrsquos Project Advisor
helliphelliphelliphelliphelliphelliphelliphelliphelliphelliphelliphelliphelliphelliphelliphelliphelliphelliphelliphellip
(Assistant Professor Sirinna Boonyasaquan)
Chair of Business English for International Communication Program
helliphelliphelliphelliphelliphelliphelliphelliphelliphelliphelliphelliphelliphelliphelliphelliphelliphelliphelliphellip
(Assistant Professor Sirinna Boonyasaquan)
Oral Defense Committee
helliphelliphelliphelliphelliphelliphelliphelliphelliphelliphelliphelliphelliphelliphelliphelliphelliphelliphelliphellip Chair
(Assistant Professor Sirinna Boonyasaquan)
helliphelliphelliphelliphelliphelliphelliphelliphelliphelliphelliphelliphelliphelliphelliphelliphelliphelliphelliphellip Committee Member
(Dr Wanlapa Thaijinda)
helliphelliphelliphelliphelliphelliphelliphelliphelliphelliphelliphelliphelliphelliphelliphelliphelliphelliphelliphellip Committee Member
(Dr Saengchan Hemchua)
This Masterrsquos Project has been approved as partial fulfillment of the requirements
for the Master of Arts Degree in Business English for International Communication of
Srinakharinwirot University
helliphelliphelliphelliphelliphelliphelliphelliphelliphelliphelliphelliphelliphelliphellip Dean of the Faculty of Humanities
(Associate Professor Akkara Buntip)
May hellip 2010
ACKNOWLEDGEMENTS
I wish to express my deep gratitude to Assistant Professor Sirinna
Boonyasaquan my masterrsquos project advisor for her dedication in giving helpful advice
constructive comments and encouragement throughout the research Her valuable
guidance and comments made this research project possible
My heartfelt appreciation goes to Dr Wanlapa Thaijinda Dr Saengchan
Hemchua and Dr Phnita Kulsirisawad my project committee as well as Ms Sopin
Chantakloi my questionnaire advisor for their valuable comments and recommendations
which add greatly to my research
I am very grateful to Mr Surachart Suvikapakornkul Air Purser for his full
support and suggestions to the questionnaire
Lastly special thanks go to my classmates for their encouragement and good
support during the precious time at Srinakarinwirot University
Wilas Mankongvanichkul
TABLE OF CONTENTS
Chapter Page
1 INTRODUCTION 1
Rationale of the Study 1
Objectives of the Study 3
Significance of the Study 3
Scope of the Study 3
Definition of Terms 4
2 REVIEW OF LITERATURE 6
The Aviation Industry in Thailand 6
Customer Satisfaction 8
Service Quality 11
SERVQUAL Model 14
Demographic Variables 17
Previous Related Studies on Airline Passengersrsquo Satisfaction 18
3 METHODOLOGY 21
Participants of the Study 21
Research Instrument 22
Procedures of the Study 22
Data Analysis 23
TABLES OF CONTENTS (Continued)
Chapter Page
4 FINDINGS 26
Demographic Data 26
Level of Passengersrsquo Satisfaction 29
Passengersrsquo Satisfaction Level in Relationship with Their Demographic
Data
30
Other Comments 36
5 CONCLUSION AND DISCUSSION 37
Conclusion 37
Discussion 39
Limitations of the Study 46
Recommendations for Further Studies 47
REFERENCES 48
APPENDICES 54
A Questionnaire Thai Version 55
B Questionnaire English Version 57
C Questionnaire Specifications 59
VITAE 60
LIST OF TABLES
Table Page
1 Interval of Satisfaction Level 24
2 Participantsrsquo Age 26
3 Participantsrsquo Occupation 27
4 Participantsrsquo Monthly Income 27
5 Participants Purpose of Travel 28
6 Participantsrsquo Frequency of Travel 28
7 Relationship between the Participantsrsquo Age and their Satisfaction 31
8 Relationship between the Participantsrsquo Occupation and their Satisfaction 32
9 Relationship between the Participantsrsquo Income and their Satisfaction 33
10 Relationship between the Participantsrsquo Purpose of Travel and their
Satisfaction 34
11 Relationship between the Participantsrsquo Frequency of Travel and their
Satisfaction 35
LIST OF FIGURE
Figure Page
1 Overall Level of Passengersrsquo Satisfaction 30
CHAPTER ONE
INTRODUCTION
11 Rationale of the Study
The entry of low cost airlines in Thailand has rapidly increased in number There
are some reasons why the low cost airlines take this position One of them is that the full-
fare airlines have insufficient flights to cover all the destinations and another is that the
commercial promotions of low cost airlines are successful At the same time this has
posed a heavy challenge to existing airlines that run full-priced service Thai Airways
International (TG) the national airline of Thailand is no exception even though it has
been recognized as a provider of better service and more convenience to passengers
(ldquoTHAI AIRWAYS INTL Official 4-Star Ranking of Product and Service Qualityrdquo
2009) Still the company has to compete against those low cost airlines which fly to
similar destinations
Being a national airline TG has to overcome its competitors not by reducing the
ticket prices but by increasing their service quality to enhance passengersrsquo satisfaction
level In order to do that TG needs to understand the importance of how to make the
passengers satisfied with a high quality service
Regardless of the size of your business and whether it is product-based or service-
based (Rueangthanakiet 2008) to be successful depends on a high level of customer
satisfaction As customer satisfaction strategies are proven to enhance service quality of
the business knowing how to provide passengers with satisfaction is very useful to TG to
increase its competitive advantages
2
Customer satisfaction service arises when a company can provide customers with
benefits that exceed customersrsquo expectation and this is considered value-added If
customers are satisfied with a product or service they will buy more and do so more
often (Griffin 1995) All businesses always try to find ways to make customers happy by
all means to meet and even exceed their expectations in order to win their loyalty
TG has focused on service quality to increase passengersrsquo satisfaction and the
companyrsquos market share for years TGrsquos current motto ldquoService from the Heartrdquo clearly
indicates that the company has placed paramount importance to service The findings
from a study (Ostrowski OrsquoBrien amp Gordon 1993) revealed that airlines could acquire
and retain customer loyalty by offering high quality service Providing a superior service
quality should therefore be the main agenda for all airlines in order to remain
competitive in the market
However there are various factors affecting customersrsquo satisfaction with a
companyrsquos service Service provided can be tangible or intangible The service-related
equipment brochures magazines or even service operatorsrsquo uniforms are considered
tangible factors which can enhance customerrsquos satisfaction with the companyrsquos service
The quality of the tangibles is easier to improve since the tangibles are concrete On the
contrary it is difficult to evaluate the quality of service when taking the intangible factors
into account (Heesawat 2005) The intangibles such as personal needs and expectations
are abstract Expectation of a person differs from one to another Consumersrsquo
expectations can be influenced by word of mouth past experience etc The best way is
to provide the best service Research and development projects should be more
frequently carried out in a service organization to keep pace with how customers feel
towards the service The SERVQUAL instrument (Parasuraman Zeithamal amp Berry
1985) has been considered one of the effective tools used to assess a companyrsquo s service
3
quality so as to see if the company needs to better serve the customers and what service
areas need to be improved
12 Objectives of the Study
The main objectives of this study were first to explore the level of passengersrsquo
satisfaction with the service quality on Thai Airways Internationalrsquos domestic flights in
terms of five dimensions of SERVQUAL instrument reliability assurance tangibles
empathy and responsiveness Second the relationship of the satisfaction with the research
participantsrsquo demographic profile ie age occupation income purpose of travel and
frequency of travel were investigated
13 Significance of the study
The outcomes of this study would help TGrsquos customer service managers and other
practitioners to better understand the overall picture of TG service delivery and also of
their passengersrsquo satisfaction level Moreover the results from this research would assist
airline managers to better serve their customers monitor and develop service quality to
achieve the highest level of their passengersrsquo satisfaction It was hoped that the findings
could help TG increase its competence to compete with other airline companies In
addition the findings would enhance other airliners to improve their customer relations
management as well as their brand loyalty
14 Scope of the Study
The research was focused on a sample group of 150 Thai passengers 75 males
and 75 females who traveled with ten TGrsquos domestic flights on the route from Bangkok to
Chiangmai The Bangkok - Chiangmai route was chosen for the study because TG had
4
the highest number of domestic passengers traveling on this route as Chiangmai has
served as both domestic and international airline hub (THAI 2008)
The questionnaire employed in the study was based on the SERVQUAL
instrument (Parasuraman et al 1985) It was used to reflect the companyrsquos service in
five dimensions reliability assurance tangibles empathy and responsiveness
15 Definition of Terms
SERVQUAL is a tool developed by Parasuraman et al (1985) and is used to
measure service quality via five dimensions (RATER)
Reliability is the ability to perform the service in an accurate and dependable
manner
Assurance involves the knowledge and courtesy of employees and their
ability to convey trust and confidence
Tangibles present the appearance of physical factors such as equipment
facilities and personnel
Empathy indicates providing individual attention and care to customers
Responsiveness refers to the willingness to provide help and prompt service
to customers
Service quality is a customerrsquos perception that occurs when the need of service is
met above average more than just adequate In other words service quality is the ability
of service that meets a customers expectations for that service It represents the
properties of the service valued by the customer According to Parasuraman et al
(1985) service quality is measured by five dimensions (RATER) reliability assurance
tangibility empathy and responsiveness
5
Customer satisfaction is a measure of how a product and service supplied by a
company meets or surpasses customer expectation It is seen as a key performance
indicator within business and is an indication of how successful the company is at
providing products andor services to the market Customer satisfaction is an abstract
concept and the actual happening of the state of satisfaction will vary from person to
person and productservice to productservice In a competitive market where businesses
compete for customers customer satisfaction is considered a key element of business
strategy (Gitman amp McDaniel 2005)
CHAPTER TWO
REVIEW OF LITERATURE
This chapter presents a review of literature and research which is related to the
study It comprises six topics the aviation industry in Thailand customer satisfaction
service quality SERVQUAL instrument demographic variables and previous related
studies
21 The Aviation Industry in Thailand
The world economic crisis and the uncertainty of Thai political situations have
directly affected customer purchasing power of all kinds of businesses including the
airline industry The Tourism Authority of Thailand (TAT) has tried to boost the
domestic travel in several ways including an offer of promotional traveling packages
This is a tactic of turning a crisis to an opportunity as well as enhancing domestic airlinesrsquo
sales
To provide a detailed picture on this topic two issues are discussed domestic
airline operators and the nature of airline business onboard services
Domestic Airline Operators
In terms of fare the domestic airlines that are currently operating in Thailand are
low-cost airlines and full-fare airlines
A low-cost airline is an airline which charges relatively lower fares To generate
more revenue from loss of decreasing margin of ticket prices the low-cost airline may
ask for extra charges for such as food priority boarding seat allocating and baggage
7
privileges etc This type of airlines includes Bangkok Airways Nok Air Orient Thai
Airlines and Air Asia
Meanwhile a full-fare airline sells tickets at full prices and traditionally offers
three travel classes namely first business and economy classes Thai Airways
International is the sole operator in Thailand who operates this type of airline service TG
is serving 10 airports domestically and providing sufficient capacity to serve local
demands During the festive season extra flights are provided in a greater number to
meet peak demands particularly those to Chiangmai and Phuket (THAI 2009)
TG flies to two destinations in the North ie Chiangmai and Chiangrai three
destinations in the Northeast ie Khonkaen Udonthani and Ubolratchathani and five
destinations in the South ie Phuket Hatyai Suratthani Krabi and Samui
To recap there are two major groups of domestic airlines in terms of airfare which
are low cost and full-fare airlines TG is the only full-fare airline operator in Thailand
The Nature of Airline Business On-board Services
The airline business has become more competitive and most airlines in
considering their competitive edge take into account the quality of service to be offered
to customers (Palin 1996) Typically a service package includes lsquotangiblesrsquo which refer
to goods provided for customers and lsquointangiblesrsquo which are those related to the quality of
service offered to the customers The in-flight service-package includes both tangibles
and intangibles The problem to be addressed is the need to ensure that all the flights are
fully stocked with the physical items in the service package together with hygienic and
functional equipment requested by cabin crew for providing service These goods fall
into four categories
1 Food items including beverages to be consumed on board
8
2 Non-food items comprising an extensive list which may include newspapers
blankets toilet bags headsets for aircraft audio-visual systems
3 Duty-free goods for passengers to purchase on the aircraft
4 Equipment required by cabin crew for providing service The service
equipment includes tea and coffee-making equipment first aid kits etc
Nevertheless the quality of a service package not only depends on food drinks
and facilities on the aircraft such as newspapers blankets toilet bags headsets etc but it
also depends on the skills and knowledge of cabin crew who serve passengers to create
positive attitudes toward the airline and to enhance the brand loyalty
In conclusion the aviation industry in Thailand is very competitive Low-cost
airlines have increasingly become more popular because of the economic crisis To
compete with those budget airlines TG needs to find ways to retain and attract
passengers
22 Customer Satisfaction
It is impossible for any business to sustain itself without customers Accordingly
factors contributing to any successful business mainly result from customer satisfaction
customer loyalty and customer retention One important factor in determining the
likelihood of success and profits of an organization is customer satisfaction Customer
satisfaction results in customer loyalty When there is customer loyalty the customer
retention rate is high and good business results tend to follow
Customer satisfaction a business term is a measure of how products and services
supplied by a company meet or surpass customersrsquo expectation In a competitive
marketplace where businesses compete for gaining more customers customer satisfaction
9
is seen as a key performance indicator within a business and has increasingly become a
key element of business strategy (Gitman amp Carl 2005)
Hennig-Thurau and Klee (1997) state that customer satisfaction with a companys
products or services is often regarded as the key to the companys success and long-term
competitiveness Customer satisfaction is also often viewed as a central determinant of
customer retention A high customer satisfaction level yields several benefits It
heightens customersrsquo loyalty and prevents customersrsquo complaints lowers customersrsquo
price sensitivity reduces the costs of failed marketing and of new customer creation
reduces operating costs due to an increase in number of customers improves the
effectiveness of advertising and enhances business reputation (Fornell 1992) However
specialists on satisfaction indicate that the main factors determining customer satisfaction
are the customersrsquo own perceptions and expectations of service quality (Zeithaml amp
Bitner 2000)
Customersrsquo expectation and perception
Customersrsquo perception of service quality depends on the degree of the service that
meets the customersrsquo expectations service providers must know how to shape those
expectations The messages from service providers contribute significantly to expectation
development because the service is mostly regarded as intangible and people cannot
readily observe for themselves what to expect It is critical that the service provider gives
information to customers as clearly and accurately as possible before the customers make
a purchase Organizations that create unrealistic expectations in an effort to sell a service
are likely to find their customersrsquo satisfaction low Those unhappy customers will tell
others and the credibility of the business will be damaged (Gilbert 1999)
10
To ensure highly perceived quality and to maintain loyal customer base service
providers need to be accurate and reasonable about what they lead customers to expect
They also need to do a good job in the areas of reliability assurance tangibles empathy
and responsiveness It is difficult for companies to get ahead of the competition and the
nature of competition in the service industry is more difficult to protect from imitation
Competitors are increasingly forced to imitate the best features of one another
Therefore any competitors who try to invest more energy and resources in building
strong service quality are most likely to be winners (Gilbert 1999)
Factors Affecting Consumers Expectation
The key factors influencing consumersrsquo view on service quality include word of
mouth personal needs customersrsquo past experience and external communication
(Parasuraman et al 1985)
Word of mouth is particularly important because when consumers are satisfied or
dissatisfied with the service they are likely to share it with their friends Service is
generally classified as intangible Customers cannot actually ldquoseerdquo the service until they
experience it Before making a purchase customers need to find out as much information
as possible so as to make a good decision Word of mouth is a means to make a
consumer feel interested or uninterested in the service
Personal needs are considered another important factor They deal with the
motives that determine the nature and strength of what a consumer expects from a
service
Meanwhile past experience refers to what consumers have learned through their
personal interaction with a service provider It is particularly important in shaping
customersrsquo expectations
11
The last factor is external communication comprising such as direct sale and
advertisement in order to communicate and position a service through messages which
can influence consumer perceptions
In summary each factor can individually or harmoniously affect consumersrsquo
purchasing decision Customer satisfaction is a key to business success In order to make
customers satisfied a company needs to understand their expectations and perception by
studying the factors that affect their purchasing decision
23 Service Quality
A search for the definition of ldquoqualityrdquo has yielded inconsistent results Quality
has been variously defined as fitness for use in the product which successfully serves the
purpose of the user during usage (Juran amp Gryna 1974) In addition Zeithaml et al
(1990) state that ldquoqualityrdquo is what exceeds the customersrsquo expectation of the service
On the other hand quality is a characteristic of thoughts and statements believed
to be taken for granted if an explanation of quality is going to be both false and true
precisely (Pirsig 1987) Pirsig also says that since definitions derive from abstract and
formal thinking quality cannot be defined it is impossible to define quality because
quality can never be considered independently but only in relation to what is perceived
Measuring Quality in Service
Parasuraman et al (1985) point out that service quality is more difficult for the
consumers to evaluate than the product quality Perception of service quality results from
a comparison of customer expectations with actual service performance Quality
evaluations are made not only from the outcome of a service but also from the ldquoprocessrdquo
12
of service delivery and the customers have fewer tangible characters to be measured
physically when purchasing services than when purchasing products (Gronroos 1978)
Service quality is the degree of how well the service level delivered matches
customer expectations Delivering quality service means that the service provider needs
to follow customer expectations on a consistent basis (Lewis amp Booms 1983)
To conclude three underlying service quality themes can be drawn from the
discussion as follows
Service quality is more difficult for the customer to evaluate than product quality
Service quality perceptions result from a comparison of consumer expectations
with actual service performance
Quality evaluations are not made solely on the outcome of a service They
involve evaluations of the process of service delivery
The Benefits of Service Quality
The benefits of service quality comprise four areas as follows (Kotler 2000)
Customers Retention High quality builds loyal customers and creates positive word of
mouth which is an important factor in purchase decision This can determine customer
satisfaction which affects repeat business If a customer is happy with an existing firm it
is difficult to convince him or her to move to another
Avoidance of Price Competition A firm with a reputation for high quality has
a much stronger competitive position than one with a reputation for poor quality Price-
cutting by a competitor will not be enough to encourage a client to switch Good quality
is more powerful to remain competitive
13
Retention of Good Employees Employees appreciate working in operations
that are well run and produce quality products They do not enjoy receiving customer
complaints Also turnover and loss of employee morale are listed as costs of poor quality
manpower When an operation has good quality it can retain good employees And at
the time business expansion is needed recruiting is easier and training cost is reduced
Reduction of Costs The quality cost includes internal costs external costs and
quality system costs Internal costs are those associated with correcting problems
discovered by the firm before products reached customers External costs are related to
errors that the customers experience They can be very expensive when the customers
decide not to return because of a service problem Then the promotional and advertising
costs or external costs are necessary to be spent to create the company image in order to
make customers come back and win brand loyalty for the company in the end However
the company needs to check the service quality through customersrsquo feedback periodically
to avoid problems
Although the quality service system does not come without costs it is usually less
than those internal and external costs resulting from poor quality service Some examples
of the costs of a quality system include customer service audits trainings management
meetings with employees and customers and introduction of a new technology (Kotler
Bowen amp Makens 1999)
To sum up it is necessary for a service company to know the service quality level
The quality needs to be evaluated by comparing customer experience with service
performance Once a service company reaches a good quality level a company will
retain its customers easily be away from price wars keep and get good employees and
reduce some operation costs
14
Thai Airways In-flight Service Quality
The latest airline evaluation in 2009 by Skytrax from United Kingdom which is a
research organization focused on in-flight services revealed that TG got the official 4-star
ranking for its product and service quality This honor is awarded to airlines which
deliver a good quality performance
Skytrax also disclosed that for short travels or domestic routes two traveling
classes are business class and economy class The overall evaluation of the domestic
route showed that TGrsquos business class was rated excellent (5-star) in two articles which
are ldquowashroom cleanlinessrdquo and ldquonewspaper amp magazinerdquo in terms of ldquoonboard productrdquo
category Meanwhile TG also got the highest rank in terms of ldquoservice efficiencyrdquo and
ldquoresponding to requestsrdquo in ldquocabin staff servicerdquo categories In addition in the economy
class TG could do superbly in three articles of cabin staff service which were ldquoservice
efficiencyrdquo ldquoenthusiasm and attituderdquo and ldquofriendliness and hospitalityrdquo (ldquoTHAI
AIRWAYS INTL Official 4-Star Ranking of Product and Service Qualityrdquo 2009)
In conclusion TG has been recognized internationally however it still needs to
move ahead The quality ranking is useful for TG to realize that the company needs to
develop its products and services in all categories in order to step up and well-prepared
for competitions in the future
24 SERVQUAL Model
SERVQUAL is an instrument used for measuring how customers perceive the
quality of the service This instrument is based on five dimensions and on a comparison
between customersrsquo expectations of how the service should be performed and their
experiences of how the service is actually performed Usually 20 attributes are used to
describe the five dimensions and participants are asked to state what they expect from the
15
service and how they perceive the service on a five-point scale from ldquoexcellentrdquo to
ldquopoorrdquo Based on the difference between expectations and experiences over the 20
attributes an overall quality score can be calculated The higher the score shows that
experiences are below expectation the lower the perceived quality (Parasuraman amp
Berry 1991)
SERVQUAL consists of five dimensions (RATER) as follows (Parasuraman et
al 1985)
Reliability This means that a service firm provides its customers with accurate
service the first time without making any mistakes and delivers what it has promised to
do by the time that has been committed
Assurance This means that employeesrsquo behaviors give customers confidence in
the firm and that the firm makes customers feel safe It also means that the employees are
always courteous and have the necessary knowledge to respond to customers questions
Tangibles This dimension relates to the appeal of facilities equipment and
materials used by a service firm as well as to the appearance of service employees
Empathy This means that the firm understands the customersrsquo problems and
performs in their best interests as well as giving customers individual personal attention
and having convenient operating hours
Responsiveness This means that employees of a service firm are willing to help
customers and respond to their requests as well as to inform customers when service will
be provided and give prompt service
16
Application of SERVQUAL Model in Hospitality Business
The SERVQUAL instrument has been used to assess the quality of a wide range
of services in the United States such as financial service operations telephone services
repair and maintenance services (Parasuraman et al 1988) and other professional
services (Bojanic 1991) Fick and Ritchie (1991) have employed the SERVQUAL
instrument to compare services provided by various types of organizations within the
travel and tourism industry Oberoi and Hales (1990) have examined the SERVQUAL
approach as a basis for measuring the quality of the conference hotel products Many
researchers of other service businesses believed that ldquoSERVQUALrdquo is a concise multiple-
item scale with good reliability and validity (Buttle 1996 Lages amp Fernandes 2005)
In Thailand Boontaganon (2002) studied the service quality of fast food
restaurants in Bangkok by using SERVQUAL The study examined the differences in
service quality expectations and perceptions based on demographic characteristics
including gender age occupation education and income level 360 questionnaires were
distributed to people who had just exited from fast food outlets in Bangkok The results
showed significant differences in service quality of customer expectations and
perceptions which indicated the unacceptable service quality delivered by fast food
restaurants in Bangkok
Suthirungkul (2003) studied the customer expectations and perceptions of service
quality of the Clark Hatch Fitness Center at Silom Road Branch Bangkok The objectives
of the study were to identify the SERVQUAL dimensions that customers both local and
foreign used to evaluate The Clark Hatch Fitness Center to study the customer
expectations towards the services quality that should be provided and to evaluate the
perceptions of service quality that customers obtained after using service The
questionnaire was used as a tool for collecting the data 277 Thai and foreign members of
17
the Clark Hatch Fitness Center at Silom Road Branch were the research participants The
results of the study were that there existed gaps between expectations and perceptions in
terms of the five SERVQUAL dimensions and the demographic characteristics had
influenced the gap scores
In short SERVQUAL is an effective measuring tool This tool has widely been
used in many previous studies in hospitality business both domestically and
internationally
25 Demographic Variables
In general business sector market segmentation is often based on demographic
profiles (Reid amp Bojanic 2001) in order that marketers can choose the proper service
segmentation strategies to satisfy different target market segments Demographics are the
variables about consumersrsquo wants preferences and usage rates are often associated with
demographic variables Moreover the demographic variables are easier to measure
(Kotler 2000) Important demographics are as follows
1 Gender There is no logical reason to expect biology to account for this
difference between the sexes The explanation may be in socialization differences and
personality disposition Feminine gender identity is characterized by traits such as
expensiveness and emotionalism and other orientation while masculine gender identity is
characterized by independence activity and self orientation (Kotler amp Scheff 1997)
2 Age Consumersrsquo wants and abilities change with age People buy different
goods and services over their lifetime Peoplersquos tastes in different products and services
are also related to age (Kotler 2000)
18
3 Occupation This variable reflects values attitudes taste and lifestyle
Occupation and income tended to be closely correlation on almost cause-and-effect
relationship (Schiffman amp Kanuk 1994)
4 Income Consumers form a purchase intention based on such factors and
expected family income price and expected benefits from the product and services
(Kotler 1997)
5 Purpose of Travel The purpose of travel measure the frequent distribution
The purposes of travel are for such as business holiday visiting friends and relative and
others (ldquoTravel Planningrdquo 2010)
6 Frequency of Travel A critical factor in predicting the demand for tourism
within a certain period of time is the number of trips individuals take New touristsrsquo
behavior shows a tendency toward more frequent travel (Alegre amp Pou 2006)
To recap the demographic profiles play a significant role in planning service to
meet passengersrsquo satisfaction In airline business six features of the demographics were
included in this study
26 Previous Studies on Airline Passengersrsquo Satisfaction
In an airline business the major revenue of a company comes from the number of
passengers rather than a total sum of cargo service aircraft maintenance or catering
supply all together Studies on airline passengersrsquo satisfaction are numerous as the
following examples
Gilbert and Wong (2003) identified the service dimensions that matter most to
current airline passengers The study measured and compared differences in passengersrsquo
expectations of the desired airline service quality in terms of reliability assurance
19
facilities employees flight patterns customization and responsiveness The primary data
were collected from passengers departing from Hong Kong airport Regarding the
service dimension expectations it was found that there were no statistically significant
differences between passengers who made their own airline choice (decision makers) and
those who did not (non-decision makers) However there were significant differences
among passengers of different ethnic groups nationalities as well as among passengers
who traveled for different purposes such as business holiday and visiting friends or
relatives
The findings also indicated that passengers consistently ranked lsquoassurancersquo as the
most important service dimension It showed that the passengers were concerned about
the safety and security aspects and this also indicated why there had been such a
downturn in demand as this study was conducted just prior to the World Trade Center
incident on September11 2001
In Thailand Somwang (2008) assessed the passengersrsquo views of service quality in
Thai low cost airlines The research was based on the principle that passengers evaluated
airline service quality through a comparison between their experiences and expectations
over a number of quality attributes The study evaluated passengersrsquo perceived service
quality of Thai low cost carriers based on the SERVQUAL instrument The findings
indicated that the passengersrsquo expectations on service quality were higher than what they
had actually experienced Further analysis showed that female passengers had lower
perceived service quality than male passengers The findings also revealed that higher
monthly income had greater differences with respect to expectations and perceptions than
lower income respondents Furthermore passengers usually traveled with low cost
carriers for three main purposes which were for leisure visiting friends or relatives and
business
20
In brief the previous studies explored the satisfaction of airline passengers by
using SERVQUAL instrument to measure the service quality The results above found
out the differences between customersrsquo expectations and perceptions The findings of a
study in Hong Kong revealed the passengersrsquo satisfaction on the dimensions of the
service quality Meanwhile a study in Thailand implied some findings about the
demographic profiles resulting in service quality Studies on service quality help improve
business organizations retain customers and attract new customers
CHAPTER THREE
METHODOLOGY
This chapter consists of four sections participants of the study research
instrument procedures of the study and data analysis
31 Participants of the Study
One hundred and fifty Thai passengers 75 males and 75 females who took the
TG Bangkok - Chiangmai route were randomly chosen as participants for the study
Since there are about 150 passenger seats in each flight the researcher randomly acquired
a sample size of 10 percent of the overall passengers from the ten flights totaling 150
Thai people are the main group of passengers who travel domestically over the year The
researcher therefore decided to select only the Thai passengers as the participants for the
study Also so as to cover various types of passengers the researcher included flights of
different time within a day (as shown in a following part of this chapter) for a reason that
passengers with some specific purposes chose to travel at some specific time For
example business people might prefer an early morning flight rather than a later-in-the-
day one
TGrsquos Bangkok ndash Chiangmai route has been considered one of the most frequent
domestic routes (THAI 2009) TG operates ten flights daily from Bangkok to
Chiangmai The researcher consequently chose this route for this research work to
assess the passengersrsquo satisfaction with TGrsquos service quality
The study was conducted in early March when it was still in the high season for
travels to the northern province of Thailand Fifteen passengers from each of the ten
flights of the Bangkok - Chiangmai route were asked to fill out the questionnaire at the
22
end of the on-board service while the plane was approaching Chiangmai its destination
All the 150 completed questionnaires were obtained as planned
32 Research Instrument
A questionnaire in Thai was used for data collection The questionnaire was
divided into three parts The first part was about the respondentsrsquo demographic profile
since consumersrsquo needs preferences and personalization are often associated with
demographic factors (Kotler 2000) Six demographic characteristics related to in-flight
service (Cheosakul 2004) consisting of gender age occupation monthly income
purpose of travel and travel frequency with THAI were demographic issues of the survey
The second part comprised questions about passengersrsquo satisfaction with the service
during the flight This part of the questionnaire was based on the SERVQUAL
instrument for measuring customersrsquo satisfaction in five dimensions of service reliability
assurance tangibles empathy and responsiveness (Parasuraman et al 1985) The last
part comprised a question and a blank space provided for suggestions on TGrsquos service
quality
33 Procedures of the Study
The questionnaire was initially approved by the researcherrsquos masterrsquos project
advisor and two specialists a TG in-flight service manager and a SWU lecturer Then a
pilot study was conducted to ten passengers to check for content reliability the
appropriateness of the number of questions and language used in the questionnaire As
the researcher included all the ten flights of TGrsquos Bangkok - Chiangmai route in the
study the tried-out questionnaire was randomly distributed to ten TG passengers (5 males
and 5 females) on each flight of the aforementioned route on the same day in February
23
2010 Also since this study was about onboard service the questionnaire was distributed
to the participants after the in-flight service was completed and before the plane landed
After that the questionnaire was adjusted and prepared for the actual survey
The revised questionnaire was eventually distributed to 150 participants in ten
consecutive days in early March 2010 Fifteen passengers in each Bangkok -
Chiangmai flight per day were randomly asked to fill out the questionnaire after the
completion of in-flight service
The plan below showed the ten flights of for the survey each flight for a day to
make sure that the data gained were reliable
BKK-CNX Flight (TG) Flight Schedule (Departure-Arrival)
TG100 0615-0725
TG102 0750-0910
TG104 0910-1030
TG106 1020-1140
TG110 1250-1400
TG112 1400-1510
TG114 1540-1650
TG116 1715-1825
TG120 1900-2010
TG122 2130-2240
34 Data Analysis
The data acquired from the questionnaires were analyzed in three sections
demographic profile of passengers level of passengersrsquo satisfaction with TGrsquos service
and the relationship between demographic profile and passengersrsquo satisfaction based on
24
Likert scale The 5-point Likert scales were used to rate the level of satisfaction as shown
in Table 1 below
Table 1 Intervals of Satisfaction Level (Poonlarbtawee 1987)
The interpretation of the scales in this study is as follows
Rating
Scale
Level of
Agreement Disagreement
Satisfaction
Level
Mean Score
5 Strongly agree Excellent 451-500
4 Agree Good 351-450
3 Uncertain Average 251-350
2 Disagree Fair 151-250
1 Strongly disagree Poor 100-150
The researcher picked up lsquothe high grouprsquo and lsquothe low grouprsquo of each
SERVQUAL dimension to present the relationship between the participantsrsquo
demographic profile and their satisfaction As the data gained from the highest number of
the participants or the high group was the major point that the researcher relied on focus
was on the majority opinion At the same time the data gathered from the lowest number
of the participants or the low group should not be overlooked because each and all
passengers are important for TG and in the high competitive airline market it is necessary
to retain each and every passenger so as to grow far in the aviation business
The results were presented in terms of percentages and mean scores in the form of
tables and a bar chart These fundamental statistic methods were proper in this study
25
because percentages and mean scores are considered the basic statistics used for data
analysis and presentation Also the general public can easily understand the
interpretation of the data Another reason was that the sample group of this study
comprised only 150 TG passengers The researcher therefore decided to apply the
aforementioned statistics in this research Discussion of the results was also offered
CHAPTER FOUR
FINDINGS
This chapter describes the findings of the study consisting of the demographic
data of the participants level of their satisfaction with TGrsquos service quality relationship
between the demographic data and five dimensions of SERVQUAL instrument and the
uncovers to the last question on the questionnaire including suggestion
41 Demographic Data
The demographic data of TGrsquos research participants in terms of age occupation
monthly income purpose of travel and frequency of travel are presented in Tables 2- 6
below
Table 2 Participantsrsquo Age
Age No of Participants Percentage ()
Under 20 years
21-40 years
41-60 years
Above 60 years
8
85
45
12
53
567
300
80
Total 150 100
Regarding the age group the highest number of the passengers was 20-40 years
old or 567 30 of them were 46-60 years old and 8 were above 60 years old Only
53 were under 20 years old
27
Table 3 Participantsrsquo Occupation
Occupation No of Participants Percentage ()
Government official State enterprise employee
Business employee
Business owner
Student
Retiree
Others
22
63
37
13
9
6
147
420
247
86
60
40
Total 150 100
In terms of occupation the highest number of the participants was business
employees (42) followed by business owners (247) government officials or state
enterprise employees (147) students (86) retirees (6) and other occupations (4)
respectively
Table 4 Monthly Income
Monthly income (baht) No of Participants Percentage ()
Up to 20000
20001- 40000
40001 - 60000
60001 and above
58
72
11
9
386
480
74
60
Total 150 100
For the income the highest number of the participants earned 20001-40000 baht
monthly (48) followed by those with a monthly income of up to 20000 baht (386)
28
of 40001-60000 baht monthly (64) and of 60001 baht and above monthly was the
lowest (6)
Table 5 Purpose of Travel
Purpose of travel No of Participants Percentage ()
Business trips
Holidays
Visits
Others
41
79
27
3
273
527
180
20
Total 150 100
Regarding the purpose of travel the highest number of the passengers traveled via
TG on holidays (527) followed by those who traveled on business trips (273)
Meanwhile those who made a visit were at 180 and who traveled with other purposes
were at 2
Table 6 Frequency of Travel
Frequency in traveling with THAI
(during the last 12 months)
No of Participants Percentage ()
First time
2-3 times
4-10 times
More than 10 times
39
99
10
2
260
660
67
13
Total 150 100
29
The last demographic data derive from the frequency in traveling with THAI
66 of the participants indicated that they traveled 2-3 times during the last 12 months
26 traveled for the first time while 67 for 4-10 times and 13 for more than 10
times during the last 12 months
In conclusion the demographic data shown in the tables above indicated that lsquothe
high grouprsquo comprised the following characteristics The age group of the majority
number of the participants ranged from 21-40 years (567) Most of them were business
employees (42) The highest number of the passengersrsquo monthly income was around
20000 ndash 40000 baht per month (48) The majority of the passengers traveled on
holidays (527) by TG 2-3 times in the past 12 months (66)
Meanwhile lsquothe low grouprsquo was found having the following characteristics The
lowest number of the research participants was under 20 years old or 53 Only 47 of
the participants had other kinds of occupation which were not indicated on the
questionnaire while only 6 of the participants earned 60001 baht or above monthly
2 of the participants traveled on other purposes besides those shown on the
questionnaire Lastly 13 of the passengers were those who traveled by TG more than
10 times in the past 12 months
42 Level of Passengersrsquo Satisfaction
Figure 1 below is the conclusion from the second part of the questionnaire The
150 participants were asked to rate the level of service quality that they perceived from
the TGrsquos domestic flights on Bangkok - Chiangmai route The questionnaire was divided
into five dimensions of SERVQUALrsquos (Parasuraman et al 1985) service quality which
comprised reliability assurance tangibles empathy and responsiveness The scales 1 to 5
ranged from lsquostrongly disagreersquo to lsquostrongly agreersquo
30
0
5
Reliability Assurance Tangibles Empathy Responsiveness
280
345 334307
269
SERVQUAL Dimension
Figure 1 Overall Level of Participants Satisfaction
Mean scores
Figure 1 shows the average mean score of all 150 passengersrsquo satisfaction on five
dimensions of service quality ranging from the mean scores of 345 to 269 The results
revealed that the most important service quality dimension for the whole samples group
of passengers was assurance ( 345) followed by tangibles ( 334) empathy ( 307)
reliability ( 28) and responsiveness ( 269) respectively The overall average mean
was 307
43 Passengersrsquo Satisfaction Level in Relationship with Their Demographic Data
This section shows the relationship between the demographic data (age
occupation monthly income purpose of travel and travel frequency) of the participants
and their satisfaction with the service quality of TGrsquos in-flight service
The researcher focused on each category of demographic characteristics of two
major groups a group with the highest score and the other with the lowest score In fact
the most important data were the majority opinion of the sample group In other words
for this study it was lsquothe high grouprsquo However the researcher as a TG cabin crew gave
importance to the low group as well since each and every passenger is significant to TG
x
x x x
x x
31
business particularly in the high competitive market of airline business The researcher
was interested to know what the passengers in the lsquolow grouprsquo thought about the in-flight
service and what their feedback was
The following tables (Tables 7-11) illustrate the relationship between each
dimension of the demographic data and the SERVQUAL service assessment tool and the
following symbols are applied in the tables below
lsquoNrsquo means the number of the participants
lsquo rsquo means the mean score
lsquoThe high grouprsquo means the group that comprises the highest number of participants
lsquoThe low grouprsquo means the group that comprises the lowest number of participants
Table 7 Relationship between the Participantsrsquo Age and their Satisfaction with In-flight
Service
SERVQUALrsquoS
RATER
Average
Mean Score
of All Groups
The High Group
(Age 20-40 Yrs Old)
N = 85567
The Low Group
(Age Under 20 Yrs Old)
N = 853
Mean Score of Each Group
Reliability 280 278 270
Assurance 345 378 335
Tangibles 334 331 328
Empathy 307 309 314
Responsiveness 269 267 290
Table 7 reveals the connection between the participantsrsquo age and the five
dimensions of the SERVQUAL instrument The high group had higher mean scores for
x
32
three dimensions than the low group In other words the participants with an age range
of 20-40 years were more satisfied with TGrsquos service quality in terms of reliability
assurance tangibles than those who were under 20 years old Meanwhile the low group
had higher mean scores for two dimensions than the high group This means the
participants who were lower than 20 years old were more satisfied with the in-flight
service in terms of empathy and responsiveness than those whose ages ranged from 20-40
years
Interestingly it was found that both groups have a lower mean score for the
reliability dimension ( 278 and 270) than the average mean score of all the age groups
in this study ( 28)
Table 8 Relationship between the Participantsrsquo Occupation and their Satisfaction with In-
flight Service
SERVQUALrsquoS
RATER
Average
Mean Score
of All Groups
The High Group
(Business Employee)
N = 63420
The Low Group
(Others)
N = 640
Mean Score of Each Group
Reliability 280 275 284
Assurance 345 347 348
Tangibles 334 331 336
Empathy 307 310 305
Responsiveness 269 264 277
Table 8 illustrates the connection between the participantsrsquo occupations and the
five dimensions of the SERVQUAL instrument The low group had higher mean scores
x
x
33
for almost all the dimensions of SERVQUALrsquos RATER than the high group except for
one dimension In other words the participants who worked as business employees were
less satisfied with TGrsquos service quality in terms of reliability assurance tangibles and
responsiveness than those whose occupations were not specified in the questionnaire
Empathy was the only dimension of service quality that the participants who were in the
high group were satisfied with
Table 9 Relationship between the Participantsrsquo Income and their Satisfaction with In-
flight Service
SERVQUALrsquoS
RATER
Average
Mean Score
of All Groups
The High Group
(20001-40000)
N = 72480
The Low Group
(60001 and above)
N = 960
Mean Score of Each Group
Reliability 280 273 285
Assurance 345 349 350
Tangibles 334 332 321
Empathy 307 301 325
Responsiveness 269 262 273
Table 9 indicates the connection between the participantsrsquo monthly income and
the five dimensions of the SERVQUAL instrument The low group had higher mean
scores for almost all the dimensions of RATER than the high group except for one
dimension In other words the participants who earned monthly income of 20001 ndash
40000 baht were less satisfied with TGrsquos service quality in terms of reliability assurance
empathy and responsiveness than those who earned monthly income of 60001 baht and
34
above The tangibles dimension was the only service quality issue that the participants
who were in the high group were satisfied with
Table 10 Relationship between the Participantsrsquo Purpose of Travel and their Satisfaction
with In-flight Service
SERVQUALrsquoS
RATER
Average
Mean Score
of All Groups
The High Group
(Holidays)
N = 79527
The Low Group
(Others)
N = 320
Mean Score of Each Group
Reliability 280 279 285
Assurance 345 353 349
Tangibles 334 335 338
Empathy 307 308 312
Responsiveness 269 270 275
Table 10 reflects the connection between the participantsrsquo purpose of travel and
the five dimensions of the SERVQUAL instrument The low group had higher mean
scores for almost all the dimensions than the high group except for one dimension In
other words the participants who traveled on holidays were less satisfied with TGrsquos
service quality in terms of reliability tangibles empathy and responsiveness than those
whose purpose of travel were not specified in the questionnaire Assurance was the only
dimension of service quality that the participants who were in the high group were
satisfied with
35
Interestingly it was found that both groups has a higher satisfaction level for the
assurance tangibles empathy and responsiveness dimensions than the average mean
scores of the whole sample group
Table 11 Relationship between the Participantsrsquo Frequency of Travel with THAI and their
Satisfaction with In-flight Service
SERVQUALrsquoS
RATER
Average Mean
Score of All
Groups
The High
Group
(2-3 timesyear)
N = 99660
The Low Group
(more than 10
timesyear)
N = 213
Mean Score of Each Group
Reliability 280 281 295
Assurance 345 346 360
Tangibles 334 335 343
Empathy 307 308 321
Responsiveness 269 270 292
Table 11 presents the connection between the participantsrsquo frequency of travel
with THAI and the five dimensions of the SERVQUAL instrument The low group had
higher mean scores for all the dimensions of RATER than the high group In other
words the participants who traveled 2-3 times in the last 12 months were less satisfied
with TGrsquos service quality in terms of reliability assurance tangibles empathy and
responsiveness than those whose frequency of travel were more than 10 times in the last
12 months
36
Interestingly it was found that both groups has a higher satisfaction level for all
the five RATER dimensions than the average mean scores of the whole sample group in
this study
44 Other Comments
The last part of the questionnaire was designed to ask whether the participants
would continue using TGrsquos service The findings disclosed that 142 participants or
946 indicated that they would while 8 of them or 54 declined
Also at the end of the questionnaire there was a blank space for the participants to
freely express their own ideas and suggestions on TGrsquos service However only 7
participants or 46 gave suggestions regarding the in-flight service Four of the
participants were dissatisfied with the flavor of the snacks provided on board One
complained that it was not cool enough in the cabin while one was upset for not being
granted for a request for a blanket The last one commented that the passengerrsquos seat was
not comfortable
In summary the passengersrsquo satisfaction level of the service quality in connection
with their demographic data was introduced Five out of the six demographic
characteristics the participantsrsquo age occupation monthly income purpose of travel and
frequency of travel were analyzed in connection with the five dimensions of SERVQUAL
instrument reliability assurance tangibles empathy and responsiveness It was observed
that there were some connection between these two matters in various ways as earlier
discussed Lastly it was found that one hundred and forty-two participants would
continue using TGrsquos service while the rest refused Only seven of all the participants or
46 gave some comments on the open-ended suggestion part
CHAPTER FIVE
CONCLUSION AND DISCUSSION
This chapter presents the conclusion discussion limitations of the study and
recommendations for further studies
51 Conclusion
This research aimed to examine the service quality provided by Thai Airways
International on its domestic flights One hundred and fifty passengers who traveled by
TG on the Bangkok - Chiang Mai route were the research participants The SERVQUAL
instrument was used as an instrument for data collection in the survey This instrument
was based on five determinants proposed by Panasuraman etal (1985) in terms of
reliability assurance tangibles empathy and responsiveness This research was also
conducted on the demographic characteristics comprising gender age occupation
monthly income purpose of travel and frequency in traveling and the relationship of these
characteristics except the gender with the passengersrsquo satisfaction with TGrsquos in-flight
service quality The questionnaires were distributed in early March 2010
The results showed that all the participantsrsquo satisfaction based on the five
dimensions was at the average level The highest level of passengersrsquo satisfaction was
placed on the assurance dimension followed by tangibles and empathy dimensions
accordingly The two lowest levels of the passengersrsquo satisfaction were placed on the
responsiveness and reliability dimensions
In addition a summary of the demographic characteristics showed that the high
group or the group with the highest number of participants was business employees The
highest number of the participants was between 21-40 years old The highest number of
38
the participantsrsquo income ranged from 20000 ndash 40000 baht monthly Also the high
grouprsquos purpose of travel was to go on holiday Lastly the highest number of the
participants traveled via TG only 2-3 times during the past 12 months
Meanwhile the low group or the group with the lowest number of participants
was passengers with other kinds of occupations which were not specified on the
questionnaire The low group of the participants was under 20 years old The low group
of the participantsrsquo income ranged from 60001 baht monthly or higher Also the low
group revealed that they traveled via TG for other purposes which were not indicated on
the questionnaire Lastly the passengers who traveled via TG more than 10 times during
the past 12 months belonged in the low group
It has also been discovered that as a whole both groups the high and low groups
were in the same direction in their satisfaction with the five dimensions of service quality
The two groups were satisfied with the service quality dimensions in terms of assurance
at the highest level followed by tangibles empathy reliability and responsiveness
respectively
However when analyzing each demographic characteristic the participants who
were under 20 years old rated the responsiveness dimension higher than the reliability
dimension Also for those participants whose income was around 60001 or higher the
empathy dimension was rated higher than the tangibles Regarding the occupation
business people were satisfied with the reliability and responsiveness dimensions at a
very low level Meanwhile the participants who traveled via TG on their holidays rated
the assurance dimension at a very high level Lastly frequent fliers who traveled by
THAI more than 10 times were most satisfied with TGrsquos service since they rated all
RATER aspects highly
39
52 Discussion
The findings have revealed the answers to the research questions First the
demographic data of the participants gender age occupation monthly income purpose
of travel and frequency of travel were shown Second the level of the passengersrsquo
satisfaction toward the service quality on Thai Airways Internationalrsquos domestic flights in
terms of the SERVQUAL instrument (Parasuraman et al 1985) reliability assurance
tangibles empathy and responsiveness was disclosed Also the results about the
relationship between the passengersrsquo satisfaction and their demographic data were pointed
out
The results of the survey indicated that out of the five dimensions assurance was
rated at the highest level ( 345) followed by tangibles ( 334) and empathy ( 307)
(See Figure 1) In addition passengers rated their highest satisfaction with the assurance
dimension which included cabin crewrsquos job knowledge their courtesy confidence in their
service ability and safety while traveling It may be because TG cabin crew are well-
trained prior to their actual service work on board This can also ensure passengersrsquo
safety Particularly the safety and security features have been the most concerns of
airline passengers since the 9-11 incidents in New York USA This is why most
customers rated their highest satisfaction with the assurance dimension (Carman 1990)
The findings of this study are also consistent with those of Fick and Ritchie (1991)
who studied the operation of the SERVQUAL instrument in three major tourism sectors
airlines restaurants and ski area services It was revealed that the most important
dimensions of the service were assurance and tangibles If companies were unable to
inspire trust and confidence in their customers and the tangibles are not impressive it
would be difficult for them to achieve a high level of customerrsquos satisfaction (Sachukorn
2000)
x x x
40
Responsiveness is often found as the lowest level of satisfaction among customers
in the service industry It is plausible that the staff were too busy to provide prompt and
good service (Kholthanasep 2001) In this study the results revealed that the
responsiveness dimension was rated at the lowest score ( 269) among the five
dimensions followed by the reliability ( 280) dimension It was highly possible that the
passengersrsquo dissatisfaction occurred when passengers did not receive prompt service from
TG when they needed help
Prompt service is an important factor of customersrsquo expectation Customers
generally rate the service as poor when the speed of service does not meet their
expectations (Kholthanasep 2001) Bojanic and Rosen (1994) examined the nature of the
association between service quality as perceived by consumers and its determinants by
applying SERVQUAL in a restaurant setting They found that customers rated
responsiveness as the lowest satisfaction in their studies Zeithaml et al (1990) explained
that the responsiveness dimension in the SERVQUAL was willingness to help customers
and provide prompt service As the responsiveness dimension in this research comprised
prompt service willingness on-time service and quick response therefore it will be
beneficial to TG if the company can ensure that the service provided by its cabin crew
especially the willingness to help passengers and to provide prompt service meet
passengersrsquo satisfaction
Regarding the relationship between the participantsrsquo demographic data and their
satisfaction with the service quality there are many points of interests to be discussed as
follows
Firstly regarding the relationship of the passengersrsquo satisfaction with the service
and their age those who were under 20 years old rated satisfaction with the
responsiveness dimension ( 290) higher than the reliability dimension ( 270) (See
x
x
x x
41
Table 7) It was possible that young passengers usually gave priority to the dimension of
care and service when compared with that of the service providersrsquo accurate and
dependable manner (Panittumrong 2003) In addition young customers had less
experience in a service and it was difficult to compare the current service with the past
experience consequently they were more satisfied with the service provided than senior
customers
Another point was raised about the participantsrsquo age The study revealed that the
number of the high group with the age range of 21- 40 was at 567 However that of
the second highest group of the participants with the age range of 41-60 was at 30
which was rather high This latter grouprsquos level of satisfaction on the service quality was
also close to the average mean score It was found that the average mean score of the
reliability dimension was 280 while that of the second highest group was 281 the
average mean score of the assurance dimension was 345 while that of the second highest
group was 347 the average mean score of the tangibles dimension was 334 while that of
the second highest group was 335 the average mean score of the empathy dimension and
that of the second highest group was rated at 307 equally and the average mean score of
the responsiveness was 269 while that of the second highest group was 271 In sum if
consider the two groups in terms of the participantsrsquo age one of the high group and the
other with the second high group the results confirmed that the satisfaction level of the
majority of passengers was at the above average level
Secondly regarding the relationship between the participantsrsquo satisfaction and
their occupation business employees who were found at the highest number (42) had
very low satisfaction with the service quality in terms of reliability ( 275) and
responsiveness ( 264) while the mean scores of the whole sample group for these two
dimensions were at 280 and 269 respectively (See Table 8) The findings strongly
x
x
42
correlated with that of Cheaosakul (2004) who studied the consumersrsquo perception of
airline service quality with a focus on occupations It was found that the group of
business employees had the highest score on expectations Cheaosakul (2004)rsquos study
also revealed that business employees did not frequently travel compared with people of
other occupations such as tourists It was found in this particular study that the number of
the participantsrsquo purpose of travel with TG for business trips was only at 273 (See
Table 5) while the highest number of the participants went on holiday was at 52
Cheaosakul (2004) indicated that business people therefore had high expectations than
the other group who traveled more frequently
Thirdly an even more interesting point was raised when comparing the level of
satisfaction of the passengers who were government officials or state enterprise
employees and business owners Although passengers who were government officials or
state enterprise employees came third in terms of participants they are considered
valuable customers of TG since according to the governmentrsquos policy they are required
to take only TG which is a national airline whenever they travel by air There are few
exceptions though However it is almost impossible for Thai government officials who
travel on business trip and are funded by the governmentrsquos budget to fly with other
airliners It was found from this study that government officials were less satisfied with
TG quality service in terms of reliability ( 277) and responsiveness ( 264) than the
average level of which the mean scores of the two dimensions were at 280 and 269
respectively
Another issue of discussion regarding the participantsrsquo occupation business
owners came second It was observed that business owners rated the reliability ( 282)
and responsiveness dimensions ( 270) higher than the average scores of all groups (See
Table 8) It is possible that business owners had more positive attitude with TGrsquos service
x x
x
x
43
than the other groups TG seemed popular among business owners and they were the
most important group of customers This was supported by Suriya (2005) who studied
airline market segments after the launch of the low cost airlines in Thailand Suriya
(2005) identified that merchants or business owners were the major group of customers in
the full-service airline market
Fourthly regarding the monthly income of the research participants of the low
group passengers who earned an income of around 60001 or higher rated the empathy
( 325) dimension higher than tangibles ( 321) dimension (See Table 9) This may
be because the high income passengers sensitively felt that the facilities and equipment
found on their domestic route looked quite old-fashioned due to TGrsquos cost reduction The
company saved costs after the Suvannabhumi airport was closed in the 2008 crisis The
result is similar to the findings of Wangpen and Inthornma (2007) in that high income
customers had higher expectations towards the service It was possible that they had
more tendencies to be dissatisfied with the service failures The two researchers
concluded that passengers with different incomes were satisfied with the services at
different levels because they had different attitudes expectations and abilities to pay for
the service
Fifthly as it was found from this study that the highest score for the purpose of
travel was going on holiday (527) and the participants who were tourists rated the
assurance dimension at the highest level or the mean score of 353 (See Table 10) much
higher than the mean score of the whole group which was at 345 It was rather surprising
that the highest score for the travel purpose was not for business trips It is possible to
explain that this group spent for the travel cost on their own and they might want to make
sure that they chose the best service for themselves The result is parallel with Gabbie
and OrsquoNeill (1997) who examined customer satisfaction in the hotel sector using the
x x
44
SERVQUAL tool This study showed that the holiday guests who paid for
accommodation on their own rated assurance much higher than other dimensions It is
plausible to explain that passengers traveling on their own budget must make sure that
they already chose the service that was worth the money spent
However when analyzing the satisfaction on service quality of the participants
whose purpose of travel via TG was for business it was also found that this business
participants rated the high score for the tangibles dimension at the mean score of 340
compared with the average mean score of all groups of 334 Passengers who traveled on
business included government officials and state enterprise employees were major
customers of TG It was therefore interesting to find out from this study that their
satisfaction score in terms of tangibles or the appearance of physical factors such as
equipment facilities and personnel was above the average score of all groups Although
the score was not much higher the gap was bigger than that of the other RATER
dimensions as seen from the following information the passengers who traveled on
business trip showed their satisfaction on the reliability dimension at the mean score of
281 the assurance dimension at 347 the empathy dimension at 309 and the
responsiveness dimension at 270 while the average of all groups was at 280 345 307
and 269 respectively
The last point that the researcher wanted to point out is that this study revealed
that the participants who traveled more than 10 times for the last 12 months were lowest
in number (13) However it was interesting that these frequent flyers showed the high
rate of satisfaction with TGrsquos in-flight service quality The mean scores in all dimensions
showed the high rate of satisfaction (See Table 11) It is possible that passengers who
traveled very often via TG had high loyalty The brand loyalty made passengers happy in
every feature of service This result however contrasts with Ostrowski et al (1993) who
45
investigated service quality and customer loyalty in the commercial airline industry The
study examined whether the high levels of service quality existed in the US commercial
airline industry and how service quality could potentially lead to customer loyalty The
main results indicated that the levels of perceived service quality were below potential
and that customer loyalty to airlines was low It is plausible to say that the data of the two
studies were different The data collected on two air carriers in USA might have
different characteristics from the demographic information of Thai people and the number
of the participants in the two studies might differ However TG still needs to listen to the
voice of all passengers especially the frequent flyers Even if the number of this sample
group was few every customer is valuable for any firm Also it would be valuable to
implement a relevant strategy to expand this group of passengers since they had a positive
attitude for TG
Interestingly the findings from the last part of the questionnaire also showed that
the majority of the participants (946) showed their willingness to use TGrsquos service in
the future It can plausibly be explained that the participants were satisfied with TGrsquo
service quality at the moderate level ( 307) Their satisfaction with the five dimensions
of SERVQUAL was also moderate They might think that TG is a reliable airline that
they can depend on Thai passengers have confidence and trust in the service of Thai
cabin crew in terms of courtesy Also it is possible that they might not trust the low cost
airlinesrsquo service of the crew
There were only seven remarks on the in-flight service when the participants were
asked to freely give suggestions The tangible dimension problematic Passengers
pointed out about the small size of passengersrsquo seats and the quality of the air-
conditioning system One problem was on the responsiveness dimension which happened
when a passenger asked for a blanket but she was not offered indicating that some of the
x
46
cabin crewrsquos promptness to provide service was still not up to a standard Another
comment was on the flavor of the snacks Although this issue is not directly relevant to
the service it is worthwhile for TG to consider this problem
In conclusion the researcher found both strengths and weaknesses in TGrsquos service
quality Assurance was found the highest satisfaction in the participantsrsquo opinion TG
should maintain the service quality with a focus on this dimension On the other hand
the responsiveness and reliability dimensions were at the lowest satisfaction level among
the five dimensions The company should improve its service quality on these two
dimensions especially with regards to TGrsquos lsquoprompt servicersquo and lsquoproblem solvingrsquo
service to retain its passengers
53 Limitations of the study
This study has some limitations as follows
1 This study was limited to only one domestic route (Bangkok ndash Chiangmai)
Therefore the participants in this study were passengers who traveled only between these
two provinces The results of the study might differ if the study covered another route or
many more routes at the same time Consequently further studies can be conducted for
other domestic destinations such as Phuket and other big cities
2 The research participants were all Thai passengers It would be interesting to
study foreign passengersrsquo satisfaction on TGrsquos in-flight service quality
3 This study focused only on Parasuraman et al (1985)rsquos SERVQUAL
Instrument used to assess the service quality The results might differ if other instruments
were used
47
54 Recommendations for further studies
Further research should be undertaken to validate the results of this study The
researcher has found several opportunities to extend this study as follows
Survey on the lsquoresponsivenessrsquo dimensions
Responsiveness concerns the willingness or readiness of employees to provide
service such as timelines of service and prompt service This dimension was what the
passengers in this study were most concerned about because it was rated as the lowest
level of satisfaction Thus TG should find the countermeasure of how to increase the
level of passengersrsquo satisfaction in the responsiveness dimension
Assessment of the ground service quality
Since this research was conducted on on-board service quality further studies on
ground services such as a reservation or check-in service should be investigated in order
to integrate the results covering every sector of the airline service
Study on passengersrsquo attitude towards the service quality in other airlines
A study on the service quality of other airlines should be conducted in order to
obtain comparative data and find out reasons for their passengersrsquo behavior and attitude
consequently allowing TG to remedy any weak points and increase the number of new
passengers
REFERENCES
REFERENCES
Alegre J amp Pou L (2006) An analysis of the microeconomic determinants of travel
frequency Department of Applied Economics Universitat de les Illes Balears
Bojanic DC (1991) Quality measurement in professional service firms Journal of
Professional Service Marketing 7(2) 27-37
Bojanic D C amp Rosen L D (1994) Measuring service quality in restaurants An
application of the SERVQUAL model Journal of Hospitality Research 18(1)
3-14
Boontaganon W (2002) The study of service quality of fast-food restaurants in Bangkok
using SERVQUAL measurement Thesis MBA (Business Administration)
Bangkok Assumption University Photocopied
Buttle F (1996) SERVQUAL review critique research agenda European Journal of
Marketing 30(1) 8-31
CarmanJ M (1990) Consumer perceptions of service quality An assessment of the
SERVQUAL dimensions Journal of Retailing 69 33-35
Cheaosakul W (2004) Consumers perception of service quality a case study of Thai
Airways International Plc Thesis MBA Bangkok Assumption University
Photocopied
Fick RG amp Ritchie JRB (1991) Measuring service quality in the travel and tourism
industry Journal of Travel Research 30(2) 2-9
Fornell C (1992) A national customer satisfaction barometer the Swedish experience
Journal of Marketing 56 6-21
Gabbie O amp OrsquoNeill M (1997) SERVQUAL and the Northern Ireland hotel sector a
comparative analysis part 2 Managing Service Quality 17(1) 43-49
50
Gilbert DH (1999) Marketing connecting with customers (2nd
ed) Upper Saddle
River NJ Prentice Hall
Gilbert D amp Wong KCR (2002) Passenger expectations and airline services a
Hong Kong based study Surrey Management School Surrey University of
Surrey
Gitman LJ amp Carl DM (2005) The future of business the essentials Mason Ohio
South-Western College Pub
Grifin J (1995) Customer loyalty NY Lexington Book
Gronroos C (1978) A service-oriented approach to marketing of services European
Journal of Marketing 12(8) 588-601
Hennig-Thurau T amp Klee A (1997) The impact of customer satisfaction and
relationship quality on customer retention a critical reassessment and model
development Masterrsquos Project MA (Psychology amp Marketing) Hanover
University of Hanover
Heesawat C (2005) The opportunities and problems in making services more tangible
PhD Dissertation Bangkok Assumption University Photocopied
Juran JM amp Gryna FM (1974) Quality control handbook NY McGraw-Hill
Kholthanasep G (2001) A study of customerrsquos expectations and perceptions of service
quality delivery by first class hotels in Bangkok metropolitan area Thesis
MBA Bangkok Assumption University Photocopied
Kotler P amp Scheff J (1997) Standing room only strategies for marketing the
performing arts Boston Mass Harvard Business School Press
Kotler P (1997) Marketing management analysis planning and control (9th
ed) Upper
Saddle River NJ Prentice Hall
51
Kotler P Bowen J amp Makens J (1999) Marketing for hospitality and tourism (2nd
ed) NJ Prentice Hall
Kotler P (2000) Marketing management the millennium edition (10th
ed) NJ Prentice
Hall
Lages FL amp Fernandes CJ (2005) The SERVQUAL scale a multi-item instrument
for measuring service personal values Journal of Business Research 58(11)
1562-1572
Oberoi U amp Hales C (1990) Assessing the quality of the conference hotel product
London The Service Industries Journal 10(4) 700-722
Ostrowski PL Orsquobrien TV amp Gordon GL (1993) Service quality and customer
loyalty in the commercial airline industry Journal of Travel Research 32(2)
16-24
Palin M (1996) Flight catering transportation and loading (2nd
ed) London Longman
Group Limited
Panittumrong P (2004) The consumerrsquos opinion towards Clark Hatch Fitness Center
Master Project MBA (Management) Bangkok Graduate School
Srinakharinwirot University Photocopied
Parasuraman A Zeitmal VA amp Berry LL (1985) A concept model of service
quality and its implications for future research Journal of Marketing 49 41-50
Parasuraman A Zeitmal VA amp Berry LL (1988) SERVQUAL a multiple item
scale for measuring customer perceptions of service quality Journal of
Retailing 64(1) 64
Parasuraman A amp Berry LL (1991) Marketing services competing through quality
NY The Free Press
52
Pirsig RM (1987) Zen and the art of motorcycle maintenance an inquiry into values
(Mass Market Paperback) NY Bantam Books
Poonlarbtawee K (1987) Statistics for research Bangkok Physic Center Printing
Reid RD amp Bojanic DC (2001) Hospitality marketing management NJ John Wiley
amp Son Inc
Rueangthanakiet P (2008) Memberrsquos satisfaction of fitness service quality a case study
of California Wow Xperience Plc Masterrsquos Project MA (Business English for
International Communication) Bangkok Graduate School Srinakharinwirot
University Photocopied
Sachukorn S (2006) Reception and service excellence Bangkok Saitharn
Schiffman LG amp Kanuk LL (1994) Consumer behavior (5th
ed) London Prentice-
Hall International
Somwang C (2008) An assessment of passengersrsquo views of service quality in Thai low
cost carriers Inter Program MA (Communicative English) Bangkok
Ramkhamhaeng University Photocopied
Suriya K (2005) Airline market segments after low cost airlines in Thailand passenger
classification using neural networks and logit model with selective learning
Faculty of Economics Chiangmai Chiangmai University
Suthirungkul N (2003) The study of customer expectations and perceptions of service
quality of the Clark Hatch fitness center of Silom road branch Bangkok Thesis
MBA (Business Administration) Bangkok Assumption University
Photocopied
Thai Airways International (2008) Traffic program information (Introduction of summer
200809) Bangkok THAI Printing Office
53
Thai Airways International (2009) Traffic program information (Introduction of winter
200910) Bangkok THAI Printing Office
THAI AIRWAYS INTL Official 4-Star Ranking of Product and Service Quality (2009
October) Retrieved February 14 2010 from
httpwwwairlinequalitycomAirlinesTGhtml
Travel Planning (2010 February 12) Retrieved February 12 2010 from
httpwwwsuite101comlessoncfm1848818243
Wangpen N amp Inthornma S (2007) Membersrsquo satisfaction in fitness centers in
Bangkok Thesis MA (Hotel and Tourism Management) Bangkok Graduate
School Naresuan University Photocopied
Zeithaml VA amp Bitner MJ (2000) Services marketing (2nd
ed) NY McGraw Hill
Zeithaml VA Parasuraman A amp Berry LL (1990) Delivering quality service
balancing customer perceptions and expectations NY Free Press
APPENDICES
55
APPENDIX A
แบบทดสอบความพงพอใจของผโดยสารการบนไทย
เรยนทานผโดยสารทเคารพ กระผมนาย วลาศ มนคงวณชกล พนกงานตอนรบสายการบนไทย และนกศกษาปรญญาโท หลกสตรภาษาองกฤษธรกจเพอการสอสารนานาชาต มหาวทยาลยศรนครนทรวโรฒ ไดจดท าแบบสอบถามนเพอเปนสวนหนงของการส ารวจความพงพอใจของผโดยสารทมตอคณภาพงานบรการ เทยวบนภายในประเทศของการบนไทย โดยมงหวงทจะน าขอมลทไดรบจากการส ารวจมาเปนประโยชนตอการสงเสรมสนบสนนการปฏบตงานใหเกดประสทธผล จงขอความกรณาจากทานในการตอบแบบสอบถามทกขอตามขอเทจจรงและความเหนของทาน ขอมลทงหมดเปนความลบ จะใชเพอการวจยเทานน และขอขอบคณในความรวมมอของทาน
helliphelliphelliphelliphelliphelliphelliphelliphelliphelliphelliphelliphelliphelliphelliphelliphelliphelliphelliphelliphelliphelliphelliphelliphelliphelliphelliphelliphelliphelliphellip
ค าชแจง โปรดท าเครองหมาย (x) ลงในชองวาง ทตรงกบค าตอบของทาน
ตอนท 1 ขอมลทวไป
1 เพศ ( ) ชาย ( ) หญง 2 อาย ( ) ตากวา 20 ป ( ) 21-40 ป ( ) 41-60 ป ( ) 60 ปขนไป 3 อาชพ ( ) ขาราชการ รฐวสาหกจ ( ) พนกงานบรษท ( ) ธรกจสวนตว ( ) นกเรยน นกศกษา ( ) เกษยณ ( ) อนๆ 4 รายได เดอน ( ) ตากวา 20000 ( ) 20001- 40000 บาท ( ) 40001- 60000 บาท ( ) 60001 บาท ขนไป 5 จดประสงคการเดนทาง ( ) ธรกจ ( ) พกผอน ( ) เยยมเยยนญาตมตร เพอนฝง ( ) อนๆ 6 ความถในการเดนทางกบการบนไทย (ในรอบ 12 เดอน) ( ) ครงแรก ( ) 2-3 ครง ( ) 4-10 ครง ( ) 10 ครงขนไป
56
ตอนท 2 ความพงพอใจของทานตอการบรการ (5 = เหนดวยอยางยง 4= เหนดวย 3= ปานกลาง 2=ไมเหนดวย 1=ไมเหนดวยอยางยง)
ระดบความพงพอใจ
การบรการของการบนไทย 5 4 3 2 1 1 เมอเจาหนาทสญญาทจะใหบรการทานในเรองใด จะทาตามนนเสมอ
2 การใหบรการของเจาหนาท สรางความเชอมนใหกบทาน
3 อปกรณบนเครองบนมรปแบบททนสมย (เชน จอทว ทนง)
4 บรษทฯกาหนดเวลาการใหบรการบนเครองเหมาะสม
5 เจาหนาทใหบรการทดนบตงแตกาวแรกบนเครอง
6 เจาหนาทมความตงใจดทจะชวยเหลอทาน เมอทานมปญหา
7 ทานรสกปลอดภยเมออยบนเครองบน
8 สงอานวยความสะดวกตางๆบนเครอง มรปลกษณทดงดดใจ (เชน กลองอาหาร) 9 เจาหนาทไมเขาใจความตองการของทาน ในบางกรณ
10 เจาหนาทไมไดระบเวลาในการใหบรการผโดยสารบนเครองทแนนอน 11 เจาหนาทพยายามทางานโดยไมใหเกดขอผดพลาด
12 เจาหนาทปฎบตงานดวยความสภาพเสมอ
13 เจาหนาทแตงกายเรยบรอยและดด
14 บรษทฯใหความเอาใจใสกบผโดยสารเปนรายบคคล
15 บางครงเจาหนาทไมเตมใจทจะใหบรการผโดยสาร
16 บรษทใหบรการทานตรงเวลาทกาหนด
17 เจาหนาทสามารถใหขอมลเกยวกบการเดนทางไดอยางถกตอง
18 เอกสารของบรษทฯทเกยวของกบการบรการ (เชน แผนพบ นตยสาร) มขอมลครบถวน และรปแบบสวยงาม 19 เจาหนาทใหบรการทานดวยสมผสความเปนไทย
20 เจาหนาทใหบรการผโดยสารอยางรวดเรว
ทานจะกลบมาใชบรการของการบนไทยตอไป จะใชบรการตอไป ไมใชบรการ
ขอเสนอแนะ_______________________________________________________
_____________________________________________________________ ขอบพระคณอยางสงในความรวมมอของทาน
57
APPENDIX B
Questionnaire
Dear Honorable Passengers
My name is Wilas Mankongvanichkul -- a THAI cabin crew and masterrsquos student of business English
for international communication program Srinakharinwirot University This questionnaire is about
an exploration of passengersrsquo satisfaction with service quality of Thai Airways International (TG)rsquos
domestic flights Data gained will be utilized for THAI service operation Please kindly complete the
questionnaire The data gained will be kept confidential and used for the research study only Your
kind cooperation is greatly appreciated
helliphelliphelliphelliphelliphelliphelliphelliphelliphelliphelliphelliphelliphelliphelliphelliphelliphelliphelliphelliphelliphelliphelliphelliphelliphellip
Direction Please mark (x) your answer in the space provided
Part 1 Personal Information
1 Gender
( ) Male ( ) Female
2 Age
( ) Under 20 years ( ) 21-40 years
( ) 41-60 years ( ) Above 60 years
3 Occupation
( ) Government official State enterprise employee
( ) Business employee
( ) Business owner ( ) Student
( ) Retiree ( ) Others
4 Monthly income
( ) Up to 20000 baht ( ) 20001- 40000 baht
( ) 40001 ndash 60000 baht ( ) 60001 baht and above
5 Purpose of travel
( ) Business trips ( ) Holidays
( ) Visits ( ) Others
6 Frequency in traveling with THAI (during the last 12 months)
( ) First time ( ) 2-3 times
( ) 4-10 times ( ) More than 10 times
58 Part 2 Your satisfaction with the service
(5=Strongly Agree 4= Agree 3=Uncertain 2=Disagree 1= Strongly Disagree)
Level of Satisfaction
The Service of THAI 5 4 3 2 1
1 When cabin crew promise to do something by a
certain time they do so
2 You can trust THAI cabin crew
3 TG has modern on board equipment
(such as TV screen passengersrsquo seats)
4 TG has operating hours on board convenient to all
passengers
5 Cabin crew offer good services upon boarding
6 When passengers have a problem cabin crew show a
sincere interest in solving it
7 Passengers feel safe on-board
8 The physical facilities of TG are visually appealing
(such as meal boxes)
9 Cabin crew do not understand your special needs in
some cases
10 Cabin crew do not tell passengers exactly when
services will be offered
11 Cabin crew insist on error-free records
12 Cabin crew are consistently courteous to passengers
13 Cabin crew are well-dressed and neat in appearance
14 TG gives passengers individual attention
15 Cabin crew are not always willing to help passengers
16 TG provides its services at the time it promises to
do so
17 Cabin crew are knowledgeable to answer passengers
travel-related questions
18 Documents about service are informative and appealing
(such as pamphlets and magazines)
19 Services provided have a ldquoThai Touchrdquo
20 Cabin crew are quick to respond to passengersrsquo requests
Will you come back for TGrsquos service Yes No
Suggestions________________________________________________________________
________________________________________________________________________ Thank you very much for your kind cooperation
59
APPENDIX C
Questionnaire Specification Based on SERVQUAL measurement (Parasuraman et al 1985)
Passengers satisfaction level toward service quality factors
No Service Quality Features (RATER)
Str
on
gly
ag
ree
Ag
ree
Un
certa
in
Dis
ag
ree
Str
on
gly
Dis
ag
ree
(5) (4) (3) (2) (1)
1 When cabin crew promise to do something by a certain time they do so Reliability
2 You can trust THAI cabin crew Assurance
3 TG has modern on board equipment (such as TV screen passengersrsquo seats) Tangibles
4 TG has operating hours on board convenient to all passengers Empathy
5 Cabin crew offer good services upon boarding Responsiveness
6 When passengers have a problem cabin crew show a sincere interest in solving it
Reliability
7 Passengers feel safe on-board Assurance
8 The physical facilities of TG are visually appealing (such as meal boxes) Tangibles
9 Cabin crew do not always understand your special needs in some cases Empathy
10 Cabin crew do not tell passengers exactly when services will be offered Responsiveness
11 Cabin crew insist on error-free records Reliability
12 Cabin crew are consistently courteous to passengers Assurance
13 Cabin crew are well-dressed and neat in appearance Tangibles
14 TG gives passengers individual attention Empathy
15 Cabin crew are not always willing to help passengers Responsiveness
16 TG provides its services at the time it promises to do so Reliability
17 Cabin crew are knowledgeable to answer passengers travel-related questions Assurance
18 TGs documents associated with services are informative and appealing (such as pamphlets and magazines)
Tangibles
19 Services provided have a ldquoThai Touchrdquo Empathy
20 Cabin crew are quick to respond to passengersrsquo requests Responsiveness
VITAE
61
VITAE
Name Wilas Mankongvanichkul
Date of Birth February 14 1980
Place of Birth Bangkok
Address 688 Soi Phaholyothin 32 Chankasem Jatuchak
Bangkok 10900
Present Occupation Cabin Crew
Thai Airways International Public Company Limited
89 Vibhavadi Rangsit Road Bangkok 10110
Education Background
2010 Master of Art (Business English for International
Communication)
Srinakharinwirot University
2001 Bachelor of Business Administration Bangkok University
1997 High School Saint Dominic School
- Cover
- Abstract
- Chapter 1
- Chapter 2
- Chapter 3
- Chapter 4
- Chapter 5
- Bibliography
- Appendix
- Vitae
-

PASSENGERSrsquo SATISFACTION WITH SERVICE QUALITY
A CASE STUDY OF THAI AIRWAYS INTERNATIONALrsquoS DOMESTIC FLIGHTS
AN ABSTRACT
BY
WILAS MANKONGVANICHKUL
Presented in Partial Fulfillment of the Requirements for the
Master of Arts Degree in Business English for International Communication
at Srinakharinwirot University
May 2010
Wilas Mankongvanichkul (2010) Passengersrsquo Satisfaction with Service Quality A
Case Study of Thai Airways Internationalrsquos Domestic Flights Masterrsquos Project
MA (Business English for International Communication) Bangkok Graduate
School Srinakharinwirot University Project Advisor Assistant Professor
Sirinna Boonyasaquan
This study aimed at exploring passengersrsquo satisfaction on service quality in the
airline business and examining the connection of their satisfaction with their demographic
profiles The data were gained from the questionnaire based on the SERVQUAL
instrument which is a tool used to assess the service quality The research participants
were 150 passengers of TGrsquos domestic flights on Bangkok ndash Chiangmai route The
results showed that the passengersrsquo were moderately satisfied with TGrsquos in-flight service
in all the five dimensions The highest satisfaction level was placed on the assurance
dimension followed by tangibles empathy reliability and responsiveness respectively
The demographic data were analyzed in relationship with passengersrsquo
satisfaction It was revealed that among the five SERVQUAL dimensions the assurance
dimension was also rated at the highest level in terms of all the five demographic profiles
age occupation monthly income purpose of travel and frequency of travel Passengers
who were at the age range of 20 -40 years those whose occupations were not identified
those whose monthly income were about 60001 or higher those whose purpose of travel
was for holiday trips and lastly those who traveled via TG more than ten times in the past
12 months were satisfied with the service quality in terms of the assurance dimension at
the highest level at the mean scores of 378 348 350 353 and 360 respectively
ความพงพอใจของผโดยสารทมตอคณภาพงานบรการ
กรณศกษาเทยวบนภายในประเทศของการบนไทย
บทคดยอ
ของ
วลาศ มนคงวณชกล
เสนอตอบณฑตวทยาลย มหาวทยาลยศรนครนทรวโรฒ เพอเปนสวนหนงของการศกษา
ตามหลกสตรปรญญาศลปศาสตรมหาบณฑต สาขาวชาภาษาองกฤษธรกจเพอการสอสารนานาชาต
พฤษภาคม 2553
วลาศ มนคงวณชกล (2553) ความพงพอใจของผโดยสารทมตอคณภาพงานบรการ กรณศกษา
เทยวบนภายในประเทศของการบนไทย สารนพนธ ศศม (ภาษาองกฤษธรกจเพอการ
สอสารนานาชาต) กรงเทพฯ บณฑตวทยาลย มหาวทยาลยศรนครนทรวโรฒ
อาจารยทปรกษาสารนพนธ ผชวยศาสตราจารย ศรนนา บณยสงวน
การศกษาครงนมวตถประสงคเพอการประเมนความพงพอใจของผโดยสารทมตอคณภาพ
ของสายการบน และศกษาความสมพนธของขอมลสวนบคคลกบความพงพอใจของผโดยสาร
การศกษาครงนใชแบบสอบถามทอางองหลกการของเครองมอสารวจคณภาพของงานบรการ
SERVQUAL กลมตวอยางคอผโดยสารของเทยวบนภายในประเทศ เสนทางกรงเทพ ndash เชยงใหม
จานวน 150 คน ผลจากการศกษาพบวา ผโดยสารมความพงพอใจตอการบรการทง 5 ดาน
ในระดบปานกลาง ทงนพบวา ดานความเชอมน ไดรบความพงพอใจจากผโดยสารมากทสด
รองลงมาคอ ดานการบรการทเปนรปธรรม การเขาถงจตใจ ความเชอถอได และการตอบสนอง
ตามลาดบ
การศกษาครงนยงสามารถสรปไดวาขอมลสวนตวของผโดยสารมความสมพนธกบระดบ
ความพงพอใจดงน ในการบรการทง 5 ดาน ดานความเชอมนไดรบการจดอนดบสงสด ในแตละดาน
ของขอมลสวนบคคลทง 5 ประการ ไดแก อาย อาชพ รายไดตอเดอน จดประสงคในการเดนทาง
และความถในการเดนทาง โดยทผโดยสารกลมอายระหวาง 20-40 ป กลมทไมไดระบอาชพ
กลมทมรายไดตอเดอนมากกวา 60000 บาท กลมทเดนทางทองเทยว และกลมทเดนทาง
กบการบนไทยมากกวา 10 ครงตอป มความพอใจดานบรการในดานความเชอมน ในระดบสงสด
ทคาเฉลย 378 348 350 353 และ 360 ตามลาดบ
The Masterrsquos Project Advisor Chair of Business English for International
Communication Program and Oral Defense Committee have approved this Masterrsquos
Project Passengersrsquo Satisfaction with Service Quality A Case Study of Thai Airways
Internationalrsquos Domestic Flights by Mr Wilas Mankongvanichkul as partial fulfillment
of the requirements for the Master of Arts Degree in Business English for International
Communication of Srinakharinwirot University
Masterrsquos Project Advisor
helliphelliphelliphelliphelliphelliphelliphelliphelliphelliphelliphelliphelliphelliphelliphelliphelliphelliphelliphellip
(Assistant Professor Sirinna Boonyasaquan)
Chair of Business English for International Communication Program
helliphelliphelliphelliphelliphelliphelliphelliphelliphelliphelliphelliphelliphelliphelliphelliphelliphelliphelliphellip
(Assistant Professor Sirinna Boonyasaquan)
Oral Defense Committee
helliphelliphelliphelliphelliphelliphelliphelliphelliphelliphelliphelliphelliphelliphelliphelliphelliphelliphelliphellip Chair
(Assistant Professor Sirinna Boonyasaquan)
helliphelliphelliphelliphelliphelliphelliphelliphelliphelliphelliphelliphelliphelliphelliphelliphelliphelliphelliphellip Committee Member
(Dr Wanlapa Thaijinda)
helliphelliphelliphelliphelliphelliphelliphelliphelliphelliphelliphelliphelliphelliphelliphelliphelliphelliphelliphellip Committee Member
(Dr Saengchan Hemchua)
This Masterrsquos Project has been approved as partial fulfillment of the requirements
for the Master of Arts Degree in Business English for International Communication of
Srinakharinwirot University
helliphelliphelliphelliphelliphelliphelliphelliphelliphelliphelliphelliphelliphelliphellip Dean of the Faculty of Humanities
(Associate Professor Akkara Buntip)
May hellip 2010
ACKNOWLEDGEMENTS
I wish to express my deep gratitude to Assistant Professor Sirinna
Boonyasaquan my masterrsquos project advisor for her dedication in giving helpful advice
constructive comments and encouragement throughout the research Her valuable
guidance and comments made this research project possible
My heartfelt appreciation goes to Dr Wanlapa Thaijinda Dr Saengchan
Hemchua and Dr Phnita Kulsirisawad my project committee as well as Ms Sopin
Chantakloi my questionnaire advisor for their valuable comments and recommendations
which add greatly to my research
I am very grateful to Mr Surachart Suvikapakornkul Air Purser for his full
support and suggestions to the questionnaire
Lastly special thanks go to my classmates for their encouragement and good
support during the precious time at Srinakarinwirot University
Wilas Mankongvanichkul
TABLE OF CONTENTS
Chapter Page
1 INTRODUCTION 1
Rationale of the Study 1
Objectives of the Study 3
Significance of the Study 3
Scope of the Study 3
Definition of Terms 4
2 REVIEW OF LITERATURE 6
The Aviation Industry in Thailand 6
Customer Satisfaction 8
Service Quality 11
SERVQUAL Model 14
Demographic Variables 17
Previous Related Studies on Airline Passengersrsquo Satisfaction 18
3 METHODOLOGY 21
Participants of the Study 21
Research Instrument 22
Procedures of the Study 22
Data Analysis 23
TABLES OF CONTENTS (Continued)
Chapter Page
4 FINDINGS 26
Demographic Data 26
Level of Passengersrsquo Satisfaction 29
Passengersrsquo Satisfaction Level in Relationship with Their Demographic
Data
30
Other Comments 36
5 CONCLUSION AND DISCUSSION 37
Conclusion 37
Discussion 39
Limitations of the Study 46
Recommendations for Further Studies 47
REFERENCES 48
APPENDICES 54
A Questionnaire Thai Version 55
B Questionnaire English Version 57
C Questionnaire Specifications 59
VITAE 60
LIST OF TABLES
Table Page
1 Interval of Satisfaction Level 24
2 Participantsrsquo Age 26
3 Participantsrsquo Occupation 27
4 Participantsrsquo Monthly Income 27
5 Participants Purpose of Travel 28
6 Participantsrsquo Frequency of Travel 28
7 Relationship between the Participantsrsquo Age and their Satisfaction 31
8 Relationship between the Participantsrsquo Occupation and their Satisfaction 32
9 Relationship between the Participantsrsquo Income and their Satisfaction 33
10 Relationship between the Participantsrsquo Purpose of Travel and their
Satisfaction 34
11 Relationship between the Participantsrsquo Frequency of Travel and their
Satisfaction 35
LIST OF FIGURE
Figure Page
1 Overall Level of Passengersrsquo Satisfaction 30
CHAPTER ONE
INTRODUCTION
11 Rationale of the Study
The entry of low cost airlines in Thailand has rapidly increased in number There
are some reasons why the low cost airlines take this position One of them is that the full-
fare airlines have insufficient flights to cover all the destinations and another is that the
commercial promotions of low cost airlines are successful At the same time this has
posed a heavy challenge to existing airlines that run full-priced service Thai Airways
International (TG) the national airline of Thailand is no exception even though it has
been recognized as a provider of better service and more convenience to passengers
(ldquoTHAI AIRWAYS INTL Official 4-Star Ranking of Product and Service Qualityrdquo
2009) Still the company has to compete against those low cost airlines which fly to
similar destinations
Being a national airline TG has to overcome its competitors not by reducing the
ticket prices but by increasing their service quality to enhance passengersrsquo satisfaction
level In order to do that TG needs to understand the importance of how to make the
passengers satisfied with a high quality service
Regardless of the size of your business and whether it is product-based or service-
based (Rueangthanakiet 2008) to be successful depends on a high level of customer
satisfaction As customer satisfaction strategies are proven to enhance service quality of
the business knowing how to provide passengers with satisfaction is very useful to TG to
increase its competitive advantages
2
Customer satisfaction service arises when a company can provide customers with
benefits that exceed customersrsquo expectation and this is considered value-added If
customers are satisfied with a product or service they will buy more and do so more
often (Griffin 1995) All businesses always try to find ways to make customers happy by
all means to meet and even exceed their expectations in order to win their loyalty
TG has focused on service quality to increase passengersrsquo satisfaction and the
companyrsquos market share for years TGrsquos current motto ldquoService from the Heartrdquo clearly
indicates that the company has placed paramount importance to service The findings
from a study (Ostrowski OrsquoBrien amp Gordon 1993) revealed that airlines could acquire
and retain customer loyalty by offering high quality service Providing a superior service
quality should therefore be the main agenda for all airlines in order to remain
competitive in the market
However there are various factors affecting customersrsquo satisfaction with a
companyrsquos service Service provided can be tangible or intangible The service-related
equipment brochures magazines or even service operatorsrsquo uniforms are considered
tangible factors which can enhance customerrsquos satisfaction with the companyrsquos service
The quality of the tangibles is easier to improve since the tangibles are concrete On the
contrary it is difficult to evaluate the quality of service when taking the intangible factors
into account (Heesawat 2005) The intangibles such as personal needs and expectations
are abstract Expectation of a person differs from one to another Consumersrsquo
expectations can be influenced by word of mouth past experience etc The best way is
to provide the best service Research and development projects should be more
frequently carried out in a service organization to keep pace with how customers feel
towards the service The SERVQUAL instrument (Parasuraman Zeithamal amp Berry
1985) has been considered one of the effective tools used to assess a companyrsquo s service
3
quality so as to see if the company needs to better serve the customers and what service
areas need to be improved
12 Objectives of the Study
The main objectives of this study were first to explore the level of passengersrsquo
satisfaction with the service quality on Thai Airways Internationalrsquos domestic flights in
terms of five dimensions of SERVQUAL instrument reliability assurance tangibles
empathy and responsiveness Second the relationship of the satisfaction with the research
participantsrsquo demographic profile ie age occupation income purpose of travel and
frequency of travel were investigated
13 Significance of the study
The outcomes of this study would help TGrsquos customer service managers and other
practitioners to better understand the overall picture of TG service delivery and also of
their passengersrsquo satisfaction level Moreover the results from this research would assist
airline managers to better serve their customers monitor and develop service quality to
achieve the highest level of their passengersrsquo satisfaction It was hoped that the findings
could help TG increase its competence to compete with other airline companies In
addition the findings would enhance other airliners to improve their customer relations
management as well as their brand loyalty
14 Scope of the Study
The research was focused on a sample group of 150 Thai passengers 75 males
and 75 females who traveled with ten TGrsquos domestic flights on the route from Bangkok to
Chiangmai The Bangkok - Chiangmai route was chosen for the study because TG had
4
the highest number of domestic passengers traveling on this route as Chiangmai has
served as both domestic and international airline hub (THAI 2008)
The questionnaire employed in the study was based on the SERVQUAL
instrument (Parasuraman et al 1985) It was used to reflect the companyrsquos service in
five dimensions reliability assurance tangibles empathy and responsiveness
15 Definition of Terms
SERVQUAL is a tool developed by Parasuraman et al (1985) and is used to
measure service quality via five dimensions (RATER)
Reliability is the ability to perform the service in an accurate and dependable
manner
Assurance involves the knowledge and courtesy of employees and their
ability to convey trust and confidence
Tangibles present the appearance of physical factors such as equipment
facilities and personnel
Empathy indicates providing individual attention and care to customers
Responsiveness refers to the willingness to provide help and prompt service
to customers
Service quality is a customerrsquos perception that occurs when the need of service is
met above average more than just adequate In other words service quality is the ability
of service that meets a customers expectations for that service It represents the
properties of the service valued by the customer According to Parasuraman et al
(1985) service quality is measured by five dimensions (RATER) reliability assurance
tangibility empathy and responsiveness
5
Customer satisfaction is a measure of how a product and service supplied by a
company meets or surpasses customer expectation It is seen as a key performance
indicator within business and is an indication of how successful the company is at
providing products andor services to the market Customer satisfaction is an abstract
concept and the actual happening of the state of satisfaction will vary from person to
person and productservice to productservice In a competitive market where businesses
compete for customers customer satisfaction is considered a key element of business
strategy (Gitman amp McDaniel 2005)
CHAPTER TWO
REVIEW OF LITERATURE
This chapter presents a review of literature and research which is related to the
study It comprises six topics the aviation industry in Thailand customer satisfaction
service quality SERVQUAL instrument demographic variables and previous related
studies
21 The Aviation Industry in Thailand
The world economic crisis and the uncertainty of Thai political situations have
directly affected customer purchasing power of all kinds of businesses including the
airline industry The Tourism Authority of Thailand (TAT) has tried to boost the
domestic travel in several ways including an offer of promotional traveling packages
This is a tactic of turning a crisis to an opportunity as well as enhancing domestic airlinesrsquo
sales
To provide a detailed picture on this topic two issues are discussed domestic
airline operators and the nature of airline business onboard services
Domestic Airline Operators
In terms of fare the domestic airlines that are currently operating in Thailand are
low-cost airlines and full-fare airlines
A low-cost airline is an airline which charges relatively lower fares To generate
more revenue from loss of decreasing margin of ticket prices the low-cost airline may
ask for extra charges for such as food priority boarding seat allocating and baggage
7
privileges etc This type of airlines includes Bangkok Airways Nok Air Orient Thai
Airlines and Air Asia
Meanwhile a full-fare airline sells tickets at full prices and traditionally offers
three travel classes namely first business and economy classes Thai Airways
International is the sole operator in Thailand who operates this type of airline service TG
is serving 10 airports domestically and providing sufficient capacity to serve local
demands During the festive season extra flights are provided in a greater number to
meet peak demands particularly those to Chiangmai and Phuket (THAI 2009)
TG flies to two destinations in the North ie Chiangmai and Chiangrai three
destinations in the Northeast ie Khonkaen Udonthani and Ubolratchathani and five
destinations in the South ie Phuket Hatyai Suratthani Krabi and Samui
To recap there are two major groups of domestic airlines in terms of airfare which
are low cost and full-fare airlines TG is the only full-fare airline operator in Thailand
The Nature of Airline Business On-board Services
The airline business has become more competitive and most airlines in
considering their competitive edge take into account the quality of service to be offered
to customers (Palin 1996) Typically a service package includes lsquotangiblesrsquo which refer
to goods provided for customers and lsquointangiblesrsquo which are those related to the quality of
service offered to the customers The in-flight service-package includes both tangibles
and intangibles The problem to be addressed is the need to ensure that all the flights are
fully stocked with the physical items in the service package together with hygienic and
functional equipment requested by cabin crew for providing service These goods fall
into four categories
1 Food items including beverages to be consumed on board
8
2 Non-food items comprising an extensive list which may include newspapers
blankets toilet bags headsets for aircraft audio-visual systems
3 Duty-free goods for passengers to purchase on the aircraft
4 Equipment required by cabin crew for providing service The service
equipment includes tea and coffee-making equipment first aid kits etc
Nevertheless the quality of a service package not only depends on food drinks
and facilities on the aircraft such as newspapers blankets toilet bags headsets etc but it
also depends on the skills and knowledge of cabin crew who serve passengers to create
positive attitudes toward the airline and to enhance the brand loyalty
In conclusion the aviation industry in Thailand is very competitive Low-cost
airlines have increasingly become more popular because of the economic crisis To
compete with those budget airlines TG needs to find ways to retain and attract
passengers
22 Customer Satisfaction
It is impossible for any business to sustain itself without customers Accordingly
factors contributing to any successful business mainly result from customer satisfaction
customer loyalty and customer retention One important factor in determining the
likelihood of success and profits of an organization is customer satisfaction Customer
satisfaction results in customer loyalty When there is customer loyalty the customer
retention rate is high and good business results tend to follow
Customer satisfaction a business term is a measure of how products and services
supplied by a company meet or surpass customersrsquo expectation In a competitive
marketplace where businesses compete for gaining more customers customer satisfaction
9
is seen as a key performance indicator within a business and has increasingly become a
key element of business strategy (Gitman amp Carl 2005)
Hennig-Thurau and Klee (1997) state that customer satisfaction with a companys
products or services is often regarded as the key to the companys success and long-term
competitiveness Customer satisfaction is also often viewed as a central determinant of
customer retention A high customer satisfaction level yields several benefits It
heightens customersrsquo loyalty and prevents customersrsquo complaints lowers customersrsquo
price sensitivity reduces the costs of failed marketing and of new customer creation
reduces operating costs due to an increase in number of customers improves the
effectiveness of advertising and enhances business reputation (Fornell 1992) However
specialists on satisfaction indicate that the main factors determining customer satisfaction
are the customersrsquo own perceptions and expectations of service quality (Zeithaml amp
Bitner 2000)
Customersrsquo expectation and perception
Customersrsquo perception of service quality depends on the degree of the service that
meets the customersrsquo expectations service providers must know how to shape those
expectations The messages from service providers contribute significantly to expectation
development because the service is mostly regarded as intangible and people cannot
readily observe for themselves what to expect It is critical that the service provider gives
information to customers as clearly and accurately as possible before the customers make
a purchase Organizations that create unrealistic expectations in an effort to sell a service
are likely to find their customersrsquo satisfaction low Those unhappy customers will tell
others and the credibility of the business will be damaged (Gilbert 1999)
10
To ensure highly perceived quality and to maintain loyal customer base service
providers need to be accurate and reasonable about what they lead customers to expect
They also need to do a good job in the areas of reliability assurance tangibles empathy
and responsiveness It is difficult for companies to get ahead of the competition and the
nature of competition in the service industry is more difficult to protect from imitation
Competitors are increasingly forced to imitate the best features of one another
Therefore any competitors who try to invest more energy and resources in building
strong service quality are most likely to be winners (Gilbert 1999)
Factors Affecting Consumers Expectation
The key factors influencing consumersrsquo view on service quality include word of
mouth personal needs customersrsquo past experience and external communication
(Parasuraman et al 1985)
Word of mouth is particularly important because when consumers are satisfied or
dissatisfied with the service they are likely to share it with their friends Service is
generally classified as intangible Customers cannot actually ldquoseerdquo the service until they
experience it Before making a purchase customers need to find out as much information
as possible so as to make a good decision Word of mouth is a means to make a
consumer feel interested or uninterested in the service
Personal needs are considered another important factor They deal with the
motives that determine the nature and strength of what a consumer expects from a
service
Meanwhile past experience refers to what consumers have learned through their
personal interaction with a service provider It is particularly important in shaping
customersrsquo expectations
11
The last factor is external communication comprising such as direct sale and
advertisement in order to communicate and position a service through messages which
can influence consumer perceptions
In summary each factor can individually or harmoniously affect consumersrsquo
purchasing decision Customer satisfaction is a key to business success In order to make
customers satisfied a company needs to understand their expectations and perception by
studying the factors that affect their purchasing decision
23 Service Quality
A search for the definition of ldquoqualityrdquo has yielded inconsistent results Quality
has been variously defined as fitness for use in the product which successfully serves the
purpose of the user during usage (Juran amp Gryna 1974) In addition Zeithaml et al
(1990) state that ldquoqualityrdquo is what exceeds the customersrsquo expectation of the service
On the other hand quality is a characteristic of thoughts and statements believed
to be taken for granted if an explanation of quality is going to be both false and true
precisely (Pirsig 1987) Pirsig also says that since definitions derive from abstract and
formal thinking quality cannot be defined it is impossible to define quality because
quality can never be considered independently but only in relation to what is perceived
Measuring Quality in Service
Parasuraman et al (1985) point out that service quality is more difficult for the
consumers to evaluate than the product quality Perception of service quality results from
a comparison of customer expectations with actual service performance Quality
evaluations are made not only from the outcome of a service but also from the ldquoprocessrdquo
12
of service delivery and the customers have fewer tangible characters to be measured
physically when purchasing services than when purchasing products (Gronroos 1978)
Service quality is the degree of how well the service level delivered matches
customer expectations Delivering quality service means that the service provider needs
to follow customer expectations on a consistent basis (Lewis amp Booms 1983)
To conclude three underlying service quality themes can be drawn from the
discussion as follows
Service quality is more difficult for the customer to evaluate than product quality
Service quality perceptions result from a comparison of consumer expectations
with actual service performance
Quality evaluations are not made solely on the outcome of a service They
involve evaluations of the process of service delivery
The Benefits of Service Quality
The benefits of service quality comprise four areas as follows (Kotler 2000)
Customers Retention High quality builds loyal customers and creates positive word of
mouth which is an important factor in purchase decision This can determine customer
satisfaction which affects repeat business If a customer is happy with an existing firm it
is difficult to convince him or her to move to another
Avoidance of Price Competition A firm with a reputation for high quality has
a much stronger competitive position than one with a reputation for poor quality Price-
cutting by a competitor will not be enough to encourage a client to switch Good quality
is more powerful to remain competitive
13
Retention of Good Employees Employees appreciate working in operations
that are well run and produce quality products They do not enjoy receiving customer
complaints Also turnover and loss of employee morale are listed as costs of poor quality
manpower When an operation has good quality it can retain good employees And at
the time business expansion is needed recruiting is easier and training cost is reduced
Reduction of Costs The quality cost includes internal costs external costs and
quality system costs Internal costs are those associated with correcting problems
discovered by the firm before products reached customers External costs are related to
errors that the customers experience They can be very expensive when the customers
decide not to return because of a service problem Then the promotional and advertising
costs or external costs are necessary to be spent to create the company image in order to
make customers come back and win brand loyalty for the company in the end However
the company needs to check the service quality through customersrsquo feedback periodically
to avoid problems
Although the quality service system does not come without costs it is usually less
than those internal and external costs resulting from poor quality service Some examples
of the costs of a quality system include customer service audits trainings management
meetings with employees and customers and introduction of a new technology (Kotler
Bowen amp Makens 1999)
To sum up it is necessary for a service company to know the service quality level
The quality needs to be evaluated by comparing customer experience with service
performance Once a service company reaches a good quality level a company will
retain its customers easily be away from price wars keep and get good employees and
reduce some operation costs
14
Thai Airways In-flight Service Quality
The latest airline evaluation in 2009 by Skytrax from United Kingdom which is a
research organization focused on in-flight services revealed that TG got the official 4-star
ranking for its product and service quality This honor is awarded to airlines which
deliver a good quality performance
Skytrax also disclosed that for short travels or domestic routes two traveling
classes are business class and economy class The overall evaluation of the domestic
route showed that TGrsquos business class was rated excellent (5-star) in two articles which
are ldquowashroom cleanlinessrdquo and ldquonewspaper amp magazinerdquo in terms of ldquoonboard productrdquo
category Meanwhile TG also got the highest rank in terms of ldquoservice efficiencyrdquo and
ldquoresponding to requestsrdquo in ldquocabin staff servicerdquo categories In addition in the economy
class TG could do superbly in three articles of cabin staff service which were ldquoservice
efficiencyrdquo ldquoenthusiasm and attituderdquo and ldquofriendliness and hospitalityrdquo (ldquoTHAI
AIRWAYS INTL Official 4-Star Ranking of Product and Service Qualityrdquo 2009)
In conclusion TG has been recognized internationally however it still needs to
move ahead The quality ranking is useful for TG to realize that the company needs to
develop its products and services in all categories in order to step up and well-prepared
for competitions in the future
24 SERVQUAL Model
SERVQUAL is an instrument used for measuring how customers perceive the
quality of the service This instrument is based on five dimensions and on a comparison
between customersrsquo expectations of how the service should be performed and their
experiences of how the service is actually performed Usually 20 attributes are used to
describe the five dimensions and participants are asked to state what they expect from the
15
service and how they perceive the service on a five-point scale from ldquoexcellentrdquo to
ldquopoorrdquo Based on the difference between expectations and experiences over the 20
attributes an overall quality score can be calculated The higher the score shows that
experiences are below expectation the lower the perceived quality (Parasuraman amp
Berry 1991)
SERVQUAL consists of five dimensions (RATER) as follows (Parasuraman et
al 1985)
Reliability This means that a service firm provides its customers with accurate
service the first time without making any mistakes and delivers what it has promised to
do by the time that has been committed
Assurance This means that employeesrsquo behaviors give customers confidence in
the firm and that the firm makes customers feel safe It also means that the employees are
always courteous and have the necessary knowledge to respond to customers questions
Tangibles This dimension relates to the appeal of facilities equipment and
materials used by a service firm as well as to the appearance of service employees
Empathy This means that the firm understands the customersrsquo problems and
performs in their best interests as well as giving customers individual personal attention
and having convenient operating hours
Responsiveness This means that employees of a service firm are willing to help
customers and respond to their requests as well as to inform customers when service will
be provided and give prompt service
16
Application of SERVQUAL Model in Hospitality Business
The SERVQUAL instrument has been used to assess the quality of a wide range
of services in the United States such as financial service operations telephone services
repair and maintenance services (Parasuraman et al 1988) and other professional
services (Bojanic 1991) Fick and Ritchie (1991) have employed the SERVQUAL
instrument to compare services provided by various types of organizations within the
travel and tourism industry Oberoi and Hales (1990) have examined the SERVQUAL
approach as a basis for measuring the quality of the conference hotel products Many
researchers of other service businesses believed that ldquoSERVQUALrdquo is a concise multiple-
item scale with good reliability and validity (Buttle 1996 Lages amp Fernandes 2005)
In Thailand Boontaganon (2002) studied the service quality of fast food
restaurants in Bangkok by using SERVQUAL The study examined the differences in
service quality expectations and perceptions based on demographic characteristics
including gender age occupation education and income level 360 questionnaires were
distributed to people who had just exited from fast food outlets in Bangkok The results
showed significant differences in service quality of customer expectations and
perceptions which indicated the unacceptable service quality delivered by fast food
restaurants in Bangkok
Suthirungkul (2003) studied the customer expectations and perceptions of service
quality of the Clark Hatch Fitness Center at Silom Road Branch Bangkok The objectives
of the study were to identify the SERVQUAL dimensions that customers both local and
foreign used to evaluate The Clark Hatch Fitness Center to study the customer
expectations towards the services quality that should be provided and to evaluate the
perceptions of service quality that customers obtained after using service The
questionnaire was used as a tool for collecting the data 277 Thai and foreign members of
17
the Clark Hatch Fitness Center at Silom Road Branch were the research participants The
results of the study were that there existed gaps between expectations and perceptions in
terms of the five SERVQUAL dimensions and the demographic characteristics had
influenced the gap scores
In short SERVQUAL is an effective measuring tool This tool has widely been
used in many previous studies in hospitality business both domestically and
internationally
25 Demographic Variables
In general business sector market segmentation is often based on demographic
profiles (Reid amp Bojanic 2001) in order that marketers can choose the proper service
segmentation strategies to satisfy different target market segments Demographics are the
variables about consumersrsquo wants preferences and usage rates are often associated with
demographic variables Moreover the demographic variables are easier to measure
(Kotler 2000) Important demographics are as follows
1 Gender There is no logical reason to expect biology to account for this
difference between the sexes The explanation may be in socialization differences and
personality disposition Feminine gender identity is characterized by traits such as
expensiveness and emotionalism and other orientation while masculine gender identity is
characterized by independence activity and self orientation (Kotler amp Scheff 1997)
2 Age Consumersrsquo wants and abilities change with age People buy different
goods and services over their lifetime Peoplersquos tastes in different products and services
are also related to age (Kotler 2000)
18
3 Occupation This variable reflects values attitudes taste and lifestyle
Occupation and income tended to be closely correlation on almost cause-and-effect
relationship (Schiffman amp Kanuk 1994)
4 Income Consumers form a purchase intention based on such factors and
expected family income price and expected benefits from the product and services
(Kotler 1997)
5 Purpose of Travel The purpose of travel measure the frequent distribution
The purposes of travel are for such as business holiday visiting friends and relative and
others (ldquoTravel Planningrdquo 2010)
6 Frequency of Travel A critical factor in predicting the demand for tourism
within a certain period of time is the number of trips individuals take New touristsrsquo
behavior shows a tendency toward more frequent travel (Alegre amp Pou 2006)
To recap the demographic profiles play a significant role in planning service to
meet passengersrsquo satisfaction In airline business six features of the demographics were
included in this study
26 Previous Studies on Airline Passengersrsquo Satisfaction
In an airline business the major revenue of a company comes from the number of
passengers rather than a total sum of cargo service aircraft maintenance or catering
supply all together Studies on airline passengersrsquo satisfaction are numerous as the
following examples
Gilbert and Wong (2003) identified the service dimensions that matter most to
current airline passengers The study measured and compared differences in passengersrsquo
expectations of the desired airline service quality in terms of reliability assurance
19
facilities employees flight patterns customization and responsiveness The primary data
were collected from passengers departing from Hong Kong airport Regarding the
service dimension expectations it was found that there were no statistically significant
differences between passengers who made their own airline choice (decision makers) and
those who did not (non-decision makers) However there were significant differences
among passengers of different ethnic groups nationalities as well as among passengers
who traveled for different purposes such as business holiday and visiting friends or
relatives
The findings also indicated that passengers consistently ranked lsquoassurancersquo as the
most important service dimension It showed that the passengers were concerned about
the safety and security aspects and this also indicated why there had been such a
downturn in demand as this study was conducted just prior to the World Trade Center
incident on September11 2001
In Thailand Somwang (2008) assessed the passengersrsquo views of service quality in
Thai low cost airlines The research was based on the principle that passengers evaluated
airline service quality through a comparison between their experiences and expectations
over a number of quality attributes The study evaluated passengersrsquo perceived service
quality of Thai low cost carriers based on the SERVQUAL instrument The findings
indicated that the passengersrsquo expectations on service quality were higher than what they
had actually experienced Further analysis showed that female passengers had lower
perceived service quality than male passengers The findings also revealed that higher
monthly income had greater differences with respect to expectations and perceptions than
lower income respondents Furthermore passengers usually traveled with low cost
carriers for three main purposes which were for leisure visiting friends or relatives and
business
20
In brief the previous studies explored the satisfaction of airline passengers by
using SERVQUAL instrument to measure the service quality The results above found
out the differences between customersrsquo expectations and perceptions The findings of a
study in Hong Kong revealed the passengersrsquo satisfaction on the dimensions of the
service quality Meanwhile a study in Thailand implied some findings about the
demographic profiles resulting in service quality Studies on service quality help improve
business organizations retain customers and attract new customers
CHAPTER THREE
METHODOLOGY
This chapter consists of four sections participants of the study research
instrument procedures of the study and data analysis
31 Participants of the Study
One hundred and fifty Thai passengers 75 males and 75 females who took the
TG Bangkok - Chiangmai route were randomly chosen as participants for the study
Since there are about 150 passenger seats in each flight the researcher randomly acquired
a sample size of 10 percent of the overall passengers from the ten flights totaling 150
Thai people are the main group of passengers who travel domestically over the year The
researcher therefore decided to select only the Thai passengers as the participants for the
study Also so as to cover various types of passengers the researcher included flights of
different time within a day (as shown in a following part of this chapter) for a reason that
passengers with some specific purposes chose to travel at some specific time For
example business people might prefer an early morning flight rather than a later-in-the-
day one
TGrsquos Bangkok ndash Chiangmai route has been considered one of the most frequent
domestic routes (THAI 2009) TG operates ten flights daily from Bangkok to
Chiangmai The researcher consequently chose this route for this research work to
assess the passengersrsquo satisfaction with TGrsquos service quality
The study was conducted in early March when it was still in the high season for
travels to the northern province of Thailand Fifteen passengers from each of the ten
flights of the Bangkok - Chiangmai route were asked to fill out the questionnaire at the
22
end of the on-board service while the plane was approaching Chiangmai its destination
All the 150 completed questionnaires were obtained as planned
32 Research Instrument
A questionnaire in Thai was used for data collection The questionnaire was
divided into three parts The first part was about the respondentsrsquo demographic profile
since consumersrsquo needs preferences and personalization are often associated with
demographic factors (Kotler 2000) Six demographic characteristics related to in-flight
service (Cheosakul 2004) consisting of gender age occupation monthly income
purpose of travel and travel frequency with THAI were demographic issues of the survey
The second part comprised questions about passengersrsquo satisfaction with the service
during the flight This part of the questionnaire was based on the SERVQUAL
instrument for measuring customersrsquo satisfaction in five dimensions of service reliability
assurance tangibles empathy and responsiveness (Parasuraman et al 1985) The last
part comprised a question and a blank space provided for suggestions on TGrsquos service
quality
33 Procedures of the Study
The questionnaire was initially approved by the researcherrsquos masterrsquos project
advisor and two specialists a TG in-flight service manager and a SWU lecturer Then a
pilot study was conducted to ten passengers to check for content reliability the
appropriateness of the number of questions and language used in the questionnaire As
the researcher included all the ten flights of TGrsquos Bangkok - Chiangmai route in the
study the tried-out questionnaire was randomly distributed to ten TG passengers (5 males
and 5 females) on each flight of the aforementioned route on the same day in February
23
2010 Also since this study was about onboard service the questionnaire was distributed
to the participants after the in-flight service was completed and before the plane landed
After that the questionnaire was adjusted and prepared for the actual survey
The revised questionnaire was eventually distributed to 150 participants in ten
consecutive days in early March 2010 Fifteen passengers in each Bangkok -
Chiangmai flight per day were randomly asked to fill out the questionnaire after the
completion of in-flight service
The plan below showed the ten flights of for the survey each flight for a day to
make sure that the data gained were reliable
BKK-CNX Flight (TG) Flight Schedule (Departure-Arrival)
TG100 0615-0725
TG102 0750-0910
TG104 0910-1030
TG106 1020-1140
TG110 1250-1400
TG112 1400-1510
TG114 1540-1650
TG116 1715-1825
TG120 1900-2010
TG122 2130-2240
34 Data Analysis
The data acquired from the questionnaires were analyzed in three sections
demographic profile of passengers level of passengersrsquo satisfaction with TGrsquos service
and the relationship between demographic profile and passengersrsquo satisfaction based on
24
Likert scale The 5-point Likert scales were used to rate the level of satisfaction as shown
in Table 1 below
Table 1 Intervals of Satisfaction Level (Poonlarbtawee 1987)
The interpretation of the scales in this study is as follows
Rating
Scale
Level of
Agreement Disagreement
Satisfaction
Level
Mean Score
5 Strongly agree Excellent 451-500
4 Agree Good 351-450
3 Uncertain Average 251-350
2 Disagree Fair 151-250
1 Strongly disagree Poor 100-150
The researcher picked up lsquothe high grouprsquo and lsquothe low grouprsquo of each
SERVQUAL dimension to present the relationship between the participantsrsquo
demographic profile and their satisfaction As the data gained from the highest number of
the participants or the high group was the major point that the researcher relied on focus
was on the majority opinion At the same time the data gathered from the lowest number
of the participants or the low group should not be overlooked because each and all
passengers are important for TG and in the high competitive airline market it is necessary
to retain each and every passenger so as to grow far in the aviation business
The results were presented in terms of percentages and mean scores in the form of
tables and a bar chart These fundamental statistic methods were proper in this study
25
because percentages and mean scores are considered the basic statistics used for data
analysis and presentation Also the general public can easily understand the
interpretation of the data Another reason was that the sample group of this study
comprised only 150 TG passengers The researcher therefore decided to apply the
aforementioned statistics in this research Discussion of the results was also offered
CHAPTER FOUR
FINDINGS
This chapter describes the findings of the study consisting of the demographic
data of the participants level of their satisfaction with TGrsquos service quality relationship
between the demographic data and five dimensions of SERVQUAL instrument and the
uncovers to the last question on the questionnaire including suggestion
41 Demographic Data
The demographic data of TGrsquos research participants in terms of age occupation
monthly income purpose of travel and frequency of travel are presented in Tables 2- 6
below
Table 2 Participantsrsquo Age
Age No of Participants Percentage ()
Under 20 years
21-40 years
41-60 years
Above 60 years
8
85
45
12
53
567
300
80
Total 150 100
Regarding the age group the highest number of the passengers was 20-40 years
old or 567 30 of them were 46-60 years old and 8 were above 60 years old Only
53 were under 20 years old
27
Table 3 Participantsrsquo Occupation
Occupation No of Participants Percentage ()
Government official State enterprise employee
Business employee
Business owner
Student
Retiree
Others
22
63
37
13
9
6
147
420
247
86
60
40
Total 150 100
In terms of occupation the highest number of the participants was business
employees (42) followed by business owners (247) government officials or state
enterprise employees (147) students (86) retirees (6) and other occupations (4)
respectively
Table 4 Monthly Income
Monthly income (baht) No of Participants Percentage ()
Up to 20000
20001- 40000
40001 - 60000
60001 and above
58
72
11
9
386
480
74
60
Total 150 100
For the income the highest number of the participants earned 20001-40000 baht
monthly (48) followed by those with a monthly income of up to 20000 baht (386)
28
of 40001-60000 baht monthly (64) and of 60001 baht and above monthly was the
lowest (6)
Table 5 Purpose of Travel
Purpose of travel No of Participants Percentage ()
Business trips
Holidays
Visits
Others
41
79
27
3
273
527
180
20
Total 150 100
Regarding the purpose of travel the highest number of the passengers traveled via
TG on holidays (527) followed by those who traveled on business trips (273)
Meanwhile those who made a visit were at 180 and who traveled with other purposes
were at 2
Table 6 Frequency of Travel
Frequency in traveling with THAI
(during the last 12 months)
No of Participants Percentage ()
First time
2-3 times
4-10 times
More than 10 times
39
99
10
2
260
660
67
13
Total 150 100
29
The last demographic data derive from the frequency in traveling with THAI
66 of the participants indicated that they traveled 2-3 times during the last 12 months
26 traveled for the first time while 67 for 4-10 times and 13 for more than 10
times during the last 12 months
In conclusion the demographic data shown in the tables above indicated that lsquothe
high grouprsquo comprised the following characteristics The age group of the majority
number of the participants ranged from 21-40 years (567) Most of them were business
employees (42) The highest number of the passengersrsquo monthly income was around
20000 ndash 40000 baht per month (48) The majority of the passengers traveled on
holidays (527) by TG 2-3 times in the past 12 months (66)
Meanwhile lsquothe low grouprsquo was found having the following characteristics The
lowest number of the research participants was under 20 years old or 53 Only 47 of
the participants had other kinds of occupation which were not indicated on the
questionnaire while only 6 of the participants earned 60001 baht or above monthly
2 of the participants traveled on other purposes besides those shown on the
questionnaire Lastly 13 of the passengers were those who traveled by TG more than
10 times in the past 12 months
42 Level of Passengersrsquo Satisfaction
Figure 1 below is the conclusion from the second part of the questionnaire The
150 participants were asked to rate the level of service quality that they perceived from
the TGrsquos domestic flights on Bangkok - Chiangmai route The questionnaire was divided
into five dimensions of SERVQUALrsquos (Parasuraman et al 1985) service quality which
comprised reliability assurance tangibles empathy and responsiveness The scales 1 to 5
ranged from lsquostrongly disagreersquo to lsquostrongly agreersquo
30
0
5
Reliability Assurance Tangibles Empathy Responsiveness
280
345 334307
269
SERVQUAL Dimension
Figure 1 Overall Level of Participants Satisfaction
Mean scores
Figure 1 shows the average mean score of all 150 passengersrsquo satisfaction on five
dimensions of service quality ranging from the mean scores of 345 to 269 The results
revealed that the most important service quality dimension for the whole samples group
of passengers was assurance ( 345) followed by tangibles ( 334) empathy ( 307)
reliability ( 28) and responsiveness ( 269) respectively The overall average mean
was 307
43 Passengersrsquo Satisfaction Level in Relationship with Their Demographic Data
This section shows the relationship between the demographic data (age
occupation monthly income purpose of travel and travel frequency) of the participants
and their satisfaction with the service quality of TGrsquos in-flight service
The researcher focused on each category of demographic characteristics of two
major groups a group with the highest score and the other with the lowest score In fact
the most important data were the majority opinion of the sample group In other words
for this study it was lsquothe high grouprsquo However the researcher as a TG cabin crew gave
importance to the low group as well since each and every passenger is significant to TG
x
x x x
x x
31
business particularly in the high competitive market of airline business The researcher
was interested to know what the passengers in the lsquolow grouprsquo thought about the in-flight
service and what their feedback was
The following tables (Tables 7-11) illustrate the relationship between each
dimension of the demographic data and the SERVQUAL service assessment tool and the
following symbols are applied in the tables below
lsquoNrsquo means the number of the participants
lsquo rsquo means the mean score
lsquoThe high grouprsquo means the group that comprises the highest number of participants
lsquoThe low grouprsquo means the group that comprises the lowest number of participants
Table 7 Relationship between the Participantsrsquo Age and their Satisfaction with In-flight
Service
SERVQUALrsquoS
RATER
Average
Mean Score
of All Groups
The High Group
(Age 20-40 Yrs Old)
N = 85567
The Low Group
(Age Under 20 Yrs Old)
N = 853
Mean Score of Each Group
Reliability 280 278 270
Assurance 345 378 335
Tangibles 334 331 328
Empathy 307 309 314
Responsiveness 269 267 290
Table 7 reveals the connection between the participantsrsquo age and the five
dimensions of the SERVQUAL instrument The high group had higher mean scores for
x
32
three dimensions than the low group In other words the participants with an age range
of 20-40 years were more satisfied with TGrsquos service quality in terms of reliability
assurance tangibles than those who were under 20 years old Meanwhile the low group
had higher mean scores for two dimensions than the high group This means the
participants who were lower than 20 years old were more satisfied with the in-flight
service in terms of empathy and responsiveness than those whose ages ranged from 20-40
years
Interestingly it was found that both groups have a lower mean score for the
reliability dimension ( 278 and 270) than the average mean score of all the age groups
in this study ( 28)
Table 8 Relationship between the Participantsrsquo Occupation and their Satisfaction with In-
flight Service
SERVQUALrsquoS
RATER
Average
Mean Score
of All Groups
The High Group
(Business Employee)
N = 63420
The Low Group
(Others)
N = 640
Mean Score of Each Group
Reliability 280 275 284
Assurance 345 347 348
Tangibles 334 331 336
Empathy 307 310 305
Responsiveness 269 264 277
Table 8 illustrates the connection between the participantsrsquo occupations and the
five dimensions of the SERVQUAL instrument The low group had higher mean scores
x
x
33
for almost all the dimensions of SERVQUALrsquos RATER than the high group except for
one dimension In other words the participants who worked as business employees were
less satisfied with TGrsquos service quality in terms of reliability assurance tangibles and
responsiveness than those whose occupations were not specified in the questionnaire
Empathy was the only dimension of service quality that the participants who were in the
high group were satisfied with
Table 9 Relationship between the Participantsrsquo Income and their Satisfaction with In-
flight Service
SERVQUALrsquoS
RATER
Average
Mean Score
of All Groups
The High Group
(20001-40000)
N = 72480
The Low Group
(60001 and above)
N = 960
Mean Score of Each Group
Reliability 280 273 285
Assurance 345 349 350
Tangibles 334 332 321
Empathy 307 301 325
Responsiveness 269 262 273
Table 9 indicates the connection between the participantsrsquo monthly income and
the five dimensions of the SERVQUAL instrument The low group had higher mean
scores for almost all the dimensions of RATER than the high group except for one
dimension In other words the participants who earned monthly income of 20001 ndash
40000 baht were less satisfied with TGrsquos service quality in terms of reliability assurance
empathy and responsiveness than those who earned monthly income of 60001 baht and
34
above The tangibles dimension was the only service quality issue that the participants
who were in the high group were satisfied with
Table 10 Relationship between the Participantsrsquo Purpose of Travel and their Satisfaction
with In-flight Service
SERVQUALrsquoS
RATER
Average
Mean Score
of All Groups
The High Group
(Holidays)
N = 79527
The Low Group
(Others)
N = 320
Mean Score of Each Group
Reliability 280 279 285
Assurance 345 353 349
Tangibles 334 335 338
Empathy 307 308 312
Responsiveness 269 270 275
Table 10 reflects the connection between the participantsrsquo purpose of travel and
the five dimensions of the SERVQUAL instrument The low group had higher mean
scores for almost all the dimensions than the high group except for one dimension In
other words the participants who traveled on holidays were less satisfied with TGrsquos
service quality in terms of reliability tangibles empathy and responsiveness than those
whose purpose of travel were not specified in the questionnaire Assurance was the only
dimension of service quality that the participants who were in the high group were
satisfied with
35
Interestingly it was found that both groups has a higher satisfaction level for the
assurance tangibles empathy and responsiveness dimensions than the average mean
scores of the whole sample group
Table 11 Relationship between the Participantsrsquo Frequency of Travel with THAI and their
Satisfaction with In-flight Service
SERVQUALrsquoS
RATER
Average Mean
Score of All
Groups
The High
Group
(2-3 timesyear)
N = 99660
The Low Group
(more than 10
timesyear)
N = 213
Mean Score of Each Group
Reliability 280 281 295
Assurance 345 346 360
Tangibles 334 335 343
Empathy 307 308 321
Responsiveness 269 270 292
Table 11 presents the connection between the participantsrsquo frequency of travel
with THAI and the five dimensions of the SERVQUAL instrument The low group had
higher mean scores for all the dimensions of RATER than the high group In other
words the participants who traveled 2-3 times in the last 12 months were less satisfied
with TGrsquos service quality in terms of reliability assurance tangibles empathy and
responsiveness than those whose frequency of travel were more than 10 times in the last
12 months
36
Interestingly it was found that both groups has a higher satisfaction level for all
the five RATER dimensions than the average mean scores of the whole sample group in
this study
44 Other Comments
The last part of the questionnaire was designed to ask whether the participants
would continue using TGrsquos service The findings disclosed that 142 participants or
946 indicated that they would while 8 of them or 54 declined
Also at the end of the questionnaire there was a blank space for the participants to
freely express their own ideas and suggestions on TGrsquos service However only 7
participants or 46 gave suggestions regarding the in-flight service Four of the
participants were dissatisfied with the flavor of the snacks provided on board One
complained that it was not cool enough in the cabin while one was upset for not being
granted for a request for a blanket The last one commented that the passengerrsquos seat was
not comfortable
In summary the passengersrsquo satisfaction level of the service quality in connection
with their demographic data was introduced Five out of the six demographic
characteristics the participantsrsquo age occupation monthly income purpose of travel and
frequency of travel were analyzed in connection with the five dimensions of SERVQUAL
instrument reliability assurance tangibles empathy and responsiveness It was observed
that there were some connection between these two matters in various ways as earlier
discussed Lastly it was found that one hundred and forty-two participants would
continue using TGrsquos service while the rest refused Only seven of all the participants or
46 gave some comments on the open-ended suggestion part
CHAPTER FIVE
CONCLUSION AND DISCUSSION
This chapter presents the conclusion discussion limitations of the study and
recommendations for further studies
51 Conclusion
This research aimed to examine the service quality provided by Thai Airways
International on its domestic flights One hundred and fifty passengers who traveled by
TG on the Bangkok - Chiang Mai route were the research participants The SERVQUAL
instrument was used as an instrument for data collection in the survey This instrument
was based on five determinants proposed by Panasuraman etal (1985) in terms of
reliability assurance tangibles empathy and responsiveness This research was also
conducted on the demographic characteristics comprising gender age occupation
monthly income purpose of travel and frequency in traveling and the relationship of these
characteristics except the gender with the passengersrsquo satisfaction with TGrsquos in-flight
service quality The questionnaires were distributed in early March 2010
The results showed that all the participantsrsquo satisfaction based on the five
dimensions was at the average level The highest level of passengersrsquo satisfaction was
placed on the assurance dimension followed by tangibles and empathy dimensions
accordingly The two lowest levels of the passengersrsquo satisfaction were placed on the
responsiveness and reliability dimensions
In addition a summary of the demographic characteristics showed that the high
group or the group with the highest number of participants was business employees The
highest number of the participants was between 21-40 years old The highest number of
38
the participantsrsquo income ranged from 20000 ndash 40000 baht monthly Also the high
grouprsquos purpose of travel was to go on holiday Lastly the highest number of the
participants traveled via TG only 2-3 times during the past 12 months
Meanwhile the low group or the group with the lowest number of participants
was passengers with other kinds of occupations which were not specified on the
questionnaire The low group of the participants was under 20 years old The low group
of the participantsrsquo income ranged from 60001 baht monthly or higher Also the low
group revealed that they traveled via TG for other purposes which were not indicated on
the questionnaire Lastly the passengers who traveled via TG more than 10 times during
the past 12 months belonged in the low group
It has also been discovered that as a whole both groups the high and low groups
were in the same direction in their satisfaction with the five dimensions of service quality
The two groups were satisfied with the service quality dimensions in terms of assurance
at the highest level followed by tangibles empathy reliability and responsiveness
respectively
However when analyzing each demographic characteristic the participants who
were under 20 years old rated the responsiveness dimension higher than the reliability
dimension Also for those participants whose income was around 60001 or higher the
empathy dimension was rated higher than the tangibles Regarding the occupation
business people were satisfied with the reliability and responsiveness dimensions at a
very low level Meanwhile the participants who traveled via TG on their holidays rated
the assurance dimension at a very high level Lastly frequent fliers who traveled by
THAI more than 10 times were most satisfied with TGrsquos service since they rated all
RATER aspects highly
39
52 Discussion
The findings have revealed the answers to the research questions First the
demographic data of the participants gender age occupation monthly income purpose
of travel and frequency of travel were shown Second the level of the passengersrsquo
satisfaction toward the service quality on Thai Airways Internationalrsquos domestic flights in
terms of the SERVQUAL instrument (Parasuraman et al 1985) reliability assurance
tangibles empathy and responsiveness was disclosed Also the results about the
relationship between the passengersrsquo satisfaction and their demographic data were pointed
out
The results of the survey indicated that out of the five dimensions assurance was
rated at the highest level ( 345) followed by tangibles ( 334) and empathy ( 307)
(See Figure 1) In addition passengers rated their highest satisfaction with the assurance
dimension which included cabin crewrsquos job knowledge their courtesy confidence in their
service ability and safety while traveling It may be because TG cabin crew are well-
trained prior to their actual service work on board This can also ensure passengersrsquo
safety Particularly the safety and security features have been the most concerns of
airline passengers since the 9-11 incidents in New York USA This is why most
customers rated their highest satisfaction with the assurance dimension (Carman 1990)
The findings of this study are also consistent with those of Fick and Ritchie (1991)
who studied the operation of the SERVQUAL instrument in three major tourism sectors
airlines restaurants and ski area services It was revealed that the most important
dimensions of the service were assurance and tangibles If companies were unable to
inspire trust and confidence in their customers and the tangibles are not impressive it
would be difficult for them to achieve a high level of customerrsquos satisfaction (Sachukorn
2000)
x x x
40
Responsiveness is often found as the lowest level of satisfaction among customers
in the service industry It is plausible that the staff were too busy to provide prompt and
good service (Kholthanasep 2001) In this study the results revealed that the
responsiveness dimension was rated at the lowest score ( 269) among the five
dimensions followed by the reliability ( 280) dimension It was highly possible that the
passengersrsquo dissatisfaction occurred when passengers did not receive prompt service from
TG when they needed help
Prompt service is an important factor of customersrsquo expectation Customers
generally rate the service as poor when the speed of service does not meet their
expectations (Kholthanasep 2001) Bojanic and Rosen (1994) examined the nature of the
association between service quality as perceived by consumers and its determinants by
applying SERVQUAL in a restaurant setting They found that customers rated
responsiveness as the lowest satisfaction in their studies Zeithaml et al (1990) explained
that the responsiveness dimension in the SERVQUAL was willingness to help customers
and provide prompt service As the responsiveness dimension in this research comprised
prompt service willingness on-time service and quick response therefore it will be
beneficial to TG if the company can ensure that the service provided by its cabin crew
especially the willingness to help passengers and to provide prompt service meet
passengersrsquo satisfaction
Regarding the relationship between the participantsrsquo demographic data and their
satisfaction with the service quality there are many points of interests to be discussed as
follows
Firstly regarding the relationship of the passengersrsquo satisfaction with the service
and their age those who were under 20 years old rated satisfaction with the
responsiveness dimension ( 290) higher than the reliability dimension ( 270) (See
x
x
x x
41
Table 7) It was possible that young passengers usually gave priority to the dimension of
care and service when compared with that of the service providersrsquo accurate and
dependable manner (Panittumrong 2003) In addition young customers had less
experience in a service and it was difficult to compare the current service with the past
experience consequently they were more satisfied with the service provided than senior
customers
Another point was raised about the participantsrsquo age The study revealed that the
number of the high group with the age range of 21- 40 was at 567 However that of
the second highest group of the participants with the age range of 41-60 was at 30
which was rather high This latter grouprsquos level of satisfaction on the service quality was
also close to the average mean score It was found that the average mean score of the
reliability dimension was 280 while that of the second highest group was 281 the
average mean score of the assurance dimension was 345 while that of the second highest
group was 347 the average mean score of the tangibles dimension was 334 while that of
the second highest group was 335 the average mean score of the empathy dimension and
that of the second highest group was rated at 307 equally and the average mean score of
the responsiveness was 269 while that of the second highest group was 271 In sum if
consider the two groups in terms of the participantsrsquo age one of the high group and the
other with the second high group the results confirmed that the satisfaction level of the
majority of passengers was at the above average level
Secondly regarding the relationship between the participantsrsquo satisfaction and
their occupation business employees who were found at the highest number (42) had
very low satisfaction with the service quality in terms of reliability ( 275) and
responsiveness ( 264) while the mean scores of the whole sample group for these two
dimensions were at 280 and 269 respectively (See Table 8) The findings strongly
x
x
42
correlated with that of Cheaosakul (2004) who studied the consumersrsquo perception of
airline service quality with a focus on occupations It was found that the group of
business employees had the highest score on expectations Cheaosakul (2004)rsquos study
also revealed that business employees did not frequently travel compared with people of
other occupations such as tourists It was found in this particular study that the number of
the participantsrsquo purpose of travel with TG for business trips was only at 273 (See
Table 5) while the highest number of the participants went on holiday was at 52
Cheaosakul (2004) indicated that business people therefore had high expectations than
the other group who traveled more frequently
Thirdly an even more interesting point was raised when comparing the level of
satisfaction of the passengers who were government officials or state enterprise
employees and business owners Although passengers who were government officials or
state enterprise employees came third in terms of participants they are considered
valuable customers of TG since according to the governmentrsquos policy they are required
to take only TG which is a national airline whenever they travel by air There are few
exceptions though However it is almost impossible for Thai government officials who
travel on business trip and are funded by the governmentrsquos budget to fly with other
airliners It was found from this study that government officials were less satisfied with
TG quality service in terms of reliability ( 277) and responsiveness ( 264) than the
average level of which the mean scores of the two dimensions were at 280 and 269
respectively
Another issue of discussion regarding the participantsrsquo occupation business
owners came second It was observed that business owners rated the reliability ( 282)
and responsiveness dimensions ( 270) higher than the average scores of all groups (See
Table 8) It is possible that business owners had more positive attitude with TGrsquos service
x x
x
x
43
than the other groups TG seemed popular among business owners and they were the
most important group of customers This was supported by Suriya (2005) who studied
airline market segments after the launch of the low cost airlines in Thailand Suriya
(2005) identified that merchants or business owners were the major group of customers in
the full-service airline market
Fourthly regarding the monthly income of the research participants of the low
group passengers who earned an income of around 60001 or higher rated the empathy
( 325) dimension higher than tangibles ( 321) dimension (See Table 9) This may
be because the high income passengers sensitively felt that the facilities and equipment
found on their domestic route looked quite old-fashioned due to TGrsquos cost reduction The
company saved costs after the Suvannabhumi airport was closed in the 2008 crisis The
result is similar to the findings of Wangpen and Inthornma (2007) in that high income
customers had higher expectations towards the service It was possible that they had
more tendencies to be dissatisfied with the service failures The two researchers
concluded that passengers with different incomes were satisfied with the services at
different levels because they had different attitudes expectations and abilities to pay for
the service
Fifthly as it was found from this study that the highest score for the purpose of
travel was going on holiday (527) and the participants who were tourists rated the
assurance dimension at the highest level or the mean score of 353 (See Table 10) much
higher than the mean score of the whole group which was at 345 It was rather surprising
that the highest score for the travel purpose was not for business trips It is possible to
explain that this group spent for the travel cost on their own and they might want to make
sure that they chose the best service for themselves The result is parallel with Gabbie
and OrsquoNeill (1997) who examined customer satisfaction in the hotel sector using the
x x
44
SERVQUAL tool This study showed that the holiday guests who paid for
accommodation on their own rated assurance much higher than other dimensions It is
plausible to explain that passengers traveling on their own budget must make sure that
they already chose the service that was worth the money spent
However when analyzing the satisfaction on service quality of the participants
whose purpose of travel via TG was for business it was also found that this business
participants rated the high score for the tangibles dimension at the mean score of 340
compared with the average mean score of all groups of 334 Passengers who traveled on
business included government officials and state enterprise employees were major
customers of TG It was therefore interesting to find out from this study that their
satisfaction score in terms of tangibles or the appearance of physical factors such as
equipment facilities and personnel was above the average score of all groups Although
the score was not much higher the gap was bigger than that of the other RATER
dimensions as seen from the following information the passengers who traveled on
business trip showed their satisfaction on the reliability dimension at the mean score of
281 the assurance dimension at 347 the empathy dimension at 309 and the
responsiveness dimension at 270 while the average of all groups was at 280 345 307
and 269 respectively
The last point that the researcher wanted to point out is that this study revealed
that the participants who traveled more than 10 times for the last 12 months were lowest
in number (13) However it was interesting that these frequent flyers showed the high
rate of satisfaction with TGrsquos in-flight service quality The mean scores in all dimensions
showed the high rate of satisfaction (See Table 11) It is possible that passengers who
traveled very often via TG had high loyalty The brand loyalty made passengers happy in
every feature of service This result however contrasts with Ostrowski et al (1993) who
45
investigated service quality and customer loyalty in the commercial airline industry The
study examined whether the high levels of service quality existed in the US commercial
airline industry and how service quality could potentially lead to customer loyalty The
main results indicated that the levels of perceived service quality were below potential
and that customer loyalty to airlines was low It is plausible to say that the data of the two
studies were different The data collected on two air carriers in USA might have
different characteristics from the demographic information of Thai people and the number
of the participants in the two studies might differ However TG still needs to listen to the
voice of all passengers especially the frequent flyers Even if the number of this sample
group was few every customer is valuable for any firm Also it would be valuable to
implement a relevant strategy to expand this group of passengers since they had a positive
attitude for TG
Interestingly the findings from the last part of the questionnaire also showed that
the majority of the participants (946) showed their willingness to use TGrsquos service in
the future It can plausibly be explained that the participants were satisfied with TGrsquo
service quality at the moderate level ( 307) Their satisfaction with the five dimensions
of SERVQUAL was also moderate They might think that TG is a reliable airline that
they can depend on Thai passengers have confidence and trust in the service of Thai
cabin crew in terms of courtesy Also it is possible that they might not trust the low cost
airlinesrsquo service of the crew
There were only seven remarks on the in-flight service when the participants were
asked to freely give suggestions The tangible dimension problematic Passengers
pointed out about the small size of passengersrsquo seats and the quality of the air-
conditioning system One problem was on the responsiveness dimension which happened
when a passenger asked for a blanket but she was not offered indicating that some of the
x
46
cabin crewrsquos promptness to provide service was still not up to a standard Another
comment was on the flavor of the snacks Although this issue is not directly relevant to
the service it is worthwhile for TG to consider this problem
In conclusion the researcher found both strengths and weaknesses in TGrsquos service
quality Assurance was found the highest satisfaction in the participantsrsquo opinion TG
should maintain the service quality with a focus on this dimension On the other hand
the responsiveness and reliability dimensions were at the lowest satisfaction level among
the five dimensions The company should improve its service quality on these two
dimensions especially with regards to TGrsquos lsquoprompt servicersquo and lsquoproblem solvingrsquo
service to retain its passengers
53 Limitations of the study
This study has some limitations as follows
1 This study was limited to only one domestic route (Bangkok ndash Chiangmai)
Therefore the participants in this study were passengers who traveled only between these
two provinces The results of the study might differ if the study covered another route or
many more routes at the same time Consequently further studies can be conducted for
other domestic destinations such as Phuket and other big cities
2 The research participants were all Thai passengers It would be interesting to
study foreign passengersrsquo satisfaction on TGrsquos in-flight service quality
3 This study focused only on Parasuraman et al (1985)rsquos SERVQUAL
Instrument used to assess the service quality The results might differ if other instruments
were used
47
54 Recommendations for further studies
Further research should be undertaken to validate the results of this study The
researcher has found several opportunities to extend this study as follows
Survey on the lsquoresponsivenessrsquo dimensions
Responsiveness concerns the willingness or readiness of employees to provide
service such as timelines of service and prompt service This dimension was what the
passengers in this study were most concerned about because it was rated as the lowest
level of satisfaction Thus TG should find the countermeasure of how to increase the
level of passengersrsquo satisfaction in the responsiveness dimension
Assessment of the ground service quality
Since this research was conducted on on-board service quality further studies on
ground services such as a reservation or check-in service should be investigated in order
to integrate the results covering every sector of the airline service
Study on passengersrsquo attitude towards the service quality in other airlines
A study on the service quality of other airlines should be conducted in order to
obtain comparative data and find out reasons for their passengersrsquo behavior and attitude
consequently allowing TG to remedy any weak points and increase the number of new
passengers
REFERENCES
REFERENCES
Alegre J amp Pou L (2006) An analysis of the microeconomic determinants of travel
frequency Department of Applied Economics Universitat de les Illes Balears
Bojanic DC (1991) Quality measurement in professional service firms Journal of
Professional Service Marketing 7(2) 27-37
Bojanic D C amp Rosen L D (1994) Measuring service quality in restaurants An
application of the SERVQUAL model Journal of Hospitality Research 18(1)
3-14
Boontaganon W (2002) The study of service quality of fast-food restaurants in Bangkok
using SERVQUAL measurement Thesis MBA (Business Administration)
Bangkok Assumption University Photocopied
Buttle F (1996) SERVQUAL review critique research agenda European Journal of
Marketing 30(1) 8-31
CarmanJ M (1990) Consumer perceptions of service quality An assessment of the
SERVQUAL dimensions Journal of Retailing 69 33-35
Cheaosakul W (2004) Consumers perception of service quality a case study of Thai
Airways International Plc Thesis MBA Bangkok Assumption University
Photocopied
Fick RG amp Ritchie JRB (1991) Measuring service quality in the travel and tourism
industry Journal of Travel Research 30(2) 2-9
Fornell C (1992) A national customer satisfaction barometer the Swedish experience
Journal of Marketing 56 6-21
Gabbie O amp OrsquoNeill M (1997) SERVQUAL and the Northern Ireland hotel sector a
comparative analysis part 2 Managing Service Quality 17(1) 43-49
50
Gilbert DH (1999) Marketing connecting with customers (2nd
ed) Upper Saddle
River NJ Prentice Hall
Gilbert D amp Wong KCR (2002) Passenger expectations and airline services a
Hong Kong based study Surrey Management School Surrey University of
Surrey
Gitman LJ amp Carl DM (2005) The future of business the essentials Mason Ohio
South-Western College Pub
Grifin J (1995) Customer loyalty NY Lexington Book
Gronroos C (1978) A service-oriented approach to marketing of services European
Journal of Marketing 12(8) 588-601
Hennig-Thurau T amp Klee A (1997) The impact of customer satisfaction and
relationship quality on customer retention a critical reassessment and model
development Masterrsquos Project MA (Psychology amp Marketing) Hanover
University of Hanover
Heesawat C (2005) The opportunities and problems in making services more tangible
PhD Dissertation Bangkok Assumption University Photocopied
Juran JM amp Gryna FM (1974) Quality control handbook NY McGraw-Hill
Kholthanasep G (2001) A study of customerrsquos expectations and perceptions of service
quality delivery by first class hotels in Bangkok metropolitan area Thesis
MBA Bangkok Assumption University Photocopied
Kotler P amp Scheff J (1997) Standing room only strategies for marketing the
performing arts Boston Mass Harvard Business School Press
Kotler P (1997) Marketing management analysis planning and control (9th
ed) Upper
Saddle River NJ Prentice Hall
51
Kotler P Bowen J amp Makens J (1999) Marketing for hospitality and tourism (2nd
ed) NJ Prentice Hall
Kotler P (2000) Marketing management the millennium edition (10th
ed) NJ Prentice
Hall
Lages FL amp Fernandes CJ (2005) The SERVQUAL scale a multi-item instrument
for measuring service personal values Journal of Business Research 58(11)
1562-1572
Oberoi U amp Hales C (1990) Assessing the quality of the conference hotel product
London The Service Industries Journal 10(4) 700-722
Ostrowski PL Orsquobrien TV amp Gordon GL (1993) Service quality and customer
loyalty in the commercial airline industry Journal of Travel Research 32(2)
16-24
Palin M (1996) Flight catering transportation and loading (2nd
ed) London Longman
Group Limited
Panittumrong P (2004) The consumerrsquos opinion towards Clark Hatch Fitness Center
Master Project MBA (Management) Bangkok Graduate School
Srinakharinwirot University Photocopied
Parasuraman A Zeitmal VA amp Berry LL (1985) A concept model of service
quality and its implications for future research Journal of Marketing 49 41-50
Parasuraman A Zeitmal VA amp Berry LL (1988) SERVQUAL a multiple item
scale for measuring customer perceptions of service quality Journal of
Retailing 64(1) 64
Parasuraman A amp Berry LL (1991) Marketing services competing through quality
NY The Free Press
52
Pirsig RM (1987) Zen and the art of motorcycle maintenance an inquiry into values
(Mass Market Paperback) NY Bantam Books
Poonlarbtawee K (1987) Statistics for research Bangkok Physic Center Printing
Reid RD amp Bojanic DC (2001) Hospitality marketing management NJ John Wiley
amp Son Inc
Rueangthanakiet P (2008) Memberrsquos satisfaction of fitness service quality a case study
of California Wow Xperience Plc Masterrsquos Project MA (Business English for
International Communication) Bangkok Graduate School Srinakharinwirot
University Photocopied
Sachukorn S (2006) Reception and service excellence Bangkok Saitharn
Schiffman LG amp Kanuk LL (1994) Consumer behavior (5th
ed) London Prentice-
Hall International
Somwang C (2008) An assessment of passengersrsquo views of service quality in Thai low
cost carriers Inter Program MA (Communicative English) Bangkok
Ramkhamhaeng University Photocopied
Suriya K (2005) Airline market segments after low cost airlines in Thailand passenger
classification using neural networks and logit model with selective learning
Faculty of Economics Chiangmai Chiangmai University
Suthirungkul N (2003) The study of customer expectations and perceptions of service
quality of the Clark Hatch fitness center of Silom road branch Bangkok Thesis
MBA (Business Administration) Bangkok Assumption University
Photocopied
Thai Airways International (2008) Traffic program information (Introduction of summer
200809) Bangkok THAI Printing Office
53
Thai Airways International (2009) Traffic program information (Introduction of winter
200910) Bangkok THAI Printing Office
THAI AIRWAYS INTL Official 4-Star Ranking of Product and Service Quality (2009
October) Retrieved February 14 2010 from
httpwwwairlinequalitycomAirlinesTGhtml
Travel Planning (2010 February 12) Retrieved February 12 2010 from
httpwwwsuite101comlessoncfm1848818243
Wangpen N amp Inthornma S (2007) Membersrsquo satisfaction in fitness centers in
Bangkok Thesis MA (Hotel and Tourism Management) Bangkok Graduate
School Naresuan University Photocopied
Zeithaml VA amp Bitner MJ (2000) Services marketing (2nd
ed) NY McGraw Hill
Zeithaml VA Parasuraman A amp Berry LL (1990) Delivering quality service
balancing customer perceptions and expectations NY Free Press
APPENDICES
55
APPENDIX A
แบบทดสอบความพงพอใจของผโดยสารการบนไทย
เรยนทานผโดยสารทเคารพ กระผมนาย วลาศ มนคงวณชกล พนกงานตอนรบสายการบนไทย และนกศกษาปรญญาโท หลกสตรภาษาองกฤษธรกจเพอการสอสารนานาชาต มหาวทยาลยศรนครนทรวโรฒ ไดจดท าแบบสอบถามนเพอเปนสวนหนงของการส ารวจความพงพอใจของผโดยสารทมตอคณภาพงานบรการ เทยวบนภายในประเทศของการบนไทย โดยมงหวงทจะน าขอมลทไดรบจากการส ารวจมาเปนประโยชนตอการสงเสรมสนบสนนการปฏบตงานใหเกดประสทธผล จงขอความกรณาจากทานในการตอบแบบสอบถามทกขอตามขอเทจจรงและความเหนของทาน ขอมลทงหมดเปนความลบ จะใชเพอการวจยเทานน และขอขอบคณในความรวมมอของทาน
helliphelliphelliphelliphelliphelliphelliphelliphelliphelliphelliphelliphelliphelliphelliphelliphelliphelliphelliphelliphelliphelliphelliphelliphelliphelliphelliphelliphelliphelliphellip
ค าชแจง โปรดท าเครองหมาย (x) ลงในชองวาง ทตรงกบค าตอบของทาน
ตอนท 1 ขอมลทวไป
1 เพศ ( ) ชาย ( ) หญง 2 อาย ( ) ตากวา 20 ป ( ) 21-40 ป ( ) 41-60 ป ( ) 60 ปขนไป 3 อาชพ ( ) ขาราชการ รฐวสาหกจ ( ) พนกงานบรษท ( ) ธรกจสวนตว ( ) นกเรยน นกศกษา ( ) เกษยณ ( ) อนๆ 4 รายได เดอน ( ) ตากวา 20000 ( ) 20001- 40000 บาท ( ) 40001- 60000 บาท ( ) 60001 บาท ขนไป 5 จดประสงคการเดนทาง ( ) ธรกจ ( ) พกผอน ( ) เยยมเยยนญาตมตร เพอนฝง ( ) อนๆ 6 ความถในการเดนทางกบการบนไทย (ในรอบ 12 เดอน) ( ) ครงแรก ( ) 2-3 ครง ( ) 4-10 ครง ( ) 10 ครงขนไป
56
ตอนท 2 ความพงพอใจของทานตอการบรการ (5 = เหนดวยอยางยง 4= เหนดวย 3= ปานกลาง 2=ไมเหนดวย 1=ไมเหนดวยอยางยง)
ระดบความพงพอใจ
การบรการของการบนไทย 5 4 3 2 1 1 เมอเจาหนาทสญญาทจะใหบรการทานในเรองใด จะทาตามนนเสมอ
2 การใหบรการของเจาหนาท สรางความเชอมนใหกบทาน
3 อปกรณบนเครองบนมรปแบบททนสมย (เชน จอทว ทนง)
4 บรษทฯกาหนดเวลาการใหบรการบนเครองเหมาะสม
5 เจาหนาทใหบรการทดนบตงแตกาวแรกบนเครอง
6 เจาหนาทมความตงใจดทจะชวยเหลอทาน เมอทานมปญหา
7 ทานรสกปลอดภยเมออยบนเครองบน
8 สงอานวยความสะดวกตางๆบนเครอง มรปลกษณทดงดดใจ (เชน กลองอาหาร) 9 เจาหนาทไมเขาใจความตองการของทาน ในบางกรณ
10 เจาหนาทไมไดระบเวลาในการใหบรการผโดยสารบนเครองทแนนอน 11 เจาหนาทพยายามทางานโดยไมใหเกดขอผดพลาด
12 เจาหนาทปฎบตงานดวยความสภาพเสมอ
13 เจาหนาทแตงกายเรยบรอยและดด
14 บรษทฯใหความเอาใจใสกบผโดยสารเปนรายบคคล
15 บางครงเจาหนาทไมเตมใจทจะใหบรการผโดยสาร
16 บรษทใหบรการทานตรงเวลาทกาหนด
17 เจาหนาทสามารถใหขอมลเกยวกบการเดนทางไดอยางถกตอง
18 เอกสารของบรษทฯทเกยวของกบการบรการ (เชน แผนพบ นตยสาร) มขอมลครบถวน และรปแบบสวยงาม 19 เจาหนาทใหบรการทานดวยสมผสความเปนไทย
20 เจาหนาทใหบรการผโดยสารอยางรวดเรว
ทานจะกลบมาใชบรการของการบนไทยตอไป จะใชบรการตอไป ไมใชบรการ
ขอเสนอแนะ_______________________________________________________
_____________________________________________________________ ขอบพระคณอยางสงในความรวมมอของทาน
57
APPENDIX B
Questionnaire
Dear Honorable Passengers
My name is Wilas Mankongvanichkul -- a THAI cabin crew and masterrsquos student of business English
for international communication program Srinakharinwirot University This questionnaire is about
an exploration of passengersrsquo satisfaction with service quality of Thai Airways International (TG)rsquos
domestic flights Data gained will be utilized for THAI service operation Please kindly complete the
questionnaire The data gained will be kept confidential and used for the research study only Your
kind cooperation is greatly appreciated
helliphelliphelliphelliphelliphelliphelliphelliphelliphelliphelliphelliphelliphelliphelliphelliphelliphelliphelliphelliphelliphelliphelliphelliphelliphellip
Direction Please mark (x) your answer in the space provided
Part 1 Personal Information
1 Gender
( ) Male ( ) Female
2 Age
( ) Under 20 years ( ) 21-40 years
( ) 41-60 years ( ) Above 60 years
3 Occupation
( ) Government official State enterprise employee
( ) Business employee
( ) Business owner ( ) Student
( ) Retiree ( ) Others
4 Monthly income
( ) Up to 20000 baht ( ) 20001- 40000 baht
( ) 40001 ndash 60000 baht ( ) 60001 baht and above
5 Purpose of travel
( ) Business trips ( ) Holidays
( ) Visits ( ) Others
6 Frequency in traveling with THAI (during the last 12 months)
( ) First time ( ) 2-3 times
( ) 4-10 times ( ) More than 10 times
58 Part 2 Your satisfaction with the service
(5=Strongly Agree 4= Agree 3=Uncertain 2=Disagree 1= Strongly Disagree)
Level of Satisfaction
The Service of THAI 5 4 3 2 1
1 When cabin crew promise to do something by a
certain time they do so
2 You can trust THAI cabin crew
3 TG has modern on board equipment
(such as TV screen passengersrsquo seats)
4 TG has operating hours on board convenient to all
passengers
5 Cabin crew offer good services upon boarding
6 When passengers have a problem cabin crew show a
sincere interest in solving it
7 Passengers feel safe on-board
8 The physical facilities of TG are visually appealing
(such as meal boxes)
9 Cabin crew do not understand your special needs in
some cases
10 Cabin crew do not tell passengers exactly when
services will be offered
11 Cabin crew insist on error-free records
12 Cabin crew are consistently courteous to passengers
13 Cabin crew are well-dressed and neat in appearance
14 TG gives passengers individual attention
15 Cabin crew are not always willing to help passengers
16 TG provides its services at the time it promises to
do so
17 Cabin crew are knowledgeable to answer passengers
travel-related questions
18 Documents about service are informative and appealing
(such as pamphlets and magazines)
19 Services provided have a ldquoThai Touchrdquo
20 Cabin crew are quick to respond to passengersrsquo requests
Will you come back for TGrsquos service Yes No
Suggestions________________________________________________________________
________________________________________________________________________ Thank you very much for your kind cooperation
59
APPENDIX C
Questionnaire Specification Based on SERVQUAL measurement (Parasuraman et al 1985)
Passengers satisfaction level toward service quality factors
No Service Quality Features (RATER)
Str
on
gly
ag
ree
Ag
ree
Un
certa
in
Dis
ag
ree
Str
on
gly
Dis
ag
ree
(5) (4) (3) (2) (1)
1 When cabin crew promise to do something by a certain time they do so Reliability
2 You can trust THAI cabin crew Assurance
3 TG has modern on board equipment (such as TV screen passengersrsquo seats) Tangibles
4 TG has operating hours on board convenient to all passengers Empathy
5 Cabin crew offer good services upon boarding Responsiveness
6 When passengers have a problem cabin crew show a sincere interest in solving it
Reliability
7 Passengers feel safe on-board Assurance
8 The physical facilities of TG are visually appealing (such as meal boxes) Tangibles
9 Cabin crew do not always understand your special needs in some cases Empathy
10 Cabin crew do not tell passengers exactly when services will be offered Responsiveness
11 Cabin crew insist on error-free records Reliability
12 Cabin crew are consistently courteous to passengers Assurance
13 Cabin crew are well-dressed and neat in appearance Tangibles
14 TG gives passengers individual attention Empathy
15 Cabin crew are not always willing to help passengers Responsiveness
16 TG provides its services at the time it promises to do so Reliability
17 Cabin crew are knowledgeable to answer passengers travel-related questions Assurance
18 TGs documents associated with services are informative and appealing (such as pamphlets and magazines)
Tangibles
19 Services provided have a ldquoThai Touchrdquo Empathy
20 Cabin crew are quick to respond to passengersrsquo requests Responsiveness
VITAE
61
VITAE
Name Wilas Mankongvanichkul
Date of Birth February 14 1980
Place of Birth Bangkok
Address 688 Soi Phaholyothin 32 Chankasem Jatuchak
Bangkok 10900
Present Occupation Cabin Crew
Thai Airways International Public Company Limited
89 Vibhavadi Rangsit Road Bangkok 10110
Education Background
2010 Master of Art (Business English for International
Communication)
Srinakharinwirot University
2001 Bachelor of Business Administration Bangkok University
1997 High School Saint Dominic School
- Cover
- Abstract
- Chapter 1
- Chapter 2
- Chapter 3
- Chapter 4
- Chapter 5
- Bibliography
- Appendix
- Vitae
-

2
Customer satisfaction service arises when a company can provide customers with
benefits that exceed customersrsquo expectation and this is considered value-added If
customers are satisfied with a product or service they will buy more and do so more
often (Griffin 1995) All businesses always try to find ways to make customers happy by
all means to meet and even exceed their expectations in order to win their loyalty
TG has focused on service quality to increase passengersrsquo satisfaction and the
companyrsquos market share for years TGrsquos current motto ldquoService from the Heartrdquo clearly
indicates that the company has placed paramount importance to service The findings
from a study (Ostrowski OrsquoBrien amp Gordon 1993) revealed that airlines could acquire
and retain customer loyalty by offering high quality service Providing a superior service
quality should therefore be the main agenda for all airlines in order to remain
competitive in the market
However there are various factors affecting customersrsquo satisfaction with a
companyrsquos service Service provided can be tangible or intangible The service-related
equipment brochures magazines or even service operatorsrsquo uniforms are considered
tangible factors which can enhance customerrsquos satisfaction with the companyrsquos service
The quality of the tangibles is easier to improve since the tangibles are concrete On the
contrary it is difficult to evaluate the quality of service when taking the intangible factors
into account (Heesawat 2005) The intangibles such as personal needs and expectations
are abstract Expectation of a person differs from one to another Consumersrsquo
expectations can be influenced by word of mouth past experience etc The best way is
to provide the best service Research and development projects should be more
frequently carried out in a service organization to keep pace with how customers feel
towards the service The SERVQUAL instrument (Parasuraman Zeithamal amp Berry
1985) has been considered one of the effective tools used to assess a companyrsquo s service
3
quality so as to see if the company needs to better serve the customers and what service
areas need to be improved
12 Objectives of the Study
The main objectives of this study were first to explore the level of passengersrsquo
satisfaction with the service quality on Thai Airways Internationalrsquos domestic flights in
terms of five dimensions of SERVQUAL instrument reliability assurance tangibles
empathy and responsiveness Second the relationship of the satisfaction with the research
participantsrsquo demographic profile ie age occupation income purpose of travel and
frequency of travel were investigated
13 Significance of the study
The outcomes of this study would help TGrsquos customer service managers and other
practitioners to better understand the overall picture of TG service delivery and also of
their passengersrsquo satisfaction level Moreover the results from this research would assist
airline managers to better serve their customers monitor and develop service quality to
achieve the highest level of their passengersrsquo satisfaction It was hoped that the findings
could help TG increase its competence to compete with other airline companies In
addition the findings would enhance other airliners to improve their customer relations
management as well as their brand loyalty
14 Scope of the Study
The research was focused on a sample group of 150 Thai passengers 75 males
and 75 females who traveled with ten TGrsquos domestic flights on the route from Bangkok to
Chiangmai The Bangkok - Chiangmai route was chosen for the study because TG had
4
the highest number of domestic passengers traveling on this route as Chiangmai has
served as both domestic and international airline hub (THAI 2008)
The questionnaire employed in the study was based on the SERVQUAL
instrument (Parasuraman et al 1985) It was used to reflect the companyrsquos service in
five dimensions reliability assurance tangibles empathy and responsiveness
15 Definition of Terms
SERVQUAL is a tool developed by Parasuraman et al (1985) and is used to
measure service quality via five dimensions (RATER)
Reliability is the ability to perform the service in an accurate and dependable
manner
Assurance involves the knowledge and courtesy of employees and their
ability to convey trust and confidence
Tangibles present the appearance of physical factors such as equipment
facilities and personnel
Empathy indicates providing individual attention and care to customers
Responsiveness refers to the willingness to provide help and prompt service
to customers
Service quality is a customerrsquos perception that occurs when the need of service is
met above average more than just adequate In other words service quality is the ability
of service that meets a customers expectations for that service It represents the
properties of the service valued by the customer According to Parasuraman et al
(1985) service quality is measured by five dimensions (RATER) reliability assurance
tangibility empathy and responsiveness
5
Customer satisfaction is a measure of how a product and service supplied by a
company meets or surpasses customer expectation It is seen as a key performance
indicator within business and is an indication of how successful the company is at
providing products andor services to the market Customer satisfaction is an abstract
concept and the actual happening of the state of satisfaction will vary from person to
person and productservice to productservice In a competitive market where businesses
compete for customers customer satisfaction is considered a key element of business
strategy (Gitman amp McDaniel 2005)
CHAPTER TWO
REVIEW OF LITERATURE
This chapter presents a review of literature and research which is related to the
study It comprises six topics the aviation industry in Thailand customer satisfaction
service quality SERVQUAL instrument demographic variables and previous related
studies
21 The Aviation Industry in Thailand
The world economic crisis and the uncertainty of Thai political situations have
directly affected customer purchasing power of all kinds of businesses including the
airline industry The Tourism Authority of Thailand (TAT) has tried to boost the
domestic travel in several ways including an offer of promotional traveling packages
This is a tactic of turning a crisis to an opportunity as well as enhancing domestic airlinesrsquo
sales
To provide a detailed picture on this topic two issues are discussed domestic
airline operators and the nature of airline business onboard services
Domestic Airline Operators
In terms of fare the domestic airlines that are currently operating in Thailand are
low-cost airlines and full-fare airlines
A low-cost airline is an airline which charges relatively lower fares To generate
more revenue from loss of decreasing margin of ticket prices the low-cost airline may
ask for extra charges for such as food priority boarding seat allocating and baggage
7
privileges etc This type of airlines includes Bangkok Airways Nok Air Orient Thai
Airlines and Air Asia
Meanwhile a full-fare airline sells tickets at full prices and traditionally offers
three travel classes namely first business and economy classes Thai Airways
International is the sole operator in Thailand who operates this type of airline service TG
is serving 10 airports domestically and providing sufficient capacity to serve local
demands During the festive season extra flights are provided in a greater number to
meet peak demands particularly those to Chiangmai and Phuket (THAI 2009)
TG flies to two destinations in the North ie Chiangmai and Chiangrai three
destinations in the Northeast ie Khonkaen Udonthani and Ubolratchathani and five
destinations in the South ie Phuket Hatyai Suratthani Krabi and Samui
To recap there are two major groups of domestic airlines in terms of airfare which
are low cost and full-fare airlines TG is the only full-fare airline operator in Thailand
The Nature of Airline Business On-board Services
The airline business has become more competitive and most airlines in
considering their competitive edge take into account the quality of service to be offered
to customers (Palin 1996) Typically a service package includes lsquotangiblesrsquo which refer
to goods provided for customers and lsquointangiblesrsquo which are those related to the quality of
service offered to the customers The in-flight service-package includes both tangibles
and intangibles The problem to be addressed is the need to ensure that all the flights are
fully stocked with the physical items in the service package together with hygienic and
functional equipment requested by cabin crew for providing service These goods fall
into four categories
1 Food items including beverages to be consumed on board
8
2 Non-food items comprising an extensive list which may include newspapers
blankets toilet bags headsets for aircraft audio-visual systems
3 Duty-free goods for passengers to purchase on the aircraft
4 Equipment required by cabin crew for providing service The service
equipment includes tea and coffee-making equipment first aid kits etc
Nevertheless the quality of a service package not only depends on food drinks
and facilities on the aircraft such as newspapers blankets toilet bags headsets etc but it
also depends on the skills and knowledge of cabin crew who serve passengers to create
positive attitudes toward the airline and to enhance the brand loyalty
In conclusion the aviation industry in Thailand is very competitive Low-cost
airlines have increasingly become more popular because of the economic crisis To
compete with those budget airlines TG needs to find ways to retain and attract
passengers
22 Customer Satisfaction
It is impossible for any business to sustain itself without customers Accordingly
factors contributing to any successful business mainly result from customer satisfaction
customer loyalty and customer retention One important factor in determining the
likelihood of success and profits of an organization is customer satisfaction Customer
satisfaction results in customer loyalty When there is customer loyalty the customer
retention rate is high and good business results tend to follow
Customer satisfaction a business term is a measure of how products and services
supplied by a company meet or surpass customersrsquo expectation In a competitive
marketplace where businesses compete for gaining more customers customer satisfaction
9
is seen as a key performance indicator within a business and has increasingly become a
key element of business strategy (Gitman amp Carl 2005)
Hennig-Thurau and Klee (1997) state that customer satisfaction with a companys
products or services is often regarded as the key to the companys success and long-term
competitiveness Customer satisfaction is also often viewed as a central determinant of
customer retention A high customer satisfaction level yields several benefits It
heightens customersrsquo loyalty and prevents customersrsquo complaints lowers customersrsquo
price sensitivity reduces the costs of failed marketing and of new customer creation
reduces operating costs due to an increase in number of customers improves the
effectiveness of advertising and enhances business reputation (Fornell 1992) However
specialists on satisfaction indicate that the main factors determining customer satisfaction
are the customersrsquo own perceptions and expectations of service quality (Zeithaml amp
Bitner 2000)
Customersrsquo expectation and perception
Customersrsquo perception of service quality depends on the degree of the service that
meets the customersrsquo expectations service providers must know how to shape those
expectations The messages from service providers contribute significantly to expectation
development because the service is mostly regarded as intangible and people cannot
readily observe for themselves what to expect It is critical that the service provider gives
information to customers as clearly and accurately as possible before the customers make
a purchase Organizations that create unrealistic expectations in an effort to sell a service
are likely to find their customersrsquo satisfaction low Those unhappy customers will tell
others and the credibility of the business will be damaged (Gilbert 1999)
10
To ensure highly perceived quality and to maintain loyal customer base service
providers need to be accurate and reasonable about what they lead customers to expect
They also need to do a good job in the areas of reliability assurance tangibles empathy
and responsiveness It is difficult for companies to get ahead of the competition and the
nature of competition in the service industry is more difficult to protect from imitation
Competitors are increasingly forced to imitate the best features of one another
Therefore any competitors who try to invest more energy and resources in building
strong service quality are most likely to be winners (Gilbert 1999)
Factors Affecting Consumers Expectation
The key factors influencing consumersrsquo view on service quality include word of
mouth personal needs customersrsquo past experience and external communication
(Parasuraman et al 1985)
Word of mouth is particularly important because when consumers are satisfied or
dissatisfied with the service they are likely to share it with their friends Service is
generally classified as intangible Customers cannot actually ldquoseerdquo the service until they
experience it Before making a purchase customers need to find out as much information
as possible so as to make a good decision Word of mouth is a means to make a
consumer feel interested or uninterested in the service
Personal needs are considered another important factor They deal with the
motives that determine the nature and strength of what a consumer expects from a
service
Meanwhile past experience refers to what consumers have learned through their
personal interaction with a service provider It is particularly important in shaping
customersrsquo expectations
11
The last factor is external communication comprising such as direct sale and
advertisement in order to communicate and position a service through messages which
can influence consumer perceptions
In summary each factor can individually or harmoniously affect consumersrsquo
purchasing decision Customer satisfaction is a key to business success In order to make
customers satisfied a company needs to understand their expectations and perception by
studying the factors that affect their purchasing decision
23 Service Quality
A search for the definition of ldquoqualityrdquo has yielded inconsistent results Quality
has been variously defined as fitness for use in the product which successfully serves the
purpose of the user during usage (Juran amp Gryna 1974) In addition Zeithaml et al
(1990) state that ldquoqualityrdquo is what exceeds the customersrsquo expectation of the service
On the other hand quality is a characteristic of thoughts and statements believed
to be taken for granted if an explanation of quality is going to be both false and true
precisely (Pirsig 1987) Pirsig also says that since definitions derive from abstract and
formal thinking quality cannot be defined it is impossible to define quality because
quality can never be considered independently but only in relation to what is perceived
Measuring Quality in Service
Parasuraman et al (1985) point out that service quality is more difficult for the
consumers to evaluate than the product quality Perception of service quality results from
a comparison of customer expectations with actual service performance Quality
evaluations are made not only from the outcome of a service but also from the ldquoprocessrdquo
12
of service delivery and the customers have fewer tangible characters to be measured
physically when purchasing services than when purchasing products (Gronroos 1978)
Service quality is the degree of how well the service level delivered matches
customer expectations Delivering quality service means that the service provider needs
to follow customer expectations on a consistent basis (Lewis amp Booms 1983)
To conclude three underlying service quality themes can be drawn from the
discussion as follows
Service quality is more difficult for the customer to evaluate than product quality
Service quality perceptions result from a comparison of consumer expectations
with actual service performance
Quality evaluations are not made solely on the outcome of a service They
involve evaluations of the process of service delivery
The Benefits of Service Quality
The benefits of service quality comprise four areas as follows (Kotler 2000)
Customers Retention High quality builds loyal customers and creates positive word of
mouth which is an important factor in purchase decision This can determine customer
satisfaction which affects repeat business If a customer is happy with an existing firm it
is difficult to convince him or her to move to another
Avoidance of Price Competition A firm with a reputation for high quality has
a much stronger competitive position than one with a reputation for poor quality Price-
cutting by a competitor will not be enough to encourage a client to switch Good quality
is more powerful to remain competitive
13
Retention of Good Employees Employees appreciate working in operations
that are well run and produce quality products They do not enjoy receiving customer
complaints Also turnover and loss of employee morale are listed as costs of poor quality
manpower When an operation has good quality it can retain good employees And at
the time business expansion is needed recruiting is easier and training cost is reduced
Reduction of Costs The quality cost includes internal costs external costs and
quality system costs Internal costs are those associated with correcting problems
discovered by the firm before products reached customers External costs are related to
errors that the customers experience They can be very expensive when the customers
decide not to return because of a service problem Then the promotional and advertising
costs or external costs are necessary to be spent to create the company image in order to
make customers come back and win brand loyalty for the company in the end However
the company needs to check the service quality through customersrsquo feedback periodically
to avoid problems
Although the quality service system does not come without costs it is usually less
than those internal and external costs resulting from poor quality service Some examples
of the costs of a quality system include customer service audits trainings management
meetings with employees and customers and introduction of a new technology (Kotler
Bowen amp Makens 1999)
To sum up it is necessary for a service company to know the service quality level
The quality needs to be evaluated by comparing customer experience with service
performance Once a service company reaches a good quality level a company will
retain its customers easily be away from price wars keep and get good employees and
reduce some operation costs
14
Thai Airways In-flight Service Quality
The latest airline evaluation in 2009 by Skytrax from United Kingdom which is a
research organization focused on in-flight services revealed that TG got the official 4-star
ranking for its product and service quality This honor is awarded to airlines which
deliver a good quality performance
Skytrax also disclosed that for short travels or domestic routes two traveling
classes are business class and economy class The overall evaluation of the domestic
route showed that TGrsquos business class was rated excellent (5-star) in two articles which
are ldquowashroom cleanlinessrdquo and ldquonewspaper amp magazinerdquo in terms of ldquoonboard productrdquo
category Meanwhile TG also got the highest rank in terms of ldquoservice efficiencyrdquo and
ldquoresponding to requestsrdquo in ldquocabin staff servicerdquo categories In addition in the economy
class TG could do superbly in three articles of cabin staff service which were ldquoservice
efficiencyrdquo ldquoenthusiasm and attituderdquo and ldquofriendliness and hospitalityrdquo (ldquoTHAI
AIRWAYS INTL Official 4-Star Ranking of Product and Service Qualityrdquo 2009)
In conclusion TG has been recognized internationally however it still needs to
move ahead The quality ranking is useful for TG to realize that the company needs to
develop its products and services in all categories in order to step up and well-prepared
for competitions in the future
24 SERVQUAL Model
SERVQUAL is an instrument used for measuring how customers perceive the
quality of the service This instrument is based on five dimensions and on a comparison
between customersrsquo expectations of how the service should be performed and their
experiences of how the service is actually performed Usually 20 attributes are used to
describe the five dimensions and participants are asked to state what they expect from the
15
service and how they perceive the service on a five-point scale from ldquoexcellentrdquo to
ldquopoorrdquo Based on the difference between expectations and experiences over the 20
attributes an overall quality score can be calculated The higher the score shows that
experiences are below expectation the lower the perceived quality (Parasuraman amp
Berry 1991)
SERVQUAL consists of five dimensions (RATER) as follows (Parasuraman et
al 1985)
Reliability This means that a service firm provides its customers with accurate
service the first time without making any mistakes and delivers what it has promised to
do by the time that has been committed
Assurance This means that employeesrsquo behaviors give customers confidence in
the firm and that the firm makes customers feel safe It also means that the employees are
always courteous and have the necessary knowledge to respond to customers questions
Tangibles This dimension relates to the appeal of facilities equipment and
materials used by a service firm as well as to the appearance of service employees
Empathy This means that the firm understands the customersrsquo problems and
performs in their best interests as well as giving customers individual personal attention
and having convenient operating hours
Responsiveness This means that employees of a service firm are willing to help
customers and respond to their requests as well as to inform customers when service will
be provided and give prompt service
16
Application of SERVQUAL Model in Hospitality Business
The SERVQUAL instrument has been used to assess the quality of a wide range
of services in the United States such as financial service operations telephone services
repair and maintenance services (Parasuraman et al 1988) and other professional
services (Bojanic 1991) Fick and Ritchie (1991) have employed the SERVQUAL
instrument to compare services provided by various types of organizations within the
travel and tourism industry Oberoi and Hales (1990) have examined the SERVQUAL
approach as a basis for measuring the quality of the conference hotel products Many
researchers of other service businesses believed that ldquoSERVQUALrdquo is a concise multiple-
item scale with good reliability and validity (Buttle 1996 Lages amp Fernandes 2005)
In Thailand Boontaganon (2002) studied the service quality of fast food
restaurants in Bangkok by using SERVQUAL The study examined the differences in
service quality expectations and perceptions based on demographic characteristics
including gender age occupation education and income level 360 questionnaires were
distributed to people who had just exited from fast food outlets in Bangkok The results
showed significant differences in service quality of customer expectations and
perceptions which indicated the unacceptable service quality delivered by fast food
restaurants in Bangkok
Suthirungkul (2003) studied the customer expectations and perceptions of service
quality of the Clark Hatch Fitness Center at Silom Road Branch Bangkok The objectives
of the study were to identify the SERVQUAL dimensions that customers both local and
foreign used to evaluate The Clark Hatch Fitness Center to study the customer
expectations towards the services quality that should be provided and to evaluate the
perceptions of service quality that customers obtained after using service The
questionnaire was used as a tool for collecting the data 277 Thai and foreign members of
17
the Clark Hatch Fitness Center at Silom Road Branch were the research participants The
results of the study were that there existed gaps between expectations and perceptions in
terms of the five SERVQUAL dimensions and the demographic characteristics had
influenced the gap scores
In short SERVQUAL is an effective measuring tool This tool has widely been
used in many previous studies in hospitality business both domestically and
internationally
25 Demographic Variables
In general business sector market segmentation is often based on demographic
profiles (Reid amp Bojanic 2001) in order that marketers can choose the proper service
segmentation strategies to satisfy different target market segments Demographics are the
variables about consumersrsquo wants preferences and usage rates are often associated with
demographic variables Moreover the demographic variables are easier to measure
(Kotler 2000) Important demographics are as follows
1 Gender There is no logical reason to expect biology to account for this
difference between the sexes The explanation may be in socialization differences and
personality disposition Feminine gender identity is characterized by traits such as
expensiveness and emotionalism and other orientation while masculine gender identity is
characterized by independence activity and self orientation (Kotler amp Scheff 1997)
2 Age Consumersrsquo wants and abilities change with age People buy different
goods and services over their lifetime Peoplersquos tastes in different products and services
are also related to age (Kotler 2000)
18
3 Occupation This variable reflects values attitudes taste and lifestyle
Occupation and income tended to be closely correlation on almost cause-and-effect
relationship (Schiffman amp Kanuk 1994)
4 Income Consumers form a purchase intention based on such factors and
expected family income price and expected benefits from the product and services
(Kotler 1997)
5 Purpose of Travel The purpose of travel measure the frequent distribution
The purposes of travel are for such as business holiday visiting friends and relative and
others (ldquoTravel Planningrdquo 2010)
6 Frequency of Travel A critical factor in predicting the demand for tourism
within a certain period of time is the number of trips individuals take New touristsrsquo
behavior shows a tendency toward more frequent travel (Alegre amp Pou 2006)
To recap the demographic profiles play a significant role in planning service to
meet passengersrsquo satisfaction In airline business six features of the demographics were
included in this study
26 Previous Studies on Airline Passengersrsquo Satisfaction
In an airline business the major revenue of a company comes from the number of
passengers rather than a total sum of cargo service aircraft maintenance or catering
supply all together Studies on airline passengersrsquo satisfaction are numerous as the
following examples
Gilbert and Wong (2003) identified the service dimensions that matter most to
current airline passengers The study measured and compared differences in passengersrsquo
expectations of the desired airline service quality in terms of reliability assurance
19
facilities employees flight patterns customization and responsiveness The primary data
were collected from passengers departing from Hong Kong airport Regarding the
service dimension expectations it was found that there were no statistically significant
differences between passengers who made their own airline choice (decision makers) and
those who did not (non-decision makers) However there were significant differences
among passengers of different ethnic groups nationalities as well as among passengers
who traveled for different purposes such as business holiday and visiting friends or
relatives
The findings also indicated that passengers consistently ranked lsquoassurancersquo as the
most important service dimension It showed that the passengers were concerned about
the safety and security aspects and this also indicated why there had been such a
downturn in demand as this study was conducted just prior to the World Trade Center
incident on September11 2001
In Thailand Somwang (2008) assessed the passengersrsquo views of service quality in
Thai low cost airlines The research was based on the principle that passengers evaluated
airline service quality through a comparison between their experiences and expectations
over a number of quality attributes The study evaluated passengersrsquo perceived service
quality of Thai low cost carriers based on the SERVQUAL instrument The findings
indicated that the passengersrsquo expectations on service quality were higher than what they
had actually experienced Further analysis showed that female passengers had lower
perceived service quality than male passengers The findings also revealed that higher
monthly income had greater differences with respect to expectations and perceptions than
lower income respondents Furthermore passengers usually traveled with low cost
carriers for three main purposes which were for leisure visiting friends or relatives and
business
20
In brief the previous studies explored the satisfaction of airline passengers by
using SERVQUAL instrument to measure the service quality The results above found
out the differences between customersrsquo expectations and perceptions The findings of a
study in Hong Kong revealed the passengersrsquo satisfaction on the dimensions of the
service quality Meanwhile a study in Thailand implied some findings about the
demographic profiles resulting in service quality Studies on service quality help improve
business organizations retain customers and attract new customers
CHAPTER THREE
METHODOLOGY
This chapter consists of four sections participants of the study research
instrument procedures of the study and data analysis
31 Participants of the Study
One hundred and fifty Thai passengers 75 males and 75 females who took the
TG Bangkok - Chiangmai route were randomly chosen as participants for the study
Since there are about 150 passenger seats in each flight the researcher randomly acquired
a sample size of 10 percent of the overall passengers from the ten flights totaling 150
Thai people are the main group of passengers who travel domestically over the year The
researcher therefore decided to select only the Thai passengers as the participants for the
study Also so as to cover various types of passengers the researcher included flights of
different time within a day (as shown in a following part of this chapter) for a reason that
passengers with some specific purposes chose to travel at some specific time For
example business people might prefer an early morning flight rather than a later-in-the-
day one
TGrsquos Bangkok ndash Chiangmai route has been considered one of the most frequent
domestic routes (THAI 2009) TG operates ten flights daily from Bangkok to
Chiangmai The researcher consequently chose this route for this research work to
assess the passengersrsquo satisfaction with TGrsquos service quality
The study was conducted in early March when it was still in the high season for
travels to the northern province of Thailand Fifteen passengers from each of the ten
flights of the Bangkok - Chiangmai route were asked to fill out the questionnaire at the
22
end of the on-board service while the plane was approaching Chiangmai its destination
All the 150 completed questionnaires were obtained as planned
32 Research Instrument
A questionnaire in Thai was used for data collection The questionnaire was
divided into three parts The first part was about the respondentsrsquo demographic profile
since consumersrsquo needs preferences and personalization are often associated with
demographic factors (Kotler 2000) Six demographic characteristics related to in-flight
service (Cheosakul 2004) consisting of gender age occupation monthly income
purpose of travel and travel frequency with THAI were demographic issues of the survey
The second part comprised questions about passengersrsquo satisfaction with the service
during the flight This part of the questionnaire was based on the SERVQUAL
instrument for measuring customersrsquo satisfaction in five dimensions of service reliability
assurance tangibles empathy and responsiveness (Parasuraman et al 1985) The last
part comprised a question and a blank space provided for suggestions on TGrsquos service
quality
33 Procedures of the Study
The questionnaire was initially approved by the researcherrsquos masterrsquos project
advisor and two specialists a TG in-flight service manager and a SWU lecturer Then a
pilot study was conducted to ten passengers to check for content reliability the
appropriateness of the number of questions and language used in the questionnaire As
the researcher included all the ten flights of TGrsquos Bangkok - Chiangmai route in the
study the tried-out questionnaire was randomly distributed to ten TG passengers (5 males
and 5 females) on each flight of the aforementioned route on the same day in February
23
2010 Also since this study was about onboard service the questionnaire was distributed
to the participants after the in-flight service was completed and before the plane landed
After that the questionnaire was adjusted and prepared for the actual survey
The revised questionnaire was eventually distributed to 150 participants in ten
consecutive days in early March 2010 Fifteen passengers in each Bangkok -
Chiangmai flight per day were randomly asked to fill out the questionnaire after the
completion of in-flight service
The plan below showed the ten flights of for the survey each flight for a day to
make sure that the data gained were reliable
BKK-CNX Flight (TG) Flight Schedule (Departure-Arrival)
TG100 0615-0725
TG102 0750-0910
TG104 0910-1030
TG106 1020-1140
TG110 1250-1400
TG112 1400-1510
TG114 1540-1650
TG116 1715-1825
TG120 1900-2010
TG122 2130-2240
34 Data Analysis
The data acquired from the questionnaires were analyzed in three sections
demographic profile of passengers level of passengersrsquo satisfaction with TGrsquos service
and the relationship between demographic profile and passengersrsquo satisfaction based on
24
Likert scale The 5-point Likert scales were used to rate the level of satisfaction as shown
in Table 1 below
Table 1 Intervals of Satisfaction Level (Poonlarbtawee 1987)
The interpretation of the scales in this study is as follows
Rating
Scale
Level of
Agreement Disagreement
Satisfaction
Level
Mean Score
5 Strongly agree Excellent 451-500
4 Agree Good 351-450
3 Uncertain Average 251-350
2 Disagree Fair 151-250
1 Strongly disagree Poor 100-150
The researcher picked up lsquothe high grouprsquo and lsquothe low grouprsquo of each
SERVQUAL dimension to present the relationship between the participantsrsquo
demographic profile and their satisfaction As the data gained from the highest number of
the participants or the high group was the major point that the researcher relied on focus
was on the majority opinion At the same time the data gathered from the lowest number
of the participants or the low group should not be overlooked because each and all
passengers are important for TG and in the high competitive airline market it is necessary
to retain each and every passenger so as to grow far in the aviation business
The results were presented in terms of percentages and mean scores in the form of
tables and a bar chart These fundamental statistic methods were proper in this study
25
because percentages and mean scores are considered the basic statistics used for data
analysis and presentation Also the general public can easily understand the
interpretation of the data Another reason was that the sample group of this study
comprised only 150 TG passengers The researcher therefore decided to apply the
aforementioned statistics in this research Discussion of the results was also offered
CHAPTER FOUR
FINDINGS
This chapter describes the findings of the study consisting of the demographic
data of the participants level of their satisfaction with TGrsquos service quality relationship
between the demographic data and five dimensions of SERVQUAL instrument and the
uncovers to the last question on the questionnaire including suggestion
41 Demographic Data
The demographic data of TGrsquos research participants in terms of age occupation
monthly income purpose of travel and frequency of travel are presented in Tables 2- 6
below
Table 2 Participantsrsquo Age
Age No of Participants Percentage ()
Under 20 years
21-40 years
41-60 years
Above 60 years
8
85
45
12
53
567
300
80
Total 150 100
Regarding the age group the highest number of the passengers was 20-40 years
old or 567 30 of them were 46-60 years old and 8 were above 60 years old Only
53 were under 20 years old
27
Table 3 Participantsrsquo Occupation
Occupation No of Participants Percentage ()
Government official State enterprise employee
Business employee
Business owner
Student
Retiree
Others
22
63
37
13
9
6
147
420
247
86
60
40
Total 150 100
In terms of occupation the highest number of the participants was business
employees (42) followed by business owners (247) government officials or state
enterprise employees (147) students (86) retirees (6) and other occupations (4)
respectively
Table 4 Monthly Income
Monthly income (baht) No of Participants Percentage ()
Up to 20000
20001- 40000
40001 - 60000
60001 and above
58
72
11
9
386
480
74
60
Total 150 100
For the income the highest number of the participants earned 20001-40000 baht
monthly (48) followed by those with a monthly income of up to 20000 baht (386)
28
of 40001-60000 baht monthly (64) and of 60001 baht and above monthly was the
lowest (6)
Table 5 Purpose of Travel
Purpose of travel No of Participants Percentage ()
Business trips
Holidays
Visits
Others
41
79
27
3
273
527
180
20
Total 150 100
Regarding the purpose of travel the highest number of the passengers traveled via
TG on holidays (527) followed by those who traveled on business trips (273)
Meanwhile those who made a visit were at 180 and who traveled with other purposes
were at 2
Table 6 Frequency of Travel
Frequency in traveling with THAI
(during the last 12 months)
No of Participants Percentage ()
First time
2-3 times
4-10 times
More than 10 times
39
99
10
2
260
660
67
13
Total 150 100
29
The last demographic data derive from the frequency in traveling with THAI
66 of the participants indicated that they traveled 2-3 times during the last 12 months
26 traveled for the first time while 67 for 4-10 times and 13 for more than 10
times during the last 12 months
In conclusion the demographic data shown in the tables above indicated that lsquothe
high grouprsquo comprised the following characteristics The age group of the majority
number of the participants ranged from 21-40 years (567) Most of them were business
employees (42) The highest number of the passengersrsquo monthly income was around
20000 ndash 40000 baht per month (48) The majority of the passengers traveled on
holidays (527) by TG 2-3 times in the past 12 months (66)
Meanwhile lsquothe low grouprsquo was found having the following characteristics The
lowest number of the research participants was under 20 years old or 53 Only 47 of
the participants had other kinds of occupation which were not indicated on the
questionnaire while only 6 of the participants earned 60001 baht or above monthly
2 of the participants traveled on other purposes besides those shown on the
questionnaire Lastly 13 of the passengers were those who traveled by TG more than
10 times in the past 12 months
42 Level of Passengersrsquo Satisfaction
Figure 1 below is the conclusion from the second part of the questionnaire The
150 participants were asked to rate the level of service quality that they perceived from
the TGrsquos domestic flights on Bangkok - Chiangmai route The questionnaire was divided
into five dimensions of SERVQUALrsquos (Parasuraman et al 1985) service quality which
comprised reliability assurance tangibles empathy and responsiveness The scales 1 to 5
ranged from lsquostrongly disagreersquo to lsquostrongly agreersquo
30
0
5
Reliability Assurance Tangibles Empathy Responsiveness
280
345 334307
269
SERVQUAL Dimension
Figure 1 Overall Level of Participants Satisfaction
Mean scores
Figure 1 shows the average mean score of all 150 passengersrsquo satisfaction on five
dimensions of service quality ranging from the mean scores of 345 to 269 The results
revealed that the most important service quality dimension for the whole samples group
of passengers was assurance ( 345) followed by tangibles ( 334) empathy ( 307)
reliability ( 28) and responsiveness ( 269) respectively The overall average mean
was 307
43 Passengersrsquo Satisfaction Level in Relationship with Their Demographic Data
This section shows the relationship between the demographic data (age
occupation monthly income purpose of travel and travel frequency) of the participants
and their satisfaction with the service quality of TGrsquos in-flight service
The researcher focused on each category of demographic characteristics of two
major groups a group with the highest score and the other with the lowest score In fact
the most important data were the majority opinion of the sample group In other words
for this study it was lsquothe high grouprsquo However the researcher as a TG cabin crew gave
importance to the low group as well since each and every passenger is significant to TG
x
x x x
x x
31
business particularly in the high competitive market of airline business The researcher
was interested to know what the passengers in the lsquolow grouprsquo thought about the in-flight
service and what their feedback was
The following tables (Tables 7-11) illustrate the relationship between each
dimension of the demographic data and the SERVQUAL service assessment tool and the
following symbols are applied in the tables below
lsquoNrsquo means the number of the participants
lsquo rsquo means the mean score
lsquoThe high grouprsquo means the group that comprises the highest number of participants
lsquoThe low grouprsquo means the group that comprises the lowest number of participants
Table 7 Relationship between the Participantsrsquo Age and their Satisfaction with In-flight
Service
SERVQUALrsquoS
RATER
Average
Mean Score
of All Groups
The High Group
(Age 20-40 Yrs Old)
N = 85567
The Low Group
(Age Under 20 Yrs Old)
N = 853
Mean Score of Each Group
Reliability 280 278 270
Assurance 345 378 335
Tangibles 334 331 328
Empathy 307 309 314
Responsiveness 269 267 290
Table 7 reveals the connection between the participantsrsquo age and the five
dimensions of the SERVQUAL instrument The high group had higher mean scores for
x
32
three dimensions than the low group In other words the participants with an age range
of 20-40 years were more satisfied with TGrsquos service quality in terms of reliability
assurance tangibles than those who were under 20 years old Meanwhile the low group
had higher mean scores for two dimensions than the high group This means the
participants who were lower than 20 years old were more satisfied with the in-flight
service in terms of empathy and responsiveness than those whose ages ranged from 20-40
years
Interestingly it was found that both groups have a lower mean score for the
reliability dimension ( 278 and 270) than the average mean score of all the age groups
in this study ( 28)
Table 8 Relationship between the Participantsrsquo Occupation and their Satisfaction with In-
flight Service
SERVQUALrsquoS
RATER
Average
Mean Score
of All Groups
The High Group
(Business Employee)
N = 63420
The Low Group
(Others)
N = 640
Mean Score of Each Group
Reliability 280 275 284
Assurance 345 347 348
Tangibles 334 331 336
Empathy 307 310 305
Responsiveness 269 264 277
Table 8 illustrates the connection between the participantsrsquo occupations and the
five dimensions of the SERVQUAL instrument The low group had higher mean scores
x
x
33
for almost all the dimensions of SERVQUALrsquos RATER than the high group except for
one dimension In other words the participants who worked as business employees were
less satisfied with TGrsquos service quality in terms of reliability assurance tangibles and
responsiveness than those whose occupations were not specified in the questionnaire
Empathy was the only dimension of service quality that the participants who were in the
high group were satisfied with
Table 9 Relationship between the Participantsrsquo Income and their Satisfaction with In-
flight Service
SERVQUALrsquoS
RATER
Average
Mean Score
of All Groups
The High Group
(20001-40000)
N = 72480
The Low Group
(60001 and above)
N = 960
Mean Score of Each Group
Reliability 280 273 285
Assurance 345 349 350
Tangibles 334 332 321
Empathy 307 301 325
Responsiveness 269 262 273
Table 9 indicates the connection between the participantsrsquo monthly income and
the five dimensions of the SERVQUAL instrument The low group had higher mean
scores for almost all the dimensions of RATER than the high group except for one
dimension In other words the participants who earned monthly income of 20001 ndash
40000 baht were less satisfied with TGrsquos service quality in terms of reliability assurance
empathy and responsiveness than those who earned monthly income of 60001 baht and
34
above The tangibles dimension was the only service quality issue that the participants
who were in the high group were satisfied with
Table 10 Relationship between the Participantsrsquo Purpose of Travel and their Satisfaction
with In-flight Service
SERVQUALrsquoS
RATER
Average
Mean Score
of All Groups
The High Group
(Holidays)
N = 79527
The Low Group
(Others)
N = 320
Mean Score of Each Group
Reliability 280 279 285
Assurance 345 353 349
Tangibles 334 335 338
Empathy 307 308 312
Responsiveness 269 270 275
Table 10 reflects the connection between the participantsrsquo purpose of travel and
the five dimensions of the SERVQUAL instrument The low group had higher mean
scores for almost all the dimensions than the high group except for one dimension In
other words the participants who traveled on holidays were less satisfied with TGrsquos
service quality in terms of reliability tangibles empathy and responsiveness than those
whose purpose of travel were not specified in the questionnaire Assurance was the only
dimension of service quality that the participants who were in the high group were
satisfied with
35
Interestingly it was found that both groups has a higher satisfaction level for the
assurance tangibles empathy and responsiveness dimensions than the average mean
scores of the whole sample group
Table 11 Relationship between the Participantsrsquo Frequency of Travel with THAI and their
Satisfaction with In-flight Service
SERVQUALrsquoS
RATER
Average Mean
Score of All
Groups
The High
Group
(2-3 timesyear)
N = 99660
The Low Group
(more than 10
timesyear)
N = 213
Mean Score of Each Group
Reliability 280 281 295
Assurance 345 346 360
Tangibles 334 335 343
Empathy 307 308 321
Responsiveness 269 270 292
Table 11 presents the connection between the participantsrsquo frequency of travel
with THAI and the five dimensions of the SERVQUAL instrument The low group had
higher mean scores for all the dimensions of RATER than the high group In other
words the participants who traveled 2-3 times in the last 12 months were less satisfied
with TGrsquos service quality in terms of reliability assurance tangibles empathy and
responsiveness than those whose frequency of travel were more than 10 times in the last
12 months
36
Interestingly it was found that both groups has a higher satisfaction level for all
the five RATER dimensions than the average mean scores of the whole sample group in
this study
44 Other Comments
The last part of the questionnaire was designed to ask whether the participants
would continue using TGrsquos service The findings disclosed that 142 participants or
946 indicated that they would while 8 of them or 54 declined
Also at the end of the questionnaire there was a blank space for the participants to
freely express their own ideas and suggestions on TGrsquos service However only 7
participants or 46 gave suggestions regarding the in-flight service Four of the
participants were dissatisfied with the flavor of the snacks provided on board One
complained that it was not cool enough in the cabin while one was upset for not being
granted for a request for a blanket The last one commented that the passengerrsquos seat was
not comfortable
In summary the passengersrsquo satisfaction level of the service quality in connection
with their demographic data was introduced Five out of the six demographic
characteristics the participantsrsquo age occupation monthly income purpose of travel and
frequency of travel were analyzed in connection with the five dimensions of SERVQUAL
instrument reliability assurance tangibles empathy and responsiveness It was observed
that there were some connection between these two matters in various ways as earlier
discussed Lastly it was found that one hundred and forty-two participants would
continue using TGrsquos service while the rest refused Only seven of all the participants or
46 gave some comments on the open-ended suggestion part
CHAPTER FIVE
CONCLUSION AND DISCUSSION
This chapter presents the conclusion discussion limitations of the study and
recommendations for further studies
51 Conclusion
This research aimed to examine the service quality provided by Thai Airways
International on its domestic flights One hundred and fifty passengers who traveled by
TG on the Bangkok - Chiang Mai route were the research participants The SERVQUAL
instrument was used as an instrument for data collection in the survey This instrument
was based on five determinants proposed by Panasuraman etal (1985) in terms of
reliability assurance tangibles empathy and responsiveness This research was also
conducted on the demographic characteristics comprising gender age occupation
monthly income purpose of travel and frequency in traveling and the relationship of these
characteristics except the gender with the passengersrsquo satisfaction with TGrsquos in-flight
service quality The questionnaires were distributed in early March 2010
The results showed that all the participantsrsquo satisfaction based on the five
dimensions was at the average level The highest level of passengersrsquo satisfaction was
placed on the assurance dimension followed by tangibles and empathy dimensions
accordingly The two lowest levels of the passengersrsquo satisfaction were placed on the
responsiveness and reliability dimensions
In addition a summary of the demographic characteristics showed that the high
group or the group with the highest number of participants was business employees The
highest number of the participants was between 21-40 years old The highest number of
38
the participantsrsquo income ranged from 20000 ndash 40000 baht monthly Also the high
grouprsquos purpose of travel was to go on holiday Lastly the highest number of the
participants traveled via TG only 2-3 times during the past 12 months
Meanwhile the low group or the group with the lowest number of participants
was passengers with other kinds of occupations which were not specified on the
questionnaire The low group of the participants was under 20 years old The low group
of the participantsrsquo income ranged from 60001 baht monthly or higher Also the low
group revealed that they traveled via TG for other purposes which were not indicated on
the questionnaire Lastly the passengers who traveled via TG more than 10 times during
the past 12 months belonged in the low group
It has also been discovered that as a whole both groups the high and low groups
were in the same direction in their satisfaction with the five dimensions of service quality
The two groups were satisfied with the service quality dimensions in terms of assurance
at the highest level followed by tangibles empathy reliability and responsiveness
respectively
However when analyzing each demographic characteristic the participants who
were under 20 years old rated the responsiveness dimension higher than the reliability
dimension Also for those participants whose income was around 60001 or higher the
empathy dimension was rated higher than the tangibles Regarding the occupation
business people were satisfied with the reliability and responsiveness dimensions at a
very low level Meanwhile the participants who traveled via TG on their holidays rated
the assurance dimension at a very high level Lastly frequent fliers who traveled by
THAI more than 10 times were most satisfied with TGrsquos service since they rated all
RATER aspects highly
39
52 Discussion
The findings have revealed the answers to the research questions First the
demographic data of the participants gender age occupation monthly income purpose
of travel and frequency of travel were shown Second the level of the passengersrsquo
satisfaction toward the service quality on Thai Airways Internationalrsquos domestic flights in
terms of the SERVQUAL instrument (Parasuraman et al 1985) reliability assurance
tangibles empathy and responsiveness was disclosed Also the results about the
relationship between the passengersrsquo satisfaction and their demographic data were pointed
out
The results of the survey indicated that out of the five dimensions assurance was
rated at the highest level ( 345) followed by tangibles ( 334) and empathy ( 307)
(See Figure 1) In addition passengers rated their highest satisfaction with the assurance
dimension which included cabin crewrsquos job knowledge their courtesy confidence in their
service ability and safety while traveling It may be because TG cabin crew are well-
trained prior to their actual service work on board This can also ensure passengersrsquo
safety Particularly the safety and security features have been the most concerns of
airline passengers since the 9-11 incidents in New York USA This is why most
customers rated their highest satisfaction with the assurance dimension (Carman 1990)
The findings of this study are also consistent with those of Fick and Ritchie (1991)
who studied the operation of the SERVQUAL instrument in three major tourism sectors
airlines restaurants and ski area services It was revealed that the most important
dimensions of the service were assurance and tangibles If companies were unable to
inspire trust and confidence in their customers and the tangibles are not impressive it
would be difficult for them to achieve a high level of customerrsquos satisfaction (Sachukorn
2000)
x x x
40
Responsiveness is often found as the lowest level of satisfaction among customers
in the service industry It is plausible that the staff were too busy to provide prompt and
good service (Kholthanasep 2001) In this study the results revealed that the
responsiveness dimension was rated at the lowest score ( 269) among the five
dimensions followed by the reliability ( 280) dimension It was highly possible that the
passengersrsquo dissatisfaction occurred when passengers did not receive prompt service from
TG when they needed help
Prompt service is an important factor of customersrsquo expectation Customers
generally rate the service as poor when the speed of service does not meet their
expectations (Kholthanasep 2001) Bojanic and Rosen (1994) examined the nature of the
association between service quality as perceived by consumers and its determinants by
applying SERVQUAL in a restaurant setting They found that customers rated
responsiveness as the lowest satisfaction in their studies Zeithaml et al (1990) explained
that the responsiveness dimension in the SERVQUAL was willingness to help customers
and provide prompt service As the responsiveness dimension in this research comprised
prompt service willingness on-time service and quick response therefore it will be
beneficial to TG if the company can ensure that the service provided by its cabin crew
especially the willingness to help passengers and to provide prompt service meet
passengersrsquo satisfaction
Regarding the relationship between the participantsrsquo demographic data and their
satisfaction with the service quality there are many points of interests to be discussed as
follows
Firstly regarding the relationship of the passengersrsquo satisfaction with the service
and their age those who were under 20 years old rated satisfaction with the
responsiveness dimension ( 290) higher than the reliability dimension ( 270) (See
x
x
x x
41
Table 7) It was possible that young passengers usually gave priority to the dimension of
care and service when compared with that of the service providersrsquo accurate and
dependable manner (Panittumrong 2003) In addition young customers had less
experience in a service and it was difficult to compare the current service with the past
experience consequently they were more satisfied with the service provided than senior
customers
Another point was raised about the participantsrsquo age The study revealed that the
number of the high group with the age range of 21- 40 was at 567 However that of
the second highest group of the participants with the age range of 41-60 was at 30
which was rather high This latter grouprsquos level of satisfaction on the service quality was
also close to the average mean score It was found that the average mean score of the
reliability dimension was 280 while that of the second highest group was 281 the
average mean score of the assurance dimension was 345 while that of the second highest
group was 347 the average mean score of the tangibles dimension was 334 while that of
the second highest group was 335 the average mean score of the empathy dimension and
that of the second highest group was rated at 307 equally and the average mean score of
the responsiveness was 269 while that of the second highest group was 271 In sum if
consider the two groups in terms of the participantsrsquo age one of the high group and the
other with the second high group the results confirmed that the satisfaction level of the
majority of passengers was at the above average level
Secondly regarding the relationship between the participantsrsquo satisfaction and
their occupation business employees who were found at the highest number (42) had
very low satisfaction with the service quality in terms of reliability ( 275) and
responsiveness ( 264) while the mean scores of the whole sample group for these two
dimensions were at 280 and 269 respectively (See Table 8) The findings strongly
x
x
42
correlated with that of Cheaosakul (2004) who studied the consumersrsquo perception of
airline service quality with a focus on occupations It was found that the group of
business employees had the highest score on expectations Cheaosakul (2004)rsquos study
also revealed that business employees did not frequently travel compared with people of
other occupations such as tourists It was found in this particular study that the number of
the participantsrsquo purpose of travel with TG for business trips was only at 273 (See
Table 5) while the highest number of the participants went on holiday was at 52
Cheaosakul (2004) indicated that business people therefore had high expectations than
the other group who traveled more frequently
Thirdly an even more interesting point was raised when comparing the level of
satisfaction of the passengers who were government officials or state enterprise
employees and business owners Although passengers who were government officials or
state enterprise employees came third in terms of participants they are considered
valuable customers of TG since according to the governmentrsquos policy they are required
to take only TG which is a national airline whenever they travel by air There are few
exceptions though However it is almost impossible for Thai government officials who
travel on business trip and are funded by the governmentrsquos budget to fly with other
airliners It was found from this study that government officials were less satisfied with
TG quality service in terms of reliability ( 277) and responsiveness ( 264) than the
average level of which the mean scores of the two dimensions were at 280 and 269
respectively
Another issue of discussion regarding the participantsrsquo occupation business
owners came second It was observed that business owners rated the reliability ( 282)
and responsiveness dimensions ( 270) higher than the average scores of all groups (See
Table 8) It is possible that business owners had more positive attitude with TGrsquos service
x x
x
x
43
than the other groups TG seemed popular among business owners and they were the
most important group of customers This was supported by Suriya (2005) who studied
airline market segments after the launch of the low cost airlines in Thailand Suriya
(2005) identified that merchants or business owners were the major group of customers in
the full-service airline market
Fourthly regarding the monthly income of the research participants of the low
group passengers who earned an income of around 60001 or higher rated the empathy
( 325) dimension higher than tangibles ( 321) dimension (See Table 9) This may
be because the high income passengers sensitively felt that the facilities and equipment
found on their domestic route looked quite old-fashioned due to TGrsquos cost reduction The
company saved costs after the Suvannabhumi airport was closed in the 2008 crisis The
result is similar to the findings of Wangpen and Inthornma (2007) in that high income
customers had higher expectations towards the service It was possible that they had
more tendencies to be dissatisfied with the service failures The two researchers
concluded that passengers with different incomes were satisfied with the services at
different levels because they had different attitudes expectations and abilities to pay for
the service
Fifthly as it was found from this study that the highest score for the purpose of
travel was going on holiday (527) and the participants who were tourists rated the
assurance dimension at the highest level or the mean score of 353 (See Table 10) much
higher than the mean score of the whole group which was at 345 It was rather surprising
that the highest score for the travel purpose was not for business trips It is possible to
explain that this group spent for the travel cost on their own and they might want to make
sure that they chose the best service for themselves The result is parallel with Gabbie
and OrsquoNeill (1997) who examined customer satisfaction in the hotel sector using the
x x
44
SERVQUAL tool This study showed that the holiday guests who paid for
accommodation on their own rated assurance much higher than other dimensions It is
plausible to explain that passengers traveling on their own budget must make sure that
they already chose the service that was worth the money spent
However when analyzing the satisfaction on service quality of the participants
whose purpose of travel via TG was for business it was also found that this business
participants rated the high score for the tangibles dimension at the mean score of 340
compared with the average mean score of all groups of 334 Passengers who traveled on
business included government officials and state enterprise employees were major
customers of TG It was therefore interesting to find out from this study that their
satisfaction score in terms of tangibles or the appearance of physical factors such as
equipment facilities and personnel was above the average score of all groups Although
the score was not much higher the gap was bigger than that of the other RATER
dimensions as seen from the following information the passengers who traveled on
business trip showed their satisfaction on the reliability dimension at the mean score of
281 the assurance dimension at 347 the empathy dimension at 309 and the
responsiveness dimension at 270 while the average of all groups was at 280 345 307
and 269 respectively
The last point that the researcher wanted to point out is that this study revealed
that the participants who traveled more than 10 times for the last 12 months were lowest
in number (13) However it was interesting that these frequent flyers showed the high
rate of satisfaction with TGrsquos in-flight service quality The mean scores in all dimensions
showed the high rate of satisfaction (See Table 11) It is possible that passengers who
traveled very often via TG had high loyalty The brand loyalty made passengers happy in
every feature of service This result however contrasts with Ostrowski et al (1993) who
45
investigated service quality and customer loyalty in the commercial airline industry The
study examined whether the high levels of service quality existed in the US commercial
airline industry and how service quality could potentially lead to customer loyalty The
main results indicated that the levels of perceived service quality were below potential
and that customer loyalty to airlines was low It is plausible to say that the data of the two
studies were different The data collected on two air carriers in USA might have
different characteristics from the demographic information of Thai people and the number
of the participants in the two studies might differ However TG still needs to listen to the
voice of all passengers especially the frequent flyers Even if the number of this sample
group was few every customer is valuable for any firm Also it would be valuable to
implement a relevant strategy to expand this group of passengers since they had a positive
attitude for TG
Interestingly the findings from the last part of the questionnaire also showed that
the majority of the participants (946) showed their willingness to use TGrsquos service in
the future It can plausibly be explained that the participants were satisfied with TGrsquo
service quality at the moderate level ( 307) Their satisfaction with the five dimensions
of SERVQUAL was also moderate They might think that TG is a reliable airline that
they can depend on Thai passengers have confidence and trust in the service of Thai
cabin crew in terms of courtesy Also it is possible that they might not trust the low cost
airlinesrsquo service of the crew
There were only seven remarks on the in-flight service when the participants were
asked to freely give suggestions The tangible dimension problematic Passengers
pointed out about the small size of passengersrsquo seats and the quality of the air-
conditioning system One problem was on the responsiveness dimension which happened
when a passenger asked for a blanket but she was not offered indicating that some of the
x
46
cabin crewrsquos promptness to provide service was still not up to a standard Another
comment was on the flavor of the snacks Although this issue is not directly relevant to
the service it is worthwhile for TG to consider this problem
In conclusion the researcher found both strengths and weaknesses in TGrsquos service
quality Assurance was found the highest satisfaction in the participantsrsquo opinion TG
should maintain the service quality with a focus on this dimension On the other hand
the responsiveness and reliability dimensions were at the lowest satisfaction level among
the five dimensions The company should improve its service quality on these two
dimensions especially with regards to TGrsquos lsquoprompt servicersquo and lsquoproblem solvingrsquo
service to retain its passengers
53 Limitations of the study
This study has some limitations as follows
1 This study was limited to only one domestic route (Bangkok ndash Chiangmai)
Therefore the participants in this study were passengers who traveled only between these
two provinces The results of the study might differ if the study covered another route or
many more routes at the same time Consequently further studies can be conducted for
other domestic destinations such as Phuket and other big cities
2 The research participants were all Thai passengers It would be interesting to
study foreign passengersrsquo satisfaction on TGrsquos in-flight service quality
3 This study focused only on Parasuraman et al (1985)rsquos SERVQUAL
Instrument used to assess the service quality The results might differ if other instruments
were used
47
54 Recommendations for further studies
Further research should be undertaken to validate the results of this study The
researcher has found several opportunities to extend this study as follows
Survey on the lsquoresponsivenessrsquo dimensions
Responsiveness concerns the willingness or readiness of employees to provide
service such as timelines of service and prompt service This dimension was what the
passengers in this study were most concerned about because it was rated as the lowest
level of satisfaction Thus TG should find the countermeasure of how to increase the
level of passengersrsquo satisfaction in the responsiveness dimension
Assessment of the ground service quality
Since this research was conducted on on-board service quality further studies on
ground services such as a reservation or check-in service should be investigated in order
to integrate the results covering every sector of the airline service
Study on passengersrsquo attitude towards the service quality in other airlines
A study on the service quality of other airlines should be conducted in order to
obtain comparative data and find out reasons for their passengersrsquo behavior and attitude
consequently allowing TG to remedy any weak points and increase the number of new
passengers
REFERENCES
REFERENCES
Alegre J amp Pou L (2006) An analysis of the microeconomic determinants of travel
frequency Department of Applied Economics Universitat de les Illes Balears
Bojanic DC (1991) Quality measurement in professional service firms Journal of
Professional Service Marketing 7(2) 27-37
Bojanic D C amp Rosen L D (1994) Measuring service quality in restaurants An
application of the SERVQUAL model Journal of Hospitality Research 18(1)
3-14
Boontaganon W (2002) The study of service quality of fast-food restaurants in Bangkok
using SERVQUAL measurement Thesis MBA (Business Administration)
Bangkok Assumption University Photocopied
Buttle F (1996) SERVQUAL review critique research agenda European Journal of
Marketing 30(1) 8-31
CarmanJ M (1990) Consumer perceptions of service quality An assessment of the
SERVQUAL dimensions Journal of Retailing 69 33-35
Cheaosakul W (2004) Consumers perception of service quality a case study of Thai
Airways International Plc Thesis MBA Bangkok Assumption University
Photocopied
Fick RG amp Ritchie JRB (1991) Measuring service quality in the travel and tourism
industry Journal of Travel Research 30(2) 2-9
Fornell C (1992) A national customer satisfaction barometer the Swedish experience
Journal of Marketing 56 6-21
Gabbie O amp OrsquoNeill M (1997) SERVQUAL and the Northern Ireland hotel sector a
comparative analysis part 2 Managing Service Quality 17(1) 43-49
50
Gilbert DH (1999) Marketing connecting with customers (2nd
ed) Upper Saddle
River NJ Prentice Hall
Gilbert D amp Wong KCR (2002) Passenger expectations and airline services a
Hong Kong based study Surrey Management School Surrey University of
Surrey
Gitman LJ amp Carl DM (2005) The future of business the essentials Mason Ohio
South-Western College Pub
Grifin J (1995) Customer loyalty NY Lexington Book
Gronroos C (1978) A service-oriented approach to marketing of services European
Journal of Marketing 12(8) 588-601
Hennig-Thurau T amp Klee A (1997) The impact of customer satisfaction and
relationship quality on customer retention a critical reassessment and model
development Masterrsquos Project MA (Psychology amp Marketing) Hanover
University of Hanover
Heesawat C (2005) The opportunities and problems in making services more tangible
PhD Dissertation Bangkok Assumption University Photocopied
Juran JM amp Gryna FM (1974) Quality control handbook NY McGraw-Hill
Kholthanasep G (2001) A study of customerrsquos expectations and perceptions of service
quality delivery by first class hotels in Bangkok metropolitan area Thesis
MBA Bangkok Assumption University Photocopied
Kotler P amp Scheff J (1997) Standing room only strategies for marketing the
performing arts Boston Mass Harvard Business School Press
Kotler P (1997) Marketing management analysis planning and control (9th
ed) Upper
Saddle River NJ Prentice Hall
51
Kotler P Bowen J amp Makens J (1999) Marketing for hospitality and tourism (2nd
ed) NJ Prentice Hall
Kotler P (2000) Marketing management the millennium edition (10th
ed) NJ Prentice
Hall
Lages FL amp Fernandes CJ (2005) The SERVQUAL scale a multi-item instrument
for measuring service personal values Journal of Business Research 58(11)
1562-1572
Oberoi U amp Hales C (1990) Assessing the quality of the conference hotel product
London The Service Industries Journal 10(4) 700-722
Ostrowski PL Orsquobrien TV amp Gordon GL (1993) Service quality and customer
loyalty in the commercial airline industry Journal of Travel Research 32(2)
16-24
Palin M (1996) Flight catering transportation and loading (2nd
ed) London Longman
Group Limited
Panittumrong P (2004) The consumerrsquos opinion towards Clark Hatch Fitness Center
Master Project MBA (Management) Bangkok Graduate School
Srinakharinwirot University Photocopied
Parasuraman A Zeitmal VA amp Berry LL (1985) A concept model of service
quality and its implications for future research Journal of Marketing 49 41-50
Parasuraman A Zeitmal VA amp Berry LL (1988) SERVQUAL a multiple item
scale for measuring customer perceptions of service quality Journal of
Retailing 64(1) 64
Parasuraman A amp Berry LL (1991) Marketing services competing through quality
NY The Free Press
52
Pirsig RM (1987) Zen and the art of motorcycle maintenance an inquiry into values
(Mass Market Paperback) NY Bantam Books
Poonlarbtawee K (1987) Statistics for research Bangkok Physic Center Printing
Reid RD amp Bojanic DC (2001) Hospitality marketing management NJ John Wiley
amp Son Inc
Rueangthanakiet P (2008) Memberrsquos satisfaction of fitness service quality a case study
of California Wow Xperience Plc Masterrsquos Project MA (Business English for
International Communication) Bangkok Graduate School Srinakharinwirot
University Photocopied
Sachukorn S (2006) Reception and service excellence Bangkok Saitharn
Schiffman LG amp Kanuk LL (1994) Consumer behavior (5th
ed) London Prentice-
Hall International
Somwang C (2008) An assessment of passengersrsquo views of service quality in Thai low
cost carriers Inter Program MA (Communicative English) Bangkok
Ramkhamhaeng University Photocopied
Suriya K (2005) Airline market segments after low cost airlines in Thailand passenger
classification using neural networks and logit model with selective learning
Faculty of Economics Chiangmai Chiangmai University
Suthirungkul N (2003) The study of customer expectations and perceptions of service
quality of the Clark Hatch fitness center of Silom road branch Bangkok Thesis
MBA (Business Administration) Bangkok Assumption University
Photocopied
Thai Airways International (2008) Traffic program information (Introduction of summer
200809) Bangkok THAI Printing Office
53
Thai Airways International (2009) Traffic program information (Introduction of winter
200910) Bangkok THAI Printing Office
THAI AIRWAYS INTL Official 4-Star Ranking of Product and Service Quality (2009
October) Retrieved February 14 2010 from
httpwwwairlinequalitycomAirlinesTGhtml
Travel Planning (2010 February 12) Retrieved February 12 2010 from
httpwwwsuite101comlessoncfm1848818243
Wangpen N amp Inthornma S (2007) Membersrsquo satisfaction in fitness centers in
Bangkok Thesis MA (Hotel and Tourism Management) Bangkok Graduate
School Naresuan University Photocopied
Zeithaml VA amp Bitner MJ (2000) Services marketing (2nd
ed) NY McGraw Hill
Zeithaml VA Parasuraman A amp Berry LL (1990) Delivering quality service
balancing customer perceptions and expectations NY Free Press
APPENDICES
55
APPENDIX A
แบบทดสอบความพงพอใจของผโดยสารการบนไทย
เรยนทานผโดยสารทเคารพ กระผมนาย วลาศ มนคงวณชกล พนกงานตอนรบสายการบนไทย และนกศกษาปรญญาโท หลกสตรภาษาองกฤษธรกจเพอการสอสารนานาชาต มหาวทยาลยศรนครนทรวโรฒ ไดจดท าแบบสอบถามนเพอเปนสวนหนงของการส ารวจความพงพอใจของผโดยสารทมตอคณภาพงานบรการ เทยวบนภายในประเทศของการบนไทย โดยมงหวงทจะน าขอมลทไดรบจากการส ารวจมาเปนประโยชนตอการสงเสรมสนบสนนการปฏบตงานใหเกดประสทธผล จงขอความกรณาจากทานในการตอบแบบสอบถามทกขอตามขอเทจจรงและความเหนของทาน ขอมลทงหมดเปนความลบ จะใชเพอการวจยเทานน และขอขอบคณในความรวมมอของทาน
helliphelliphelliphelliphelliphelliphelliphelliphelliphelliphelliphelliphelliphelliphelliphelliphelliphelliphelliphelliphelliphelliphelliphelliphelliphelliphelliphelliphelliphelliphellip
ค าชแจง โปรดท าเครองหมาย (x) ลงในชองวาง ทตรงกบค าตอบของทาน
ตอนท 1 ขอมลทวไป
1 เพศ ( ) ชาย ( ) หญง 2 อาย ( ) ตากวา 20 ป ( ) 21-40 ป ( ) 41-60 ป ( ) 60 ปขนไป 3 อาชพ ( ) ขาราชการ รฐวสาหกจ ( ) พนกงานบรษท ( ) ธรกจสวนตว ( ) นกเรยน นกศกษา ( ) เกษยณ ( ) อนๆ 4 รายได เดอน ( ) ตากวา 20000 ( ) 20001- 40000 บาท ( ) 40001- 60000 บาท ( ) 60001 บาท ขนไป 5 จดประสงคการเดนทาง ( ) ธรกจ ( ) พกผอน ( ) เยยมเยยนญาตมตร เพอนฝง ( ) อนๆ 6 ความถในการเดนทางกบการบนไทย (ในรอบ 12 เดอน) ( ) ครงแรก ( ) 2-3 ครง ( ) 4-10 ครง ( ) 10 ครงขนไป
56
ตอนท 2 ความพงพอใจของทานตอการบรการ (5 = เหนดวยอยางยง 4= เหนดวย 3= ปานกลาง 2=ไมเหนดวย 1=ไมเหนดวยอยางยง)
ระดบความพงพอใจ
การบรการของการบนไทย 5 4 3 2 1 1 เมอเจาหนาทสญญาทจะใหบรการทานในเรองใด จะทาตามนนเสมอ
2 การใหบรการของเจาหนาท สรางความเชอมนใหกบทาน
3 อปกรณบนเครองบนมรปแบบททนสมย (เชน จอทว ทนง)
4 บรษทฯกาหนดเวลาการใหบรการบนเครองเหมาะสม
5 เจาหนาทใหบรการทดนบตงแตกาวแรกบนเครอง
6 เจาหนาทมความตงใจดทจะชวยเหลอทาน เมอทานมปญหา
7 ทานรสกปลอดภยเมออยบนเครองบน
8 สงอานวยความสะดวกตางๆบนเครอง มรปลกษณทดงดดใจ (เชน กลองอาหาร) 9 เจาหนาทไมเขาใจความตองการของทาน ในบางกรณ
10 เจาหนาทไมไดระบเวลาในการใหบรการผโดยสารบนเครองทแนนอน 11 เจาหนาทพยายามทางานโดยไมใหเกดขอผดพลาด
12 เจาหนาทปฎบตงานดวยความสภาพเสมอ
13 เจาหนาทแตงกายเรยบรอยและดด
14 บรษทฯใหความเอาใจใสกบผโดยสารเปนรายบคคล
15 บางครงเจาหนาทไมเตมใจทจะใหบรการผโดยสาร
16 บรษทใหบรการทานตรงเวลาทกาหนด
17 เจาหนาทสามารถใหขอมลเกยวกบการเดนทางไดอยางถกตอง
18 เอกสารของบรษทฯทเกยวของกบการบรการ (เชน แผนพบ นตยสาร) มขอมลครบถวน และรปแบบสวยงาม 19 เจาหนาทใหบรการทานดวยสมผสความเปนไทย
20 เจาหนาทใหบรการผโดยสารอยางรวดเรว
ทานจะกลบมาใชบรการของการบนไทยตอไป จะใชบรการตอไป ไมใชบรการ
ขอเสนอแนะ_______________________________________________________
_____________________________________________________________ ขอบพระคณอยางสงในความรวมมอของทาน
57
APPENDIX B
Questionnaire
Dear Honorable Passengers
My name is Wilas Mankongvanichkul -- a THAI cabin crew and masterrsquos student of business English
for international communication program Srinakharinwirot University This questionnaire is about
an exploration of passengersrsquo satisfaction with service quality of Thai Airways International (TG)rsquos
domestic flights Data gained will be utilized for THAI service operation Please kindly complete the
questionnaire The data gained will be kept confidential and used for the research study only Your
kind cooperation is greatly appreciated
helliphelliphelliphelliphelliphelliphelliphelliphelliphelliphelliphelliphelliphelliphelliphelliphelliphelliphelliphelliphelliphelliphelliphelliphelliphellip
Direction Please mark (x) your answer in the space provided
Part 1 Personal Information
1 Gender
( ) Male ( ) Female
2 Age
( ) Under 20 years ( ) 21-40 years
( ) 41-60 years ( ) Above 60 years
3 Occupation
( ) Government official State enterprise employee
( ) Business employee
( ) Business owner ( ) Student
( ) Retiree ( ) Others
4 Monthly income
( ) Up to 20000 baht ( ) 20001- 40000 baht
( ) 40001 ndash 60000 baht ( ) 60001 baht and above
5 Purpose of travel
( ) Business trips ( ) Holidays
( ) Visits ( ) Others
6 Frequency in traveling with THAI (during the last 12 months)
( ) First time ( ) 2-3 times
( ) 4-10 times ( ) More than 10 times
58 Part 2 Your satisfaction with the service
(5=Strongly Agree 4= Agree 3=Uncertain 2=Disagree 1= Strongly Disagree)
Level of Satisfaction
The Service of THAI 5 4 3 2 1
1 When cabin crew promise to do something by a
certain time they do so
2 You can trust THAI cabin crew
3 TG has modern on board equipment
(such as TV screen passengersrsquo seats)
4 TG has operating hours on board convenient to all
passengers
5 Cabin crew offer good services upon boarding
6 When passengers have a problem cabin crew show a
sincere interest in solving it
7 Passengers feel safe on-board
8 The physical facilities of TG are visually appealing
(such as meal boxes)
9 Cabin crew do not understand your special needs in
some cases
10 Cabin crew do not tell passengers exactly when
services will be offered
11 Cabin crew insist on error-free records
12 Cabin crew are consistently courteous to passengers
13 Cabin crew are well-dressed and neat in appearance
14 TG gives passengers individual attention
15 Cabin crew are not always willing to help passengers
16 TG provides its services at the time it promises to
do so
17 Cabin crew are knowledgeable to answer passengers
travel-related questions
18 Documents about service are informative and appealing
(such as pamphlets and magazines)
19 Services provided have a ldquoThai Touchrdquo
20 Cabin crew are quick to respond to passengersrsquo requests
Will you come back for TGrsquos service Yes No
Suggestions________________________________________________________________
________________________________________________________________________ Thank you very much for your kind cooperation
59
APPENDIX C
Questionnaire Specification Based on SERVQUAL measurement (Parasuraman et al 1985)
Passengers satisfaction level toward service quality factors
No Service Quality Features (RATER)
Str
on
gly
ag
ree
Ag
ree
Un
certa
in
Dis
ag
ree
Str
on
gly
Dis
ag
ree
(5) (4) (3) (2) (1)
1 When cabin crew promise to do something by a certain time they do so Reliability
2 You can trust THAI cabin crew Assurance
3 TG has modern on board equipment (such as TV screen passengersrsquo seats) Tangibles
4 TG has operating hours on board convenient to all passengers Empathy
5 Cabin crew offer good services upon boarding Responsiveness
6 When passengers have a problem cabin crew show a sincere interest in solving it
Reliability
7 Passengers feel safe on-board Assurance
8 The physical facilities of TG are visually appealing (such as meal boxes) Tangibles
9 Cabin crew do not always understand your special needs in some cases Empathy
10 Cabin crew do not tell passengers exactly when services will be offered Responsiveness
11 Cabin crew insist on error-free records Reliability
12 Cabin crew are consistently courteous to passengers Assurance
13 Cabin crew are well-dressed and neat in appearance Tangibles
14 TG gives passengers individual attention Empathy
15 Cabin crew are not always willing to help passengers Responsiveness
16 TG provides its services at the time it promises to do so Reliability
17 Cabin crew are knowledgeable to answer passengers travel-related questions Assurance
18 TGs documents associated with services are informative and appealing (such as pamphlets and magazines)
Tangibles
19 Services provided have a ldquoThai Touchrdquo Empathy
20 Cabin crew are quick to respond to passengersrsquo requests Responsiveness
VITAE
61
VITAE
Name Wilas Mankongvanichkul
Date of Birth February 14 1980
Place of Birth Bangkok
Address 688 Soi Phaholyothin 32 Chankasem Jatuchak
Bangkok 10900
Present Occupation Cabin Crew
Thai Airways International Public Company Limited
89 Vibhavadi Rangsit Road Bangkok 10110
Education Background
2010 Master of Art (Business English for International
Communication)
Srinakharinwirot University
2001 Bachelor of Business Administration Bangkok University
1997 High School Saint Dominic School
- Cover
- Abstract
- Chapter 1
- Chapter 2
- Chapter 3
- Chapter 4
- Chapter 5
- Bibliography
- Appendix
- Vitae
-

3
quality so as to see if the company needs to better serve the customers and what service
areas need to be improved
12 Objectives of the Study
The main objectives of this study were first to explore the level of passengersrsquo
satisfaction with the service quality on Thai Airways Internationalrsquos domestic flights in
terms of five dimensions of SERVQUAL instrument reliability assurance tangibles
empathy and responsiveness Second the relationship of the satisfaction with the research
participantsrsquo demographic profile ie age occupation income purpose of travel and
frequency of travel were investigated
13 Significance of the study
The outcomes of this study would help TGrsquos customer service managers and other
practitioners to better understand the overall picture of TG service delivery and also of
their passengersrsquo satisfaction level Moreover the results from this research would assist
airline managers to better serve their customers monitor and develop service quality to
achieve the highest level of their passengersrsquo satisfaction It was hoped that the findings
could help TG increase its competence to compete with other airline companies In
addition the findings would enhance other airliners to improve their customer relations
management as well as their brand loyalty
14 Scope of the Study
The research was focused on a sample group of 150 Thai passengers 75 males
and 75 females who traveled with ten TGrsquos domestic flights on the route from Bangkok to
Chiangmai The Bangkok - Chiangmai route was chosen for the study because TG had
4
the highest number of domestic passengers traveling on this route as Chiangmai has
served as both domestic and international airline hub (THAI 2008)
The questionnaire employed in the study was based on the SERVQUAL
instrument (Parasuraman et al 1985) It was used to reflect the companyrsquos service in
five dimensions reliability assurance tangibles empathy and responsiveness
15 Definition of Terms
SERVQUAL is a tool developed by Parasuraman et al (1985) and is used to
measure service quality via five dimensions (RATER)
Reliability is the ability to perform the service in an accurate and dependable
manner
Assurance involves the knowledge and courtesy of employees and their
ability to convey trust and confidence
Tangibles present the appearance of physical factors such as equipment
facilities and personnel
Empathy indicates providing individual attention and care to customers
Responsiveness refers to the willingness to provide help and prompt service
to customers
Service quality is a customerrsquos perception that occurs when the need of service is
met above average more than just adequate In other words service quality is the ability
of service that meets a customers expectations for that service It represents the
properties of the service valued by the customer According to Parasuraman et al
(1985) service quality is measured by five dimensions (RATER) reliability assurance
tangibility empathy and responsiveness
5
Customer satisfaction is a measure of how a product and service supplied by a
company meets or surpasses customer expectation It is seen as a key performance
indicator within business and is an indication of how successful the company is at
providing products andor services to the market Customer satisfaction is an abstract
concept and the actual happening of the state of satisfaction will vary from person to
person and productservice to productservice In a competitive market where businesses
compete for customers customer satisfaction is considered a key element of business
strategy (Gitman amp McDaniel 2005)
CHAPTER TWO
REVIEW OF LITERATURE
This chapter presents a review of literature and research which is related to the
study It comprises six topics the aviation industry in Thailand customer satisfaction
service quality SERVQUAL instrument demographic variables and previous related
studies
21 The Aviation Industry in Thailand
The world economic crisis and the uncertainty of Thai political situations have
directly affected customer purchasing power of all kinds of businesses including the
airline industry The Tourism Authority of Thailand (TAT) has tried to boost the
domestic travel in several ways including an offer of promotional traveling packages
This is a tactic of turning a crisis to an opportunity as well as enhancing domestic airlinesrsquo
sales
To provide a detailed picture on this topic two issues are discussed domestic
airline operators and the nature of airline business onboard services
Domestic Airline Operators
In terms of fare the domestic airlines that are currently operating in Thailand are
low-cost airlines and full-fare airlines
A low-cost airline is an airline which charges relatively lower fares To generate
more revenue from loss of decreasing margin of ticket prices the low-cost airline may
ask for extra charges for such as food priority boarding seat allocating and baggage
7
privileges etc This type of airlines includes Bangkok Airways Nok Air Orient Thai
Airlines and Air Asia
Meanwhile a full-fare airline sells tickets at full prices and traditionally offers
three travel classes namely first business and economy classes Thai Airways
International is the sole operator in Thailand who operates this type of airline service TG
is serving 10 airports domestically and providing sufficient capacity to serve local
demands During the festive season extra flights are provided in a greater number to
meet peak demands particularly those to Chiangmai and Phuket (THAI 2009)
TG flies to two destinations in the North ie Chiangmai and Chiangrai three
destinations in the Northeast ie Khonkaen Udonthani and Ubolratchathani and five
destinations in the South ie Phuket Hatyai Suratthani Krabi and Samui
To recap there are two major groups of domestic airlines in terms of airfare which
are low cost and full-fare airlines TG is the only full-fare airline operator in Thailand
The Nature of Airline Business On-board Services
The airline business has become more competitive and most airlines in
considering their competitive edge take into account the quality of service to be offered
to customers (Palin 1996) Typically a service package includes lsquotangiblesrsquo which refer
to goods provided for customers and lsquointangiblesrsquo which are those related to the quality of
service offered to the customers The in-flight service-package includes both tangibles
and intangibles The problem to be addressed is the need to ensure that all the flights are
fully stocked with the physical items in the service package together with hygienic and
functional equipment requested by cabin crew for providing service These goods fall
into four categories
1 Food items including beverages to be consumed on board
8
2 Non-food items comprising an extensive list which may include newspapers
blankets toilet bags headsets for aircraft audio-visual systems
3 Duty-free goods for passengers to purchase on the aircraft
4 Equipment required by cabin crew for providing service The service
equipment includes tea and coffee-making equipment first aid kits etc
Nevertheless the quality of a service package not only depends on food drinks
and facilities on the aircraft such as newspapers blankets toilet bags headsets etc but it
also depends on the skills and knowledge of cabin crew who serve passengers to create
positive attitudes toward the airline and to enhance the brand loyalty
In conclusion the aviation industry in Thailand is very competitive Low-cost
airlines have increasingly become more popular because of the economic crisis To
compete with those budget airlines TG needs to find ways to retain and attract
passengers
22 Customer Satisfaction
It is impossible for any business to sustain itself without customers Accordingly
factors contributing to any successful business mainly result from customer satisfaction
customer loyalty and customer retention One important factor in determining the
likelihood of success and profits of an organization is customer satisfaction Customer
satisfaction results in customer loyalty When there is customer loyalty the customer
retention rate is high and good business results tend to follow
Customer satisfaction a business term is a measure of how products and services
supplied by a company meet or surpass customersrsquo expectation In a competitive
marketplace where businesses compete for gaining more customers customer satisfaction
9
is seen as a key performance indicator within a business and has increasingly become a
key element of business strategy (Gitman amp Carl 2005)
Hennig-Thurau and Klee (1997) state that customer satisfaction with a companys
products or services is often regarded as the key to the companys success and long-term
competitiveness Customer satisfaction is also often viewed as a central determinant of
customer retention A high customer satisfaction level yields several benefits It
heightens customersrsquo loyalty and prevents customersrsquo complaints lowers customersrsquo
price sensitivity reduces the costs of failed marketing and of new customer creation
reduces operating costs due to an increase in number of customers improves the
effectiveness of advertising and enhances business reputation (Fornell 1992) However
specialists on satisfaction indicate that the main factors determining customer satisfaction
are the customersrsquo own perceptions and expectations of service quality (Zeithaml amp
Bitner 2000)
Customersrsquo expectation and perception
Customersrsquo perception of service quality depends on the degree of the service that
meets the customersrsquo expectations service providers must know how to shape those
expectations The messages from service providers contribute significantly to expectation
development because the service is mostly regarded as intangible and people cannot
readily observe for themselves what to expect It is critical that the service provider gives
information to customers as clearly and accurately as possible before the customers make
a purchase Organizations that create unrealistic expectations in an effort to sell a service
are likely to find their customersrsquo satisfaction low Those unhappy customers will tell
others and the credibility of the business will be damaged (Gilbert 1999)
10
To ensure highly perceived quality and to maintain loyal customer base service
providers need to be accurate and reasonable about what they lead customers to expect
They also need to do a good job in the areas of reliability assurance tangibles empathy
and responsiveness It is difficult for companies to get ahead of the competition and the
nature of competition in the service industry is more difficult to protect from imitation
Competitors are increasingly forced to imitate the best features of one another
Therefore any competitors who try to invest more energy and resources in building
strong service quality are most likely to be winners (Gilbert 1999)
Factors Affecting Consumers Expectation
The key factors influencing consumersrsquo view on service quality include word of
mouth personal needs customersrsquo past experience and external communication
(Parasuraman et al 1985)
Word of mouth is particularly important because when consumers are satisfied or
dissatisfied with the service they are likely to share it with their friends Service is
generally classified as intangible Customers cannot actually ldquoseerdquo the service until they
experience it Before making a purchase customers need to find out as much information
as possible so as to make a good decision Word of mouth is a means to make a
consumer feel interested or uninterested in the service
Personal needs are considered another important factor They deal with the
motives that determine the nature and strength of what a consumer expects from a
service
Meanwhile past experience refers to what consumers have learned through their
personal interaction with a service provider It is particularly important in shaping
customersrsquo expectations
11
The last factor is external communication comprising such as direct sale and
advertisement in order to communicate and position a service through messages which
can influence consumer perceptions
In summary each factor can individually or harmoniously affect consumersrsquo
purchasing decision Customer satisfaction is a key to business success In order to make
customers satisfied a company needs to understand their expectations and perception by
studying the factors that affect their purchasing decision
23 Service Quality
A search for the definition of ldquoqualityrdquo has yielded inconsistent results Quality
has been variously defined as fitness for use in the product which successfully serves the
purpose of the user during usage (Juran amp Gryna 1974) In addition Zeithaml et al
(1990) state that ldquoqualityrdquo is what exceeds the customersrsquo expectation of the service
On the other hand quality is a characteristic of thoughts and statements believed
to be taken for granted if an explanation of quality is going to be both false and true
precisely (Pirsig 1987) Pirsig also says that since definitions derive from abstract and
formal thinking quality cannot be defined it is impossible to define quality because
quality can never be considered independently but only in relation to what is perceived
Measuring Quality in Service
Parasuraman et al (1985) point out that service quality is more difficult for the
consumers to evaluate than the product quality Perception of service quality results from
a comparison of customer expectations with actual service performance Quality
evaluations are made not only from the outcome of a service but also from the ldquoprocessrdquo
12
of service delivery and the customers have fewer tangible characters to be measured
physically when purchasing services than when purchasing products (Gronroos 1978)
Service quality is the degree of how well the service level delivered matches
customer expectations Delivering quality service means that the service provider needs
to follow customer expectations on a consistent basis (Lewis amp Booms 1983)
To conclude three underlying service quality themes can be drawn from the
discussion as follows
Service quality is more difficult for the customer to evaluate than product quality
Service quality perceptions result from a comparison of consumer expectations
with actual service performance
Quality evaluations are not made solely on the outcome of a service They
involve evaluations of the process of service delivery
The Benefits of Service Quality
The benefits of service quality comprise four areas as follows (Kotler 2000)
Customers Retention High quality builds loyal customers and creates positive word of
mouth which is an important factor in purchase decision This can determine customer
satisfaction which affects repeat business If a customer is happy with an existing firm it
is difficult to convince him or her to move to another
Avoidance of Price Competition A firm with a reputation for high quality has
a much stronger competitive position than one with a reputation for poor quality Price-
cutting by a competitor will not be enough to encourage a client to switch Good quality
is more powerful to remain competitive
13
Retention of Good Employees Employees appreciate working in operations
that are well run and produce quality products They do not enjoy receiving customer
complaints Also turnover and loss of employee morale are listed as costs of poor quality
manpower When an operation has good quality it can retain good employees And at
the time business expansion is needed recruiting is easier and training cost is reduced
Reduction of Costs The quality cost includes internal costs external costs and
quality system costs Internal costs are those associated with correcting problems
discovered by the firm before products reached customers External costs are related to
errors that the customers experience They can be very expensive when the customers
decide not to return because of a service problem Then the promotional and advertising
costs or external costs are necessary to be spent to create the company image in order to
make customers come back and win brand loyalty for the company in the end However
the company needs to check the service quality through customersrsquo feedback periodically
to avoid problems
Although the quality service system does not come without costs it is usually less
than those internal and external costs resulting from poor quality service Some examples
of the costs of a quality system include customer service audits trainings management
meetings with employees and customers and introduction of a new technology (Kotler
Bowen amp Makens 1999)
To sum up it is necessary for a service company to know the service quality level
The quality needs to be evaluated by comparing customer experience with service
performance Once a service company reaches a good quality level a company will
retain its customers easily be away from price wars keep and get good employees and
reduce some operation costs
14
Thai Airways In-flight Service Quality
The latest airline evaluation in 2009 by Skytrax from United Kingdom which is a
research organization focused on in-flight services revealed that TG got the official 4-star
ranking for its product and service quality This honor is awarded to airlines which
deliver a good quality performance
Skytrax also disclosed that for short travels or domestic routes two traveling
classes are business class and economy class The overall evaluation of the domestic
route showed that TGrsquos business class was rated excellent (5-star) in two articles which
are ldquowashroom cleanlinessrdquo and ldquonewspaper amp magazinerdquo in terms of ldquoonboard productrdquo
category Meanwhile TG also got the highest rank in terms of ldquoservice efficiencyrdquo and
ldquoresponding to requestsrdquo in ldquocabin staff servicerdquo categories In addition in the economy
class TG could do superbly in three articles of cabin staff service which were ldquoservice
efficiencyrdquo ldquoenthusiasm and attituderdquo and ldquofriendliness and hospitalityrdquo (ldquoTHAI
AIRWAYS INTL Official 4-Star Ranking of Product and Service Qualityrdquo 2009)
In conclusion TG has been recognized internationally however it still needs to
move ahead The quality ranking is useful for TG to realize that the company needs to
develop its products and services in all categories in order to step up and well-prepared
for competitions in the future
24 SERVQUAL Model
SERVQUAL is an instrument used for measuring how customers perceive the
quality of the service This instrument is based on five dimensions and on a comparison
between customersrsquo expectations of how the service should be performed and their
experiences of how the service is actually performed Usually 20 attributes are used to
describe the five dimensions and participants are asked to state what they expect from the
15
service and how they perceive the service on a five-point scale from ldquoexcellentrdquo to
ldquopoorrdquo Based on the difference between expectations and experiences over the 20
attributes an overall quality score can be calculated The higher the score shows that
experiences are below expectation the lower the perceived quality (Parasuraman amp
Berry 1991)
SERVQUAL consists of five dimensions (RATER) as follows (Parasuraman et
al 1985)
Reliability This means that a service firm provides its customers with accurate
service the first time without making any mistakes and delivers what it has promised to
do by the time that has been committed
Assurance This means that employeesrsquo behaviors give customers confidence in
the firm and that the firm makes customers feel safe It also means that the employees are
always courteous and have the necessary knowledge to respond to customers questions
Tangibles This dimension relates to the appeal of facilities equipment and
materials used by a service firm as well as to the appearance of service employees
Empathy This means that the firm understands the customersrsquo problems and
performs in their best interests as well as giving customers individual personal attention
and having convenient operating hours
Responsiveness This means that employees of a service firm are willing to help
customers and respond to their requests as well as to inform customers when service will
be provided and give prompt service
16
Application of SERVQUAL Model in Hospitality Business
The SERVQUAL instrument has been used to assess the quality of a wide range
of services in the United States such as financial service operations telephone services
repair and maintenance services (Parasuraman et al 1988) and other professional
services (Bojanic 1991) Fick and Ritchie (1991) have employed the SERVQUAL
instrument to compare services provided by various types of organizations within the
travel and tourism industry Oberoi and Hales (1990) have examined the SERVQUAL
approach as a basis for measuring the quality of the conference hotel products Many
researchers of other service businesses believed that ldquoSERVQUALrdquo is a concise multiple-
item scale with good reliability and validity (Buttle 1996 Lages amp Fernandes 2005)
In Thailand Boontaganon (2002) studied the service quality of fast food
restaurants in Bangkok by using SERVQUAL The study examined the differences in
service quality expectations and perceptions based on demographic characteristics
including gender age occupation education and income level 360 questionnaires were
distributed to people who had just exited from fast food outlets in Bangkok The results
showed significant differences in service quality of customer expectations and
perceptions which indicated the unacceptable service quality delivered by fast food
restaurants in Bangkok
Suthirungkul (2003) studied the customer expectations and perceptions of service
quality of the Clark Hatch Fitness Center at Silom Road Branch Bangkok The objectives
of the study were to identify the SERVQUAL dimensions that customers both local and
foreign used to evaluate The Clark Hatch Fitness Center to study the customer
expectations towards the services quality that should be provided and to evaluate the
perceptions of service quality that customers obtained after using service The
questionnaire was used as a tool for collecting the data 277 Thai and foreign members of
17
the Clark Hatch Fitness Center at Silom Road Branch were the research participants The
results of the study were that there existed gaps between expectations and perceptions in
terms of the five SERVQUAL dimensions and the demographic characteristics had
influenced the gap scores
In short SERVQUAL is an effective measuring tool This tool has widely been
used in many previous studies in hospitality business both domestically and
internationally
25 Demographic Variables
In general business sector market segmentation is often based on demographic
profiles (Reid amp Bojanic 2001) in order that marketers can choose the proper service
segmentation strategies to satisfy different target market segments Demographics are the
variables about consumersrsquo wants preferences and usage rates are often associated with
demographic variables Moreover the demographic variables are easier to measure
(Kotler 2000) Important demographics are as follows
1 Gender There is no logical reason to expect biology to account for this
difference between the sexes The explanation may be in socialization differences and
personality disposition Feminine gender identity is characterized by traits such as
expensiveness and emotionalism and other orientation while masculine gender identity is
characterized by independence activity and self orientation (Kotler amp Scheff 1997)
2 Age Consumersrsquo wants and abilities change with age People buy different
goods and services over their lifetime Peoplersquos tastes in different products and services
are also related to age (Kotler 2000)
18
3 Occupation This variable reflects values attitudes taste and lifestyle
Occupation and income tended to be closely correlation on almost cause-and-effect
relationship (Schiffman amp Kanuk 1994)
4 Income Consumers form a purchase intention based on such factors and
expected family income price and expected benefits from the product and services
(Kotler 1997)
5 Purpose of Travel The purpose of travel measure the frequent distribution
The purposes of travel are for such as business holiday visiting friends and relative and
others (ldquoTravel Planningrdquo 2010)
6 Frequency of Travel A critical factor in predicting the demand for tourism
within a certain period of time is the number of trips individuals take New touristsrsquo
behavior shows a tendency toward more frequent travel (Alegre amp Pou 2006)
To recap the demographic profiles play a significant role in planning service to
meet passengersrsquo satisfaction In airline business six features of the demographics were
included in this study
26 Previous Studies on Airline Passengersrsquo Satisfaction
In an airline business the major revenue of a company comes from the number of
passengers rather than a total sum of cargo service aircraft maintenance or catering
supply all together Studies on airline passengersrsquo satisfaction are numerous as the
following examples
Gilbert and Wong (2003) identified the service dimensions that matter most to
current airline passengers The study measured and compared differences in passengersrsquo
expectations of the desired airline service quality in terms of reliability assurance
19
facilities employees flight patterns customization and responsiveness The primary data
were collected from passengers departing from Hong Kong airport Regarding the
service dimension expectations it was found that there were no statistically significant
differences between passengers who made their own airline choice (decision makers) and
those who did not (non-decision makers) However there were significant differences
among passengers of different ethnic groups nationalities as well as among passengers
who traveled for different purposes such as business holiday and visiting friends or
relatives
The findings also indicated that passengers consistently ranked lsquoassurancersquo as the
most important service dimension It showed that the passengers were concerned about
the safety and security aspects and this also indicated why there had been such a
downturn in demand as this study was conducted just prior to the World Trade Center
incident on September11 2001
In Thailand Somwang (2008) assessed the passengersrsquo views of service quality in
Thai low cost airlines The research was based on the principle that passengers evaluated
airline service quality through a comparison between their experiences and expectations
over a number of quality attributes The study evaluated passengersrsquo perceived service
quality of Thai low cost carriers based on the SERVQUAL instrument The findings
indicated that the passengersrsquo expectations on service quality were higher than what they
had actually experienced Further analysis showed that female passengers had lower
perceived service quality than male passengers The findings also revealed that higher
monthly income had greater differences with respect to expectations and perceptions than
lower income respondents Furthermore passengers usually traveled with low cost
carriers for three main purposes which were for leisure visiting friends or relatives and
business
20
In brief the previous studies explored the satisfaction of airline passengers by
using SERVQUAL instrument to measure the service quality The results above found
out the differences between customersrsquo expectations and perceptions The findings of a
study in Hong Kong revealed the passengersrsquo satisfaction on the dimensions of the
service quality Meanwhile a study in Thailand implied some findings about the
demographic profiles resulting in service quality Studies on service quality help improve
business organizations retain customers and attract new customers
CHAPTER THREE
METHODOLOGY
This chapter consists of four sections participants of the study research
instrument procedures of the study and data analysis
31 Participants of the Study
One hundred and fifty Thai passengers 75 males and 75 females who took the
TG Bangkok - Chiangmai route were randomly chosen as participants for the study
Since there are about 150 passenger seats in each flight the researcher randomly acquired
a sample size of 10 percent of the overall passengers from the ten flights totaling 150
Thai people are the main group of passengers who travel domestically over the year The
researcher therefore decided to select only the Thai passengers as the participants for the
study Also so as to cover various types of passengers the researcher included flights of
different time within a day (as shown in a following part of this chapter) for a reason that
passengers with some specific purposes chose to travel at some specific time For
example business people might prefer an early morning flight rather than a later-in-the-
day one
TGrsquos Bangkok ndash Chiangmai route has been considered one of the most frequent
domestic routes (THAI 2009) TG operates ten flights daily from Bangkok to
Chiangmai The researcher consequently chose this route for this research work to
assess the passengersrsquo satisfaction with TGrsquos service quality
The study was conducted in early March when it was still in the high season for
travels to the northern province of Thailand Fifteen passengers from each of the ten
flights of the Bangkok - Chiangmai route were asked to fill out the questionnaire at the
22
end of the on-board service while the plane was approaching Chiangmai its destination
All the 150 completed questionnaires were obtained as planned
32 Research Instrument
A questionnaire in Thai was used for data collection The questionnaire was
divided into three parts The first part was about the respondentsrsquo demographic profile
since consumersrsquo needs preferences and personalization are often associated with
demographic factors (Kotler 2000) Six demographic characteristics related to in-flight
service (Cheosakul 2004) consisting of gender age occupation monthly income
purpose of travel and travel frequency with THAI were demographic issues of the survey
The second part comprised questions about passengersrsquo satisfaction with the service
during the flight This part of the questionnaire was based on the SERVQUAL
instrument for measuring customersrsquo satisfaction in five dimensions of service reliability
assurance tangibles empathy and responsiveness (Parasuraman et al 1985) The last
part comprised a question and a blank space provided for suggestions on TGrsquos service
quality
33 Procedures of the Study
The questionnaire was initially approved by the researcherrsquos masterrsquos project
advisor and two specialists a TG in-flight service manager and a SWU lecturer Then a
pilot study was conducted to ten passengers to check for content reliability the
appropriateness of the number of questions and language used in the questionnaire As
the researcher included all the ten flights of TGrsquos Bangkok - Chiangmai route in the
study the tried-out questionnaire was randomly distributed to ten TG passengers (5 males
and 5 females) on each flight of the aforementioned route on the same day in February
23
2010 Also since this study was about onboard service the questionnaire was distributed
to the participants after the in-flight service was completed and before the plane landed
After that the questionnaire was adjusted and prepared for the actual survey
The revised questionnaire was eventually distributed to 150 participants in ten
consecutive days in early March 2010 Fifteen passengers in each Bangkok -
Chiangmai flight per day were randomly asked to fill out the questionnaire after the
completion of in-flight service
The plan below showed the ten flights of for the survey each flight for a day to
make sure that the data gained were reliable
BKK-CNX Flight (TG) Flight Schedule (Departure-Arrival)
TG100 0615-0725
TG102 0750-0910
TG104 0910-1030
TG106 1020-1140
TG110 1250-1400
TG112 1400-1510
TG114 1540-1650
TG116 1715-1825
TG120 1900-2010
TG122 2130-2240
34 Data Analysis
The data acquired from the questionnaires were analyzed in three sections
demographic profile of passengers level of passengersrsquo satisfaction with TGrsquos service
and the relationship between demographic profile and passengersrsquo satisfaction based on
24
Likert scale The 5-point Likert scales were used to rate the level of satisfaction as shown
in Table 1 below
Table 1 Intervals of Satisfaction Level (Poonlarbtawee 1987)
The interpretation of the scales in this study is as follows
Rating
Scale
Level of
Agreement Disagreement
Satisfaction
Level
Mean Score
5 Strongly agree Excellent 451-500
4 Agree Good 351-450
3 Uncertain Average 251-350
2 Disagree Fair 151-250
1 Strongly disagree Poor 100-150
The researcher picked up lsquothe high grouprsquo and lsquothe low grouprsquo of each
SERVQUAL dimension to present the relationship between the participantsrsquo
demographic profile and their satisfaction As the data gained from the highest number of
the participants or the high group was the major point that the researcher relied on focus
was on the majority opinion At the same time the data gathered from the lowest number
of the participants or the low group should not be overlooked because each and all
passengers are important for TG and in the high competitive airline market it is necessary
to retain each and every passenger so as to grow far in the aviation business
The results were presented in terms of percentages and mean scores in the form of
tables and a bar chart These fundamental statistic methods were proper in this study
25
because percentages and mean scores are considered the basic statistics used for data
analysis and presentation Also the general public can easily understand the
interpretation of the data Another reason was that the sample group of this study
comprised only 150 TG passengers The researcher therefore decided to apply the
aforementioned statistics in this research Discussion of the results was also offered
CHAPTER FOUR
FINDINGS
This chapter describes the findings of the study consisting of the demographic
data of the participants level of their satisfaction with TGrsquos service quality relationship
between the demographic data and five dimensions of SERVQUAL instrument and the
uncovers to the last question on the questionnaire including suggestion
41 Demographic Data
The demographic data of TGrsquos research participants in terms of age occupation
monthly income purpose of travel and frequency of travel are presented in Tables 2- 6
below
Table 2 Participantsrsquo Age
Age No of Participants Percentage ()
Under 20 years
21-40 years
41-60 years
Above 60 years
8
85
45
12
53
567
300
80
Total 150 100
Regarding the age group the highest number of the passengers was 20-40 years
old or 567 30 of them were 46-60 years old and 8 were above 60 years old Only
53 were under 20 years old
27
Table 3 Participantsrsquo Occupation
Occupation No of Participants Percentage ()
Government official State enterprise employee
Business employee
Business owner
Student
Retiree
Others
22
63
37
13
9
6
147
420
247
86
60
40
Total 150 100
In terms of occupation the highest number of the participants was business
employees (42) followed by business owners (247) government officials or state
enterprise employees (147) students (86) retirees (6) and other occupations (4)
respectively
Table 4 Monthly Income
Monthly income (baht) No of Participants Percentage ()
Up to 20000
20001- 40000
40001 - 60000
60001 and above
58
72
11
9
386
480
74
60
Total 150 100
For the income the highest number of the participants earned 20001-40000 baht
monthly (48) followed by those with a monthly income of up to 20000 baht (386)
28
of 40001-60000 baht monthly (64) and of 60001 baht and above monthly was the
lowest (6)
Table 5 Purpose of Travel
Purpose of travel No of Participants Percentage ()
Business trips
Holidays
Visits
Others
41
79
27
3
273
527
180
20
Total 150 100
Regarding the purpose of travel the highest number of the passengers traveled via
TG on holidays (527) followed by those who traveled on business trips (273)
Meanwhile those who made a visit were at 180 and who traveled with other purposes
were at 2
Table 6 Frequency of Travel
Frequency in traveling with THAI
(during the last 12 months)
No of Participants Percentage ()
First time
2-3 times
4-10 times
More than 10 times
39
99
10
2
260
660
67
13
Total 150 100
29
The last demographic data derive from the frequency in traveling with THAI
66 of the participants indicated that they traveled 2-3 times during the last 12 months
26 traveled for the first time while 67 for 4-10 times and 13 for more than 10
times during the last 12 months
In conclusion the demographic data shown in the tables above indicated that lsquothe
high grouprsquo comprised the following characteristics The age group of the majority
number of the participants ranged from 21-40 years (567) Most of them were business
employees (42) The highest number of the passengersrsquo monthly income was around
20000 ndash 40000 baht per month (48) The majority of the passengers traveled on
holidays (527) by TG 2-3 times in the past 12 months (66)
Meanwhile lsquothe low grouprsquo was found having the following characteristics The
lowest number of the research participants was under 20 years old or 53 Only 47 of
the participants had other kinds of occupation which were not indicated on the
questionnaire while only 6 of the participants earned 60001 baht or above monthly
2 of the participants traveled on other purposes besides those shown on the
questionnaire Lastly 13 of the passengers were those who traveled by TG more than
10 times in the past 12 months
42 Level of Passengersrsquo Satisfaction
Figure 1 below is the conclusion from the second part of the questionnaire The
150 participants were asked to rate the level of service quality that they perceived from
the TGrsquos domestic flights on Bangkok - Chiangmai route The questionnaire was divided
into five dimensions of SERVQUALrsquos (Parasuraman et al 1985) service quality which
comprised reliability assurance tangibles empathy and responsiveness The scales 1 to 5
ranged from lsquostrongly disagreersquo to lsquostrongly agreersquo
30
0
5
Reliability Assurance Tangibles Empathy Responsiveness
280
345 334307
269
SERVQUAL Dimension
Figure 1 Overall Level of Participants Satisfaction
Mean scores
Figure 1 shows the average mean score of all 150 passengersrsquo satisfaction on five
dimensions of service quality ranging from the mean scores of 345 to 269 The results
revealed that the most important service quality dimension for the whole samples group
of passengers was assurance ( 345) followed by tangibles ( 334) empathy ( 307)
reliability ( 28) and responsiveness ( 269) respectively The overall average mean
was 307
43 Passengersrsquo Satisfaction Level in Relationship with Their Demographic Data
This section shows the relationship between the demographic data (age
occupation monthly income purpose of travel and travel frequency) of the participants
and their satisfaction with the service quality of TGrsquos in-flight service
The researcher focused on each category of demographic characteristics of two
major groups a group with the highest score and the other with the lowest score In fact
the most important data were the majority opinion of the sample group In other words
for this study it was lsquothe high grouprsquo However the researcher as a TG cabin crew gave
importance to the low group as well since each and every passenger is significant to TG
x
x x x
x x
31
business particularly in the high competitive market of airline business The researcher
was interested to know what the passengers in the lsquolow grouprsquo thought about the in-flight
service and what their feedback was
The following tables (Tables 7-11) illustrate the relationship between each
dimension of the demographic data and the SERVQUAL service assessment tool and the
following symbols are applied in the tables below
lsquoNrsquo means the number of the participants
lsquo rsquo means the mean score
lsquoThe high grouprsquo means the group that comprises the highest number of participants
lsquoThe low grouprsquo means the group that comprises the lowest number of participants
Table 7 Relationship between the Participantsrsquo Age and their Satisfaction with In-flight
Service
SERVQUALrsquoS
RATER
Average
Mean Score
of All Groups
The High Group
(Age 20-40 Yrs Old)
N = 85567
The Low Group
(Age Under 20 Yrs Old)
N = 853
Mean Score of Each Group
Reliability 280 278 270
Assurance 345 378 335
Tangibles 334 331 328
Empathy 307 309 314
Responsiveness 269 267 290
Table 7 reveals the connection between the participantsrsquo age and the five
dimensions of the SERVQUAL instrument The high group had higher mean scores for
x
32
three dimensions than the low group In other words the participants with an age range
of 20-40 years were more satisfied with TGrsquos service quality in terms of reliability
assurance tangibles than those who were under 20 years old Meanwhile the low group
had higher mean scores for two dimensions than the high group This means the
participants who were lower than 20 years old were more satisfied with the in-flight
service in terms of empathy and responsiveness than those whose ages ranged from 20-40
years
Interestingly it was found that both groups have a lower mean score for the
reliability dimension ( 278 and 270) than the average mean score of all the age groups
in this study ( 28)
Table 8 Relationship between the Participantsrsquo Occupation and their Satisfaction with In-
flight Service
SERVQUALrsquoS
RATER
Average
Mean Score
of All Groups
The High Group
(Business Employee)
N = 63420
The Low Group
(Others)
N = 640
Mean Score of Each Group
Reliability 280 275 284
Assurance 345 347 348
Tangibles 334 331 336
Empathy 307 310 305
Responsiveness 269 264 277
Table 8 illustrates the connection between the participantsrsquo occupations and the
five dimensions of the SERVQUAL instrument The low group had higher mean scores
x
x
33
for almost all the dimensions of SERVQUALrsquos RATER than the high group except for
one dimension In other words the participants who worked as business employees were
less satisfied with TGrsquos service quality in terms of reliability assurance tangibles and
responsiveness than those whose occupations were not specified in the questionnaire
Empathy was the only dimension of service quality that the participants who were in the
high group were satisfied with
Table 9 Relationship between the Participantsrsquo Income and their Satisfaction with In-
flight Service
SERVQUALrsquoS
RATER
Average
Mean Score
of All Groups
The High Group
(20001-40000)
N = 72480
The Low Group
(60001 and above)
N = 960
Mean Score of Each Group
Reliability 280 273 285
Assurance 345 349 350
Tangibles 334 332 321
Empathy 307 301 325
Responsiveness 269 262 273
Table 9 indicates the connection between the participantsrsquo monthly income and
the five dimensions of the SERVQUAL instrument The low group had higher mean
scores for almost all the dimensions of RATER than the high group except for one
dimension In other words the participants who earned monthly income of 20001 ndash
40000 baht were less satisfied with TGrsquos service quality in terms of reliability assurance
empathy and responsiveness than those who earned monthly income of 60001 baht and
34
above The tangibles dimension was the only service quality issue that the participants
who were in the high group were satisfied with
Table 10 Relationship between the Participantsrsquo Purpose of Travel and their Satisfaction
with In-flight Service
SERVQUALrsquoS
RATER
Average
Mean Score
of All Groups
The High Group
(Holidays)
N = 79527
The Low Group
(Others)
N = 320
Mean Score of Each Group
Reliability 280 279 285
Assurance 345 353 349
Tangibles 334 335 338
Empathy 307 308 312
Responsiveness 269 270 275
Table 10 reflects the connection between the participantsrsquo purpose of travel and
the five dimensions of the SERVQUAL instrument The low group had higher mean
scores for almost all the dimensions than the high group except for one dimension In
other words the participants who traveled on holidays were less satisfied with TGrsquos
service quality in terms of reliability tangibles empathy and responsiveness than those
whose purpose of travel were not specified in the questionnaire Assurance was the only
dimension of service quality that the participants who were in the high group were
satisfied with
35
Interestingly it was found that both groups has a higher satisfaction level for the
assurance tangibles empathy and responsiveness dimensions than the average mean
scores of the whole sample group
Table 11 Relationship between the Participantsrsquo Frequency of Travel with THAI and their
Satisfaction with In-flight Service
SERVQUALrsquoS
RATER
Average Mean
Score of All
Groups
The High
Group
(2-3 timesyear)
N = 99660
The Low Group
(more than 10
timesyear)
N = 213
Mean Score of Each Group
Reliability 280 281 295
Assurance 345 346 360
Tangibles 334 335 343
Empathy 307 308 321
Responsiveness 269 270 292
Table 11 presents the connection between the participantsrsquo frequency of travel
with THAI and the five dimensions of the SERVQUAL instrument The low group had
higher mean scores for all the dimensions of RATER than the high group In other
words the participants who traveled 2-3 times in the last 12 months were less satisfied
with TGrsquos service quality in terms of reliability assurance tangibles empathy and
responsiveness than those whose frequency of travel were more than 10 times in the last
12 months
36
Interestingly it was found that both groups has a higher satisfaction level for all
the five RATER dimensions than the average mean scores of the whole sample group in
this study
44 Other Comments
The last part of the questionnaire was designed to ask whether the participants
would continue using TGrsquos service The findings disclosed that 142 participants or
946 indicated that they would while 8 of them or 54 declined
Also at the end of the questionnaire there was a blank space for the participants to
freely express their own ideas and suggestions on TGrsquos service However only 7
participants or 46 gave suggestions regarding the in-flight service Four of the
participants were dissatisfied with the flavor of the snacks provided on board One
complained that it was not cool enough in the cabin while one was upset for not being
granted for a request for a blanket The last one commented that the passengerrsquos seat was
not comfortable
In summary the passengersrsquo satisfaction level of the service quality in connection
with their demographic data was introduced Five out of the six demographic
characteristics the participantsrsquo age occupation monthly income purpose of travel and
frequency of travel were analyzed in connection with the five dimensions of SERVQUAL
instrument reliability assurance tangibles empathy and responsiveness It was observed
that there were some connection between these two matters in various ways as earlier
discussed Lastly it was found that one hundred and forty-two participants would
continue using TGrsquos service while the rest refused Only seven of all the participants or
46 gave some comments on the open-ended suggestion part
CHAPTER FIVE
CONCLUSION AND DISCUSSION
This chapter presents the conclusion discussion limitations of the study and
recommendations for further studies
51 Conclusion
This research aimed to examine the service quality provided by Thai Airways
International on its domestic flights One hundred and fifty passengers who traveled by
TG on the Bangkok - Chiang Mai route were the research participants The SERVQUAL
instrument was used as an instrument for data collection in the survey This instrument
was based on five determinants proposed by Panasuraman etal (1985) in terms of
reliability assurance tangibles empathy and responsiveness This research was also
conducted on the demographic characteristics comprising gender age occupation
monthly income purpose of travel and frequency in traveling and the relationship of these
characteristics except the gender with the passengersrsquo satisfaction with TGrsquos in-flight
service quality The questionnaires were distributed in early March 2010
The results showed that all the participantsrsquo satisfaction based on the five
dimensions was at the average level The highest level of passengersrsquo satisfaction was
placed on the assurance dimension followed by tangibles and empathy dimensions
accordingly The two lowest levels of the passengersrsquo satisfaction were placed on the
responsiveness and reliability dimensions
In addition a summary of the demographic characteristics showed that the high
group or the group with the highest number of participants was business employees The
highest number of the participants was between 21-40 years old The highest number of
38
the participantsrsquo income ranged from 20000 ndash 40000 baht monthly Also the high
grouprsquos purpose of travel was to go on holiday Lastly the highest number of the
participants traveled via TG only 2-3 times during the past 12 months
Meanwhile the low group or the group with the lowest number of participants
was passengers with other kinds of occupations which were not specified on the
questionnaire The low group of the participants was under 20 years old The low group
of the participantsrsquo income ranged from 60001 baht monthly or higher Also the low
group revealed that they traveled via TG for other purposes which were not indicated on
the questionnaire Lastly the passengers who traveled via TG more than 10 times during
the past 12 months belonged in the low group
It has also been discovered that as a whole both groups the high and low groups
were in the same direction in their satisfaction with the five dimensions of service quality
The two groups were satisfied with the service quality dimensions in terms of assurance
at the highest level followed by tangibles empathy reliability and responsiveness
respectively
However when analyzing each demographic characteristic the participants who
were under 20 years old rated the responsiveness dimension higher than the reliability
dimension Also for those participants whose income was around 60001 or higher the
empathy dimension was rated higher than the tangibles Regarding the occupation
business people were satisfied with the reliability and responsiveness dimensions at a
very low level Meanwhile the participants who traveled via TG on their holidays rated
the assurance dimension at a very high level Lastly frequent fliers who traveled by
THAI more than 10 times were most satisfied with TGrsquos service since they rated all
RATER aspects highly
39
52 Discussion
The findings have revealed the answers to the research questions First the
demographic data of the participants gender age occupation monthly income purpose
of travel and frequency of travel were shown Second the level of the passengersrsquo
satisfaction toward the service quality on Thai Airways Internationalrsquos domestic flights in
terms of the SERVQUAL instrument (Parasuraman et al 1985) reliability assurance
tangibles empathy and responsiveness was disclosed Also the results about the
relationship between the passengersrsquo satisfaction and their demographic data were pointed
out
The results of the survey indicated that out of the five dimensions assurance was
rated at the highest level ( 345) followed by tangibles ( 334) and empathy ( 307)
(See Figure 1) In addition passengers rated their highest satisfaction with the assurance
dimension which included cabin crewrsquos job knowledge their courtesy confidence in their
service ability and safety while traveling It may be because TG cabin crew are well-
trained prior to their actual service work on board This can also ensure passengersrsquo
safety Particularly the safety and security features have been the most concerns of
airline passengers since the 9-11 incidents in New York USA This is why most
customers rated their highest satisfaction with the assurance dimension (Carman 1990)
The findings of this study are also consistent with those of Fick and Ritchie (1991)
who studied the operation of the SERVQUAL instrument in three major tourism sectors
airlines restaurants and ski area services It was revealed that the most important
dimensions of the service were assurance and tangibles If companies were unable to
inspire trust and confidence in their customers and the tangibles are not impressive it
would be difficult for them to achieve a high level of customerrsquos satisfaction (Sachukorn
2000)
x x x
40
Responsiveness is often found as the lowest level of satisfaction among customers
in the service industry It is plausible that the staff were too busy to provide prompt and
good service (Kholthanasep 2001) In this study the results revealed that the
responsiveness dimension was rated at the lowest score ( 269) among the five
dimensions followed by the reliability ( 280) dimension It was highly possible that the
passengersrsquo dissatisfaction occurred when passengers did not receive prompt service from
TG when they needed help
Prompt service is an important factor of customersrsquo expectation Customers
generally rate the service as poor when the speed of service does not meet their
expectations (Kholthanasep 2001) Bojanic and Rosen (1994) examined the nature of the
association between service quality as perceived by consumers and its determinants by
applying SERVQUAL in a restaurant setting They found that customers rated
responsiveness as the lowest satisfaction in their studies Zeithaml et al (1990) explained
that the responsiveness dimension in the SERVQUAL was willingness to help customers
and provide prompt service As the responsiveness dimension in this research comprised
prompt service willingness on-time service and quick response therefore it will be
beneficial to TG if the company can ensure that the service provided by its cabin crew
especially the willingness to help passengers and to provide prompt service meet
passengersrsquo satisfaction
Regarding the relationship between the participantsrsquo demographic data and their
satisfaction with the service quality there are many points of interests to be discussed as
follows
Firstly regarding the relationship of the passengersrsquo satisfaction with the service
and their age those who were under 20 years old rated satisfaction with the
responsiveness dimension ( 290) higher than the reliability dimension ( 270) (See
x
x
x x
41
Table 7) It was possible that young passengers usually gave priority to the dimension of
care and service when compared with that of the service providersrsquo accurate and
dependable manner (Panittumrong 2003) In addition young customers had less
experience in a service and it was difficult to compare the current service with the past
experience consequently they were more satisfied with the service provided than senior
customers
Another point was raised about the participantsrsquo age The study revealed that the
number of the high group with the age range of 21- 40 was at 567 However that of
the second highest group of the participants with the age range of 41-60 was at 30
which was rather high This latter grouprsquos level of satisfaction on the service quality was
also close to the average mean score It was found that the average mean score of the
reliability dimension was 280 while that of the second highest group was 281 the
average mean score of the assurance dimension was 345 while that of the second highest
group was 347 the average mean score of the tangibles dimension was 334 while that of
the second highest group was 335 the average mean score of the empathy dimension and
that of the second highest group was rated at 307 equally and the average mean score of
the responsiveness was 269 while that of the second highest group was 271 In sum if
consider the two groups in terms of the participantsrsquo age one of the high group and the
other with the second high group the results confirmed that the satisfaction level of the
majority of passengers was at the above average level
Secondly regarding the relationship between the participantsrsquo satisfaction and
their occupation business employees who were found at the highest number (42) had
very low satisfaction with the service quality in terms of reliability ( 275) and
responsiveness ( 264) while the mean scores of the whole sample group for these two
dimensions were at 280 and 269 respectively (See Table 8) The findings strongly
x
x
42
correlated with that of Cheaosakul (2004) who studied the consumersrsquo perception of
airline service quality with a focus on occupations It was found that the group of
business employees had the highest score on expectations Cheaosakul (2004)rsquos study
also revealed that business employees did not frequently travel compared with people of
other occupations such as tourists It was found in this particular study that the number of
the participantsrsquo purpose of travel with TG for business trips was only at 273 (See
Table 5) while the highest number of the participants went on holiday was at 52
Cheaosakul (2004) indicated that business people therefore had high expectations than
the other group who traveled more frequently
Thirdly an even more interesting point was raised when comparing the level of
satisfaction of the passengers who were government officials or state enterprise
employees and business owners Although passengers who were government officials or
state enterprise employees came third in terms of participants they are considered
valuable customers of TG since according to the governmentrsquos policy they are required
to take only TG which is a national airline whenever they travel by air There are few
exceptions though However it is almost impossible for Thai government officials who
travel on business trip and are funded by the governmentrsquos budget to fly with other
airliners It was found from this study that government officials were less satisfied with
TG quality service in terms of reliability ( 277) and responsiveness ( 264) than the
average level of which the mean scores of the two dimensions were at 280 and 269
respectively
Another issue of discussion regarding the participantsrsquo occupation business
owners came second It was observed that business owners rated the reliability ( 282)
and responsiveness dimensions ( 270) higher than the average scores of all groups (See
Table 8) It is possible that business owners had more positive attitude with TGrsquos service
x x
x
x
43
than the other groups TG seemed popular among business owners and they were the
most important group of customers This was supported by Suriya (2005) who studied
airline market segments after the launch of the low cost airlines in Thailand Suriya
(2005) identified that merchants or business owners were the major group of customers in
the full-service airline market
Fourthly regarding the monthly income of the research participants of the low
group passengers who earned an income of around 60001 or higher rated the empathy
( 325) dimension higher than tangibles ( 321) dimension (See Table 9) This may
be because the high income passengers sensitively felt that the facilities and equipment
found on their domestic route looked quite old-fashioned due to TGrsquos cost reduction The
company saved costs after the Suvannabhumi airport was closed in the 2008 crisis The
result is similar to the findings of Wangpen and Inthornma (2007) in that high income
customers had higher expectations towards the service It was possible that they had
more tendencies to be dissatisfied with the service failures The two researchers
concluded that passengers with different incomes were satisfied with the services at
different levels because they had different attitudes expectations and abilities to pay for
the service
Fifthly as it was found from this study that the highest score for the purpose of
travel was going on holiday (527) and the participants who were tourists rated the
assurance dimension at the highest level or the mean score of 353 (See Table 10) much
higher than the mean score of the whole group which was at 345 It was rather surprising
that the highest score for the travel purpose was not for business trips It is possible to
explain that this group spent for the travel cost on their own and they might want to make
sure that they chose the best service for themselves The result is parallel with Gabbie
and OrsquoNeill (1997) who examined customer satisfaction in the hotel sector using the
x x
44
SERVQUAL tool This study showed that the holiday guests who paid for
accommodation on their own rated assurance much higher than other dimensions It is
plausible to explain that passengers traveling on their own budget must make sure that
they already chose the service that was worth the money spent
However when analyzing the satisfaction on service quality of the participants
whose purpose of travel via TG was for business it was also found that this business
participants rated the high score for the tangibles dimension at the mean score of 340
compared with the average mean score of all groups of 334 Passengers who traveled on
business included government officials and state enterprise employees were major
customers of TG It was therefore interesting to find out from this study that their
satisfaction score in terms of tangibles or the appearance of physical factors such as
equipment facilities and personnel was above the average score of all groups Although
the score was not much higher the gap was bigger than that of the other RATER
dimensions as seen from the following information the passengers who traveled on
business trip showed their satisfaction on the reliability dimension at the mean score of
281 the assurance dimension at 347 the empathy dimension at 309 and the
responsiveness dimension at 270 while the average of all groups was at 280 345 307
and 269 respectively
The last point that the researcher wanted to point out is that this study revealed
that the participants who traveled more than 10 times for the last 12 months were lowest
in number (13) However it was interesting that these frequent flyers showed the high
rate of satisfaction with TGrsquos in-flight service quality The mean scores in all dimensions
showed the high rate of satisfaction (See Table 11) It is possible that passengers who
traveled very often via TG had high loyalty The brand loyalty made passengers happy in
every feature of service This result however contrasts with Ostrowski et al (1993) who
45
investigated service quality and customer loyalty in the commercial airline industry The
study examined whether the high levels of service quality existed in the US commercial
airline industry and how service quality could potentially lead to customer loyalty The
main results indicated that the levels of perceived service quality were below potential
and that customer loyalty to airlines was low It is plausible to say that the data of the two
studies were different The data collected on two air carriers in USA might have
different characteristics from the demographic information of Thai people and the number
of the participants in the two studies might differ However TG still needs to listen to the
voice of all passengers especially the frequent flyers Even if the number of this sample
group was few every customer is valuable for any firm Also it would be valuable to
implement a relevant strategy to expand this group of passengers since they had a positive
attitude for TG
Interestingly the findings from the last part of the questionnaire also showed that
the majority of the participants (946) showed their willingness to use TGrsquos service in
the future It can plausibly be explained that the participants were satisfied with TGrsquo
service quality at the moderate level ( 307) Their satisfaction with the five dimensions
of SERVQUAL was also moderate They might think that TG is a reliable airline that
they can depend on Thai passengers have confidence and trust in the service of Thai
cabin crew in terms of courtesy Also it is possible that they might not trust the low cost
airlinesrsquo service of the crew
There were only seven remarks on the in-flight service when the participants were
asked to freely give suggestions The tangible dimension problematic Passengers
pointed out about the small size of passengersrsquo seats and the quality of the air-
conditioning system One problem was on the responsiveness dimension which happened
when a passenger asked for a blanket but she was not offered indicating that some of the
x
46
cabin crewrsquos promptness to provide service was still not up to a standard Another
comment was on the flavor of the snacks Although this issue is not directly relevant to
the service it is worthwhile for TG to consider this problem
In conclusion the researcher found both strengths and weaknesses in TGrsquos service
quality Assurance was found the highest satisfaction in the participantsrsquo opinion TG
should maintain the service quality with a focus on this dimension On the other hand
the responsiveness and reliability dimensions were at the lowest satisfaction level among
the five dimensions The company should improve its service quality on these two
dimensions especially with regards to TGrsquos lsquoprompt servicersquo and lsquoproblem solvingrsquo
service to retain its passengers
53 Limitations of the study
This study has some limitations as follows
1 This study was limited to only one domestic route (Bangkok ndash Chiangmai)
Therefore the participants in this study were passengers who traveled only between these
two provinces The results of the study might differ if the study covered another route or
many more routes at the same time Consequently further studies can be conducted for
other domestic destinations such as Phuket and other big cities
2 The research participants were all Thai passengers It would be interesting to
study foreign passengersrsquo satisfaction on TGrsquos in-flight service quality
3 This study focused only on Parasuraman et al (1985)rsquos SERVQUAL
Instrument used to assess the service quality The results might differ if other instruments
were used
47
54 Recommendations for further studies
Further research should be undertaken to validate the results of this study The
researcher has found several opportunities to extend this study as follows
Survey on the lsquoresponsivenessrsquo dimensions
Responsiveness concerns the willingness or readiness of employees to provide
service such as timelines of service and prompt service This dimension was what the
passengers in this study were most concerned about because it was rated as the lowest
level of satisfaction Thus TG should find the countermeasure of how to increase the
level of passengersrsquo satisfaction in the responsiveness dimension
Assessment of the ground service quality
Since this research was conducted on on-board service quality further studies on
ground services such as a reservation or check-in service should be investigated in order
to integrate the results covering every sector of the airline service
Study on passengersrsquo attitude towards the service quality in other airlines
A study on the service quality of other airlines should be conducted in order to
obtain comparative data and find out reasons for their passengersrsquo behavior and attitude
consequently allowing TG to remedy any weak points and increase the number of new
passengers
REFERENCES
REFERENCES
Alegre J amp Pou L (2006) An analysis of the microeconomic determinants of travel
frequency Department of Applied Economics Universitat de les Illes Balears
Bojanic DC (1991) Quality measurement in professional service firms Journal of
Professional Service Marketing 7(2) 27-37
Bojanic D C amp Rosen L D (1994) Measuring service quality in restaurants An
application of the SERVQUAL model Journal of Hospitality Research 18(1)
3-14
Boontaganon W (2002) The study of service quality of fast-food restaurants in Bangkok
using SERVQUAL measurement Thesis MBA (Business Administration)
Bangkok Assumption University Photocopied
Buttle F (1996) SERVQUAL review critique research agenda European Journal of
Marketing 30(1) 8-31
CarmanJ M (1990) Consumer perceptions of service quality An assessment of the
SERVQUAL dimensions Journal of Retailing 69 33-35
Cheaosakul W (2004) Consumers perception of service quality a case study of Thai
Airways International Plc Thesis MBA Bangkok Assumption University
Photocopied
Fick RG amp Ritchie JRB (1991) Measuring service quality in the travel and tourism
industry Journal of Travel Research 30(2) 2-9
Fornell C (1992) A national customer satisfaction barometer the Swedish experience
Journal of Marketing 56 6-21
Gabbie O amp OrsquoNeill M (1997) SERVQUAL and the Northern Ireland hotel sector a
comparative analysis part 2 Managing Service Quality 17(1) 43-49
50
Gilbert DH (1999) Marketing connecting with customers (2nd
ed) Upper Saddle
River NJ Prentice Hall
Gilbert D amp Wong KCR (2002) Passenger expectations and airline services a
Hong Kong based study Surrey Management School Surrey University of
Surrey
Gitman LJ amp Carl DM (2005) The future of business the essentials Mason Ohio
South-Western College Pub
Grifin J (1995) Customer loyalty NY Lexington Book
Gronroos C (1978) A service-oriented approach to marketing of services European
Journal of Marketing 12(8) 588-601
Hennig-Thurau T amp Klee A (1997) The impact of customer satisfaction and
relationship quality on customer retention a critical reassessment and model
development Masterrsquos Project MA (Psychology amp Marketing) Hanover
University of Hanover
Heesawat C (2005) The opportunities and problems in making services more tangible
PhD Dissertation Bangkok Assumption University Photocopied
Juran JM amp Gryna FM (1974) Quality control handbook NY McGraw-Hill
Kholthanasep G (2001) A study of customerrsquos expectations and perceptions of service
quality delivery by first class hotels in Bangkok metropolitan area Thesis
MBA Bangkok Assumption University Photocopied
Kotler P amp Scheff J (1997) Standing room only strategies for marketing the
performing arts Boston Mass Harvard Business School Press
Kotler P (1997) Marketing management analysis planning and control (9th
ed) Upper
Saddle River NJ Prentice Hall
51
Kotler P Bowen J amp Makens J (1999) Marketing for hospitality and tourism (2nd
ed) NJ Prentice Hall
Kotler P (2000) Marketing management the millennium edition (10th
ed) NJ Prentice
Hall
Lages FL amp Fernandes CJ (2005) The SERVQUAL scale a multi-item instrument
for measuring service personal values Journal of Business Research 58(11)
1562-1572
Oberoi U amp Hales C (1990) Assessing the quality of the conference hotel product
London The Service Industries Journal 10(4) 700-722
Ostrowski PL Orsquobrien TV amp Gordon GL (1993) Service quality and customer
loyalty in the commercial airline industry Journal of Travel Research 32(2)
16-24
Palin M (1996) Flight catering transportation and loading (2nd
ed) London Longman
Group Limited
Panittumrong P (2004) The consumerrsquos opinion towards Clark Hatch Fitness Center
Master Project MBA (Management) Bangkok Graduate School
Srinakharinwirot University Photocopied
Parasuraman A Zeitmal VA amp Berry LL (1985) A concept model of service
quality and its implications for future research Journal of Marketing 49 41-50
Parasuraman A Zeitmal VA amp Berry LL (1988) SERVQUAL a multiple item
scale for measuring customer perceptions of service quality Journal of
Retailing 64(1) 64
Parasuraman A amp Berry LL (1991) Marketing services competing through quality
NY The Free Press
52
Pirsig RM (1987) Zen and the art of motorcycle maintenance an inquiry into values
(Mass Market Paperback) NY Bantam Books
Poonlarbtawee K (1987) Statistics for research Bangkok Physic Center Printing
Reid RD amp Bojanic DC (2001) Hospitality marketing management NJ John Wiley
amp Son Inc
Rueangthanakiet P (2008) Memberrsquos satisfaction of fitness service quality a case study
of California Wow Xperience Plc Masterrsquos Project MA (Business English for
International Communication) Bangkok Graduate School Srinakharinwirot
University Photocopied
Sachukorn S (2006) Reception and service excellence Bangkok Saitharn
Schiffman LG amp Kanuk LL (1994) Consumer behavior (5th
ed) London Prentice-
Hall International
Somwang C (2008) An assessment of passengersrsquo views of service quality in Thai low
cost carriers Inter Program MA (Communicative English) Bangkok
Ramkhamhaeng University Photocopied
Suriya K (2005) Airline market segments after low cost airlines in Thailand passenger
classification using neural networks and logit model with selective learning
Faculty of Economics Chiangmai Chiangmai University
Suthirungkul N (2003) The study of customer expectations and perceptions of service
quality of the Clark Hatch fitness center of Silom road branch Bangkok Thesis
MBA (Business Administration) Bangkok Assumption University
Photocopied
Thai Airways International (2008) Traffic program information (Introduction of summer
200809) Bangkok THAI Printing Office
53
Thai Airways International (2009) Traffic program information (Introduction of winter
200910) Bangkok THAI Printing Office
THAI AIRWAYS INTL Official 4-Star Ranking of Product and Service Quality (2009
October) Retrieved February 14 2010 from
httpwwwairlinequalitycomAirlinesTGhtml
Travel Planning (2010 February 12) Retrieved February 12 2010 from
httpwwwsuite101comlessoncfm1848818243
Wangpen N amp Inthornma S (2007) Membersrsquo satisfaction in fitness centers in
Bangkok Thesis MA (Hotel and Tourism Management) Bangkok Graduate
School Naresuan University Photocopied
Zeithaml VA amp Bitner MJ (2000) Services marketing (2nd
ed) NY McGraw Hill
Zeithaml VA Parasuraman A amp Berry LL (1990) Delivering quality service
balancing customer perceptions and expectations NY Free Press
APPENDICES
55
APPENDIX A
แบบทดสอบความพงพอใจของผโดยสารการบนไทย
เรยนทานผโดยสารทเคารพ กระผมนาย วลาศ มนคงวณชกล พนกงานตอนรบสายการบนไทย และนกศกษาปรญญาโท หลกสตรภาษาองกฤษธรกจเพอการสอสารนานาชาต มหาวทยาลยศรนครนทรวโรฒ ไดจดท าแบบสอบถามนเพอเปนสวนหนงของการส ารวจความพงพอใจของผโดยสารทมตอคณภาพงานบรการ เทยวบนภายในประเทศของการบนไทย โดยมงหวงทจะน าขอมลทไดรบจากการส ารวจมาเปนประโยชนตอการสงเสรมสนบสนนการปฏบตงานใหเกดประสทธผล จงขอความกรณาจากทานในการตอบแบบสอบถามทกขอตามขอเทจจรงและความเหนของทาน ขอมลทงหมดเปนความลบ จะใชเพอการวจยเทานน และขอขอบคณในความรวมมอของทาน
helliphelliphelliphelliphelliphelliphelliphelliphelliphelliphelliphelliphelliphelliphelliphelliphelliphelliphelliphelliphelliphelliphelliphelliphelliphelliphelliphelliphelliphelliphellip
ค าชแจง โปรดท าเครองหมาย (x) ลงในชองวาง ทตรงกบค าตอบของทาน
ตอนท 1 ขอมลทวไป
1 เพศ ( ) ชาย ( ) หญง 2 อาย ( ) ตากวา 20 ป ( ) 21-40 ป ( ) 41-60 ป ( ) 60 ปขนไป 3 อาชพ ( ) ขาราชการ รฐวสาหกจ ( ) พนกงานบรษท ( ) ธรกจสวนตว ( ) นกเรยน นกศกษา ( ) เกษยณ ( ) อนๆ 4 รายได เดอน ( ) ตากวา 20000 ( ) 20001- 40000 บาท ( ) 40001- 60000 บาท ( ) 60001 บาท ขนไป 5 จดประสงคการเดนทาง ( ) ธรกจ ( ) พกผอน ( ) เยยมเยยนญาตมตร เพอนฝง ( ) อนๆ 6 ความถในการเดนทางกบการบนไทย (ในรอบ 12 เดอน) ( ) ครงแรก ( ) 2-3 ครง ( ) 4-10 ครง ( ) 10 ครงขนไป
56
ตอนท 2 ความพงพอใจของทานตอการบรการ (5 = เหนดวยอยางยง 4= เหนดวย 3= ปานกลาง 2=ไมเหนดวย 1=ไมเหนดวยอยางยง)
ระดบความพงพอใจ
การบรการของการบนไทย 5 4 3 2 1 1 เมอเจาหนาทสญญาทจะใหบรการทานในเรองใด จะทาตามนนเสมอ
2 การใหบรการของเจาหนาท สรางความเชอมนใหกบทาน
3 อปกรณบนเครองบนมรปแบบททนสมย (เชน จอทว ทนง)
4 บรษทฯกาหนดเวลาการใหบรการบนเครองเหมาะสม
5 เจาหนาทใหบรการทดนบตงแตกาวแรกบนเครอง
6 เจาหนาทมความตงใจดทจะชวยเหลอทาน เมอทานมปญหา
7 ทานรสกปลอดภยเมออยบนเครองบน
8 สงอานวยความสะดวกตางๆบนเครอง มรปลกษณทดงดดใจ (เชน กลองอาหาร) 9 เจาหนาทไมเขาใจความตองการของทาน ในบางกรณ
10 เจาหนาทไมไดระบเวลาในการใหบรการผโดยสารบนเครองทแนนอน 11 เจาหนาทพยายามทางานโดยไมใหเกดขอผดพลาด
12 เจาหนาทปฎบตงานดวยความสภาพเสมอ
13 เจาหนาทแตงกายเรยบรอยและดด
14 บรษทฯใหความเอาใจใสกบผโดยสารเปนรายบคคล
15 บางครงเจาหนาทไมเตมใจทจะใหบรการผโดยสาร
16 บรษทใหบรการทานตรงเวลาทกาหนด
17 เจาหนาทสามารถใหขอมลเกยวกบการเดนทางไดอยางถกตอง
18 เอกสารของบรษทฯทเกยวของกบการบรการ (เชน แผนพบ นตยสาร) มขอมลครบถวน และรปแบบสวยงาม 19 เจาหนาทใหบรการทานดวยสมผสความเปนไทย
20 เจาหนาทใหบรการผโดยสารอยางรวดเรว
ทานจะกลบมาใชบรการของการบนไทยตอไป จะใชบรการตอไป ไมใชบรการ
ขอเสนอแนะ_______________________________________________________
_____________________________________________________________ ขอบพระคณอยางสงในความรวมมอของทาน
57
APPENDIX B
Questionnaire
Dear Honorable Passengers
My name is Wilas Mankongvanichkul -- a THAI cabin crew and masterrsquos student of business English
for international communication program Srinakharinwirot University This questionnaire is about
an exploration of passengersrsquo satisfaction with service quality of Thai Airways International (TG)rsquos
domestic flights Data gained will be utilized for THAI service operation Please kindly complete the
questionnaire The data gained will be kept confidential and used for the research study only Your
kind cooperation is greatly appreciated
helliphelliphelliphelliphelliphelliphelliphelliphelliphelliphelliphelliphelliphelliphelliphelliphelliphelliphelliphelliphelliphelliphelliphelliphelliphellip
Direction Please mark (x) your answer in the space provided
Part 1 Personal Information
1 Gender
( ) Male ( ) Female
2 Age
( ) Under 20 years ( ) 21-40 years
( ) 41-60 years ( ) Above 60 years
3 Occupation
( ) Government official State enterprise employee
( ) Business employee
( ) Business owner ( ) Student
( ) Retiree ( ) Others
4 Monthly income
( ) Up to 20000 baht ( ) 20001- 40000 baht
( ) 40001 ndash 60000 baht ( ) 60001 baht and above
5 Purpose of travel
( ) Business trips ( ) Holidays
( ) Visits ( ) Others
6 Frequency in traveling with THAI (during the last 12 months)
( ) First time ( ) 2-3 times
( ) 4-10 times ( ) More than 10 times
58 Part 2 Your satisfaction with the service
(5=Strongly Agree 4= Agree 3=Uncertain 2=Disagree 1= Strongly Disagree)
Level of Satisfaction
The Service of THAI 5 4 3 2 1
1 When cabin crew promise to do something by a
certain time they do so
2 You can trust THAI cabin crew
3 TG has modern on board equipment
(such as TV screen passengersrsquo seats)
4 TG has operating hours on board convenient to all
passengers
5 Cabin crew offer good services upon boarding
6 When passengers have a problem cabin crew show a
sincere interest in solving it
7 Passengers feel safe on-board
8 The physical facilities of TG are visually appealing
(such as meal boxes)
9 Cabin crew do not understand your special needs in
some cases
10 Cabin crew do not tell passengers exactly when
services will be offered
11 Cabin crew insist on error-free records
12 Cabin crew are consistently courteous to passengers
13 Cabin crew are well-dressed and neat in appearance
14 TG gives passengers individual attention
15 Cabin crew are not always willing to help passengers
16 TG provides its services at the time it promises to
do so
17 Cabin crew are knowledgeable to answer passengers
travel-related questions
18 Documents about service are informative and appealing
(such as pamphlets and magazines)
19 Services provided have a ldquoThai Touchrdquo
20 Cabin crew are quick to respond to passengersrsquo requests
Will you come back for TGrsquos service Yes No
Suggestions________________________________________________________________
________________________________________________________________________ Thank you very much for your kind cooperation
59
APPENDIX C
Questionnaire Specification Based on SERVQUAL measurement (Parasuraman et al 1985)
Passengers satisfaction level toward service quality factors
No Service Quality Features (RATER)
Str
on
gly
ag
ree
Ag
ree
Un
certa
in
Dis
ag
ree
Str
on
gly
Dis
ag
ree
(5) (4) (3) (2) (1)
1 When cabin crew promise to do something by a certain time they do so Reliability
2 You can trust THAI cabin crew Assurance
3 TG has modern on board equipment (such as TV screen passengersrsquo seats) Tangibles
4 TG has operating hours on board convenient to all passengers Empathy
5 Cabin crew offer good services upon boarding Responsiveness
6 When passengers have a problem cabin crew show a sincere interest in solving it
Reliability
7 Passengers feel safe on-board Assurance
8 The physical facilities of TG are visually appealing (such as meal boxes) Tangibles
9 Cabin crew do not always understand your special needs in some cases Empathy
10 Cabin crew do not tell passengers exactly when services will be offered Responsiveness
11 Cabin crew insist on error-free records Reliability
12 Cabin crew are consistently courteous to passengers Assurance
13 Cabin crew are well-dressed and neat in appearance Tangibles
14 TG gives passengers individual attention Empathy
15 Cabin crew are not always willing to help passengers Responsiveness
16 TG provides its services at the time it promises to do so Reliability
17 Cabin crew are knowledgeable to answer passengers travel-related questions Assurance
18 TGs documents associated with services are informative and appealing (such as pamphlets and magazines)
Tangibles
19 Services provided have a ldquoThai Touchrdquo Empathy
20 Cabin crew are quick to respond to passengersrsquo requests Responsiveness
VITAE
61
VITAE
Name Wilas Mankongvanichkul
Date of Birth February 14 1980
Place of Birth Bangkok
Address 688 Soi Phaholyothin 32 Chankasem Jatuchak
Bangkok 10900
Present Occupation Cabin Crew
Thai Airways International Public Company Limited
89 Vibhavadi Rangsit Road Bangkok 10110
Education Background
2010 Master of Art (Business English for International
Communication)
Srinakharinwirot University
2001 Bachelor of Business Administration Bangkok University
1997 High School Saint Dominic School
- Cover
- Abstract
- Chapter 1
- Chapter 2
- Chapter 3
- Chapter 4
- Chapter 5
- Bibliography
- Appendix
- Vitae
-

5
Customer satisfaction is a measure of how a product and service supplied by a
company meets or surpasses customer expectation It is seen as a key performance
indicator within business and is an indication of how successful the company is at
providing products andor services to the market Customer satisfaction is an abstract
concept and the actual happening of the state of satisfaction will vary from person to
person and productservice to productservice In a competitive market where businesses
compete for customers customer satisfaction is considered a key element of business
strategy (Gitman amp McDaniel 2005)
CHAPTER TWO
REVIEW OF LITERATURE
This chapter presents a review of literature and research which is related to the
study It comprises six topics the aviation industry in Thailand customer satisfaction
service quality SERVQUAL instrument demographic variables and previous related
studies
21 The Aviation Industry in Thailand
The world economic crisis and the uncertainty of Thai political situations have
directly affected customer purchasing power of all kinds of businesses including the
airline industry The Tourism Authority of Thailand (TAT) has tried to boost the
domestic travel in several ways including an offer of promotional traveling packages
This is a tactic of turning a crisis to an opportunity as well as enhancing domestic airlinesrsquo
sales
To provide a detailed picture on this topic two issues are discussed domestic
airline operators and the nature of airline business onboard services
Domestic Airline Operators
In terms of fare the domestic airlines that are currently operating in Thailand are
low-cost airlines and full-fare airlines
A low-cost airline is an airline which charges relatively lower fares To generate
more revenue from loss of decreasing margin of ticket prices the low-cost airline may
ask for extra charges for such as food priority boarding seat allocating and baggage
7
privileges etc This type of airlines includes Bangkok Airways Nok Air Orient Thai
Airlines and Air Asia
Meanwhile a full-fare airline sells tickets at full prices and traditionally offers
three travel classes namely first business and economy classes Thai Airways
International is the sole operator in Thailand who operates this type of airline service TG
is serving 10 airports domestically and providing sufficient capacity to serve local
demands During the festive season extra flights are provided in a greater number to
meet peak demands particularly those to Chiangmai and Phuket (THAI 2009)
TG flies to two destinations in the North ie Chiangmai and Chiangrai three
destinations in the Northeast ie Khonkaen Udonthani and Ubolratchathani and five
destinations in the South ie Phuket Hatyai Suratthani Krabi and Samui
To recap there are two major groups of domestic airlines in terms of airfare which
are low cost and full-fare airlines TG is the only full-fare airline operator in Thailand
The Nature of Airline Business On-board Services
The airline business has become more competitive and most airlines in
considering their competitive edge take into account the quality of service to be offered
to customers (Palin 1996) Typically a service package includes lsquotangiblesrsquo which refer
to goods provided for customers and lsquointangiblesrsquo which are those related to the quality of
service offered to the customers The in-flight service-package includes both tangibles
and intangibles The problem to be addressed is the need to ensure that all the flights are
fully stocked with the physical items in the service package together with hygienic and
functional equipment requested by cabin crew for providing service These goods fall
into four categories
1 Food items including beverages to be consumed on board
8
2 Non-food items comprising an extensive list which may include newspapers
blankets toilet bags headsets for aircraft audio-visual systems
3 Duty-free goods for passengers to purchase on the aircraft
4 Equipment required by cabin crew for providing service The service
equipment includes tea and coffee-making equipment first aid kits etc
Nevertheless the quality of a service package not only depends on food drinks
and facilities on the aircraft such as newspapers blankets toilet bags headsets etc but it
also depends on the skills and knowledge of cabin crew who serve passengers to create
positive attitudes toward the airline and to enhance the brand loyalty
In conclusion the aviation industry in Thailand is very competitive Low-cost
airlines have increasingly become more popular because of the economic crisis To
compete with those budget airlines TG needs to find ways to retain and attract
passengers
22 Customer Satisfaction
It is impossible for any business to sustain itself without customers Accordingly
factors contributing to any successful business mainly result from customer satisfaction
customer loyalty and customer retention One important factor in determining the
likelihood of success and profits of an organization is customer satisfaction Customer
satisfaction results in customer loyalty When there is customer loyalty the customer
retention rate is high and good business results tend to follow
Customer satisfaction a business term is a measure of how products and services
supplied by a company meet or surpass customersrsquo expectation In a competitive
marketplace where businesses compete for gaining more customers customer satisfaction
9
is seen as a key performance indicator within a business and has increasingly become a
key element of business strategy (Gitman amp Carl 2005)
Hennig-Thurau and Klee (1997) state that customer satisfaction with a companys
products or services is often regarded as the key to the companys success and long-term
competitiveness Customer satisfaction is also often viewed as a central determinant of
customer retention A high customer satisfaction level yields several benefits It
heightens customersrsquo loyalty and prevents customersrsquo complaints lowers customersrsquo
price sensitivity reduces the costs of failed marketing and of new customer creation
reduces operating costs due to an increase in number of customers improves the
effectiveness of advertising and enhances business reputation (Fornell 1992) However
specialists on satisfaction indicate that the main factors determining customer satisfaction
are the customersrsquo own perceptions and expectations of service quality (Zeithaml amp
Bitner 2000)
Customersrsquo expectation and perception
Customersrsquo perception of service quality depends on the degree of the service that
meets the customersrsquo expectations service providers must know how to shape those
expectations The messages from service providers contribute significantly to expectation
development because the service is mostly regarded as intangible and people cannot
readily observe for themselves what to expect It is critical that the service provider gives
information to customers as clearly and accurately as possible before the customers make
a purchase Organizations that create unrealistic expectations in an effort to sell a service
are likely to find their customersrsquo satisfaction low Those unhappy customers will tell
others and the credibility of the business will be damaged (Gilbert 1999)
10
To ensure highly perceived quality and to maintain loyal customer base service
providers need to be accurate and reasonable about what they lead customers to expect
They also need to do a good job in the areas of reliability assurance tangibles empathy
and responsiveness It is difficult for companies to get ahead of the competition and the
nature of competition in the service industry is more difficult to protect from imitation
Competitors are increasingly forced to imitate the best features of one another
Therefore any competitors who try to invest more energy and resources in building
strong service quality are most likely to be winners (Gilbert 1999)
Factors Affecting Consumers Expectation
The key factors influencing consumersrsquo view on service quality include word of
mouth personal needs customersrsquo past experience and external communication
(Parasuraman et al 1985)
Word of mouth is particularly important because when consumers are satisfied or
dissatisfied with the service they are likely to share it with their friends Service is
generally classified as intangible Customers cannot actually ldquoseerdquo the service until they
experience it Before making a purchase customers need to find out as much information
as possible so as to make a good decision Word of mouth is a means to make a
consumer feel interested or uninterested in the service
Personal needs are considered another important factor They deal with the
motives that determine the nature and strength of what a consumer expects from a
service
Meanwhile past experience refers to what consumers have learned through their
personal interaction with a service provider It is particularly important in shaping
customersrsquo expectations
11
The last factor is external communication comprising such as direct sale and
advertisement in order to communicate and position a service through messages which
can influence consumer perceptions
In summary each factor can individually or harmoniously affect consumersrsquo
purchasing decision Customer satisfaction is a key to business success In order to make
customers satisfied a company needs to understand their expectations and perception by
studying the factors that affect their purchasing decision
23 Service Quality
A search for the definition of ldquoqualityrdquo has yielded inconsistent results Quality
has been variously defined as fitness for use in the product which successfully serves the
purpose of the user during usage (Juran amp Gryna 1974) In addition Zeithaml et al
(1990) state that ldquoqualityrdquo is what exceeds the customersrsquo expectation of the service
On the other hand quality is a characteristic of thoughts and statements believed
to be taken for granted if an explanation of quality is going to be both false and true
precisely (Pirsig 1987) Pirsig also says that since definitions derive from abstract and
formal thinking quality cannot be defined it is impossible to define quality because
quality can never be considered independently but only in relation to what is perceived
Measuring Quality in Service
Parasuraman et al (1985) point out that service quality is more difficult for the
consumers to evaluate than the product quality Perception of service quality results from
a comparison of customer expectations with actual service performance Quality
evaluations are made not only from the outcome of a service but also from the ldquoprocessrdquo
12
of service delivery and the customers have fewer tangible characters to be measured
physically when purchasing services than when purchasing products (Gronroos 1978)
Service quality is the degree of how well the service level delivered matches
customer expectations Delivering quality service means that the service provider needs
to follow customer expectations on a consistent basis (Lewis amp Booms 1983)
To conclude three underlying service quality themes can be drawn from the
discussion as follows
Service quality is more difficult for the customer to evaluate than product quality
Service quality perceptions result from a comparison of consumer expectations
with actual service performance
Quality evaluations are not made solely on the outcome of a service They
involve evaluations of the process of service delivery
The Benefits of Service Quality
The benefits of service quality comprise four areas as follows (Kotler 2000)
Customers Retention High quality builds loyal customers and creates positive word of
mouth which is an important factor in purchase decision This can determine customer
satisfaction which affects repeat business If a customer is happy with an existing firm it
is difficult to convince him or her to move to another
Avoidance of Price Competition A firm with a reputation for high quality has
a much stronger competitive position than one with a reputation for poor quality Price-
cutting by a competitor will not be enough to encourage a client to switch Good quality
is more powerful to remain competitive
13
Retention of Good Employees Employees appreciate working in operations
that are well run and produce quality products They do not enjoy receiving customer
complaints Also turnover and loss of employee morale are listed as costs of poor quality
manpower When an operation has good quality it can retain good employees And at
the time business expansion is needed recruiting is easier and training cost is reduced
Reduction of Costs The quality cost includes internal costs external costs and
quality system costs Internal costs are those associated with correcting problems
discovered by the firm before products reached customers External costs are related to
errors that the customers experience They can be very expensive when the customers
decide not to return because of a service problem Then the promotional and advertising
costs or external costs are necessary to be spent to create the company image in order to
make customers come back and win brand loyalty for the company in the end However
the company needs to check the service quality through customersrsquo feedback periodically
to avoid problems
Although the quality service system does not come without costs it is usually less
than those internal and external costs resulting from poor quality service Some examples
of the costs of a quality system include customer service audits trainings management
meetings with employees and customers and introduction of a new technology (Kotler
Bowen amp Makens 1999)
To sum up it is necessary for a service company to know the service quality level
The quality needs to be evaluated by comparing customer experience with service
performance Once a service company reaches a good quality level a company will
retain its customers easily be away from price wars keep and get good employees and
reduce some operation costs
14
Thai Airways In-flight Service Quality
The latest airline evaluation in 2009 by Skytrax from United Kingdom which is a
research organization focused on in-flight services revealed that TG got the official 4-star
ranking for its product and service quality This honor is awarded to airlines which
deliver a good quality performance
Skytrax also disclosed that for short travels or domestic routes two traveling
classes are business class and economy class The overall evaluation of the domestic
route showed that TGrsquos business class was rated excellent (5-star) in two articles which
are ldquowashroom cleanlinessrdquo and ldquonewspaper amp magazinerdquo in terms of ldquoonboard productrdquo
category Meanwhile TG also got the highest rank in terms of ldquoservice efficiencyrdquo and
ldquoresponding to requestsrdquo in ldquocabin staff servicerdquo categories In addition in the economy
class TG could do superbly in three articles of cabin staff service which were ldquoservice
efficiencyrdquo ldquoenthusiasm and attituderdquo and ldquofriendliness and hospitalityrdquo (ldquoTHAI
AIRWAYS INTL Official 4-Star Ranking of Product and Service Qualityrdquo 2009)
In conclusion TG has been recognized internationally however it still needs to
move ahead The quality ranking is useful for TG to realize that the company needs to
develop its products and services in all categories in order to step up and well-prepared
for competitions in the future
24 SERVQUAL Model
SERVQUAL is an instrument used for measuring how customers perceive the
quality of the service This instrument is based on five dimensions and on a comparison
between customersrsquo expectations of how the service should be performed and their
experiences of how the service is actually performed Usually 20 attributes are used to
describe the five dimensions and participants are asked to state what they expect from the
15
service and how they perceive the service on a five-point scale from ldquoexcellentrdquo to
ldquopoorrdquo Based on the difference between expectations and experiences over the 20
attributes an overall quality score can be calculated The higher the score shows that
experiences are below expectation the lower the perceived quality (Parasuraman amp
Berry 1991)
SERVQUAL consists of five dimensions (RATER) as follows (Parasuraman et
al 1985)
Reliability This means that a service firm provides its customers with accurate
service the first time without making any mistakes and delivers what it has promised to
do by the time that has been committed
Assurance This means that employeesrsquo behaviors give customers confidence in
the firm and that the firm makes customers feel safe It also means that the employees are
always courteous and have the necessary knowledge to respond to customers questions
Tangibles This dimension relates to the appeal of facilities equipment and
materials used by a service firm as well as to the appearance of service employees
Empathy This means that the firm understands the customersrsquo problems and
performs in their best interests as well as giving customers individual personal attention
and having convenient operating hours
Responsiveness This means that employees of a service firm are willing to help
customers and respond to their requests as well as to inform customers when service will
be provided and give prompt service
16
Application of SERVQUAL Model in Hospitality Business
The SERVQUAL instrument has been used to assess the quality of a wide range
of services in the United States such as financial service operations telephone services
repair and maintenance services (Parasuraman et al 1988) and other professional
services (Bojanic 1991) Fick and Ritchie (1991) have employed the SERVQUAL
instrument to compare services provided by various types of organizations within the
travel and tourism industry Oberoi and Hales (1990) have examined the SERVQUAL
approach as a basis for measuring the quality of the conference hotel products Many
researchers of other service businesses believed that ldquoSERVQUALrdquo is a concise multiple-
item scale with good reliability and validity (Buttle 1996 Lages amp Fernandes 2005)
In Thailand Boontaganon (2002) studied the service quality of fast food
restaurants in Bangkok by using SERVQUAL The study examined the differences in
service quality expectations and perceptions based on demographic characteristics
including gender age occupation education and income level 360 questionnaires were
distributed to people who had just exited from fast food outlets in Bangkok The results
showed significant differences in service quality of customer expectations and
perceptions which indicated the unacceptable service quality delivered by fast food
restaurants in Bangkok
Suthirungkul (2003) studied the customer expectations and perceptions of service
quality of the Clark Hatch Fitness Center at Silom Road Branch Bangkok The objectives
of the study were to identify the SERVQUAL dimensions that customers both local and
foreign used to evaluate The Clark Hatch Fitness Center to study the customer
expectations towards the services quality that should be provided and to evaluate the
perceptions of service quality that customers obtained after using service The
questionnaire was used as a tool for collecting the data 277 Thai and foreign members of
17
the Clark Hatch Fitness Center at Silom Road Branch were the research participants The
results of the study were that there existed gaps between expectations and perceptions in
terms of the five SERVQUAL dimensions and the demographic characteristics had
influenced the gap scores
In short SERVQUAL is an effective measuring tool This tool has widely been
used in many previous studies in hospitality business both domestically and
internationally
25 Demographic Variables
In general business sector market segmentation is often based on demographic
profiles (Reid amp Bojanic 2001) in order that marketers can choose the proper service
segmentation strategies to satisfy different target market segments Demographics are the
variables about consumersrsquo wants preferences and usage rates are often associated with
demographic variables Moreover the demographic variables are easier to measure
(Kotler 2000) Important demographics are as follows
1 Gender There is no logical reason to expect biology to account for this
difference between the sexes The explanation may be in socialization differences and
personality disposition Feminine gender identity is characterized by traits such as
expensiveness and emotionalism and other orientation while masculine gender identity is
characterized by independence activity and self orientation (Kotler amp Scheff 1997)
2 Age Consumersrsquo wants and abilities change with age People buy different
goods and services over their lifetime Peoplersquos tastes in different products and services
are also related to age (Kotler 2000)
18
3 Occupation This variable reflects values attitudes taste and lifestyle
Occupation and income tended to be closely correlation on almost cause-and-effect
relationship (Schiffman amp Kanuk 1994)
4 Income Consumers form a purchase intention based on such factors and
expected family income price and expected benefits from the product and services
(Kotler 1997)
5 Purpose of Travel The purpose of travel measure the frequent distribution
The purposes of travel are for such as business holiday visiting friends and relative and
others (ldquoTravel Planningrdquo 2010)
6 Frequency of Travel A critical factor in predicting the demand for tourism
within a certain period of time is the number of trips individuals take New touristsrsquo
behavior shows a tendency toward more frequent travel (Alegre amp Pou 2006)
To recap the demographic profiles play a significant role in planning service to
meet passengersrsquo satisfaction In airline business six features of the demographics were
included in this study
26 Previous Studies on Airline Passengersrsquo Satisfaction
In an airline business the major revenue of a company comes from the number of
passengers rather than a total sum of cargo service aircraft maintenance or catering
supply all together Studies on airline passengersrsquo satisfaction are numerous as the
following examples
Gilbert and Wong (2003) identified the service dimensions that matter most to
current airline passengers The study measured and compared differences in passengersrsquo
expectations of the desired airline service quality in terms of reliability assurance
19
facilities employees flight patterns customization and responsiveness The primary data
were collected from passengers departing from Hong Kong airport Regarding the
service dimension expectations it was found that there were no statistically significant
differences between passengers who made their own airline choice (decision makers) and
those who did not (non-decision makers) However there were significant differences
among passengers of different ethnic groups nationalities as well as among passengers
who traveled for different purposes such as business holiday and visiting friends or
relatives
The findings also indicated that passengers consistently ranked lsquoassurancersquo as the
most important service dimension It showed that the passengers were concerned about
the safety and security aspects and this also indicated why there had been such a
downturn in demand as this study was conducted just prior to the World Trade Center
incident on September11 2001
In Thailand Somwang (2008) assessed the passengersrsquo views of service quality in
Thai low cost airlines The research was based on the principle that passengers evaluated
airline service quality through a comparison between their experiences and expectations
over a number of quality attributes The study evaluated passengersrsquo perceived service
quality of Thai low cost carriers based on the SERVQUAL instrument The findings
indicated that the passengersrsquo expectations on service quality were higher than what they
had actually experienced Further analysis showed that female passengers had lower
perceived service quality than male passengers The findings also revealed that higher
monthly income had greater differences with respect to expectations and perceptions than
lower income respondents Furthermore passengers usually traveled with low cost
carriers for three main purposes which were for leisure visiting friends or relatives and
business
20
In brief the previous studies explored the satisfaction of airline passengers by
using SERVQUAL instrument to measure the service quality The results above found
out the differences between customersrsquo expectations and perceptions The findings of a
study in Hong Kong revealed the passengersrsquo satisfaction on the dimensions of the
service quality Meanwhile a study in Thailand implied some findings about the
demographic profiles resulting in service quality Studies on service quality help improve
business organizations retain customers and attract new customers
CHAPTER THREE
METHODOLOGY
This chapter consists of four sections participants of the study research
instrument procedures of the study and data analysis
31 Participants of the Study
One hundred and fifty Thai passengers 75 males and 75 females who took the
TG Bangkok - Chiangmai route were randomly chosen as participants for the study
Since there are about 150 passenger seats in each flight the researcher randomly acquired
a sample size of 10 percent of the overall passengers from the ten flights totaling 150
Thai people are the main group of passengers who travel domestically over the year The
researcher therefore decided to select only the Thai passengers as the participants for the
study Also so as to cover various types of passengers the researcher included flights of
different time within a day (as shown in a following part of this chapter) for a reason that
passengers with some specific purposes chose to travel at some specific time For
example business people might prefer an early morning flight rather than a later-in-the-
day one
TGrsquos Bangkok ndash Chiangmai route has been considered one of the most frequent
domestic routes (THAI 2009) TG operates ten flights daily from Bangkok to
Chiangmai The researcher consequently chose this route for this research work to
assess the passengersrsquo satisfaction with TGrsquos service quality
The study was conducted in early March when it was still in the high season for
travels to the northern province of Thailand Fifteen passengers from each of the ten
flights of the Bangkok - Chiangmai route were asked to fill out the questionnaire at the
22
end of the on-board service while the plane was approaching Chiangmai its destination
All the 150 completed questionnaires were obtained as planned
32 Research Instrument
A questionnaire in Thai was used for data collection The questionnaire was
divided into three parts The first part was about the respondentsrsquo demographic profile
since consumersrsquo needs preferences and personalization are often associated with
demographic factors (Kotler 2000) Six demographic characteristics related to in-flight
service (Cheosakul 2004) consisting of gender age occupation monthly income
purpose of travel and travel frequency with THAI were demographic issues of the survey
The second part comprised questions about passengersrsquo satisfaction with the service
during the flight This part of the questionnaire was based on the SERVQUAL
instrument for measuring customersrsquo satisfaction in five dimensions of service reliability
assurance tangibles empathy and responsiveness (Parasuraman et al 1985) The last
part comprised a question and a blank space provided for suggestions on TGrsquos service
quality
33 Procedures of the Study
The questionnaire was initially approved by the researcherrsquos masterrsquos project
advisor and two specialists a TG in-flight service manager and a SWU lecturer Then a
pilot study was conducted to ten passengers to check for content reliability the
appropriateness of the number of questions and language used in the questionnaire As
the researcher included all the ten flights of TGrsquos Bangkok - Chiangmai route in the
study the tried-out questionnaire was randomly distributed to ten TG passengers (5 males
and 5 females) on each flight of the aforementioned route on the same day in February
23
2010 Also since this study was about onboard service the questionnaire was distributed
to the participants after the in-flight service was completed and before the plane landed
After that the questionnaire was adjusted and prepared for the actual survey
The revised questionnaire was eventually distributed to 150 participants in ten
consecutive days in early March 2010 Fifteen passengers in each Bangkok -
Chiangmai flight per day were randomly asked to fill out the questionnaire after the
completion of in-flight service
The plan below showed the ten flights of for the survey each flight for a day to
make sure that the data gained were reliable
BKK-CNX Flight (TG) Flight Schedule (Departure-Arrival)
TG100 0615-0725
TG102 0750-0910
TG104 0910-1030
TG106 1020-1140
TG110 1250-1400
TG112 1400-1510
TG114 1540-1650
TG116 1715-1825
TG120 1900-2010
TG122 2130-2240
34 Data Analysis
The data acquired from the questionnaires were analyzed in three sections
demographic profile of passengers level of passengersrsquo satisfaction with TGrsquos service
and the relationship between demographic profile and passengersrsquo satisfaction based on
24
Likert scale The 5-point Likert scales were used to rate the level of satisfaction as shown
in Table 1 below
Table 1 Intervals of Satisfaction Level (Poonlarbtawee 1987)
The interpretation of the scales in this study is as follows
Rating
Scale
Level of
Agreement Disagreement
Satisfaction
Level
Mean Score
5 Strongly agree Excellent 451-500
4 Agree Good 351-450
3 Uncertain Average 251-350
2 Disagree Fair 151-250
1 Strongly disagree Poor 100-150
The researcher picked up lsquothe high grouprsquo and lsquothe low grouprsquo of each
SERVQUAL dimension to present the relationship between the participantsrsquo
demographic profile and their satisfaction As the data gained from the highest number of
the participants or the high group was the major point that the researcher relied on focus
was on the majority opinion At the same time the data gathered from the lowest number
of the participants or the low group should not be overlooked because each and all
passengers are important for TG and in the high competitive airline market it is necessary
to retain each and every passenger so as to grow far in the aviation business
The results were presented in terms of percentages and mean scores in the form of
tables and a bar chart These fundamental statistic methods were proper in this study
25
because percentages and mean scores are considered the basic statistics used for data
analysis and presentation Also the general public can easily understand the
interpretation of the data Another reason was that the sample group of this study
comprised only 150 TG passengers The researcher therefore decided to apply the
aforementioned statistics in this research Discussion of the results was also offered
CHAPTER FOUR
FINDINGS
This chapter describes the findings of the study consisting of the demographic
data of the participants level of their satisfaction with TGrsquos service quality relationship
between the demographic data and five dimensions of SERVQUAL instrument and the
uncovers to the last question on the questionnaire including suggestion
41 Demographic Data
The demographic data of TGrsquos research participants in terms of age occupation
monthly income purpose of travel and frequency of travel are presented in Tables 2- 6
below
Table 2 Participantsrsquo Age
Age No of Participants Percentage ()
Under 20 years
21-40 years
41-60 years
Above 60 years
8
85
45
12
53
567
300
80
Total 150 100
Regarding the age group the highest number of the passengers was 20-40 years
old or 567 30 of them were 46-60 years old and 8 were above 60 years old Only
53 were under 20 years old
27
Table 3 Participantsrsquo Occupation
Occupation No of Participants Percentage ()
Government official State enterprise employee
Business employee
Business owner
Student
Retiree
Others
22
63
37
13
9
6
147
420
247
86
60
40
Total 150 100
In terms of occupation the highest number of the participants was business
employees (42) followed by business owners (247) government officials or state
enterprise employees (147) students (86) retirees (6) and other occupations (4)
respectively
Table 4 Monthly Income
Monthly income (baht) No of Participants Percentage ()
Up to 20000
20001- 40000
40001 - 60000
60001 and above
58
72
11
9
386
480
74
60
Total 150 100
For the income the highest number of the participants earned 20001-40000 baht
monthly (48) followed by those with a monthly income of up to 20000 baht (386)
28
of 40001-60000 baht monthly (64) and of 60001 baht and above monthly was the
lowest (6)
Table 5 Purpose of Travel
Purpose of travel No of Participants Percentage ()
Business trips
Holidays
Visits
Others
41
79
27
3
273
527
180
20
Total 150 100
Regarding the purpose of travel the highest number of the passengers traveled via
TG on holidays (527) followed by those who traveled on business trips (273)
Meanwhile those who made a visit were at 180 and who traveled with other purposes
were at 2
Table 6 Frequency of Travel
Frequency in traveling with THAI
(during the last 12 months)
No of Participants Percentage ()
First time
2-3 times
4-10 times
More than 10 times
39
99
10
2
260
660
67
13
Total 150 100
29
The last demographic data derive from the frequency in traveling with THAI
66 of the participants indicated that they traveled 2-3 times during the last 12 months
26 traveled for the first time while 67 for 4-10 times and 13 for more than 10
times during the last 12 months
In conclusion the demographic data shown in the tables above indicated that lsquothe
high grouprsquo comprised the following characteristics The age group of the majority
number of the participants ranged from 21-40 years (567) Most of them were business
employees (42) The highest number of the passengersrsquo monthly income was around
20000 ndash 40000 baht per month (48) The majority of the passengers traveled on
holidays (527) by TG 2-3 times in the past 12 months (66)
Meanwhile lsquothe low grouprsquo was found having the following characteristics The
lowest number of the research participants was under 20 years old or 53 Only 47 of
the participants had other kinds of occupation which were not indicated on the
questionnaire while only 6 of the participants earned 60001 baht or above monthly
2 of the participants traveled on other purposes besides those shown on the
questionnaire Lastly 13 of the passengers were those who traveled by TG more than
10 times in the past 12 months
42 Level of Passengersrsquo Satisfaction
Figure 1 below is the conclusion from the second part of the questionnaire The
150 participants were asked to rate the level of service quality that they perceived from
the TGrsquos domestic flights on Bangkok - Chiangmai route The questionnaire was divided
into five dimensions of SERVQUALrsquos (Parasuraman et al 1985) service quality which
comprised reliability assurance tangibles empathy and responsiveness The scales 1 to 5
ranged from lsquostrongly disagreersquo to lsquostrongly agreersquo
30
0
5
Reliability Assurance Tangibles Empathy Responsiveness
280
345 334307
269
SERVQUAL Dimension
Figure 1 Overall Level of Participants Satisfaction
Mean scores
Figure 1 shows the average mean score of all 150 passengersrsquo satisfaction on five
dimensions of service quality ranging from the mean scores of 345 to 269 The results
revealed that the most important service quality dimension for the whole samples group
of passengers was assurance ( 345) followed by tangibles ( 334) empathy ( 307)
reliability ( 28) and responsiveness ( 269) respectively The overall average mean
was 307
43 Passengersrsquo Satisfaction Level in Relationship with Their Demographic Data
This section shows the relationship between the demographic data (age
occupation monthly income purpose of travel and travel frequency) of the participants
and their satisfaction with the service quality of TGrsquos in-flight service
The researcher focused on each category of demographic characteristics of two
major groups a group with the highest score and the other with the lowest score In fact
the most important data were the majority opinion of the sample group In other words
for this study it was lsquothe high grouprsquo However the researcher as a TG cabin crew gave
importance to the low group as well since each and every passenger is significant to TG
x
x x x
x x
31
business particularly in the high competitive market of airline business The researcher
was interested to know what the passengers in the lsquolow grouprsquo thought about the in-flight
service and what their feedback was
The following tables (Tables 7-11) illustrate the relationship between each
dimension of the demographic data and the SERVQUAL service assessment tool and the
following symbols are applied in the tables below
lsquoNrsquo means the number of the participants
lsquo rsquo means the mean score
lsquoThe high grouprsquo means the group that comprises the highest number of participants
lsquoThe low grouprsquo means the group that comprises the lowest number of participants
Table 7 Relationship between the Participantsrsquo Age and their Satisfaction with In-flight
Service
SERVQUALrsquoS
RATER
Average
Mean Score
of All Groups
The High Group
(Age 20-40 Yrs Old)
N = 85567
The Low Group
(Age Under 20 Yrs Old)
N = 853
Mean Score of Each Group
Reliability 280 278 270
Assurance 345 378 335
Tangibles 334 331 328
Empathy 307 309 314
Responsiveness 269 267 290
Table 7 reveals the connection between the participantsrsquo age and the five
dimensions of the SERVQUAL instrument The high group had higher mean scores for
x
32
three dimensions than the low group In other words the participants with an age range
of 20-40 years were more satisfied with TGrsquos service quality in terms of reliability
assurance tangibles than those who were under 20 years old Meanwhile the low group
had higher mean scores for two dimensions than the high group This means the
participants who were lower than 20 years old were more satisfied with the in-flight
service in terms of empathy and responsiveness than those whose ages ranged from 20-40
years
Interestingly it was found that both groups have a lower mean score for the
reliability dimension ( 278 and 270) than the average mean score of all the age groups
in this study ( 28)
Table 8 Relationship between the Participantsrsquo Occupation and their Satisfaction with In-
flight Service
SERVQUALrsquoS
RATER
Average
Mean Score
of All Groups
The High Group
(Business Employee)
N = 63420
The Low Group
(Others)
N = 640
Mean Score of Each Group
Reliability 280 275 284
Assurance 345 347 348
Tangibles 334 331 336
Empathy 307 310 305
Responsiveness 269 264 277
Table 8 illustrates the connection between the participantsrsquo occupations and the
five dimensions of the SERVQUAL instrument The low group had higher mean scores
x
x
33
for almost all the dimensions of SERVQUALrsquos RATER than the high group except for
one dimension In other words the participants who worked as business employees were
less satisfied with TGrsquos service quality in terms of reliability assurance tangibles and
responsiveness than those whose occupations were not specified in the questionnaire
Empathy was the only dimension of service quality that the participants who were in the
high group were satisfied with
Table 9 Relationship between the Participantsrsquo Income and their Satisfaction with In-
flight Service
SERVQUALrsquoS
RATER
Average
Mean Score
of All Groups
The High Group
(20001-40000)
N = 72480
The Low Group
(60001 and above)
N = 960
Mean Score of Each Group
Reliability 280 273 285
Assurance 345 349 350
Tangibles 334 332 321
Empathy 307 301 325
Responsiveness 269 262 273
Table 9 indicates the connection between the participantsrsquo monthly income and
the five dimensions of the SERVQUAL instrument The low group had higher mean
scores for almost all the dimensions of RATER than the high group except for one
dimension In other words the participants who earned monthly income of 20001 ndash
40000 baht were less satisfied with TGrsquos service quality in terms of reliability assurance
empathy and responsiveness than those who earned monthly income of 60001 baht and
34
above The tangibles dimension was the only service quality issue that the participants
who were in the high group were satisfied with
Table 10 Relationship between the Participantsrsquo Purpose of Travel and their Satisfaction
with In-flight Service
SERVQUALrsquoS
RATER
Average
Mean Score
of All Groups
The High Group
(Holidays)
N = 79527
The Low Group
(Others)
N = 320
Mean Score of Each Group
Reliability 280 279 285
Assurance 345 353 349
Tangibles 334 335 338
Empathy 307 308 312
Responsiveness 269 270 275
Table 10 reflects the connection between the participantsrsquo purpose of travel and
the five dimensions of the SERVQUAL instrument The low group had higher mean
scores for almost all the dimensions than the high group except for one dimension In
other words the participants who traveled on holidays were less satisfied with TGrsquos
service quality in terms of reliability tangibles empathy and responsiveness than those
whose purpose of travel were not specified in the questionnaire Assurance was the only
dimension of service quality that the participants who were in the high group were
satisfied with
35
Interestingly it was found that both groups has a higher satisfaction level for the
assurance tangibles empathy and responsiveness dimensions than the average mean
scores of the whole sample group
Table 11 Relationship between the Participantsrsquo Frequency of Travel with THAI and their
Satisfaction with In-flight Service
SERVQUALrsquoS
RATER
Average Mean
Score of All
Groups
The High
Group
(2-3 timesyear)
N = 99660
The Low Group
(more than 10
timesyear)
N = 213
Mean Score of Each Group
Reliability 280 281 295
Assurance 345 346 360
Tangibles 334 335 343
Empathy 307 308 321
Responsiveness 269 270 292
Table 11 presents the connection between the participantsrsquo frequency of travel
with THAI and the five dimensions of the SERVQUAL instrument The low group had
higher mean scores for all the dimensions of RATER than the high group In other
words the participants who traveled 2-3 times in the last 12 months were less satisfied
with TGrsquos service quality in terms of reliability assurance tangibles empathy and
responsiveness than those whose frequency of travel were more than 10 times in the last
12 months
36
Interestingly it was found that both groups has a higher satisfaction level for all
the five RATER dimensions than the average mean scores of the whole sample group in
this study
44 Other Comments
The last part of the questionnaire was designed to ask whether the participants
would continue using TGrsquos service The findings disclosed that 142 participants or
946 indicated that they would while 8 of them or 54 declined
Also at the end of the questionnaire there was a blank space for the participants to
freely express their own ideas and suggestions on TGrsquos service However only 7
participants or 46 gave suggestions regarding the in-flight service Four of the
participants were dissatisfied with the flavor of the snacks provided on board One
complained that it was not cool enough in the cabin while one was upset for not being
granted for a request for a blanket The last one commented that the passengerrsquos seat was
not comfortable
In summary the passengersrsquo satisfaction level of the service quality in connection
with their demographic data was introduced Five out of the six demographic
characteristics the participantsrsquo age occupation monthly income purpose of travel and
frequency of travel were analyzed in connection with the five dimensions of SERVQUAL
instrument reliability assurance tangibles empathy and responsiveness It was observed
that there were some connection between these two matters in various ways as earlier
discussed Lastly it was found that one hundred and forty-two participants would
continue using TGrsquos service while the rest refused Only seven of all the participants or
46 gave some comments on the open-ended suggestion part
CHAPTER FIVE
CONCLUSION AND DISCUSSION
This chapter presents the conclusion discussion limitations of the study and
recommendations for further studies
51 Conclusion
This research aimed to examine the service quality provided by Thai Airways
International on its domestic flights One hundred and fifty passengers who traveled by
TG on the Bangkok - Chiang Mai route were the research participants The SERVQUAL
instrument was used as an instrument for data collection in the survey This instrument
was based on five determinants proposed by Panasuraman etal (1985) in terms of
reliability assurance tangibles empathy and responsiveness This research was also
conducted on the demographic characteristics comprising gender age occupation
monthly income purpose of travel and frequency in traveling and the relationship of these
characteristics except the gender with the passengersrsquo satisfaction with TGrsquos in-flight
service quality The questionnaires were distributed in early March 2010
The results showed that all the participantsrsquo satisfaction based on the five
dimensions was at the average level The highest level of passengersrsquo satisfaction was
placed on the assurance dimension followed by tangibles and empathy dimensions
accordingly The two lowest levels of the passengersrsquo satisfaction were placed on the
responsiveness and reliability dimensions
In addition a summary of the demographic characteristics showed that the high
group or the group with the highest number of participants was business employees The
highest number of the participants was between 21-40 years old The highest number of
38
the participantsrsquo income ranged from 20000 ndash 40000 baht monthly Also the high
grouprsquos purpose of travel was to go on holiday Lastly the highest number of the
participants traveled via TG only 2-3 times during the past 12 months
Meanwhile the low group or the group with the lowest number of participants
was passengers with other kinds of occupations which were not specified on the
questionnaire The low group of the participants was under 20 years old The low group
of the participantsrsquo income ranged from 60001 baht monthly or higher Also the low
group revealed that they traveled via TG for other purposes which were not indicated on
the questionnaire Lastly the passengers who traveled via TG more than 10 times during
the past 12 months belonged in the low group
It has also been discovered that as a whole both groups the high and low groups
were in the same direction in their satisfaction with the five dimensions of service quality
The two groups were satisfied with the service quality dimensions in terms of assurance
at the highest level followed by tangibles empathy reliability and responsiveness
respectively
However when analyzing each demographic characteristic the participants who
were under 20 years old rated the responsiveness dimension higher than the reliability
dimension Also for those participants whose income was around 60001 or higher the
empathy dimension was rated higher than the tangibles Regarding the occupation
business people were satisfied with the reliability and responsiveness dimensions at a
very low level Meanwhile the participants who traveled via TG on their holidays rated
the assurance dimension at a very high level Lastly frequent fliers who traveled by
THAI more than 10 times were most satisfied with TGrsquos service since they rated all
RATER aspects highly
39
52 Discussion
The findings have revealed the answers to the research questions First the
demographic data of the participants gender age occupation monthly income purpose
of travel and frequency of travel were shown Second the level of the passengersrsquo
satisfaction toward the service quality on Thai Airways Internationalrsquos domestic flights in
terms of the SERVQUAL instrument (Parasuraman et al 1985) reliability assurance
tangibles empathy and responsiveness was disclosed Also the results about the
relationship between the passengersrsquo satisfaction and their demographic data were pointed
out
The results of the survey indicated that out of the five dimensions assurance was
rated at the highest level ( 345) followed by tangibles ( 334) and empathy ( 307)
(See Figure 1) In addition passengers rated their highest satisfaction with the assurance
dimension which included cabin crewrsquos job knowledge their courtesy confidence in their
service ability and safety while traveling It may be because TG cabin crew are well-
trained prior to their actual service work on board This can also ensure passengersrsquo
safety Particularly the safety and security features have been the most concerns of
airline passengers since the 9-11 incidents in New York USA This is why most
customers rated their highest satisfaction with the assurance dimension (Carman 1990)
The findings of this study are also consistent with those of Fick and Ritchie (1991)
who studied the operation of the SERVQUAL instrument in three major tourism sectors
airlines restaurants and ski area services It was revealed that the most important
dimensions of the service were assurance and tangibles If companies were unable to
inspire trust and confidence in their customers and the tangibles are not impressive it
would be difficult for them to achieve a high level of customerrsquos satisfaction (Sachukorn
2000)
x x x
40
Responsiveness is often found as the lowest level of satisfaction among customers
in the service industry It is plausible that the staff were too busy to provide prompt and
good service (Kholthanasep 2001) In this study the results revealed that the
responsiveness dimension was rated at the lowest score ( 269) among the five
dimensions followed by the reliability ( 280) dimension It was highly possible that the
passengersrsquo dissatisfaction occurred when passengers did not receive prompt service from
TG when they needed help
Prompt service is an important factor of customersrsquo expectation Customers
generally rate the service as poor when the speed of service does not meet their
expectations (Kholthanasep 2001) Bojanic and Rosen (1994) examined the nature of the
association between service quality as perceived by consumers and its determinants by
applying SERVQUAL in a restaurant setting They found that customers rated
responsiveness as the lowest satisfaction in their studies Zeithaml et al (1990) explained
that the responsiveness dimension in the SERVQUAL was willingness to help customers
and provide prompt service As the responsiveness dimension in this research comprised
prompt service willingness on-time service and quick response therefore it will be
beneficial to TG if the company can ensure that the service provided by its cabin crew
especially the willingness to help passengers and to provide prompt service meet
passengersrsquo satisfaction
Regarding the relationship between the participantsrsquo demographic data and their
satisfaction with the service quality there are many points of interests to be discussed as
follows
Firstly regarding the relationship of the passengersrsquo satisfaction with the service
and their age those who were under 20 years old rated satisfaction with the
responsiveness dimension ( 290) higher than the reliability dimension ( 270) (See
x
x
x x
41
Table 7) It was possible that young passengers usually gave priority to the dimension of
care and service when compared with that of the service providersrsquo accurate and
dependable manner (Panittumrong 2003) In addition young customers had less
experience in a service and it was difficult to compare the current service with the past
experience consequently they were more satisfied with the service provided than senior
customers
Another point was raised about the participantsrsquo age The study revealed that the
number of the high group with the age range of 21- 40 was at 567 However that of
the second highest group of the participants with the age range of 41-60 was at 30
which was rather high This latter grouprsquos level of satisfaction on the service quality was
also close to the average mean score It was found that the average mean score of the
reliability dimension was 280 while that of the second highest group was 281 the
average mean score of the assurance dimension was 345 while that of the second highest
group was 347 the average mean score of the tangibles dimension was 334 while that of
the second highest group was 335 the average mean score of the empathy dimension and
that of the second highest group was rated at 307 equally and the average mean score of
the responsiveness was 269 while that of the second highest group was 271 In sum if
consider the two groups in terms of the participantsrsquo age one of the high group and the
other with the second high group the results confirmed that the satisfaction level of the
majority of passengers was at the above average level
Secondly regarding the relationship between the participantsrsquo satisfaction and
their occupation business employees who were found at the highest number (42) had
very low satisfaction with the service quality in terms of reliability ( 275) and
responsiveness ( 264) while the mean scores of the whole sample group for these two
dimensions were at 280 and 269 respectively (See Table 8) The findings strongly
x
x
42
correlated with that of Cheaosakul (2004) who studied the consumersrsquo perception of
airline service quality with a focus on occupations It was found that the group of
business employees had the highest score on expectations Cheaosakul (2004)rsquos study
also revealed that business employees did not frequently travel compared with people of
other occupations such as tourists It was found in this particular study that the number of
the participantsrsquo purpose of travel with TG for business trips was only at 273 (See
Table 5) while the highest number of the participants went on holiday was at 52
Cheaosakul (2004) indicated that business people therefore had high expectations than
the other group who traveled more frequently
Thirdly an even more interesting point was raised when comparing the level of
satisfaction of the passengers who were government officials or state enterprise
employees and business owners Although passengers who were government officials or
state enterprise employees came third in terms of participants they are considered
valuable customers of TG since according to the governmentrsquos policy they are required
to take only TG which is a national airline whenever they travel by air There are few
exceptions though However it is almost impossible for Thai government officials who
travel on business trip and are funded by the governmentrsquos budget to fly with other
airliners It was found from this study that government officials were less satisfied with
TG quality service in terms of reliability ( 277) and responsiveness ( 264) than the
average level of which the mean scores of the two dimensions were at 280 and 269
respectively
Another issue of discussion regarding the participantsrsquo occupation business
owners came second It was observed that business owners rated the reliability ( 282)
and responsiveness dimensions ( 270) higher than the average scores of all groups (See
Table 8) It is possible that business owners had more positive attitude with TGrsquos service
x x
x
x
43
than the other groups TG seemed popular among business owners and they were the
most important group of customers This was supported by Suriya (2005) who studied
airline market segments after the launch of the low cost airlines in Thailand Suriya
(2005) identified that merchants or business owners were the major group of customers in
the full-service airline market
Fourthly regarding the monthly income of the research participants of the low
group passengers who earned an income of around 60001 or higher rated the empathy
( 325) dimension higher than tangibles ( 321) dimension (See Table 9) This may
be because the high income passengers sensitively felt that the facilities and equipment
found on their domestic route looked quite old-fashioned due to TGrsquos cost reduction The
company saved costs after the Suvannabhumi airport was closed in the 2008 crisis The
result is similar to the findings of Wangpen and Inthornma (2007) in that high income
customers had higher expectations towards the service It was possible that they had
more tendencies to be dissatisfied with the service failures The two researchers
concluded that passengers with different incomes were satisfied with the services at
different levels because they had different attitudes expectations and abilities to pay for
the service
Fifthly as it was found from this study that the highest score for the purpose of
travel was going on holiday (527) and the participants who were tourists rated the
assurance dimension at the highest level or the mean score of 353 (See Table 10) much
higher than the mean score of the whole group which was at 345 It was rather surprising
that the highest score for the travel purpose was not for business trips It is possible to
explain that this group spent for the travel cost on their own and they might want to make
sure that they chose the best service for themselves The result is parallel with Gabbie
and OrsquoNeill (1997) who examined customer satisfaction in the hotel sector using the
x x
44
SERVQUAL tool This study showed that the holiday guests who paid for
accommodation on their own rated assurance much higher than other dimensions It is
plausible to explain that passengers traveling on their own budget must make sure that
they already chose the service that was worth the money spent
However when analyzing the satisfaction on service quality of the participants
whose purpose of travel via TG was for business it was also found that this business
participants rated the high score for the tangibles dimension at the mean score of 340
compared with the average mean score of all groups of 334 Passengers who traveled on
business included government officials and state enterprise employees were major
customers of TG It was therefore interesting to find out from this study that their
satisfaction score in terms of tangibles or the appearance of physical factors such as
equipment facilities and personnel was above the average score of all groups Although
the score was not much higher the gap was bigger than that of the other RATER
dimensions as seen from the following information the passengers who traveled on
business trip showed their satisfaction on the reliability dimension at the mean score of
281 the assurance dimension at 347 the empathy dimension at 309 and the
responsiveness dimension at 270 while the average of all groups was at 280 345 307
and 269 respectively
The last point that the researcher wanted to point out is that this study revealed
that the participants who traveled more than 10 times for the last 12 months were lowest
in number (13) However it was interesting that these frequent flyers showed the high
rate of satisfaction with TGrsquos in-flight service quality The mean scores in all dimensions
showed the high rate of satisfaction (See Table 11) It is possible that passengers who
traveled very often via TG had high loyalty The brand loyalty made passengers happy in
every feature of service This result however contrasts with Ostrowski et al (1993) who
45
investigated service quality and customer loyalty in the commercial airline industry The
study examined whether the high levels of service quality existed in the US commercial
airline industry and how service quality could potentially lead to customer loyalty The
main results indicated that the levels of perceived service quality were below potential
and that customer loyalty to airlines was low It is plausible to say that the data of the two
studies were different The data collected on two air carriers in USA might have
different characteristics from the demographic information of Thai people and the number
of the participants in the two studies might differ However TG still needs to listen to the
voice of all passengers especially the frequent flyers Even if the number of this sample
group was few every customer is valuable for any firm Also it would be valuable to
implement a relevant strategy to expand this group of passengers since they had a positive
attitude for TG
Interestingly the findings from the last part of the questionnaire also showed that
the majority of the participants (946) showed their willingness to use TGrsquos service in
the future It can plausibly be explained that the participants were satisfied with TGrsquo
service quality at the moderate level ( 307) Their satisfaction with the five dimensions
of SERVQUAL was also moderate They might think that TG is a reliable airline that
they can depend on Thai passengers have confidence and trust in the service of Thai
cabin crew in terms of courtesy Also it is possible that they might not trust the low cost
airlinesrsquo service of the crew
There were only seven remarks on the in-flight service when the participants were
asked to freely give suggestions The tangible dimension problematic Passengers
pointed out about the small size of passengersrsquo seats and the quality of the air-
conditioning system One problem was on the responsiveness dimension which happened
when a passenger asked for a blanket but she was not offered indicating that some of the
x
46
cabin crewrsquos promptness to provide service was still not up to a standard Another
comment was on the flavor of the snacks Although this issue is not directly relevant to
the service it is worthwhile for TG to consider this problem
In conclusion the researcher found both strengths and weaknesses in TGrsquos service
quality Assurance was found the highest satisfaction in the participantsrsquo opinion TG
should maintain the service quality with a focus on this dimension On the other hand
the responsiveness and reliability dimensions were at the lowest satisfaction level among
the five dimensions The company should improve its service quality on these two
dimensions especially with regards to TGrsquos lsquoprompt servicersquo and lsquoproblem solvingrsquo
service to retain its passengers
53 Limitations of the study
This study has some limitations as follows
1 This study was limited to only one domestic route (Bangkok ndash Chiangmai)
Therefore the participants in this study were passengers who traveled only between these
two provinces The results of the study might differ if the study covered another route or
many more routes at the same time Consequently further studies can be conducted for
other domestic destinations such as Phuket and other big cities
2 The research participants were all Thai passengers It would be interesting to
study foreign passengersrsquo satisfaction on TGrsquos in-flight service quality
3 This study focused only on Parasuraman et al (1985)rsquos SERVQUAL
Instrument used to assess the service quality The results might differ if other instruments
were used
47
54 Recommendations for further studies
Further research should be undertaken to validate the results of this study The
researcher has found several opportunities to extend this study as follows
Survey on the lsquoresponsivenessrsquo dimensions
Responsiveness concerns the willingness or readiness of employees to provide
service such as timelines of service and prompt service This dimension was what the
passengers in this study were most concerned about because it was rated as the lowest
level of satisfaction Thus TG should find the countermeasure of how to increase the
level of passengersrsquo satisfaction in the responsiveness dimension
Assessment of the ground service quality
Since this research was conducted on on-board service quality further studies on
ground services such as a reservation or check-in service should be investigated in order
to integrate the results covering every sector of the airline service
Study on passengersrsquo attitude towards the service quality in other airlines
A study on the service quality of other airlines should be conducted in order to
obtain comparative data and find out reasons for their passengersrsquo behavior and attitude
consequently allowing TG to remedy any weak points and increase the number of new
passengers
REFERENCES
REFERENCES
Alegre J amp Pou L (2006) An analysis of the microeconomic determinants of travel
frequency Department of Applied Economics Universitat de les Illes Balears
Bojanic DC (1991) Quality measurement in professional service firms Journal of
Professional Service Marketing 7(2) 27-37
Bojanic D C amp Rosen L D (1994) Measuring service quality in restaurants An
application of the SERVQUAL model Journal of Hospitality Research 18(1)
3-14
Boontaganon W (2002) The study of service quality of fast-food restaurants in Bangkok
using SERVQUAL measurement Thesis MBA (Business Administration)
Bangkok Assumption University Photocopied
Buttle F (1996) SERVQUAL review critique research agenda European Journal of
Marketing 30(1) 8-31
CarmanJ M (1990) Consumer perceptions of service quality An assessment of the
SERVQUAL dimensions Journal of Retailing 69 33-35
Cheaosakul W (2004) Consumers perception of service quality a case study of Thai
Airways International Plc Thesis MBA Bangkok Assumption University
Photocopied
Fick RG amp Ritchie JRB (1991) Measuring service quality in the travel and tourism
industry Journal of Travel Research 30(2) 2-9
Fornell C (1992) A national customer satisfaction barometer the Swedish experience
Journal of Marketing 56 6-21
Gabbie O amp OrsquoNeill M (1997) SERVQUAL and the Northern Ireland hotel sector a
comparative analysis part 2 Managing Service Quality 17(1) 43-49
50
Gilbert DH (1999) Marketing connecting with customers (2nd
ed) Upper Saddle
River NJ Prentice Hall
Gilbert D amp Wong KCR (2002) Passenger expectations and airline services a
Hong Kong based study Surrey Management School Surrey University of
Surrey
Gitman LJ amp Carl DM (2005) The future of business the essentials Mason Ohio
South-Western College Pub
Grifin J (1995) Customer loyalty NY Lexington Book
Gronroos C (1978) A service-oriented approach to marketing of services European
Journal of Marketing 12(8) 588-601
Hennig-Thurau T amp Klee A (1997) The impact of customer satisfaction and
relationship quality on customer retention a critical reassessment and model
development Masterrsquos Project MA (Psychology amp Marketing) Hanover
University of Hanover
Heesawat C (2005) The opportunities and problems in making services more tangible
PhD Dissertation Bangkok Assumption University Photocopied
Juran JM amp Gryna FM (1974) Quality control handbook NY McGraw-Hill
Kholthanasep G (2001) A study of customerrsquos expectations and perceptions of service
quality delivery by first class hotels in Bangkok metropolitan area Thesis
MBA Bangkok Assumption University Photocopied
Kotler P amp Scheff J (1997) Standing room only strategies for marketing the
performing arts Boston Mass Harvard Business School Press
Kotler P (1997) Marketing management analysis planning and control (9th
ed) Upper
Saddle River NJ Prentice Hall
51
Kotler P Bowen J amp Makens J (1999) Marketing for hospitality and tourism (2nd
ed) NJ Prentice Hall
Kotler P (2000) Marketing management the millennium edition (10th
ed) NJ Prentice
Hall
Lages FL amp Fernandes CJ (2005) The SERVQUAL scale a multi-item instrument
for measuring service personal values Journal of Business Research 58(11)
1562-1572
Oberoi U amp Hales C (1990) Assessing the quality of the conference hotel product
London The Service Industries Journal 10(4) 700-722
Ostrowski PL Orsquobrien TV amp Gordon GL (1993) Service quality and customer
loyalty in the commercial airline industry Journal of Travel Research 32(2)
16-24
Palin M (1996) Flight catering transportation and loading (2nd
ed) London Longman
Group Limited
Panittumrong P (2004) The consumerrsquos opinion towards Clark Hatch Fitness Center
Master Project MBA (Management) Bangkok Graduate School
Srinakharinwirot University Photocopied
Parasuraman A Zeitmal VA amp Berry LL (1985) A concept model of service
quality and its implications for future research Journal of Marketing 49 41-50
Parasuraman A Zeitmal VA amp Berry LL (1988) SERVQUAL a multiple item
scale for measuring customer perceptions of service quality Journal of
Retailing 64(1) 64
Parasuraman A amp Berry LL (1991) Marketing services competing through quality
NY The Free Press
52
Pirsig RM (1987) Zen and the art of motorcycle maintenance an inquiry into values
(Mass Market Paperback) NY Bantam Books
Poonlarbtawee K (1987) Statistics for research Bangkok Physic Center Printing
Reid RD amp Bojanic DC (2001) Hospitality marketing management NJ John Wiley
amp Son Inc
Rueangthanakiet P (2008) Memberrsquos satisfaction of fitness service quality a case study
of California Wow Xperience Plc Masterrsquos Project MA (Business English for
International Communication) Bangkok Graduate School Srinakharinwirot
University Photocopied
Sachukorn S (2006) Reception and service excellence Bangkok Saitharn
Schiffman LG amp Kanuk LL (1994) Consumer behavior (5th
ed) London Prentice-
Hall International
Somwang C (2008) An assessment of passengersrsquo views of service quality in Thai low
cost carriers Inter Program MA (Communicative English) Bangkok
Ramkhamhaeng University Photocopied
Suriya K (2005) Airline market segments after low cost airlines in Thailand passenger
classification using neural networks and logit model with selective learning
Faculty of Economics Chiangmai Chiangmai University
Suthirungkul N (2003) The study of customer expectations and perceptions of service
quality of the Clark Hatch fitness center of Silom road branch Bangkok Thesis
MBA (Business Administration) Bangkok Assumption University
Photocopied
Thai Airways International (2008) Traffic program information (Introduction of summer
200809) Bangkok THAI Printing Office
53
Thai Airways International (2009) Traffic program information (Introduction of winter
200910) Bangkok THAI Printing Office
THAI AIRWAYS INTL Official 4-Star Ranking of Product and Service Quality (2009
October) Retrieved February 14 2010 from
httpwwwairlinequalitycomAirlinesTGhtml
Travel Planning (2010 February 12) Retrieved February 12 2010 from
httpwwwsuite101comlessoncfm1848818243
Wangpen N amp Inthornma S (2007) Membersrsquo satisfaction in fitness centers in
Bangkok Thesis MA (Hotel and Tourism Management) Bangkok Graduate
School Naresuan University Photocopied
Zeithaml VA amp Bitner MJ (2000) Services marketing (2nd
ed) NY McGraw Hill
Zeithaml VA Parasuraman A amp Berry LL (1990) Delivering quality service
balancing customer perceptions and expectations NY Free Press
APPENDICES
55
APPENDIX A
แบบทดสอบความพงพอใจของผโดยสารการบนไทย
เรยนทานผโดยสารทเคารพ กระผมนาย วลาศ มนคงวณชกล พนกงานตอนรบสายการบนไทย และนกศกษาปรญญาโท หลกสตรภาษาองกฤษธรกจเพอการสอสารนานาชาต มหาวทยาลยศรนครนทรวโรฒ ไดจดท าแบบสอบถามนเพอเปนสวนหนงของการส ารวจความพงพอใจของผโดยสารทมตอคณภาพงานบรการ เทยวบนภายในประเทศของการบนไทย โดยมงหวงทจะน าขอมลทไดรบจากการส ารวจมาเปนประโยชนตอการสงเสรมสนบสนนการปฏบตงานใหเกดประสทธผล จงขอความกรณาจากทานในการตอบแบบสอบถามทกขอตามขอเทจจรงและความเหนของทาน ขอมลทงหมดเปนความลบ จะใชเพอการวจยเทานน และขอขอบคณในความรวมมอของทาน
helliphelliphelliphelliphelliphelliphelliphelliphelliphelliphelliphelliphelliphelliphelliphelliphelliphelliphelliphelliphelliphelliphelliphelliphelliphelliphelliphelliphelliphelliphellip
ค าชแจง โปรดท าเครองหมาย (x) ลงในชองวาง ทตรงกบค าตอบของทาน
ตอนท 1 ขอมลทวไป
1 เพศ ( ) ชาย ( ) หญง 2 อาย ( ) ตากวา 20 ป ( ) 21-40 ป ( ) 41-60 ป ( ) 60 ปขนไป 3 อาชพ ( ) ขาราชการ รฐวสาหกจ ( ) พนกงานบรษท ( ) ธรกจสวนตว ( ) นกเรยน นกศกษา ( ) เกษยณ ( ) อนๆ 4 รายได เดอน ( ) ตากวา 20000 ( ) 20001- 40000 บาท ( ) 40001- 60000 บาท ( ) 60001 บาท ขนไป 5 จดประสงคการเดนทาง ( ) ธรกจ ( ) พกผอน ( ) เยยมเยยนญาตมตร เพอนฝง ( ) อนๆ 6 ความถในการเดนทางกบการบนไทย (ในรอบ 12 เดอน) ( ) ครงแรก ( ) 2-3 ครง ( ) 4-10 ครง ( ) 10 ครงขนไป
56
ตอนท 2 ความพงพอใจของทานตอการบรการ (5 = เหนดวยอยางยง 4= เหนดวย 3= ปานกลาง 2=ไมเหนดวย 1=ไมเหนดวยอยางยง)
ระดบความพงพอใจ
การบรการของการบนไทย 5 4 3 2 1 1 เมอเจาหนาทสญญาทจะใหบรการทานในเรองใด จะทาตามนนเสมอ
2 การใหบรการของเจาหนาท สรางความเชอมนใหกบทาน
3 อปกรณบนเครองบนมรปแบบททนสมย (เชน จอทว ทนง)
4 บรษทฯกาหนดเวลาการใหบรการบนเครองเหมาะสม
5 เจาหนาทใหบรการทดนบตงแตกาวแรกบนเครอง
6 เจาหนาทมความตงใจดทจะชวยเหลอทาน เมอทานมปญหา
7 ทานรสกปลอดภยเมออยบนเครองบน
8 สงอานวยความสะดวกตางๆบนเครอง มรปลกษณทดงดดใจ (เชน กลองอาหาร) 9 เจาหนาทไมเขาใจความตองการของทาน ในบางกรณ
10 เจาหนาทไมไดระบเวลาในการใหบรการผโดยสารบนเครองทแนนอน 11 เจาหนาทพยายามทางานโดยไมใหเกดขอผดพลาด
12 เจาหนาทปฎบตงานดวยความสภาพเสมอ
13 เจาหนาทแตงกายเรยบรอยและดด
14 บรษทฯใหความเอาใจใสกบผโดยสารเปนรายบคคล
15 บางครงเจาหนาทไมเตมใจทจะใหบรการผโดยสาร
16 บรษทใหบรการทานตรงเวลาทกาหนด
17 เจาหนาทสามารถใหขอมลเกยวกบการเดนทางไดอยางถกตอง
18 เอกสารของบรษทฯทเกยวของกบการบรการ (เชน แผนพบ นตยสาร) มขอมลครบถวน และรปแบบสวยงาม 19 เจาหนาทใหบรการทานดวยสมผสความเปนไทย
20 เจาหนาทใหบรการผโดยสารอยางรวดเรว
ทานจะกลบมาใชบรการของการบนไทยตอไป จะใชบรการตอไป ไมใชบรการ
ขอเสนอแนะ_______________________________________________________
_____________________________________________________________ ขอบพระคณอยางสงในความรวมมอของทาน
57
APPENDIX B
Questionnaire
Dear Honorable Passengers
My name is Wilas Mankongvanichkul -- a THAI cabin crew and masterrsquos student of business English
for international communication program Srinakharinwirot University This questionnaire is about
an exploration of passengersrsquo satisfaction with service quality of Thai Airways International (TG)rsquos
domestic flights Data gained will be utilized for THAI service operation Please kindly complete the
questionnaire The data gained will be kept confidential and used for the research study only Your
kind cooperation is greatly appreciated
helliphelliphelliphelliphelliphelliphelliphelliphelliphelliphelliphelliphelliphelliphelliphelliphelliphelliphelliphelliphelliphelliphelliphelliphelliphellip
Direction Please mark (x) your answer in the space provided
Part 1 Personal Information
1 Gender
( ) Male ( ) Female
2 Age
( ) Under 20 years ( ) 21-40 years
( ) 41-60 years ( ) Above 60 years
3 Occupation
( ) Government official State enterprise employee
( ) Business employee
( ) Business owner ( ) Student
( ) Retiree ( ) Others
4 Monthly income
( ) Up to 20000 baht ( ) 20001- 40000 baht
( ) 40001 ndash 60000 baht ( ) 60001 baht and above
5 Purpose of travel
( ) Business trips ( ) Holidays
( ) Visits ( ) Others
6 Frequency in traveling with THAI (during the last 12 months)
( ) First time ( ) 2-3 times
( ) 4-10 times ( ) More than 10 times
58 Part 2 Your satisfaction with the service
(5=Strongly Agree 4= Agree 3=Uncertain 2=Disagree 1= Strongly Disagree)
Level of Satisfaction
The Service of THAI 5 4 3 2 1
1 When cabin crew promise to do something by a
certain time they do so
2 You can trust THAI cabin crew
3 TG has modern on board equipment
(such as TV screen passengersrsquo seats)
4 TG has operating hours on board convenient to all
passengers
5 Cabin crew offer good services upon boarding
6 When passengers have a problem cabin crew show a
sincere interest in solving it
7 Passengers feel safe on-board
8 The physical facilities of TG are visually appealing
(such as meal boxes)
9 Cabin crew do not understand your special needs in
some cases
10 Cabin crew do not tell passengers exactly when
services will be offered
11 Cabin crew insist on error-free records
12 Cabin crew are consistently courteous to passengers
13 Cabin crew are well-dressed and neat in appearance
14 TG gives passengers individual attention
15 Cabin crew are not always willing to help passengers
16 TG provides its services at the time it promises to
do so
17 Cabin crew are knowledgeable to answer passengers
travel-related questions
18 Documents about service are informative and appealing
(such as pamphlets and magazines)
19 Services provided have a ldquoThai Touchrdquo
20 Cabin crew are quick to respond to passengersrsquo requests
Will you come back for TGrsquos service Yes No
Suggestions________________________________________________________________
________________________________________________________________________ Thank you very much for your kind cooperation
59
APPENDIX C
Questionnaire Specification Based on SERVQUAL measurement (Parasuraman et al 1985)
Passengers satisfaction level toward service quality factors
No Service Quality Features (RATER)
Str
on
gly
ag
ree
Ag
ree
Un
certa
in
Dis
ag
ree
Str
on
gly
Dis
ag
ree
(5) (4) (3) (2) (1)
1 When cabin crew promise to do something by a certain time they do so Reliability
2 You can trust THAI cabin crew Assurance
3 TG has modern on board equipment (such as TV screen passengersrsquo seats) Tangibles
4 TG has operating hours on board convenient to all passengers Empathy
5 Cabin crew offer good services upon boarding Responsiveness
6 When passengers have a problem cabin crew show a sincere interest in solving it
Reliability
7 Passengers feel safe on-board Assurance
8 The physical facilities of TG are visually appealing (such as meal boxes) Tangibles
9 Cabin crew do not always understand your special needs in some cases Empathy
10 Cabin crew do not tell passengers exactly when services will be offered Responsiveness
11 Cabin crew insist on error-free records Reliability
12 Cabin crew are consistently courteous to passengers Assurance
13 Cabin crew are well-dressed and neat in appearance Tangibles
14 TG gives passengers individual attention Empathy
15 Cabin crew are not always willing to help passengers Responsiveness
16 TG provides its services at the time it promises to do so Reliability
17 Cabin crew are knowledgeable to answer passengers travel-related questions Assurance
18 TGs documents associated with services are informative and appealing (such as pamphlets and magazines)
Tangibles
19 Services provided have a ldquoThai Touchrdquo Empathy
20 Cabin crew are quick to respond to passengersrsquo requests Responsiveness
VITAE
61
VITAE
Name Wilas Mankongvanichkul
Date of Birth February 14 1980
Place of Birth Bangkok
Address 688 Soi Phaholyothin 32 Chankasem Jatuchak
Bangkok 10900
Present Occupation Cabin Crew
Thai Airways International Public Company Limited
89 Vibhavadi Rangsit Road Bangkok 10110
Education Background
2010 Master of Art (Business English for International
Communication)
Srinakharinwirot University
2001 Bachelor of Business Administration Bangkok University
1997 High School Saint Dominic School
- Cover
- Abstract
- Chapter 1
- Chapter 2
- Chapter 3
- Chapter 4
- Chapter 5
- Bibliography
- Appendix
- Vitae
-

8
2 Non-food items comprising an extensive list which may include newspapers
blankets toilet bags headsets for aircraft audio-visual systems
3 Duty-free goods for passengers to purchase on the aircraft
4 Equipment required by cabin crew for providing service The service
equipment includes tea and coffee-making equipment first aid kits etc
Nevertheless the quality of a service package not only depends on food drinks
and facilities on the aircraft such as newspapers blankets toilet bags headsets etc but it
also depends on the skills and knowledge of cabin crew who serve passengers to create
positive attitudes toward the airline and to enhance the brand loyalty
In conclusion the aviation industry in Thailand is very competitive Low-cost
airlines have increasingly become more popular because of the economic crisis To
compete with those budget airlines TG needs to find ways to retain and attract
passengers
22 Customer Satisfaction
It is impossible for any business to sustain itself without customers Accordingly
factors contributing to any successful business mainly result from customer satisfaction
customer loyalty and customer retention One important factor in determining the
likelihood of success and profits of an organization is customer satisfaction Customer
satisfaction results in customer loyalty When there is customer loyalty the customer
retention rate is high and good business results tend to follow
Customer satisfaction a business term is a measure of how products and services
supplied by a company meet or surpass customersrsquo expectation In a competitive
marketplace where businesses compete for gaining more customers customer satisfaction
9
is seen as a key performance indicator within a business and has increasingly become a
key element of business strategy (Gitman amp Carl 2005)
Hennig-Thurau and Klee (1997) state that customer satisfaction with a companys
products or services is often regarded as the key to the companys success and long-term
competitiveness Customer satisfaction is also often viewed as a central determinant of
customer retention A high customer satisfaction level yields several benefits It
heightens customersrsquo loyalty and prevents customersrsquo complaints lowers customersrsquo
price sensitivity reduces the costs of failed marketing and of new customer creation
reduces operating costs due to an increase in number of customers improves the
effectiveness of advertising and enhances business reputation (Fornell 1992) However
specialists on satisfaction indicate that the main factors determining customer satisfaction
are the customersrsquo own perceptions and expectations of service quality (Zeithaml amp
Bitner 2000)
Customersrsquo expectation and perception
Customersrsquo perception of service quality depends on the degree of the service that
meets the customersrsquo expectations service providers must know how to shape those
expectations The messages from service providers contribute significantly to expectation
development because the service is mostly regarded as intangible and people cannot
readily observe for themselves what to expect It is critical that the service provider gives
information to customers as clearly and accurately as possible before the customers make
a purchase Organizations that create unrealistic expectations in an effort to sell a service
are likely to find their customersrsquo satisfaction low Those unhappy customers will tell
others and the credibility of the business will be damaged (Gilbert 1999)
10
To ensure highly perceived quality and to maintain loyal customer base service
providers need to be accurate and reasonable about what they lead customers to expect
They also need to do a good job in the areas of reliability assurance tangibles empathy
and responsiveness It is difficult for companies to get ahead of the competition and the
nature of competition in the service industry is more difficult to protect from imitation
Competitors are increasingly forced to imitate the best features of one another
Therefore any competitors who try to invest more energy and resources in building
strong service quality are most likely to be winners (Gilbert 1999)
Factors Affecting Consumers Expectation
The key factors influencing consumersrsquo view on service quality include word of
mouth personal needs customersrsquo past experience and external communication
(Parasuraman et al 1985)
Word of mouth is particularly important because when consumers are satisfied or
dissatisfied with the service they are likely to share it with their friends Service is
generally classified as intangible Customers cannot actually ldquoseerdquo the service until they
experience it Before making a purchase customers need to find out as much information
as possible so as to make a good decision Word of mouth is a means to make a
consumer feel interested or uninterested in the service
Personal needs are considered another important factor They deal with the
motives that determine the nature and strength of what a consumer expects from a
service
Meanwhile past experience refers to what consumers have learned through their
personal interaction with a service provider It is particularly important in shaping
customersrsquo expectations
11
The last factor is external communication comprising such as direct sale and
advertisement in order to communicate and position a service through messages which
can influence consumer perceptions
In summary each factor can individually or harmoniously affect consumersrsquo
purchasing decision Customer satisfaction is a key to business success In order to make
customers satisfied a company needs to understand their expectations and perception by
studying the factors that affect their purchasing decision
23 Service Quality
A search for the definition of ldquoqualityrdquo has yielded inconsistent results Quality
has been variously defined as fitness for use in the product which successfully serves the
purpose of the user during usage (Juran amp Gryna 1974) In addition Zeithaml et al
(1990) state that ldquoqualityrdquo is what exceeds the customersrsquo expectation of the service
On the other hand quality is a characteristic of thoughts and statements believed
to be taken for granted if an explanation of quality is going to be both false and true
precisely (Pirsig 1987) Pirsig also says that since definitions derive from abstract and
formal thinking quality cannot be defined it is impossible to define quality because
quality can never be considered independently but only in relation to what is perceived
Measuring Quality in Service
Parasuraman et al (1985) point out that service quality is more difficult for the
consumers to evaluate than the product quality Perception of service quality results from
a comparison of customer expectations with actual service performance Quality
evaluations are made not only from the outcome of a service but also from the ldquoprocessrdquo
12
of service delivery and the customers have fewer tangible characters to be measured
physically when purchasing services than when purchasing products (Gronroos 1978)
Service quality is the degree of how well the service level delivered matches
customer expectations Delivering quality service means that the service provider needs
to follow customer expectations on a consistent basis (Lewis amp Booms 1983)
To conclude three underlying service quality themes can be drawn from the
discussion as follows
Service quality is more difficult for the customer to evaluate than product quality
Service quality perceptions result from a comparison of consumer expectations
with actual service performance
Quality evaluations are not made solely on the outcome of a service They
involve evaluations of the process of service delivery
The Benefits of Service Quality
The benefits of service quality comprise four areas as follows (Kotler 2000)
Customers Retention High quality builds loyal customers and creates positive word of
mouth which is an important factor in purchase decision This can determine customer
satisfaction which affects repeat business If a customer is happy with an existing firm it
is difficult to convince him or her to move to another
Avoidance of Price Competition A firm with a reputation for high quality has
a much stronger competitive position than one with a reputation for poor quality Price-
cutting by a competitor will not be enough to encourage a client to switch Good quality
is more powerful to remain competitive
13
Retention of Good Employees Employees appreciate working in operations
that are well run and produce quality products They do not enjoy receiving customer
complaints Also turnover and loss of employee morale are listed as costs of poor quality
manpower When an operation has good quality it can retain good employees And at
the time business expansion is needed recruiting is easier and training cost is reduced
Reduction of Costs The quality cost includes internal costs external costs and
quality system costs Internal costs are those associated with correcting problems
discovered by the firm before products reached customers External costs are related to
errors that the customers experience They can be very expensive when the customers
decide not to return because of a service problem Then the promotional and advertising
costs or external costs are necessary to be spent to create the company image in order to
make customers come back and win brand loyalty for the company in the end However
the company needs to check the service quality through customersrsquo feedback periodically
to avoid problems
Although the quality service system does not come without costs it is usually less
than those internal and external costs resulting from poor quality service Some examples
of the costs of a quality system include customer service audits trainings management
meetings with employees and customers and introduction of a new technology (Kotler
Bowen amp Makens 1999)
To sum up it is necessary for a service company to know the service quality level
The quality needs to be evaluated by comparing customer experience with service
performance Once a service company reaches a good quality level a company will
retain its customers easily be away from price wars keep and get good employees and
reduce some operation costs
14
Thai Airways In-flight Service Quality
The latest airline evaluation in 2009 by Skytrax from United Kingdom which is a
research organization focused on in-flight services revealed that TG got the official 4-star
ranking for its product and service quality This honor is awarded to airlines which
deliver a good quality performance
Skytrax also disclosed that for short travels or domestic routes two traveling
classes are business class and economy class The overall evaluation of the domestic
route showed that TGrsquos business class was rated excellent (5-star) in two articles which
are ldquowashroom cleanlinessrdquo and ldquonewspaper amp magazinerdquo in terms of ldquoonboard productrdquo
category Meanwhile TG also got the highest rank in terms of ldquoservice efficiencyrdquo and
ldquoresponding to requestsrdquo in ldquocabin staff servicerdquo categories In addition in the economy
class TG could do superbly in three articles of cabin staff service which were ldquoservice
efficiencyrdquo ldquoenthusiasm and attituderdquo and ldquofriendliness and hospitalityrdquo (ldquoTHAI
AIRWAYS INTL Official 4-Star Ranking of Product and Service Qualityrdquo 2009)
In conclusion TG has been recognized internationally however it still needs to
move ahead The quality ranking is useful for TG to realize that the company needs to
develop its products and services in all categories in order to step up and well-prepared
for competitions in the future
24 SERVQUAL Model
SERVQUAL is an instrument used for measuring how customers perceive the
quality of the service This instrument is based on five dimensions and on a comparison
between customersrsquo expectations of how the service should be performed and their
experiences of how the service is actually performed Usually 20 attributes are used to
describe the five dimensions and participants are asked to state what they expect from the
15
service and how they perceive the service on a five-point scale from ldquoexcellentrdquo to
ldquopoorrdquo Based on the difference between expectations and experiences over the 20
attributes an overall quality score can be calculated The higher the score shows that
experiences are below expectation the lower the perceived quality (Parasuraman amp
Berry 1991)
SERVQUAL consists of five dimensions (RATER) as follows (Parasuraman et
al 1985)
Reliability This means that a service firm provides its customers with accurate
service the first time without making any mistakes and delivers what it has promised to
do by the time that has been committed
Assurance This means that employeesrsquo behaviors give customers confidence in
the firm and that the firm makes customers feel safe It also means that the employees are
always courteous and have the necessary knowledge to respond to customers questions
Tangibles This dimension relates to the appeal of facilities equipment and
materials used by a service firm as well as to the appearance of service employees
Empathy This means that the firm understands the customersrsquo problems and
performs in their best interests as well as giving customers individual personal attention
and having convenient operating hours
Responsiveness This means that employees of a service firm are willing to help
customers and respond to their requests as well as to inform customers when service will
be provided and give prompt service
16
Application of SERVQUAL Model in Hospitality Business
The SERVQUAL instrument has been used to assess the quality of a wide range
of services in the United States such as financial service operations telephone services
repair and maintenance services (Parasuraman et al 1988) and other professional
services (Bojanic 1991) Fick and Ritchie (1991) have employed the SERVQUAL
instrument to compare services provided by various types of organizations within the
travel and tourism industry Oberoi and Hales (1990) have examined the SERVQUAL
approach as a basis for measuring the quality of the conference hotel products Many
researchers of other service businesses believed that ldquoSERVQUALrdquo is a concise multiple-
item scale with good reliability and validity (Buttle 1996 Lages amp Fernandes 2005)
In Thailand Boontaganon (2002) studied the service quality of fast food
restaurants in Bangkok by using SERVQUAL The study examined the differences in
service quality expectations and perceptions based on demographic characteristics
including gender age occupation education and income level 360 questionnaires were
distributed to people who had just exited from fast food outlets in Bangkok The results
showed significant differences in service quality of customer expectations and
perceptions which indicated the unacceptable service quality delivered by fast food
restaurants in Bangkok
Suthirungkul (2003) studied the customer expectations and perceptions of service
quality of the Clark Hatch Fitness Center at Silom Road Branch Bangkok The objectives
of the study were to identify the SERVQUAL dimensions that customers both local and
foreign used to evaluate The Clark Hatch Fitness Center to study the customer
expectations towards the services quality that should be provided and to evaluate the
perceptions of service quality that customers obtained after using service The
questionnaire was used as a tool for collecting the data 277 Thai and foreign members of
17
the Clark Hatch Fitness Center at Silom Road Branch were the research participants The
results of the study were that there existed gaps between expectations and perceptions in
terms of the five SERVQUAL dimensions and the demographic characteristics had
influenced the gap scores
In short SERVQUAL is an effective measuring tool This tool has widely been
used in many previous studies in hospitality business both domestically and
internationally
25 Demographic Variables
In general business sector market segmentation is often based on demographic
profiles (Reid amp Bojanic 2001) in order that marketers can choose the proper service
segmentation strategies to satisfy different target market segments Demographics are the
variables about consumersrsquo wants preferences and usage rates are often associated with
demographic variables Moreover the demographic variables are easier to measure
(Kotler 2000) Important demographics are as follows
1 Gender There is no logical reason to expect biology to account for this
difference between the sexes The explanation may be in socialization differences and
personality disposition Feminine gender identity is characterized by traits such as
expensiveness and emotionalism and other orientation while masculine gender identity is
characterized by independence activity and self orientation (Kotler amp Scheff 1997)
2 Age Consumersrsquo wants and abilities change with age People buy different
goods and services over their lifetime Peoplersquos tastes in different products and services
are also related to age (Kotler 2000)
18
3 Occupation This variable reflects values attitudes taste and lifestyle
Occupation and income tended to be closely correlation on almost cause-and-effect
relationship (Schiffman amp Kanuk 1994)
4 Income Consumers form a purchase intention based on such factors and
expected family income price and expected benefits from the product and services
(Kotler 1997)
5 Purpose of Travel The purpose of travel measure the frequent distribution
The purposes of travel are for such as business holiday visiting friends and relative and
others (ldquoTravel Planningrdquo 2010)
6 Frequency of Travel A critical factor in predicting the demand for tourism
within a certain period of time is the number of trips individuals take New touristsrsquo
behavior shows a tendency toward more frequent travel (Alegre amp Pou 2006)
To recap the demographic profiles play a significant role in planning service to
meet passengersrsquo satisfaction In airline business six features of the demographics were
included in this study
26 Previous Studies on Airline Passengersrsquo Satisfaction
In an airline business the major revenue of a company comes from the number of
passengers rather than a total sum of cargo service aircraft maintenance or catering
supply all together Studies on airline passengersrsquo satisfaction are numerous as the
following examples
Gilbert and Wong (2003) identified the service dimensions that matter most to
current airline passengers The study measured and compared differences in passengersrsquo
expectations of the desired airline service quality in terms of reliability assurance
19
facilities employees flight patterns customization and responsiveness The primary data
were collected from passengers departing from Hong Kong airport Regarding the
service dimension expectations it was found that there were no statistically significant
differences between passengers who made their own airline choice (decision makers) and
those who did not (non-decision makers) However there were significant differences
among passengers of different ethnic groups nationalities as well as among passengers
who traveled for different purposes such as business holiday and visiting friends or
relatives
The findings also indicated that passengers consistently ranked lsquoassurancersquo as the
most important service dimension It showed that the passengers were concerned about
the safety and security aspects and this also indicated why there had been such a
downturn in demand as this study was conducted just prior to the World Trade Center
incident on September11 2001
In Thailand Somwang (2008) assessed the passengersrsquo views of service quality in
Thai low cost airlines The research was based on the principle that passengers evaluated
airline service quality through a comparison between their experiences and expectations
over a number of quality attributes The study evaluated passengersrsquo perceived service
quality of Thai low cost carriers based on the SERVQUAL instrument The findings
indicated that the passengersrsquo expectations on service quality were higher than what they
had actually experienced Further analysis showed that female passengers had lower
perceived service quality than male passengers The findings also revealed that higher
monthly income had greater differences with respect to expectations and perceptions than
lower income respondents Furthermore passengers usually traveled with low cost
carriers for three main purposes which were for leisure visiting friends or relatives and
business
20
In brief the previous studies explored the satisfaction of airline passengers by
using SERVQUAL instrument to measure the service quality The results above found
out the differences between customersrsquo expectations and perceptions The findings of a
study in Hong Kong revealed the passengersrsquo satisfaction on the dimensions of the
service quality Meanwhile a study in Thailand implied some findings about the
demographic profiles resulting in service quality Studies on service quality help improve
business organizations retain customers and attract new customers
CHAPTER THREE
METHODOLOGY
This chapter consists of four sections participants of the study research
instrument procedures of the study and data analysis
31 Participants of the Study
One hundred and fifty Thai passengers 75 males and 75 females who took the
TG Bangkok - Chiangmai route were randomly chosen as participants for the study
Since there are about 150 passenger seats in each flight the researcher randomly acquired
a sample size of 10 percent of the overall passengers from the ten flights totaling 150
Thai people are the main group of passengers who travel domestically over the year The
researcher therefore decided to select only the Thai passengers as the participants for the
study Also so as to cover various types of passengers the researcher included flights of
different time within a day (as shown in a following part of this chapter) for a reason that
passengers with some specific purposes chose to travel at some specific time For
example business people might prefer an early morning flight rather than a later-in-the-
day one
TGrsquos Bangkok ndash Chiangmai route has been considered one of the most frequent
domestic routes (THAI 2009) TG operates ten flights daily from Bangkok to
Chiangmai The researcher consequently chose this route for this research work to
assess the passengersrsquo satisfaction with TGrsquos service quality
The study was conducted in early March when it was still in the high season for
travels to the northern province of Thailand Fifteen passengers from each of the ten
flights of the Bangkok - Chiangmai route were asked to fill out the questionnaire at the
22
end of the on-board service while the plane was approaching Chiangmai its destination
All the 150 completed questionnaires were obtained as planned
32 Research Instrument
A questionnaire in Thai was used for data collection The questionnaire was
divided into three parts The first part was about the respondentsrsquo demographic profile
since consumersrsquo needs preferences and personalization are often associated with
demographic factors (Kotler 2000) Six demographic characteristics related to in-flight
service (Cheosakul 2004) consisting of gender age occupation monthly income
purpose of travel and travel frequency with THAI were demographic issues of the survey
The second part comprised questions about passengersrsquo satisfaction with the service
during the flight This part of the questionnaire was based on the SERVQUAL
instrument for measuring customersrsquo satisfaction in five dimensions of service reliability
assurance tangibles empathy and responsiveness (Parasuraman et al 1985) The last
part comprised a question and a blank space provided for suggestions on TGrsquos service
quality
33 Procedures of the Study
The questionnaire was initially approved by the researcherrsquos masterrsquos project
advisor and two specialists a TG in-flight service manager and a SWU lecturer Then a
pilot study was conducted to ten passengers to check for content reliability the
appropriateness of the number of questions and language used in the questionnaire As
the researcher included all the ten flights of TGrsquos Bangkok - Chiangmai route in the
study the tried-out questionnaire was randomly distributed to ten TG passengers (5 males
and 5 females) on each flight of the aforementioned route on the same day in February
23
2010 Also since this study was about onboard service the questionnaire was distributed
to the participants after the in-flight service was completed and before the plane landed
After that the questionnaire was adjusted and prepared for the actual survey
The revised questionnaire was eventually distributed to 150 participants in ten
consecutive days in early March 2010 Fifteen passengers in each Bangkok -
Chiangmai flight per day were randomly asked to fill out the questionnaire after the
completion of in-flight service
The plan below showed the ten flights of for the survey each flight for a day to
make sure that the data gained were reliable
BKK-CNX Flight (TG) Flight Schedule (Departure-Arrival)
TG100 0615-0725
TG102 0750-0910
TG104 0910-1030
TG106 1020-1140
TG110 1250-1400
TG112 1400-1510
TG114 1540-1650
TG116 1715-1825
TG120 1900-2010
TG122 2130-2240
34 Data Analysis
The data acquired from the questionnaires were analyzed in three sections
demographic profile of passengers level of passengersrsquo satisfaction with TGrsquos service
and the relationship between demographic profile and passengersrsquo satisfaction based on
24
Likert scale The 5-point Likert scales were used to rate the level of satisfaction as shown
in Table 1 below
Table 1 Intervals of Satisfaction Level (Poonlarbtawee 1987)
The interpretation of the scales in this study is as follows
Rating
Scale
Level of
Agreement Disagreement
Satisfaction
Level
Mean Score
5 Strongly agree Excellent 451-500
4 Agree Good 351-450
3 Uncertain Average 251-350
2 Disagree Fair 151-250
1 Strongly disagree Poor 100-150
The researcher picked up lsquothe high grouprsquo and lsquothe low grouprsquo of each
SERVQUAL dimension to present the relationship between the participantsrsquo
demographic profile and their satisfaction As the data gained from the highest number of
the participants or the high group was the major point that the researcher relied on focus
was on the majority opinion At the same time the data gathered from the lowest number
of the participants or the low group should not be overlooked because each and all
passengers are important for TG and in the high competitive airline market it is necessary
to retain each and every passenger so as to grow far in the aviation business
The results were presented in terms of percentages and mean scores in the form of
tables and a bar chart These fundamental statistic methods were proper in this study
25
because percentages and mean scores are considered the basic statistics used for data
analysis and presentation Also the general public can easily understand the
interpretation of the data Another reason was that the sample group of this study
comprised only 150 TG passengers The researcher therefore decided to apply the
aforementioned statistics in this research Discussion of the results was also offered
CHAPTER FOUR
FINDINGS
This chapter describes the findings of the study consisting of the demographic
data of the participants level of their satisfaction with TGrsquos service quality relationship
between the demographic data and five dimensions of SERVQUAL instrument and the
uncovers to the last question on the questionnaire including suggestion
41 Demographic Data
The demographic data of TGrsquos research participants in terms of age occupation
monthly income purpose of travel and frequency of travel are presented in Tables 2- 6
below
Table 2 Participantsrsquo Age
Age No of Participants Percentage ()
Under 20 years
21-40 years
41-60 years
Above 60 years
8
85
45
12
53
567
300
80
Total 150 100
Regarding the age group the highest number of the passengers was 20-40 years
old or 567 30 of them were 46-60 years old and 8 were above 60 years old Only
53 were under 20 years old
27
Table 3 Participantsrsquo Occupation
Occupation No of Participants Percentage ()
Government official State enterprise employee
Business employee
Business owner
Student
Retiree
Others
22
63
37
13
9
6
147
420
247
86
60
40
Total 150 100
In terms of occupation the highest number of the participants was business
employees (42) followed by business owners (247) government officials or state
enterprise employees (147) students (86) retirees (6) and other occupations (4)
respectively
Table 4 Monthly Income
Monthly income (baht) No of Participants Percentage ()
Up to 20000
20001- 40000
40001 - 60000
60001 and above
58
72
11
9
386
480
74
60
Total 150 100
For the income the highest number of the participants earned 20001-40000 baht
monthly (48) followed by those with a monthly income of up to 20000 baht (386)
28
of 40001-60000 baht monthly (64) and of 60001 baht and above monthly was the
lowest (6)
Table 5 Purpose of Travel
Purpose of travel No of Participants Percentage ()
Business trips
Holidays
Visits
Others
41
79
27
3
273
527
180
20
Total 150 100
Regarding the purpose of travel the highest number of the passengers traveled via
TG on holidays (527) followed by those who traveled on business trips (273)
Meanwhile those who made a visit were at 180 and who traveled with other purposes
were at 2
Table 6 Frequency of Travel
Frequency in traveling with THAI
(during the last 12 months)
No of Participants Percentage ()
First time
2-3 times
4-10 times
More than 10 times
39
99
10
2
260
660
67
13
Total 150 100
29
The last demographic data derive from the frequency in traveling with THAI
66 of the participants indicated that they traveled 2-3 times during the last 12 months
26 traveled for the first time while 67 for 4-10 times and 13 for more than 10
times during the last 12 months
In conclusion the demographic data shown in the tables above indicated that lsquothe
high grouprsquo comprised the following characteristics The age group of the majority
number of the participants ranged from 21-40 years (567) Most of them were business
employees (42) The highest number of the passengersrsquo monthly income was around
20000 ndash 40000 baht per month (48) The majority of the passengers traveled on
holidays (527) by TG 2-3 times in the past 12 months (66)
Meanwhile lsquothe low grouprsquo was found having the following characteristics The
lowest number of the research participants was under 20 years old or 53 Only 47 of
the participants had other kinds of occupation which were not indicated on the
questionnaire while only 6 of the participants earned 60001 baht or above monthly
2 of the participants traveled on other purposes besides those shown on the
questionnaire Lastly 13 of the passengers were those who traveled by TG more than
10 times in the past 12 months
42 Level of Passengersrsquo Satisfaction
Figure 1 below is the conclusion from the second part of the questionnaire The
150 participants were asked to rate the level of service quality that they perceived from
the TGrsquos domestic flights on Bangkok - Chiangmai route The questionnaire was divided
into five dimensions of SERVQUALrsquos (Parasuraman et al 1985) service quality which
comprised reliability assurance tangibles empathy and responsiveness The scales 1 to 5
ranged from lsquostrongly disagreersquo to lsquostrongly agreersquo
30
0
5
Reliability Assurance Tangibles Empathy Responsiveness
280
345 334307
269
SERVQUAL Dimension
Figure 1 Overall Level of Participants Satisfaction
Mean scores
Figure 1 shows the average mean score of all 150 passengersrsquo satisfaction on five
dimensions of service quality ranging from the mean scores of 345 to 269 The results
revealed that the most important service quality dimension for the whole samples group
of passengers was assurance ( 345) followed by tangibles ( 334) empathy ( 307)
reliability ( 28) and responsiveness ( 269) respectively The overall average mean
was 307
43 Passengersrsquo Satisfaction Level in Relationship with Their Demographic Data
This section shows the relationship between the demographic data (age
occupation monthly income purpose of travel and travel frequency) of the participants
and their satisfaction with the service quality of TGrsquos in-flight service
The researcher focused on each category of demographic characteristics of two
major groups a group with the highest score and the other with the lowest score In fact
the most important data were the majority opinion of the sample group In other words
for this study it was lsquothe high grouprsquo However the researcher as a TG cabin crew gave
importance to the low group as well since each and every passenger is significant to TG
x
x x x
x x
31
business particularly in the high competitive market of airline business The researcher
was interested to know what the passengers in the lsquolow grouprsquo thought about the in-flight
service and what their feedback was
The following tables (Tables 7-11) illustrate the relationship between each
dimension of the demographic data and the SERVQUAL service assessment tool and the
following symbols are applied in the tables below
lsquoNrsquo means the number of the participants
lsquo rsquo means the mean score
lsquoThe high grouprsquo means the group that comprises the highest number of participants
lsquoThe low grouprsquo means the group that comprises the lowest number of participants
Table 7 Relationship between the Participantsrsquo Age and their Satisfaction with In-flight
Service
SERVQUALrsquoS
RATER
Average
Mean Score
of All Groups
The High Group
(Age 20-40 Yrs Old)
N = 85567
The Low Group
(Age Under 20 Yrs Old)
N = 853
Mean Score of Each Group
Reliability 280 278 270
Assurance 345 378 335
Tangibles 334 331 328
Empathy 307 309 314
Responsiveness 269 267 290
Table 7 reveals the connection between the participantsrsquo age and the five
dimensions of the SERVQUAL instrument The high group had higher mean scores for
x
32
three dimensions than the low group In other words the participants with an age range
of 20-40 years were more satisfied with TGrsquos service quality in terms of reliability
assurance tangibles than those who were under 20 years old Meanwhile the low group
had higher mean scores for two dimensions than the high group This means the
participants who were lower than 20 years old were more satisfied with the in-flight
service in terms of empathy and responsiveness than those whose ages ranged from 20-40
years
Interestingly it was found that both groups have a lower mean score for the
reliability dimension ( 278 and 270) than the average mean score of all the age groups
in this study ( 28)
Table 8 Relationship between the Participantsrsquo Occupation and their Satisfaction with In-
flight Service
SERVQUALrsquoS
RATER
Average
Mean Score
of All Groups
The High Group
(Business Employee)
N = 63420
The Low Group
(Others)
N = 640
Mean Score of Each Group
Reliability 280 275 284
Assurance 345 347 348
Tangibles 334 331 336
Empathy 307 310 305
Responsiveness 269 264 277
Table 8 illustrates the connection between the participantsrsquo occupations and the
five dimensions of the SERVQUAL instrument The low group had higher mean scores
x
x
33
for almost all the dimensions of SERVQUALrsquos RATER than the high group except for
one dimension In other words the participants who worked as business employees were
less satisfied with TGrsquos service quality in terms of reliability assurance tangibles and
responsiveness than those whose occupations were not specified in the questionnaire
Empathy was the only dimension of service quality that the participants who were in the
high group were satisfied with
Table 9 Relationship between the Participantsrsquo Income and their Satisfaction with In-
flight Service
SERVQUALrsquoS
RATER
Average
Mean Score
of All Groups
The High Group
(20001-40000)
N = 72480
The Low Group
(60001 and above)
N = 960
Mean Score of Each Group
Reliability 280 273 285
Assurance 345 349 350
Tangibles 334 332 321
Empathy 307 301 325
Responsiveness 269 262 273
Table 9 indicates the connection between the participantsrsquo monthly income and
the five dimensions of the SERVQUAL instrument The low group had higher mean
scores for almost all the dimensions of RATER than the high group except for one
dimension In other words the participants who earned monthly income of 20001 ndash
40000 baht were less satisfied with TGrsquos service quality in terms of reliability assurance
empathy and responsiveness than those who earned monthly income of 60001 baht and
34
above The tangibles dimension was the only service quality issue that the participants
who were in the high group were satisfied with
Table 10 Relationship between the Participantsrsquo Purpose of Travel and their Satisfaction
with In-flight Service
SERVQUALrsquoS
RATER
Average
Mean Score
of All Groups
The High Group
(Holidays)
N = 79527
The Low Group
(Others)
N = 320
Mean Score of Each Group
Reliability 280 279 285
Assurance 345 353 349
Tangibles 334 335 338
Empathy 307 308 312
Responsiveness 269 270 275
Table 10 reflects the connection between the participantsrsquo purpose of travel and
the five dimensions of the SERVQUAL instrument The low group had higher mean
scores for almost all the dimensions than the high group except for one dimension In
other words the participants who traveled on holidays were less satisfied with TGrsquos
service quality in terms of reliability tangibles empathy and responsiveness than those
whose purpose of travel were not specified in the questionnaire Assurance was the only
dimension of service quality that the participants who were in the high group were
satisfied with
35
Interestingly it was found that both groups has a higher satisfaction level for the
assurance tangibles empathy and responsiveness dimensions than the average mean
scores of the whole sample group
Table 11 Relationship between the Participantsrsquo Frequency of Travel with THAI and their
Satisfaction with In-flight Service
SERVQUALrsquoS
RATER
Average Mean
Score of All
Groups
The High
Group
(2-3 timesyear)
N = 99660
The Low Group
(more than 10
timesyear)
N = 213
Mean Score of Each Group
Reliability 280 281 295
Assurance 345 346 360
Tangibles 334 335 343
Empathy 307 308 321
Responsiveness 269 270 292
Table 11 presents the connection between the participantsrsquo frequency of travel
with THAI and the five dimensions of the SERVQUAL instrument The low group had
higher mean scores for all the dimensions of RATER than the high group In other
words the participants who traveled 2-3 times in the last 12 months were less satisfied
with TGrsquos service quality in terms of reliability assurance tangibles empathy and
responsiveness than those whose frequency of travel were more than 10 times in the last
12 months
36
Interestingly it was found that both groups has a higher satisfaction level for all
the five RATER dimensions than the average mean scores of the whole sample group in
this study
44 Other Comments
The last part of the questionnaire was designed to ask whether the participants
would continue using TGrsquos service The findings disclosed that 142 participants or
946 indicated that they would while 8 of them or 54 declined
Also at the end of the questionnaire there was a blank space for the participants to
freely express their own ideas and suggestions on TGrsquos service However only 7
participants or 46 gave suggestions regarding the in-flight service Four of the
participants were dissatisfied with the flavor of the snacks provided on board One
complained that it was not cool enough in the cabin while one was upset for not being
granted for a request for a blanket The last one commented that the passengerrsquos seat was
not comfortable
In summary the passengersrsquo satisfaction level of the service quality in connection
with their demographic data was introduced Five out of the six demographic
characteristics the participantsrsquo age occupation monthly income purpose of travel and
frequency of travel were analyzed in connection with the five dimensions of SERVQUAL
instrument reliability assurance tangibles empathy and responsiveness It was observed
that there were some connection between these two matters in various ways as earlier
discussed Lastly it was found that one hundred and forty-two participants would
continue using TGrsquos service while the rest refused Only seven of all the participants or
46 gave some comments on the open-ended suggestion part
CHAPTER FIVE
CONCLUSION AND DISCUSSION
This chapter presents the conclusion discussion limitations of the study and
recommendations for further studies
51 Conclusion
This research aimed to examine the service quality provided by Thai Airways
International on its domestic flights One hundred and fifty passengers who traveled by
TG on the Bangkok - Chiang Mai route were the research participants The SERVQUAL
instrument was used as an instrument for data collection in the survey This instrument
was based on five determinants proposed by Panasuraman etal (1985) in terms of
reliability assurance tangibles empathy and responsiveness This research was also
conducted on the demographic characteristics comprising gender age occupation
monthly income purpose of travel and frequency in traveling and the relationship of these
characteristics except the gender with the passengersrsquo satisfaction with TGrsquos in-flight
service quality The questionnaires were distributed in early March 2010
The results showed that all the participantsrsquo satisfaction based on the five
dimensions was at the average level The highest level of passengersrsquo satisfaction was
placed on the assurance dimension followed by tangibles and empathy dimensions
accordingly The two lowest levels of the passengersrsquo satisfaction were placed on the
responsiveness and reliability dimensions
In addition a summary of the demographic characteristics showed that the high
group or the group with the highest number of participants was business employees The
highest number of the participants was between 21-40 years old The highest number of
38
the participantsrsquo income ranged from 20000 ndash 40000 baht monthly Also the high
grouprsquos purpose of travel was to go on holiday Lastly the highest number of the
participants traveled via TG only 2-3 times during the past 12 months
Meanwhile the low group or the group with the lowest number of participants
was passengers with other kinds of occupations which were not specified on the
questionnaire The low group of the participants was under 20 years old The low group
of the participantsrsquo income ranged from 60001 baht monthly or higher Also the low
group revealed that they traveled via TG for other purposes which were not indicated on
the questionnaire Lastly the passengers who traveled via TG more than 10 times during
the past 12 months belonged in the low group
It has also been discovered that as a whole both groups the high and low groups
were in the same direction in their satisfaction with the five dimensions of service quality
The two groups were satisfied with the service quality dimensions in terms of assurance
at the highest level followed by tangibles empathy reliability and responsiveness
respectively
However when analyzing each demographic characteristic the participants who
were under 20 years old rated the responsiveness dimension higher than the reliability
dimension Also for those participants whose income was around 60001 or higher the
empathy dimension was rated higher than the tangibles Regarding the occupation
business people were satisfied with the reliability and responsiveness dimensions at a
very low level Meanwhile the participants who traveled via TG on their holidays rated
the assurance dimension at a very high level Lastly frequent fliers who traveled by
THAI more than 10 times were most satisfied with TGrsquos service since they rated all
RATER aspects highly
39
52 Discussion
The findings have revealed the answers to the research questions First the
demographic data of the participants gender age occupation monthly income purpose
of travel and frequency of travel were shown Second the level of the passengersrsquo
satisfaction toward the service quality on Thai Airways Internationalrsquos domestic flights in
terms of the SERVQUAL instrument (Parasuraman et al 1985) reliability assurance
tangibles empathy and responsiveness was disclosed Also the results about the
relationship between the passengersrsquo satisfaction and their demographic data were pointed
out
The results of the survey indicated that out of the five dimensions assurance was
rated at the highest level ( 345) followed by tangibles ( 334) and empathy ( 307)
(See Figure 1) In addition passengers rated their highest satisfaction with the assurance
dimension which included cabin crewrsquos job knowledge their courtesy confidence in their
service ability and safety while traveling It may be because TG cabin crew are well-
trained prior to their actual service work on board This can also ensure passengersrsquo
safety Particularly the safety and security features have been the most concerns of
airline passengers since the 9-11 incidents in New York USA This is why most
customers rated their highest satisfaction with the assurance dimension (Carman 1990)
The findings of this study are also consistent with those of Fick and Ritchie (1991)
who studied the operation of the SERVQUAL instrument in three major tourism sectors
airlines restaurants and ski area services It was revealed that the most important
dimensions of the service were assurance and tangibles If companies were unable to
inspire trust and confidence in their customers and the tangibles are not impressive it
would be difficult for them to achieve a high level of customerrsquos satisfaction (Sachukorn
2000)
x x x
40
Responsiveness is often found as the lowest level of satisfaction among customers
in the service industry It is plausible that the staff were too busy to provide prompt and
good service (Kholthanasep 2001) In this study the results revealed that the
responsiveness dimension was rated at the lowest score ( 269) among the five
dimensions followed by the reliability ( 280) dimension It was highly possible that the
passengersrsquo dissatisfaction occurred when passengers did not receive prompt service from
TG when they needed help
Prompt service is an important factor of customersrsquo expectation Customers
generally rate the service as poor when the speed of service does not meet their
expectations (Kholthanasep 2001) Bojanic and Rosen (1994) examined the nature of the
association between service quality as perceived by consumers and its determinants by
applying SERVQUAL in a restaurant setting They found that customers rated
responsiveness as the lowest satisfaction in their studies Zeithaml et al (1990) explained
that the responsiveness dimension in the SERVQUAL was willingness to help customers
and provide prompt service As the responsiveness dimension in this research comprised
prompt service willingness on-time service and quick response therefore it will be
beneficial to TG if the company can ensure that the service provided by its cabin crew
especially the willingness to help passengers and to provide prompt service meet
passengersrsquo satisfaction
Regarding the relationship between the participantsrsquo demographic data and their
satisfaction with the service quality there are many points of interests to be discussed as
follows
Firstly regarding the relationship of the passengersrsquo satisfaction with the service
and their age those who were under 20 years old rated satisfaction with the
responsiveness dimension ( 290) higher than the reliability dimension ( 270) (See
x
x
x x
41
Table 7) It was possible that young passengers usually gave priority to the dimension of
care and service when compared with that of the service providersrsquo accurate and
dependable manner (Panittumrong 2003) In addition young customers had less
experience in a service and it was difficult to compare the current service with the past
experience consequently they were more satisfied with the service provided than senior
customers
Another point was raised about the participantsrsquo age The study revealed that the
number of the high group with the age range of 21- 40 was at 567 However that of
the second highest group of the participants with the age range of 41-60 was at 30
which was rather high This latter grouprsquos level of satisfaction on the service quality was
also close to the average mean score It was found that the average mean score of the
reliability dimension was 280 while that of the second highest group was 281 the
average mean score of the assurance dimension was 345 while that of the second highest
group was 347 the average mean score of the tangibles dimension was 334 while that of
the second highest group was 335 the average mean score of the empathy dimension and
that of the second highest group was rated at 307 equally and the average mean score of
the responsiveness was 269 while that of the second highest group was 271 In sum if
consider the two groups in terms of the participantsrsquo age one of the high group and the
other with the second high group the results confirmed that the satisfaction level of the
majority of passengers was at the above average level
Secondly regarding the relationship between the participantsrsquo satisfaction and
their occupation business employees who were found at the highest number (42) had
very low satisfaction with the service quality in terms of reliability ( 275) and
responsiveness ( 264) while the mean scores of the whole sample group for these two
dimensions were at 280 and 269 respectively (See Table 8) The findings strongly
x
x
42
correlated with that of Cheaosakul (2004) who studied the consumersrsquo perception of
airline service quality with a focus on occupations It was found that the group of
business employees had the highest score on expectations Cheaosakul (2004)rsquos study
also revealed that business employees did not frequently travel compared with people of
other occupations such as tourists It was found in this particular study that the number of
the participantsrsquo purpose of travel with TG for business trips was only at 273 (See
Table 5) while the highest number of the participants went on holiday was at 52
Cheaosakul (2004) indicated that business people therefore had high expectations than
the other group who traveled more frequently
Thirdly an even more interesting point was raised when comparing the level of
satisfaction of the passengers who were government officials or state enterprise
employees and business owners Although passengers who were government officials or
state enterprise employees came third in terms of participants they are considered
valuable customers of TG since according to the governmentrsquos policy they are required
to take only TG which is a national airline whenever they travel by air There are few
exceptions though However it is almost impossible for Thai government officials who
travel on business trip and are funded by the governmentrsquos budget to fly with other
airliners It was found from this study that government officials were less satisfied with
TG quality service in terms of reliability ( 277) and responsiveness ( 264) than the
average level of which the mean scores of the two dimensions were at 280 and 269
respectively
Another issue of discussion regarding the participantsrsquo occupation business
owners came second It was observed that business owners rated the reliability ( 282)
and responsiveness dimensions ( 270) higher than the average scores of all groups (See
Table 8) It is possible that business owners had more positive attitude with TGrsquos service
x x
x
x
43
than the other groups TG seemed popular among business owners and they were the
most important group of customers This was supported by Suriya (2005) who studied
airline market segments after the launch of the low cost airlines in Thailand Suriya
(2005) identified that merchants or business owners were the major group of customers in
the full-service airline market
Fourthly regarding the monthly income of the research participants of the low
group passengers who earned an income of around 60001 or higher rated the empathy
( 325) dimension higher than tangibles ( 321) dimension (See Table 9) This may
be because the high income passengers sensitively felt that the facilities and equipment
found on their domestic route looked quite old-fashioned due to TGrsquos cost reduction The
company saved costs after the Suvannabhumi airport was closed in the 2008 crisis The
result is similar to the findings of Wangpen and Inthornma (2007) in that high income
customers had higher expectations towards the service It was possible that they had
more tendencies to be dissatisfied with the service failures The two researchers
concluded that passengers with different incomes were satisfied with the services at
different levels because they had different attitudes expectations and abilities to pay for
the service
Fifthly as it was found from this study that the highest score for the purpose of
travel was going on holiday (527) and the participants who were tourists rated the
assurance dimension at the highest level or the mean score of 353 (See Table 10) much
higher than the mean score of the whole group which was at 345 It was rather surprising
that the highest score for the travel purpose was not for business trips It is possible to
explain that this group spent for the travel cost on their own and they might want to make
sure that they chose the best service for themselves The result is parallel with Gabbie
and OrsquoNeill (1997) who examined customer satisfaction in the hotel sector using the
x x
44
SERVQUAL tool This study showed that the holiday guests who paid for
accommodation on their own rated assurance much higher than other dimensions It is
plausible to explain that passengers traveling on their own budget must make sure that
they already chose the service that was worth the money spent
However when analyzing the satisfaction on service quality of the participants
whose purpose of travel via TG was for business it was also found that this business
participants rated the high score for the tangibles dimension at the mean score of 340
compared with the average mean score of all groups of 334 Passengers who traveled on
business included government officials and state enterprise employees were major
customers of TG It was therefore interesting to find out from this study that their
satisfaction score in terms of tangibles or the appearance of physical factors such as
equipment facilities and personnel was above the average score of all groups Although
the score was not much higher the gap was bigger than that of the other RATER
dimensions as seen from the following information the passengers who traveled on
business trip showed their satisfaction on the reliability dimension at the mean score of
281 the assurance dimension at 347 the empathy dimension at 309 and the
responsiveness dimension at 270 while the average of all groups was at 280 345 307
and 269 respectively
The last point that the researcher wanted to point out is that this study revealed
that the participants who traveled more than 10 times for the last 12 months were lowest
in number (13) However it was interesting that these frequent flyers showed the high
rate of satisfaction with TGrsquos in-flight service quality The mean scores in all dimensions
showed the high rate of satisfaction (See Table 11) It is possible that passengers who
traveled very often via TG had high loyalty The brand loyalty made passengers happy in
every feature of service This result however contrasts with Ostrowski et al (1993) who
45
investigated service quality and customer loyalty in the commercial airline industry The
study examined whether the high levels of service quality existed in the US commercial
airline industry and how service quality could potentially lead to customer loyalty The
main results indicated that the levels of perceived service quality were below potential
and that customer loyalty to airlines was low It is plausible to say that the data of the two
studies were different The data collected on two air carriers in USA might have
different characteristics from the demographic information of Thai people and the number
of the participants in the two studies might differ However TG still needs to listen to the
voice of all passengers especially the frequent flyers Even if the number of this sample
group was few every customer is valuable for any firm Also it would be valuable to
implement a relevant strategy to expand this group of passengers since they had a positive
attitude for TG
Interestingly the findings from the last part of the questionnaire also showed that
the majority of the participants (946) showed their willingness to use TGrsquos service in
the future It can plausibly be explained that the participants were satisfied with TGrsquo
service quality at the moderate level ( 307) Their satisfaction with the five dimensions
of SERVQUAL was also moderate They might think that TG is a reliable airline that
they can depend on Thai passengers have confidence and trust in the service of Thai
cabin crew in terms of courtesy Also it is possible that they might not trust the low cost
airlinesrsquo service of the crew
There were only seven remarks on the in-flight service when the participants were
asked to freely give suggestions The tangible dimension problematic Passengers
pointed out about the small size of passengersrsquo seats and the quality of the air-
conditioning system One problem was on the responsiveness dimension which happened
when a passenger asked for a blanket but she was not offered indicating that some of the
x
46
cabin crewrsquos promptness to provide service was still not up to a standard Another
comment was on the flavor of the snacks Although this issue is not directly relevant to
the service it is worthwhile for TG to consider this problem
In conclusion the researcher found both strengths and weaknesses in TGrsquos service
quality Assurance was found the highest satisfaction in the participantsrsquo opinion TG
should maintain the service quality with a focus on this dimension On the other hand
the responsiveness and reliability dimensions were at the lowest satisfaction level among
the five dimensions The company should improve its service quality on these two
dimensions especially with regards to TGrsquos lsquoprompt servicersquo and lsquoproblem solvingrsquo
service to retain its passengers
53 Limitations of the study
This study has some limitations as follows
1 This study was limited to only one domestic route (Bangkok ndash Chiangmai)
Therefore the participants in this study were passengers who traveled only between these
two provinces The results of the study might differ if the study covered another route or
many more routes at the same time Consequently further studies can be conducted for
other domestic destinations such as Phuket and other big cities
2 The research participants were all Thai passengers It would be interesting to
study foreign passengersrsquo satisfaction on TGrsquos in-flight service quality
3 This study focused only on Parasuraman et al (1985)rsquos SERVQUAL
Instrument used to assess the service quality The results might differ if other instruments
were used
47
54 Recommendations for further studies
Further research should be undertaken to validate the results of this study The
researcher has found several opportunities to extend this study as follows
Survey on the lsquoresponsivenessrsquo dimensions
Responsiveness concerns the willingness or readiness of employees to provide
service such as timelines of service and prompt service This dimension was what the
passengers in this study were most concerned about because it was rated as the lowest
level of satisfaction Thus TG should find the countermeasure of how to increase the
level of passengersrsquo satisfaction in the responsiveness dimension
Assessment of the ground service quality
Since this research was conducted on on-board service quality further studies on
ground services such as a reservation or check-in service should be investigated in order
to integrate the results covering every sector of the airline service
Study on passengersrsquo attitude towards the service quality in other airlines
A study on the service quality of other airlines should be conducted in order to
obtain comparative data and find out reasons for their passengersrsquo behavior and attitude
consequently allowing TG to remedy any weak points and increase the number of new
passengers
REFERENCES
REFERENCES
Alegre J amp Pou L (2006) An analysis of the microeconomic determinants of travel
frequency Department of Applied Economics Universitat de les Illes Balears
Bojanic DC (1991) Quality measurement in professional service firms Journal of
Professional Service Marketing 7(2) 27-37
Bojanic D C amp Rosen L D (1994) Measuring service quality in restaurants An
application of the SERVQUAL model Journal of Hospitality Research 18(1)
3-14
Boontaganon W (2002) The study of service quality of fast-food restaurants in Bangkok
using SERVQUAL measurement Thesis MBA (Business Administration)
Bangkok Assumption University Photocopied
Buttle F (1996) SERVQUAL review critique research agenda European Journal of
Marketing 30(1) 8-31
CarmanJ M (1990) Consumer perceptions of service quality An assessment of the
SERVQUAL dimensions Journal of Retailing 69 33-35
Cheaosakul W (2004) Consumers perception of service quality a case study of Thai
Airways International Plc Thesis MBA Bangkok Assumption University
Photocopied
Fick RG amp Ritchie JRB (1991) Measuring service quality in the travel and tourism
industry Journal of Travel Research 30(2) 2-9
Fornell C (1992) A national customer satisfaction barometer the Swedish experience
Journal of Marketing 56 6-21
Gabbie O amp OrsquoNeill M (1997) SERVQUAL and the Northern Ireland hotel sector a
comparative analysis part 2 Managing Service Quality 17(1) 43-49
50
Gilbert DH (1999) Marketing connecting with customers (2nd
ed) Upper Saddle
River NJ Prentice Hall
Gilbert D amp Wong KCR (2002) Passenger expectations and airline services a
Hong Kong based study Surrey Management School Surrey University of
Surrey
Gitman LJ amp Carl DM (2005) The future of business the essentials Mason Ohio
South-Western College Pub
Grifin J (1995) Customer loyalty NY Lexington Book
Gronroos C (1978) A service-oriented approach to marketing of services European
Journal of Marketing 12(8) 588-601
Hennig-Thurau T amp Klee A (1997) The impact of customer satisfaction and
relationship quality on customer retention a critical reassessment and model
development Masterrsquos Project MA (Psychology amp Marketing) Hanover
University of Hanover
Heesawat C (2005) The opportunities and problems in making services more tangible
PhD Dissertation Bangkok Assumption University Photocopied
Juran JM amp Gryna FM (1974) Quality control handbook NY McGraw-Hill
Kholthanasep G (2001) A study of customerrsquos expectations and perceptions of service
quality delivery by first class hotels in Bangkok metropolitan area Thesis
MBA Bangkok Assumption University Photocopied
Kotler P amp Scheff J (1997) Standing room only strategies for marketing the
performing arts Boston Mass Harvard Business School Press
Kotler P (1997) Marketing management analysis planning and control (9th
ed) Upper
Saddle River NJ Prentice Hall
51
Kotler P Bowen J amp Makens J (1999) Marketing for hospitality and tourism (2nd
ed) NJ Prentice Hall
Kotler P (2000) Marketing management the millennium edition (10th
ed) NJ Prentice
Hall
Lages FL amp Fernandes CJ (2005) The SERVQUAL scale a multi-item instrument
for measuring service personal values Journal of Business Research 58(11)
1562-1572
Oberoi U amp Hales C (1990) Assessing the quality of the conference hotel product
London The Service Industries Journal 10(4) 700-722
Ostrowski PL Orsquobrien TV amp Gordon GL (1993) Service quality and customer
loyalty in the commercial airline industry Journal of Travel Research 32(2)
16-24
Palin M (1996) Flight catering transportation and loading (2nd
ed) London Longman
Group Limited
Panittumrong P (2004) The consumerrsquos opinion towards Clark Hatch Fitness Center
Master Project MBA (Management) Bangkok Graduate School
Srinakharinwirot University Photocopied
Parasuraman A Zeitmal VA amp Berry LL (1985) A concept model of service
quality and its implications for future research Journal of Marketing 49 41-50
Parasuraman A Zeitmal VA amp Berry LL (1988) SERVQUAL a multiple item
scale for measuring customer perceptions of service quality Journal of
Retailing 64(1) 64
Parasuraman A amp Berry LL (1991) Marketing services competing through quality
NY The Free Press
52
Pirsig RM (1987) Zen and the art of motorcycle maintenance an inquiry into values
(Mass Market Paperback) NY Bantam Books
Poonlarbtawee K (1987) Statistics for research Bangkok Physic Center Printing
Reid RD amp Bojanic DC (2001) Hospitality marketing management NJ John Wiley
amp Son Inc
Rueangthanakiet P (2008) Memberrsquos satisfaction of fitness service quality a case study
of California Wow Xperience Plc Masterrsquos Project MA (Business English for
International Communication) Bangkok Graduate School Srinakharinwirot
University Photocopied
Sachukorn S (2006) Reception and service excellence Bangkok Saitharn
Schiffman LG amp Kanuk LL (1994) Consumer behavior (5th
ed) London Prentice-
Hall International
Somwang C (2008) An assessment of passengersrsquo views of service quality in Thai low
cost carriers Inter Program MA (Communicative English) Bangkok
Ramkhamhaeng University Photocopied
Suriya K (2005) Airline market segments after low cost airlines in Thailand passenger
classification using neural networks and logit model with selective learning
Faculty of Economics Chiangmai Chiangmai University
Suthirungkul N (2003) The study of customer expectations and perceptions of service
quality of the Clark Hatch fitness center of Silom road branch Bangkok Thesis
MBA (Business Administration) Bangkok Assumption University
Photocopied
Thai Airways International (2008) Traffic program information (Introduction of summer
200809) Bangkok THAI Printing Office
53
Thai Airways International (2009) Traffic program information (Introduction of winter
200910) Bangkok THAI Printing Office
THAI AIRWAYS INTL Official 4-Star Ranking of Product and Service Quality (2009
October) Retrieved February 14 2010 from
httpwwwairlinequalitycomAirlinesTGhtml
Travel Planning (2010 February 12) Retrieved February 12 2010 from
httpwwwsuite101comlessoncfm1848818243
Wangpen N amp Inthornma S (2007) Membersrsquo satisfaction in fitness centers in
Bangkok Thesis MA (Hotel and Tourism Management) Bangkok Graduate
School Naresuan University Photocopied
Zeithaml VA amp Bitner MJ (2000) Services marketing (2nd
ed) NY McGraw Hill
Zeithaml VA Parasuraman A amp Berry LL (1990) Delivering quality service
balancing customer perceptions and expectations NY Free Press
APPENDICES
55
APPENDIX A
แบบทดสอบความพงพอใจของผโดยสารการบนไทย
เรยนทานผโดยสารทเคารพ กระผมนาย วลาศ มนคงวณชกล พนกงานตอนรบสายการบนไทย และนกศกษาปรญญาโท หลกสตรภาษาองกฤษธรกจเพอการสอสารนานาชาต มหาวทยาลยศรนครนทรวโรฒ ไดจดท าแบบสอบถามนเพอเปนสวนหนงของการส ารวจความพงพอใจของผโดยสารทมตอคณภาพงานบรการ เทยวบนภายในประเทศของการบนไทย โดยมงหวงทจะน าขอมลทไดรบจากการส ารวจมาเปนประโยชนตอการสงเสรมสนบสนนการปฏบตงานใหเกดประสทธผล จงขอความกรณาจากทานในการตอบแบบสอบถามทกขอตามขอเทจจรงและความเหนของทาน ขอมลทงหมดเปนความลบ จะใชเพอการวจยเทานน และขอขอบคณในความรวมมอของทาน
helliphelliphelliphelliphelliphelliphelliphelliphelliphelliphelliphelliphelliphelliphelliphelliphelliphelliphelliphelliphelliphelliphelliphelliphelliphelliphelliphelliphelliphelliphellip
ค าชแจง โปรดท าเครองหมาย (x) ลงในชองวาง ทตรงกบค าตอบของทาน
ตอนท 1 ขอมลทวไป
1 เพศ ( ) ชาย ( ) หญง 2 อาย ( ) ตากวา 20 ป ( ) 21-40 ป ( ) 41-60 ป ( ) 60 ปขนไป 3 อาชพ ( ) ขาราชการ รฐวสาหกจ ( ) พนกงานบรษท ( ) ธรกจสวนตว ( ) นกเรยน นกศกษา ( ) เกษยณ ( ) อนๆ 4 รายได เดอน ( ) ตากวา 20000 ( ) 20001- 40000 บาท ( ) 40001- 60000 บาท ( ) 60001 บาท ขนไป 5 จดประสงคการเดนทาง ( ) ธรกจ ( ) พกผอน ( ) เยยมเยยนญาตมตร เพอนฝง ( ) อนๆ 6 ความถในการเดนทางกบการบนไทย (ในรอบ 12 เดอน) ( ) ครงแรก ( ) 2-3 ครง ( ) 4-10 ครง ( ) 10 ครงขนไป
56
ตอนท 2 ความพงพอใจของทานตอการบรการ (5 = เหนดวยอยางยง 4= เหนดวย 3= ปานกลาง 2=ไมเหนดวย 1=ไมเหนดวยอยางยง)
ระดบความพงพอใจ
การบรการของการบนไทย 5 4 3 2 1 1 เมอเจาหนาทสญญาทจะใหบรการทานในเรองใด จะทาตามนนเสมอ
2 การใหบรการของเจาหนาท สรางความเชอมนใหกบทาน
3 อปกรณบนเครองบนมรปแบบททนสมย (เชน จอทว ทนง)
4 บรษทฯกาหนดเวลาการใหบรการบนเครองเหมาะสม
5 เจาหนาทใหบรการทดนบตงแตกาวแรกบนเครอง
6 เจาหนาทมความตงใจดทจะชวยเหลอทาน เมอทานมปญหา
7 ทานรสกปลอดภยเมออยบนเครองบน
8 สงอานวยความสะดวกตางๆบนเครอง มรปลกษณทดงดดใจ (เชน กลองอาหาร) 9 เจาหนาทไมเขาใจความตองการของทาน ในบางกรณ
10 เจาหนาทไมไดระบเวลาในการใหบรการผโดยสารบนเครองทแนนอน 11 เจาหนาทพยายามทางานโดยไมใหเกดขอผดพลาด
12 เจาหนาทปฎบตงานดวยความสภาพเสมอ
13 เจาหนาทแตงกายเรยบรอยและดด
14 บรษทฯใหความเอาใจใสกบผโดยสารเปนรายบคคล
15 บางครงเจาหนาทไมเตมใจทจะใหบรการผโดยสาร
16 บรษทใหบรการทานตรงเวลาทกาหนด
17 เจาหนาทสามารถใหขอมลเกยวกบการเดนทางไดอยางถกตอง
18 เอกสารของบรษทฯทเกยวของกบการบรการ (เชน แผนพบ นตยสาร) มขอมลครบถวน และรปแบบสวยงาม 19 เจาหนาทใหบรการทานดวยสมผสความเปนไทย
20 เจาหนาทใหบรการผโดยสารอยางรวดเรว
ทานจะกลบมาใชบรการของการบนไทยตอไป จะใชบรการตอไป ไมใชบรการ
ขอเสนอแนะ_______________________________________________________
_____________________________________________________________ ขอบพระคณอยางสงในความรวมมอของทาน
57
APPENDIX B
Questionnaire
Dear Honorable Passengers
My name is Wilas Mankongvanichkul -- a THAI cabin crew and masterrsquos student of business English
for international communication program Srinakharinwirot University This questionnaire is about
an exploration of passengersrsquo satisfaction with service quality of Thai Airways International (TG)rsquos
domestic flights Data gained will be utilized for THAI service operation Please kindly complete the
questionnaire The data gained will be kept confidential and used for the research study only Your
kind cooperation is greatly appreciated
helliphelliphelliphelliphelliphelliphelliphelliphelliphelliphelliphelliphelliphelliphelliphelliphelliphelliphelliphelliphelliphelliphelliphelliphelliphellip
Direction Please mark (x) your answer in the space provided
Part 1 Personal Information
1 Gender
( ) Male ( ) Female
2 Age
( ) Under 20 years ( ) 21-40 years
( ) 41-60 years ( ) Above 60 years
3 Occupation
( ) Government official State enterprise employee
( ) Business employee
( ) Business owner ( ) Student
( ) Retiree ( ) Others
4 Monthly income
( ) Up to 20000 baht ( ) 20001- 40000 baht
( ) 40001 ndash 60000 baht ( ) 60001 baht and above
5 Purpose of travel
( ) Business trips ( ) Holidays
( ) Visits ( ) Others
6 Frequency in traveling with THAI (during the last 12 months)
( ) First time ( ) 2-3 times
( ) 4-10 times ( ) More than 10 times
58 Part 2 Your satisfaction with the service
(5=Strongly Agree 4= Agree 3=Uncertain 2=Disagree 1= Strongly Disagree)
Level of Satisfaction
The Service of THAI 5 4 3 2 1
1 When cabin crew promise to do something by a
certain time they do so
2 You can trust THAI cabin crew
3 TG has modern on board equipment
(such as TV screen passengersrsquo seats)
4 TG has operating hours on board convenient to all
passengers
5 Cabin crew offer good services upon boarding
6 When passengers have a problem cabin crew show a
sincere interest in solving it
7 Passengers feel safe on-board
8 The physical facilities of TG are visually appealing
(such as meal boxes)
9 Cabin crew do not understand your special needs in
some cases
10 Cabin crew do not tell passengers exactly when
services will be offered
11 Cabin crew insist on error-free records
12 Cabin crew are consistently courteous to passengers
13 Cabin crew are well-dressed and neat in appearance
14 TG gives passengers individual attention
15 Cabin crew are not always willing to help passengers
16 TG provides its services at the time it promises to
do so
17 Cabin crew are knowledgeable to answer passengers
travel-related questions
18 Documents about service are informative and appealing
(such as pamphlets and magazines)
19 Services provided have a ldquoThai Touchrdquo
20 Cabin crew are quick to respond to passengersrsquo requests
Will you come back for TGrsquos service Yes No
Suggestions________________________________________________________________
________________________________________________________________________ Thank you very much for your kind cooperation
59
APPENDIX C
Questionnaire Specification Based on SERVQUAL measurement (Parasuraman et al 1985)
Passengers satisfaction level toward service quality factors
No Service Quality Features (RATER)
Str
on
gly
ag
ree
Ag
ree
Un
certa
in
Dis
ag
ree
Str
on
gly
Dis
ag
ree
(5) (4) (3) (2) (1)
1 When cabin crew promise to do something by a certain time they do so Reliability
2 You can trust THAI cabin crew Assurance
3 TG has modern on board equipment (such as TV screen passengersrsquo seats) Tangibles
4 TG has operating hours on board convenient to all passengers Empathy
5 Cabin crew offer good services upon boarding Responsiveness
6 When passengers have a problem cabin crew show a sincere interest in solving it
Reliability
7 Passengers feel safe on-board Assurance
8 The physical facilities of TG are visually appealing (such as meal boxes) Tangibles
9 Cabin crew do not always understand your special needs in some cases Empathy
10 Cabin crew do not tell passengers exactly when services will be offered Responsiveness
11 Cabin crew insist on error-free records Reliability
12 Cabin crew are consistently courteous to passengers Assurance
13 Cabin crew are well-dressed and neat in appearance Tangibles
14 TG gives passengers individual attention Empathy
15 Cabin crew are not always willing to help passengers Responsiveness
16 TG provides its services at the time it promises to do so Reliability
17 Cabin crew are knowledgeable to answer passengers travel-related questions Assurance
18 TGs documents associated with services are informative and appealing (such as pamphlets and magazines)
Tangibles
19 Services provided have a ldquoThai Touchrdquo Empathy
20 Cabin crew are quick to respond to passengersrsquo requests Responsiveness
VITAE
61
VITAE
Name Wilas Mankongvanichkul
Date of Birth February 14 1980
Place of Birth Bangkok
Address 688 Soi Phaholyothin 32 Chankasem Jatuchak
Bangkok 10900
Present Occupation Cabin Crew
Thai Airways International Public Company Limited
89 Vibhavadi Rangsit Road Bangkok 10110
Education Background
2010 Master of Art (Business English for International
Communication)
Srinakharinwirot University
2001 Bachelor of Business Administration Bangkok University
1997 High School Saint Dominic School
- Cover
- Abstract
- Chapter 1
- Chapter 2
- Chapter 3
- Chapter 4
- Chapter 5
- Bibliography
- Appendix
- Vitae
-

9
is seen as a key performance indicator within a business and has increasingly become a
key element of business strategy (Gitman amp Carl 2005)
Hennig-Thurau and Klee (1997) state that customer satisfaction with a companys
products or services is often regarded as the key to the companys success and long-term
competitiveness Customer satisfaction is also often viewed as a central determinant of
customer retention A high customer satisfaction level yields several benefits It
heightens customersrsquo loyalty and prevents customersrsquo complaints lowers customersrsquo
price sensitivity reduces the costs of failed marketing and of new customer creation
reduces operating costs due to an increase in number of customers improves the
effectiveness of advertising and enhances business reputation (Fornell 1992) However
specialists on satisfaction indicate that the main factors determining customer satisfaction
are the customersrsquo own perceptions and expectations of service quality (Zeithaml amp
Bitner 2000)
Customersrsquo expectation and perception
Customersrsquo perception of service quality depends on the degree of the service that
meets the customersrsquo expectations service providers must know how to shape those
expectations The messages from service providers contribute significantly to expectation
development because the service is mostly regarded as intangible and people cannot
readily observe for themselves what to expect It is critical that the service provider gives
information to customers as clearly and accurately as possible before the customers make
a purchase Organizations that create unrealistic expectations in an effort to sell a service
are likely to find their customersrsquo satisfaction low Those unhappy customers will tell
others and the credibility of the business will be damaged (Gilbert 1999)
10
To ensure highly perceived quality and to maintain loyal customer base service
providers need to be accurate and reasonable about what they lead customers to expect
They also need to do a good job in the areas of reliability assurance tangibles empathy
and responsiveness It is difficult for companies to get ahead of the competition and the
nature of competition in the service industry is more difficult to protect from imitation
Competitors are increasingly forced to imitate the best features of one another
Therefore any competitors who try to invest more energy and resources in building
strong service quality are most likely to be winners (Gilbert 1999)
Factors Affecting Consumers Expectation
The key factors influencing consumersrsquo view on service quality include word of
mouth personal needs customersrsquo past experience and external communication
(Parasuraman et al 1985)
Word of mouth is particularly important because when consumers are satisfied or
dissatisfied with the service they are likely to share it with their friends Service is
generally classified as intangible Customers cannot actually ldquoseerdquo the service until they
experience it Before making a purchase customers need to find out as much information
as possible so as to make a good decision Word of mouth is a means to make a
consumer feel interested or uninterested in the service
Personal needs are considered another important factor They deal with the
motives that determine the nature and strength of what a consumer expects from a
service
Meanwhile past experience refers to what consumers have learned through their
personal interaction with a service provider It is particularly important in shaping
customersrsquo expectations
11
The last factor is external communication comprising such as direct sale and
advertisement in order to communicate and position a service through messages which
can influence consumer perceptions
In summary each factor can individually or harmoniously affect consumersrsquo
purchasing decision Customer satisfaction is a key to business success In order to make
customers satisfied a company needs to understand their expectations and perception by
studying the factors that affect their purchasing decision
23 Service Quality
A search for the definition of ldquoqualityrdquo has yielded inconsistent results Quality
has been variously defined as fitness for use in the product which successfully serves the
purpose of the user during usage (Juran amp Gryna 1974) In addition Zeithaml et al
(1990) state that ldquoqualityrdquo is what exceeds the customersrsquo expectation of the service
On the other hand quality is a characteristic of thoughts and statements believed
to be taken for granted if an explanation of quality is going to be both false and true
precisely (Pirsig 1987) Pirsig also says that since definitions derive from abstract and
formal thinking quality cannot be defined it is impossible to define quality because
quality can never be considered independently but only in relation to what is perceived
Measuring Quality in Service
Parasuraman et al (1985) point out that service quality is more difficult for the
consumers to evaluate than the product quality Perception of service quality results from
a comparison of customer expectations with actual service performance Quality
evaluations are made not only from the outcome of a service but also from the ldquoprocessrdquo
12
of service delivery and the customers have fewer tangible characters to be measured
physically when purchasing services than when purchasing products (Gronroos 1978)
Service quality is the degree of how well the service level delivered matches
customer expectations Delivering quality service means that the service provider needs
to follow customer expectations on a consistent basis (Lewis amp Booms 1983)
To conclude three underlying service quality themes can be drawn from the
discussion as follows
Service quality is more difficult for the customer to evaluate than product quality
Service quality perceptions result from a comparison of consumer expectations
with actual service performance
Quality evaluations are not made solely on the outcome of a service They
involve evaluations of the process of service delivery
The Benefits of Service Quality
The benefits of service quality comprise four areas as follows (Kotler 2000)
Customers Retention High quality builds loyal customers and creates positive word of
mouth which is an important factor in purchase decision This can determine customer
satisfaction which affects repeat business If a customer is happy with an existing firm it
is difficult to convince him or her to move to another
Avoidance of Price Competition A firm with a reputation for high quality has
a much stronger competitive position than one with a reputation for poor quality Price-
cutting by a competitor will not be enough to encourage a client to switch Good quality
is more powerful to remain competitive
13
Retention of Good Employees Employees appreciate working in operations
that are well run and produce quality products They do not enjoy receiving customer
complaints Also turnover and loss of employee morale are listed as costs of poor quality
manpower When an operation has good quality it can retain good employees And at
the time business expansion is needed recruiting is easier and training cost is reduced
Reduction of Costs The quality cost includes internal costs external costs and
quality system costs Internal costs are those associated with correcting problems
discovered by the firm before products reached customers External costs are related to
errors that the customers experience They can be very expensive when the customers
decide not to return because of a service problem Then the promotional and advertising
costs or external costs are necessary to be spent to create the company image in order to
make customers come back and win brand loyalty for the company in the end However
the company needs to check the service quality through customersrsquo feedback periodically
to avoid problems
Although the quality service system does not come without costs it is usually less
than those internal and external costs resulting from poor quality service Some examples
of the costs of a quality system include customer service audits trainings management
meetings with employees and customers and introduction of a new technology (Kotler
Bowen amp Makens 1999)
To sum up it is necessary for a service company to know the service quality level
The quality needs to be evaluated by comparing customer experience with service
performance Once a service company reaches a good quality level a company will
retain its customers easily be away from price wars keep and get good employees and
reduce some operation costs
14
Thai Airways In-flight Service Quality
The latest airline evaluation in 2009 by Skytrax from United Kingdom which is a
research organization focused on in-flight services revealed that TG got the official 4-star
ranking for its product and service quality This honor is awarded to airlines which
deliver a good quality performance
Skytrax also disclosed that for short travels or domestic routes two traveling
classes are business class and economy class The overall evaluation of the domestic
route showed that TGrsquos business class was rated excellent (5-star) in two articles which
are ldquowashroom cleanlinessrdquo and ldquonewspaper amp magazinerdquo in terms of ldquoonboard productrdquo
category Meanwhile TG also got the highest rank in terms of ldquoservice efficiencyrdquo and
ldquoresponding to requestsrdquo in ldquocabin staff servicerdquo categories In addition in the economy
class TG could do superbly in three articles of cabin staff service which were ldquoservice
efficiencyrdquo ldquoenthusiasm and attituderdquo and ldquofriendliness and hospitalityrdquo (ldquoTHAI
AIRWAYS INTL Official 4-Star Ranking of Product and Service Qualityrdquo 2009)
In conclusion TG has been recognized internationally however it still needs to
move ahead The quality ranking is useful for TG to realize that the company needs to
develop its products and services in all categories in order to step up and well-prepared
for competitions in the future
24 SERVQUAL Model
SERVQUAL is an instrument used for measuring how customers perceive the
quality of the service This instrument is based on five dimensions and on a comparison
between customersrsquo expectations of how the service should be performed and their
experiences of how the service is actually performed Usually 20 attributes are used to
describe the five dimensions and participants are asked to state what they expect from the
15
service and how they perceive the service on a five-point scale from ldquoexcellentrdquo to
ldquopoorrdquo Based on the difference between expectations and experiences over the 20
attributes an overall quality score can be calculated The higher the score shows that
experiences are below expectation the lower the perceived quality (Parasuraman amp
Berry 1991)
SERVQUAL consists of five dimensions (RATER) as follows (Parasuraman et
al 1985)
Reliability This means that a service firm provides its customers with accurate
service the first time without making any mistakes and delivers what it has promised to
do by the time that has been committed
Assurance This means that employeesrsquo behaviors give customers confidence in
the firm and that the firm makes customers feel safe It also means that the employees are
always courteous and have the necessary knowledge to respond to customers questions
Tangibles This dimension relates to the appeal of facilities equipment and
materials used by a service firm as well as to the appearance of service employees
Empathy This means that the firm understands the customersrsquo problems and
performs in their best interests as well as giving customers individual personal attention
and having convenient operating hours
Responsiveness This means that employees of a service firm are willing to help
customers and respond to their requests as well as to inform customers when service will
be provided and give prompt service
16
Application of SERVQUAL Model in Hospitality Business
The SERVQUAL instrument has been used to assess the quality of a wide range
of services in the United States such as financial service operations telephone services
repair and maintenance services (Parasuraman et al 1988) and other professional
services (Bojanic 1991) Fick and Ritchie (1991) have employed the SERVQUAL
instrument to compare services provided by various types of organizations within the
travel and tourism industry Oberoi and Hales (1990) have examined the SERVQUAL
approach as a basis for measuring the quality of the conference hotel products Many
researchers of other service businesses believed that ldquoSERVQUALrdquo is a concise multiple-
item scale with good reliability and validity (Buttle 1996 Lages amp Fernandes 2005)
In Thailand Boontaganon (2002) studied the service quality of fast food
restaurants in Bangkok by using SERVQUAL The study examined the differences in
service quality expectations and perceptions based on demographic characteristics
including gender age occupation education and income level 360 questionnaires were
distributed to people who had just exited from fast food outlets in Bangkok The results
showed significant differences in service quality of customer expectations and
perceptions which indicated the unacceptable service quality delivered by fast food
restaurants in Bangkok
Suthirungkul (2003) studied the customer expectations and perceptions of service
quality of the Clark Hatch Fitness Center at Silom Road Branch Bangkok The objectives
of the study were to identify the SERVQUAL dimensions that customers both local and
foreign used to evaluate The Clark Hatch Fitness Center to study the customer
expectations towards the services quality that should be provided and to evaluate the
perceptions of service quality that customers obtained after using service The
questionnaire was used as a tool for collecting the data 277 Thai and foreign members of
17
the Clark Hatch Fitness Center at Silom Road Branch were the research participants The
results of the study were that there existed gaps between expectations and perceptions in
terms of the five SERVQUAL dimensions and the demographic characteristics had
influenced the gap scores
In short SERVQUAL is an effective measuring tool This tool has widely been
used in many previous studies in hospitality business both domestically and
internationally
25 Demographic Variables
In general business sector market segmentation is often based on demographic
profiles (Reid amp Bojanic 2001) in order that marketers can choose the proper service
segmentation strategies to satisfy different target market segments Demographics are the
variables about consumersrsquo wants preferences and usage rates are often associated with
demographic variables Moreover the demographic variables are easier to measure
(Kotler 2000) Important demographics are as follows
1 Gender There is no logical reason to expect biology to account for this
difference between the sexes The explanation may be in socialization differences and
personality disposition Feminine gender identity is characterized by traits such as
expensiveness and emotionalism and other orientation while masculine gender identity is
characterized by independence activity and self orientation (Kotler amp Scheff 1997)
2 Age Consumersrsquo wants and abilities change with age People buy different
goods and services over their lifetime Peoplersquos tastes in different products and services
are also related to age (Kotler 2000)
18
3 Occupation This variable reflects values attitudes taste and lifestyle
Occupation and income tended to be closely correlation on almost cause-and-effect
relationship (Schiffman amp Kanuk 1994)
4 Income Consumers form a purchase intention based on such factors and
expected family income price and expected benefits from the product and services
(Kotler 1997)
5 Purpose of Travel The purpose of travel measure the frequent distribution
The purposes of travel are for such as business holiday visiting friends and relative and
others (ldquoTravel Planningrdquo 2010)
6 Frequency of Travel A critical factor in predicting the demand for tourism
within a certain period of time is the number of trips individuals take New touristsrsquo
behavior shows a tendency toward more frequent travel (Alegre amp Pou 2006)
To recap the demographic profiles play a significant role in planning service to
meet passengersrsquo satisfaction In airline business six features of the demographics were
included in this study
26 Previous Studies on Airline Passengersrsquo Satisfaction
In an airline business the major revenue of a company comes from the number of
passengers rather than a total sum of cargo service aircraft maintenance or catering
supply all together Studies on airline passengersrsquo satisfaction are numerous as the
following examples
Gilbert and Wong (2003) identified the service dimensions that matter most to
current airline passengers The study measured and compared differences in passengersrsquo
expectations of the desired airline service quality in terms of reliability assurance
19
facilities employees flight patterns customization and responsiveness The primary data
were collected from passengers departing from Hong Kong airport Regarding the
service dimension expectations it was found that there were no statistically significant
differences between passengers who made their own airline choice (decision makers) and
those who did not (non-decision makers) However there were significant differences
among passengers of different ethnic groups nationalities as well as among passengers
who traveled for different purposes such as business holiday and visiting friends or
relatives
The findings also indicated that passengers consistently ranked lsquoassurancersquo as the
most important service dimension It showed that the passengers were concerned about
the safety and security aspects and this also indicated why there had been such a
downturn in demand as this study was conducted just prior to the World Trade Center
incident on September11 2001
In Thailand Somwang (2008) assessed the passengersrsquo views of service quality in
Thai low cost airlines The research was based on the principle that passengers evaluated
airline service quality through a comparison between their experiences and expectations
over a number of quality attributes The study evaluated passengersrsquo perceived service
quality of Thai low cost carriers based on the SERVQUAL instrument The findings
indicated that the passengersrsquo expectations on service quality were higher than what they
had actually experienced Further analysis showed that female passengers had lower
perceived service quality than male passengers The findings also revealed that higher
monthly income had greater differences with respect to expectations and perceptions than
lower income respondents Furthermore passengers usually traveled with low cost
carriers for three main purposes which were for leisure visiting friends or relatives and
business
20
In brief the previous studies explored the satisfaction of airline passengers by
using SERVQUAL instrument to measure the service quality The results above found
out the differences between customersrsquo expectations and perceptions The findings of a
study in Hong Kong revealed the passengersrsquo satisfaction on the dimensions of the
service quality Meanwhile a study in Thailand implied some findings about the
demographic profiles resulting in service quality Studies on service quality help improve
business organizations retain customers and attract new customers
CHAPTER THREE
METHODOLOGY
This chapter consists of four sections participants of the study research
instrument procedures of the study and data analysis
31 Participants of the Study
One hundred and fifty Thai passengers 75 males and 75 females who took the
TG Bangkok - Chiangmai route were randomly chosen as participants for the study
Since there are about 150 passenger seats in each flight the researcher randomly acquired
a sample size of 10 percent of the overall passengers from the ten flights totaling 150
Thai people are the main group of passengers who travel domestically over the year The
researcher therefore decided to select only the Thai passengers as the participants for the
study Also so as to cover various types of passengers the researcher included flights of
different time within a day (as shown in a following part of this chapter) for a reason that
passengers with some specific purposes chose to travel at some specific time For
example business people might prefer an early morning flight rather than a later-in-the-
day one
TGrsquos Bangkok ndash Chiangmai route has been considered one of the most frequent
domestic routes (THAI 2009) TG operates ten flights daily from Bangkok to
Chiangmai The researcher consequently chose this route for this research work to
assess the passengersrsquo satisfaction with TGrsquos service quality
The study was conducted in early March when it was still in the high season for
travels to the northern province of Thailand Fifteen passengers from each of the ten
flights of the Bangkok - Chiangmai route were asked to fill out the questionnaire at the
22
end of the on-board service while the plane was approaching Chiangmai its destination
All the 150 completed questionnaires were obtained as planned
32 Research Instrument
A questionnaire in Thai was used for data collection The questionnaire was
divided into three parts The first part was about the respondentsrsquo demographic profile
since consumersrsquo needs preferences and personalization are often associated with
demographic factors (Kotler 2000) Six demographic characteristics related to in-flight
service (Cheosakul 2004) consisting of gender age occupation monthly income
purpose of travel and travel frequency with THAI were demographic issues of the survey
The second part comprised questions about passengersrsquo satisfaction with the service
during the flight This part of the questionnaire was based on the SERVQUAL
instrument for measuring customersrsquo satisfaction in five dimensions of service reliability
assurance tangibles empathy and responsiveness (Parasuraman et al 1985) The last
part comprised a question and a blank space provided for suggestions on TGrsquos service
quality
33 Procedures of the Study
The questionnaire was initially approved by the researcherrsquos masterrsquos project
advisor and two specialists a TG in-flight service manager and a SWU lecturer Then a
pilot study was conducted to ten passengers to check for content reliability the
appropriateness of the number of questions and language used in the questionnaire As
the researcher included all the ten flights of TGrsquos Bangkok - Chiangmai route in the
study the tried-out questionnaire was randomly distributed to ten TG passengers (5 males
and 5 females) on each flight of the aforementioned route on the same day in February
23
2010 Also since this study was about onboard service the questionnaire was distributed
to the participants after the in-flight service was completed and before the plane landed
After that the questionnaire was adjusted and prepared for the actual survey
The revised questionnaire was eventually distributed to 150 participants in ten
consecutive days in early March 2010 Fifteen passengers in each Bangkok -
Chiangmai flight per day were randomly asked to fill out the questionnaire after the
completion of in-flight service
The plan below showed the ten flights of for the survey each flight for a day to
make sure that the data gained were reliable
BKK-CNX Flight (TG) Flight Schedule (Departure-Arrival)
TG100 0615-0725
TG102 0750-0910
TG104 0910-1030
TG106 1020-1140
TG110 1250-1400
TG112 1400-1510
TG114 1540-1650
TG116 1715-1825
TG120 1900-2010
TG122 2130-2240
34 Data Analysis
The data acquired from the questionnaires were analyzed in three sections
demographic profile of passengers level of passengersrsquo satisfaction with TGrsquos service
and the relationship between demographic profile and passengersrsquo satisfaction based on
24
Likert scale The 5-point Likert scales were used to rate the level of satisfaction as shown
in Table 1 below
Table 1 Intervals of Satisfaction Level (Poonlarbtawee 1987)
The interpretation of the scales in this study is as follows
Rating
Scale
Level of
Agreement Disagreement
Satisfaction
Level
Mean Score
5 Strongly agree Excellent 451-500
4 Agree Good 351-450
3 Uncertain Average 251-350
2 Disagree Fair 151-250
1 Strongly disagree Poor 100-150
The researcher picked up lsquothe high grouprsquo and lsquothe low grouprsquo of each
SERVQUAL dimension to present the relationship between the participantsrsquo
demographic profile and their satisfaction As the data gained from the highest number of
the participants or the high group was the major point that the researcher relied on focus
was on the majority opinion At the same time the data gathered from the lowest number
of the participants or the low group should not be overlooked because each and all
passengers are important for TG and in the high competitive airline market it is necessary
to retain each and every passenger so as to grow far in the aviation business
The results were presented in terms of percentages and mean scores in the form of
tables and a bar chart These fundamental statistic methods were proper in this study
25
because percentages and mean scores are considered the basic statistics used for data
analysis and presentation Also the general public can easily understand the
interpretation of the data Another reason was that the sample group of this study
comprised only 150 TG passengers The researcher therefore decided to apply the
aforementioned statistics in this research Discussion of the results was also offered
CHAPTER FOUR
FINDINGS
This chapter describes the findings of the study consisting of the demographic
data of the participants level of their satisfaction with TGrsquos service quality relationship
between the demographic data and five dimensions of SERVQUAL instrument and the
uncovers to the last question on the questionnaire including suggestion
41 Demographic Data
The demographic data of TGrsquos research participants in terms of age occupation
monthly income purpose of travel and frequency of travel are presented in Tables 2- 6
below
Table 2 Participantsrsquo Age
Age No of Participants Percentage ()
Under 20 years
21-40 years
41-60 years
Above 60 years
8
85
45
12
53
567
300
80
Total 150 100
Regarding the age group the highest number of the passengers was 20-40 years
old or 567 30 of them were 46-60 years old and 8 were above 60 years old Only
53 were under 20 years old
27
Table 3 Participantsrsquo Occupation
Occupation No of Participants Percentage ()
Government official State enterprise employee
Business employee
Business owner
Student
Retiree
Others
22
63
37
13
9
6
147
420
247
86
60
40
Total 150 100
In terms of occupation the highest number of the participants was business
employees (42) followed by business owners (247) government officials or state
enterprise employees (147) students (86) retirees (6) and other occupations (4)
respectively
Table 4 Monthly Income
Monthly income (baht) No of Participants Percentage ()
Up to 20000
20001- 40000
40001 - 60000
60001 and above
58
72
11
9
386
480
74
60
Total 150 100
For the income the highest number of the participants earned 20001-40000 baht
monthly (48) followed by those with a monthly income of up to 20000 baht (386)
28
of 40001-60000 baht monthly (64) and of 60001 baht and above monthly was the
lowest (6)
Table 5 Purpose of Travel
Purpose of travel No of Participants Percentage ()
Business trips
Holidays
Visits
Others
41
79
27
3
273
527
180
20
Total 150 100
Regarding the purpose of travel the highest number of the passengers traveled via
TG on holidays (527) followed by those who traveled on business trips (273)
Meanwhile those who made a visit were at 180 and who traveled with other purposes
were at 2
Table 6 Frequency of Travel
Frequency in traveling with THAI
(during the last 12 months)
No of Participants Percentage ()
First time
2-3 times
4-10 times
More than 10 times
39
99
10
2
260
660
67
13
Total 150 100
29
The last demographic data derive from the frequency in traveling with THAI
66 of the participants indicated that they traveled 2-3 times during the last 12 months
26 traveled for the first time while 67 for 4-10 times and 13 for more than 10
times during the last 12 months
In conclusion the demographic data shown in the tables above indicated that lsquothe
high grouprsquo comprised the following characteristics The age group of the majority
number of the participants ranged from 21-40 years (567) Most of them were business
employees (42) The highest number of the passengersrsquo monthly income was around
20000 ndash 40000 baht per month (48) The majority of the passengers traveled on
holidays (527) by TG 2-3 times in the past 12 months (66)
Meanwhile lsquothe low grouprsquo was found having the following characteristics The
lowest number of the research participants was under 20 years old or 53 Only 47 of
the participants had other kinds of occupation which were not indicated on the
questionnaire while only 6 of the participants earned 60001 baht or above monthly
2 of the participants traveled on other purposes besides those shown on the
questionnaire Lastly 13 of the passengers were those who traveled by TG more than
10 times in the past 12 months
42 Level of Passengersrsquo Satisfaction
Figure 1 below is the conclusion from the second part of the questionnaire The
150 participants were asked to rate the level of service quality that they perceived from
the TGrsquos domestic flights on Bangkok - Chiangmai route The questionnaire was divided
into five dimensions of SERVQUALrsquos (Parasuraman et al 1985) service quality which
comprised reliability assurance tangibles empathy and responsiveness The scales 1 to 5
ranged from lsquostrongly disagreersquo to lsquostrongly agreersquo
30
0
5
Reliability Assurance Tangibles Empathy Responsiveness
280
345 334307
269
SERVQUAL Dimension
Figure 1 Overall Level of Participants Satisfaction
Mean scores
Figure 1 shows the average mean score of all 150 passengersrsquo satisfaction on five
dimensions of service quality ranging from the mean scores of 345 to 269 The results
revealed that the most important service quality dimension for the whole samples group
of passengers was assurance ( 345) followed by tangibles ( 334) empathy ( 307)
reliability ( 28) and responsiveness ( 269) respectively The overall average mean
was 307
43 Passengersrsquo Satisfaction Level in Relationship with Their Demographic Data
This section shows the relationship between the demographic data (age
occupation monthly income purpose of travel and travel frequency) of the participants
and their satisfaction with the service quality of TGrsquos in-flight service
The researcher focused on each category of demographic characteristics of two
major groups a group with the highest score and the other with the lowest score In fact
the most important data were the majority opinion of the sample group In other words
for this study it was lsquothe high grouprsquo However the researcher as a TG cabin crew gave
importance to the low group as well since each and every passenger is significant to TG
x
x x x
x x
31
business particularly in the high competitive market of airline business The researcher
was interested to know what the passengers in the lsquolow grouprsquo thought about the in-flight
service and what their feedback was
The following tables (Tables 7-11) illustrate the relationship between each
dimension of the demographic data and the SERVQUAL service assessment tool and the
following symbols are applied in the tables below
lsquoNrsquo means the number of the participants
lsquo rsquo means the mean score
lsquoThe high grouprsquo means the group that comprises the highest number of participants
lsquoThe low grouprsquo means the group that comprises the lowest number of participants
Table 7 Relationship between the Participantsrsquo Age and their Satisfaction with In-flight
Service
SERVQUALrsquoS
RATER
Average
Mean Score
of All Groups
The High Group
(Age 20-40 Yrs Old)
N = 85567
The Low Group
(Age Under 20 Yrs Old)
N = 853
Mean Score of Each Group
Reliability 280 278 270
Assurance 345 378 335
Tangibles 334 331 328
Empathy 307 309 314
Responsiveness 269 267 290
Table 7 reveals the connection between the participantsrsquo age and the five
dimensions of the SERVQUAL instrument The high group had higher mean scores for
x
32
three dimensions than the low group In other words the participants with an age range
of 20-40 years were more satisfied with TGrsquos service quality in terms of reliability
assurance tangibles than those who were under 20 years old Meanwhile the low group
had higher mean scores for two dimensions than the high group This means the
participants who were lower than 20 years old were more satisfied with the in-flight
service in terms of empathy and responsiveness than those whose ages ranged from 20-40
years
Interestingly it was found that both groups have a lower mean score for the
reliability dimension ( 278 and 270) than the average mean score of all the age groups
in this study ( 28)
Table 8 Relationship between the Participantsrsquo Occupation and their Satisfaction with In-
flight Service
SERVQUALrsquoS
RATER
Average
Mean Score
of All Groups
The High Group
(Business Employee)
N = 63420
The Low Group
(Others)
N = 640
Mean Score of Each Group
Reliability 280 275 284
Assurance 345 347 348
Tangibles 334 331 336
Empathy 307 310 305
Responsiveness 269 264 277
Table 8 illustrates the connection between the participantsrsquo occupations and the
five dimensions of the SERVQUAL instrument The low group had higher mean scores
x
x
33
for almost all the dimensions of SERVQUALrsquos RATER than the high group except for
one dimension In other words the participants who worked as business employees were
less satisfied with TGrsquos service quality in terms of reliability assurance tangibles and
responsiveness than those whose occupations were not specified in the questionnaire
Empathy was the only dimension of service quality that the participants who were in the
high group were satisfied with
Table 9 Relationship between the Participantsrsquo Income and their Satisfaction with In-
flight Service
SERVQUALrsquoS
RATER
Average
Mean Score
of All Groups
The High Group
(20001-40000)
N = 72480
The Low Group
(60001 and above)
N = 960
Mean Score of Each Group
Reliability 280 273 285
Assurance 345 349 350
Tangibles 334 332 321
Empathy 307 301 325
Responsiveness 269 262 273
Table 9 indicates the connection between the participantsrsquo monthly income and
the five dimensions of the SERVQUAL instrument The low group had higher mean
scores for almost all the dimensions of RATER than the high group except for one
dimension In other words the participants who earned monthly income of 20001 ndash
40000 baht were less satisfied with TGrsquos service quality in terms of reliability assurance
empathy and responsiveness than those who earned monthly income of 60001 baht and
34
above The tangibles dimension was the only service quality issue that the participants
who were in the high group were satisfied with
Table 10 Relationship between the Participantsrsquo Purpose of Travel and their Satisfaction
with In-flight Service
SERVQUALrsquoS
RATER
Average
Mean Score
of All Groups
The High Group
(Holidays)
N = 79527
The Low Group
(Others)
N = 320
Mean Score of Each Group
Reliability 280 279 285
Assurance 345 353 349
Tangibles 334 335 338
Empathy 307 308 312
Responsiveness 269 270 275
Table 10 reflects the connection between the participantsrsquo purpose of travel and
the five dimensions of the SERVQUAL instrument The low group had higher mean
scores for almost all the dimensions than the high group except for one dimension In
other words the participants who traveled on holidays were less satisfied with TGrsquos
service quality in terms of reliability tangibles empathy and responsiveness than those
whose purpose of travel were not specified in the questionnaire Assurance was the only
dimension of service quality that the participants who were in the high group were
satisfied with
35
Interestingly it was found that both groups has a higher satisfaction level for the
assurance tangibles empathy and responsiveness dimensions than the average mean
scores of the whole sample group
Table 11 Relationship between the Participantsrsquo Frequency of Travel with THAI and their
Satisfaction with In-flight Service
SERVQUALrsquoS
RATER
Average Mean
Score of All
Groups
The High
Group
(2-3 timesyear)
N = 99660
The Low Group
(more than 10
timesyear)
N = 213
Mean Score of Each Group
Reliability 280 281 295
Assurance 345 346 360
Tangibles 334 335 343
Empathy 307 308 321
Responsiveness 269 270 292
Table 11 presents the connection between the participantsrsquo frequency of travel
with THAI and the five dimensions of the SERVQUAL instrument The low group had
higher mean scores for all the dimensions of RATER than the high group In other
words the participants who traveled 2-3 times in the last 12 months were less satisfied
with TGrsquos service quality in terms of reliability assurance tangibles empathy and
responsiveness than those whose frequency of travel were more than 10 times in the last
12 months
36
Interestingly it was found that both groups has a higher satisfaction level for all
the five RATER dimensions than the average mean scores of the whole sample group in
this study
44 Other Comments
The last part of the questionnaire was designed to ask whether the participants
would continue using TGrsquos service The findings disclosed that 142 participants or
946 indicated that they would while 8 of them or 54 declined
Also at the end of the questionnaire there was a blank space for the participants to
freely express their own ideas and suggestions on TGrsquos service However only 7
participants or 46 gave suggestions regarding the in-flight service Four of the
participants were dissatisfied with the flavor of the snacks provided on board One
complained that it was not cool enough in the cabin while one was upset for not being
granted for a request for a blanket The last one commented that the passengerrsquos seat was
not comfortable
In summary the passengersrsquo satisfaction level of the service quality in connection
with their demographic data was introduced Five out of the six demographic
characteristics the participantsrsquo age occupation monthly income purpose of travel and
frequency of travel were analyzed in connection with the five dimensions of SERVQUAL
instrument reliability assurance tangibles empathy and responsiveness It was observed
that there were some connection between these two matters in various ways as earlier
discussed Lastly it was found that one hundred and forty-two participants would
continue using TGrsquos service while the rest refused Only seven of all the participants or
46 gave some comments on the open-ended suggestion part
CHAPTER FIVE
CONCLUSION AND DISCUSSION
This chapter presents the conclusion discussion limitations of the study and
recommendations for further studies
51 Conclusion
This research aimed to examine the service quality provided by Thai Airways
International on its domestic flights One hundred and fifty passengers who traveled by
TG on the Bangkok - Chiang Mai route were the research participants The SERVQUAL
instrument was used as an instrument for data collection in the survey This instrument
was based on five determinants proposed by Panasuraman etal (1985) in terms of
reliability assurance tangibles empathy and responsiveness This research was also
conducted on the demographic characteristics comprising gender age occupation
monthly income purpose of travel and frequency in traveling and the relationship of these
characteristics except the gender with the passengersrsquo satisfaction with TGrsquos in-flight
service quality The questionnaires were distributed in early March 2010
The results showed that all the participantsrsquo satisfaction based on the five
dimensions was at the average level The highest level of passengersrsquo satisfaction was
placed on the assurance dimension followed by tangibles and empathy dimensions
accordingly The two lowest levels of the passengersrsquo satisfaction were placed on the
responsiveness and reliability dimensions
In addition a summary of the demographic characteristics showed that the high
group or the group with the highest number of participants was business employees The
highest number of the participants was between 21-40 years old The highest number of
38
the participantsrsquo income ranged from 20000 ndash 40000 baht monthly Also the high
grouprsquos purpose of travel was to go on holiday Lastly the highest number of the
participants traveled via TG only 2-3 times during the past 12 months
Meanwhile the low group or the group with the lowest number of participants
was passengers with other kinds of occupations which were not specified on the
questionnaire The low group of the participants was under 20 years old The low group
of the participantsrsquo income ranged from 60001 baht monthly or higher Also the low
group revealed that they traveled via TG for other purposes which were not indicated on
the questionnaire Lastly the passengers who traveled via TG more than 10 times during
the past 12 months belonged in the low group
It has also been discovered that as a whole both groups the high and low groups
were in the same direction in their satisfaction with the five dimensions of service quality
The two groups were satisfied with the service quality dimensions in terms of assurance
at the highest level followed by tangibles empathy reliability and responsiveness
respectively
However when analyzing each demographic characteristic the participants who
were under 20 years old rated the responsiveness dimension higher than the reliability
dimension Also for those participants whose income was around 60001 or higher the
empathy dimension was rated higher than the tangibles Regarding the occupation
business people were satisfied with the reliability and responsiveness dimensions at a
very low level Meanwhile the participants who traveled via TG on their holidays rated
the assurance dimension at a very high level Lastly frequent fliers who traveled by
THAI more than 10 times were most satisfied with TGrsquos service since they rated all
RATER aspects highly
39
52 Discussion
The findings have revealed the answers to the research questions First the
demographic data of the participants gender age occupation monthly income purpose
of travel and frequency of travel were shown Second the level of the passengersrsquo
satisfaction toward the service quality on Thai Airways Internationalrsquos domestic flights in
terms of the SERVQUAL instrument (Parasuraman et al 1985) reliability assurance
tangibles empathy and responsiveness was disclosed Also the results about the
relationship between the passengersrsquo satisfaction and their demographic data were pointed
out
The results of the survey indicated that out of the five dimensions assurance was
rated at the highest level ( 345) followed by tangibles ( 334) and empathy ( 307)
(See Figure 1) In addition passengers rated their highest satisfaction with the assurance
dimension which included cabin crewrsquos job knowledge their courtesy confidence in their
service ability and safety while traveling It may be because TG cabin crew are well-
trained prior to their actual service work on board This can also ensure passengersrsquo
safety Particularly the safety and security features have been the most concerns of
airline passengers since the 9-11 incidents in New York USA This is why most
customers rated their highest satisfaction with the assurance dimension (Carman 1990)
The findings of this study are also consistent with those of Fick and Ritchie (1991)
who studied the operation of the SERVQUAL instrument in three major tourism sectors
airlines restaurants and ski area services It was revealed that the most important
dimensions of the service were assurance and tangibles If companies were unable to
inspire trust and confidence in their customers and the tangibles are not impressive it
would be difficult for them to achieve a high level of customerrsquos satisfaction (Sachukorn
2000)
x x x
40
Responsiveness is often found as the lowest level of satisfaction among customers
in the service industry It is plausible that the staff were too busy to provide prompt and
good service (Kholthanasep 2001) In this study the results revealed that the
responsiveness dimension was rated at the lowest score ( 269) among the five
dimensions followed by the reliability ( 280) dimension It was highly possible that the
passengersrsquo dissatisfaction occurred when passengers did not receive prompt service from
TG when they needed help
Prompt service is an important factor of customersrsquo expectation Customers
generally rate the service as poor when the speed of service does not meet their
expectations (Kholthanasep 2001) Bojanic and Rosen (1994) examined the nature of the
association between service quality as perceived by consumers and its determinants by
applying SERVQUAL in a restaurant setting They found that customers rated
responsiveness as the lowest satisfaction in their studies Zeithaml et al (1990) explained
that the responsiveness dimension in the SERVQUAL was willingness to help customers
and provide prompt service As the responsiveness dimension in this research comprised
prompt service willingness on-time service and quick response therefore it will be
beneficial to TG if the company can ensure that the service provided by its cabin crew
especially the willingness to help passengers and to provide prompt service meet
passengersrsquo satisfaction
Regarding the relationship between the participantsrsquo demographic data and their
satisfaction with the service quality there are many points of interests to be discussed as
follows
Firstly regarding the relationship of the passengersrsquo satisfaction with the service
and their age those who were under 20 years old rated satisfaction with the
responsiveness dimension ( 290) higher than the reliability dimension ( 270) (See
x
x
x x
41
Table 7) It was possible that young passengers usually gave priority to the dimension of
care and service when compared with that of the service providersrsquo accurate and
dependable manner (Panittumrong 2003) In addition young customers had less
experience in a service and it was difficult to compare the current service with the past
experience consequently they were more satisfied with the service provided than senior
customers
Another point was raised about the participantsrsquo age The study revealed that the
number of the high group with the age range of 21- 40 was at 567 However that of
the second highest group of the participants with the age range of 41-60 was at 30
which was rather high This latter grouprsquos level of satisfaction on the service quality was
also close to the average mean score It was found that the average mean score of the
reliability dimension was 280 while that of the second highest group was 281 the
average mean score of the assurance dimension was 345 while that of the second highest
group was 347 the average mean score of the tangibles dimension was 334 while that of
the second highest group was 335 the average mean score of the empathy dimension and
that of the second highest group was rated at 307 equally and the average mean score of
the responsiveness was 269 while that of the second highest group was 271 In sum if
consider the two groups in terms of the participantsrsquo age one of the high group and the
other with the second high group the results confirmed that the satisfaction level of the
majority of passengers was at the above average level
Secondly regarding the relationship between the participantsrsquo satisfaction and
their occupation business employees who were found at the highest number (42) had
very low satisfaction with the service quality in terms of reliability ( 275) and
responsiveness ( 264) while the mean scores of the whole sample group for these two
dimensions were at 280 and 269 respectively (See Table 8) The findings strongly
x
x
42
correlated with that of Cheaosakul (2004) who studied the consumersrsquo perception of
airline service quality with a focus on occupations It was found that the group of
business employees had the highest score on expectations Cheaosakul (2004)rsquos study
also revealed that business employees did not frequently travel compared with people of
other occupations such as tourists It was found in this particular study that the number of
the participantsrsquo purpose of travel with TG for business trips was only at 273 (See
Table 5) while the highest number of the participants went on holiday was at 52
Cheaosakul (2004) indicated that business people therefore had high expectations than
the other group who traveled more frequently
Thirdly an even more interesting point was raised when comparing the level of
satisfaction of the passengers who were government officials or state enterprise
employees and business owners Although passengers who were government officials or
state enterprise employees came third in terms of participants they are considered
valuable customers of TG since according to the governmentrsquos policy they are required
to take only TG which is a national airline whenever they travel by air There are few
exceptions though However it is almost impossible for Thai government officials who
travel on business trip and are funded by the governmentrsquos budget to fly with other
airliners It was found from this study that government officials were less satisfied with
TG quality service in terms of reliability ( 277) and responsiveness ( 264) than the
average level of which the mean scores of the two dimensions were at 280 and 269
respectively
Another issue of discussion regarding the participantsrsquo occupation business
owners came second It was observed that business owners rated the reliability ( 282)
and responsiveness dimensions ( 270) higher than the average scores of all groups (See
Table 8) It is possible that business owners had more positive attitude with TGrsquos service
x x
x
x
43
than the other groups TG seemed popular among business owners and they were the
most important group of customers This was supported by Suriya (2005) who studied
airline market segments after the launch of the low cost airlines in Thailand Suriya
(2005) identified that merchants or business owners were the major group of customers in
the full-service airline market
Fourthly regarding the monthly income of the research participants of the low
group passengers who earned an income of around 60001 or higher rated the empathy
( 325) dimension higher than tangibles ( 321) dimension (See Table 9) This may
be because the high income passengers sensitively felt that the facilities and equipment
found on their domestic route looked quite old-fashioned due to TGrsquos cost reduction The
company saved costs after the Suvannabhumi airport was closed in the 2008 crisis The
result is similar to the findings of Wangpen and Inthornma (2007) in that high income
customers had higher expectations towards the service It was possible that they had
more tendencies to be dissatisfied with the service failures The two researchers
concluded that passengers with different incomes were satisfied with the services at
different levels because they had different attitudes expectations and abilities to pay for
the service
Fifthly as it was found from this study that the highest score for the purpose of
travel was going on holiday (527) and the participants who were tourists rated the
assurance dimension at the highest level or the mean score of 353 (See Table 10) much
higher than the mean score of the whole group which was at 345 It was rather surprising
that the highest score for the travel purpose was not for business trips It is possible to
explain that this group spent for the travel cost on their own and they might want to make
sure that they chose the best service for themselves The result is parallel with Gabbie
and OrsquoNeill (1997) who examined customer satisfaction in the hotel sector using the
x x
44
SERVQUAL tool This study showed that the holiday guests who paid for
accommodation on their own rated assurance much higher than other dimensions It is
plausible to explain that passengers traveling on their own budget must make sure that
they already chose the service that was worth the money spent
However when analyzing the satisfaction on service quality of the participants
whose purpose of travel via TG was for business it was also found that this business
participants rated the high score for the tangibles dimension at the mean score of 340
compared with the average mean score of all groups of 334 Passengers who traveled on
business included government officials and state enterprise employees were major
customers of TG It was therefore interesting to find out from this study that their
satisfaction score in terms of tangibles or the appearance of physical factors such as
equipment facilities and personnel was above the average score of all groups Although
the score was not much higher the gap was bigger than that of the other RATER
dimensions as seen from the following information the passengers who traveled on
business trip showed their satisfaction on the reliability dimension at the mean score of
281 the assurance dimension at 347 the empathy dimension at 309 and the
responsiveness dimension at 270 while the average of all groups was at 280 345 307
and 269 respectively
The last point that the researcher wanted to point out is that this study revealed
that the participants who traveled more than 10 times for the last 12 months were lowest
in number (13) However it was interesting that these frequent flyers showed the high
rate of satisfaction with TGrsquos in-flight service quality The mean scores in all dimensions
showed the high rate of satisfaction (See Table 11) It is possible that passengers who
traveled very often via TG had high loyalty The brand loyalty made passengers happy in
every feature of service This result however contrasts with Ostrowski et al (1993) who
45
investigated service quality and customer loyalty in the commercial airline industry The
study examined whether the high levels of service quality existed in the US commercial
airline industry and how service quality could potentially lead to customer loyalty The
main results indicated that the levels of perceived service quality were below potential
and that customer loyalty to airlines was low It is plausible to say that the data of the two
studies were different The data collected on two air carriers in USA might have
different characteristics from the demographic information of Thai people and the number
of the participants in the two studies might differ However TG still needs to listen to the
voice of all passengers especially the frequent flyers Even if the number of this sample
group was few every customer is valuable for any firm Also it would be valuable to
implement a relevant strategy to expand this group of passengers since they had a positive
attitude for TG
Interestingly the findings from the last part of the questionnaire also showed that
the majority of the participants (946) showed their willingness to use TGrsquos service in
the future It can plausibly be explained that the participants were satisfied with TGrsquo
service quality at the moderate level ( 307) Their satisfaction with the five dimensions
of SERVQUAL was also moderate They might think that TG is a reliable airline that
they can depend on Thai passengers have confidence and trust in the service of Thai
cabin crew in terms of courtesy Also it is possible that they might not trust the low cost
airlinesrsquo service of the crew
There were only seven remarks on the in-flight service when the participants were
asked to freely give suggestions The tangible dimension problematic Passengers
pointed out about the small size of passengersrsquo seats and the quality of the air-
conditioning system One problem was on the responsiveness dimension which happened
when a passenger asked for a blanket but she was not offered indicating that some of the
x
46
cabin crewrsquos promptness to provide service was still not up to a standard Another
comment was on the flavor of the snacks Although this issue is not directly relevant to
the service it is worthwhile for TG to consider this problem
In conclusion the researcher found both strengths and weaknesses in TGrsquos service
quality Assurance was found the highest satisfaction in the participantsrsquo opinion TG
should maintain the service quality with a focus on this dimension On the other hand
the responsiveness and reliability dimensions were at the lowest satisfaction level among
the five dimensions The company should improve its service quality on these two
dimensions especially with regards to TGrsquos lsquoprompt servicersquo and lsquoproblem solvingrsquo
service to retain its passengers
53 Limitations of the study
This study has some limitations as follows
1 This study was limited to only one domestic route (Bangkok ndash Chiangmai)
Therefore the participants in this study were passengers who traveled only between these
two provinces The results of the study might differ if the study covered another route or
many more routes at the same time Consequently further studies can be conducted for
other domestic destinations such as Phuket and other big cities
2 The research participants were all Thai passengers It would be interesting to
study foreign passengersrsquo satisfaction on TGrsquos in-flight service quality
3 This study focused only on Parasuraman et al (1985)rsquos SERVQUAL
Instrument used to assess the service quality The results might differ if other instruments
were used
47
54 Recommendations for further studies
Further research should be undertaken to validate the results of this study The
researcher has found several opportunities to extend this study as follows
Survey on the lsquoresponsivenessrsquo dimensions
Responsiveness concerns the willingness or readiness of employees to provide
service such as timelines of service and prompt service This dimension was what the
passengers in this study were most concerned about because it was rated as the lowest
level of satisfaction Thus TG should find the countermeasure of how to increase the
level of passengersrsquo satisfaction in the responsiveness dimension
Assessment of the ground service quality
Since this research was conducted on on-board service quality further studies on
ground services such as a reservation or check-in service should be investigated in order
to integrate the results covering every sector of the airline service
Study on passengersrsquo attitude towards the service quality in other airlines
A study on the service quality of other airlines should be conducted in order to
obtain comparative data and find out reasons for their passengersrsquo behavior and attitude
consequently allowing TG to remedy any weak points and increase the number of new
passengers
REFERENCES
REFERENCES
Alegre J amp Pou L (2006) An analysis of the microeconomic determinants of travel
frequency Department of Applied Economics Universitat de les Illes Balears
Bojanic DC (1991) Quality measurement in professional service firms Journal of
Professional Service Marketing 7(2) 27-37
Bojanic D C amp Rosen L D (1994) Measuring service quality in restaurants An
application of the SERVQUAL model Journal of Hospitality Research 18(1)
3-14
Boontaganon W (2002) The study of service quality of fast-food restaurants in Bangkok
using SERVQUAL measurement Thesis MBA (Business Administration)
Bangkok Assumption University Photocopied
Buttle F (1996) SERVQUAL review critique research agenda European Journal of
Marketing 30(1) 8-31
CarmanJ M (1990) Consumer perceptions of service quality An assessment of the
SERVQUAL dimensions Journal of Retailing 69 33-35
Cheaosakul W (2004) Consumers perception of service quality a case study of Thai
Airways International Plc Thesis MBA Bangkok Assumption University
Photocopied
Fick RG amp Ritchie JRB (1991) Measuring service quality in the travel and tourism
industry Journal of Travel Research 30(2) 2-9
Fornell C (1992) A national customer satisfaction barometer the Swedish experience
Journal of Marketing 56 6-21
Gabbie O amp OrsquoNeill M (1997) SERVQUAL and the Northern Ireland hotel sector a
comparative analysis part 2 Managing Service Quality 17(1) 43-49
50
Gilbert DH (1999) Marketing connecting with customers (2nd
ed) Upper Saddle
River NJ Prentice Hall
Gilbert D amp Wong KCR (2002) Passenger expectations and airline services a
Hong Kong based study Surrey Management School Surrey University of
Surrey
Gitman LJ amp Carl DM (2005) The future of business the essentials Mason Ohio
South-Western College Pub
Grifin J (1995) Customer loyalty NY Lexington Book
Gronroos C (1978) A service-oriented approach to marketing of services European
Journal of Marketing 12(8) 588-601
Hennig-Thurau T amp Klee A (1997) The impact of customer satisfaction and
relationship quality on customer retention a critical reassessment and model
development Masterrsquos Project MA (Psychology amp Marketing) Hanover
University of Hanover
Heesawat C (2005) The opportunities and problems in making services more tangible
PhD Dissertation Bangkok Assumption University Photocopied
Juran JM amp Gryna FM (1974) Quality control handbook NY McGraw-Hill
Kholthanasep G (2001) A study of customerrsquos expectations and perceptions of service
quality delivery by first class hotels in Bangkok metropolitan area Thesis
MBA Bangkok Assumption University Photocopied
Kotler P amp Scheff J (1997) Standing room only strategies for marketing the
performing arts Boston Mass Harvard Business School Press
Kotler P (1997) Marketing management analysis planning and control (9th
ed) Upper
Saddle River NJ Prentice Hall
51
Kotler P Bowen J amp Makens J (1999) Marketing for hospitality and tourism (2nd
ed) NJ Prentice Hall
Kotler P (2000) Marketing management the millennium edition (10th
ed) NJ Prentice
Hall
Lages FL amp Fernandes CJ (2005) The SERVQUAL scale a multi-item instrument
for measuring service personal values Journal of Business Research 58(11)
1562-1572
Oberoi U amp Hales C (1990) Assessing the quality of the conference hotel product
London The Service Industries Journal 10(4) 700-722
Ostrowski PL Orsquobrien TV amp Gordon GL (1993) Service quality and customer
loyalty in the commercial airline industry Journal of Travel Research 32(2)
16-24
Palin M (1996) Flight catering transportation and loading (2nd
ed) London Longman
Group Limited
Panittumrong P (2004) The consumerrsquos opinion towards Clark Hatch Fitness Center
Master Project MBA (Management) Bangkok Graduate School
Srinakharinwirot University Photocopied
Parasuraman A Zeitmal VA amp Berry LL (1985) A concept model of service
quality and its implications for future research Journal of Marketing 49 41-50
Parasuraman A Zeitmal VA amp Berry LL (1988) SERVQUAL a multiple item
scale for measuring customer perceptions of service quality Journal of
Retailing 64(1) 64
Parasuraman A amp Berry LL (1991) Marketing services competing through quality
NY The Free Press
52
Pirsig RM (1987) Zen and the art of motorcycle maintenance an inquiry into values
(Mass Market Paperback) NY Bantam Books
Poonlarbtawee K (1987) Statistics for research Bangkok Physic Center Printing
Reid RD amp Bojanic DC (2001) Hospitality marketing management NJ John Wiley
amp Son Inc
Rueangthanakiet P (2008) Memberrsquos satisfaction of fitness service quality a case study
of California Wow Xperience Plc Masterrsquos Project MA (Business English for
International Communication) Bangkok Graduate School Srinakharinwirot
University Photocopied
Sachukorn S (2006) Reception and service excellence Bangkok Saitharn
Schiffman LG amp Kanuk LL (1994) Consumer behavior (5th
ed) London Prentice-
Hall International
Somwang C (2008) An assessment of passengersrsquo views of service quality in Thai low
cost carriers Inter Program MA (Communicative English) Bangkok
Ramkhamhaeng University Photocopied
Suriya K (2005) Airline market segments after low cost airlines in Thailand passenger
classification using neural networks and logit model with selective learning
Faculty of Economics Chiangmai Chiangmai University
Suthirungkul N (2003) The study of customer expectations and perceptions of service
quality of the Clark Hatch fitness center of Silom road branch Bangkok Thesis
MBA (Business Administration) Bangkok Assumption University
Photocopied
Thai Airways International (2008) Traffic program information (Introduction of summer
200809) Bangkok THAI Printing Office
53
Thai Airways International (2009) Traffic program information (Introduction of winter
200910) Bangkok THAI Printing Office
THAI AIRWAYS INTL Official 4-Star Ranking of Product and Service Quality (2009
October) Retrieved February 14 2010 from
httpwwwairlinequalitycomAirlinesTGhtml
Travel Planning (2010 February 12) Retrieved February 12 2010 from
httpwwwsuite101comlessoncfm1848818243
Wangpen N amp Inthornma S (2007) Membersrsquo satisfaction in fitness centers in
Bangkok Thesis MA (Hotel and Tourism Management) Bangkok Graduate
School Naresuan University Photocopied
Zeithaml VA amp Bitner MJ (2000) Services marketing (2nd
ed) NY McGraw Hill
Zeithaml VA Parasuraman A amp Berry LL (1990) Delivering quality service
balancing customer perceptions and expectations NY Free Press
APPENDICES
55
APPENDIX A
แบบทดสอบความพงพอใจของผโดยสารการบนไทย
เรยนทานผโดยสารทเคารพ กระผมนาย วลาศ มนคงวณชกล พนกงานตอนรบสายการบนไทย และนกศกษาปรญญาโท หลกสตรภาษาองกฤษธรกจเพอการสอสารนานาชาต มหาวทยาลยศรนครนทรวโรฒ ไดจดท าแบบสอบถามนเพอเปนสวนหนงของการส ารวจความพงพอใจของผโดยสารทมตอคณภาพงานบรการ เทยวบนภายในประเทศของการบนไทย โดยมงหวงทจะน าขอมลทไดรบจากการส ารวจมาเปนประโยชนตอการสงเสรมสนบสนนการปฏบตงานใหเกดประสทธผล จงขอความกรณาจากทานในการตอบแบบสอบถามทกขอตามขอเทจจรงและความเหนของทาน ขอมลทงหมดเปนความลบ จะใชเพอการวจยเทานน และขอขอบคณในความรวมมอของทาน
helliphelliphelliphelliphelliphelliphelliphelliphelliphelliphelliphelliphelliphelliphelliphelliphelliphelliphelliphelliphelliphelliphelliphelliphelliphelliphelliphelliphelliphelliphellip
ค าชแจง โปรดท าเครองหมาย (x) ลงในชองวาง ทตรงกบค าตอบของทาน
ตอนท 1 ขอมลทวไป
1 เพศ ( ) ชาย ( ) หญง 2 อาย ( ) ตากวา 20 ป ( ) 21-40 ป ( ) 41-60 ป ( ) 60 ปขนไป 3 อาชพ ( ) ขาราชการ รฐวสาหกจ ( ) พนกงานบรษท ( ) ธรกจสวนตว ( ) นกเรยน นกศกษา ( ) เกษยณ ( ) อนๆ 4 รายได เดอน ( ) ตากวา 20000 ( ) 20001- 40000 บาท ( ) 40001- 60000 บาท ( ) 60001 บาท ขนไป 5 จดประสงคการเดนทาง ( ) ธรกจ ( ) พกผอน ( ) เยยมเยยนญาตมตร เพอนฝง ( ) อนๆ 6 ความถในการเดนทางกบการบนไทย (ในรอบ 12 เดอน) ( ) ครงแรก ( ) 2-3 ครง ( ) 4-10 ครง ( ) 10 ครงขนไป
56
ตอนท 2 ความพงพอใจของทานตอการบรการ (5 = เหนดวยอยางยง 4= เหนดวย 3= ปานกลาง 2=ไมเหนดวย 1=ไมเหนดวยอยางยง)
ระดบความพงพอใจ
การบรการของการบนไทย 5 4 3 2 1 1 เมอเจาหนาทสญญาทจะใหบรการทานในเรองใด จะทาตามนนเสมอ
2 การใหบรการของเจาหนาท สรางความเชอมนใหกบทาน
3 อปกรณบนเครองบนมรปแบบททนสมย (เชน จอทว ทนง)
4 บรษทฯกาหนดเวลาการใหบรการบนเครองเหมาะสม
5 เจาหนาทใหบรการทดนบตงแตกาวแรกบนเครอง
6 เจาหนาทมความตงใจดทจะชวยเหลอทาน เมอทานมปญหา
7 ทานรสกปลอดภยเมออยบนเครองบน
8 สงอานวยความสะดวกตางๆบนเครอง มรปลกษณทดงดดใจ (เชน กลองอาหาร) 9 เจาหนาทไมเขาใจความตองการของทาน ในบางกรณ
10 เจาหนาทไมไดระบเวลาในการใหบรการผโดยสารบนเครองทแนนอน 11 เจาหนาทพยายามทางานโดยไมใหเกดขอผดพลาด
12 เจาหนาทปฎบตงานดวยความสภาพเสมอ
13 เจาหนาทแตงกายเรยบรอยและดด
14 บรษทฯใหความเอาใจใสกบผโดยสารเปนรายบคคล
15 บางครงเจาหนาทไมเตมใจทจะใหบรการผโดยสาร
16 บรษทใหบรการทานตรงเวลาทกาหนด
17 เจาหนาทสามารถใหขอมลเกยวกบการเดนทางไดอยางถกตอง
18 เอกสารของบรษทฯทเกยวของกบการบรการ (เชน แผนพบ นตยสาร) มขอมลครบถวน และรปแบบสวยงาม 19 เจาหนาทใหบรการทานดวยสมผสความเปนไทย
20 เจาหนาทใหบรการผโดยสารอยางรวดเรว
ทานจะกลบมาใชบรการของการบนไทยตอไป จะใชบรการตอไป ไมใชบรการ
ขอเสนอแนะ_______________________________________________________
_____________________________________________________________ ขอบพระคณอยางสงในความรวมมอของทาน
57
APPENDIX B
Questionnaire
Dear Honorable Passengers
My name is Wilas Mankongvanichkul -- a THAI cabin crew and masterrsquos student of business English
for international communication program Srinakharinwirot University This questionnaire is about
an exploration of passengersrsquo satisfaction with service quality of Thai Airways International (TG)rsquos
domestic flights Data gained will be utilized for THAI service operation Please kindly complete the
questionnaire The data gained will be kept confidential and used for the research study only Your
kind cooperation is greatly appreciated
helliphelliphelliphelliphelliphelliphelliphelliphelliphelliphelliphelliphelliphelliphelliphelliphelliphelliphelliphelliphelliphelliphelliphelliphelliphellip
Direction Please mark (x) your answer in the space provided
Part 1 Personal Information
1 Gender
( ) Male ( ) Female
2 Age
( ) Under 20 years ( ) 21-40 years
( ) 41-60 years ( ) Above 60 years
3 Occupation
( ) Government official State enterprise employee
( ) Business employee
( ) Business owner ( ) Student
( ) Retiree ( ) Others
4 Monthly income
( ) Up to 20000 baht ( ) 20001- 40000 baht
( ) 40001 ndash 60000 baht ( ) 60001 baht and above
5 Purpose of travel
( ) Business trips ( ) Holidays
( ) Visits ( ) Others
6 Frequency in traveling with THAI (during the last 12 months)
( ) First time ( ) 2-3 times
( ) 4-10 times ( ) More than 10 times
58 Part 2 Your satisfaction with the service
(5=Strongly Agree 4= Agree 3=Uncertain 2=Disagree 1= Strongly Disagree)
Level of Satisfaction
The Service of THAI 5 4 3 2 1
1 When cabin crew promise to do something by a
certain time they do so
2 You can trust THAI cabin crew
3 TG has modern on board equipment
(such as TV screen passengersrsquo seats)
4 TG has operating hours on board convenient to all
passengers
5 Cabin crew offer good services upon boarding
6 When passengers have a problem cabin crew show a
sincere interest in solving it
7 Passengers feel safe on-board
8 The physical facilities of TG are visually appealing
(such as meal boxes)
9 Cabin crew do not understand your special needs in
some cases
10 Cabin crew do not tell passengers exactly when
services will be offered
11 Cabin crew insist on error-free records
12 Cabin crew are consistently courteous to passengers
13 Cabin crew are well-dressed and neat in appearance
14 TG gives passengers individual attention
15 Cabin crew are not always willing to help passengers
16 TG provides its services at the time it promises to
do so
17 Cabin crew are knowledgeable to answer passengers
travel-related questions
18 Documents about service are informative and appealing
(such as pamphlets and magazines)
19 Services provided have a ldquoThai Touchrdquo
20 Cabin crew are quick to respond to passengersrsquo requests
Will you come back for TGrsquos service Yes No
Suggestions________________________________________________________________
________________________________________________________________________ Thank you very much for your kind cooperation
59
APPENDIX C
Questionnaire Specification Based on SERVQUAL measurement (Parasuraman et al 1985)
Passengers satisfaction level toward service quality factors
No Service Quality Features (RATER)
Str
on
gly
ag
ree
Ag
ree
Un
certa
in
Dis
ag
ree
Str
on
gly
Dis
ag
ree
(5) (4) (3) (2) (1)
1 When cabin crew promise to do something by a certain time they do so Reliability
2 You can trust THAI cabin crew Assurance
3 TG has modern on board equipment (such as TV screen passengersrsquo seats) Tangibles
4 TG has operating hours on board convenient to all passengers Empathy
5 Cabin crew offer good services upon boarding Responsiveness
6 When passengers have a problem cabin crew show a sincere interest in solving it
Reliability
7 Passengers feel safe on-board Assurance
8 The physical facilities of TG are visually appealing (such as meal boxes) Tangibles
9 Cabin crew do not always understand your special needs in some cases Empathy
10 Cabin crew do not tell passengers exactly when services will be offered Responsiveness
11 Cabin crew insist on error-free records Reliability
12 Cabin crew are consistently courteous to passengers Assurance
13 Cabin crew are well-dressed and neat in appearance Tangibles
14 TG gives passengers individual attention Empathy
15 Cabin crew are not always willing to help passengers Responsiveness
16 TG provides its services at the time it promises to do so Reliability
17 Cabin crew are knowledgeable to answer passengers travel-related questions Assurance
18 TGs documents associated with services are informative and appealing (such as pamphlets and magazines)
Tangibles
19 Services provided have a ldquoThai Touchrdquo Empathy
20 Cabin crew are quick to respond to passengersrsquo requests Responsiveness
VITAE
61
VITAE
Name Wilas Mankongvanichkul
Date of Birth February 14 1980
Place of Birth Bangkok
Address 688 Soi Phaholyothin 32 Chankasem Jatuchak
Bangkok 10900
Present Occupation Cabin Crew
Thai Airways International Public Company Limited
89 Vibhavadi Rangsit Road Bangkok 10110
Education Background
2010 Master of Art (Business English for International
Communication)
Srinakharinwirot University
2001 Bachelor of Business Administration Bangkok University
1997 High School Saint Dominic School
- Cover
- Abstract
- Chapter 1
- Chapter 2
- Chapter 3
- Chapter 4
- Chapter 5
- Bibliography
- Appendix
- Vitae
-

10
To ensure highly perceived quality and to maintain loyal customer base service
providers need to be accurate and reasonable about what they lead customers to expect
They also need to do a good job in the areas of reliability assurance tangibles empathy
and responsiveness It is difficult for companies to get ahead of the competition and the
nature of competition in the service industry is more difficult to protect from imitation
Competitors are increasingly forced to imitate the best features of one another
Therefore any competitors who try to invest more energy and resources in building
strong service quality are most likely to be winners (Gilbert 1999)
Factors Affecting Consumers Expectation
The key factors influencing consumersrsquo view on service quality include word of
mouth personal needs customersrsquo past experience and external communication
(Parasuraman et al 1985)
Word of mouth is particularly important because when consumers are satisfied or
dissatisfied with the service they are likely to share it with their friends Service is
generally classified as intangible Customers cannot actually ldquoseerdquo the service until they
experience it Before making a purchase customers need to find out as much information
as possible so as to make a good decision Word of mouth is a means to make a
consumer feel interested or uninterested in the service
Personal needs are considered another important factor They deal with the
motives that determine the nature and strength of what a consumer expects from a
service
Meanwhile past experience refers to what consumers have learned through their
personal interaction with a service provider It is particularly important in shaping
customersrsquo expectations
11
The last factor is external communication comprising such as direct sale and
advertisement in order to communicate and position a service through messages which
can influence consumer perceptions
In summary each factor can individually or harmoniously affect consumersrsquo
purchasing decision Customer satisfaction is a key to business success In order to make
customers satisfied a company needs to understand their expectations and perception by
studying the factors that affect their purchasing decision
23 Service Quality
A search for the definition of ldquoqualityrdquo has yielded inconsistent results Quality
has been variously defined as fitness for use in the product which successfully serves the
purpose of the user during usage (Juran amp Gryna 1974) In addition Zeithaml et al
(1990) state that ldquoqualityrdquo is what exceeds the customersrsquo expectation of the service
On the other hand quality is a characteristic of thoughts and statements believed
to be taken for granted if an explanation of quality is going to be both false and true
precisely (Pirsig 1987) Pirsig also says that since definitions derive from abstract and
formal thinking quality cannot be defined it is impossible to define quality because
quality can never be considered independently but only in relation to what is perceived
Measuring Quality in Service
Parasuraman et al (1985) point out that service quality is more difficult for the
consumers to evaluate than the product quality Perception of service quality results from
a comparison of customer expectations with actual service performance Quality
evaluations are made not only from the outcome of a service but also from the ldquoprocessrdquo
12
of service delivery and the customers have fewer tangible characters to be measured
physically when purchasing services than when purchasing products (Gronroos 1978)
Service quality is the degree of how well the service level delivered matches
customer expectations Delivering quality service means that the service provider needs
to follow customer expectations on a consistent basis (Lewis amp Booms 1983)
To conclude three underlying service quality themes can be drawn from the
discussion as follows
Service quality is more difficult for the customer to evaluate than product quality
Service quality perceptions result from a comparison of consumer expectations
with actual service performance
Quality evaluations are not made solely on the outcome of a service They
involve evaluations of the process of service delivery
The Benefits of Service Quality
The benefits of service quality comprise four areas as follows (Kotler 2000)
Customers Retention High quality builds loyal customers and creates positive word of
mouth which is an important factor in purchase decision This can determine customer
satisfaction which affects repeat business If a customer is happy with an existing firm it
is difficult to convince him or her to move to another
Avoidance of Price Competition A firm with a reputation for high quality has
a much stronger competitive position than one with a reputation for poor quality Price-
cutting by a competitor will not be enough to encourage a client to switch Good quality
is more powerful to remain competitive
13
Retention of Good Employees Employees appreciate working in operations
that are well run and produce quality products They do not enjoy receiving customer
complaints Also turnover and loss of employee morale are listed as costs of poor quality
manpower When an operation has good quality it can retain good employees And at
the time business expansion is needed recruiting is easier and training cost is reduced
Reduction of Costs The quality cost includes internal costs external costs and
quality system costs Internal costs are those associated with correcting problems
discovered by the firm before products reached customers External costs are related to
errors that the customers experience They can be very expensive when the customers
decide not to return because of a service problem Then the promotional and advertising
costs or external costs are necessary to be spent to create the company image in order to
make customers come back and win brand loyalty for the company in the end However
the company needs to check the service quality through customersrsquo feedback periodically
to avoid problems
Although the quality service system does not come without costs it is usually less
than those internal and external costs resulting from poor quality service Some examples
of the costs of a quality system include customer service audits trainings management
meetings with employees and customers and introduction of a new technology (Kotler
Bowen amp Makens 1999)
To sum up it is necessary for a service company to know the service quality level
The quality needs to be evaluated by comparing customer experience with service
performance Once a service company reaches a good quality level a company will
retain its customers easily be away from price wars keep and get good employees and
reduce some operation costs
14
Thai Airways In-flight Service Quality
The latest airline evaluation in 2009 by Skytrax from United Kingdom which is a
research organization focused on in-flight services revealed that TG got the official 4-star
ranking for its product and service quality This honor is awarded to airlines which
deliver a good quality performance
Skytrax also disclosed that for short travels or domestic routes two traveling
classes are business class and economy class The overall evaluation of the domestic
route showed that TGrsquos business class was rated excellent (5-star) in two articles which
are ldquowashroom cleanlinessrdquo and ldquonewspaper amp magazinerdquo in terms of ldquoonboard productrdquo
category Meanwhile TG also got the highest rank in terms of ldquoservice efficiencyrdquo and
ldquoresponding to requestsrdquo in ldquocabin staff servicerdquo categories In addition in the economy
class TG could do superbly in three articles of cabin staff service which were ldquoservice
efficiencyrdquo ldquoenthusiasm and attituderdquo and ldquofriendliness and hospitalityrdquo (ldquoTHAI
AIRWAYS INTL Official 4-Star Ranking of Product and Service Qualityrdquo 2009)
In conclusion TG has been recognized internationally however it still needs to
move ahead The quality ranking is useful for TG to realize that the company needs to
develop its products and services in all categories in order to step up and well-prepared
for competitions in the future
24 SERVQUAL Model
SERVQUAL is an instrument used for measuring how customers perceive the
quality of the service This instrument is based on five dimensions and on a comparison
between customersrsquo expectations of how the service should be performed and their
experiences of how the service is actually performed Usually 20 attributes are used to
describe the five dimensions and participants are asked to state what they expect from the
15
service and how they perceive the service on a five-point scale from ldquoexcellentrdquo to
ldquopoorrdquo Based on the difference between expectations and experiences over the 20
attributes an overall quality score can be calculated The higher the score shows that
experiences are below expectation the lower the perceived quality (Parasuraman amp
Berry 1991)
SERVQUAL consists of five dimensions (RATER) as follows (Parasuraman et
al 1985)
Reliability This means that a service firm provides its customers with accurate
service the first time without making any mistakes and delivers what it has promised to
do by the time that has been committed
Assurance This means that employeesrsquo behaviors give customers confidence in
the firm and that the firm makes customers feel safe It also means that the employees are
always courteous and have the necessary knowledge to respond to customers questions
Tangibles This dimension relates to the appeal of facilities equipment and
materials used by a service firm as well as to the appearance of service employees
Empathy This means that the firm understands the customersrsquo problems and
performs in their best interests as well as giving customers individual personal attention
and having convenient operating hours
Responsiveness This means that employees of a service firm are willing to help
customers and respond to their requests as well as to inform customers when service will
be provided and give prompt service
16
Application of SERVQUAL Model in Hospitality Business
The SERVQUAL instrument has been used to assess the quality of a wide range
of services in the United States such as financial service operations telephone services
repair and maintenance services (Parasuraman et al 1988) and other professional
services (Bojanic 1991) Fick and Ritchie (1991) have employed the SERVQUAL
instrument to compare services provided by various types of organizations within the
travel and tourism industry Oberoi and Hales (1990) have examined the SERVQUAL
approach as a basis for measuring the quality of the conference hotel products Many
researchers of other service businesses believed that ldquoSERVQUALrdquo is a concise multiple-
item scale with good reliability and validity (Buttle 1996 Lages amp Fernandes 2005)
In Thailand Boontaganon (2002) studied the service quality of fast food
restaurants in Bangkok by using SERVQUAL The study examined the differences in
service quality expectations and perceptions based on demographic characteristics
including gender age occupation education and income level 360 questionnaires were
distributed to people who had just exited from fast food outlets in Bangkok The results
showed significant differences in service quality of customer expectations and
perceptions which indicated the unacceptable service quality delivered by fast food
restaurants in Bangkok
Suthirungkul (2003) studied the customer expectations and perceptions of service
quality of the Clark Hatch Fitness Center at Silom Road Branch Bangkok The objectives
of the study were to identify the SERVQUAL dimensions that customers both local and
foreign used to evaluate The Clark Hatch Fitness Center to study the customer
expectations towards the services quality that should be provided and to evaluate the
perceptions of service quality that customers obtained after using service The
questionnaire was used as a tool for collecting the data 277 Thai and foreign members of
17
the Clark Hatch Fitness Center at Silom Road Branch were the research participants The
results of the study were that there existed gaps between expectations and perceptions in
terms of the five SERVQUAL dimensions and the demographic characteristics had
influenced the gap scores
In short SERVQUAL is an effective measuring tool This tool has widely been
used in many previous studies in hospitality business both domestically and
internationally
25 Demographic Variables
In general business sector market segmentation is often based on demographic
profiles (Reid amp Bojanic 2001) in order that marketers can choose the proper service
segmentation strategies to satisfy different target market segments Demographics are the
variables about consumersrsquo wants preferences and usage rates are often associated with
demographic variables Moreover the demographic variables are easier to measure
(Kotler 2000) Important demographics are as follows
1 Gender There is no logical reason to expect biology to account for this
difference between the sexes The explanation may be in socialization differences and
personality disposition Feminine gender identity is characterized by traits such as
expensiveness and emotionalism and other orientation while masculine gender identity is
characterized by independence activity and self orientation (Kotler amp Scheff 1997)
2 Age Consumersrsquo wants and abilities change with age People buy different
goods and services over their lifetime Peoplersquos tastes in different products and services
are also related to age (Kotler 2000)
18
3 Occupation This variable reflects values attitudes taste and lifestyle
Occupation and income tended to be closely correlation on almost cause-and-effect
relationship (Schiffman amp Kanuk 1994)
4 Income Consumers form a purchase intention based on such factors and
expected family income price and expected benefits from the product and services
(Kotler 1997)
5 Purpose of Travel The purpose of travel measure the frequent distribution
The purposes of travel are for such as business holiday visiting friends and relative and
others (ldquoTravel Planningrdquo 2010)
6 Frequency of Travel A critical factor in predicting the demand for tourism
within a certain period of time is the number of trips individuals take New touristsrsquo
behavior shows a tendency toward more frequent travel (Alegre amp Pou 2006)
To recap the demographic profiles play a significant role in planning service to
meet passengersrsquo satisfaction In airline business six features of the demographics were
included in this study
26 Previous Studies on Airline Passengersrsquo Satisfaction
In an airline business the major revenue of a company comes from the number of
passengers rather than a total sum of cargo service aircraft maintenance or catering
supply all together Studies on airline passengersrsquo satisfaction are numerous as the
following examples
Gilbert and Wong (2003) identified the service dimensions that matter most to
current airline passengers The study measured and compared differences in passengersrsquo
expectations of the desired airline service quality in terms of reliability assurance
19
facilities employees flight patterns customization and responsiveness The primary data
were collected from passengers departing from Hong Kong airport Regarding the
service dimension expectations it was found that there were no statistically significant
differences between passengers who made their own airline choice (decision makers) and
those who did not (non-decision makers) However there were significant differences
among passengers of different ethnic groups nationalities as well as among passengers
who traveled for different purposes such as business holiday and visiting friends or
relatives
The findings also indicated that passengers consistently ranked lsquoassurancersquo as the
most important service dimension It showed that the passengers were concerned about
the safety and security aspects and this also indicated why there had been such a
downturn in demand as this study was conducted just prior to the World Trade Center
incident on September11 2001
In Thailand Somwang (2008) assessed the passengersrsquo views of service quality in
Thai low cost airlines The research was based on the principle that passengers evaluated
airline service quality through a comparison between their experiences and expectations
over a number of quality attributes The study evaluated passengersrsquo perceived service
quality of Thai low cost carriers based on the SERVQUAL instrument The findings
indicated that the passengersrsquo expectations on service quality were higher than what they
had actually experienced Further analysis showed that female passengers had lower
perceived service quality than male passengers The findings also revealed that higher
monthly income had greater differences with respect to expectations and perceptions than
lower income respondents Furthermore passengers usually traveled with low cost
carriers for three main purposes which were for leisure visiting friends or relatives and
business
20
In brief the previous studies explored the satisfaction of airline passengers by
using SERVQUAL instrument to measure the service quality The results above found
out the differences between customersrsquo expectations and perceptions The findings of a
study in Hong Kong revealed the passengersrsquo satisfaction on the dimensions of the
service quality Meanwhile a study in Thailand implied some findings about the
demographic profiles resulting in service quality Studies on service quality help improve
business organizations retain customers and attract new customers
CHAPTER THREE
METHODOLOGY
This chapter consists of four sections participants of the study research
instrument procedures of the study and data analysis
31 Participants of the Study
One hundred and fifty Thai passengers 75 males and 75 females who took the
TG Bangkok - Chiangmai route were randomly chosen as participants for the study
Since there are about 150 passenger seats in each flight the researcher randomly acquired
a sample size of 10 percent of the overall passengers from the ten flights totaling 150
Thai people are the main group of passengers who travel domestically over the year The
researcher therefore decided to select only the Thai passengers as the participants for the
study Also so as to cover various types of passengers the researcher included flights of
different time within a day (as shown in a following part of this chapter) for a reason that
passengers with some specific purposes chose to travel at some specific time For
example business people might prefer an early morning flight rather than a later-in-the-
day one
TGrsquos Bangkok ndash Chiangmai route has been considered one of the most frequent
domestic routes (THAI 2009) TG operates ten flights daily from Bangkok to
Chiangmai The researcher consequently chose this route for this research work to
assess the passengersrsquo satisfaction with TGrsquos service quality
The study was conducted in early March when it was still in the high season for
travels to the northern province of Thailand Fifteen passengers from each of the ten
flights of the Bangkok - Chiangmai route were asked to fill out the questionnaire at the
22
end of the on-board service while the plane was approaching Chiangmai its destination
All the 150 completed questionnaires were obtained as planned
32 Research Instrument
A questionnaire in Thai was used for data collection The questionnaire was
divided into three parts The first part was about the respondentsrsquo demographic profile
since consumersrsquo needs preferences and personalization are often associated with
demographic factors (Kotler 2000) Six demographic characteristics related to in-flight
service (Cheosakul 2004) consisting of gender age occupation monthly income
purpose of travel and travel frequency with THAI were demographic issues of the survey
The second part comprised questions about passengersrsquo satisfaction with the service
during the flight This part of the questionnaire was based on the SERVQUAL
instrument for measuring customersrsquo satisfaction in five dimensions of service reliability
assurance tangibles empathy and responsiveness (Parasuraman et al 1985) The last
part comprised a question and a blank space provided for suggestions on TGrsquos service
quality
33 Procedures of the Study
The questionnaire was initially approved by the researcherrsquos masterrsquos project
advisor and two specialists a TG in-flight service manager and a SWU lecturer Then a
pilot study was conducted to ten passengers to check for content reliability the
appropriateness of the number of questions and language used in the questionnaire As
the researcher included all the ten flights of TGrsquos Bangkok - Chiangmai route in the
study the tried-out questionnaire was randomly distributed to ten TG passengers (5 males
and 5 females) on each flight of the aforementioned route on the same day in February
23
2010 Also since this study was about onboard service the questionnaire was distributed
to the participants after the in-flight service was completed and before the plane landed
After that the questionnaire was adjusted and prepared for the actual survey
The revised questionnaire was eventually distributed to 150 participants in ten
consecutive days in early March 2010 Fifteen passengers in each Bangkok -
Chiangmai flight per day were randomly asked to fill out the questionnaire after the
completion of in-flight service
The plan below showed the ten flights of for the survey each flight for a day to
make sure that the data gained were reliable
BKK-CNX Flight (TG) Flight Schedule (Departure-Arrival)
TG100 0615-0725
TG102 0750-0910
TG104 0910-1030
TG106 1020-1140
TG110 1250-1400
TG112 1400-1510
TG114 1540-1650
TG116 1715-1825
TG120 1900-2010
TG122 2130-2240
34 Data Analysis
The data acquired from the questionnaires were analyzed in three sections
demographic profile of passengers level of passengersrsquo satisfaction with TGrsquos service
and the relationship between demographic profile and passengersrsquo satisfaction based on
24
Likert scale The 5-point Likert scales were used to rate the level of satisfaction as shown
in Table 1 below
Table 1 Intervals of Satisfaction Level (Poonlarbtawee 1987)
The interpretation of the scales in this study is as follows
Rating
Scale
Level of
Agreement Disagreement
Satisfaction
Level
Mean Score
5 Strongly agree Excellent 451-500
4 Agree Good 351-450
3 Uncertain Average 251-350
2 Disagree Fair 151-250
1 Strongly disagree Poor 100-150
The researcher picked up lsquothe high grouprsquo and lsquothe low grouprsquo of each
SERVQUAL dimension to present the relationship between the participantsrsquo
demographic profile and their satisfaction As the data gained from the highest number of
the participants or the high group was the major point that the researcher relied on focus
was on the majority opinion At the same time the data gathered from the lowest number
of the participants or the low group should not be overlooked because each and all
passengers are important for TG and in the high competitive airline market it is necessary
to retain each and every passenger so as to grow far in the aviation business
The results were presented in terms of percentages and mean scores in the form of
tables and a bar chart These fundamental statistic methods were proper in this study
25
because percentages and mean scores are considered the basic statistics used for data
analysis and presentation Also the general public can easily understand the
interpretation of the data Another reason was that the sample group of this study
comprised only 150 TG passengers The researcher therefore decided to apply the
aforementioned statistics in this research Discussion of the results was also offered
CHAPTER FOUR
FINDINGS
This chapter describes the findings of the study consisting of the demographic
data of the participants level of their satisfaction with TGrsquos service quality relationship
between the demographic data and five dimensions of SERVQUAL instrument and the
uncovers to the last question on the questionnaire including suggestion
41 Demographic Data
The demographic data of TGrsquos research participants in terms of age occupation
monthly income purpose of travel and frequency of travel are presented in Tables 2- 6
below
Table 2 Participantsrsquo Age
Age No of Participants Percentage ()
Under 20 years
21-40 years
41-60 years
Above 60 years
8
85
45
12
53
567
300
80
Total 150 100
Regarding the age group the highest number of the passengers was 20-40 years
old or 567 30 of them were 46-60 years old and 8 were above 60 years old Only
53 were under 20 years old
27
Table 3 Participantsrsquo Occupation
Occupation No of Participants Percentage ()
Government official State enterprise employee
Business employee
Business owner
Student
Retiree
Others
22
63
37
13
9
6
147
420
247
86
60
40
Total 150 100
In terms of occupation the highest number of the participants was business
employees (42) followed by business owners (247) government officials or state
enterprise employees (147) students (86) retirees (6) and other occupations (4)
respectively
Table 4 Monthly Income
Monthly income (baht) No of Participants Percentage ()
Up to 20000
20001- 40000
40001 - 60000
60001 and above
58
72
11
9
386
480
74
60
Total 150 100
For the income the highest number of the participants earned 20001-40000 baht
monthly (48) followed by those with a monthly income of up to 20000 baht (386)
28
of 40001-60000 baht monthly (64) and of 60001 baht and above monthly was the
lowest (6)
Table 5 Purpose of Travel
Purpose of travel No of Participants Percentage ()
Business trips
Holidays
Visits
Others
41
79
27
3
273
527
180
20
Total 150 100
Regarding the purpose of travel the highest number of the passengers traveled via
TG on holidays (527) followed by those who traveled on business trips (273)
Meanwhile those who made a visit were at 180 and who traveled with other purposes
were at 2
Table 6 Frequency of Travel
Frequency in traveling with THAI
(during the last 12 months)
No of Participants Percentage ()
First time
2-3 times
4-10 times
More than 10 times
39
99
10
2
260
660
67
13
Total 150 100
29
The last demographic data derive from the frequency in traveling with THAI
66 of the participants indicated that they traveled 2-3 times during the last 12 months
26 traveled for the first time while 67 for 4-10 times and 13 for more than 10
times during the last 12 months
In conclusion the demographic data shown in the tables above indicated that lsquothe
high grouprsquo comprised the following characteristics The age group of the majority
number of the participants ranged from 21-40 years (567) Most of them were business
employees (42) The highest number of the passengersrsquo monthly income was around
20000 ndash 40000 baht per month (48) The majority of the passengers traveled on
holidays (527) by TG 2-3 times in the past 12 months (66)
Meanwhile lsquothe low grouprsquo was found having the following characteristics The
lowest number of the research participants was under 20 years old or 53 Only 47 of
the participants had other kinds of occupation which were not indicated on the
questionnaire while only 6 of the participants earned 60001 baht or above monthly
2 of the participants traveled on other purposes besides those shown on the
questionnaire Lastly 13 of the passengers were those who traveled by TG more than
10 times in the past 12 months
42 Level of Passengersrsquo Satisfaction
Figure 1 below is the conclusion from the second part of the questionnaire The
150 participants were asked to rate the level of service quality that they perceived from
the TGrsquos domestic flights on Bangkok - Chiangmai route The questionnaire was divided
into five dimensions of SERVQUALrsquos (Parasuraman et al 1985) service quality which
comprised reliability assurance tangibles empathy and responsiveness The scales 1 to 5
ranged from lsquostrongly disagreersquo to lsquostrongly agreersquo
30
0
5
Reliability Assurance Tangibles Empathy Responsiveness
280
345 334307
269
SERVQUAL Dimension
Figure 1 Overall Level of Participants Satisfaction
Mean scores
Figure 1 shows the average mean score of all 150 passengersrsquo satisfaction on five
dimensions of service quality ranging from the mean scores of 345 to 269 The results
revealed that the most important service quality dimension for the whole samples group
of passengers was assurance ( 345) followed by tangibles ( 334) empathy ( 307)
reliability ( 28) and responsiveness ( 269) respectively The overall average mean
was 307
43 Passengersrsquo Satisfaction Level in Relationship with Their Demographic Data
This section shows the relationship between the demographic data (age
occupation monthly income purpose of travel and travel frequency) of the participants
and their satisfaction with the service quality of TGrsquos in-flight service
The researcher focused on each category of demographic characteristics of two
major groups a group with the highest score and the other with the lowest score In fact
the most important data were the majority opinion of the sample group In other words
for this study it was lsquothe high grouprsquo However the researcher as a TG cabin crew gave
importance to the low group as well since each and every passenger is significant to TG
x
x x x
x x
31
business particularly in the high competitive market of airline business The researcher
was interested to know what the passengers in the lsquolow grouprsquo thought about the in-flight
service and what their feedback was
The following tables (Tables 7-11) illustrate the relationship between each
dimension of the demographic data and the SERVQUAL service assessment tool and the
following symbols are applied in the tables below
lsquoNrsquo means the number of the participants
lsquo rsquo means the mean score
lsquoThe high grouprsquo means the group that comprises the highest number of participants
lsquoThe low grouprsquo means the group that comprises the lowest number of participants
Table 7 Relationship between the Participantsrsquo Age and their Satisfaction with In-flight
Service
SERVQUALrsquoS
RATER
Average
Mean Score
of All Groups
The High Group
(Age 20-40 Yrs Old)
N = 85567
The Low Group
(Age Under 20 Yrs Old)
N = 853
Mean Score of Each Group
Reliability 280 278 270
Assurance 345 378 335
Tangibles 334 331 328
Empathy 307 309 314
Responsiveness 269 267 290
Table 7 reveals the connection between the participantsrsquo age and the five
dimensions of the SERVQUAL instrument The high group had higher mean scores for
x
32
three dimensions than the low group In other words the participants with an age range
of 20-40 years were more satisfied with TGrsquos service quality in terms of reliability
assurance tangibles than those who were under 20 years old Meanwhile the low group
had higher mean scores for two dimensions than the high group This means the
participants who were lower than 20 years old were more satisfied with the in-flight
service in terms of empathy and responsiveness than those whose ages ranged from 20-40
years
Interestingly it was found that both groups have a lower mean score for the
reliability dimension ( 278 and 270) than the average mean score of all the age groups
in this study ( 28)
Table 8 Relationship between the Participantsrsquo Occupation and their Satisfaction with In-
flight Service
SERVQUALrsquoS
RATER
Average
Mean Score
of All Groups
The High Group
(Business Employee)
N = 63420
The Low Group
(Others)
N = 640
Mean Score of Each Group
Reliability 280 275 284
Assurance 345 347 348
Tangibles 334 331 336
Empathy 307 310 305
Responsiveness 269 264 277
Table 8 illustrates the connection between the participantsrsquo occupations and the
five dimensions of the SERVQUAL instrument The low group had higher mean scores
x
x
33
for almost all the dimensions of SERVQUALrsquos RATER than the high group except for
one dimension In other words the participants who worked as business employees were
less satisfied with TGrsquos service quality in terms of reliability assurance tangibles and
responsiveness than those whose occupations were not specified in the questionnaire
Empathy was the only dimension of service quality that the participants who were in the
high group were satisfied with
Table 9 Relationship between the Participantsrsquo Income and their Satisfaction with In-
flight Service
SERVQUALrsquoS
RATER
Average
Mean Score
of All Groups
The High Group
(20001-40000)
N = 72480
The Low Group
(60001 and above)
N = 960
Mean Score of Each Group
Reliability 280 273 285
Assurance 345 349 350
Tangibles 334 332 321
Empathy 307 301 325
Responsiveness 269 262 273
Table 9 indicates the connection between the participantsrsquo monthly income and
the five dimensions of the SERVQUAL instrument The low group had higher mean
scores for almost all the dimensions of RATER than the high group except for one
dimension In other words the participants who earned monthly income of 20001 ndash
40000 baht were less satisfied with TGrsquos service quality in terms of reliability assurance
empathy and responsiveness than those who earned monthly income of 60001 baht and
34
above The tangibles dimension was the only service quality issue that the participants
who were in the high group were satisfied with
Table 10 Relationship between the Participantsrsquo Purpose of Travel and their Satisfaction
with In-flight Service
SERVQUALrsquoS
RATER
Average
Mean Score
of All Groups
The High Group
(Holidays)
N = 79527
The Low Group
(Others)
N = 320
Mean Score of Each Group
Reliability 280 279 285
Assurance 345 353 349
Tangibles 334 335 338
Empathy 307 308 312
Responsiveness 269 270 275
Table 10 reflects the connection between the participantsrsquo purpose of travel and
the five dimensions of the SERVQUAL instrument The low group had higher mean
scores for almost all the dimensions than the high group except for one dimension In
other words the participants who traveled on holidays were less satisfied with TGrsquos
service quality in terms of reliability tangibles empathy and responsiveness than those
whose purpose of travel were not specified in the questionnaire Assurance was the only
dimension of service quality that the participants who were in the high group were
satisfied with
35
Interestingly it was found that both groups has a higher satisfaction level for the
assurance tangibles empathy and responsiveness dimensions than the average mean
scores of the whole sample group
Table 11 Relationship between the Participantsrsquo Frequency of Travel with THAI and their
Satisfaction with In-flight Service
SERVQUALrsquoS
RATER
Average Mean
Score of All
Groups
The High
Group
(2-3 timesyear)
N = 99660
The Low Group
(more than 10
timesyear)
N = 213
Mean Score of Each Group
Reliability 280 281 295
Assurance 345 346 360
Tangibles 334 335 343
Empathy 307 308 321
Responsiveness 269 270 292
Table 11 presents the connection between the participantsrsquo frequency of travel
with THAI and the five dimensions of the SERVQUAL instrument The low group had
higher mean scores for all the dimensions of RATER than the high group In other
words the participants who traveled 2-3 times in the last 12 months were less satisfied
with TGrsquos service quality in terms of reliability assurance tangibles empathy and
responsiveness than those whose frequency of travel were more than 10 times in the last
12 months
36
Interestingly it was found that both groups has a higher satisfaction level for all
the five RATER dimensions than the average mean scores of the whole sample group in
this study
44 Other Comments
The last part of the questionnaire was designed to ask whether the participants
would continue using TGrsquos service The findings disclosed that 142 participants or
946 indicated that they would while 8 of them or 54 declined
Also at the end of the questionnaire there was a blank space for the participants to
freely express their own ideas and suggestions on TGrsquos service However only 7
participants or 46 gave suggestions regarding the in-flight service Four of the
participants were dissatisfied with the flavor of the snacks provided on board One
complained that it was not cool enough in the cabin while one was upset for not being
granted for a request for a blanket The last one commented that the passengerrsquos seat was
not comfortable
In summary the passengersrsquo satisfaction level of the service quality in connection
with their demographic data was introduced Five out of the six demographic
characteristics the participantsrsquo age occupation monthly income purpose of travel and
frequency of travel were analyzed in connection with the five dimensions of SERVQUAL
instrument reliability assurance tangibles empathy and responsiveness It was observed
that there were some connection between these two matters in various ways as earlier
discussed Lastly it was found that one hundred and forty-two participants would
continue using TGrsquos service while the rest refused Only seven of all the participants or
46 gave some comments on the open-ended suggestion part
CHAPTER FIVE
CONCLUSION AND DISCUSSION
This chapter presents the conclusion discussion limitations of the study and
recommendations for further studies
51 Conclusion
This research aimed to examine the service quality provided by Thai Airways
International on its domestic flights One hundred and fifty passengers who traveled by
TG on the Bangkok - Chiang Mai route were the research participants The SERVQUAL
instrument was used as an instrument for data collection in the survey This instrument
was based on five determinants proposed by Panasuraman etal (1985) in terms of
reliability assurance tangibles empathy and responsiveness This research was also
conducted on the demographic characteristics comprising gender age occupation
monthly income purpose of travel and frequency in traveling and the relationship of these
characteristics except the gender with the passengersrsquo satisfaction with TGrsquos in-flight
service quality The questionnaires were distributed in early March 2010
The results showed that all the participantsrsquo satisfaction based on the five
dimensions was at the average level The highest level of passengersrsquo satisfaction was
placed on the assurance dimension followed by tangibles and empathy dimensions
accordingly The two lowest levels of the passengersrsquo satisfaction were placed on the
responsiveness and reliability dimensions
In addition a summary of the demographic characteristics showed that the high
group or the group with the highest number of participants was business employees The
highest number of the participants was between 21-40 years old The highest number of
38
the participantsrsquo income ranged from 20000 ndash 40000 baht monthly Also the high
grouprsquos purpose of travel was to go on holiday Lastly the highest number of the
participants traveled via TG only 2-3 times during the past 12 months
Meanwhile the low group or the group with the lowest number of participants
was passengers with other kinds of occupations which were not specified on the
questionnaire The low group of the participants was under 20 years old The low group
of the participantsrsquo income ranged from 60001 baht monthly or higher Also the low
group revealed that they traveled via TG for other purposes which were not indicated on
the questionnaire Lastly the passengers who traveled via TG more than 10 times during
the past 12 months belonged in the low group
It has also been discovered that as a whole both groups the high and low groups
were in the same direction in their satisfaction with the five dimensions of service quality
The two groups were satisfied with the service quality dimensions in terms of assurance
at the highest level followed by tangibles empathy reliability and responsiveness
respectively
However when analyzing each demographic characteristic the participants who
were under 20 years old rated the responsiveness dimension higher than the reliability
dimension Also for those participants whose income was around 60001 or higher the
empathy dimension was rated higher than the tangibles Regarding the occupation
business people were satisfied with the reliability and responsiveness dimensions at a
very low level Meanwhile the participants who traveled via TG on their holidays rated
the assurance dimension at a very high level Lastly frequent fliers who traveled by
THAI more than 10 times were most satisfied with TGrsquos service since they rated all
RATER aspects highly
39
52 Discussion
The findings have revealed the answers to the research questions First the
demographic data of the participants gender age occupation monthly income purpose
of travel and frequency of travel were shown Second the level of the passengersrsquo
satisfaction toward the service quality on Thai Airways Internationalrsquos domestic flights in
terms of the SERVQUAL instrument (Parasuraman et al 1985) reliability assurance
tangibles empathy and responsiveness was disclosed Also the results about the
relationship between the passengersrsquo satisfaction and their demographic data were pointed
out
The results of the survey indicated that out of the five dimensions assurance was
rated at the highest level ( 345) followed by tangibles ( 334) and empathy ( 307)
(See Figure 1) In addition passengers rated their highest satisfaction with the assurance
dimension which included cabin crewrsquos job knowledge their courtesy confidence in their
service ability and safety while traveling It may be because TG cabin crew are well-
trained prior to their actual service work on board This can also ensure passengersrsquo
safety Particularly the safety and security features have been the most concerns of
airline passengers since the 9-11 incidents in New York USA This is why most
customers rated their highest satisfaction with the assurance dimension (Carman 1990)
The findings of this study are also consistent with those of Fick and Ritchie (1991)
who studied the operation of the SERVQUAL instrument in three major tourism sectors
airlines restaurants and ski area services It was revealed that the most important
dimensions of the service were assurance and tangibles If companies were unable to
inspire trust and confidence in their customers and the tangibles are not impressive it
would be difficult for them to achieve a high level of customerrsquos satisfaction (Sachukorn
2000)
x x x
40
Responsiveness is often found as the lowest level of satisfaction among customers
in the service industry It is plausible that the staff were too busy to provide prompt and
good service (Kholthanasep 2001) In this study the results revealed that the
responsiveness dimension was rated at the lowest score ( 269) among the five
dimensions followed by the reliability ( 280) dimension It was highly possible that the
passengersrsquo dissatisfaction occurred when passengers did not receive prompt service from
TG when they needed help
Prompt service is an important factor of customersrsquo expectation Customers
generally rate the service as poor when the speed of service does not meet their
expectations (Kholthanasep 2001) Bojanic and Rosen (1994) examined the nature of the
association between service quality as perceived by consumers and its determinants by
applying SERVQUAL in a restaurant setting They found that customers rated
responsiveness as the lowest satisfaction in their studies Zeithaml et al (1990) explained
that the responsiveness dimension in the SERVQUAL was willingness to help customers
and provide prompt service As the responsiveness dimension in this research comprised
prompt service willingness on-time service and quick response therefore it will be
beneficial to TG if the company can ensure that the service provided by its cabin crew
especially the willingness to help passengers and to provide prompt service meet
passengersrsquo satisfaction
Regarding the relationship between the participantsrsquo demographic data and their
satisfaction with the service quality there are many points of interests to be discussed as
follows
Firstly regarding the relationship of the passengersrsquo satisfaction with the service
and their age those who were under 20 years old rated satisfaction with the
responsiveness dimension ( 290) higher than the reliability dimension ( 270) (See
x
x
x x
41
Table 7) It was possible that young passengers usually gave priority to the dimension of
care and service when compared with that of the service providersrsquo accurate and
dependable manner (Panittumrong 2003) In addition young customers had less
experience in a service and it was difficult to compare the current service with the past
experience consequently they were more satisfied with the service provided than senior
customers
Another point was raised about the participantsrsquo age The study revealed that the
number of the high group with the age range of 21- 40 was at 567 However that of
the second highest group of the participants with the age range of 41-60 was at 30
which was rather high This latter grouprsquos level of satisfaction on the service quality was
also close to the average mean score It was found that the average mean score of the
reliability dimension was 280 while that of the second highest group was 281 the
average mean score of the assurance dimension was 345 while that of the second highest
group was 347 the average mean score of the tangibles dimension was 334 while that of
the second highest group was 335 the average mean score of the empathy dimension and
that of the second highest group was rated at 307 equally and the average mean score of
the responsiveness was 269 while that of the second highest group was 271 In sum if
consider the two groups in terms of the participantsrsquo age one of the high group and the
other with the second high group the results confirmed that the satisfaction level of the
majority of passengers was at the above average level
Secondly regarding the relationship between the participantsrsquo satisfaction and
their occupation business employees who were found at the highest number (42) had
very low satisfaction with the service quality in terms of reliability ( 275) and
responsiveness ( 264) while the mean scores of the whole sample group for these two
dimensions were at 280 and 269 respectively (See Table 8) The findings strongly
x
x
42
correlated with that of Cheaosakul (2004) who studied the consumersrsquo perception of
airline service quality with a focus on occupations It was found that the group of
business employees had the highest score on expectations Cheaosakul (2004)rsquos study
also revealed that business employees did not frequently travel compared with people of
other occupations such as tourists It was found in this particular study that the number of
the participantsrsquo purpose of travel with TG for business trips was only at 273 (See
Table 5) while the highest number of the participants went on holiday was at 52
Cheaosakul (2004) indicated that business people therefore had high expectations than
the other group who traveled more frequently
Thirdly an even more interesting point was raised when comparing the level of
satisfaction of the passengers who were government officials or state enterprise
employees and business owners Although passengers who were government officials or
state enterprise employees came third in terms of participants they are considered
valuable customers of TG since according to the governmentrsquos policy they are required
to take only TG which is a national airline whenever they travel by air There are few
exceptions though However it is almost impossible for Thai government officials who
travel on business trip and are funded by the governmentrsquos budget to fly with other
airliners It was found from this study that government officials were less satisfied with
TG quality service in terms of reliability ( 277) and responsiveness ( 264) than the
average level of which the mean scores of the two dimensions were at 280 and 269
respectively
Another issue of discussion regarding the participantsrsquo occupation business
owners came second It was observed that business owners rated the reliability ( 282)
and responsiveness dimensions ( 270) higher than the average scores of all groups (See
Table 8) It is possible that business owners had more positive attitude with TGrsquos service
x x
x
x
43
than the other groups TG seemed popular among business owners and they were the
most important group of customers This was supported by Suriya (2005) who studied
airline market segments after the launch of the low cost airlines in Thailand Suriya
(2005) identified that merchants or business owners were the major group of customers in
the full-service airline market
Fourthly regarding the monthly income of the research participants of the low
group passengers who earned an income of around 60001 or higher rated the empathy
( 325) dimension higher than tangibles ( 321) dimension (See Table 9) This may
be because the high income passengers sensitively felt that the facilities and equipment
found on their domestic route looked quite old-fashioned due to TGrsquos cost reduction The
company saved costs after the Suvannabhumi airport was closed in the 2008 crisis The
result is similar to the findings of Wangpen and Inthornma (2007) in that high income
customers had higher expectations towards the service It was possible that they had
more tendencies to be dissatisfied with the service failures The two researchers
concluded that passengers with different incomes were satisfied with the services at
different levels because they had different attitudes expectations and abilities to pay for
the service
Fifthly as it was found from this study that the highest score for the purpose of
travel was going on holiday (527) and the participants who were tourists rated the
assurance dimension at the highest level or the mean score of 353 (See Table 10) much
higher than the mean score of the whole group which was at 345 It was rather surprising
that the highest score for the travel purpose was not for business trips It is possible to
explain that this group spent for the travel cost on their own and they might want to make
sure that they chose the best service for themselves The result is parallel with Gabbie
and OrsquoNeill (1997) who examined customer satisfaction in the hotel sector using the
x x
44
SERVQUAL tool This study showed that the holiday guests who paid for
accommodation on their own rated assurance much higher than other dimensions It is
plausible to explain that passengers traveling on their own budget must make sure that
they already chose the service that was worth the money spent
However when analyzing the satisfaction on service quality of the participants
whose purpose of travel via TG was for business it was also found that this business
participants rated the high score for the tangibles dimension at the mean score of 340
compared with the average mean score of all groups of 334 Passengers who traveled on
business included government officials and state enterprise employees were major
customers of TG It was therefore interesting to find out from this study that their
satisfaction score in terms of tangibles or the appearance of physical factors such as
equipment facilities and personnel was above the average score of all groups Although
the score was not much higher the gap was bigger than that of the other RATER
dimensions as seen from the following information the passengers who traveled on
business trip showed their satisfaction on the reliability dimension at the mean score of
281 the assurance dimension at 347 the empathy dimension at 309 and the
responsiveness dimension at 270 while the average of all groups was at 280 345 307
and 269 respectively
The last point that the researcher wanted to point out is that this study revealed
that the participants who traveled more than 10 times for the last 12 months were lowest
in number (13) However it was interesting that these frequent flyers showed the high
rate of satisfaction with TGrsquos in-flight service quality The mean scores in all dimensions
showed the high rate of satisfaction (See Table 11) It is possible that passengers who
traveled very often via TG had high loyalty The brand loyalty made passengers happy in
every feature of service This result however contrasts with Ostrowski et al (1993) who
45
investigated service quality and customer loyalty in the commercial airline industry The
study examined whether the high levels of service quality existed in the US commercial
airline industry and how service quality could potentially lead to customer loyalty The
main results indicated that the levels of perceived service quality were below potential
and that customer loyalty to airlines was low It is plausible to say that the data of the two
studies were different The data collected on two air carriers in USA might have
different characteristics from the demographic information of Thai people and the number
of the participants in the two studies might differ However TG still needs to listen to the
voice of all passengers especially the frequent flyers Even if the number of this sample
group was few every customer is valuable for any firm Also it would be valuable to
implement a relevant strategy to expand this group of passengers since they had a positive
attitude for TG
Interestingly the findings from the last part of the questionnaire also showed that
the majority of the participants (946) showed their willingness to use TGrsquos service in
the future It can plausibly be explained that the participants were satisfied with TGrsquo
service quality at the moderate level ( 307) Their satisfaction with the five dimensions
of SERVQUAL was also moderate They might think that TG is a reliable airline that
they can depend on Thai passengers have confidence and trust in the service of Thai
cabin crew in terms of courtesy Also it is possible that they might not trust the low cost
airlinesrsquo service of the crew
There were only seven remarks on the in-flight service when the participants were
asked to freely give suggestions The tangible dimension problematic Passengers
pointed out about the small size of passengersrsquo seats and the quality of the air-
conditioning system One problem was on the responsiveness dimension which happened
when a passenger asked for a blanket but she was not offered indicating that some of the
x
46
cabin crewrsquos promptness to provide service was still not up to a standard Another
comment was on the flavor of the snacks Although this issue is not directly relevant to
the service it is worthwhile for TG to consider this problem
In conclusion the researcher found both strengths and weaknesses in TGrsquos service
quality Assurance was found the highest satisfaction in the participantsrsquo opinion TG
should maintain the service quality with a focus on this dimension On the other hand
the responsiveness and reliability dimensions were at the lowest satisfaction level among
the five dimensions The company should improve its service quality on these two
dimensions especially with regards to TGrsquos lsquoprompt servicersquo and lsquoproblem solvingrsquo
service to retain its passengers
53 Limitations of the study
This study has some limitations as follows
1 This study was limited to only one domestic route (Bangkok ndash Chiangmai)
Therefore the participants in this study were passengers who traveled only between these
two provinces The results of the study might differ if the study covered another route or
many more routes at the same time Consequently further studies can be conducted for
other domestic destinations such as Phuket and other big cities
2 The research participants were all Thai passengers It would be interesting to
study foreign passengersrsquo satisfaction on TGrsquos in-flight service quality
3 This study focused only on Parasuraman et al (1985)rsquos SERVQUAL
Instrument used to assess the service quality The results might differ if other instruments
were used
47
54 Recommendations for further studies
Further research should be undertaken to validate the results of this study The
researcher has found several opportunities to extend this study as follows
Survey on the lsquoresponsivenessrsquo dimensions
Responsiveness concerns the willingness or readiness of employees to provide
service such as timelines of service and prompt service This dimension was what the
passengers in this study were most concerned about because it was rated as the lowest
level of satisfaction Thus TG should find the countermeasure of how to increase the
level of passengersrsquo satisfaction in the responsiveness dimension
Assessment of the ground service quality
Since this research was conducted on on-board service quality further studies on
ground services such as a reservation or check-in service should be investigated in order
to integrate the results covering every sector of the airline service
Study on passengersrsquo attitude towards the service quality in other airlines
A study on the service quality of other airlines should be conducted in order to
obtain comparative data and find out reasons for their passengersrsquo behavior and attitude
consequently allowing TG to remedy any weak points and increase the number of new
passengers
REFERENCES
REFERENCES
Alegre J amp Pou L (2006) An analysis of the microeconomic determinants of travel
frequency Department of Applied Economics Universitat de les Illes Balears
Bojanic DC (1991) Quality measurement in professional service firms Journal of
Professional Service Marketing 7(2) 27-37
Bojanic D C amp Rosen L D (1994) Measuring service quality in restaurants An
application of the SERVQUAL model Journal of Hospitality Research 18(1)
3-14
Boontaganon W (2002) The study of service quality of fast-food restaurants in Bangkok
using SERVQUAL measurement Thesis MBA (Business Administration)
Bangkok Assumption University Photocopied
Buttle F (1996) SERVQUAL review critique research agenda European Journal of
Marketing 30(1) 8-31
CarmanJ M (1990) Consumer perceptions of service quality An assessment of the
SERVQUAL dimensions Journal of Retailing 69 33-35
Cheaosakul W (2004) Consumers perception of service quality a case study of Thai
Airways International Plc Thesis MBA Bangkok Assumption University
Photocopied
Fick RG amp Ritchie JRB (1991) Measuring service quality in the travel and tourism
industry Journal of Travel Research 30(2) 2-9
Fornell C (1992) A national customer satisfaction barometer the Swedish experience
Journal of Marketing 56 6-21
Gabbie O amp OrsquoNeill M (1997) SERVQUAL and the Northern Ireland hotel sector a
comparative analysis part 2 Managing Service Quality 17(1) 43-49
50
Gilbert DH (1999) Marketing connecting with customers (2nd
ed) Upper Saddle
River NJ Prentice Hall
Gilbert D amp Wong KCR (2002) Passenger expectations and airline services a
Hong Kong based study Surrey Management School Surrey University of
Surrey
Gitman LJ amp Carl DM (2005) The future of business the essentials Mason Ohio
South-Western College Pub
Grifin J (1995) Customer loyalty NY Lexington Book
Gronroos C (1978) A service-oriented approach to marketing of services European
Journal of Marketing 12(8) 588-601
Hennig-Thurau T amp Klee A (1997) The impact of customer satisfaction and
relationship quality on customer retention a critical reassessment and model
development Masterrsquos Project MA (Psychology amp Marketing) Hanover
University of Hanover
Heesawat C (2005) The opportunities and problems in making services more tangible
PhD Dissertation Bangkok Assumption University Photocopied
Juran JM amp Gryna FM (1974) Quality control handbook NY McGraw-Hill
Kholthanasep G (2001) A study of customerrsquos expectations and perceptions of service
quality delivery by first class hotels in Bangkok metropolitan area Thesis
MBA Bangkok Assumption University Photocopied
Kotler P amp Scheff J (1997) Standing room only strategies for marketing the
performing arts Boston Mass Harvard Business School Press
Kotler P (1997) Marketing management analysis planning and control (9th
ed) Upper
Saddle River NJ Prentice Hall
51
Kotler P Bowen J amp Makens J (1999) Marketing for hospitality and tourism (2nd
ed) NJ Prentice Hall
Kotler P (2000) Marketing management the millennium edition (10th
ed) NJ Prentice
Hall
Lages FL amp Fernandes CJ (2005) The SERVQUAL scale a multi-item instrument
for measuring service personal values Journal of Business Research 58(11)
1562-1572
Oberoi U amp Hales C (1990) Assessing the quality of the conference hotel product
London The Service Industries Journal 10(4) 700-722
Ostrowski PL Orsquobrien TV amp Gordon GL (1993) Service quality and customer
loyalty in the commercial airline industry Journal of Travel Research 32(2)
16-24
Palin M (1996) Flight catering transportation and loading (2nd
ed) London Longman
Group Limited
Panittumrong P (2004) The consumerrsquos opinion towards Clark Hatch Fitness Center
Master Project MBA (Management) Bangkok Graduate School
Srinakharinwirot University Photocopied
Parasuraman A Zeitmal VA amp Berry LL (1985) A concept model of service
quality and its implications for future research Journal of Marketing 49 41-50
Parasuraman A Zeitmal VA amp Berry LL (1988) SERVQUAL a multiple item
scale for measuring customer perceptions of service quality Journal of
Retailing 64(1) 64
Parasuraman A amp Berry LL (1991) Marketing services competing through quality
NY The Free Press
52
Pirsig RM (1987) Zen and the art of motorcycle maintenance an inquiry into values
(Mass Market Paperback) NY Bantam Books
Poonlarbtawee K (1987) Statistics for research Bangkok Physic Center Printing
Reid RD amp Bojanic DC (2001) Hospitality marketing management NJ John Wiley
amp Son Inc
Rueangthanakiet P (2008) Memberrsquos satisfaction of fitness service quality a case study
of California Wow Xperience Plc Masterrsquos Project MA (Business English for
International Communication) Bangkok Graduate School Srinakharinwirot
University Photocopied
Sachukorn S (2006) Reception and service excellence Bangkok Saitharn
Schiffman LG amp Kanuk LL (1994) Consumer behavior (5th
ed) London Prentice-
Hall International
Somwang C (2008) An assessment of passengersrsquo views of service quality in Thai low
cost carriers Inter Program MA (Communicative English) Bangkok
Ramkhamhaeng University Photocopied
Suriya K (2005) Airline market segments after low cost airlines in Thailand passenger
classification using neural networks and logit model with selective learning
Faculty of Economics Chiangmai Chiangmai University
Suthirungkul N (2003) The study of customer expectations and perceptions of service
quality of the Clark Hatch fitness center of Silom road branch Bangkok Thesis
MBA (Business Administration) Bangkok Assumption University
Photocopied
Thai Airways International (2008) Traffic program information (Introduction of summer
200809) Bangkok THAI Printing Office
53
Thai Airways International (2009) Traffic program information (Introduction of winter
200910) Bangkok THAI Printing Office
THAI AIRWAYS INTL Official 4-Star Ranking of Product and Service Quality (2009
October) Retrieved February 14 2010 from
httpwwwairlinequalitycomAirlinesTGhtml
Travel Planning (2010 February 12) Retrieved February 12 2010 from
httpwwwsuite101comlessoncfm1848818243
Wangpen N amp Inthornma S (2007) Membersrsquo satisfaction in fitness centers in
Bangkok Thesis MA (Hotel and Tourism Management) Bangkok Graduate
School Naresuan University Photocopied
Zeithaml VA amp Bitner MJ (2000) Services marketing (2nd
ed) NY McGraw Hill
Zeithaml VA Parasuraman A amp Berry LL (1990) Delivering quality service
balancing customer perceptions and expectations NY Free Press
APPENDICES
55
APPENDIX A
แบบทดสอบความพงพอใจของผโดยสารการบนไทย
เรยนทานผโดยสารทเคารพ กระผมนาย วลาศ มนคงวณชกล พนกงานตอนรบสายการบนไทย และนกศกษาปรญญาโท หลกสตรภาษาองกฤษธรกจเพอการสอสารนานาชาต มหาวทยาลยศรนครนทรวโรฒ ไดจดท าแบบสอบถามนเพอเปนสวนหนงของการส ารวจความพงพอใจของผโดยสารทมตอคณภาพงานบรการ เทยวบนภายในประเทศของการบนไทย โดยมงหวงทจะน าขอมลทไดรบจากการส ารวจมาเปนประโยชนตอการสงเสรมสนบสนนการปฏบตงานใหเกดประสทธผล จงขอความกรณาจากทานในการตอบแบบสอบถามทกขอตามขอเทจจรงและความเหนของทาน ขอมลทงหมดเปนความลบ จะใชเพอการวจยเทานน และขอขอบคณในความรวมมอของทาน
helliphelliphelliphelliphelliphelliphelliphelliphelliphelliphelliphelliphelliphelliphelliphelliphelliphelliphelliphelliphelliphelliphelliphelliphelliphelliphelliphelliphelliphelliphellip
ค าชแจง โปรดท าเครองหมาย (x) ลงในชองวาง ทตรงกบค าตอบของทาน
ตอนท 1 ขอมลทวไป
1 เพศ ( ) ชาย ( ) หญง 2 อาย ( ) ตากวา 20 ป ( ) 21-40 ป ( ) 41-60 ป ( ) 60 ปขนไป 3 อาชพ ( ) ขาราชการ รฐวสาหกจ ( ) พนกงานบรษท ( ) ธรกจสวนตว ( ) นกเรยน นกศกษา ( ) เกษยณ ( ) อนๆ 4 รายได เดอน ( ) ตากวา 20000 ( ) 20001- 40000 บาท ( ) 40001- 60000 บาท ( ) 60001 บาท ขนไป 5 จดประสงคการเดนทาง ( ) ธรกจ ( ) พกผอน ( ) เยยมเยยนญาตมตร เพอนฝง ( ) อนๆ 6 ความถในการเดนทางกบการบนไทย (ในรอบ 12 เดอน) ( ) ครงแรก ( ) 2-3 ครง ( ) 4-10 ครง ( ) 10 ครงขนไป
56
ตอนท 2 ความพงพอใจของทานตอการบรการ (5 = เหนดวยอยางยง 4= เหนดวย 3= ปานกลาง 2=ไมเหนดวย 1=ไมเหนดวยอยางยง)
ระดบความพงพอใจ
การบรการของการบนไทย 5 4 3 2 1 1 เมอเจาหนาทสญญาทจะใหบรการทานในเรองใด จะทาตามนนเสมอ
2 การใหบรการของเจาหนาท สรางความเชอมนใหกบทาน
3 อปกรณบนเครองบนมรปแบบททนสมย (เชน จอทว ทนง)
4 บรษทฯกาหนดเวลาการใหบรการบนเครองเหมาะสม
5 เจาหนาทใหบรการทดนบตงแตกาวแรกบนเครอง
6 เจาหนาทมความตงใจดทจะชวยเหลอทาน เมอทานมปญหา
7 ทานรสกปลอดภยเมออยบนเครองบน
8 สงอานวยความสะดวกตางๆบนเครอง มรปลกษณทดงดดใจ (เชน กลองอาหาร) 9 เจาหนาทไมเขาใจความตองการของทาน ในบางกรณ
10 เจาหนาทไมไดระบเวลาในการใหบรการผโดยสารบนเครองทแนนอน 11 เจาหนาทพยายามทางานโดยไมใหเกดขอผดพลาด
12 เจาหนาทปฎบตงานดวยความสภาพเสมอ
13 เจาหนาทแตงกายเรยบรอยและดด
14 บรษทฯใหความเอาใจใสกบผโดยสารเปนรายบคคล
15 บางครงเจาหนาทไมเตมใจทจะใหบรการผโดยสาร
16 บรษทใหบรการทานตรงเวลาทกาหนด
17 เจาหนาทสามารถใหขอมลเกยวกบการเดนทางไดอยางถกตอง
18 เอกสารของบรษทฯทเกยวของกบการบรการ (เชน แผนพบ นตยสาร) มขอมลครบถวน และรปแบบสวยงาม 19 เจาหนาทใหบรการทานดวยสมผสความเปนไทย
20 เจาหนาทใหบรการผโดยสารอยางรวดเรว
ทานจะกลบมาใชบรการของการบนไทยตอไป จะใชบรการตอไป ไมใชบรการ
ขอเสนอแนะ_______________________________________________________
_____________________________________________________________ ขอบพระคณอยางสงในความรวมมอของทาน
57
APPENDIX B
Questionnaire
Dear Honorable Passengers
My name is Wilas Mankongvanichkul -- a THAI cabin crew and masterrsquos student of business English
for international communication program Srinakharinwirot University This questionnaire is about
an exploration of passengersrsquo satisfaction with service quality of Thai Airways International (TG)rsquos
domestic flights Data gained will be utilized for THAI service operation Please kindly complete the
questionnaire The data gained will be kept confidential and used for the research study only Your
kind cooperation is greatly appreciated
helliphelliphelliphelliphelliphelliphelliphelliphelliphelliphelliphelliphelliphelliphelliphelliphelliphelliphelliphelliphelliphelliphelliphelliphelliphellip
Direction Please mark (x) your answer in the space provided
Part 1 Personal Information
1 Gender
( ) Male ( ) Female
2 Age
( ) Under 20 years ( ) 21-40 years
( ) 41-60 years ( ) Above 60 years
3 Occupation
( ) Government official State enterprise employee
( ) Business employee
( ) Business owner ( ) Student
( ) Retiree ( ) Others
4 Monthly income
( ) Up to 20000 baht ( ) 20001- 40000 baht
( ) 40001 ndash 60000 baht ( ) 60001 baht and above
5 Purpose of travel
( ) Business trips ( ) Holidays
( ) Visits ( ) Others
6 Frequency in traveling with THAI (during the last 12 months)
( ) First time ( ) 2-3 times
( ) 4-10 times ( ) More than 10 times
58 Part 2 Your satisfaction with the service
(5=Strongly Agree 4= Agree 3=Uncertain 2=Disagree 1= Strongly Disagree)
Level of Satisfaction
The Service of THAI 5 4 3 2 1
1 When cabin crew promise to do something by a
certain time they do so
2 You can trust THAI cabin crew
3 TG has modern on board equipment
(such as TV screen passengersrsquo seats)
4 TG has operating hours on board convenient to all
passengers
5 Cabin crew offer good services upon boarding
6 When passengers have a problem cabin crew show a
sincere interest in solving it
7 Passengers feel safe on-board
8 The physical facilities of TG are visually appealing
(such as meal boxes)
9 Cabin crew do not understand your special needs in
some cases
10 Cabin crew do not tell passengers exactly when
services will be offered
11 Cabin crew insist on error-free records
12 Cabin crew are consistently courteous to passengers
13 Cabin crew are well-dressed and neat in appearance
14 TG gives passengers individual attention
15 Cabin crew are not always willing to help passengers
16 TG provides its services at the time it promises to
do so
17 Cabin crew are knowledgeable to answer passengers
travel-related questions
18 Documents about service are informative and appealing
(such as pamphlets and magazines)
19 Services provided have a ldquoThai Touchrdquo
20 Cabin crew are quick to respond to passengersrsquo requests
Will you come back for TGrsquos service Yes No
Suggestions________________________________________________________________
________________________________________________________________________ Thank you very much for your kind cooperation
59
APPENDIX C
Questionnaire Specification Based on SERVQUAL measurement (Parasuraman et al 1985)
Passengers satisfaction level toward service quality factors
No Service Quality Features (RATER)
Str
on
gly
ag
ree
Ag
ree
Un
certa
in
Dis
ag
ree
Str
on
gly
Dis
ag
ree
(5) (4) (3) (2) (1)
1 When cabin crew promise to do something by a certain time they do so Reliability
2 You can trust THAI cabin crew Assurance
3 TG has modern on board equipment (such as TV screen passengersrsquo seats) Tangibles
4 TG has operating hours on board convenient to all passengers Empathy
5 Cabin crew offer good services upon boarding Responsiveness
6 When passengers have a problem cabin crew show a sincere interest in solving it
Reliability
7 Passengers feel safe on-board Assurance
8 The physical facilities of TG are visually appealing (such as meal boxes) Tangibles
9 Cabin crew do not always understand your special needs in some cases Empathy
10 Cabin crew do not tell passengers exactly when services will be offered Responsiveness
11 Cabin crew insist on error-free records Reliability
12 Cabin crew are consistently courteous to passengers Assurance
13 Cabin crew are well-dressed and neat in appearance Tangibles
14 TG gives passengers individual attention Empathy
15 Cabin crew are not always willing to help passengers Responsiveness
16 TG provides its services at the time it promises to do so Reliability
17 Cabin crew are knowledgeable to answer passengers travel-related questions Assurance
18 TGs documents associated with services are informative and appealing (such as pamphlets and magazines)
Tangibles
19 Services provided have a ldquoThai Touchrdquo Empathy
20 Cabin crew are quick to respond to passengersrsquo requests Responsiveness
VITAE
61
VITAE
Name Wilas Mankongvanichkul
Date of Birth February 14 1980
Place of Birth Bangkok
Address 688 Soi Phaholyothin 32 Chankasem Jatuchak
Bangkok 10900
Present Occupation Cabin Crew
Thai Airways International Public Company Limited
89 Vibhavadi Rangsit Road Bangkok 10110
Education Background
2010 Master of Art (Business English for International
Communication)
Srinakharinwirot University
2001 Bachelor of Business Administration Bangkok University
1997 High School Saint Dominic School
- Cover
- Abstract
- Chapter 1
- Chapter 2
- Chapter 3
- Chapter 4
- Chapter 5
- Bibliography
- Appendix
- Vitae
-
11
The last factor is external communication comprising such as direct sale and
advertisement in order to communicate and position a service through messages which
can influence consumer perceptions
In summary each factor can individually or harmoniously affect consumersrsquo
purchasing decision Customer satisfaction is a key to business success In order to make
customers satisfied a company needs to understand their expectations and perception by
studying the factors that affect their purchasing decision
23 Service Quality
A search for the definition of ldquoqualityrdquo has yielded inconsistent results Quality
has been variously defined as fitness for use in the product which successfully serves the
purpose of the user during usage (Juran amp Gryna 1974) In addition Zeithaml et al
(1990) state that ldquoqualityrdquo is what exceeds the customersrsquo expectation of the service
On the other hand quality is a characteristic of thoughts and statements believed
to be taken for granted if an explanation of quality is going to be both false and true
precisely (Pirsig 1987) Pirsig also says that since definitions derive from abstract and
formal thinking quality cannot be defined it is impossible to define quality because
quality can never be considered independently but only in relation to what is perceived
Measuring Quality in Service
Parasuraman et al (1985) point out that service quality is more difficult for the
consumers to evaluate than the product quality Perception of service quality results from
a comparison of customer expectations with actual service performance Quality
evaluations are made not only from the outcome of a service but also from the ldquoprocessrdquo
12
of service delivery and the customers have fewer tangible characters to be measured
physically when purchasing services than when purchasing products (Gronroos 1978)
Service quality is the degree of how well the service level delivered matches
customer expectations Delivering quality service means that the service provider needs
to follow customer expectations on a consistent basis (Lewis amp Booms 1983)
To conclude three underlying service quality themes can be drawn from the
discussion as follows
Service quality is more difficult for the customer to evaluate than product quality
Service quality perceptions result from a comparison of consumer expectations
with actual service performance
Quality evaluations are not made solely on the outcome of a service They
involve evaluations of the process of service delivery
The Benefits of Service Quality
The benefits of service quality comprise four areas as follows (Kotler 2000)
Customers Retention High quality builds loyal customers and creates positive word of
mouth which is an important factor in purchase decision This can determine customer
satisfaction which affects repeat business If a customer is happy with an existing firm it
is difficult to convince him or her to move to another
Avoidance of Price Competition A firm with a reputation for high quality has
a much stronger competitive position than one with a reputation for poor quality Price-
cutting by a competitor will not be enough to encourage a client to switch Good quality
is more powerful to remain competitive
13
Retention of Good Employees Employees appreciate working in operations
that are well run and produce quality products They do not enjoy receiving customer
complaints Also turnover and loss of employee morale are listed as costs of poor quality
manpower When an operation has good quality it can retain good employees And at
the time business expansion is needed recruiting is easier and training cost is reduced
Reduction of Costs The quality cost includes internal costs external costs and
quality system costs Internal costs are those associated with correcting problems
discovered by the firm before products reached customers External costs are related to
errors that the customers experience They can be very expensive when the customers
decide not to return because of a service problem Then the promotional and advertising
costs or external costs are necessary to be spent to create the company image in order to
make customers come back and win brand loyalty for the company in the end However
the company needs to check the service quality through customersrsquo feedback periodically
to avoid problems
Although the quality service system does not come without costs it is usually less
than those internal and external costs resulting from poor quality service Some examples
of the costs of a quality system include customer service audits trainings management
meetings with employees and customers and introduction of a new technology (Kotler
Bowen amp Makens 1999)
To sum up it is necessary for a service company to know the service quality level
The quality needs to be evaluated by comparing customer experience with service
performance Once a service company reaches a good quality level a company will
retain its customers easily be away from price wars keep and get good employees and
reduce some operation costs
14
Thai Airways In-flight Service Quality
The latest airline evaluation in 2009 by Skytrax from United Kingdom which is a
research organization focused on in-flight services revealed that TG got the official 4-star
ranking for its product and service quality This honor is awarded to airlines which
deliver a good quality performance
Skytrax also disclosed that for short travels or domestic routes two traveling
classes are business class and economy class The overall evaluation of the domestic
route showed that TGrsquos business class was rated excellent (5-star) in two articles which
are ldquowashroom cleanlinessrdquo and ldquonewspaper amp magazinerdquo in terms of ldquoonboard productrdquo
category Meanwhile TG also got the highest rank in terms of ldquoservice efficiencyrdquo and
ldquoresponding to requestsrdquo in ldquocabin staff servicerdquo categories In addition in the economy
class TG could do superbly in three articles of cabin staff service which were ldquoservice
efficiencyrdquo ldquoenthusiasm and attituderdquo and ldquofriendliness and hospitalityrdquo (ldquoTHAI
AIRWAYS INTL Official 4-Star Ranking of Product and Service Qualityrdquo 2009)
In conclusion TG has been recognized internationally however it still needs to
move ahead The quality ranking is useful for TG to realize that the company needs to
develop its products and services in all categories in order to step up and well-prepared
for competitions in the future
24 SERVQUAL Model
SERVQUAL is an instrument used for measuring how customers perceive the
quality of the service This instrument is based on five dimensions and on a comparison
between customersrsquo expectations of how the service should be performed and their
experiences of how the service is actually performed Usually 20 attributes are used to
describe the five dimensions and participants are asked to state what they expect from the
15
service and how they perceive the service on a five-point scale from ldquoexcellentrdquo to
ldquopoorrdquo Based on the difference between expectations and experiences over the 20
attributes an overall quality score can be calculated The higher the score shows that
experiences are below expectation the lower the perceived quality (Parasuraman amp
Berry 1991)
SERVQUAL consists of five dimensions (RATER) as follows (Parasuraman et
al 1985)
Reliability This means that a service firm provides its customers with accurate
service the first time without making any mistakes and delivers what it has promised to
do by the time that has been committed
Assurance This means that employeesrsquo behaviors give customers confidence in
the firm and that the firm makes customers feel safe It also means that the employees are
always courteous and have the necessary knowledge to respond to customers questions
Tangibles This dimension relates to the appeal of facilities equipment and
materials used by a service firm as well as to the appearance of service employees
Empathy This means that the firm understands the customersrsquo problems and
performs in their best interests as well as giving customers individual personal attention
and having convenient operating hours
Responsiveness This means that employees of a service firm are willing to help
customers and respond to their requests as well as to inform customers when service will
be provided and give prompt service
16
Application of SERVQUAL Model in Hospitality Business
The SERVQUAL instrument has been used to assess the quality of a wide range
of services in the United States such as financial service operations telephone services
repair and maintenance services (Parasuraman et al 1988) and other professional
services (Bojanic 1991) Fick and Ritchie (1991) have employed the SERVQUAL
instrument to compare services provided by various types of organizations within the
travel and tourism industry Oberoi and Hales (1990) have examined the SERVQUAL
approach as a basis for measuring the quality of the conference hotel products Many
researchers of other service businesses believed that ldquoSERVQUALrdquo is a concise multiple-
item scale with good reliability and validity (Buttle 1996 Lages amp Fernandes 2005)
In Thailand Boontaganon (2002) studied the service quality of fast food
restaurants in Bangkok by using SERVQUAL The study examined the differences in
service quality expectations and perceptions based on demographic characteristics
including gender age occupation education and income level 360 questionnaires were
distributed to people who had just exited from fast food outlets in Bangkok The results
showed significant differences in service quality of customer expectations and
perceptions which indicated the unacceptable service quality delivered by fast food
restaurants in Bangkok
Suthirungkul (2003) studied the customer expectations and perceptions of service
quality of the Clark Hatch Fitness Center at Silom Road Branch Bangkok The objectives
of the study were to identify the SERVQUAL dimensions that customers both local and
foreign used to evaluate The Clark Hatch Fitness Center to study the customer
expectations towards the services quality that should be provided and to evaluate the
perceptions of service quality that customers obtained after using service The
questionnaire was used as a tool for collecting the data 277 Thai and foreign members of
17
the Clark Hatch Fitness Center at Silom Road Branch were the research participants The
results of the study were that there existed gaps between expectations and perceptions in
terms of the five SERVQUAL dimensions and the demographic characteristics had
influenced the gap scores
In short SERVQUAL is an effective measuring tool This tool has widely been
used in many previous studies in hospitality business both domestically and
internationally
25 Demographic Variables
In general business sector market segmentation is often based on demographic
profiles (Reid amp Bojanic 2001) in order that marketers can choose the proper service
segmentation strategies to satisfy different target market segments Demographics are the
variables about consumersrsquo wants preferences and usage rates are often associated with
demographic variables Moreover the demographic variables are easier to measure
(Kotler 2000) Important demographics are as follows
1 Gender There is no logical reason to expect biology to account for this
difference between the sexes The explanation may be in socialization differences and
personality disposition Feminine gender identity is characterized by traits such as
expensiveness and emotionalism and other orientation while masculine gender identity is
characterized by independence activity and self orientation (Kotler amp Scheff 1997)
2 Age Consumersrsquo wants and abilities change with age People buy different
goods and services over their lifetime Peoplersquos tastes in different products and services
are also related to age (Kotler 2000)
18
3 Occupation This variable reflects values attitudes taste and lifestyle
Occupation and income tended to be closely correlation on almost cause-and-effect
relationship (Schiffman amp Kanuk 1994)
4 Income Consumers form a purchase intention based on such factors and
expected family income price and expected benefits from the product and services
(Kotler 1997)
5 Purpose of Travel The purpose of travel measure the frequent distribution
The purposes of travel are for such as business holiday visiting friends and relative and
others (ldquoTravel Planningrdquo 2010)
6 Frequency of Travel A critical factor in predicting the demand for tourism
within a certain period of time is the number of trips individuals take New touristsrsquo
behavior shows a tendency toward more frequent travel (Alegre amp Pou 2006)
To recap the demographic profiles play a significant role in planning service to
meet passengersrsquo satisfaction In airline business six features of the demographics were
included in this study
26 Previous Studies on Airline Passengersrsquo Satisfaction
In an airline business the major revenue of a company comes from the number of
passengers rather than a total sum of cargo service aircraft maintenance or catering
supply all together Studies on airline passengersrsquo satisfaction are numerous as the
following examples
Gilbert and Wong (2003) identified the service dimensions that matter most to
current airline passengers The study measured and compared differences in passengersrsquo
expectations of the desired airline service quality in terms of reliability assurance
19
facilities employees flight patterns customization and responsiveness The primary data
were collected from passengers departing from Hong Kong airport Regarding the
service dimension expectations it was found that there were no statistically significant
differences between passengers who made their own airline choice (decision makers) and
those who did not (non-decision makers) However there were significant differences
among passengers of different ethnic groups nationalities as well as among passengers
who traveled for different purposes such as business holiday and visiting friends or
relatives
The findings also indicated that passengers consistently ranked lsquoassurancersquo as the
most important service dimension It showed that the passengers were concerned about
the safety and security aspects and this also indicated why there had been such a
downturn in demand as this study was conducted just prior to the World Trade Center
incident on September11 2001
In Thailand Somwang (2008) assessed the passengersrsquo views of service quality in
Thai low cost airlines The research was based on the principle that passengers evaluated
airline service quality through a comparison between their experiences and expectations
over a number of quality attributes The study evaluated passengersrsquo perceived service
quality of Thai low cost carriers based on the SERVQUAL instrument The findings
indicated that the passengersrsquo expectations on service quality were higher than what they
had actually experienced Further analysis showed that female passengers had lower
perceived service quality than male passengers The findings also revealed that higher
monthly income had greater differences with respect to expectations and perceptions than
lower income respondents Furthermore passengers usually traveled with low cost
carriers for three main purposes which were for leisure visiting friends or relatives and
business
20
In brief the previous studies explored the satisfaction of airline passengers by
using SERVQUAL instrument to measure the service quality The results above found
out the differences between customersrsquo expectations and perceptions The findings of a
study in Hong Kong revealed the passengersrsquo satisfaction on the dimensions of the
service quality Meanwhile a study in Thailand implied some findings about the
demographic profiles resulting in service quality Studies on service quality help improve
business organizations retain customers and attract new customers
CHAPTER THREE
METHODOLOGY
This chapter consists of four sections participants of the study research
instrument procedures of the study and data analysis
31 Participants of the Study
One hundred and fifty Thai passengers 75 males and 75 females who took the
TG Bangkok - Chiangmai route were randomly chosen as participants for the study
Since there are about 150 passenger seats in each flight the researcher randomly acquired
a sample size of 10 percent of the overall passengers from the ten flights totaling 150
Thai people are the main group of passengers who travel domestically over the year The
researcher therefore decided to select only the Thai passengers as the participants for the
study Also so as to cover various types of passengers the researcher included flights of
different time within a day (as shown in a following part of this chapter) for a reason that
passengers with some specific purposes chose to travel at some specific time For
example business people might prefer an early morning flight rather than a later-in-the-
day one
TGrsquos Bangkok ndash Chiangmai route has been considered one of the most frequent
domestic routes (THAI 2009) TG operates ten flights daily from Bangkok to
Chiangmai The researcher consequently chose this route for this research work to
assess the passengersrsquo satisfaction with TGrsquos service quality
The study was conducted in early March when it was still in the high season for
travels to the northern province of Thailand Fifteen passengers from each of the ten
flights of the Bangkok - Chiangmai route were asked to fill out the questionnaire at the
22
end of the on-board service while the plane was approaching Chiangmai its destination
All the 150 completed questionnaires were obtained as planned
32 Research Instrument
A questionnaire in Thai was used for data collection The questionnaire was
divided into three parts The first part was about the respondentsrsquo demographic profile
since consumersrsquo needs preferences and personalization are often associated with
demographic factors (Kotler 2000) Six demographic characteristics related to in-flight
service (Cheosakul 2004) consisting of gender age occupation monthly income
purpose of travel and travel frequency with THAI were demographic issues of the survey
The second part comprised questions about passengersrsquo satisfaction with the service
during the flight This part of the questionnaire was based on the SERVQUAL
instrument for measuring customersrsquo satisfaction in five dimensions of service reliability
assurance tangibles empathy and responsiveness (Parasuraman et al 1985) The last
part comprised a question and a blank space provided for suggestions on TGrsquos service
quality
33 Procedures of the Study
The questionnaire was initially approved by the researcherrsquos masterrsquos project
advisor and two specialists a TG in-flight service manager and a SWU lecturer Then a
pilot study was conducted to ten passengers to check for content reliability the
appropriateness of the number of questions and language used in the questionnaire As
the researcher included all the ten flights of TGrsquos Bangkok - Chiangmai route in the
study the tried-out questionnaire was randomly distributed to ten TG passengers (5 males
and 5 females) on each flight of the aforementioned route on the same day in February
23
2010 Also since this study was about onboard service the questionnaire was distributed
to the participants after the in-flight service was completed and before the plane landed
After that the questionnaire was adjusted and prepared for the actual survey
The revised questionnaire was eventually distributed to 150 participants in ten
consecutive days in early March 2010 Fifteen passengers in each Bangkok -
Chiangmai flight per day were randomly asked to fill out the questionnaire after the
completion of in-flight service
The plan below showed the ten flights of for the survey each flight for a day to
make sure that the data gained were reliable
BKK-CNX Flight (TG) Flight Schedule (Departure-Arrival)
TG100 0615-0725
TG102 0750-0910
TG104 0910-1030
TG106 1020-1140
TG110 1250-1400
TG112 1400-1510
TG114 1540-1650
TG116 1715-1825
TG120 1900-2010
TG122 2130-2240
34 Data Analysis
The data acquired from the questionnaires were analyzed in three sections
demographic profile of passengers level of passengersrsquo satisfaction with TGrsquos service
and the relationship between demographic profile and passengersrsquo satisfaction based on
24
Likert scale The 5-point Likert scales were used to rate the level of satisfaction as shown
in Table 1 below
Table 1 Intervals of Satisfaction Level (Poonlarbtawee 1987)
The interpretation of the scales in this study is as follows
Rating
Scale
Level of
Agreement Disagreement
Satisfaction
Level
Mean Score
5 Strongly agree Excellent 451-500
4 Agree Good 351-450
3 Uncertain Average 251-350
2 Disagree Fair 151-250
1 Strongly disagree Poor 100-150
The researcher picked up lsquothe high grouprsquo and lsquothe low grouprsquo of each
SERVQUAL dimension to present the relationship between the participantsrsquo
demographic profile and their satisfaction As the data gained from the highest number of
the participants or the high group was the major point that the researcher relied on focus
was on the majority opinion At the same time the data gathered from the lowest number
of the participants or the low group should not be overlooked because each and all
passengers are important for TG and in the high competitive airline market it is necessary
to retain each and every passenger so as to grow far in the aviation business
The results were presented in terms of percentages and mean scores in the form of
tables and a bar chart These fundamental statistic methods were proper in this study
25
because percentages and mean scores are considered the basic statistics used for data
analysis and presentation Also the general public can easily understand the
interpretation of the data Another reason was that the sample group of this study
comprised only 150 TG passengers The researcher therefore decided to apply the
aforementioned statistics in this research Discussion of the results was also offered
CHAPTER FOUR
FINDINGS
This chapter describes the findings of the study consisting of the demographic
data of the participants level of their satisfaction with TGrsquos service quality relationship
between the demographic data and five dimensions of SERVQUAL instrument and the
uncovers to the last question on the questionnaire including suggestion
41 Demographic Data
The demographic data of TGrsquos research participants in terms of age occupation
monthly income purpose of travel and frequency of travel are presented in Tables 2- 6
below
Table 2 Participantsrsquo Age
Age No of Participants Percentage ()
Under 20 years
21-40 years
41-60 years
Above 60 years
8
85
45
12
53
567
300
80
Total 150 100
Regarding the age group the highest number of the passengers was 20-40 years
old or 567 30 of them were 46-60 years old and 8 were above 60 years old Only
53 were under 20 years old
27
Table 3 Participantsrsquo Occupation
Occupation No of Participants Percentage ()
Government official State enterprise employee
Business employee
Business owner
Student
Retiree
Others
22
63
37
13
9
6
147
420
247
86
60
40
Total 150 100
In terms of occupation the highest number of the participants was business
employees (42) followed by business owners (247) government officials or state
enterprise employees (147) students (86) retirees (6) and other occupations (4)
respectively
Table 4 Monthly Income
Monthly income (baht) No of Participants Percentage ()
Up to 20000
20001- 40000
40001 - 60000
60001 and above
58
72
11
9
386
480
74
60
Total 150 100
For the income the highest number of the participants earned 20001-40000 baht
monthly (48) followed by those with a monthly income of up to 20000 baht (386)
28
of 40001-60000 baht monthly (64) and of 60001 baht and above monthly was the
lowest (6)
Table 5 Purpose of Travel
Purpose of travel No of Participants Percentage ()
Business trips
Holidays
Visits
Others
41
79
27
3
273
527
180
20
Total 150 100
Regarding the purpose of travel the highest number of the passengers traveled via
TG on holidays (527) followed by those who traveled on business trips (273)
Meanwhile those who made a visit were at 180 and who traveled with other purposes
were at 2
Table 6 Frequency of Travel
Frequency in traveling with THAI
(during the last 12 months)
No of Participants Percentage ()
First time
2-3 times
4-10 times
More than 10 times
39
99
10
2
260
660
67
13
Total 150 100
29
The last demographic data derive from the frequency in traveling with THAI
66 of the participants indicated that they traveled 2-3 times during the last 12 months
26 traveled for the first time while 67 for 4-10 times and 13 for more than 10
times during the last 12 months
In conclusion the demographic data shown in the tables above indicated that lsquothe
high grouprsquo comprised the following characteristics The age group of the majority
number of the participants ranged from 21-40 years (567) Most of them were business
employees (42) The highest number of the passengersrsquo monthly income was around
20000 ndash 40000 baht per month (48) The majority of the passengers traveled on
holidays (527) by TG 2-3 times in the past 12 months (66)
Meanwhile lsquothe low grouprsquo was found having the following characteristics The
lowest number of the research participants was under 20 years old or 53 Only 47 of
the participants had other kinds of occupation which were not indicated on the
questionnaire while only 6 of the participants earned 60001 baht or above monthly
2 of the participants traveled on other purposes besides those shown on the
questionnaire Lastly 13 of the passengers were those who traveled by TG more than
10 times in the past 12 months
42 Level of Passengersrsquo Satisfaction
Figure 1 below is the conclusion from the second part of the questionnaire The
150 participants were asked to rate the level of service quality that they perceived from
the TGrsquos domestic flights on Bangkok - Chiangmai route The questionnaire was divided
into five dimensions of SERVQUALrsquos (Parasuraman et al 1985) service quality which
comprised reliability assurance tangibles empathy and responsiveness The scales 1 to 5
ranged from lsquostrongly disagreersquo to lsquostrongly agreersquo
30
0
5
Reliability Assurance Tangibles Empathy Responsiveness
280
345 334307
269
SERVQUAL Dimension
Figure 1 Overall Level of Participants Satisfaction
Mean scores
Figure 1 shows the average mean score of all 150 passengersrsquo satisfaction on five
dimensions of service quality ranging from the mean scores of 345 to 269 The results
revealed that the most important service quality dimension for the whole samples group
of passengers was assurance ( 345) followed by tangibles ( 334) empathy ( 307)
reliability ( 28) and responsiveness ( 269) respectively The overall average mean
was 307
43 Passengersrsquo Satisfaction Level in Relationship with Their Demographic Data
This section shows the relationship between the demographic data (age
occupation monthly income purpose of travel and travel frequency) of the participants
and their satisfaction with the service quality of TGrsquos in-flight service
The researcher focused on each category of demographic characteristics of two
major groups a group with the highest score and the other with the lowest score In fact
the most important data were the majority opinion of the sample group In other words
for this study it was lsquothe high grouprsquo However the researcher as a TG cabin crew gave
importance to the low group as well since each and every passenger is significant to TG
x
x x x
x x
31
business particularly in the high competitive market of airline business The researcher
was interested to know what the passengers in the lsquolow grouprsquo thought about the in-flight
service and what their feedback was
The following tables (Tables 7-11) illustrate the relationship between each
dimension of the demographic data and the SERVQUAL service assessment tool and the
following symbols are applied in the tables below
lsquoNrsquo means the number of the participants
lsquo rsquo means the mean score
lsquoThe high grouprsquo means the group that comprises the highest number of participants
lsquoThe low grouprsquo means the group that comprises the lowest number of participants
Table 7 Relationship between the Participantsrsquo Age and their Satisfaction with In-flight
Service
SERVQUALrsquoS
RATER
Average
Mean Score
of All Groups
The High Group
(Age 20-40 Yrs Old)
N = 85567
The Low Group
(Age Under 20 Yrs Old)
N = 853
Mean Score of Each Group
Reliability 280 278 270
Assurance 345 378 335
Tangibles 334 331 328
Empathy 307 309 314
Responsiveness 269 267 290
Table 7 reveals the connection between the participantsrsquo age and the five
dimensions of the SERVQUAL instrument The high group had higher mean scores for
x
32
three dimensions than the low group In other words the participants with an age range
of 20-40 years were more satisfied with TGrsquos service quality in terms of reliability
assurance tangibles than those who were under 20 years old Meanwhile the low group
had higher mean scores for two dimensions than the high group This means the
participants who were lower than 20 years old were more satisfied with the in-flight
service in terms of empathy and responsiveness than those whose ages ranged from 20-40
years
Interestingly it was found that both groups have a lower mean score for the
reliability dimension ( 278 and 270) than the average mean score of all the age groups
in this study ( 28)
Table 8 Relationship between the Participantsrsquo Occupation and their Satisfaction with In-
flight Service
SERVQUALrsquoS
RATER
Average
Mean Score
of All Groups
The High Group
(Business Employee)
N = 63420
The Low Group
(Others)
N = 640
Mean Score of Each Group
Reliability 280 275 284
Assurance 345 347 348
Tangibles 334 331 336
Empathy 307 310 305
Responsiveness 269 264 277
Table 8 illustrates the connection between the participantsrsquo occupations and the
five dimensions of the SERVQUAL instrument The low group had higher mean scores
x
x
33
for almost all the dimensions of SERVQUALrsquos RATER than the high group except for
one dimension In other words the participants who worked as business employees were
less satisfied with TGrsquos service quality in terms of reliability assurance tangibles and
responsiveness than those whose occupations were not specified in the questionnaire
Empathy was the only dimension of service quality that the participants who were in the
high group were satisfied with
Table 9 Relationship between the Participantsrsquo Income and their Satisfaction with In-
flight Service
SERVQUALrsquoS
RATER
Average
Mean Score
of All Groups
The High Group
(20001-40000)
N = 72480
The Low Group
(60001 and above)
N = 960
Mean Score of Each Group
Reliability 280 273 285
Assurance 345 349 350
Tangibles 334 332 321
Empathy 307 301 325
Responsiveness 269 262 273
Table 9 indicates the connection between the participantsrsquo monthly income and
the five dimensions of the SERVQUAL instrument The low group had higher mean
scores for almost all the dimensions of RATER than the high group except for one
dimension In other words the participants who earned monthly income of 20001 ndash
40000 baht were less satisfied with TGrsquos service quality in terms of reliability assurance
empathy and responsiveness than those who earned monthly income of 60001 baht and
34
above The tangibles dimension was the only service quality issue that the participants
who were in the high group were satisfied with
Table 10 Relationship between the Participantsrsquo Purpose of Travel and their Satisfaction
with In-flight Service
SERVQUALrsquoS
RATER
Average
Mean Score
of All Groups
The High Group
(Holidays)
N = 79527
The Low Group
(Others)
N = 320
Mean Score of Each Group
Reliability 280 279 285
Assurance 345 353 349
Tangibles 334 335 338
Empathy 307 308 312
Responsiveness 269 270 275
Table 10 reflects the connection between the participantsrsquo purpose of travel and
the five dimensions of the SERVQUAL instrument The low group had higher mean
scores for almost all the dimensions than the high group except for one dimension In
other words the participants who traveled on holidays were less satisfied with TGrsquos
service quality in terms of reliability tangibles empathy and responsiveness than those
whose purpose of travel were not specified in the questionnaire Assurance was the only
dimension of service quality that the participants who were in the high group were
satisfied with
35
Interestingly it was found that both groups has a higher satisfaction level for the
assurance tangibles empathy and responsiveness dimensions than the average mean
scores of the whole sample group
Table 11 Relationship between the Participantsrsquo Frequency of Travel with THAI and their
Satisfaction with In-flight Service
SERVQUALrsquoS
RATER
Average Mean
Score of All
Groups
The High
Group
(2-3 timesyear)
N = 99660
The Low Group
(more than 10
timesyear)
N = 213
Mean Score of Each Group
Reliability 280 281 295
Assurance 345 346 360
Tangibles 334 335 343
Empathy 307 308 321
Responsiveness 269 270 292
Table 11 presents the connection between the participantsrsquo frequency of travel
with THAI and the five dimensions of the SERVQUAL instrument The low group had
higher mean scores for all the dimensions of RATER than the high group In other
words the participants who traveled 2-3 times in the last 12 months were less satisfied
with TGrsquos service quality in terms of reliability assurance tangibles empathy and
responsiveness than those whose frequency of travel were more than 10 times in the last
12 months
36
Interestingly it was found that both groups has a higher satisfaction level for all
the five RATER dimensions than the average mean scores of the whole sample group in
this study
44 Other Comments
The last part of the questionnaire was designed to ask whether the participants
would continue using TGrsquos service The findings disclosed that 142 participants or
946 indicated that they would while 8 of them or 54 declined
Also at the end of the questionnaire there was a blank space for the participants to
freely express their own ideas and suggestions on TGrsquos service However only 7
participants or 46 gave suggestions regarding the in-flight service Four of the
participants were dissatisfied with the flavor of the snacks provided on board One
complained that it was not cool enough in the cabin while one was upset for not being
granted for a request for a blanket The last one commented that the passengerrsquos seat was
not comfortable
In summary the passengersrsquo satisfaction level of the service quality in connection
with their demographic data was introduced Five out of the six demographic
characteristics the participantsrsquo age occupation monthly income purpose of travel and
frequency of travel were analyzed in connection with the five dimensions of SERVQUAL
instrument reliability assurance tangibles empathy and responsiveness It was observed
that there were some connection between these two matters in various ways as earlier
discussed Lastly it was found that one hundred and forty-two participants would
continue using TGrsquos service while the rest refused Only seven of all the participants or
46 gave some comments on the open-ended suggestion part
CHAPTER FIVE
CONCLUSION AND DISCUSSION
This chapter presents the conclusion discussion limitations of the study and
recommendations for further studies
51 Conclusion
This research aimed to examine the service quality provided by Thai Airways
International on its domestic flights One hundred and fifty passengers who traveled by
TG on the Bangkok - Chiang Mai route were the research participants The SERVQUAL
instrument was used as an instrument for data collection in the survey This instrument
was based on five determinants proposed by Panasuraman etal (1985) in terms of
reliability assurance tangibles empathy and responsiveness This research was also
conducted on the demographic characteristics comprising gender age occupation
monthly income purpose of travel and frequency in traveling and the relationship of these
characteristics except the gender with the passengersrsquo satisfaction with TGrsquos in-flight
service quality The questionnaires were distributed in early March 2010
The results showed that all the participantsrsquo satisfaction based on the five
dimensions was at the average level The highest level of passengersrsquo satisfaction was
placed on the assurance dimension followed by tangibles and empathy dimensions
accordingly The two lowest levels of the passengersrsquo satisfaction were placed on the
responsiveness and reliability dimensions
In addition a summary of the demographic characteristics showed that the high
group or the group with the highest number of participants was business employees The
highest number of the participants was between 21-40 years old The highest number of
38
the participantsrsquo income ranged from 20000 ndash 40000 baht monthly Also the high
grouprsquos purpose of travel was to go on holiday Lastly the highest number of the
participants traveled via TG only 2-3 times during the past 12 months
Meanwhile the low group or the group with the lowest number of participants
was passengers with other kinds of occupations which were not specified on the
questionnaire The low group of the participants was under 20 years old The low group
of the participantsrsquo income ranged from 60001 baht monthly or higher Also the low
group revealed that they traveled via TG for other purposes which were not indicated on
the questionnaire Lastly the passengers who traveled via TG more than 10 times during
the past 12 months belonged in the low group
It has also been discovered that as a whole both groups the high and low groups
were in the same direction in their satisfaction with the five dimensions of service quality
The two groups were satisfied with the service quality dimensions in terms of assurance
at the highest level followed by tangibles empathy reliability and responsiveness
respectively
However when analyzing each demographic characteristic the participants who
were under 20 years old rated the responsiveness dimension higher than the reliability
dimension Also for those participants whose income was around 60001 or higher the
empathy dimension was rated higher than the tangibles Regarding the occupation
business people were satisfied with the reliability and responsiveness dimensions at a
very low level Meanwhile the participants who traveled via TG on their holidays rated
the assurance dimension at a very high level Lastly frequent fliers who traveled by
THAI more than 10 times were most satisfied with TGrsquos service since they rated all
RATER aspects highly
39
52 Discussion
The findings have revealed the answers to the research questions First the
demographic data of the participants gender age occupation monthly income purpose
of travel and frequency of travel were shown Second the level of the passengersrsquo
satisfaction toward the service quality on Thai Airways Internationalrsquos domestic flights in
terms of the SERVQUAL instrument (Parasuraman et al 1985) reliability assurance
tangibles empathy and responsiveness was disclosed Also the results about the
relationship between the passengersrsquo satisfaction and their demographic data were pointed
out
The results of the survey indicated that out of the five dimensions assurance was
rated at the highest level ( 345) followed by tangibles ( 334) and empathy ( 307)
(See Figure 1) In addition passengers rated their highest satisfaction with the assurance
dimension which included cabin crewrsquos job knowledge their courtesy confidence in their
service ability and safety while traveling It may be because TG cabin crew are well-
trained prior to their actual service work on board This can also ensure passengersrsquo
safety Particularly the safety and security features have been the most concerns of
airline passengers since the 9-11 incidents in New York USA This is why most
customers rated their highest satisfaction with the assurance dimension (Carman 1990)
The findings of this study are also consistent with those of Fick and Ritchie (1991)
who studied the operation of the SERVQUAL instrument in three major tourism sectors
airlines restaurants and ski area services It was revealed that the most important
dimensions of the service were assurance and tangibles If companies were unable to
inspire trust and confidence in their customers and the tangibles are not impressive it
would be difficult for them to achieve a high level of customerrsquos satisfaction (Sachukorn
2000)
x x x
40
Responsiveness is often found as the lowest level of satisfaction among customers
in the service industry It is plausible that the staff were too busy to provide prompt and
good service (Kholthanasep 2001) In this study the results revealed that the
responsiveness dimension was rated at the lowest score ( 269) among the five
dimensions followed by the reliability ( 280) dimension It was highly possible that the
passengersrsquo dissatisfaction occurred when passengers did not receive prompt service from
TG when they needed help
Prompt service is an important factor of customersrsquo expectation Customers
generally rate the service as poor when the speed of service does not meet their
expectations (Kholthanasep 2001) Bojanic and Rosen (1994) examined the nature of the
association between service quality as perceived by consumers and its determinants by
applying SERVQUAL in a restaurant setting They found that customers rated
responsiveness as the lowest satisfaction in their studies Zeithaml et al (1990) explained
that the responsiveness dimension in the SERVQUAL was willingness to help customers
and provide prompt service As the responsiveness dimension in this research comprised
prompt service willingness on-time service and quick response therefore it will be
beneficial to TG if the company can ensure that the service provided by its cabin crew
especially the willingness to help passengers and to provide prompt service meet
passengersrsquo satisfaction
Regarding the relationship between the participantsrsquo demographic data and their
satisfaction with the service quality there are many points of interests to be discussed as
follows
Firstly regarding the relationship of the passengersrsquo satisfaction with the service
and their age those who were under 20 years old rated satisfaction with the
responsiveness dimension ( 290) higher than the reliability dimension ( 270) (See
x
x
x x
41
Table 7) It was possible that young passengers usually gave priority to the dimension of
care and service when compared with that of the service providersrsquo accurate and
dependable manner (Panittumrong 2003) In addition young customers had less
experience in a service and it was difficult to compare the current service with the past
experience consequently they were more satisfied with the service provided than senior
customers
Another point was raised about the participantsrsquo age The study revealed that the
number of the high group with the age range of 21- 40 was at 567 However that of
the second highest group of the participants with the age range of 41-60 was at 30
which was rather high This latter grouprsquos level of satisfaction on the service quality was
also close to the average mean score It was found that the average mean score of the
reliability dimension was 280 while that of the second highest group was 281 the
average mean score of the assurance dimension was 345 while that of the second highest
group was 347 the average mean score of the tangibles dimension was 334 while that of
the second highest group was 335 the average mean score of the empathy dimension and
that of the second highest group was rated at 307 equally and the average mean score of
the responsiveness was 269 while that of the second highest group was 271 In sum if
consider the two groups in terms of the participantsrsquo age one of the high group and the
other with the second high group the results confirmed that the satisfaction level of the
majority of passengers was at the above average level
Secondly regarding the relationship between the participantsrsquo satisfaction and
their occupation business employees who were found at the highest number (42) had
very low satisfaction with the service quality in terms of reliability ( 275) and
responsiveness ( 264) while the mean scores of the whole sample group for these two
dimensions were at 280 and 269 respectively (See Table 8) The findings strongly
x
x
42
correlated with that of Cheaosakul (2004) who studied the consumersrsquo perception of
airline service quality with a focus on occupations It was found that the group of
business employees had the highest score on expectations Cheaosakul (2004)rsquos study
also revealed that business employees did not frequently travel compared with people of
other occupations such as tourists It was found in this particular study that the number of
the participantsrsquo purpose of travel with TG for business trips was only at 273 (See
Table 5) while the highest number of the participants went on holiday was at 52
Cheaosakul (2004) indicated that business people therefore had high expectations than
the other group who traveled more frequently
Thirdly an even more interesting point was raised when comparing the level of
satisfaction of the passengers who were government officials or state enterprise
employees and business owners Although passengers who were government officials or
state enterprise employees came third in terms of participants they are considered
valuable customers of TG since according to the governmentrsquos policy they are required
to take only TG which is a national airline whenever they travel by air There are few
exceptions though However it is almost impossible for Thai government officials who
travel on business trip and are funded by the governmentrsquos budget to fly with other
airliners It was found from this study that government officials were less satisfied with
TG quality service in terms of reliability ( 277) and responsiveness ( 264) than the
average level of which the mean scores of the two dimensions were at 280 and 269
respectively
Another issue of discussion regarding the participantsrsquo occupation business
owners came second It was observed that business owners rated the reliability ( 282)
and responsiveness dimensions ( 270) higher than the average scores of all groups (See
Table 8) It is possible that business owners had more positive attitude with TGrsquos service
x x
x
x
43
than the other groups TG seemed popular among business owners and they were the
most important group of customers This was supported by Suriya (2005) who studied
airline market segments after the launch of the low cost airlines in Thailand Suriya
(2005) identified that merchants or business owners were the major group of customers in
the full-service airline market
Fourthly regarding the monthly income of the research participants of the low
group passengers who earned an income of around 60001 or higher rated the empathy
( 325) dimension higher than tangibles ( 321) dimension (See Table 9) This may
be because the high income passengers sensitively felt that the facilities and equipment
found on their domestic route looked quite old-fashioned due to TGrsquos cost reduction The
company saved costs after the Suvannabhumi airport was closed in the 2008 crisis The
result is similar to the findings of Wangpen and Inthornma (2007) in that high income
customers had higher expectations towards the service It was possible that they had
more tendencies to be dissatisfied with the service failures The two researchers
concluded that passengers with different incomes were satisfied with the services at
different levels because they had different attitudes expectations and abilities to pay for
the service
Fifthly as it was found from this study that the highest score for the purpose of
travel was going on holiday (527) and the participants who were tourists rated the
assurance dimension at the highest level or the mean score of 353 (See Table 10) much
higher than the mean score of the whole group which was at 345 It was rather surprising
that the highest score for the travel purpose was not for business trips It is possible to
explain that this group spent for the travel cost on their own and they might want to make
sure that they chose the best service for themselves The result is parallel with Gabbie
and OrsquoNeill (1997) who examined customer satisfaction in the hotel sector using the
x x
44
SERVQUAL tool This study showed that the holiday guests who paid for
accommodation on their own rated assurance much higher than other dimensions It is
plausible to explain that passengers traveling on their own budget must make sure that
they already chose the service that was worth the money spent
However when analyzing the satisfaction on service quality of the participants
whose purpose of travel via TG was for business it was also found that this business
participants rated the high score for the tangibles dimension at the mean score of 340
compared with the average mean score of all groups of 334 Passengers who traveled on
business included government officials and state enterprise employees were major
customers of TG It was therefore interesting to find out from this study that their
satisfaction score in terms of tangibles or the appearance of physical factors such as
equipment facilities and personnel was above the average score of all groups Although
the score was not much higher the gap was bigger than that of the other RATER
dimensions as seen from the following information the passengers who traveled on
business trip showed their satisfaction on the reliability dimension at the mean score of
281 the assurance dimension at 347 the empathy dimension at 309 and the
responsiveness dimension at 270 while the average of all groups was at 280 345 307
and 269 respectively
The last point that the researcher wanted to point out is that this study revealed
that the participants who traveled more than 10 times for the last 12 months were lowest
in number (13) However it was interesting that these frequent flyers showed the high
rate of satisfaction with TGrsquos in-flight service quality The mean scores in all dimensions
showed the high rate of satisfaction (See Table 11) It is possible that passengers who
traveled very often via TG had high loyalty The brand loyalty made passengers happy in
every feature of service This result however contrasts with Ostrowski et al (1993) who
45
investigated service quality and customer loyalty in the commercial airline industry The
study examined whether the high levels of service quality existed in the US commercial
airline industry and how service quality could potentially lead to customer loyalty The
main results indicated that the levels of perceived service quality were below potential
and that customer loyalty to airlines was low It is plausible to say that the data of the two
studies were different The data collected on two air carriers in USA might have
different characteristics from the demographic information of Thai people and the number
of the participants in the two studies might differ However TG still needs to listen to the
voice of all passengers especially the frequent flyers Even if the number of this sample
group was few every customer is valuable for any firm Also it would be valuable to
implement a relevant strategy to expand this group of passengers since they had a positive
attitude for TG
Interestingly the findings from the last part of the questionnaire also showed that
the majority of the participants (946) showed their willingness to use TGrsquos service in
the future It can plausibly be explained that the participants were satisfied with TGrsquo
service quality at the moderate level ( 307) Their satisfaction with the five dimensions
of SERVQUAL was also moderate They might think that TG is a reliable airline that
they can depend on Thai passengers have confidence and trust in the service of Thai
cabin crew in terms of courtesy Also it is possible that they might not trust the low cost
airlinesrsquo service of the crew
There were only seven remarks on the in-flight service when the participants were
asked to freely give suggestions The tangible dimension problematic Passengers
pointed out about the small size of passengersrsquo seats and the quality of the air-
conditioning system One problem was on the responsiveness dimension which happened
when a passenger asked for a blanket but she was not offered indicating that some of the
x
46
cabin crewrsquos promptness to provide service was still not up to a standard Another
comment was on the flavor of the snacks Although this issue is not directly relevant to
the service it is worthwhile for TG to consider this problem
In conclusion the researcher found both strengths and weaknesses in TGrsquos service
quality Assurance was found the highest satisfaction in the participantsrsquo opinion TG
should maintain the service quality with a focus on this dimension On the other hand
the responsiveness and reliability dimensions were at the lowest satisfaction level among
the five dimensions The company should improve its service quality on these two
dimensions especially with regards to TGrsquos lsquoprompt servicersquo and lsquoproblem solvingrsquo
service to retain its passengers
53 Limitations of the study
This study has some limitations as follows
1 This study was limited to only one domestic route (Bangkok ndash Chiangmai)
Therefore the participants in this study were passengers who traveled only between these
two provinces The results of the study might differ if the study covered another route or
many more routes at the same time Consequently further studies can be conducted for
other domestic destinations such as Phuket and other big cities
2 The research participants were all Thai passengers It would be interesting to
study foreign passengersrsquo satisfaction on TGrsquos in-flight service quality
3 This study focused only on Parasuraman et al (1985)rsquos SERVQUAL
Instrument used to assess the service quality The results might differ if other instruments
were used
47
54 Recommendations for further studies
Further research should be undertaken to validate the results of this study The
researcher has found several opportunities to extend this study as follows
Survey on the lsquoresponsivenessrsquo dimensions
Responsiveness concerns the willingness or readiness of employees to provide
service such as timelines of service and prompt service This dimension was what the
passengers in this study were most concerned about because it was rated as the lowest
level of satisfaction Thus TG should find the countermeasure of how to increase the
level of passengersrsquo satisfaction in the responsiveness dimension
Assessment of the ground service quality
Since this research was conducted on on-board service quality further studies on
ground services such as a reservation or check-in service should be investigated in order
to integrate the results covering every sector of the airline service
Study on passengersrsquo attitude towards the service quality in other airlines
A study on the service quality of other airlines should be conducted in order to
obtain comparative data and find out reasons for their passengersrsquo behavior and attitude
consequently allowing TG to remedy any weak points and increase the number of new
passengers
REFERENCES
REFERENCES
Alegre J amp Pou L (2006) An analysis of the microeconomic determinants of travel
frequency Department of Applied Economics Universitat de les Illes Balears
Bojanic DC (1991) Quality measurement in professional service firms Journal of
Professional Service Marketing 7(2) 27-37
Bojanic D C amp Rosen L D (1994) Measuring service quality in restaurants An
application of the SERVQUAL model Journal of Hospitality Research 18(1)
3-14
Boontaganon W (2002) The study of service quality of fast-food restaurants in Bangkok
using SERVQUAL measurement Thesis MBA (Business Administration)
Bangkok Assumption University Photocopied
Buttle F (1996) SERVQUAL review critique research agenda European Journal of
Marketing 30(1) 8-31
CarmanJ M (1990) Consumer perceptions of service quality An assessment of the
SERVQUAL dimensions Journal of Retailing 69 33-35
Cheaosakul W (2004) Consumers perception of service quality a case study of Thai
Airways International Plc Thesis MBA Bangkok Assumption University
Photocopied
Fick RG amp Ritchie JRB (1991) Measuring service quality in the travel and tourism
industry Journal of Travel Research 30(2) 2-9
Fornell C (1992) A national customer satisfaction barometer the Swedish experience
Journal of Marketing 56 6-21
Gabbie O amp OrsquoNeill M (1997) SERVQUAL and the Northern Ireland hotel sector a
comparative analysis part 2 Managing Service Quality 17(1) 43-49
50
Gilbert DH (1999) Marketing connecting with customers (2nd
ed) Upper Saddle
River NJ Prentice Hall
Gilbert D amp Wong KCR (2002) Passenger expectations and airline services a
Hong Kong based study Surrey Management School Surrey University of
Surrey
Gitman LJ amp Carl DM (2005) The future of business the essentials Mason Ohio
South-Western College Pub
Grifin J (1995) Customer loyalty NY Lexington Book
Gronroos C (1978) A service-oriented approach to marketing of services European
Journal of Marketing 12(8) 588-601
Hennig-Thurau T amp Klee A (1997) The impact of customer satisfaction and
relationship quality on customer retention a critical reassessment and model
development Masterrsquos Project MA (Psychology amp Marketing) Hanover
University of Hanover
Heesawat C (2005) The opportunities and problems in making services more tangible
PhD Dissertation Bangkok Assumption University Photocopied
Juran JM amp Gryna FM (1974) Quality control handbook NY McGraw-Hill
Kholthanasep G (2001) A study of customerrsquos expectations and perceptions of service
quality delivery by first class hotels in Bangkok metropolitan area Thesis
MBA Bangkok Assumption University Photocopied
Kotler P amp Scheff J (1997) Standing room only strategies for marketing the
performing arts Boston Mass Harvard Business School Press
Kotler P (1997) Marketing management analysis planning and control (9th
ed) Upper
Saddle River NJ Prentice Hall
51
Kotler P Bowen J amp Makens J (1999) Marketing for hospitality and tourism (2nd
ed) NJ Prentice Hall
Kotler P (2000) Marketing management the millennium edition (10th
ed) NJ Prentice
Hall
Lages FL amp Fernandes CJ (2005) The SERVQUAL scale a multi-item instrument
for measuring service personal values Journal of Business Research 58(11)
1562-1572
Oberoi U amp Hales C (1990) Assessing the quality of the conference hotel product
London The Service Industries Journal 10(4) 700-722
Ostrowski PL Orsquobrien TV amp Gordon GL (1993) Service quality and customer
loyalty in the commercial airline industry Journal of Travel Research 32(2)
16-24
Palin M (1996) Flight catering transportation and loading (2nd
ed) London Longman
Group Limited
Panittumrong P (2004) The consumerrsquos opinion towards Clark Hatch Fitness Center
Master Project MBA (Management) Bangkok Graduate School
Srinakharinwirot University Photocopied
Parasuraman A Zeitmal VA amp Berry LL (1985) A concept model of service
quality and its implications for future research Journal of Marketing 49 41-50
Parasuraman A Zeitmal VA amp Berry LL (1988) SERVQUAL a multiple item
scale for measuring customer perceptions of service quality Journal of
Retailing 64(1) 64
Parasuraman A amp Berry LL (1991) Marketing services competing through quality
NY The Free Press
52
Pirsig RM (1987) Zen and the art of motorcycle maintenance an inquiry into values
(Mass Market Paperback) NY Bantam Books
Poonlarbtawee K (1987) Statistics for research Bangkok Physic Center Printing
Reid RD amp Bojanic DC (2001) Hospitality marketing management NJ John Wiley
amp Son Inc
Rueangthanakiet P (2008) Memberrsquos satisfaction of fitness service quality a case study
of California Wow Xperience Plc Masterrsquos Project MA (Business English for
International Communication) Bangkok Graduate School Srinakharinwirot
University Photocopied
Sachukorn S (2006) Reception and service excellence Bangkok Saitharn
Schiffman LG amp Kanuk LL (1994) Consumer behavior (5th
ed) London Prentice-
Hall International
Somwang C (2008) An assessment of passengersrsquo views of service quality in Thai low
cost carriers Inter Program MA (Communicative English) Bangkok
Ramkhamhaeng University Photocopied
Suriya K (2005) Airline market segments after low cost airlines in Thailand passenger
classification using neural networks and logit model with selective learning
Faculty of Economics Chiangmai Chiangmai University
Suthirungkul N (2003) The study of customer expectations and perceptions of service
quality of the Clark Hatch fitness center of Silom road branch Bangkok Thesis
MBA (Business Administration) Bangkok Assumption University
Photocopied
Thai Airways International (2008) Traffic program information (Introduction of summer
200809) Bangkok THAI Printing Office
53
Thai Airways International (2009) Traffic program information (Introduction of winter
200910) Bangkok THAI Printing Office
THAI AIRWAYS INTL Official 4-Star Ranking of Product and Service Quality (2009
October) Retrieved February 14 2010 from
httpwwwairlinequalitycomAirlinesTGhtml
Travel Planning (2010 February 12) Retrieved February 12 2010 from
httpwwwsuite101comlessoncfm1848818243
Wangpen N amp Inthornma S (2007) Membersrsquo satisfaction in fitness centers in
Bangkok Thesis MA (Hotel and Tourism Management) Bangkok Graduate
School Naresuan University Photocopied
Zeithaml VA amp Bitner MJ (2000) Services marketing (2nd
ed) NY McGraw Hill
Zeithaml VA Parasuraman A amp Berry LL (1990) Delivering quality service
balancing customer perceptions and expectations NY Free Press
APPENDICES
55
APPENDIX A
แบบทดสอบความพงพอใจของผโดยสารการบนไทย
เรยนทานผโดยสารทเคารพ กระผมนาย วลาศ มนคงวณชกล พนกงานตอนรบสายการบนไทย และนกศกษาปรญญาโท หลกสตรภาษาองกฤษธรกจเพอการสอสารนานาชาต มหาวทยาลยศรนครนทรวโรฒ ไดจดท าแบบสอบถามนเพอเปนสวนหนงของการส ารวจความพงพอใจของผโดยสารทมตอคณภาพงานบรการ เทยวบนภายในประเทศของการบนไทย โดยมงหวงทจะน าขอมลทไดรบจากการส ารวจมาเปนประโยชนตอการสงเสรมสนบสนนการปฏบตงานใหเกดประสทธผล จงขอความกรณาจากทานในการตอบแบบสอบถามทกขอตามขอเทจจรงและความเหนของทาน ขอมลทงหมดเปนความลบ จะใชเพอการวจยเทานน และขอขอบคณในความรวมมอของทาน
helliphelliphelliphelliphelliphelliphelliphelliphelliphelliphelliphelliphelliphelliphelliphelliphelliphelliphelliphelliphelliphelliphelliphelliphelliphelliphelliphelliphelliphelliphellip
ค าชแจง โปรดท าเครองหมาย (x) ลงในชองวาง ทตรงกบค าตอบของทาน
ตอนท 1 ขอมลทวไป
1 เพศ ( ) ชาย ( ) หญง 2 อาย ( ) ตากวา 20 ป ( ) 21-40 ป ( ) 41-60 ป ( ) 60 ปขนไป 3 อาชพ ( ) ขาราชการ รฐวสาหกจ ( ) พนกงานบรษท ( ) ธรกจสวนตว ( ) นกเรยน นกศกษา ( ) เกษยณ ( ) อนๆ 4 รายได เดอน ( ) ตากวา 20000 ( ) 20001- 40000 บาท ( ) 40001- 60000 บาท ( ) 60001 บาท ขนไป 5 จดประสงคการเดนทาง ( ) ธรกจ ( ) พกผอน ( ) เยยมเยยนญาตมตร เพอนฝง ( ) อนๆ 6 ความถในการเดนทางกบการบนไทย (ในรอบ 12 เดอน) ( ) ครงแรก ( ) 2-3 ครง ( ) 4-10 ครง ( ) 10 ครงขนไป
56
ตอนท 2 ความพงพอใจของทานตอการบรการ (5 = เหนดวยอยางยง 4= เหนดวย 3= ปานกลาง 2=ไมเหนดวย 1=ไมเหนดวยอยางยง)
ระดบความพงพอใจ
การบรการของการบนไทย 5 4 3 2 1 1 เมอเจาหนาทสญญาทจะใหบรการทานในเรองใด จะทาตามนนเสมอ
2 การใหบรการของเจาหนาท สรางความเชอมนใหกบทาน
3 อปกรณบนเครองบนมรปแบบททนสมย (เชน จอทว ทนง)
4 บรษทฯกาหนดเวลาการใหบรการบนเครองเหมาะสม
5 เจาหนาทใหบรการทดนบตงแตกาวแรกบนเครอง
6 เจาหนาทมความตงใจดทจะชวยเหลอทาน เมอทานมปญหา
7 ทานรสกปลอดภยเมออยบนเครองบน
8 สงอานวยความสะดวกตางๆบนเครอง มรปลกษณทดงดดใจ (เชน กลองอาหาร) 9 เจาหนาทไมเขาใจความตองการของทาน ในบางกรณ
10 เจาหนาทไมไดระบเวลาในการใหบรการผโดยสารบนเครองทแนนอน 11 เจาหนาทพยายามทางานโดยไมใหเกดขอผดพลาด
12 เจาหนาทปฎบตงานดวยความสภาพเสมอ
13 เจาหนาทแตงกายเรยบรอยและดด
14 บรษทฯใหความเอาใจใสกบผโดยสารเปนรายบคคล
15 บางครงเจาหนาทไมเตมใจทจะใหบรการผโดยสาร
16 บรษทใหบรการทานตรงเวลาทกาหนด
17 เจาหนาทสามารถใหขอมลเกยวกบการเดนทางไดอยางถกตอง
18 เอกสารของบรษทฯทเกยวของกบการบรการ (เชน แผนพบ นตยสาร) มขอมลครบถวน และรปแบบสวยงาม 19 เจาหนาทใหบรการทานดวยสมผสความเปนไทย
20 เจาหนาทใหบรการผโดยสารอยางรวดเรว
ทานจะกลบมาใชบรการของการบนไทยตอไป จะใชบรการตอไป ไมใชบรการ
ขอเสนอแนะ_______________________________________________________
_____________________________________________________________ ขอบพระคณอยางสงในความรวมมอของทาน
57
APPENDIX B
Questionnaire
Dear Honorable Passengers
My name is Wilas Mankongvanichkul -- a THAI cabin crew and masterrsquos student of business English
for international communication program Srinakharinwirot University This questionnaire is about
an exploration of passengersrsquo satisfaction with service quality of Thai Airways International (TG)rsquos
domestic flights Data gained will be utilized for THAI service operation Please kindly complete the
questionnaire The data gained will be kept confidential and used for the research study only Your
kind cooperation is greatly appreciated
helliphelliphelliphelliphelliphelliphelliphelliphelliphelliphelliphelliphelliphelliphelliphelliphelliphelliphelliphelliphelliphelliphelliphelliphelliphellip
Direction Please mark (x) your answer in the space provided
Part 1 Personal Information
1 Gender
( ) Male ( ) Female
2 Age
( ) Under 20 years ( ) 21-40 years
( ) 41-60 years ( ) Above 60 years
3 Occupation
( ) Government official State enterprise employee
( ) Business employee
( ) Business owner ( ) Student
( ) Retiree ( ) Others
4 Monthly income
( ) Up to 20000 baht ( ) 20001- 40000 baht
( ) 40001 ndash 60000 baht ( ) 60001 baht and above
5 Purpose of travel
( ) Business trips ( ) Holidays
( ) Visits ( ) Others
6 Frequency in traveling with THAI (during the last 12 months)
( ) First time ( ) 2-3 times
( ) 4-10 times ( ) More than 10 times
58 Part 2 Your satisfaction with the service
(5=Strongly Agree 4= Agree 3=Uncertain 2=Disagree 1= Strongly Disagree)
Level of Satisfaction
The Service of THAI 5 4 3 2 1
1 When cabin crew promise to do something by a
certain time they do so
2 You can trust THAI cabin crew
3 TG has modern on board equipment
(such as TV screen passengersrsquo seats)
4 TG has operating hours on board convenient to all
passengers
5 Cabin crew offer good services upon boarding
6 When passengers have a problem cabin crew show a
sincere interest in solving it
7 Passengers feel safe on-board
8 The physical facilities of TG are visually appealing
(such as meal boxes)
9 Cabin crew do not understand your special needs in
some cases
10 Cabin crew do not tell passengers exactly when
services will be offered
11 Cabin crew insist on error-free records
12 Cabin crew are consistently courteous to passengers
13 Cabin crew are well-dressed and neat in appearance
14 TG gives passengers individual attention
15 Cabin crew are not always willing to help passengers
16 TG provides its services at the time it promises to
do so
17 Cabin crew are knowledgeable to answer passengers
travel-related questions
18 Documents about service are informative and appealing
(such as pamphlets and magazines)
19 Services provided have a ldquoThai Touchrdquo
20 Cabin crew are quick to respond to passengersrsquo requests
Will you come back for TGrsquos service Yes No
Suggestions________________________________________________________________
________________________________________________________________________ Thank you very much for your kind cooperation
59
APPENDIX C
Questionnaire Specification Based on SERVQUAL measurement (Parasuraman et al 1985)
Passengers satisfaction level toward service quality factors
No Service Quality Features (RATER)
Str
on
gly
ag
ree
Ag
ree
Un
certa
in
Dis
ag
ree
Str
on
gly
Dis
ag
ree
(5) (4) (3) (2) (1)
1 When cabin crew promise to do something by a certain time they do so Reliability
2 You can trust THAI cabin crew Assurance
3 TG has modern on board equipment (such as TV screen passengersrsquo seats) Tangibles
4 TG has operating hours on board convenient to all passengers Empathy
5 Cabin crew offer good services upon boarding Responsiveness
6 When passengers have a problem cabin crew show a sincere interest in solving it
Reliability
7 Passengers feel safe on-board Assurance
8 The physical facilities of TG are visually appealing (such as meal boxes) Tangibles
9 Cabin crew do not always understand your special needs in some cases Empathy
10 Cabin crew do not tell passengers exactly when services will be offered Responsiveness
11 Cabin crew insist on error-free records Reliability
12 Cabin crew are consistently courteous to passengers Assurance
13 Cabin crew are well-dressed and neat in appearance Tangibles
14 TG gives passengers individual attention Empathy
15 Cabin crew are not always willing to help passengers Responsiveness
16 TG provides its services at the time it promises to do so Reliability
17 Cabin crew are knowledgeable to answer passengers travel-related questions Assurance
18 TGs documents associated with services are informative and appealing (such as pamphlets and magazines)
Tangibles
19 Services provided have a ldquoThai Touchrdquo Empathy
20 Cabin crew are quick to respond to passengersrsquo requests Responsiveness
VITAE
61
VITAE
Name Wilas Mankongvanichkul
Date of Birth February 14 1980
Place of Birth Bangkok
Address 688 Soi Phaholyothin 32 Chankasem Jatuchak
Bangkok 10900
Present Occupation Cabin Crew
Thai Airways International Public Company Limited
89 Vibhavadi Rangsit Road Bangkok 10110
Education Background
2010 Master of Art (Business English for International
Communication)
Srinakharinwirot University
2001 Bachelor of Business Administration Bangkok University
1997 High School Saint Dominic School
- Cover
- Abstract
- Chapter 1
- Chapter 2
- Chapter 3
- Chapter 4
- Chapter 5
- Bibliography
- Appendix
- Vitae
-

12
of service delivery and the customers have fewer tangible characters to be measured
physically when purchasing services than when purchasing products (Gronroos 1978)
Service quality is the degree of how well the service level delivered matches
customer expectations Delivering quality service means that the service provider needs
to follow customer expectations on a consistent basis (Lewis amp Booms 1983)
To conclude three underlying service quality themes can be drawn from the
discussion as follows
Service quality is more difficult for the customer to evaluate than product quality
Service quality perceptions result from a comparison of consumer expectations
with actual service performance
Quality evaluations are not made solely on the outcome of a service They
involve evaluations of the process of service delivery
The Benefits of Service Quality
The benefits of service quality comprise four areas as follows (Kotler 2000)
Customers Retention High quality builds loyal customers and creates positive word of
mouth which is an important factor in purchase decision This can determine customer
satisfaction which affects repeat business If a customer is happy with an existing firm it
is difficult to convince him or her to move to another
Avoidance of Price Competition A firm with a reputation for high quality has
a much stronger competitive position than one with a reputation for poor quality Price-
cutting by a competitor will not be enough to encourage a client to switch Good quality
is more powerful to remain competitive
13
Retention of Good Employees Employees appreciate working in operations
that are well run and produce quality products They do not enjoy receiving customer
complaints Also turnover and loss of employee morale are listed as costs of poor quality
manpower When an operation has good quality it can retain good employees And at
the time business expansion is needed recruiting is easier and training cost is reduced
Reduction of Costs The quality cost includes internal costs external costs and
quality system costs Internal costs are those associated with correcting problems
discovered by the firm before products reached customers External costs are related to
errors that the customers experience They can be very expensive when the customers
decide not to return because of a service problem Then the promotional and advertising
costs or external costs are necessary to be spent to create the company image in order to
make customers come back and win brand loyalty for the company in the end However
the company needs to check the service quality through customersrsquo feedback periodically
to avoid problems
Although the quality service system does not come without costs it is usually less
than those internal and external costs resulting from poor quality service Some examples
of the costs of a quality system include customer service audits trainings management
meetings with employees and customers and introduction of a new technology (Kotler
Bowen amp Makens 1999)
To sum up it is necessary for a service company to know the service quality level
The quality needs to be evaluated by comparing customer experience with service
performance Once a service company reaches a good quality level a company will
retain its customers easily be away from price wars keep and get good employees and
reduce some operation costs
14
Thai Airways In-flight Service Quality
The latest airline evaluation in 2009 by Skytrax from United Kingdom which is a
research organization focused on in-flight services revealed that TG got the official 4-star
ranking for its product and service quality This honor is awarded to airlines which
deliver a good quality performance
Skytrax also disclosed that for short travels or domestic routes two traveling
classes are business class and economy class The overall evaluation of the domestic
route showed that TGrsquos business class was rated excellent (5-star) in two articles which
are ldquowashroom cleanlinessrdquo and ldquonewspaper amp magazinerdquo in terms of ldquoonboard productrdquo
category Meanwhile TG also got the highest rank in terms of ldquoservice efficiencyrdquo and
ldquoresponding to requestsrdquo in ldquocabin staff servicerdquo categories In addition in the economy
class TG could do superbly in three articles of cabin staff service which were ldquoservice
efficiencyrdquo ldquoenthusiasm and attituderdquo and ldquofriendliness and hospitalityrdquo (ldquoTHAI
AIRWAYS INTL Official 4-Star Ranking of Product and Service Qualityrdquo 2009)
In conclusion TG has been recognized internationally however it still needs to
move ahead The quality ranking is useful for TG to realize that the company needs to
develop its products and services in all categories in order to step up and well-prepared
for competitions in the future
24 SERVQUAL Model
SERVQUAL is an instrument used for measuring how customers perceive the
quality of the service This instrument is based on five dimensions and on a comparison
between customersrsquo expectations of how the service should be performed and their
experiences of how the service is actually performed Usually 20 attributes are used to
describe the five dimensions and participants are asked to state what they expect from the
15
service and how they perceive the service on a five-point scale from ldquoexcellentrdquo to
ldquopoorrdquo Based on the difference between expectations and experiences over the 20
attributes an overall quality score can be calculated The higher the score shows that
experiences are below expectation the lower the perceived quality (Parasuraman amp
Berry 1991)
SERVQUAL consists of five dimensions (RATER) as follows (Parasuraman et
al 1985)
Reliability This means that a service firm provides its customers with accurate
service the first time without making any mistakes and delivers what it has promised to
do by the time that has been committed
Assurance This means that employeesrsquo behaviors give customers confidence in
the firm and that the firm makes customers feel safe It also means that the employees are
always courteous and have the necessary knowledge to respond to customers questions
Tangibles This dimension relates to the appeal of facilities equipment and
materials used by a service firm as well as to the appearance of service employees
Empathy This means that the firm understands the customersrsquo problems and
performs in their best interests as well as giving customers individual personal attention
and having convenient operating hours
Responsiveness This means that employees of a service firm are willing to help
customers and respond to their requests as well as to inform customers when service will
be provided and give prompt service
16
Application of SERVQUAL Model in Hospitality Business
The SERVQUAL instrument has been used to assess the quality of a wide range
of services in the United States such as financial service operations telephone services
repair and maintenance services (Parasuraman et al 1988) and other professional
services (Bojanic 1991) Fick and Ritchie (1991) have employed the SERVQUAL
instrument to compare services provided by various types of organizations within the
travel and tourism industry Oberoi and Hales (1990) have examined the SERVQUAL
approach as a basis for measuring the quality of the conference hotel products Many
researchers of other service businesses believed that ldquoSERVQUALrdquo is a concise multiple-
item scale with good reliability and validity (Buttle 1996 Lages amp Fernandes 2005)
In Thailand Boontaganon (2002) studied the service quality of fast food
restaurants in Bangkok by using SERVQUAL The study examined the differences in
service quality expectations and perceptions based on demographic characteristics
including gender age occupation education and income level 360 questionnaires were
distributed to people who had just exited from fast food outlets in Bangkok The results
showed significant differences in service quality of customer expectations and
perceptions which indicated the unacceptable service quality delivered by fast food
restaurants in Bangkok
Suthirungkul (2003) studied the customer expectations and perceptions of service
quality of the Clark Hatch Fitness Center at Silom Road Branch Bangkok The objectives
of the study were to identify the SERVQUAL dimensions that customers both local and
foreign used to evaluate The Clark Hatch Fitness Center to study the customer
expectations towards the services quality that should be provided and to evaluate the
perceptions of service quality that customers obtained after using service The
questionnaire was used as a tool for collecting the data 277 Thai and foreign members of
17
the Clark Hatch Fitness Center at Silom Road Branch were the research participants The
results of the study were that there existed gaps between expectations and perceptions in
terms of the five SERVQUAL dimensions and the demographic characteristics had
influenced the gap scores
In short SERVQUAL is an effective measuring tool This tool has widely been
used in many previous studies in hospitality business both domestically and
internationally
25 Demographic Variables
In general business sector market segmentation is often based on demographic
profiles (Reid amp Bojanic 2001) in order that marketers can choose the proper service
segmentation strategies to satisfy different target market segments Demographics are the
variables about consumersrsquo wants preferences and usage rates are often associated with
demographic variables Moreover the demographic variables are easier to measure
(Kotler 2000) Important demographics are as follows
1 Gender There is no logical reason to expect biology to account for this
difference between the sexes The explanation may be in socialization differences and
personality disposition Feminine gender identity is characterized by traits such as
expensiveness and emotionalism and other orientation while masculine gender identity is
characterized by independence activity and self orientation (Kotler amp Scheff 1997)
2 Age Consumersrsquo wants and abilities change with age People buy different
goods and services over their lifetime Peoplersquos tastes in different products and services
are also related to age (Kotler 2000)
18
3 Occupation This variable reflects values attitudes taste and lifestyle
Occupation and income tended to be closely correlation on almost cause-and-effect
relationship (Schiffman amp Kanuk 1994)
4 Income Consumers form a purchase intention based on such factors and
expected family income price and expected benefits from the product and services
(Kotler 1997)
5 Purpose of Travel The purpose of travel measure the frequent distribution
The purposes of travel are for such as business holiday visiting friends and relative and
others (ldquoTravel Planningrdquo 2010)
6 Frequency of Travel A critical factor in predicting the demand for tourism
within a certain period of time is the number of trips individuals take New touristsrsquo
behavior shows a tendency toward more frequent travel (Alegre amp Pou 2006)
To recap the demographic profiles play a significant role in planning service to
meet passengersrsquo satisfaction In airline business six features of the demographics were
included in this study
26 Previous Studies on Airline Passengersrsquo Satisfaction
In an airline business the major revenue of a company comes from the number of
passengers rather than a total sum of cargo service aircraft maintenance or catering
supply all together Studies on airline passengersrsquo satisfaction are numerous as the
following examples
Gilbert and Wong (2003) identified the service dimensions that matter most to
current airline passengers The study measured and compared differences in passengersrsquo
expectations of the desired airline service quality in terms of reliability assurance
19
facilities employees flight patterns customization and responsiveness The primary data
were collected from passengers departing from Hong Kong airport Regarding the
service dimension expectations it was found that there were no statistically significant
differences between passengers who made their own airline choice (decision makers) and
those who did not (non-decision makers) However there were significant differences
among passengers of different ethnic groups nationalities as well as among passengers
who traveled for different purposes such as business holiday and visiting friends or
relatives
The findings also indicated that passengers consistently ranked lsquoassurancersquo as the
most important service dimension It showed that the passengers were concerned about
the safety and security aspects and this also indicated why there had been such a
downturn in demand as this study was conducted just prior to the World Trade Center
incident on September11 2001
In Thailand Somwang (2008) assessed the passengersrsquo views of service quality in
Thai low cost airlines The research was based on the principle that passengers evaluated
airline service quality through a comparison between their experiences and expectations
over a number of quality attributes The study evaluated passengersrsquo perceived service
quality of Thai low cost carriers based on the SERVQUAL instrument The findings
indicated that the passengersrsquo expectations on service quality were higher than what they
had actually experienced Further analysis showed that female passengers had lower
perceived service quality than male passengers The findings also revealed that higher
monthly income had greater differences with respect to expectations and perceptions than
lower income respondents Furthermore passengers usually traveled with low cost
carriers for three main purposes which were for leisure visiting friends or relatives and
business
20
In brief the previous studies explored the satisfaction of airline passengers by
using SERVQUAL instrument to measure the service quality The results above found
out the differences between customersrsquo expectations and perceptions The findings of a
study in Hong Kong revealed the passengersrsquo satisfaction on the dimensions of the
service quality Meanwhile a study in Thailand implied some findings about the
demographic profiles resulting in service quality Studies on service quality help improve
business organizations retain customers and attract new customers
CHAPTER THREE
METHODOLOGY
This chapter consists of four sections participants of the study research
instrument procedures of the study and data analysis
31 Participants of the Study
One hundred and fifty Thai passengers 75 males and 75 females who took the
TG Bangkok - Chiangmai route were randomly chosen as participants for the study
Since there are about 150 passenger seats in each flight the researcher randomly acquired
a sample size of 10 percent of the overall passengers from the ten flights totaling 150
Thai people are the main group of passengers who travel domestically over the year The
researcher therefore decided to select only the Thai passengers as the participants for the
study Also so as to cover various types of passengers the researcher included flights of
different time within a day (as shown in a following part of this chapter) for a reason that
passengers with some specific purposes chose to travel at some specific time For
example business people might prefer an early morning flight rather than a later-in-the-
day one
TGrsquos Bangkok ndash Chiangmai route has been considered one of the most frequent
domestic routes (THAI 2009) TG operates ten flights daily from Bangkok to
Chiangmai The researcher consequently chose this route for this research work to
assess the passengersrsquo satisfaction with TGrsquos service quality
The study was conducted in early March when it was still in the high season for
travels to the northern province of Thailand Fifteen passengers from each of the ten
flights of the Bangkok - Chiangmai route were asked to fill out the questionnaire at the
22
end of the on-board service while the plane was approaching Chiangmai its destination
All the 150 completed questionnaires were obtained as planned
32 Research Instrument
A questionnaire in Thai was used for data collection The questionnaire was
divided into three parts The first part was about the respondentsrsquo demographic profile
since consumersrsquo needs preferences and personalization are often associated with
demographic factors (Kotler 2000) Six demographic characteristics related to in-flight
service (Cheosakul 2004) consisting of gender age occupation monthly income
purpose of travel and travel frequency with THAI were demographic issues of the survey
The second part comprised questions about passengersrsquo satisfaction with the service
during the flight This part of the questionnaire was based on the SERVQUAL
instrument for measuring customersrsquo satisfaction in five dimensions of service reliability
assurance tangibles empathy and responsiveness (Parasuraman et al 1985) The last
part comprised a question and a blank space provided for suggestions on TGrsquos service
quality
33 Procedures of the Study
The questionnaire was initially approved by the researcherrsquos masterrsquos project
advisor and two specialists a TG in-flight service manager and a SWU lecturer Then a
pilot study was conducted to ten passengers to check for content reliability the
appropriateness of the number of questions and language used in the questionnaire As
the researcher included all the ten flights of TGrsquos Bangkok - Chiangmai route in the
study the tried-out questionnaire was randomly distributed to ten TG passengers (5 males
and 5 females) on each flight of the aforementioned route on the same day in February
23
2010 Also since this study was about onboard service the questionnaire was distributed
to the participants after the in-flight service was completed and before the plane landed
After that the questionnaire was adjusted and prepared for the actual survey
The revised questionnaire was eventually distributed to 150 participants in ten
consecutive days in early March 2010 Fifteen passengers in each Bangkok -
Chiangmai flight per day were randomly asked to fill out the questionnaire after the
completion of in-flight service
The plan below showed the ten flights of for the survey each flight for a day to
make sure that the data gained were reliable
BKK-CNX Flight (TG) Flight Schedule (Departure-Arrival)
TG100 0615-0725
TG102 0750-0910
TG104 0910-1030
TG106 1020-1140
TG110 1250-1400
TG112 1400-1510
TG114 1540-1650
TG116 1715-1825
TG120 1900-2010
TG122 2130-2240
34 Data Analysis
The data acquired from the questionnaires were analyzed in three sections
demographic profile of passengers level of passengersrsquo satisfaction with TGrsquos service
and the relationship between demographic profile and passengersrsquo satisfaction based on
24
Likert scale The 5-point Likert scales were used to rate the level of satisfaction as shown
in Table 1 below
Table 1 Intervals of Satisfaction Level (Poonlarbtawee 1987)
The interpretation of the scales in this study is as follows
Rating
Scale
Level of
Agreement Disagreement
Satisfaction
Level
Mean Score
5 Strongly agree Excellent 451-500
4 Agree Good 351-450
3 Uncertain Average 251-350
2 Disagree Fair 151-250
1 Strongly disagree Poor 100-150
The researcher picked up lsquothe high grouprsquo and lsquothe low grouprsquo of each
SERVQUAL dimension to present the relationship between the participantsrsquo
demographic profile and their satisfaction As the data gained from the highest number of
the participants or the high group was the major point that the researcher relied on focus
was on the majority opinion At the same time the data gathered from the lowest number
of the participants or the low group should not be overlooked because each and all
passengers are important for TG and in the high competitive airline market it is necessary
to retain each and every passenger so as to grow far in the aviation business
The results were presented in terms of percentages and mean scores in the form of
tables and a bar chart These fundamental statistic methods were proper in this study
25
because percentages and mean scores are considered the basic statistics used for data
analysis and presentation Also the general public can easily understand the
interpretation of the data Another reason was that the sample group of this study
comprised only 150 TG passengers The researcher therefore decided to apply the
aforementioned statistics in this research Discussion of the results was also offered
CHAPTER FOUR
FINDINGS
This chapter describes the findings of the study consisting of the demographic
data of the participants level of their satisfaction with TGrsquos service quality relationship
between the demographic data and five dimensions of SERVQUAL instrument and the
uncovers to the last question on the questionnaire including suggestion
41 Demographic Data
The demographic data of TGrsquos research participants in terms of age occupation
monthly income purpose of travel and frequency of travel are presented in Tables 2- 6
below
Table 2 Participantsrsquo Age
Age No of Participants Percentage ()
Under 20 years
21-40 years
41-60 years
Above 60 years
8
85
45
12
53
567
300
80
Total 150 100
Regarding the age group the highest number of the passengers was 20-40 years
old or 567 30 of them were 46-60 years old and 8 were above 60 years old Only
53 were under 20 years old
27
Table 3 Participantsrsquo Occupation
Occupation No of Participants Percentage ()
Government official State enterprise employee
Business employee
Business owner
Student
Retiree
Others
22
63
37
13
9
6
147
420
247
86
60
40
Total 150 100
In terms of occupation the highest number of the participants was business
employees (42) followed by business owners (247) government officials or state
enterprise employees (147) students (86) retirees (6) and other occupations (4)
respectively
Table 4 Monthly Income
Monthly income (baht) No of Participants Percentage ()
Up to 20000
20001- 40000
40001 - 60000
60001 and above
58
72
11
9
386
480
74
60
Total 150 100
For the income the highest number of the participants earned 20001-40000 baht
monthly (48) followed by those with a monthly income of up to 20000 baht (386)
28
of 40001-60000 baht monthly (64) and of 60001 baht and above monthly was the
lowest (6)
Table 5 Purpose of Travel
Purpose of travel No of Participants Percentage ()
Business trips
Holidays
Visits
Others
41
79
27
3
273
527
180
20
Total 150 100
Regarding the purpose of travel the highest number of the passengers traveled via
TG on holidays (527) followed by those who traveled on business trips (273)
Meanwhile those who made a visit were at 180 and who traveled with other purposes
were at 2
Table 6 Frequency of Travel
Frequency in traveling with THAI
(during the last 12 months)
No of Participants Percentage ()
First time
2-3 times
4-10 times
More than 10 times
39
99
10
2
260
660
67
13
Total 150 100
29
The last demographic data derive from the frequency in traveling with THAI
66 of the participants indicated that they traveled 2-3 times during the last 12 months
26 traveled for the first time while 67 for 4-10 times and 13 for more than 10
times during the last 12 months
In conclusion the demographic data shown in the tables above indicated that lsquothe
high grouprsquo comprised the following characteristics The age group of the majority
number of the participants ranged from 21-40 years (567) Most of them were business
employees (42) The highest number of the passengersrsquo monthly income was around
20000 ndash 40000 baht per month (48) The majority of the passengers traveled on
holidays (527) by TG 2-3 times in the past 12 months (66)
Meanwhile lsquothe low grouprsquo was found having the following characteristics The
lowest number of the research participants was under 20 years old or 53 Only 47 of
the participants had other kinds of occupation which were not indicated on the
questionnaire while only 6 of the participants earned 60001 baht or above monthly
2 of the participants traveled on other purposes besides those shown on the
questionnaire Lastly 13 of the passengers were those who traveled by TG more than
10 times in the past 12 months
42 Level of Passengersrsquo Satisfaction
Figure 1 below is the conclusion from the second part of the questionnaire The
150 participants were asked to rate the level of service quality that they perceived from
the TGrsquos domestic flights on Bangkok - Chiangmai route The questionnaire was divided
into five dimensions of SERVQUALrsquos (Parasuraman et al 1985) service quality which
comprised reliability assurance tangibles empathy and responsiveness The scales 1 to 5
ranged from lsquostrongly disagreersquo to lsquostrongly agreersquo
30
0
5
Reliability Assurance Tangibles Empathy Responsiveness
280
345 334307
269
SERVQUAL Dimension
Figure 1 Overall Level of Participants Satisfaction
Mean scores
Figure 1 shows the average mean score of all 150 passengersrsquo satisfaction on five
dimensions of service quality ranging from the mean scores of 345 to 269 The results
revealed that the most important service quality dimension for the whole samples group
of passengers was assurance ( 345) followed by tangibles ( 334) empathy ( 307)
reliability ( 28) and responsiveness ( 269) respectively The overall average mean
was 307
43 Passengersrsquo Satisfaction Level in Relationship with Their Demographic Data
This section shows the relationship between the demographic data (age
occupation monthly income purpose of travel and travel frequency) of the participants
and their satisfaction with the service quality of TGrsquos in-flight service
The researcher focused on each category of demographic characteristics of two
major groups a group with the highest score and the other with the lowest score In fact
the most important data were the majority opinion of the sample group In other words
for this study it was lsquothe high grouprsquo However the researcher as a TG cabin crew gave
importance to the low group as well since each and every passenger is significant to TG
x
x x x
x x
31
business particularly in the high competitive market of airline business The researcher
was interested to know what the passengers in the lsquolow grouprsquo thought about the in-flight
service and what their feedback was
The following tables (Tables 7-11) illustrate the relationship between each
dimension of the demographic data and the SERVQUAL service assessment tool and the
following symbols are applied in the tables below
lsquoNrsquo means the number of the participants
lsquo rsquo means the mean score
lsquoThe high grouprsquo means the group that comprises the highest number of participants
lsquoThe low grouprsquo means the group that comprises the lowest number of participants
Table 7 Relationship between the Participantsrsquo Age and their Satisfaction with In-flight
Service
SERVQUALrsquoS
RATER
Average
Mean Score
of All Groups
The High Group
(Age 20-40 Yrs Old)
N = 85567
The Low Group
(Age Under 20 Yrs Old)
N = 853
Mean Score of Each Group
Reliability 280 278 270
Assurance 345 378 335
Tangibles 334 331 328
Empathy 307 309 314
Responsiveness 269 267 290
Table 7 reveals the connection between the participantsrsquo age and the five
dimensions of the SERVQUAL instrument The high group had higher mean scores for
x
32
three dimensions than the low group In other words the participants with an age range
of 20-40 years were more satisfied with TGrsquos service quality in terms of reliability
assurance tangibles than those who were under 20 years old Meanwhile the low group
had higher mean scores for two dimensions than the high group This means the
participants who were lower than 20 years old were more satisfied with the in-flight
service in terms of empathy and responsiveness than those whose ages ranged from 20-40
years
Interestingly it was found that both groups have a lower mean score for the
reliability dimension ( 278 and 270) than the average mean score of all the age groups
in this study ( 28)
Table 8 Relationship between the Participantsrsquo Occupation and their Satisfaction with In-
flight Service
SERVQUALrsquoS
RATER
Average
Mean Score
of All Groups
The High Group
(Business Employee)
N = 63420
The Low Group
(Others)
N = 640
Mean Score of Each Group
Reliability 280 275 284
Assurance 345 347 348
Tangibles 334 331 336
Empathy 307 310 305
Responsiveness 269 264 277
Table 8 illustrates the connection between the participantsrsquo occupations and the
five dimensions of the SERVQUAL instrument The low group had higher mean scores
x
x
33
for almost all the dimensions of SERVQUALrsquos RATER than the high group except for
one dimension In other words the participants who worked as business employees were
less satisfied with TGrsquos service quality in terms of reliability assurance tangibles and
responsiveness than those whose occupations were not specified in the questionnaire
Empathy was the only dimension of service quality that the participants who were in the
high group were satisfied with
Table 9 Relationship between the Participantsrsquo Income and their Satisfaction with In-
flight Service
SERVQUALrsquoS
RATER
Average
Mean Score
of All Groups
The High Group
(20001-40000)
N = 72480
The Low Group
(60001 and above)
N = 960
Mean Score of Each Group
Reliability 280 273 285
Assurance 345 349 350
Tangibles 334 332 321
Empathy 307 301 325
Responsiveness 269 262 273
Table 9 indicates the connection between the participantsrsquo monthly income and
the five dimensions of the SERVQUAL instrument The low group had higher mean
scores for almost all the dimensions of RATER than the high group except for one
dimension In other words the participants who earned monthly income of 20001 ndash
40000 baht were less satisfied with TGrsquos service quality in terms of reliability assurance
empathy and responsiveness than those who earned monthly income of 60001 baht and
34
above The tangibles dimension was the only service quality issue that the participants
who were in the high group were satisfied with
Table 10 Relationship between the Participantsrsquo Purpose of Travel and their Satisfaction
with In-flight Service
SERVQUALrsquoS
RATER
Average
Mean Score
of All Groups
The High Group
(Holidays)
N = 79527
The Low Group
(Others)
N = 320
Mean Score of Each Group
Reliability 280 279 285
Assurance 345 353 349
Tangibles 334 335 338
Empathy 307 308 312
Responsiveness 269 270 275
Table 10 reflects the connection between the participantsrsquo purpose of travel and
the five dimensions of the SERVQUAL instrument The low group had higher mean
scores for almost all the dimensions than the high group except for one dimension In
other words the participants who traveled on holidays were less satisfied with TGrsquos
service quality in terms of reliability tangibles empathy and responsiveness than those
whose purpose of travel were not specified in the questionnaire Assurance was the only
dimension of service quality that the participants who were in the high group were
satisfied with
35
Interestingly it was found that both groups has a higher satisfaction level for the
assurance tangibles empathy and responsiveness dimensions than the average mean
scores of the whole sample group
Table 11 Relationship between the Participantsrsquo Frequency of Travel with THAI and their
Satisfaction with In-flight Service
SERVQUALrsquoS
RATER
Average Mean
Score of All
Groups
The High
Group
(2-3 timesyear)
N = 99660
The Low Group
(more than 10
timesyear)
N = 213
Mean Score of Each Group
Reliability 280 281 295
Assurance 345 346 360
Tangibles 334 335 343
Empathy 307 308 321
Responsiveness 269 270 292
Table 11 presents the connection between the participantsrsquo frequency of travel
with THAI and the five dimensions of the SERVQUAL instrument The low group had
higher mean scores for all the dimensions of RATER than the high group In other
words the participants who traveled 2-3 times in the last 12 months were less satisfied
with TGrsquos service quality in terms of reliability assurance tangibles empathy and
responsiveness than those whose frequency of travel were more than 10 times in the last
12 months
36
Interestingly it was found that both groups has a higher satisfaction level for all
the five RATER dimensions than the average mean scores of the whole sample group in
this study
44 Other Comments
The last part of the questionnaire was designed to ask whether the participants
would continue using TGrsquos service The findings disclosed that 142 participants or
946 indicated that they would while 8 of them or 54 declined
Also at the end of the questionnaire there was a blank space for the participants to
freely express their own ideas and suggestions on TGrsquos service However only 7
participants or 46 gave suggestions regarding the in-flight service Four of the
participants were dissatisfied with the flavor of the snacks provided on board One
complained that it was not cool enough in the cabin while one was upset for not being
granted for a request for a blanket The last one commented that the passengerrsquos seat was
not comfortable
In summary the passengersrsquo satisfaction level of the service quality in connection
with their demographic data was introduced Five out of the six demographic
characteristics the participantsrsquo age occupation monthly income purpose of travel and
frequency of travel were analyzed in connection with the five dimensions of SERVQUAL
instrument reliability assurance tangibles empathy and responsiveness It was observed
that there were some connection between these two matters in various ways as earlier
discussed Lastly it was found that one hundred and forty-two participants would
continue using TGrsquos service while the rest refused Only seven of all the participants or
46 gave some comments on the open-ended suggestion part
CHAPTER FIVE
CONCLUSION AND DISCUSSION
This chapter presents the conclusion discussion limitations of the study and
recommendations for further studies
51 Conclusion
This research aimed to examine the service quality provided by Thai Airways
International on its domestic flights One hundred and fifty passengers who traveled by
TG on the Bangkok - Chiang Mai route were the research participants The SERVQUAL
instrument was used as an instrument for data collection in the survey This instrument
was based on five determinants proposed by Panasuraman etal (1985) in terms of
reliability assurance tangibles empathy and responsiveness This research was also
conducted on the demographic characteristics comprising gender age occupation
monthly income purpose of travel and frequency in traveling and the relationship of these
characteristics except the gender with the passengersrsquo satisfaction with TGrsquos in-flight
service quality The questionnaires were distributed in early March 2010
The results showed that all the participantsrsquo satisfaction based on the five
dimensions was at the average level The highest level of passengersrsquo satisfaction was
placed on the assurance dimension followed by tangibles and empathy dimensions
accordingly The two lowest levels of the passengersrsquo satisfaction were placed on the
responsiveness and reliability dimensions
In addition a summary of the demographic characteristics showed that the high
group or the group with the highest number of participants was business employees The
highest number of the participants was between 21-40 years old The highest number of
38
the participantsrsquo income ranged from 20000 ndash 40000 baht monthly Also the high
grouprsquos purpose of travel was to go on holiday Lastly the highest number of the
participants traveled via TG only 2-3 times during the past 12 months
Meanwhile the low group or the group with the lowest number of participants
was passengers with other kinds of occupations which were not specified on the
questionnaire The low group of the participants was under 20 years old The low group
of the participantsrsquo income ranged from 60001 baht monthly or higher Also the low
group revealed that they traveled via TG for other purposes which were not indicated on
the questionnaire Lastly the passengers who traveled via TG more than 10 times during
the past 12 months belonged in the low group
It has also been discovered that as a whole both groups the high and low groups
were in the same direction in their satisfaction with the five dimensions of service quality
The two groups were satisfied with the service quality dimensions in terms of assurance
at the highest level followed by tangibles empathy reliability and responsiveness
respectively
However when analyzing each demographic characteristic the participants who
were under 20 years old rated the responsiveness dimension higher than the reliability
dimension Also for those participants whose income was around 60001 or higher the
empathy dimension was rated higher than the tangibles Regarding the occupation
business people were satisfied with the reliability and responsiveness dimensions at a
very low level Meanwhile the participants who traveled via TG on their holidays rated
the assurance dimension at a very high level Lastly frequent fliers who traveled by
THAI more than 10 times were most satisfied with TGrsquos service since they rated all
RATER aspects highly
39
52 Discussion
The findings have revealed the answers to the research questions First the
demographic data of the participants gender age occupation monthly income purpose
of travel and frequency of travel were shown Second the level of the passengersrsquo
satisfaction toward the service quality on Thai Airways Internationalrsquos domestic flights in
terms of the SERVQUAL instrument (Parasuraman et al 1985) reliability assurance
tangibles empathy and responsiveness was disclosed Also the results about the
relationship between the passengersrsquo satisfaction and their demographic data were pointed
out
The results of the survey indicated that out of the five dimensions assurance was
rated at the highest level ( 345) followed by tangibles ( 334) and empathy ( 307)
(See Figure 1) In addition passengers rated their highest satisfaction with the assurance
dimension which included cabin crewrsquos job knowledge their courtesy confidence in their
service ability and safety while traveling It may be because TG cabin crew are well-
trained prior to their actual service work on board This can also ensure passengersrsquo
safety Particularly the safety and security features have been the most concerns of
airline passengers since the 9-11 incidents in New York USA This is why most
customers rated their highest satisfaction with the assurance dimension (Carman 1990)
The findings of this study are also consistent with those of Fick and Ritchie (1991)
who studied the operation of the SERVQUAL instrument in three major tourism sectors
airlines restaurants and ski area services It was revealed that the most important
dimensions of the service were assurance and tangibles If companies were unable to
inspire trust and confidence in their customers and the tangibles are not impressive it
would be difficult for them to achieve a high level of customerrsquos satisfaction (Sachukorn
2000)
x x x
40
Responsiveness is often found as the lowest level of satisfaction among customers
in the service industry It is plausible that the staff were too busy to provide prompt and
good service (Kholthanasep 2001) In this study the results revealed that the
responsiveness dimension was rated at the lowest score ( 269) among the five
dimensions followed by the reliability ( 280) dimension It was highly possible that the
passengersrsquo dissatisfaction occurred when passengers did not receive prompt service from
TG when they needed help
Prompt service is an important factor of customersrsquo expectation Customers
generally rate the service as poor when the speed of service does not meet their
expectations (Kholthanasep 2001) Bojanic and Rosen (1994) examined the nature of the
association between service quality as perceived by consumers and its determinants by
applying SERVQUAL in a restaurant setting They found that customers rated
responsiveness as the lowest satisfaction in their studies Zeithaml et al (1990) explained
that the responsiveness dimension in the SERVQUAL was willingness to help customers
and provide prompt service As the responsiveness dimension in this research comprised
prompt service willingness on-time service and quick response therefore it will be
beneficial to TG if the company can ensure that the service provided by its cabin crew
especially the willingness to help passengers and to provide prompt service meet
passengersrsquo satisfaction
Regarding the relationship between the participantsrsquo demographic data and their
satisfaction with the service quality there are many points of interests to be discussed as
follows
Firstly regarding the relationship of the passengersrsquo satisfaction with the service
and their age those who were under 20 years old rated satisfaction with the
responsiveness dimension ( 290) higher than the reliability dimension ( 270) (See
x
x
x x
41
Table 7) It was possible that young passengers usually gave priority to the dimension of
care and service when compared with that of the service providersrsquo accurate and
dependable manner (Panittumrong 2003) In addition young customers had less
experience in a service and it was difficult to compare the current service with the past
experience consequently they were more satisfied with the service provided than senior
customers
Another point was raised about the participantsrsquo age The study revealed that the
number of the high group with the age range of 21- 40 was at 567 However that of
the second highest group of the participants with the age range of 41-60 was at 30
which was rather high This latter grouprsquos level of satisfaction on the service quality was
also close to the average mean score It was found that the average mean score of the
reliability dimension was 280 while that of the second highest group was 281 the
average mean score of the assurance dimension was 345 while that of the second highest
group was 347 the average mean score of the tangibles dimension was 334 while that of
the second highest group was 335 the average mean score of the empathy dimension and
that of the second highest group was rated at 307 equally and the average mean score of
the responsiveness was 269 while that of the second highest group was 271 In sum if
consider the two groups in terms of the participantsrsquo age one of the high group and the
other with the second high group the results confirmed that the satisfaction level of the
majority of passengers was at the above average level
Secondly regarding the relationship between the participantsrsquo satisfaction and
their occupation business employees who were found at the highest number (42) had
very low satisfaction with the service quality in terms of reliability ( 275) and
responsiveness ( 264) while the mean scores of the whole sample group for these two
dimensions were at 280 and 269 respectively (See Table 8) The findings strongly
x
x
42
correlated with that of Cheaosakul (2004) who studied the consumersrsquo perception of
airline service quality with a focus on occupations It was found that the group of
business employees had the highest score on expectations Cheaosakul (2004)rsquos study
also revealed that business employees did not frequently travel compared with people of
other occupations such as tourists It was found in this particular study that the number of
the participantsrsquo purpose of travel with TG for business trips was only at 273 (See
Table 5) while the highest number of the participants went on holiday was at 52
Cheaosakul (2004) indicated that business people therefore had high expectations than
the other group who traveled more frequently
Thirdly an even more interesting point was raised when comparing the level of
satisfaction of the passengers who were government officials or state enterprise
employees and business owners Although passengers who were government officials or
state enterprise employees came third in terms of participants they are considered
valuable customers of TG since according to the governmentrsquos policy they are required
to take only TG which is a national airline whenever they travel by air There are few
exceptions though However it is almost impossible for Thai government officials who
travel on business trip and are funded by the governmentrsquos budget to fly with other
airliners It was found from this study that government officials were less satisfied with
TG quality service in terms of reliability ( 277) and responsiveness ( 264) than the
average level of which the mean scores of the two dimensions were at 280 and 269
respectively
Another issue of discussion regarding the participantsrsquo occupation business
owners came second It was observed that business owners rated the reliability ( 282)
and responsiveness dimensions ( 270) higher than the average scores of all groups (See
Table 8) It is possible that business owners had more positive attitude with TGrsquos service
x x
x
x
43
than the other groups TG seemed popular among business owners and they were the
most important group of customers This was supported by Suriya (2005) who studied
airline market segments after the launch of the low cost airlines in Thailand Suriya
(2005) identified that merchants or business owners were the major group of customers in
the full-service airline market
Fourthly regarding the monthly income of the research participants of the low
group passengers who earned an income of around 60001 or higher rated the empathy
( 325) dimension higher than tangibles ( 321) dimension (See Table 9) This may
be because the high income passengers sensitively felt that the facilities and equipment
found on their domestic route looked quite old-fashioned due to TGrsquos cost reduction The
company saved costs after the Suvannabhumi airport was closed in the 2008 crisis The
result is similar to the findings of Wangpen and Inthornma (2007) in that high income
customers had higher expectations towards the service It was possible that they had
more tendencies to be dissatisfied with the service failures The two researchers
concluded that passengers with different incomes were satisfied with the services at
different levels because they had different attitudes expectations and abilities to pay for
the service
Fifthly as it was found from this study that the highest score for the purpose of
travel was going on holiday (527) and the participants who were tourists rated the
assurance dimension at the highest level or the mean score of 353 (See Table 10) much
higher than the mean score of the whole group which was at 345 It was rather surprising
that the highest score for the travel purpose was not for business trips It is possible to
explain that this group spent for the travel cost on their own and they might want to make
sure that they chose the best service for themselves The result is parallel with Gabbie
and OrsquoNeill (1997) who examined customer satisfaction in the hotel sector using the
x x
44
SERVQUAL tool This study showed that the holiday guests who paid for
accommodation on their own rated assurance much higher than other dimensions It is
plausible to explain that passengers traveling on their own budget must make sure that
they already chose the service that was worth the money spent
However when analyzing the satisfaction on service quality of the participants
whose purpose of travel via TG was for business it was also found that this business
participants rated the high score for the tangibles dimension at the mean score of 340
compared with the average mean score of all groups of 334 Passengers who traveled on
business included government officials and state enterprise employees were major
customers of TG It was therefore interesting to find out from this study that their
satisfaction score in terms of tangibles or the appearance of physical factors such as
equipment facilities and personnel was above the average score of all groups Although
the score was not much higher the gap was bigger than that of the other RATER
dimensions as seen from the following information the passengers who traveled on
business trip showed their satisfaction on the reliability dimension at the mean score of
281 the assurance dimension at 347 the empathy dimension at 309 and the
responsiveness dimension at 270 while the average of all groups was at 280 345 307
and 269 respectively
The last point that the researcher wanted to point out is that this study revealed
that the participants who traveled more than 10 times for the last 12 months were lowest
in number (13) However it was interesting that these frequent flyers showed the high
rate of satisfaction with TGrsquos in-flight service quality The mean scores in all dimensions
showed the high rate of satisfaction (See Table 11) It is possible that passengers who
traveled very often via TG had high loyalty The brand loyalty made passengers happy in
every feature of service This result however contrasts with Ostrowski et al (1993) who
45
investigated service quality and customer loyalty in the commercial airline industry The
study examined whether the high levels of service quality existed in the US commercial
airline industry and how service quality could potentially lead to customer loyalty The
main results indicated that the levels of perceived service quality were below potential
and that customer loyalty to airlines was low It is plausible to say that the data of the two
studies were different The data collected on two air carriers in USA might have
different characteristics from the demographic information of Thai people and the number
of the participants in the two studies might differ However TG still needs to listen to the
voice of all passengers especially the frequent flyers Even if the number of this sample
group was few every customer is valuable for any firm Also it would be valuable to
implement a relevant strategy to expand this group of passengers since they had a positive
attitude for TG
Interestingly the findings from the last part of the questionnaire also showed that
the majority of the participants (946) showed their willingness to use TGrsquos service in
the future It can plausibly be explained that the participants were satisfied with TGrsquo
service quality at the moderate level ( 307) Their satisfaction with the five dimensions
of SERVQUAL was also moderate They might think that TG is a reliable airline that
they can depend on Thai passengers have confidence and trust in the service of Thai
cabin crew in terms of courtesy Also it is possible that they might not trust the low cost
airlinesrsquo service of the crew
There were only seven remarks on the in-flight service when the participants were
asked to freely give suggestions The tangible dimension problematic Passengers
pointed out about the small size of passengersrsquo seats and the quality of the air-
conditioning system One problem was on the responsiveness dimension which happened
when a passenger asked for a blanket but she was not offered indicating that some of the
x
46
cabin crewrsquos promptness to provide service was still not up to a standard Another
comment was on the flavor of the snacks Although this issue is not directly relevant to
the service it is worthwhile for TG to consider this problem
In conclusion the researcher found both strengths and weaknesses in TGrsquos service
quality Assurance was found the highest satisfaction in the participantsrsquo opinion TG
should maintain the service quality with a focus on this dimension On the other hand
the responsiveness and reliability dimensions were at the lowest satisfaction level among
the five dimensions The company should improve its service quality on these two
dimensions especially with regards to TGrsquos lsquoprompt servicersquo and lsquoproblem solvingrsquo
service to retain its passengers
53 Limitations of the study
This study has some limitations as follows
1 This study was limited to only one domestic route (Bangkok ndash Chiangmai)
Therefore the participants in this study were passengers who traveled only between these
two provinces The results of the study might differ if the study covered another route or
many more routes at the same time Consequently further studies can be conducted for
other domestic destinations such as Phuket and other big cities
2 The research participants were all Thai passengers It would be interesting to
study foreign passengersrsquo satisfaction on TGrsquos in-flight service quality
3 This study focused only on Parasuraman et al (1985)rsquos SERVQUAL
Instrument used to assess the service quality The results might differ if other instruments
were used
47
54 Recommendations for further studies
Further research should be undertaken to validate the results of this study The
researcher has found several opportunities to extend this study as follows
Survey on the lsquoresponsivenessrsquo dimensions
Responsiveness concerns the willingness or readiness of employees to provide
service such as timelines of service and prompt service This dimension was what the
passengers in this study were most concerned about because it was rated as the lowest
level of satisfaction Thus TG should find the countermeasure of how to increase the
level of passengersrsquo satisfaction in the responsiveness dimension
Assessment of the ground service quality
Since this research was conducted on on-board service quality further studies on
ground services such as a reservation or check-in service should be investigated in order
to integrate the results covering every sector of the airline service
Study on passengersrsquo attitude towards the service quality in other airlines
A study on the service quality of other airlines should be conducted in order to
obtain comparative data and find out reasons for their passengersrsquo behavior and attitude
consequently allowing TG to remedy any weak points and increase the number of new
passengers
REFERENCES
REFERENCES
Alegre J amp Pou L (2006) An analysis of the microeconomic determinants of travel
frequency Department of Applied Economics Universitat de les Illes Balears
Bojanic DC (1991) Quality measurement in professional service firms Journal of
Professional Service Marketing 7(2) 27-37
Bojanic D C amp Rosen L D (1994) Measuring service quality in restaurants An
application of the SERVQUAL model Journal of Hospitality Research 18(1)
3-14
Boontaganon W (2002) The study of service quality of fast-food restaurants in Bangkok
using SERVQUAL measurement Thesis MBA (Business Administration)
Bangkok Assumption University Photocopied
Buttle F (1996) SERVQUAL review critique research agenda European Journal of
Marketing 30(1) 8-31
CarmanJ M (1990) Consumer perceptions of service quality An assessment of the
SERVQUAL dimensions Journal of Retailing 69 33-35
Cheaosakul W (2004) Consumers perception of service quality a case study of Thai
Airways International Plc Thesis MBA Bangkok Assumption University
Photocopied
Fick RG amp Ritchie JRB (1991) Measuring service quality in the travel and tourism
industry Journal of Travel Research 30(2) 2-9
Fornell C (1992) A national customer satisfaction barometer the Swedish experience
Journal of Marketing 56 6-21
Gabbie O amp OrsquoNeill M (1997) SERVQUAL and the Northern Ireland hotel sector a
comparative analysis part 2 Managing Service Quality 17(1) 43-49
50
Gilbert DH (1999) Marketing connecting with customers (2nd
ed) Upper Saddle
River NJ Prentice Hall
Gilbert D amp Wong KCR (2002) Passenger expectations and airline services a
Hong Kong based study Surrey Management School Surrey University of
Surrey
Gitman LJ amp Carl DM (2005) The future of business the essentials Mason Ohio
South-Western College Pub
Grifin J (1995) Customer loyalty NY Lexington Book
Gronroos C (1978) A service-oriented approach to marketing of services European
Journal of Marketing 12(8) 588-601
Hennig-Thurau T amp Klee A (1997) The impact of customer satisfaction and
relationship quality on customer retention a critical reassessment and model
development Masterrsquos Project MA (Psychology amp Marketing) Hanover
University of Hanover
Heesawat C (2005) The opportunities and problems in making services more tangible
PhD Dissertation Bangkok Assumption University Photocopied
Juran JM amp Gryna FM (1974) Quality control handbook NY McGraw-Hill
Kholthanasep G (2001) A study of customerrsquos expectations and perceptions of service
quality delivery by first class hotels in Bangkok metropolitan area Thesis
MBA Bangkok Assumption University Photocopied
Kotler P amp Scheff J (1997) Standing room only strategies for marketing the
performing arts Boston Mass Harvard Business School Press
Kotler P (1997) Marketing management analysis planning and control (9th
ed) Upper
Saddle River NJ Prentice Hall
51
Kotler P Bowen J amp Makens J (1999) Marketing for hospitality and tourism (2nd
ed) NJ Prentice Hall
Kotler P (2000) Marketing management the millennium edition (10th
ed) NJ Prentice
Hall
Lages FL amp Fernandes CJ (2005) The SERVQUAL scale a multi-item instrument
for measuring service personal values Journal of Business Research 58(11)
1562-1572
Oberoi U amp Hales C (1990) Assessing the quality of the conference hotel product
London The Service Industries Journal 10(4) 700-722
Ostrowski PL Orsquobrien TV amp Gordon GL (1993) Service quality and customer
loyalty in the commercial airline industry Journal of Travel Research 32(2)
16-24
Palin M (1996) Flight catering transportation and loading (2nd
ed) London Longman
Group Limited
Panittumrong P (2004) The consumerrsquos opinion towards Clark Hatch Fitness Center
Master Project MBA (Management) Bangkok Graduate School
Srinakharinwirot University Photocopied
Parasuraman A Zeitmal VA amp Berry LL (1985) A concept model of service
quality and its implications for future research Journal of Marketing 49 41-50
Parasuraman A Zeitmal VA amp Berry LL (1988) SERVQUAL a multiple item
scale for measuring customer perceptions of service quality Journal of
Retailing 64(1) 64
Parasuraman A amp Berry LL (1991) Marketing services competing through quality
NY The Free Press
52
Pirsig RM (1987) Zen and the art of motorcycle maintenance an inquiry into values
(Mass Market Paperback) NY Bantam Books
Poonlarbtawee K (1987) Statistics for research Bangkok Physic Center Printing
Reid RD amp Bojanic DC (2001) Hospitality marketing management NJ John Wiley
amp Son Inc
Rueangthanakiet P (2008) Memberrsquos satisfaction of fitness service quality a case study
of California Wow Xperience Plc Masterrsquos Project MA (Business English for
International Communication) Bangkok Graduate School Srinakharinwirot
University Photocopied
Sachukorn S (2006) Reception and service excellence Bangkok Saitharn
Schiffman LG amp Kanuk LL (1994) Consumer behavior (5th
ed) London Prentice-
Hall International
Somwang C (2008) An assessment of passengersrsquo views of service quality in Thai low
cost carriers Inter Program MA (Communicative English) Bangkok
Ramkhamhaeng University Photocopied
Suriya K (2005) Airline market segments after low cost airlines in Thailand passenger
classification using neural networks and logit model with selective learning
Faculty of Economics Chiangmai Chiangmai University
Suthirungkul N (2003) The study of customer expectations and perceptions of service
quality of the Clark Hatch fitness center of Silom road branch Bangkok Thesis
MBA (Business Administration) Bangkok Assumption University
Photocopied
Thai Airways International (2008) Traffic program information (Introduction of summer
200809) Bangkok THAI Printing Office
53
Thai Airways International (2009) Traffic program information (Introduction of winter
200910) Bangkok THAI Printing Office
THAI AIRWAYS INTL Official 4-Star Ranking of Product and Service Quality (2009
October) Retrieved February 14 2010 from
httpwwwairlinequalitycomAirlinesTGhtml
Travel Planning (2010 February 12) Retrieved February 12 2010 from
httpwwwsuite101comlessoncfm1848818243
Wangpen N amp Inthornma S (2007) Membersrsquo satisfaction in fitness centers in
Bangkok Thesis MA (Hotel and Tourism Management) Bangkok Graduate
School Naresuan University Photocopied
Zeithaml VA amp Bitner MJ (2000) Services marketing (2nd
ed) NY McGraw Hill
Zeithaml VA Parasuraman A amp Berry LL (1990) Delivering quality service
balancing customer perceptions and expectations NY Free Press
APPENDICES
55
APPENDIX A
แบบทดสอบความพงพอใจของผโดยสารการบนไทย
เรยนทานผโดยสารทเคารพ กระผมนาย วลาศ มนคงวณชกล พนกงานตอนรบสายการบนไทย และนกศกษาปรญญาโท หลกสตรภาษาองกฤษธรกจเพอการสอสารนานาชาต มหาวทยาลยศรนครนทรวโรฒ ไดจดท าแบบสอบถามนเพอเปนสวนหนงของการส ารวจความพงพอใจของผโดยสารทมตอคณภาพงานบรการ เทยวบนภายในประเทศของการบนไทย โดยมงหวงทจะน าขอมลทไดรบจากการส ารวจมาเปนประโยชนตอการสงเสรมสนบสนนการปฏบตงานใหเกดประสทธผล จงขอความกรณาจากทานในการตอบแบบสอบถามทกขอตามขอเทจจรงและความเหนของทาน ขอมลทงหมดเปนความลบ จะใชเพอการวจยเทานน และขอขอบคณในความรวมมอของทาน
helliphelliphelliphelliphelliphelliphelliphelliphelliphelliphelliphelliphelliphelliphelliphelliphelliphelliphelliphelliphelliphelliphelliphelliphelliphelliphelliphelliphelliphelliphellip
ค าชแจง โปรดท าเครองหมาย (x) ลงในชองวาง ทตรงกบค าตอบของทาน
ตอนท 1 ขอมลทวไป
1 เพศ ( ) ชาย ( ) หญง 2 อาย ( ) ตากวา 20 ป ( ) 21-40 ป ( ) 41-60 ป ( ) 60 ปขนไป 3 อาชพ ( ) ขาราชการ รฐวสาหกจ ( ) พนกงานบรษท ( ) ธรกจสวนตว ( ) นกเรยน นกศกษา ( ) เกษยณ ( ) อนๆ 4 รายได เดอน ( ) ตากวา 20000 ( ) 20001- 40000 บาท ( ) 40001- 60000 บาท ( ) 60001 บาท ขนไป 5 จดประสงคการเดนทาง ( ) ธรกจ ( ) พกผอน ( ) เยยมเยยนญาตมตร เพอนฝง ( ) อนๆ 6 ความถในการเดนทางกบการบนไทย (ในรอบ 12 เดอน) ( ) ครงแรก ( ) 2-3 ครง ( ) 4-10 ครง ( ) 10 ครงขนไป
56
ตอนท 2 ความพงพอใจของทานตอการบรการ (5 = เหนดวยอยางยง 4= เหนดวย 3= ปานกลาง 2=ไมเหนดวย 1=ไมเหนดวยอยางยง)
ระดบความพงพอใจ
การบรการของการบนไทย 5 4 3 2 1 1 เมอเจาหนาทสญญาทจะใหบรการทานในเรองใด จะทาตามนนเสมอ
2 การใหบรการของเจาหนาท สรางความเชอมนใหกบทาน
3 อปกรณบนเครองบนมรปแบบททนสมย (เชน จอทว ทนง)
4 บรษทฯกาหนดเวลาการใหบรการบนเครองเหมาะสม
5 เจาหนาทใหบรการทดนบตงแตกาวแรกบนเครอง
6 เจาหนาทมความตงใจดทจะชวยเหลอทาน เมอทานมปญหา
7 ทานรสกปลอดภยเมออยบนเครองบน
8 สงอานวยความสะดวกตางๆบนเครอง มรปลกษณทดงดดใจ (เชน กลองอาหาร) 9 เจาหนาทไมเขาใจความตองการของทาน ในบางกรณ
10 เจาหนาทไมไดระบเวลาในการใหบรการผโดยสารบนเครองทแนนอน 11 เจาหนาทพยายามทางานโดยไมใหเกดขอผดพลาด
12 เจาหนาทปฎบตงานดวยความสภาพเสมอ
13 เจาหนาทแตงกายเรยบรอยและดด
14 บรษทฯใหความเอาใจใสกบผโดยสารเปนรายบคคล
15 บางครงเจาหนาทไมเตมใจทจะใหบรการผโดยสาร
16 บรษทใหบรการทานตรงเวลาทกาหนด
17 เจาหนาทสามารถใหขอมลเกยวกบการเดนทางไดอยางถกตอง
18 เอกสารของบรษทฯทเกยวของกบการบรการ (เชน แผนพบ นตยสาร) มขอมลครบถวน และรปแบบสวยงาม 19 เจาหนาทใหบรการทานดวยสมผสความเปนไทย
20 เจาหนาทใหบรการผโดยสารอยางรวดเรว
ทานจะกลบมาใชบรการของการบนไทยตอไป จะใชบรการตอไป ไมใชบรการ
ขอเสนอแนะ_______________________________________________________
_____________________________________________________________ ขอบพระคณอยางสงในความรวมมอของทาน
57
APPENDIX B
Questionnaire
Dear Honorable Passengers
My name is Wilas Mankongvanichkul -- a THAI cabin crew and masterrsquos student of business English
for international communication program Srinakharinwirot University This questionnaire is about
an exploration of passengersrsquo satisfaction with service quality of Thai Airways International (TG)rsquos
domestic flights Data gained will be utilized for THAI service operation Please kindly complete the
questionnaire The data gained will be kept confidential and used for the research study only Your
kind cooperation is greatly appreciated
helliphelliphelliphelliphelliphelliphelliphelliphelliphelliphelliphelliphelliphelliphelliphelliphelliphelliphelliphelliphelliphelliphelliphelliphelliphellip
Direction Please mark (x) your answer in the space provided
Part 1 Personal Information
1 Gender
( ) Male ( ) Female
2 Age
( ) Under 20 years ( ) 21-40 years
( ) 41-60 years ( ) Above 60 years
3 Occupation
( ) Government official State enterprise employee
( ) Business employee
( ) Business owner ( ) Student
( ) Retiree ( ) Others
4 Monthly income
( ) Up to 20000 baht ( ) 20001- 40000 baht
( ) 40001 ndash 60000 baht ( ) 60001 baht and above
5 Purpose of travel
( ) Business trips ( ) Holidays
( ) Visits ( ) Others
6 Frequency in traveling with THAI (during the last 12 months)
( ) First time ( ) 2-3 times
( ) 4-10 times ( ) More than 10 times
58 Part 2 Your satisfaction with the service
(5=Strongly Agree 4= Agree 3=Uncertain 2=Disagree 1= Strongly Disagree)
Level of Satisfaction
The Service of THAI 5 4 3 2 1
1 When cabin crew promise to do something by a
certain time they do so
2 You can trust THAI cabin crew
3 TG has modern on board equipment
(such as TV screen passengersrsquo seats)
4 TG has operating hours on board convenient to all
passengers
5 Cabin crew offer good services upon boarding
6 When passengers have a problem cabin crew show a
sincere interest in solving it
7 Passengers feel safe on-board
8 The physical facilities of TG are visually appealing
(such as meal boxes)
9 Cabin crew do not understand your special needs in
some cases
10 Cabin crew do not tell passengers exactly when
services will be offered
11 Cabin crew insist on error-free records
12 Cabin crew are consistently courteous to passengers
13 Cabin crew are well-dressed and neat in appearance
14 TG gives passengers individual attention
15 Cabin crew are not always willing to help passengers
16 TG provides its services at the time it promises to
do so
17 Cabin crew are knowledgeable to answer passengers
travel-related questions
18 Documents about service are informative and appealing
(such as pamphlets and magazines)
19 Services provided have a ldquoThai Touchrdquo
20 Cabin crew are quick to respond to passengersrsquo requests
Will you come back for TGrsquos service Yes No
Suggestions________________________________________________________________
________________________________________________________________________ Thank you very much for your kind cooperation
59
APPENDIX C
Questionnaire Specification Based on SERVQUAL measurement (Parasuraman et al 1985)
Passengers satisfaction level toward service quality factors
No Service Quality Features (RATER)
Str
on
gly
ag
ree
Ag
ree
Un
certa
in
Dis
ag
ree
Str
on
gly
Dis
ag
ree
(5) (4) (3) (2) (1)
1 When cabin crew promise to do something by a certain time they do so Reliability
2 You can trust THAI cabin crew Assurance
3 TG has modern on board equipment (such as TV screen passengersrsquo seats) Tangibles
4 TG has operating hours on board convenient to all passengers Empathy
5 Cabin crew offer good services upon boarding Responsiveness
6 When passengers have a problem cabin crew show a sincere interest in solving it
Reliability
7 Passengers feel safe on-board Assurance
8 The physical facilities of TG are visually appealing (such as meal boxes) Tangibles
9 Cabin crew do not always understand your special needs in some cases Empathy
10 Cabin crew do not tell passengers exactly when services will be offered Responsiveness
11 Cabin crew insist on error-free records Reliability
12 Cabin crew are consistently courteous to passengers Assurance
13 Cabin crew are well-dressed and neat in appearance Tangibles
14 TG gives passengers individual attention Empathy
15 Cabin crew are not always willing to help passengers Responsiveness
16 TG provides its services at the time it promises to do so Reliability
17 Cabin crew are knowledgeable to answer passengers travel-related questions Assurance
18 TGs documents associated with services are informative and appealing (such as pamphlets and magazines)
Tangibles
19 Services provided have a ldquoThai Touchrdquo Empathy
20 Cabin crew are quick to respond to passengersrsquo requests Responsiveness
VITAE
61
VITAE
Name Wilas Mankongvanichkul
Date of Birth February 14 1980
Place of Birth Bangkok
Address 688 Soi Phaholyothin 32 Chankasem Jatuchak
Bangkok 10900
Present Occupation Cabin Crew
Thai Airways International Public Company Limited
89 Vibhavadi Rangsit Road Bangkok 10110
Education Background
2010 Master of Art (Business English for International
Communication)
Srinakharinwirot University
2001 Bachelor of Business Administration Bangkok University
1997 High School Saint Dominic School
- Cover
- Abstract
- Chapter 1
- Chapter 2
- Chapter 3
- Chapter 4
- Chapter 5
- Bibliography
- Appendix
- Vitae
-
13
Retention of Good Employees Employees appreciate working in operations
that are well run and produce quality products They do not enjoy receiving customer
complaints Also turnover and loss of employee morale are listed as costs of poor quality
manpower When an operation has good quality it can retain good employees And at
the time business expansion is needed recruiting is easier and training cost is reduced
Reduction of Costs The quality cost includes internal costs external costs and
quality system costs Internal costs are those associated with correcting problems
discovered by the firm before products reached customers External costs are related to
errors that the customers experience They can be very expensive when the customers
decide not to return because of a service problem Then the promotional and advertising
costs or external costs are necessary to be spent to create the company image in order to
make customers come back and win brand loyalty for the company in the end However
the company needs to check the service quality through customersrsquo feedback periodically
to avoid problems
Although the quality service system does not come without costs it is usually less
than those internal and external costs resulting from poor quality service Some examples
of the costs of a quality system include customer service audits trainings management
meetings with employees and customers and introduction of a new technology (Kotler
Bowen amp Makens 1999)
To sum up it is necessary for a service company to know the service quality level
The quality needs to be evaluated by comparing customer experience with service
performance Once a service company reaches a good quality level a company will
retain its customers easily be away from price wars keep and get good employees and
reduce some operation costs
14
Thai Airways In-flight Service Quality
The latest airline evaluation in 2009 by Skytrax from United Kingdom which is a
research organization focused on in-flight services revealed that TG got the official 4-star
ranking for its product and service quality This honor is awarded to airlines which
deliver a good quality performance
Skytrax also disclosed that for short travels or domestic routes two traveling
classes are business class and economy class The overall evaluation of the domestic
route showed that TGrsquos business class was rated excellent (5-star) in two articles which
are ldquowashroom cleanlinessrdquo and ldquonewspaper amp magazinerdquo in terms of ldquoonboard productrdquo
category Meanwhile TG also got the highest rank in terms of ldquoservice efficiencyrdquo and
ldquoresponding to requestsrdquo in ldquocabin staff servicerdquo categories In addition in the economy
class TG could do superbly in three articles of cabin staff service which were ldquoservice
efficiencyrdquo ldquoenthusiasm and attituderdquo and ldquofriendliness and hospitalityrdquo (ldquoTHAI
AIRWAYS INTL Official 4-Star Ranking of Product and Service Qualityrdquo 2009)
In conclusion TG has been recognized internationally however it still needs to
move ahead The quality ranking is useful for TG to realize that the company needs to
develop its products and services in all categories in order to step up and well-prepared
for competitions in the future
24 SERVQUAL Model
SERVQUAL is an instrument used for measuring how customers perceive the
quality of the service This instrument is based on five dimensions and on a comparison
between customersrsquo expectations of how the service should be performed and their
experiences of how the service is actually performed Usually 20 attributes are used to
describe the five dimensions and participants are asked to state what they expect from the
15
service and how they perceive the service on a five-point scale from ldquoexcellentrdquo to
ldquopoorrdquo Based on the difference between expectations and experiences over the 20
attributes an overall quality score can be calculated The higher the score shows that
experiences are below expectation the lower the perceived quality (Parasuraman amp
Berry 1991)
SERVQUAL consists of five dimensions (RATER) as follows (Parasuraman et
al 1985)
Reliability This means that a service firm provides its customers with accurate
service the first time without making any mistakes and delivers what it has promised to
do by the time that has been committed
Assurance This means that employeesrsquo behaviors give customers confidence in
the firm and that the firm makes customers feel safe It also means that the employees are
always courteous and have the necessary knowledge to respond to customers questions
Tangibles This dimension relates to the appeal of facilities equipment and
materials used by a service firm as well as to the appearance of service employees
Empathy This means that the firm understands the customersrsquo problems and
performs in their best interests as well as giving customers individual personal attention
and having convenient operating hours
Responsiveness This means that employees of a service firm are willing to help
customers and respond to their requests as well as to inform customers when service will
be provided and give prompt service
16
Application of SERVQUAL Model in Hospitality Business
The SERVQUAL instrument has been used to assess the quality of a wide range
of services in the United States such as financial service operations telephone services
repair and maintenance services (Parasuraman et al 1988) and other professional
services (Bojanic 1991) Fick and Ritchie (1991) have employed the SERVQUAL
instrument to compare services provided by various types of organizations within the
travel and tourism industry Oberoi and Hales (1990) have examined the SERVQUAL
approach as a basis for measuring the quality of the conference hotel products Many
researchers of other service businesses believed that ldquoSERVQUALrdquo is a concise multiple-
item scale with good reliability and validity (Buttle 1996 Lages amp Fernandes 2005)
In Thailand Boontaganon (2002) studied the service quality of fast food
restaurants in Bangkok by using SERVQUAL The study examined the differences in
service quality expectations and perceptions based on demographic characteristics
including gender age occupation education and income level 360 questionnaires were
distributed to people who had just exited from fast food outlets in Bangkok The results
showed significant differences in service quality of customer expectations and
perceptions which indicated the unacceptable service quality delivered by fast food
restaurants in Bangkok
Suthirungkul (2003) studied the customer expectations and perceptions of service
quality of the Clark Hatch Fitness Center at Silom Road Branch Bangkok The objectives
of the study were to identify the SERVQUAL dimensions that customers both local and
foreign used to evaluate The Clark Hatch Fitness Center to study the customer
expectations towards the services quality that should be provided and to evaluate the
perceptions of service quality that customers obtained after using service The
questionnaire was used as a tool for collecting the data 277 Thai and foreign members of
17
the Clark Hatch Fitness Center at Silom Road Branch were the research participants The
results of the study were that there existed gaps between expectations and perceptions in
terms of the five SERVQUAL dimensions and the demographic characteristics had
influenced the gap scores
In short SERVQUAL is an effective measuring tool This tool has widely been
used in many previous studies in hospitality business both domestically and
internationally
25 Demographic Variables
In general business sector market segmentation is often based on demographic
profiles (Reid amp Bojanic 2001) in order that marketers can choose the proper service
segmentation strategies to satisfy different target market segments Demographics are the
variables about consumersrsquo wants preferences and usage rates are often associated with
demographic variables Moreover the demographic variables are easier to measure
(Kotler 2000) Important demographics are as follows
1 Gender There is no logical reason to expect biology to account for this
difference between the sexes The explanation may be in socialization differences and
personality disposition Feminine gender identity is characterized by traits such as
expensiveness and emotionalism and other orientation while masculine gender identity is
characterized by independence activity and self orientation (Kotler amp Scheff 1997)
2 Age Consumersrsquo wants and abilities change with age People buy different
goods and services over their lifetime Peoplersquos tastes in different products and services
are also related to age (Kotler 2000)
18
3 Occupation This variable reflects values attitudes taste and lifestyle
Occupation and income tended to be closely correlation on almost cause-and-effect
relationship (Schiffman amp Kanuk 1994)
4 Income Consumers form a purchase intention based on such factors and
expected family income price and expected benefits from the product and services
(Kotler 1997)
5 Purpose of Travel The purpose of travel measure the frequent distribution
The purposes of travel are for such as business holiday visiting friends and relative and
others (ldquoTravel Planningrdquo 2010)
6 Frequency of Travel A critical factor in predicting the demand for tourism
within a certain period of time is the number of trips individuals take New touristsrsquo
behavior shows a tendency toward more frequent travel (Alegre amp Pou 2006)
To recap the demographic profiles play a significant role in planning service to
meet passengersrsquo satisfaction In airline business six features of the demographics were
included in this study
26 Previous Studies on Airline Passengersrsquo Satisfaction
In an airline business the major revenue of a company comes from the number of
passengers rather than a total sum of cargo service aircraft maintenance or catering
supply all together Studies on airline passengersrsquo satisfaction are numerous as the
following examples
Gilbert and Wong (2003) identified the service dimensions that matter most to
current airline passengers The study measured and compared differences in passengersrsquo
expectations of the desired airline service quality in terms of reliability assurance
19
facilities employees flight patterns customization and responsiveness The primary data
were collected from passengers departing from Hong Kong airport Regarding the
service dimension expectations it was found that there were no statistically significant
differences between passengers who made their own airline choice (decision makers) and
those who did not (non-decision makers) However there were significant differences
among passengers of different ethnic groups nationalities as well as among passengers
who traveled for different purposes such as business holiday and visiting friends or
relatives
The findings also indicated that passengers consistently ranked lsquoassurancersquo as the
most important service dimension It showed that the passengers were concerned about
the safety and security aspects and this also indicated why there had been such a
downturn in demand as this study was conducted just prior to the World Trade Center
incident on September11 2001
In Thailand Somwang (2008) assessed the passengersrsquo views of service quality in
Thai low cost airlines The research was based on the principle that passengers evaluated
airline service quality through a comparison between their experiences and expectations
over a number of quality attributes The study evaluated passengersrsquo perceived service
quality of Thai low cost carriers based on the SERVQUAL instrument The findings
indicated that the passengersrsquo expectations on service quality were higher than what they
had actually experienced Further analysis showed that female passengers had lower
perceived service quality than male passengers The findings also revealed that higher
monthly income had greater differences with respect to expectations and perceptions than
lower income respondents Furthermore passengers usually traveled with low cost
carriers for three main purposes which were for leisure visiting friends or relatives and
business
20
In brief the previous studies explored the satisfaction of airline passengers by
using SERVQUAL instrument to measure the service quality The results above found
out the differences between customersrsquo expectations and perceptions The findings of a
study in Hong Kong revealed the passengersrsquo satisfaction on the dimensions of the
service quality Meanwhile a study in Thailand implied some findings about the
demographic profiles resulting in service quality Studies on service quality help improve
business organizations retain customers and attract new customers
CHAPTER THREE
METHODOLOGY
This chapter consists of four sections participants of the study research
instrument procedures of the study and data analysis
31 Participants of the Study
One hundred and fifty Thai passengers 75 males and 75 females who took the
TG Bangkok - Chiangmai route were randomly chosen as participants for the study
Since there are about 150 passenger seats in each flight the researcher randomly acquired
a sample size of 10 percent of the overall passengers from the ten flights totaling 150
Thai people are the main group of passengers who travel domestically over the year The
researcher therefore decided to select only the Thai passengers as the participants for the
study Also so as to cover various types of passengers the researcher included flights of
different time within a day (as shown in a following part of this chapter) for a reason that
passengers with some specific purposes chose to travel at some specific time For
example business people might prefer an early morning flight rather than a later-in-the-
day one
TGrsquos Bangkok ndash Chiangmai route has been considered one of the most frequent
domestic routes (THAI 2009) TG operates ten flights daily from Bangkok to
Chiangmai The researcher consequently chose this route for this research work to
assess the passengersrsquo satisfaction with TGrsquos service quality
The study was conducted in early March when it was still in the high season for
travels to the northern province of Thailand Fifteen passengers from each of the ten
flights of the Bangkok - Chiangmai route were asked to fill out the questionnaire at the
22
end of the on-board service while the plane was approaching Chiangmai its destination
All the 150 completed questionnaires were obtained as planned
32 Research Instrument
A questionnaire in Thai was used for data collection The questionnaire was
divided into three parts The first part was about the respondentsrsquo demographic profile
since consumersrsquo needs preferences and personalization are often associated with
demographic factors (Kotler 2000) Six demographic characteristics related to in-flight
service (Cheosakul 2004) consisting of gender age occupation monthly income
purpose of travel and travel frequency with THAI were demographic issues of the survey
The second part comprised questions about passengersrsquo satisfaction with the service
during the flight This part of the questionnaire was based on the SERVQUAL
instrument for measuring customersrsquo satisfaction in five dimensions of service reliability
assurance tangibles empathy and responsiveness (Parasuraman et al 1985) The last
part comprised a question and a blank space provided for suggestions on TGrsquos service
quality
33 Procedures of the Study
The questionnaire was initially approved by the researcherrsquos masterrsquos project
advisor and two specialists a TG in-flight service manager and a SWU lecturer Then a
pilot study was conducted to ten passengers to check for content reliability the
appropriateness of the number of questions and language used in the questionnaire As
the researcher included all the ten flights of TGrsquos Bangkok - Chiangmai route in the
study the tried-out questionnaire was randomly distributed to ten TG passengers (5 males
and 5 females) on each flight of the aforementioned route on the same day in February
23
2010 Also since this study was about onboard service the questionnaire was distributed
to the participants after the in-flight service was completed and before the plane landed
After that the questionnaire was adjusted and prepared for the actual survey
The revised questionnaire was eventually distributed to 150 participants in ten
consecutive days in early March 2010 Fifteen passengers in each Bangkok -
Chiangmai flight per day were randomly asked to fill out the questionnaire after the
completion of in-flight service
The plan below showed the ten flights of for the survey each flight for a day to
make sure that the data gained were reliable
BKK-CNX Flight (TG) Flight Schedule (Departure-Arrival)
TG100 0615-0725
TG102 0750-0910
TG104 0910-1030
TG106 1020-1140
TG110 1250-1400
TG112 1400-1510
TG114 1540-1650
TG116 1715-1825
TG120 1900-2010
TG122 2130-2240
34 Data Analysis
The data acquired from the questionnaires were analyzed in three sections
demographic profile of passengers level of passengersrsquo satisfaction with TGrsquos service
and the relationship between demographic profile and passengersrsquo satisfaction based on
24
Likert scale The 5-point Likert scales were used to rate the level of satisfaction as shown
in Table 1 below
Table 1 Intervals of Satisfaction Level (Poonlarbtawee 1987)
The interpretation of the scales in this study is as follows
Rating
Scale
Level of
Agreement Disagreement
Satisfaction
Level
Mean Score
5 Strongly agree Excellent 451-500
4 Agree Good 351-450
3 Uncertain Average 251-350
2 Disagree Fair 151-250
1 Strongly disagree Poor 100-150
The researcher picked up lsquothe high grouprsquo and lsquothe low grouprsquo of each
SERVQUAL dimension to present the relationship between the participantsrsquo
demographic profile and their satisfaction As the data gained from the highest number of
the participants or the high group was the major point that the researcher relied on focus
was on the majority opinion At the same time the data gathered from the lowest number
of the participants or the low group should not be overlooked because each and all
passengers are important for TG and in the high competitive airline market it is necessary
to retain each and every passenger so as to grow far in the aviation business
The results were presented in terms of percentages and mean scores in the form of
tables and a bar chart These fundamental statistic methods were proper in this study
25
because percentages and mean scores are considered the basic statistics used for data
analysis and presentation Also the general public can easily understand the
interpretation of the data Another reason was that the sample group of this study
comprised only 150 TG passengers The researcher therefore decided to apply the
aforementioned statistics in this research Discussion of the results was also offered
CHAPTER FOUR
FINDINGS
This chapter describes the findings of the study consisting of the demographic
data of the participants level of their satisfaction with TGrsquos service quality relationship
between the demographic data and five dimensions of SERVQUAL instrument and the
uncovers to the last question on the questionnaire including suggestion
41 Demographic Data
The demographic data of TGrsquos research participants in terms of age occupation
monthly income purpose of travel and frequency of travel are presented in Tables 2- 6
below
Table 2 Participantsrsquo Age
Age No of Participants Percentage ()
Under 20 years
21-40 years
41-60 years
Above 60 years
8
85
45
12
53
567
300
80
Total 150 100
Regarding the age group the highest number of the passengers was 20-40 years
old or 567 30 of them were 46-60 years old and 8 were above 60 years old Only
53 were under 20 years old
27
Table 3 Participantsrsquo Occupation
Occupation No of Participants Percentage ()
Government official State enterprise employee
Business employee
Business owner
Student
Retiree
Others
22
63
37
13
9
6
147
420
247
86
60
40
Total 150 100
In terms of occupation the highest number of the participants was business
employees (42) followed by business owners (247) government officials or state
enterprise employees (147) students (86) retirees (6) and other occupations (4)
respectively
Table 4 Monthly Income
Monthly income (baht) No of Participants Percentage ()
Up to 20000
20001- 40000
40001 - 60000
60001 and above
58
72
11
9
386
480
74
60
Total 150 100
For the income the highest number of the participants earned 20001-40000 baht
monthly (48) followed by those with a monthly income of up to 20000 baht (386)
28
of 40001-60000 baht monthly (64) and of 60001 baht and above monthly was the
lowest (6)
Table 5 Purpose of Travel
Purpose of travel No of Participants Percentage ()
Business trips
Holidays
Visits
Others
41
79
27
3
273
527
180
20
Total 150 100
Regarding the purpose of travel the highest number of the passengers traveled via
TG on holidays (527) followed by those who traveled on business trips (273)
Meanwhile those who made a visit were at 180 and who traveled with other purposes
were at 2
Table 6 Frequency of Travel
Frequency in traveling with THAI
(during the last 12 months)
No of Participants Percentage ()
First time
2-3 times
4-10 times
More than 10 times
39
99
10
2
260
660
67
13
Total 150 100
29
The last demographic data derive from the frequency in traveling with THAI
66 of the participants indicated that they traveled 2-3 times during the last 12 months
26 traveled for the first time while 67 for 4-10 times and 13 for more than 10
times during the last 12 months
In conclusion the demographic data shown in the tables above indicated that lsquothe
high grouprsquo comprised the following characteristics The age group of the majority
number of the participants ranged from 21-40 years (567) Most of them were business
employees (42) The highest number of the passengersrsquo monthly income was around
20000 ndash 40000 baht per month (48) The majority of the passengers traveled on
holidays (527) by TG 2-3 times in the past 12 months (66)
Meanwhile lsquothe low grouprsquo was found having the following characteristics The
lowest number of the research participants was under 20 years old or 53 Only 47 of
the participants had other kinds of occupation which were not indicated on the
questionnaire while only 6 of the participants earned 60001 baht or above monthly
2 of the participants traveled on other purposes besides those shown on the
questionnaire Lastly 13 of the passengers were those who traveled by TG more than
10 times in the past 12 months
42 Level of Passengersrsquo Satisfaction
Figure 1 below is the conclusion from the second part of the questionnaire The
150 participants were asked to rate the level of service quality that they perceived from
the TGrsquos domestic flights on Bangkok - Chiangmai route The questionnaire was divided
into five dimensions of SERVQUALrsquos (Parasuraman et al 1985) service quality which
comprised reliability assurance tangibles empathy and responsiveness The scales 1 to 5
ranged from lsquostrongly disagreersquo to lsquostrongly agreersquo
30
0
5
Reliability Assurance Tangibles Empathy Responsiveness
280
345 334307
269
SERVQUAL Dimension
Figure 1 Overall Level of Participants Satisfaction
Mean scores
Figure 1 shows the average mean score of all 150 passengersrsquo satisfaction on five
dimensions of service quality ranging from the mean scores of 345 to 269 The results
revealed that the most important service quality dimension for the whole samples group
of passengers was assurance ( 345) followed by tangibles ( 334) empathy ( 307)
reliability ( 28) and responsiveness ( 269) respectively The overall average mean
was 307
43 Passengersrsquo Satisfaction Level in Relationship with Their Demographic Data
This section shows the relationship between the demographic data (age
occupation monthly income purpose of travel and travel frequency) of the participants
and their satisfaction with the service quality of TGrsquos in-flight service
The researcher focused on each category of demographic characteristics of two
major groups a group with the highest score and the other with the lowest score In fact
the most important data were the majority opinion of the sample group In other words
for this study it was lsquothe high grouprsquo However the researcher as a TG cabin crew gave
importance to the low group as well since each and every passenger is significant to TG
x
x x x
x x
31
business particularly in the high competitive market of airline business The researcher
was interested to know what the passengers in the lsquolow grouprsquo thought about the in-flight
service and what their feedback was
The following tables (Tables 7-11) illustrate the relationship between each
dimension of the demographic data and the SERVQUAL service assessment tool and the
following symbols are applied in the tables below
lsquoNrsquo means the number of the participants
lsquo rsquo means the mean score
lsquoThe high grouprsquo means the group that comprises the highest number of participants
lsquoThe low grouprsquo means the group that comprises the lowest number of participants
Table 7 Relationship between the Participantsrsquo Age and their Satisfaction with In-flight
Service
SERVQUALrsquoS
RATER
Average
Mean Score
of All Groups
The High Group
(Age 20-40 Yrs Old)
N = 85567
The Low Group
(Age Under 20 Yrs Old)
N = 853
Mean Score of Each Group
Reliability 280 278 270
Assurance 345 378 335
Tangibles 334 331 328
Empathy 307 309 314
Responsiveness 269 267 290
Table 7 reveals the connection between the participantsrsquo age and the five
dimensions of the SERVQUAL instrument The high group had higher mean scores for
x
32
three dimensions than the low group In other words the participants with an age range
of 20-40 years were more satisfied with TGrsquos service quality in terms of reliability
assurance tangibles than those who were under 20 years old Meanwhile the low group
had higher mean scores for two dimensions than the high group This means the
participants who were lower than 20 years old were more satisfied with the in-flight
service in terms of empathy and responsiveness than those whose ages ranged from 20-40
years
Interestingly it was found that both groups have a lower mean score for the
reliability dimension ( 278 and 270) than the average mean score of all the age groups
in this study ( 28)
Table 8 Relationship between the Participantsrsquo Occupation and their Satisfaction with In-
flight Service
SERVQUALrsquoS
RATER
Average
Mean Score
of All Groups
The High Group
(Business Employee)
N = 63420
The Low Group
(Others)
N = 640
Mean Score of Each Group
Reliability 280 275 284
Assurance 345 347 348
Tangibles 334 331 336
Empathy 307 310 305
Responsiveness 269 264 277
Table 8 illustrates the connection between the participantsrsquo occupations and the
five dimensions of the SERVQUAL instrument The low group had higher mean scores
x
x
33
for almost all the dimensions of SERVQUALrsquos RATER than the high group except for
one dimension In other words the participants who worked as business employees were
less satisfied with TGrsquos service quality in terms of reliability assurance tangibles and
responsiveness than those whose occupations were not specified in the questionnaire
Empathy was the only dimension of service quality that the participants who were in the
high group were satisfied with
Table 9 Relationship between the Participantsrsquo Income and their Satisfaction with In-
flight Service
SERVQUALrsquoS
RATER
Average
Mean Score
of All Groups
The High Group
(20001-40000)
N = 72480
The Low Group
(60001 and above)
N = 960
Mean Score of Each Group
Reliability 280 273 285
Assurance 345 349 350
Tangibles 334 332 321
Empathy 307 301 325
Responsiveness 269 262 273
Table 9 indicates the connection between the participantsrsquo monthly income and
the five dimensions of the SERVQUAL instrument The low group had higher mean
scores for almost all the dimensions of RATER than the high group except for one
dimension In other words the participants who earned monthly income of 20001 ndash
40000 baht were less satisfied with TGrsquos service quality in terms of reliability assurance
empathy and responsiveness than those who earned monthly income of 60001 baht and
34
above The tangibles dimension was the only service quality issue that the participants
who were in the high group were satisfied with
Table 10 Relationship between the Participantsrsquo Purpose of Travel and their Satisfaction
with In-flight Service
SERVQUALrsquoS
RATER
Average
Mean Score
of All Groups
The High Group
(Holidays)
N = 79527
The Low Group
(Others)
N = 320
Mean Score of Each Group
Reliability 280 279 285
Assurance 345 353 349
Tangibles 334 335 338
Empathy 307 308 312
Responsiveness 269 270 275
Table 10 reflects the connection between the participantsrsquo purpose of travel and
the five dimensions of the SERVQUAL instrument The low group had higher mean
scores for almost all the dimensions than the high group except for one dimension In
other words the participants who traveled on holidays were less satisfied with TGrsquos
service quality in terms of reliability tangibles empathy and responsiveness than those
whose purpose of travel were not specified in the questionnaire Assurance was the only
dimension of service quality that the participants who were in the high group were
satisfied with
35
Interestingly it was found that both groups has a higher satisfaction level for the
assurance tangibles empathy and responsiveness dimensions than the average mean
scores of the whole sample group
Table 11 Relationship between the Participantsrsquo Frequency of Travel with THAI and their
Satisfaction with In-flight Service
SERVQUALrsquoS
RATER
Average Mean
Score of All
Groups
The High
Group
(2-3 timesyear)
N = 99660
The Low Group
(more than 10
timesyear)
N = 213
Mean Score of Each Group
Reliability 280 281 295
Assurance 345 346 360
Tangibles 334 335 343
Empathy 307 308 321
Responsiveness 269 270 292
Table 11 presents the connection between the participantsrsquo frequency of travel
with THAI and the five dimensions of the SERVQUAL instrument The low group had
higher mean scores for all the dimensions of RATER than the high group In other
words the participants who traveled 2-3 times in the last 12 months were less satisfied
with TGrsquos service quality in terms of reliability assurance tangibles empathy and
responsiveness than those whose frequency of travel were more than 10 times in the last
12 months
36
Interestingly it was found that both groups has a higher satisfaction level for all
the five RATER dimensions than the average mean scores of the whole sample group in
this study
44 Other Comments
The last part of the questionnaire was designed to ask whether the participants
would continue using TGrsquos service The findings disclosed that 142 participants or
946 indicated that they would while 8 of them or 54 declined
Also at the end of the questionnaire there was a blank space for the participants to
freely express their own ideas and suggestions on TGrsquos service However only 7
participants or 46 gave suggestions regarding the in-flight service Four of the
participants were dissatisfied with the flavor of the snacks provided on board One
complained that it was not cool enough in the cabin while one was upset for not being
granted for a request for a blanket The last one commented that the passengerrsquos seat was
not comfortable
In summary the passengersrsquo satisfaction level of the service quality in connection
with their demographic data was introduced Five out of the six demographic
characteristics the participantsrsquo age occupation monthly income purpose of travel and
frequency of travel were analyzed in connection with the five dimensions of SERVQUAL
instrument reliability assurance tangibles empathy and responsiveness It was observed
that there were some connection between these two matters in various ways as earlier
discussed Lastly it was found that one hundred and forty-two participants would
continue using TGrsquos service while the rest refused Only seven of all the participants or
46 gave some comments on the open-ended suggestion part
CHAPTER FIVE
CONCLUSION AND DISCUSSION
This chapter presents the conclusion discussion limitations of the study and
recommendations for further studies
51 Conclusion
This research aimed to examine the service quality provided by Thai Airways
International on its domestic flights One hundred and fifty passengers who traveled by
TG on the Bangkok - Chiang Mai route were the research participants The SERVQUAL
instrument was used as an instrument for data collection in the survey This instrument
was based on five determinants proposed by Panasuraman etal (1985) in terms of
reliability assurance tangibles empathy and responsiveness This research was also
conducted on the demographic characteristics comprising gender age occupation
monthly income purpose of travel and frequency in traveling and the relationship of these
characteristics except the gender with the passengersrsquo satisfaction with TGrsquos in-flight
service quality The questionnaires were distributed in early March 2010
The results showed that all the participantsrsquo satisfaction based on the five
dimensions was at the average level The highest level of passengersrsquo satisfaction was
placed on the assurance dimension followed by tangibles and empathy dimensions
accordingly The two lowest levels of the passengersrsquo satisfaction were placed on the
responsiveness and reliability dimensions
In addition a summary of the demographic characteristics showed that the high
group or the group with the highest number of participants was business employees The
highest number of the participants was between 21-40 years old The highest number of
38
the participantsrsquo income ranged from 20000 ndash 40000 baht monthly Also the high
grouprsquos purpose of travel was to go on holiday Lastly the highest number of the
participants traveled via TG only 2-3 times during the past 12 months
Meanwhile the low group or the group with the lowest number of participants
was passengers with other kinds of occupations which were not specified on the
questionnaire The low group of the participants was under 20 years old The low group
of the participantsrsquo income ranged from 60001 baht monthly or higher Also the low
group revealed that they traveled via TG for other purposes which were not indicated on
the questionnaire Lastly the passengers who traveled via TG more than 10 times during
the past 12 months belonged in the low group
It has also been discovered that as a whole both groups the high and low groups
were in the same direction in their satisfaction with the five dimensions of service quality
The two groups were satisfied with the service quality dimensions in terms of assurance
at the highest level followed by tangibles empathy reliability and responsiveness
respectively
However when analyzing each demographic characteristic the participants who
were under 20 years old rated the responsiveness dimension higher than the reliability
dimension Also for those participants whose income was around 60001 or higher the
empathy dimension was rated higher than the tangibles Regarding the occupation
business people were satisfied with the reliability and responsiveness dimensions at a
very low level Meanwhile the participants who traveled via TG on their holidays rated
the assurance dimension at a very high level Lastly frequent fliers who traveled by
THAI more than 10 times were most satisfied with TGrsquos service since they rated all
RATER aspects highly
39
52 Discussion
The findings have revealed the answers to the research questions First the
demographic data of the participants gender age occupation monthly income purpose
of travel and frequency of travel were shown Second the level of the passengersrsquo
satisfaction toward the service quality on Thai Airways Internationalrsquos domestic flights in
terms of the SERVQUAL instrument (Parasuraman et al 1985) reliability assurance
tangibles empathy and responsiveness was disclosed Also the results about the
relationship between the passengersrsquo satisfaction and their demographic data were pointed
out
The results of the survey indicated that out of the five dimensions assurance was
rated at the highest level ( 345) followed by tangibles ( 334) and empathy ( 307)
(See Figure 1) In addition passengers rated their highest satisfaction with the assurance
dimension which included cabin crewrsquos job knowledge their courtesy confidence in their
service ability and safety while traveling It may be because TG cabin crew are well-
trained prior to their actual service work on board This can also ensure passengersrsquo
safety Particularly the safety and security features have been the most concerns of
airline passengers since the 9-11 incidents in New York USA This is why most
customers rated their highest satisfaction with the assurance dimension (Carman 1990)
The findings of this study are also consistent with those of Fick and Ritchie (1991)
who studied the operation of the SERVQUAL instrument in three major tourism sectors
airlines restaurants and ski area services It was revealed that the most important
dimensions of the service were assurance and tangibles If companies were unable to
inspire trust and confidence in their customers and the tangibles are not impressive it
would be difficult for them to achieve a high level of customerrsquos satisfaction (Sachukorn
2000)
x x x
40
Responsiveness is often found as the lowest level of satisfaction among customers
in the service industry It is plausible that the staff were too busy to provide prompt and
good service (Kholthanasep 2001) In this study the results revealed that the
responsiveness dimension was rated at the lowest score ( 269) among the five
dimensions followed by the reliability ( 280) dimension It was highly possible that the
passengersrsquo dissatisfaction occurred when passengers did not receive prompt service from
TG when they needed help
Prompt service is an important factor of customersrsquo expectation Customers
generally rate the service as poor when the speed of service does not meet their
expectations (Kholthanasep 2001) Bojanic and Rosen (1994) examined the nature of the
association between service quality as perceived by consumers and its determinants by
applying SERVQUAL in a restaurant setting They found that customers rated
responsiveness as the lowest satisfaction in their studies Zeithaml et al (1990) explained
that the responsiveness dimension in the SERVQUAL was willingness to help customers
and provide prompt service As the responsiveness dimension in this research comprised
prompt service willingness on-time service and quick response therefore it will be
beneficial to TG if the company can ensure that the service provided by its cabin crew
especially the willingness to help passengers and to provide prompt service meet
passengersrsquo satisfaction
Regarding the relationship between the participantsrsquo demographic data and their
satisfaction with the service quality there are many points of interests to be discussed as
follows
Firstly regarding the relationship of the passengersrsquo satisfaction with the service
and their age those who were under 20 years old rated satisfaction with the
responsiveness dimension ( 290) higher than the reliability dimension ( 270) (See
x
x
x x
41
Table 7) It was possible that young passengers usually gave priority to the dimension of
care and service when compared with that of the service providersrsquo accurate and
dependable manner (Panittumrong 2003) In addition young customers had less
experience in a service and it was difficult to compare the current service with the past
experience consequently they were more satisfied with the service provided than senior
customers
Another point was raised about the participantsrsquo age The study revealed that the
number of the high group with the age range of 21- 40 was at 567 However that of
the second highest group of the participants with the age range of 41-60 was at 30
which was rather high This latter grouprsquos level of satisfaction on the service quality was
also close to the average mean score It was found that the average mean score of the
reliability dimension was 280 while that of the second highest group was 281 the
average mean score of the assurance dimension was 345 while that of the second highest
group was 347 the average mean score of the tangibles dimension was 334 while that of
the second highest group was 335 the average mean score of the empathy dimension and
that of the second highest group was rated at 307 equally and the average mean score of
the responsiveness was 269 while that of the second highest group was 271 In sum if
consider the two groups in terms of the participantsrsquo age one of the high group and the
other with the second high group the results confirmed that the satisfaction level of the
majority of passengers was at the above average level
Secondly regarding the relationship between the participantsrsquo satisfaction and
their occupation business employees who were found at the highest number (42) had
very low satisfaction with the service quality in terms of reliability ( 275) and
responsiveness ( 264) while the mean scores of the whole sample group for these two
dimensions were at 280 and 269 respectively (See Table 8) The findings strongly
x
x
42
correlated with that of Cheaosakul (2004) who studied the consumersrsquo perception of
airline service quality with a focus on occupations It was found that the group of
business employees had the highest score on expectations Cheaosakul (2004)rsquos study
also revealed that business employees did not frequently travel compared with people of
other occupations such as tourists It was found in this particular study that the number of
the participantsrsquo purpose of travel with TG for business trips was only at 273 (See
Table 5) while the highest number of the participants went on holiday was at 52
Cheaosakul (2004) indicated that business people therefore had high expectations than
the other group who traveled more frequently
Thirdly an even more interesting point was raised when comparing the level of
satisfaction of the passengers who were government officials or state enterprise
employees and business owners Although passengers who were government officials or
state enterprise employees came third in terms of participants they are considered
valuable customers of TG since according to the governmentrsquos policy they are required
to take only TG which is a national airline whenever they travel by air There are few
exceptions though However it is almost impossible for Thai government officials who
travel on business trip and are funded by the governmentrsquos budget to fly with other
airliners It was found from this study that government officials were less satisfied with
TG quality service in terms of reliability ( 277) and responsiveness ( 264) than the
average level of which the mean scores of the two dimensions were at 280 and 269
respectively
Another issue of discussion regarding the participantsrsquo occupation business
owners came second It was observed that business owners rated the reliability ( 282)
and responsiveness dimensions ( 270) higher than the average scores of all groups (See
Table 8) It is possible that business owners had more positive attitude with TGrsquos service
x x
x
x
43
than the other groups TG seemed popular among business owners and they were the
most important group of customers This was supported by Suriya (2005) who studied
airline market segments after the launch of the low cost airlines in Thailand Suriya
(2005) identified that merchants or business owners were the major group of customers in
the full-service airline market
Fourthly regarding the monthly income of the research participants of the low
group passengers who earned an income of around 60001 or higher rated the empathy
( 325) dimension higher than tangibles ( 321) dimension (See Table 9) This may
be because the high income passengers sensitively felt that the facilities and equipment
found on their domestic route looked quite old-fashioned due to TGrsquos cost reduction The
company saved costs after the Suvannabhumi airport was closed in the 2008 crisis The
result is similar to the findings of Wangpen and Inthornma (2007) in that high income
customers had higher expectations towards the service It was possible that they had
more tendencies to be dissatisfied with the service failures The two researchers
concluded that passengers with different incomes were satisfied with the services at
different levels because they had different attitudes expectations and abilities to pay for
the service
Fifthly as it was found from this study that the highest score for the purpose of
travel was going on holiday (527) and the participants who were tourists rated the
assurance dimension at the highest level or the mean score of 353 (See Table 10) much
higher than the mean score of the whole group which was at 345 It was rather surprising
that the highest score for the travel purpose was not for business trips It is possible to
explain that this group spent for the travel cost on their own and they might want to make
sure that they chose the best service for themselves The result is parallel with Gabbie
and OrsquoNeill (1997) who examined customer satisfaction in the hotel sector using the
x x
44
SERVQUAL tool This study showed that the holiday guests who paid for
accommodation on their own rated assurance much higher than other dimensions It is
plausible to explain that passengers traveling on their own budget must make sure that
they already chose the service that was worth the money spent
However when analyzing the satisfaction on service quality of the participants
whose purpose of travel via TG was for business it was also found that this business
participants rated the high score for the tangibles dimension at the mean score of 340
compared with the average mean score of all groups of 334 Passengers who traveled on
business included government officials and state enterprise employees were major
customers of TG It was therefore interesting to find out from this study that their
satisfaction score in terms of tangibles or the appearance of physical factors such as
equipment facilities and personnel was above the average score of all groups Although
the score was not much higher the gap was bigger than that of the other RATER
dimensions as seen from the following information the passengers who traveled on
business trip showed their satisfaction on the reliability dimension at the mean score of
281 the assurance dimension at 347 the empathy dimension at 309 and the
responsiveness dimension at 270 while the average of all groups was at 280 345 307
and 269 respectively
The last point that the researcher wanted to point out is that this study revealed
that the participants who traveled more than 10 times for the last 12 months were lowest
in number (13) However it was interesting that these frequent flyers showed the high
rate of satisfaction with TGrsquos in-flight service quality The mean scores in all dimensions
showed the high rate of satisfaction (See Table 11) It is possible that passengers who
traveled very often via TG had high loyalty The brand loyalty made passengers happy in
every feature of service This result however contrasts with Ostrowski et al (1993) who
45
investigated service quality and customer loyalty in the commercial airline industry The
study examined whether the high levels of service quality existed in the US commercial
airline industry and how service quality could potentially lead to customer loyalty The
main results indicated that the levels of perceived service quality were below potential
and that customer loyalty to airlines was low It is plausible to say that the data of the two
studies were different The data collected on two air carriers in USA might have
different characteristics from the demographic information of Thai people and the number
of the participants in the two studies might differ However TG still needs to listen to the
voice of all passengers especially the frequent flyers Even if the number of this sample
group was few every customer is valuable for any firm Also it would be valuable to
implement a relevant strategy to expand this group of passengers since they had a positive
attitude for TG
Interestingly the findings from the last part of the questionnaire also showed that
the majority of the participants (946) showed their willingness to use TGrsquos service in
the future It can plausibly be explained that the participants were satisfied with TGrsquo
service quality at the moderate level ( 307) Their satisfaction with the five dimensions
of SERVQUAL was also moderate They might think that TG is a reliable airline that
they can depend on Thai passengers have confidence and trust in the service of Thai
cabin crew in terms of courtesy Also it is possible that they might not trust the low cost
airlinesrsquo service of the crew
There were only seven remarks on the in-flight service when the participants were
asked to freely give suggestions The tangible dimension problematic Passengers
pointed out about the small size of passengersrsquo seats and the quality of the air-
conditioning system One problem was on the responsiveness dimension which happened
when a passenger asked for a blanket but she was not offered indicating that some of the
x
46
cabin crewrsquos promptness to provide service was still not up to a standard Another
comment was on the flavor of the snacks Although this issue is not directly relevant to
the service it is worthwhile for TG to consider this problem
In conclusion the researcher found both strengths and weaknesses in TGrsquos service
quality Assurance was found the highest satisfaction in the participantsrsquo opinion TG
should maintain the service quality with a focus on this dimension On the other hand
the responsiveness and reliability dimensions were at the lowest satisfaction level among
the five dimensions The company should improve its service quality on these two
dimensions especially with regards to TGrsquos lsquoprompt servicersquo and lsquoproblem solvingrsquo
service to retain its passengers
53 Limitations of the study
This study has some limitations as follows
1 This study was limited to only one domestic route (Bangkok ndash Chiangmai)
Therefore the participants in this study were passengers who traveled only between these
two provinces The results of the study might differ if the study covered another route or
many more routes at the same time Consequently further studies can be conducted for
other domestic destinations such as Phuket and other big cities
2 The research participants were all Thai passengers It would be interesting to
study foreign passengersrsquo satisfaction on TGrsquos in-flight service quality
3 This study focused only on Parasuraman et al (1985)rsquos SERVQUAL
Instrument used to assess the service quality The results might differ if other instruments
were used
47
54 Recommendations for further studies
Further research should be undertaken to validate the results of this study The
researcher has found several opportunities to extend this study as follows
Survey on the lsquoresponsivenessrsquo dimensions
Responsiveness concerns the willingness or readiness of employees to provide
service such as timelines of service and prompt service This dimension was what the
passengers in this study were most concerned about because it was rated as the lowest
level of satisfaction Thus TG should find the countermeasure of how to increase the
level of passengersrsquo satisfaction in the responsiveness dimension
Assessment of the ground service quality
Since this research was conducted on on-board service quality further studies on
ground services such as a reservation or check-in service should be investigated in order
to integrate the results covering every sector of the airline service
Study on passengersrsquo attitude towards the service quality in other airlines
A study on the service quality of other airlines should be conducted in order to
obtain comparative data and find out reasons for their passengersrsquo behavior and attitude
consequently allowing TG to remedy any weak points and increase the number of new
passengers
REFERENCES
REFERENCES
Alegre J amp Pou L (2006) An analysis of the microeconomic determinants of travel
frequency Department of Applied Economics Universitat de les Illes Balears
Bojanic DC (1991) Quality measurement in professional service firms Journal of
Professional Service Marketing 7(2) 27-37
Bojanic D C amp Rosen L D (1994) Measuring service quality in restaurants An
application of the SERVQUAL model Journal of Hospitality Research 18(1)
3-14
Boontaganon W (2002) The study of service quality of fast-food restaurants in Bangkok
using SERVQUAL measurement Thesis MBA (Business Administration)
Bangkok Assumption University Photocopied
Buttle F (1996) SERVQUAL review critique research agenda European Journal of
Marketing 30(1) 8-31
CarmanJ M (1990) Consumer perceptions of service quality An assessment of the
SERVQUAL dimensions Journal of Retailing 69 33-35
Cheaosakul W (2004) Consumers perception of service quality a case study of Thai
Airways International Plc Thesis MBA Bangkok Assumption University
Photocopied
Fick RG amp Ritchie JRB (1991) Measuring service quality in the travel and tourism
industry Journal of Travel Research 30(2) 2-9
Fornell C (1992) A national customer satisfaction barometer the Swedish experience
Journal of Marketing 56 6-21
Gabbie O amp OrsquoNeill M (1997) SERVQUAL and the Northern Ireland hotel sector a
comparative analysis part 2 Managing Service Quality 17(1) 43-49
50
Gilbert DH (1999) Marketing connecting with customers (2nd
ed) Upper Saddle
River NJ Prentice Hall
Gilbert D amp Wong KCR (2002) Passenger expectations and airline services a
Hong Kong based study Surrey Management School Surrey University of
Surrey
Gitman LJ amp Carl DM (2005) The future of business the essentials Mason Ohio
South-Western College Pub
Grifin J (1995) Customer loyalty NY Lexington Book
Gronroos C (1978) A service-oriented approach to marketing of services European
Journal of Marketing 12(8) 588-601
Hennig-Thurau T amp Klee A (1997) The impact of customer satisfaction and
relationship quality on customer retention a critical reassessment and model
development Masterrsquos Project MA (Psychology amp Marketing) Hanover
University of Hanover
Heesawat C (2005) The opportunities and problems in making services more tangible
PhD Dissertation Bangkok Assumption University Photocopied
Juran JM amp Gryna FM (1974) Quality control handbook NY McGraw-Hill
Kholthanasep G (2001) A study of customerrsquos expectations and perceptions of service
quality delivery by first class hotels in Bangkok metropolitan area Thesis
MBA Bangkok Assumption University Photocopied
Kotler P amp Scheff J (1997) Standing room only strategies for marketing the
performing arts Boston Mass Harvard Business School Press
Kotler P (1997) Marketing management analysis planning and control (9th
ed) Upper
Saddle River NJ Prentice Hall
51
Kotler P Bowen J amp Makens J (1999) Marketing for hospitality and tourism (2nd
ed) NJ Prentice Hall
Kotler P (2000) Marketing management the millennium edition (10th
ed) NJ Prentice
Hall
Lages FL amp Fernandes CJ (2005) The SERVQUAL scale a multi-item instrument
for measuring service personal values Journal of Business Research 58(11)
1562-1572
Oberoi U amp Hales C (1990) Assessing the quality of the conference hotel product
London The Service Industries Journal 10(4) 700-722
Ostrowski PL Orsquobrien TV amp Gordon GL (1993) Service quality and customer
loyalty in the commercial airline industry Journal of Travel Research 32(2)
16-24
Palin M (1996) Flight catering transportation and loading (2nd
ed) London Longman
Group Limited
Panittumrong P (2004) The consumerrsquos opinion towards Clark Hatch Fitness Center
Master Project MBA (Management) Bangkok Graduate School
Srinakharinwirot University Photocopied
Parasuraman A Zeitmal VA amp Berry LL (1985) A concept model of service
quality and its implications for future research Journal of Marketing 49 41-50
Parasuraman A Zeitmal VA amp Berry LL (1988) SERVQUAL a multiple item
scale for measuring customer perceptions of service quality Journal of
Retailing 64(1) 64
Parasuraman A amp Berry LL (1991) Marketing services competing through quality
NY The Free Press
52
Pirsig RM (1987) Zen and the art of motorcycle maintenance an inquiry into values
(Mass Market Paperback) NY Bantam Books
Poonlarbtawee K (1987) Statistics for research Bangkok Physic Center Printing
Reid RD amp Bojanic DC (2001) Hospitality marketing management NJ John Wiley
amp Son Inc
Rueangthanakiet P (2008) Memberrsquos satisfaction of fitness service quality a case study
of California Wow Xperience Plc Masterrsquos Project MA (Business English for
International Communication) Bangkok Graduate School Srinakharinwirot
University Photocopied
Sachukorn S (2006) Reception and service excellence Bangkok Saitharn
Schiffman LG amp Kanuk LL (1994) Consumer behavior (5th
ed) London Prentice-
Hall International
Somwang C (2008) An assessment of passengersrsquo views of service quality in Thai low
cost carriers Inter Program MA (Communicative English) Bangkok
Ramkhamhaeng University Photocopied
Suriya K (2005) Airline market segments after low cost airlines in Thailand passenger
classification using neural networks and logit model with selective learning
Faculty of Economics Chiangmai Chiangmai University
Suthirungkul N (2003) The study of customer expectations and perceptions of service
quality of the Clark Hatch fitness center of Silom road branch Bangkok Thesis
MBA (Business Administration) Bangkok Assumption University
Photocopied
Thai Airways International (2008) Traffic program information (Introduction of summer
200809) Bangkok THAI Printing Office
53
Thai Airways International (2009) Traffic program information (Introduction of winter
200910) Bangkok THAI Printing Office
THAI AIRWAYS INTL Official 4-Star Ranking of Product and Service Quality (2009
October) Retrieved February 14 2010 from
httpwwwairlinequalitycomAirlinesTGhtml
Travel Planning (2010 February 12) Retrieved February 12 2010 from
httpwwwsuite101comlessoncfm1848818243
Wangpen N amp Inthornma S (2007) Membersrsquo satisfaction in fitness centers in
Bangkok Thesis MA (Hotel and Tourism Management) Bangkok Graduate
School Naresuan University Photocopied
Zeithaml VA amp Bitner MJ (2000) Services marketing (2nd
ed) NY McGraw Hill
Zeithaml VA Parasuraman A amp Berry LL (1990) Delivering quality service
balancing customer perceptions and expectations NY Free Press
APPENDICES
55
APPENDIX A
แบบทดสอบความพงพอใจของผโดยสารการบนไทย
เรยนทานผโดยสารทเคารพ กระผมนาย วลาศ มนคงวณชกล พนกงานตอนรบสายการบนไทย และนกศกษาปรญญาโท หลกสตรภาษาองกฤษธรกจเพอการสอสารนานาชาต มหาวทยาลยศรนครนทรวโรฒ ไดจดท าแบบสอบถามนเพอเปนสวนหนงของการส ารวจความพงพอใจของผโดยสารทมตอคณภาพงานบรการ เทยวบนภายในประเทศของการบนไทย โดยมงหวงทจะน าขอมลทไดรบจากการส ารวจมาเปนประโยชนตอการสงเสรมสนบสนนการปฏบตงานใหเกดประสทธผล จงขอความกรณาจากทานในการตอบแบบสอบถามทกขอตามขอเทจจรงและความเหนของทาน ขอมลทงหมดเปนความลบ จะใชเพอการวจยเทานน และขอขอบคณในความรวมมอของทาน
helliphelliphelliphelliphelliphelliphelliphelliphelliphelliphelliphelliphelliphelliphelliphelliphelliphelliphelliphelliphelliphelliphelliphelliphelliphelliphelliphelliphelliphelliphellip
ค าชแจง โปรดท าเครองหมาย (x) ลงในชองวาง ทตรงกบค าตอบของทาน
ตอนท 1 ขอมลทวไป
1 เพศ ( ) ชาย ( ) หญง 2 อาย ( ) ตากวา 20 ป ( ) 21-40 ป ( ) 41-60 ป ( ) 60 ปขนไป 3 อาชพ ( ) ขาราชการ รฐวสาหกจ ( ) พนกงานบรษท ( ) ธรกจสวนตว ( ) นกเรยน นกศกษา ( ) เกษยณ ( ) อนๆ 4 รายได เดอน ( ) ตากวา 20000 ( ) 20001- 40000 บาท ( ) 40001- 60000 บาท ( ) 60001 บาท ขนไป 5 จดประสงคการเดนทาง ( ) ธรกจ ( ) พกผอน ( ) เยยมเยยนญาตมตร เพอนฝง ( ) อนๆ 6 ความถในการเดนทางกบการบนไทย (ในรอบ 12 เดอน) ( ) ครงแรก ( ) 2-3 ครง ( ) 4-10 ครง ( ) 10 ครงขนไป
56
ตอนท 2 ความพงพอใจของทานตอการบรการ (5 = เหนดวยอยางยง 4= เหนดวย 3= ปานกลาง 2=ไมเหนดวย 1=ไมเหนดวยอยางยง)
ระดบความพงพอใจ
การบรการของการบนไทย 5 4 3 2 1 1 เมอเจาหนาทสญญาทจะใหบรการทานในเรองใด จะทาตามนนเสมอ
2 การใหบรการของเจาหนาท สรางความเชอมนใหกบทาน
3 อปกรณบนเครองบนมรปแบบททนสมย (เชน จอทว ทนง)
4 บรษทฯกาหนดเวลาการใหบรการบนเครองเหมาะสม
5 เจาหนาทใหบรการทดนบตงแตกาวแรกบนเครอง
6 เจาหนาทมความตงใจดทจะชวยเหลอทาน เมอทานมปญหา
7 ทานรสกปลอดภยเมออยบนเครองบน
8 สงอานวยความสะดวกตางๆบนเครอง มรปลกษณทดงดดใจ (เชน กลองอาหาร) 9 เจาหนาทไมเขาใจความตองการของทาน ในบางกรณ
10 เจาหนาทไมไดระบเวลาในการใหบรการผโดยสารบนเครองทแนนอน 11 เจาหนาทพยายามทางานโดยไมใหเกดขอผดพลาด
12 เจาหนาทปฎบตงานดวยความสภาพเสมอ
13 เจาหนาทแตงกายเรยบรอยและดด
14 บรษทฯใหความเอาใจใสกบผโดยสารเปนรายบคคล
15 บางครงเจาหนาทไมเตมใจทจะใหบรการผโดยสาร
16 บรษทใหบรการทานตรงเวลาทกาหนด
17 เจาหนาทสามารถใหขอมลเกยวกบการเดนทางไดอยางถกตอง
18 เอกสารของบรษทฯทเกยวของกบการบรการ (เชน แผนพบ นตยสาร) มขอมลครบถวน และรปแบบสวยงาม 19 เจาหนาทใหบรการทานดวยสมผสความเปนไทย
20 เจาหนาทใหบรการผโดยสารอยางรวดเรว
ทานจะกลบมาใชบรการของการบนไทยตอไป จะใชบรการตอไป ไมใชบรการ
ขอเสนอแนะ_______________________________________________________
_____________________________________________________________ ขอบพระคณอยางสงในความรวมมอของทาน
57
APPENDIX B
Questionnaire
Dear Honorable Passengers
My name is Wilas Mankongvanichkul -- a THAI cabin crew and masterrsquos student of business English
for international communication program Srinakharinwirot University This questionnaire is about
an exploration of passengersrsquo satisfaction with service quality of Thai Airways International (TG)rsquos
domestic flights Data gained will be utilized for THAI service operation Please kindly complete the
questionnaire The data gained will be kept confidential and used for the research study only Your
kind cooperation is greatly appreciated
helliphelliphelliphelliphelliphelliphelliphelliphelliphelliphelliphelliphelliphelliphelliphelliphelliphelliphelliphelliphelliphelliphelliphelliphelliphellip
Direction Please mark (x) your answer in the space provided
Part 1 Personal Information
1 Gender
( ) Male ( ) Female
2 Age
( ) Under 20 years ( ) 21-40 years
( ) 41-60 years ( ) Above 60 years
3 Occupation
( ) Government official State enterprise employee
( ) Business employee
( ) Business owner ( ) Student
( ) Retiree ( ) Others
4 Monthly income
( ) Up to 20000 baht ( ) 20001- 40000 baht
( ) 40001 ndash 60000 baht ( ) 60001 baht and above
5 Purpose of travel
( ) Business trips ( ) Holidays
( ) Visits ( ) Others
6 Frequency in traveling with THAI (during the last 12 months)
( ) First time ( ) 2-3 times
( ) 4-10 times ( ) More than 10 times
58 Part 2 Your satisfaction with the service
(5=Strongly Agree 4= Agree 3=Uncertain 2=Disagree 1= Strongly Disagree)
Level of Satisfaction
The Service of THAI 5 4 3 2 1
1 When cabin crew promise to do something by a
certain time they do so
2 You can trust THAI cabin crew
3 TG has modern on board equipment
(such as TV screen passengersrsquo seats)
4 TG has operating hours on board convenient to all
passengers
5 Cabin crew offer good services upon boarding
6 When passengers have a problem cabin crew show a
sincere interest in solving it
7 Passengers feel safe on-board
8 The physical facilities of TG are visually appealing
(such as meal boxes)
9 Cabin crew do not understand your special needs in
some cases
10 Cabin crew do not tell passengers exactly when
services will be offered
11 Cabin crew insist on error-free records
12 Cabin crew are consistently courteous to passengers
13 Cabin crew are well-dressed and neat in appearance
14 TG gives passengers individual attention
15 Cabin crew are not always willing to help passengers
16 TG provides its services at the time it promises to
do so
17 Cabin crew are knowledgeable to answer passengers
travel-related questions
18 Documents about service are informative and appealing
(such as pamphlets and magazines)
19 Services provided have a ldquoThai Touchrdquo
20 Cabin crew are quick to respond to passengersrsquo requests
Will you come back for TGrsquos service Yes No
Suggestions________________________________________________________________
________________________________________________________________________ Thank you very much for your kind cooperation
59
APPENDIX C
Questionnaire Specification Based on SERVQUAL measurement (Parasuraman et al 1985)
Passengers satisfaction level toward service quality factors
No Service Quality Features (RATER)
Str
on
gly
ag
ree
Ag
ree
Un
certa
in
Dis
ag
ree
Str
on
gly
Dis
ag
ree
(5) (4) (3) (2) (1)
1 When cabin crew promise to do something by a certain time they do so Reliability
2 You can trust THAI cabin crew Assurance
3 TG has modern on board equipment (such as TV screen passengersrsquo seats) Tangibles
4 TG has operating hours on board convenient to all passengers Empathy
5 Cabin crew offer good services upon boarding Responsiveness
6 When passengers have a problem cabin crew show a sincere interest in solving it
Reliability
7 Passengers feel safe on-board Assurance
8 The physical facilities of TG are visually appealing (such as meal boxes) Tangibles
9 Cabin crew do not always understand your special needs in some cases Empathy
10 Cabin crew do not tell passengers exactly when services will be offered Responsiveness
11 Cabin crew insist on error-free records Reliability
12 Cabin crew are consistently courteous to passengers Assurance
13 Cabin crew are well-dressed and neat in appearance Tangibles
14 TG gives passengers individual attention Empathy
15 Cabin crew are not always willing to help passengers Responsiveness
16 TG provides its services at the time it promises to do so Reliability
17 Cabin crew are knowledgeable to answer passengers travel-related questions Assurance
18 TGs documents associated with services are informative and appealing (such as pamphlets and magazines)
Tangibles
19 Services provided have a ldquoThai Touchrdquo Empathy
20 Cabin crew are quick to respond to passengersrsquo requests Responsiveness
VITAE
61
VITAE
Name Wilas Mankongvanichkul
Date of Birth February 14 1980
Place of Birth Bangkok
Address 688 Soi Phaholyothin 32 Chankasem Jatuchak
Bangkok 10900
Present Occupation Cabin Crew
Thai Airways International Public Company Limited
89 Vibhavadi Rangsit Road Bangkok 10110
Education Background
2010 Master of Art (Business English for International
Communication)
Srinakharinwirot University
2001 Bachelor of Business Administration Bangkok University
1997 High School Saint Dominic School
- Cover
- Abstract
- Chapter 1
- Chapter 2
- Chapter 3
- Chapter 4
- Chapter 5
- Bibliography
- Appendix
- Vitae
-
20
In brief the previous studies explored the satisfaction of airline passengers by
using SERVQUAL instrument to measure the service quality The results above found
out the differences between customersrsquo expectations and perceptions The findings of a
study in Hong Kong revealed the passengersrsquo satisfaction on the dimensions of the
service quality Meanwhile a study in Thailand implied some findings about the
demographic profiles resulting in service quality Studies on service quality help improve
business organizations retain customers and attract new customers
CHAPTER THREE
METHODOLOGY
This chapter consists of four sections participants of the study research
instrument procedures of the study and data analysis
31 Participants of the Study
One hundred and fifty Thai passengers 75 males and 75 females who took the
TG Bangkok - Chiangmai route were randomly chosen as participants for the study
Since there are about 150 passenger seats in each flight the researcher randomly acquired
a sample size of 10 percent of the overall passengers from the ten flights totaling 150
Thai people are the main group of passengers who travel domestically over the year The
researcher therefore decided to select only the Thai passengers as the participants for the
study Also so as to cover various types of passengers the researcher included flights of
different time within a day (as shown in a following part of this chapter) for a reason that
passengers with some specific purposes chose to travel at some specific time For
example business people might prefer an early morning flight rather than a later-in-the-
day one
TGrsquos Bangkok ndash Chiangmai route has been considered one of the most frequent
domestic routes (THAI 2009) TG operates ten flights daily from Bangkok to
Chiangmai The researcher consequently chose this route for this research work to
assess the passengersrsquo satisfaction with TGrsquos service quality
The study was conducted in early March when it was still in the high season for
travels to the northern province of Thailand Fifteen passengers from each of the ten
flights of the Bangkok - Chiangmai route were asked to fill out the questionnaire at the
22
end of the on-board service while the plane was approaching Chiangmai its destination
All the 150 completed questionnaires were obtained as planned
32 Research Instrument
A questionnaire in Thai was used for data collection The questionnaire was
divided into three parts The first part was about the respondentsrsquo demographic profile
since consumersrsquo needs preferences and personalization are often associated with
demographic factors (Kotler 2000) Six demographic characteristics related to in-flight
service (Cheosakul 2004) consisting of gender age occupation monthly income
purpose of travel and travel frequency with THAI were demographic issues of the survey
The second part comprised questions about passengersrsquo satisfaction with the service
during the flight This part of the questionnaire was based on the SERVQUAL
instrument for measuring customersrsquo satisfaction in five dimensions of service reliability
assurance tangibles empathy and responsiveness (Parasuraman et al 1985) The last
part comprised a question and a blank space provided for suggestions on TGrsquos service
quality
33 Procedures of the Study
The questionnaire was initially approved by the researcherrsquos masterrsquos project
advisor and two specialists a TG in-flight service manager and a SWU lecturer Then a
pilot study was conducted to ten passengers to check for content reliability the
appropriateness of the number of questions and language used in the questionnaire As
the researcher included all the ten flights of TGrsquos Bangkok - Chiangmai route in the
study the tried-out questionnaire was randomly distributed to ten TG passengers (5 males
and 5 females) on each flight of the aforementioned route on the same day in February
23
2010 Also since this study was about onboard service the questionnaire was distributed
to the participants after the in-flight service was completed and before the plane landed
After that the questionnaire was adjusted and prepared for the actual survey
The revised questionnaire was eventually distributed to 150 participants in ten
consecutive days in early March 2010 Fifteen passengers in each Bangkok -
Chiangmai flight per day were randomly asked to fill out the questionnaire after the
completion of in-flight service
The plan below showed the ten flights of for the survey each flight for a day to
make sure that the data gained were reliable
BKK-CNX Flight (TG) Flight Schedule (Departure-Arrival)
TG100 0615-0725
TG102 0750-0910
TG104 0910-1030
TG106 1020-1140
TG110 1250-1400
TG112 1400-1510
TG114 1540-1650
TG116 1715-1825
TG120 1900-2010
TG122 2130-2240
34 Data Analysis
The data acquired from the questionnaires were analyzed in three sections
demographic profile of passengers level of passengersrsquo satisfaction with TGrsquos service
and the relationship between demographic profile and passengersrsquo satisfaction based on
24
Likert scale The 5-point Likert scales were used to rate the level of satisfaction as shown
in Table 1 below
Table 1 Intervals of Satisfaction Level (Poonlarbtawee 1987)
The interpretation of the scales in this study is as follows
Rating
Scale
Level of
Agreement Disagreement
Satisfaction
Level
Mean Score
5 Strongly agree Excellent 451-500
4 Agree Good 351-450
3 Uncertain Average 251-350
2 Disagree Fair 151-250
1 Strongly disagree Poor 100-150
The researcher picked up lsquothe high grouprsquo and lsquothe low grouprsquo of each
SERVQUAL dimension to present the relationship between the participantsrsquo
demographic profile and their satisfaction As the data gained from the highest number of
the participants or the high group was the major point that the researcher relied on focus
was on the majority opinion At the same time the data gathered from the lowest number
of the participants or the low group should not be overlooked because each and all
passengers are important for TG and in the high competitive airline market it is necessary
to retain each and every passenger so as to grow far in the aviation business
The results were presented in terms of percentages and mean scores in the form of
tables and a bar chart These fundamental statistic methods were proper in this study
25
because percentages and mean scores are considered the basic statistics used for data
analysis and presentation Also the general public can easily understand the
interpretation of the data Another reason was that the sample group of this study
comprised only 150 TG passengers The researcher therefore decided to apply the
aforementioned statistics in this research Discussion of the results was also offered
CHAPTER FOUR
FINDINGS
This chapter describes the findings of the study consisting of the demographic
data of the participants level of their satisfaction with TGrsquos service quality relationship
between the demographic data and five dimensions of SERVQUAL instrument and the
uncovers to the last question on the questionnaire including suggestion
41 Demographic Data
The demographic data of TGrsquos research participants in terms of age occupation
monthly income purpose of travel and frequency of travel are presented in Tables 2- 6
below
Table 2 Participantsrsquo Age
Age No of Participants Percentage ()
Under 20 years
21-40 years
41-60 years
Above 60 years
8
85
45
12
53
567
300
80
Total 150 100
Regarding the age group the highest number of the passengers was 20-40 years
old or 567 30 of them were 46-60 years old and 8 were above 60 years old Only
53 were under 20 years old
27
Table 3 Participantsrsquo Occupation
Occupation No of Participants Percentage ()
Government official State enterprise employee
Business employee
Business owner
Student
Retiree
Others
22
63
37
13
9
6
147
420
247
86
60
40
Total 150 100
In terms of occupation the highest number of the participants was business
employees (42) followed by business owners (247) government officials or state
enterprise employees (147) students (86) retirees (6) and other occupations (4)
respectively
Table 4 Monthly Income
Monthly income (baht) No of Participants Percentage ()
Up to 20000
20001- 40000
40001 - 60000
60001 and above
58
72
11
9
386
480
74
60
Total 150 100
For the income the highest number of the participants earned 20001-40000 baht
monthly (48) followed by those with a monthly income of up to 20000 baht (386)
28
of 40001-60000 baht monthly (64) and of 60001 baht and above monthly was the
lowest (6)
Table 5 Purpose of Travel
Purpose of travel No of Participants Percentage ()
Business trips
Holidays
Visits
Others
41
79
27
3
273
527
180
20
Total 150 100
Regarding the purpose of travel the highest number of the passengers traveled via
TG on holidays (527) followed by those who traveled on business trips (273)
Meanwhile those who made a visit were at 180 and who traveled with other purposes
were at 2
Table 6 Frequency of Travel
Frequency in traveling with THAI
(during the last 12 months)
No of Participants Percentage ()
First time
2-3 times
4-10 times
More than 10 times
39
99
10
2
260
660
67
13
Total 150 100
29
The last demographic data derive from the frequency in traveling with THAI
66 of the participants indicated that they traveled 2-3 times during the last 12 months
26 traveled for the first time while 67 for 4-10 times and 13 for more than 10
times during the last 12 months
In conclusion the demographic data shown in the tables above indicated that lsquothe
high grouprsquo comprised the following characteristics The age group of the majority
number of the participants ranged from 21-40 years (567) Most of them were business
employees (42) The highest number of the passengersrsquo monthly income was around
20000 ndash 40000 baht per month (48) The majority of the passengers traveled on
holidays (527) by TG 2-3 times in the past 12 months (66)
Meanwhile lsquothe low grouprsquo was found having the following characteristics The
lowest number of the research participants was under 20 years old or 53 Only 47 of
the participants had other kinds of occupation which were not indicated on the
questionnaire while only 6 of the participants earned 60001 baht or above monthly
2 of the participants traveled on other purposes besides those shown on the
questionnaire Lastly 13 of the passengers were those who traveled by TG more than
10 times in the past 12 months
42 Level of Passengersrsquo Satisfaction
Figure 1 below is the conclusion from the second part of the questionnaire The
150 participants were asked to rate the level of service quality that they perceived from
the TGrsquos domestic flights on Bangkok - Chiangmai route The questionnaire was divided
into five dimensions of SERVQUALrsquos (Parasuraman et al 1985) service quality which
comprised reliability assurance tangibles empathy and responsiveness The scales 1 to 5
ranged from lsquostrongly disagreersquo to lsquostrongly agreersquo
30
0
5
Reliability Assurance Tangibles Empathy Responsiveness
280
345 334307
269
SERVQUAL Dimension
Figure 1 Overall Level of Participants Satisfaction
Mean scores
Figure 1 shows the average mean score of all 150 passengersrsquo satisfaction on five
dimensions of service quality ranging from the mean scores of 345 to 269 The results
revealed that the most important service quality dimension for the whole samples group
of passengers was assurance ( 345) followed by tangibles ( 334) empathy ( 307)
reliability ( 28) and responsiveness ( 269) respectively The overall average mean
was 307
43 Passengersrsquo Satisfaction Level in Relationship with Their Demographic Data
This section shows the relationship between the demographic data (age
occupation monthly income purpose of travel and travel frequency) of the participants
and their satisfaction with the service quality of TGrsquos in-flight service
The researcher focused on each category of demographic characteristics of two
major groups a group with the highest score and the other with the lowest score In fact
the most important data were the majority opinion of the sample group In other words
for this study it was lsquothe high grouprsquo However the researcher as a TG cabin crew gave
importance to the low group as well since each and every passenger is significant to TG
x
x x x
x x
31
business particularly in the high competitive market of airline business The researcher
was interested to know what the passengers in the lsquolow grouprsquo thought about the in-flight
service and what their feedback was
The following tables (Tables 7-11) illustrate the relationship between each
dimension of the demographic data and the SERVQUAL service assessment tool and the
following symbols are applied in the tables below
lsquoNrsquo means the number of the participants
lsquo rsquo means the mean score
lsquoThe high grouprsquo means the group that comprises the highest number of participants
lsquoThe low grouprsquo means the group that comprises the lowest number of participants
Table 7 Relationship between the Participantsrsquo Age and their Satisfaction with In-flight
Service
SERVQUALrsquoS
RATER
Average
Mean Score
of All Groups
The High Group
(Age 20-40 Yrs Old)
N = 85567
The Low Group
(Age Under 20 Yrs Old)
N = 853
Mean Score of Each Group
Reliability 280 278 270
Assurance 345 378 335
Tangibles 334 331 328
Empathy 307 309 314
Responsiveness 269 267 290
Table 7 reveals the connection between the participantsrsquo age and the five
dimensions of the SERVQUAL instrument The high group had higher mean scores for
x
32
three dimensions than the low group In other words the participants with an age range
of 20-40 years were more satisfied with TGrsquos service quality in terms of reliability
assurance tangibles than those who were under 20 years old Meanwhile the low group
had higher mean scores for two dimensions than the high group This means the
participants who were lower than 20 years old were more satisfied with the in-flight
service in terms of empathy and responsiveness than those whose ages ranged from 20-40
years
Interestingly it was found that both groups have a lower mean score for the
reliability dimension ( 278 and 270) than the average mean score of all the age groups
in this study ( 28)
Table 8 Relationship between the Participantsrsquo Occupation and their Satisfaction with In-
flight Service
SERVQUALrsquoS
RATER
Average
Mean Score
of All Groups
The High Group
(Business Employee)
N = 63420
The Low Group
(Others)
N = 640
Mean Score of Each Group
Reliability 280 275 284
Assurance 345 347 348
Tangibles 334 331 336
Empathy 307 310 305
Responsiveness 269 264 277
Table 8 illustrates the connection between the participantsrsquo occupations and the
five dimensions of the SERVQUAL instrument The low group had higher mean scores
x
x
33
for almost all the dimensions of SERVQUALrsquos RATER than the high group except for
one dimension In other words the participants who worked as business employees were
less satisfied with TGrsquos service quality in terms of reliability assurance tangibles and
responsiveness than those whose occupations were not specified in the questionnaire
Empathy was the only dimension of service quality that the participants who were in the
high group were satisfied with
Table 9 Relationship between the Participantsrsquo Income and their Satisfaction with In-
flight Service
SERVQUALrsquoS
RATER
Average
Mean Score
of All Groups
The High Group
(20001-40000)
N = 72480
The Low Group
(60001 and above)
N = 960
Mean Score of Each Group
Reliability 280 273 285
Assurance 345 349 350
Tangibles 334 332 321
Empathy 307 301 325
Responsiveness 269 262 273
Table 9 indicates the connection between the participantsrsquo monthly income and
the five dimensions of the SERVQUAL instrument The low group had higher mean
scores for almost all the dimensions of RATER than the high group except for one
dimension In other words the participants who earned monthly income of 20001 ndash
40000 baht were less satisfied with TGrsquos service quality in terms of reliability assurance
empathy and responsiveness than those who earned monthly income of 60001 baht and
34
above The tangibles dimension was the only service quality issue that the participants
who were in the high group were satisfied with
Table 10 Relationship between the Participantsrsquo Purpose of Travel and their Satisfaction
with In-flight Service
SERVQUALrsquoS
RATER
Average
Mean Score
of All Groups
The High Group
(Holidays)
N = 79527
The Low Group
(Others)
N = 320
Mean Score of Each Group
Reliability 280 279 285
Assurance 345 353 349
Tangibles 334 335 338
Empathy 307 308 312
Responsiveness 269 270 275
Table 10 reflects the connection between the participantsrsquo purpose of travel and
the five dimensions of the SERVQUAL instrument The low group had higher mean
scores for almost all the dimensions than the high group except for one dimension In
other words the participants who traveled on holidays were less satisfied with TGrsquos
service quality in terms of reliability tangibles empathy and responsiveness than those
whose purpose of travel were not specified in the questionnaire Assurance was the only
dimension of service quality that the participants who were in the high group were
satisfied with
35
Interestingly it was found that both groups has a higher satisfaction level for the
assurance tangibles empathy and responsiveness dimensions than the average mean
scores of the whole sample group
Table 11 Relationship between the Participantsrsquo Frequency of Travel with THAI and their
Satisfaction with In-flight Service
SERVQUALrsquoS
RATER
Average Mean
Score of All
Groups
The High
Group
(2-3 timesyear)
N = 99660
The Low Group
(more than 10
timesyear)
N = 213
Mean Score of Each Group
Reliability 280 281 295
Assurance 345 346 360
Tangibles 334 335 343
Empathy 307 308 321
Responsiveness 269 270 292
Table 11 presents the connection between the participantsrsquo frequency of travel
with THAI and the five dimensions of the SERVQUAL instrument The low group had
higher mean scores for all the dimensions of RATER than the high group In other
words the participants who traveled 2-3 times in the last 12 months were less satisfied
with TGrsquos service quality in terms of reliability assurance tangibles empathy and
responsiveness than those whose frequency of travel were more than 10 times in the last
12 months
36
Interestingly it was found that both groups has a higher satisfaction level for all
the five RATER dimensions than the average mean scores of the whole sample group in
this study
44 Other Comments
The last part of the questionnaire was designed to ask whether the participants
would continue using TGrsquos service The findings disclosed that 142 participants or
946 indicated that they would while 8 of them or 54 declined
Also at the end of the questionnaire there was a blank space for the participants to
freely express their own ideas and suggestions on TGrsquos service However only 7
participants or 46 gave suggestions regarding the in-flight service Four of the
participants were dissatisfied with the flavor of the snacks provided on board One
complained that it was not cool enough in the cabin while one was upset for not being
granted for a request for a blanket The last one commented that the passengerrsquos seat was
not comfortable
In summary the passengersrsquo satisfaction level of the service quality in connection
with their demographic data was introduced Five out of the six demographic
characteristics the participantsrsquo age occupation monthly income purpose of travel and
frequency of travel were analyzed in connection with the five dimensions of SERVQUAL
instrument reliability assurance tangibles empathy and responsiveness It was observed
that there were some connection between these two matters in various ways as earlier
discussed Lastly it was found that one hundred and forty-two participants would
continue using TGrsquos service while the rest refused Only seven of all the participants or
46 gave some comments on the open-ended suggestion part
CHAPTER FIVE
CONCLUSION AND DISCUSSION
This chapter presents the conclusion discussion limitations of the study and
recommendations for further studies
51 Conclusion
This research aimed to examine the service quality provided by Thai Airways
International on its domestic flights One hundred and fifty passengers who traveled by
TG on the Bangkok - Chiang Mai route were the research participants The SERVQUAL
instrument was used as an instrument for data collection in the survey This instrument
was based on five determinants proposed by Panasuraman etal (1985) in terms of
reliability assurance tangibles empathy and responsiveness This research was also
conducted on the demographic characteristics comprising gender age occupation
monthly income purpose of travel and frequency in traveling and the relationship of these
characteristics except the gender with the passengersrsquo satisfaction with TGrsquos in-flight
service quality The questionnaires were distributed in early March 2010
The results showed that all the participantsrsquo satisfaction based on the five
dimensions was at the average level The highest level of passengersrsquo satisfaction was
placed on the assurance dimension followed by tangibles and empathy dimensions
accordingly The two lowest levels of the passengersrsquo satisfaction were placed on the
responsiveness and reliability dimensions
In addition a summary of the demographic characteristics showed that the high
group or the group with the highest number of participants was business employees The
highest number of the participants was between 21-40 years old The highest number of
38
the participantsrsquo income ranged from 20000 ndash 40000 baht monthly Also the high
grouprsquos purpose of travel was to go on holiday Lastly the highest number of the
participants traveled via TG only 2-3 times during the past 12 months
Meanwhile the low group or the group with the lowest number of participants
was passengers with other kinds of occupations which were not specified on the
questionnaire The low group of the participants was under 20 years old The low group
of the participantsrsquo income ranged from 60001 baht monthly or higher Also the low
group revealed that they traveled via TG for other purposes which were not indicated on
the questionnaire Lastly the passengers who traveled via TG more than 10 times during
the past 12 months belonged in the low group
It has also been discovered that as a whole both groups the high and low groups
were in the same direction in their satisfaction with the five dimensions of service quality
The two groups were satisfied with the service quality dimensions in terms of assurance
at the highest level followed by tangibles empathy reliability and responsiveness
respectively
However when analyzing each demographic characteristic the participants who
were under 20 years old rated the responsiveness dimension higher than the reliability
dimension Also for those participants whose income was around 60001 or higher the
empathy dimension was rated higher than the tangibles Regarding the occupation
business people were satisfied with the reliability and responsiveness dimensions at a
very low level Meanwhile the participants who traveled via TG on their holidays rated
the assurance dimension at a very high level Lastly frequent fliers who traveled by
THAI more than 10 times were most satisfied with TGrsquos service since they rated all
RATER aspects highly
39
52 Discussion
The findings have revealed the answers to the research questions First the
demographic data of the participants gender age occupation monthly income purpose
of travel and frequency of travel were shown Second the level of the passengersrsquo
satisfaction toward the service quality on Thai Airways Internationalrsquos domestic flights in
terms of the SERVQUAL instrument (Parasuraman et al 1985) reliability assurance
tangibles empathy and responsiveness was disclosed Also the results about the
relationship between the passengersrsquo satisfaction and their demographic data were pointed
out
The results of the survey indicated that out of the five dimensions assurance was
rated at the highest level ( 345) followed by tangibles ( 334) and empathy ( 307)
(See Figure 1) In addition passengers rated their highest satisfaction with the assurance
dimension which included cabin crewrsquos job knowledge their courtesy confidence in their
service ability and safety while traveling It may be because TG cabin crew are well-
trained prior to their actual service work on board This can also ensure passengersrsquo
safety Particularly the safety and security features have been the most concerns of
airline passengers since the 9-11 incidents in New York USA This is why most
customers rated their highest satisfaction with the assurance dimension (Carman 1990)
The findings of this study are also consistent with those of Fick and Ritchie (1991)
who studied the operation of the SERVQUAL instrument in three major tourism sectors
airlines restaurants and ski area services It was revealed that the most important
dimensions of the service were assurance and tangibles If companies were unable to
inspire trust and confidence in their customers and the tangibles are not impressive it
would be difficult for them to achieve a high level of customerrsquos satisfaction (Sachukorn
2000)
x x x
40
Responsiveness is often found as the lowest level of satisfaction among customers
in the service industry It is plausible that the staff were too busy to provide prompt and
good service (Kholthanasep 2001) In this study the results revealed that the
responsiveness dimension was rated at the lowest score ( 269) among the five
dimensions followed by the reliability ( 280) dimension It was highly possible that the
passengersrsquo dissatisfaction occurred when passengers did not receive prompt service from
TG when they needed help
Prompt service is an important factor of customersrsquo expectation Customers
generally rate the service as poor when the speed of service does not meet their
expectations (Kholthanasep 2001) Bojanic and Rosen (1994) examined the nature of the
association between service quality as perceived by consumers and its determinants by
applying SERVQUAL in a restaurant setting They found that customers rated
responsiveness as the lowest satisfaction in their studies Zeithaml et al (1990) explained
that the responsiveness dimension in the SERVQUAL was willingness to help customers
and provide prompt service As the responsiveness dimension in this research comprised
prompt service willingness on-time service and quick response therefore it will be
beneficial to TG if the company can ensure that the service provided by its cabin crew
especially the willingness to help passengers and to provide prompt service meet
passengersrsquo satisfaction
Regarding the relationship between the participantsrsquo demographic data and their
satisfaction with the service quality there are many points of interests to be discussed as
follows
Firstly regarding the relationship of the passengersrsquo satisfaction with the service
and their age those who were under 20 years old rated satisfaction with the
responsiveness dimension ( 290) higher than the reliability dimension ( 270) (See
x
x
x x
41
Table 7) It was possible that young passengers usually gave priority to the dimension of
care and service when compared with that of the service providersrsquo accurate and
dependable manner (Panittumrong 2003) In addition young customers had less
experience in a service and it was difficult to compare the current service with the past
experience consequently they were more satisfied with the service provided than senior
customers
Another point was raised about the participantsrsquo age The study revealed that the
number of the high group with the age range of 21- 40 was at 567 However that of
the second highest group of the participants with the age range of 41-60 was at 30
which was rather high This latter grouprsquos level of satisfaction on the service quality was
also close to the average mean score It was found that the average mean score of the
reliability dimension was 280 while that of the second highest group was 281 the
average mean score of the assurance dimension was 345 while that of the second highest
group was 347 the average mean score of the tangibles dimension was 334 while that of
the second highest group was 335 the average mean score of the empathy dimension and
that of the second highest group was rated at 307 equally and the average mean score of
the responsiveness was 269 while that of the second highest group was 271 In sum if
consider the two groups in terms of the participantsrsquo age one of the high group and the
other with the second high group the results confirmed that the satisfaction level of the
majority of passengers was at the above average level
Secondly regarding the relationship between the participantsrsquo satisfaction and
their occupation business employees who were found at the highest number (42) had
very low satisfaction with the service quality in terms of reliability ( 275) and
responsiveness ( 264) while the mean scores of the whole sample group for these two
dimensions were at 280 and 269 respectively (See Table 8) The findings strongly
x
x
42
correlated with that of Cheaosakul (2004) who studied the consumersrsquo perception of
airline service quality with a focus on occupations It was found that the group of
business employees had the highest score on expectations Cheaosakul (2004)rsquos study
also revealed that business employees did not frequently travel compared with people of
other occupations such as tourists It was found in this particular study that the number of
the participantsrsquo purpose of travel with TG for business trips was only at 273 (See
Table 5) while the highest number of the participants went on holiday was at 52
Cheaosakul (2004) indicated that business people therefore had high expectations than
the other group who traveled more frequently
Thirdly an even more interesting point was raised when comparing the level of
satisfaction of the passengers who were government officials or state enterprise
employees and business owners Although passengers who were government officials or
state enterprise employees came third in terms of participants they are considered
valuable customers of TG since according to the governmentrsquos policy they are required
to take only TG which is a national airline whenever they travel by air There are few
exceptions though However it is almost impossible for Thai government officials who
travel on business trip and are funded by the governmentrsquos budget to fly with other
airliners It was found from this study that government officials were less satisfied with
TG quality service in terms of reliability ( 277) and responsiveness ( 264) than the
average level of which the mean scores of the two dimensions were at 280 and 269
respectively
Another issue of discussion regarding the participantsrsquo occupation business
owners came second It was observed that business owners rated the reliability ( 282)
and responsiveness dimensions ( 270) higher than the average scores of all groups (See
Table 8) It is possible that business owners had more positive attitude with TGrsquos service
x x
x
x
43
than the other groups TG seemed popular among business owners and they were the
most important group of customers This was supported by Suriya (2005) who studied
airline market segments after the launch of the low cost airlines in Thailand Suriya
(2005) identified that merchants or business owners were the major group of customers in
the full-service airline market
Fourthly regarding the monthly income of the research participants of the low
group passengers who earned an income of around 60001 or higher rated the empathy
( 325) dimension higher than tangibles ( 321) dimension (See Table 9) This may
be because the high income passengers sensitively felt that the facilities and equipment
found on their domestic route looked quite old-fashioned due to TGrsquos cost reduction The
company saved costs after the Suvannabhumi airport was closed in the 2008 crisis The
result is similar to the findings of Wangpen and Inthornma (2007) in that high income
customers had higher expectations towards the service It was possible that they had
more tendencies to be dissatisfied with the service failures The two researchers
concluded that passengers with different incomes were satisfied with the services at
different levels because they had different attitudes expectations and abilities to pay for
the service
Fifthly as it was found from this study that the highest score for the purpose of
travel was going on holiday (527) and the participants who were tourists rated the
assurance dimension at the highest level or the mean score of 353 (See Table 10) much
higher than the mean score of the whole group which was at 345 It was rather surprising
that the highest score for the travel purpose was not for business trips It is possible to
explain that this group spent for the travel cost on their own and they might want to make
sure that they chose the best service for themselves The result is parallel with Gabbie
and OrsquoNeill (1997) who examined customer satisfaction in the hotel sector using the
x x
44
SERVQUAL tool This study showed that the holiday guests who paid for
accommodation on their own rated assurance much higher than other dimensions It is
plausible to explain that passengers traveling on their own budget must make sure that
they already chose the service that was worth the money spent
However when analyzing the satisfaction on service quality of the participants
whose purpose of travel via TG was for business it was also found that this business
participants rated the high score for the tangibles dimension at the mean score of 340
compared with the average mean score of all groups of 334 Passengers who traveled on
business included government officials and state enterprise employees were major
customers of TG It was therefore interesting to find out from this study that their
satisfaction score in terms of tangibles or the appearance of physical factors such as
equipment facilities and personnel was above the average score of all groups Although
the score was not much higher the gap was bigger than that of the other RATER
dimensions as seen from the following information the passengers who traveled on
business trip showed their satisfaction on the reliability dimension at the mean score of
281 the assurance dimension at 347 the empathy dimension at 309 and the
responsiveness dimension at 270 while the average of all groups was at 280 345 307
and 269 respectively
The last point that the researcher wanted to point out is that this study revealed
that the participants who traveled more than 10 times for the last 12 months were lowest
in number (13) However it was interesting that these frequent flyers showed the high
rate of satisfaction with TGrsquos in-flight service quality The mean scores in all dimensions
showed the high rate of satisfaction (See Table 11) It is possible that passengers who
traveled very often via TG had high loyalty The brand loyalty made passengers happy in
every feature of service This result however contrasts with Ostrowski et al (1993) who
45
investigated service quality and customer loyalty in the commercial airline industry The
study examined whether the high levels of service quality existed in the US commercial
airline industry and how service quality could potentially lead to customer loyalty The
main results indicated that the levels of perceived service quality were below potential
and that customer loyalty to airlines was low It is plausible to say that the data of the two
studies were different The data collected on two air carriers in USA might have
different characteristics from the demographic information of Thai people and the number
of the participants in the two studies might differ However TG still needs to listen to the
voice of all passengers especially the frequent flyers Even if the number of this sample
group was few every customer is valuable for any firm Also it would be valuable to
implement a relevant strategy to expand this group of passengers since they had a positive
attitude for TG
Interestingly the findings from the last part of the questionnaire also showed that
the majority of the participants (946) showed their willingness to use TGrsquos service in
the future It can plausibly be explained that the participants were satisfied with TGrsquo
service quality at the moderate level ( 307) Their satisfaction with the five dimensions
of SERVQUAL was also moderate They might think that TG is a reliable airline that
they can depend on Thai passengers have confidence and trust in the service of Thai
cabin crew in terms of courtesy Also it is possible that they might not trust the low cost
airlinesrsquo service of the crew
There were only seven remarks on the in-flight service when the participants were
asked to freely give suggestions The tangible dimension problematic Passengers
pointed out about the small size of passengersrsquo seats and the quality of the air-
conditioning system One problem was on the responsiveness dimension which happened
when a passenger asked for a blanket but she was not offered indicating that some of the
x
46
cabin crewrsquos promptness to provide service was still not up to a standard Another
comment was on the flavor of the snacks Although this issue is not directly relevant to
the service it is worthwhile for TG to consider this problem
In conclusion the researcher found both strengths and weaknesses in TGrsquos service
quality Assurance was found the highest satisfaction in the participantsrsquo opinion TG
should maintain the service quality with a focus on this dimension On the other hand
the responsiveness and reliability dimensions were at the lowest satisfaction level among
the five dimensions The company should improve its service quality on these two
dimensions especially with regards to TGrsquos lsquoprompt servicersquo and lsquoproblem solvingrsquo
service to retain its passengers
53 Limitations of the study
This study has some limitations as follows
1 This study was limited to only one domestic route (Bangkok ndash Chiangmai)
Therefore the participants in this study were passengers who traveled only between these
two provinces The results of the study might differ if the study covered another route or
many more routes at the same time Consequently further studies can be conducted for
other domestic destinations such as Phuket and other big cities
2 The research participants were all Thai passengers It would be interesting to
study foreign passengersrsquo satisfaction on TGrsquos in-flight service quality
3 This study focused only on Parasuraman et al (1985)rsquos SERVQUAL
Instrument used to assess the service quality The results might differ if other instruments
were used
47
54 Recommendations for further studies
Further research should be undertaken to validate the results of this study The
researcher has found several opportunities to extend this study as follows
Survey on the lsquoresponsivenessrsquo dimensions
Responsiveness concerns the willingness or readiness of employees to provide
service such as timelines of service and prompt service This dimension was what the
passengers in this study were most concerned about because it was rated as the lowest
level of satisfaction Thus TG should find the countermeasure of how to increase the
level of passengersrsquo satisfaction in the responsiveness dimension
Assessment of the ground service quality
Since this research was conducted on on-board service quality further studies on
ground services such as a reservation or check-in service should be investigated in order
to integrate the results covering every sector of the airline service
Study on passengersrsquo attitude towards the service quality in other airlines
A study on the service quality of other airlines should be conducted in order to
obtain comparative data and find out reasons for their passengersrsquo behavior and attitude
consequently allowing TG to remedy any weak points and increase the number of new
passengers
REFERENCES
REFERENCES
Alegre J amp Pou L (2006) An analysis of the microeconomic determinants of travel
frequency Department of Applied Economics Universitat de les Illes Balears
Bojanic DC (1991) Quality measurement in professional service firms Journal of
Professional Service Marketing 7(2) 27-37
Bojanic D C amp Rosen L D (1994) Measuring service quality in restaurants An
application of the SERVQUAL model Journal of Hospitality Research 18(1)
3-14
Boontaganon W (2002) The study of service quality of fast-food restaurants in Bangkok
using SERVQUAL measurement Thesis MBA (Business Administration)
Bangkok Assumption University Photocopied
Buttle F (1996) SERVQUAL review critique research agenda European Journal of
Marketing 30(1) 8-31
CarmanJ M (1990) Consumer perceptions of service quality An assessment of the
SERVQUAL dimensions Journal of Retailing 69 33-35
Cheaosakul W (2004) Consumers perception of service quality a case study of Thai
Airways International Plc Thesis MBA Bangkok Assumption University
Photocopied
Fick RG amp Ritchie JRB (1991) Measuring service quality in the travel and tourism
industry Journal of Travel Research 30(2) 2-9
Fornell C (1992) A national customer satisfaction barometer the Swedish experience
Journal of Marketing 56 6-21
Gabbie O amp OrsquoNeill M (1997) SERVQUAL and the Northern Ireland hotel sector a
comparative analysis part 2 Managing Service Quality 17(1) 43-49
50
Gilbert DH (1999) Marketing connecting with customers (2nd
ed) Upper Saddle
River NJ Prentice Hall
Gilbert D amp Wong KCR (2002) Passenger expectations and airline services a
Hong Kong based study Surrey Management School Surrey University of
Surrey
Gitman LJ amp Carl DM (2005) The future of business the essentials Mason Ohio
South-Western College Pub
Grifin J (1995) Customer loyalty NY Lexington Book
Gronroos C (1978) A service-oriented approach to marketing of services European
Journal of Marketing 12(8) 588-601
Hennig-Thurau T amp Klee A (1997) The impact of customer satisfaction and
relationship quality on customer retention a critical reassessment and model
development Masterrsquos Project MA (Psychology amp Marketing) Hanover
University of Hanover
Heesawat C (2005) The opportunities and problems in making services more tangible
PhD Dissertation Bangkok Assumption University Photocopied
Juran JM amp Gryna FM (1974) Quality control handbook NY McGraw-Hill
Kholthanasep G (2001) A study of customerrsquos expectations and perceptions of service
quality delivery by first class hotels in Bangkok metropolitan area Thesis
MBA Bangkok Assumption University Photocopied
Kotler P amp Scheff J (1997) Standing room only strategies for marketing the
performing arts Boston Mass Harvard Business School Press
Kotler P (1997) Marketing management analysis planning and control (9th
ed) Upper
Saddle River NJ Prentice Hall
51
Kotler P Bowen J amp Makens J (1999) Marketing for hospitality and tourism (2nd
ed) NJ Prentice Hall
Kotler P (2000) Marketing management the millennium edition (10th
ed) NJ Prentice
Hall
Lages FL amp Fernandes CJ (2005) The SERVQUAL scale a multi-item instrument
for measuring service personal values Journal of Business Research 58(11)
1562-1572
Oberoi U amp Hales C (1990) Assessing the quality of the conference hotel product
London The Service Industries Journal 10(4) 700-722
Ostrowski PL Orsquobrien TV amp Gordon GL (1993) Service quality and customer
loyalty in the commercial airline industry Journal of Travel Research 32(2)
16-24
Palin M (1996) Flight catering transportation and loading (2nd
ed) London Longman
Group Limited
Panittumrong P (2004) The consumerrsquos opinion towards Clark Hatch Fitness Center
Master Project MBA (Management) Bangkok Graduate School
Srinakharinwirot University Photocopied
Parasuraman A Zeitmal VA amp Berry LL (1985) A concept model of service
quality and its implications for future research Journal of Marketing 49 41-50
Parasuraman A Zeitmal VA amp Berry LL (1988) SERVQUAL a multiple item
scale for measuring customer perceptions of service quality Journal of
Retailing 64(1) 64
Parasuraman A amp Berry LL (1991) Marketing services competing through quality
NY The Free Press
52
Pirsig RM (1987) Zen and the art of motorcycle maintenance an inquiry into values
(Mass Market Paperback) NY Bantam Books
Poonlarbtawee K (1987) Statistics for research Bangkok Physic Center Printing
Reid RD amp Bojanic DC (2001) Hospitality marketing management NJ John Wiley
amp Son Inc
Rueangthanakiet P (2008) Memberrsquos satisfaction of fitness service quality a case study
of California Wow Xperience Plc Masterrsquos Project MA (Business English for
International Communication) Bangkok Graduate School Srinakharinwirot
University Photocopied
Sachukorn S (2006) Reception and service excellence Bangkok Saitharn
Schiffman LG amp Kanuk LL (1994) Consumer behavior (5th
ed) London Prentice-
Hall International
Somwang C (2008) An assessment of passengersrsquo views of service quality in Thai low
cost carriers Inter Program MA (Communicative English) Bangkok
Ramkhamhaeng University Photocopied
Suriya K (2005) Airline market segments after low cost airlines in Thailand passenger
classification using neural networks and logit model with selective learning
Faculty of Economics Chiangmai Chiangmai University
Suthirungkul N (2003) The study of customer expectations and perceptions of service
quality of the Clark Hatch fitness center of Silom road branch Bangkok Thesis
MBA (Business Administration) Bangkok Assumption University
Photocopied
Thai Airways International (2008) Traffic program information (Introduction of summer
200809) Bangkok THAI Printing Office
53
Thai Airways International (2009) Traffic program information (Introduction of winter
200910) Bangkok THAI Printing Office
THAI AIRWAYS INTL Official 4-Star Ranking of Product and Service Quality (2009
October) Retrieved February 14 2010 from
httpwwwairlinequalitycomAirlinesTGhtml
Travel Planning (2010 February 12) Retrieved February 12 2010 from
httpwwwsuite101comlessoncfm1848818243
Wangpen N amp Inthornma S (2007) Membersrsquo satisfaction in fitness centers in
Bangkok Thesis MA (Hotel and Tourism Management) Bangkok Graduate
School Naresuan University Photocopied
Zeithaml VA amp Bitner MJ (2000) Services marketing (2nd
ed) NY McGraw Hill
Zeithaml VA Parasuraman A amp Berry LL (1990) Delivering quality service
balancing customer perceptions and expectations NY Free Press
APPENDICES
55
APPENDIX A
แบบทดสอบความพงพอใจของผโดยสารการบนไทย
เรยนทานผโดยสารทเคารพ กระผมนาย วลาศ มนคงวณชกล พนกงานตอนรบสายการบนไทย และนกศกษาปรญญาโท หลกสตรภาษาองกฤษธรกจเพอการสอสารนานาชาต มหาวทยาลยศรนครนทรวโรฒ ไดจดท าแบบสอบถามนเพอเปนสวนหนงของการส ารวจความพงพอใจของผโดยสารทมตอคณภาพงานบรการ เทยวบนภายในประเทศของการบนไทย โดยมงหวงทจะน าขอมลทไดรบจากการส ารวจมาเปนประโยชนตอการสงเสรมสนบสนนการปฏบตงานใหเกดประสทธผล จงขอความกรณาจากทานในการตอบแบบสอบถามทกขอตามขอเทจจรงและความเหนของทาน ขอมลทงหมดเปนความลบ จะใชเพอการวจยเทานน และขอขอบคณในความรวมมอของทาน
helliphelliphelliphelliphelliphelliphelliphelliphelliphelliphelliphelliphelliphelliphelliphelliphelliphelliphelliphelliphelliphelliphelliphelliphelliphelliphelliphelliphelliphelliphellip
ค าชแจง โปรดท าเครองหมาย (x) ลงในชองวาง ทตรงกบค าตอบของทาน
ตอนท 1 ขอมลทวไป
1 เพศ ( ) ชาย ( ) หญง 2 อาย ( ) ตากวา 20 ป ( ) 21-40 ป ( ) 41-60 ป ( ) 60 ปขนไป 3 อาชพ ( ) ขาราชการ รฐวสาหกจ ( ) พนกงานบรษท ( ) ธรกจสวนตว ( ) นกเรยน นกศกษา ( ) เกษยณ ( ) อนๆ 4 รายได เดอน ( ) ตากวา 20000 ( ) 20001- 40000 บาท ( ) 40001- 60000 บาท ( ) 60001 บาท ขนไป 5 จดประสงคการเดนทาง ( ) ธรกจ ( ) พกผอน ( ) เยยมเยยนญาตมตร เพอนฝง ( ) อนๆ 6 ความถในการเดนทางกบการบนไทย (ในรอบ 12 เดอน) ( ) ครงแรก ( ) 2-3 ครง ( ) 4-10 ครง ( ) 10 ครงขนไป
56
ตอนท 2 ความพงพอใจของทานตอการบรการ (5 = เหนดวยอยางยง 4= เหนดวย 3= ปานกลาง 2=ไมเหนดวย 1=ไมเหนดวยอยางยง)
ระดบความพงพอใจ
การบรการของการบนไทย 5 4 3 2 1 1 เมอเจาหนาทสญญาทจะใหบรการทานในเรองใด จะทาตามนนเสมอ
2 การใหบรการของเจาหนาท สรางความเชอมนใหกบทาน
3 อปกรณบนเครองบนมรปแบบททนสมย (เชน จอทว ทนง)
4 บรษทฯกาหนดเวลาการใหบรการบนเครองเหมาะสม
5 เจาหนาทใหบรการทดนบตงแตกาวแรกบนเครอง
6 เจาหนาทมความตงใจดทจะชวยเหลอทาน เมอทานมปญหา
7 ทานรสกปลอดภยเมออยบนเครองบน
8 สงอานวยความสะดวกตางๆบนเครอง มรปลกษณทดงดดใจ (เชน กลองอาหาร) 9 เจาหนาทไมเขาใจความตองการของทาน ในบางกรณ
10 เจาหนาทไมไดระบเวลาในการใหบรการผโดยสารบนเครองทแนนอน 11 เจาหนาทพยายามทางานโดยไมใหเกดขอผดพลาด
12 เจาหนาทปฎบตงานดวยความสภาพเสมอ
13 เจาหนาทแตงกายเรยบรอยและดด
14 บรษทฯใหความเอาใจใสกบผโดยสารเปนรายบคคล
15 บางครงเจาหนาทไมเตมใจทจะใหบรการผโดยสาร
16 บรษทใหบรการทานตรงเวลาทกาหนด
17 เจาหนาทสามารถใหขอมลเกยวกบการเดนทางไดอยางถกตอง
18 เอกสารของบรษทฯทเกยวของกบการบรการ (เชน แผนพบ นตยสาร) มขอมลครบถวน และรปแบบสวยงาม 19 เจาหนาทใหบรการทานดวยสมผสความเปนไทย
20 เจาหนาทใหบรการผโดยสารอยางรวดเรว
ทานจะกลบมาใชบรการของการบนไทยตอไป จะใชบรการตอไป ไมใชบรการ
ขอเสนอแนะ_______________________________________________________
_____________________________________________________________ ขอบพระคณอยางสงในความรวมมอของทาน
57
APPENDIX B
Questionnaire
Dear Honorable Passengers
My name is Wilas Mankongvanichkul -- a THAI cabin crew and masterrsquos student of business English
for international communication program Srinakharinwirot University This questionnaire is about
an exploration of passengersrsquo satisfaction with service quality of Thai Airways International (TG)rsquos
domestic flights Data gained will be utilized for THAI service operation Please kindly complete the
questionnaire The data gained will be kept confidential and used for the research study only Your
kind cooperation is greatly appreciated
helliphelliphelliphelliphelliphelliphelliphelliphelliphelliphelliphelliphelliphelliphelliphelliphelliphelliphelliphelliphelliphelliphelliphelliphelliphellip
Direction Please mark (x) your answer in the space provided
Part 1 Personal Information
1 Gender
( ) Male ( ) Female
2 Age
( ) Under 20 years ( ) 21-40 years
( ) 41-60 years ( ) Above 60 years
3 Occupation
( ) Government official State enterprise employee
( ) Business employee
( ) Business owner ( ) Student
( ) Retiree ( ) Others
4 Monthly income
( ) Up to 20000 baht ( ) 20001- 40000 baht
( ) 40001 ndash 60000 baht ( ) 60001 baht and above
5 Purpose of travel
( ) Business trips ( ) Holidays
( ) Visits ( ) Others
6 Frequency in traveling with THAI (during the last 12 months)
( ) First time ( ) 2-3 times
( ) 4-10 times ( ) More than 10 times
58 Part 2 Your satisfaction with the service
(5=Strongly Agree 4= Agree 3=Uncertain 2=Disagree 1= Strongly Disagree)
Level of Satisfaction
The Service of THAI 5 4 3 2 1
1 When cabin crew promise to do something by a
certain time they do so
2 You can trust THAI cabin crew
3 TG has modern on board equipment
(such as TV screen passengersrsquo seats)
4 TG has operating hours on board convenient to all
passengers
5 Cabin crew offer good services upon boarding
6 When passengers have a problem cabin crew show a
sincere interest in solving it
7 Passengers feel safe on-board
8 The physical facilities of TG are visually appealing
(such as meal boxes)
9 Cabin crew do not understand your special needs in
some cases
10 Cabin crew do not tell passengers exactly when
services will be offered
11 Cabin crew insist on error-free records
12 Cabin crew are consistently courteous to passengers
13 Cabin crew are well-dressed and neat in appearance
14 TG gives passengers individual attention
15 Cabin crew are not always willing to help passengers
16 TG provides its services at the time it promises to
do so
17 Cabin crew are knowledgeable to answer passengers
travel-related questions
18 Documents about service are informative and appealing
(such as pamphlets and magazines)
19 Services provided have a ldquoThai Touchrdquo
20 Cabin crew are quick to respond to passengersrsquo requests
Will you come back for TGrsquos service Yes No
Suggestions________________________________________________________________
________________________________________________________________________ Thank you very much for your kind cooperation
59
APPENDIX C
Questionnaire Specification Based on SERVQUAL measurement (Parasuraman et al 1985)
Passengers satisfaction level toward service quality factors
No Service Quality Features (RATER)
Str
on
gly
ag
ree
Ag
ree
Un
certa
in
Dis
ag
ree
Str
on
gly
Dis
ag
ree
(5) (4) (3) (2) (1)
1 When cabin crew promise to do something by a certain time they do so Reliability
2 You can trust THAI cabin crew Assurance
3 TG has modern on board equipment (such as TV screen passengersrsquo seats) Tangibles
4 TG has operating hours on board convenient to all passengers Empathy
5 Cabin crew offer good services upon boarding Responsiveness
6 When passengers have a problem cabin crew show a sincere interest in solving it
Reliability
7 Passengers feel safe on-board Assurance
8 The physical facilities of TG are visually appealing (such as meal boxes) Tangibles
9 Cabin crew do not always understand your special needs in some cases Empathy
10 Cabin crew do not tell passengers exactly when services will be offered Responsiveness
11 Cabin crew insist on error-free records Reliability
12 Cabin crew are consistently courteous to passengers Assurance
13 Cabin crew are well-dressed and neat in appearance Tangibles
14 TG gives passengers individual attention Empathy
15 Cabin crew are not always willing to help passengers Responsiveness
16 TG provides its services at the time it promises to do so Reliability
17 Cabin crew are knowledgeable to answer passengers travel-related questions Assurance
18 TGs documents associated with services are informative and appealing (such as pamphlets and magazines)
Tangibles
19 Services provided have a ldquoThai Touchrdquo Empathy
20 Cabin crew are quick to respond to passengersrsquo requests Responsiveness
VITAE
61
VITAE
Name Wilas Mankongvanichkul
Date of Birth February 14 1980
Place of Birth Bangkok
Address 688 Soi Phaholyothin 32 Chankasem Jatuchak
Bangkok 10900
Present Occupation Cabin Crew
Thai Airways International Public Company Limited
89 Vibhavadi Rangsit Road Bangkok 10110
Education Background
2010 Master of Art (Business English for International
Communication)
Srinakharinwirot University
2001 Bachelor of Business Administration Bangkok University
1997 High School Saint Dominic School
- Cover
- Abstract
- Chapter 1
- Chapter 2
- Chapter 3
- Chapter 4
- Chapter 5
- Bibliography
- Appendix
- Vitae
-
22
end of the on-board service while the plane was approaching Chiangmai its destination
All the 150 completed questionnaires were obtained as planned
32 Research Instrument
A questionnaire in Thai was used for data collection The questionnaire was
divided into three parts The first part was about the respondentsrsquo demographic profile
since consumersrsquo needs preferences and personalization are often associated with
demographic factors (Kotler 2000) Six demographic characteristics related to in-flight
service (Cheosakul 2004) consisting of gender age occupation monthly income
purpose of travel and travel frequency with THAI were demographic issues of the survey
The second part comprised questions about passengersrsquo satisfaction with the service
during the flight This part of the questionnaire was based on the SERVQUAL
instrument for measuring customersrsquo satisfaction in five dimensions of service reliability
assurance tangibles empathy and responsiveness (Parasuraman et al 1985) The last
part comprised a question and a blank space provided for suggestions on TGrsquos service
quality
33 Procedures of the Study
The questionnaire was initially approved by the researcherrsquos masterrsquos project
advisor and two specialists a TG in-flight service manager and a SWU lecturer Then a
pilot study was conducted to ten passengers to check for content reliability the
appropriateness of the number of questions and language used in the questionnaire As
the researcher included all the ten flights of TGrsquos Bangkok - Chiangmai route in the
study the tried-out questionnaire was randomly distributed to ten TG passengers (5 males
and 5 females) on each flight of the aforementioned route on the same day in February
23
2010 Also since this study was about onboard service the questionnaire was distributed
to the participants after the in-flight service was completed and before the plane landed
After that the questionnaire was adjusted and prepared for the actual survey
The revised questionnaire was eventually distributed to 150 participants in ten
consecutive days in early March 2010 Fifteen passengers in each Bangkok -
Chiangmai flight per day were randomly asked to fill out the questionnaire after the
completion of in-flight service
The plan below showed the ten flights of for the survey each flight for a day to
make sure that the data gained were reliable
BKK-CNX Flight (TG) Flight Schedule (Departure-Arrival)
TG100 0615-0725
TG102 0750-0910
TG104 0910-1030
TG106 1020-1140
TG110 1250-1400
TG112 1400-1510
TG114 1540-1650
TG116 1715-1825
TG120 1900-2010
TG122 2130-2240
34 Data Analysis
The data acquired from the questionnaires were analyzed in three sections
demographic profile of passengers level of passengersrsquo satisfaction with TGrsquos service
and the relationship between demographic profile and passengersrsquo satisfaction based on
24
Likert scale The 5-point Likert scales were used to rate the level of satisfaction as shown
in Table 1 below
Table 1 Intervals of Satisfaction Level (Poonlarbtawee 1987)
The interpretation of the scales in this study is as follows
Rating
Scale
Level of
Agreement Disagreement
Satisfaction
Level
Mean Score
5 Strongly agree Excellent 451-500
4 Agree Good 351-450
3 Uncertain Average 251-350
2 Disagree Fair 151-250
1 Strongly disagree Poor 100-150
The researcher picked up lsquothe high grouprsquo and lsquothe low grouprsquo of each
SERVQUAL dimension to present the relationship between the participantsrsquo
demographic profile and their satisfaction As the data gained from the highest number of
the participants or the high group was the major point that the researcher relied on focus
was on the majority opinion At the same time the data gathered from the lowest number
of the participants or the low group should not be overlooked because each and all
passengers are important for TG and in the high competitive airline market it is necessary
to retain each and every passenger so as to grow far in the aviation business
The results were presented in terms of percentages and mean scores in the form of
tables and a bar chart These fundamental statistic methods were proper in this study
25
because percentages and mean scores are considered the basic statistics used for data
analysis and presentation Also the general public can easily understand the
interpretation of the data Another reason was that the sample group of this study
comprised only 150 TG passengers The researcher therefore decided to apply the
aforementioned statistics in this research Discussion of the results was also offered
CHAPTER FOUR
FINDINGS
This chapter describes the findings of the study consisting of the demographic
data of the participants level of their satisfaction with TGrsquos service quality relationship
between the demographic data and five dimensions of SERVQUAL instrument and the
uncovers to the last question on the questionnaire including suggestion
41 Demographic Data
The demographic data of TGrsquos research participants in terms of age occupation
monthly income purpose of travel and frequency of travel are presented in Tables 2- 6
below
Table 2 Participantsrsquo Age
Age No of Participants Percentage ()
Under 20 years
21-40 years
41-60 years
Above 60 years
8
85
45
12
53
567
300
80
Total 150 100
Regarding the age group the highest number of the passengers was 20-40 years
old or 567 30 of them were 46-60 years old and 8 were above 60 years old Only
53 were under 20 years old
27
Table 3 Participantsrsquo Occupation
Occupation No of Participants Percentage ()
Government official State enterprise employee
Business employee
Business owner
Student
Retiree
Others
22
63
37
13
9
6
147
420
247
86
60
40
Total 150 100
In terms of occupation the highest number of the participants was business
employees (42) followed by business owners (247) government officials or state
enterprise employees (147) students (86) retirees (6) and other occupations (4)
respectively
Table 4 Monthly Income
Monthly income (baht) No of Participants Percentage ()
Up to 20000
20001- 40000
40001 - 60000
60001 and above
58
72
11
9
386
480
74
60
Total 150 100
For the income the highest number of the participants earned 20001-40000 baht
monthly (48) followed by those with a monthly income of up to 20000 baht (386)
28
of 40001-60000 baht monthly (64) and of 60001 baht and above monthly was the
lowest (6)
Table 5 Purpose of Travel
Purpose of travel No of Participants Percentage ()
Business trips
Holidays
Visits
Others
41
79
27
3
273
527
180
20
Total 150 100
Regarding the purpose of travel the highest number of the passengers traveled via
TG on holidays (527) followed by those who traveled on business trips (273)
Meanwhile those who made a visit were at 180 and who traveled with other purposes
were at 2
Table 6 Frequency of Travel
Frequency in traveling with THAI
(during the last 12 months)
No of Participants Percentage ()
First time
2-3 times
4-10 times
More than 10 times
39
99
10
2
260
660
67
13
Total 150 100
29
The last demographic data derive from the frequency in traveling with THAI
66 of the participants indicated that they traveled 2-3 times during the last 12 months
26 traveled for the first time while 67 for 4-10 times and 13 for more than 10
times during the last 12 months
In conclusion the demographic data shown in the tables above indicated that lsquothe
high grouprsquo comprised the following characteristics The age group of the majority
number of the participants ranged from 21-40 years (567) Most of them were business
employees (42) The highest number of the passengersrsquo monthly income was around
20000 ndash 40000 baht per month (48) The majority of the passengers traveled on
holidays (527) by TG 2-3 times in the past 12 months (66)
Meanwhile lsquothe low grouprsquo was found having the following characteristics The
lowest number of the research participants was under 20 years old or 53 Only 47 of
the participants had other kinds of occupation which were not indicated on the
questionnaire while only 6 of the participants earned 60001 baht or above monthly
2 of the participants traveled on other purposes besides those shown on the
questionnaire Lastly 13 of the passengers were those who traveled by TG more than
10 times in the past 12 months
42 Level of Passengersrsquo Satisfaction
Figure 1 below is the conclusion from the second part of the questionnaire The
150 participants were asked to rate the level of service quality that they perceived from
the TGrsquos domestic flights on Bangkok - Chiangmai route The questionnaire was divided
into five dimensions of SERVQUALrsquos (Parasuraman et al 1985) service quality which
comprised reliability assurance tangibles empathy and responsiveness The scales 1 to 5
ranged from lsquostrongly disagreersquo to lsquostrongly agreersquo
30
0
5
Reliability Assurance Tangibles Empathy Responsiveness
280
345 334307
269
SERVQUAL Dimension
Figure 1 Overall Level of Participants Satisfaction
Mean scores
Figure 1 shows the average mean score of all 150 passengersrsquo satisfaction on five
dimensions of service quality ranging from the mean scores of 345 to 269 The results
revealed that the most important service quality dimension for the whole samples group
of passengers was assurance ( 345) followed by tangibles ( 334) empathy ( 307)
reliability ( 28) and responsiveness ( 269) respectively The overall average mean
was 307
43 Passengersrsquo Satisfaction Level in Relationship with Their Demographic Data
This section shows the relationship between the demographic data (age
occupation monthly income purpose of travel and travel frequency) of the participants
and their satisfaction with the service quality of TGrsquos in-flight service
The researcher focused on each category of demographic characteristics of two
major groups a group with the highest score and the other with the lowest score In fact
the most important data were the majority opinion of the sample group In other words
for this study it was lsquothe high grouprsquo However the researcher as a TG cabin crew gave
importance to the low group as well since each and every passenger is significant to TG
x
x x x
x x
31
business particularly in the high competitive market of airline business The researcher
was interested to know what the passengers in the lsquolow grouprsquo thought about the in-flight
service and what their feedback was
The following tables (Tables 7-11) illustrate the relationship between each
dimension of the demographic data and the SERVQUAL service assessment tool and the
following symbols are applied in the tables below
lsquoNrsquo means the number of the participants
lsquo rsquo means the mean score
lsquoThe high grouprsquo means the group that comprises the highest number of participants
lsquoThe low grouprsquo means the group that comprises the lowest number of participants
Table 7 Relationship between the Participantsrsquo Age and their Satisfaction with In-flight
Service
SERVQUALrsquoS
RATER
Average
Mean Score
of All Groups
The High Group
(Age 20-40 Yrs Old)
N = 85567
The Low Group
(Age Under 20 Yrs Old)
N = 853
Mean Score of Each Group
Reliability 280 278 270
Assurance 345 378 335
Tangibles 334 331 328
Empathy 307 309 314
Responsiveness 269 267 290
Table 7 reveals the connection between the participantsrsquo age and the five
dimensions of the SERVQUAL instrument The high group had higher mean scores for
x
32
three dimensions than the low group In other words the participants with an age range
of 20-40 years were more satisfied with TGrsquos service quality in terms of reliability
assurance tangibles than those who were under 20 years old Meanwhile the low group
had higher mean scores for two dimensions than the high group This means the
participants who were lower than 20 years old were more satisfied with the in-flight
service in terms of empathy and responsiveness than those whose ages ranged from 20-40
years
Interestingly it was found that both groups have a lower mean score for the
reliability dimension ( 278 and 270) than the average mean score of all the age groups
in this study ( 28)
Table 8 Relationship between the Participantsrsquo Occupation and their Satisfaction with In-
flight Service
SERVQUALrsquoS
RATER
Average
Mean Score
of All Groups
The High Group
(Business Employee)
N = 63420
The Low Group
(Others)
N = 640
Mean Score of Each Group
Reliability 280 275 284
Assurance 345 347 348
Tangibles 334 331 336
Empathy 307 310 305
Responsiveness 269 264 277
Table 8 illustrates the connection between the participantsrsquo occupations and the
five dimensions of the SERVQUAL instrument The low group had higher mean scores
x
x
33
for almost all the dimensions of SERVQUALrsquos RATER than the high group except for
one dimension In other words the participants who worked as business employees were
less satisfied with TGrsquos service quality in terms of reliability assurance tangibles and
responsiveness than those whose occupations were not specified in the questionnaire
Empathy was the only dimension of service quality that the participants who were in the
high group were satisfied with
Table 9 Relationship between the Participantsrsquo Income and their Satisfaction with In-
flight Service
SERVQUALrsquoS
RATER
Average
Mean Score
of All Groups
The High Group
(20001-40000)
N = 72480
The Low Group
(60001 and above)
N = 960
Mean Score of Each Group
Reliability 280 273 285
Assurance 345 349 350
Tangibles 334 332 321
Empathy 307 301 325
Responsiveness 269 262 273
Table 9 indicates the connection between the participantsrsquo monthly income and
the five dimensions of the SERVQUAL instrument The low group had higher mean
scores for almost all the dimensions of RATER than the high group except for one
dimension In other words the participants who earned monthly income of 20001 ndash
40000 baht were less satisfied with TGrsquos service quality in terms of reliability assurance
empathy and responsiveness than those who earned monthly income of 60001 baht and
34
above The tangibles dimension was the only service quality issue that the participants
who were in the high group were satisfied with
Table 10 Relationship between the Participantsrsquo Purpose of Travel and their Satisfaction
with In-flight Service
SERVQUALrsquoS
RATER
Average
Mean Score
of All Groups
The High Group
(Holidays)
N = 79527
The Low Group
(Others)
N = 320
Mean Score of Each Group
Reliability 280 279 285
Assurance 345 353 349
Tangibles 334 335 338
Empathy 307 308 312
Responsiveness 269 270 275
Table 10 reflects the connection between the participantsrsquo purpose of travel and
the five dimensions of the SERVQUAL instrument The low group had higher mean
scores for almost all the dimensions than the high group except for one dimension In
other words the participants who traveled on holidays were less satisfied with TGrsquos
service quality in terms of reliability tangibles empathy and responsiveness than those
whose purpose of travel were not specified in the questionnaire Assurance was the only
dimension of service quality that the participants who were in the high group were
satisfied with
35
Interestingly it was found that both groups has a higher satisfaction level for the
assurance tangibles empathy and responsiveness dimensions than the average mean
scores of the whole sample group
Table 11 Relationship between the Participantsrsquo Frequency of Travel with THAI and their
Satisfaction with In-flight Service
SERVQUALrsquoS
RATER
Average Mean
Score of All
Groups
The High
Group
(2-3 timesyear)
N = 99660
The Low Group
(more than 10
timesyear)
N = 213
Mean Score of Each Group
Reliability 280 281 295
Assurance 345 346 360
Tangibles 334 335 343
Empathy 307 308 321
Responsiveness 269 270 292
Table 11 presents the connection between the participantsrsquo frequency of travel
with THAI and the five dimensions of the SERVQUAL instrument The low group had
higher mean scores for all the dimensions of RATER than the high group In other
words the participants who traveled 2-3 times in the last 12 months were less satisfied
with TGrsquos service quality in terms of reliability assurance tangibles empathy and
responsiveness than those whose frequency of travel were more than 10 times in the last
12 months
36
Interestingly it was found that both groups has a higher satisfaction level for all
the five RATER dimensions than the average mean scores of the whole sample group in
this study
44 Other Comments
The last part of the questionnaire was designed to ask whether the participants
would continue using TGrsquos service The findings disclosed that 142 participants or
946 indicated that they would while 8 of them or 54 declined
Also at the end of the questionnaire there was a blank space for the participants to
freely express their own ideas and suggestions on TGrsquos service However only 7
participants or 46 gave suggestions regarding the in-flight service Four of the
participants were dissatisfied with the flavor of the snacks provided on board One
complained that it was not cool enough in the cabin while one was upset for not being
granted for a request for a blanket The last one commented that the passengerrsquos seat was
not comfortable
In summary the passengersrsquo satisfaction level of the service quality in connection
with their demographic data was introduced Five out of the six demographic
characteristics the participantsrsquo age occupation monthly income purpose of travel and
frequency of travel were analyzed in connection with the five dimensions of SERVQUAL
instrument reliability assurance tangibles empathy and responsiveness It was observed
that there were some connection between these two matters in various ways as earlier
discussed Lastly it was found that one hundred and forty-two participants would
continue using TGrsquos service while the rest refused Only seven of all the participants or
46 gave some comments on the open-ended suggestion part
CHAPTER FIVE
CONCLUSION AND DISCUSSION
This chapter presents the conclusion discussion limitations of the study and
recommendations for further studies
51 Conclusion
This research aimed to examine the service quality provided by Thai Airways
International on its domestic flights One hundred and fifty passengers who traveled by
TG on the Bangkok - Chiang Mai route were the research participants The SERVQUAL
instrument was used as an instrument for data collection in the survey This instrument
was based on five determinants proposed by Panasuraman etal (1985) in terms of
reliability assurance tangibles empathy and responsiveness This research was also
conducted on the demographic characteristics comprising gender age occupation
monthly income purpose of travel and frequency in traveling and the relationship of these
characteristics except the gender with the passengersrsquo satisfaction with TGrsquos in-flight
service quality The questionnaires were distributed in early March 2010
The results showed that all the participantsrsquo satisfaction based on the five
dimensions was at the average level The highest level of passengersrsquo satisfaction was
placed on the assurance dimension followed by tangibles and empathy dimensions
accordingly The two lowest levels of the passengersrsquo satisfaction were placed on the
responsiveness and reliability dimensions
In addition a summary of the demographic characteristics showed that the high
group or the group with the highest number of participants was business employees The
highest number of the participants was between 21-40 years old The highest number of
38
the participantsrsquo income ranged from 20000 ndash 40000 baht monthly Also the high
grouprsquos purpose of travel was to go on holiday Lastly the highest number of the
participants traveled via TG only 2-3 times during the past 12 months
Meanwhile the low group or the group with the lowest number of participants
was passengers with other kinds of occupations which were not specified on the
questionnaire The low group of the participants was under 20 years old The low group
of the participantsrsquo income ranged from 60001 baht monthly or higher Also the low
group revealed that they traveled via TG for other purposes which were not indicated on
the questionnaire Lastly the passengers who traveled via TG more than 10 times during
the past 12 months belonged in the low group
It has also been discovered that as a whole both groups the high and low groups
were in the same direction in their satisfaction with the five dimensions of service quality
The two groups were satisfied with the service quality dimensions in terms of assurance
at the highest level followed by tangibles empathy reliability and responsiveness
respectively
However when analyzing each demographic characteristic the participants who
were under 20 years old rated the responsiveness dimension higher than the reliability
dimension Also for those participants whose income was around 60001 or higher the
empathy dimension was rated higher than the tangibles Regarding the occupation
business people were satisfied with the reliability and responsiveness dimensions at a
very low level Meanwhile the participants who traveled via TG on their holidays rated
the assurance dimension at a very high level Lastly frequent fliers who traveled by
THAI more than 10 times were most satisfied with TGrsquos service since they rated all
RATER aspects highly
39
52 Discussion
The findings have revealed the answers to the research questions First the
demographic data of the participants gender age occupation monthly income purpose
of travel and frequency of travel were shown Second the level of the passengersrsquo
satisfaction toward the service quality on Thai Airways Internationalrsquos domestic flights in
terms of the SERVQUAL instrument (Parasuraman et al 1985) reliability assurance
tangibles empathy and responsiveness was disclosed Also the results about the
relationship between the passengersrsquo satisfaction and their demographic data were pointed
out
The results of the survey indicated that out of the five dimensions assurance was
rated at the highest level ( 345) followed by tangibles ( 334) and empathy ( 307)
(See Figure 1) In addition passengers rated their highest satisfaction with the assurance
dimension which included cabin crewrsquos job knowledge their courtesy confidence in their
service ability and safety while traveling It may be because TG cabin crew are well-
trained prior to their actual service work on board This can also ensure passengersrsquo
safety Particularly the safety and security features have been the most concerns of
airline passengers since the 9-11 incidents in New York USA This is why most
customers rated their highest satisfaction with the assurance dimension (Carman 1990)
The findings of this study are also consistent with those of Fick and Ritchie (1991)
who studied the operation of the SERVQUAL instrument in three major tourism sectors
airlines restaurants and ski area services It was revealed that the most important
dimensions of the service were assurance and tangibles If companies were unable to
inspire trust and confidence in their customers and the tangibles are not impressive it
would be difficult for them to achieve a high level of customerrsquos satisfaction (Sachukorn
2000)
x x x
40
Responsiveness is often found as the lowest level of satisfaction among customers
in the service industry It is plausible that the staff were too busy to provide prompt and
good service (Kholthanasep 2001) In this study the results revealed that the
responsiveness dimension was rated at the lowest score ( 269) among the five
dimensions followed by the reliability ( 280) dimension It was highly possible that the
passengersrsquo dissatisfaction occurred when passengers did not receive prompt service from
TG when they needed help
Prompt service is an important factor of customersrsquo expectation Customers
generally rate the service as poor when the speed of service does not meet their
expectations (Kholthanasep 2001) Bojanic and Rosen (1994) examined the nature of the
association between service quality as perceived by consumers and its determinants by
applying SERVQUAL in a restaurant setting They found that customers rated
responsiveness as the lowest satisfaction in their studies Zeithaml et al (1990) explained
that the responsiveness dimension in the SERVQUAL was willingness to help customers
and provide prompt service As the responsiveness dimension in this research comprised
prompt service willingness on-time service and quick response therefore it will be
beneficial to TG if the company can ensure that the service provided by its cabin crew
especially the willingness to help passengers and to provide prompt service meet
passengersrsquo satisfaction
Regarding the relationship between the participantsrsquo demographic data and their
satisfaction with the service quality there are many points of interests to be discussed as
follows
Firstly regarding the relationship of the passengersrsquo satisfaction with the service
and their age those who were under 20 years old rated satisfaction with the
responsiveness dimension ( 290) higher than the reliability dimension ( 270) (See
x
x
x x
41
Table 7) It was possible that young passengers usually gave priority to the dimension of
care and service when compared with that of the service providersrsquo accurate and
dependable manner (Panittumrong 2003) In addition young customers had less
experience in a service and it was difficult to compare the current service with the past
experience consequently they were more satisfied with the service provided than senior
customers
Another point was raised about the participantsrsquo age The study revealed that the
number of the high group with the age range of 21- 40 was at 567 However that of
the second highest group of the participants with the age range of 41-60 was at 30
which was rather high This latter grouprsquos level of satisfaction on the service quality was
also close to the average mean score It was found that the average mean score of the
reliability dimension was 280 while that of the second highest group was 281 the
average mean score of the assurance dimension was 345 while that of the second highest
group was 347 the average mean score of the tangibles dimension was 334 while that of
the second highest group was 335 the average mean score of the empathy dimension and
that of the second highest group was rated at 307 equally and the average mean score of
the responsiveness was 269 while that of the second highest group was 271 In sum if
consider the two groups in terms of the participantsrsquo age one of the high group and the
other with the second high group the results confirmed that the satisfaction level of the
majority of passengers was at the above average level
Secondly regarding the relationship between the participantsrsquo satisfaction and
their occupation business employees who were found at the highest number (42) had
very low satisfaction with the service quality in terms of reliability ( 275) and
responsiveness ( 264) while the mean scores of the whole sample group for these two
dimensions were at 280 and 269 respectively (See Table 8) The findings strongly
x
x
42
correlated with that of Cheaosakul (2004) who studied the consumersrsquo perception of
airline service quality with a focus on occupations It was found that the group of
business employees had the highest score on expectations Cheaosakul (2004)rsquos study
also revealed that business employees did not frequently travel compared with people of
other occupations such as tourists It was found in this particular study that the number of
the participantsrsquo purpose of travel with TG for business trips was only at 273 (See
Table 5) while the highest number of the participants went on holiday was at 52
Cheaosakul (2004) indicated that business people therefore had high expectations than
the other group who traveled more frequently
Thirdly an even more interesting point was raised when comparing the level of
satisfaction of the passengers who were government officials or state enterprise
employees and business owners Although passengers who were government officials or
state enterprise employees came third in terms of participants they are considered
valuable customers of TG since according to the governmentrsquos policy they are required
to take only TG which is a national airline whenever they travel by air There are few
exceptions though However it is almost impossible for Thai government officials who
travel on business trip and are funded by the governmentrsquos budget to fly with other
airliners It was found from this study that government officials were less satisfied with
TG quality service in terms of reliability ( 277) and responsiveness ( 264) than the
average level of which the mean scores of the two dimensions were at 280 and 269
respectively
Another issue of discussion regarding the participantsrsquo occupation business
owners came second It was observed that business owners rated the reliability ( 282)
and responsiveness dimensions ( 270) higher than the average scores of all groups (See
Table 8) It is possible that business owners had more positive attitude with TGrsquos service
x x
x
x
43
than the other groups TG seemed popular among business owners and they were the
most important group of customers This was supported by Suriya (2005) who studied
airline market segments after the launch of the low cost airlines in Thailand Suriya
(2005) identified that merchants or business owners were the major group of customers in
the full-service airline market
Fourthly regarding the monthly income of the research participants of the low
group passengers who earned an income of around 60001 or higher rated the empathy
( 325) dimension higher than tangibles ( 321) dimension (See Table 9) This may
be because the high income passengers sensitively felt that the facilities and equipment
found on their domestic route looked quite old-fashioned due to TGrsquos cost reduction The
company saved costs after the Suvannabhumi airport was closed in the 2008 crisis The
result is similar to the findings of Wangpen and Inthornma (2007) in that high income
customers had higher expectations towards the service It was possible that they had
more tendencies to be dissatisfied with the service failures The two researchers
concluded that passengers with different incomes were satisfied with the services at
different levels because they had different attitudes expectations and abilities to pay for
the service
Fifthly as it was found from this study that the highest score for the purpose of
travel was going on holiday (527) and the participants who were tourists rated the
assurance dimension at the highest level or the mean score of 353 (See Table 10) much
higher than the mean score of the whole group which was at 345 It was rather surprising
that the highest score for the travel purpose was not for business trips It is possible to
explain that this group spent for the travel cost on their own and they might want to make
sure that they chose the best service for themselves The result is parallel with Gabbie
and OrsquoNeill (1997) who examined customer satisfaction in the hotel sector using the
x x
44
SERVQUAL tool This study showed that the holiday guests who paid for
accommodation on their own rated assurance much higher than other dimensions It is
plausible to explain that passengers traveling on their own budget must make sure that
they already chose the service that was worth the money spent
However when analyzing the satisfaction on service quality of the participants
whose purpose of travel via TG was for business it was also found that this business
participants rated the high score for the tangibles dimension at the mean score of 340
compared with the average mean score of all groups of 334 Passengers who traveled on
business included government officials and state enterprise employees were major
customers of TG It was therefore interesting to find out from this study that their
satisfaction score in terms of tangibles or the appearance of physical factors such as
equipment facilities and personnel was above the average score of all groups Although
the score was not much higher the gap was bigger than that of the other RATER
dimensions as seen from the following information the passengers who traveled on
business trip showed their satisfaction on the reliability dimension at the mean score of
281 the assurance dimension at 347 the empathy dimension at 309 and the
responsiveness dimension at 270 while the average of all groups was at 280 345 307
and 269 respectively
The last point that the researcher wanted to point out is that this study revealed
that the participants who traveled more than 10 times for the last 12 months were lowest
in number (13) However it was interesting that these frequent flyers showed the high
rate of satisfaction with TGrsquos in-flight service quality The mean scores in all dimensions
showed the high rate of satisfaction (See Table 11) It is possible that passengers who
traveled very often via TG had high loyalty The brand loyalty made passengers happy in
every feature of service This result however contrasts with Ostrowski et al (1993) who
45
investigated service quality and customer loyalty in the commercial airline industry The
study examined whether the high levels of service quality existed in the US commercial
airline industry and how service quality could potentially lead to customer loyalty The
main results indicated that the levels of perceived service quality were below potential
and that customer loyalty to airlines was low It is plausible to say that the data of the two
studies were different The data collected on two air carriers in USA might have
different characteristics from the demographic information of Thai people and the number
of the participants in the two studies might differ However TG still needs to listen to the
voice of all passengers especially the frequent flyers Even if the number of this sample
group was few every customer is valuable for any firm Also it would be valuable to
implement a relevant strategy to expand this group of passengers since they had a positive
attitude for TG
Interestingly the findings from the last part of the questionnaire also showed that
the majority of the participants (946) showed their willingness to use TGrsquos service in
the future It can plausibly be explained that the participants were satisfied with TGrsquo
service quality at the moderate level ( 307) Their satisfaction with the five dimensions
of SERVQUAL was also moderate They might think that TG is a reliable airline that
they can depend on Thai passengers have confidence and trust in the service of Thai
cabin crew in terms of courtesy Also it is possible that they might not trust the low cost
airlinesrsquo service of the crew
There were only seven remarks on the in-flight service when the participants were
asked to freely give suggestions The tangible dimension problematic Passengers
pointed out about the small size of passengersrsquo seats and the quality of the air-
conditioning system One problem was on the responsiveness dimension which happened
when a passenger asked for a blanket but she was not offered indicating that some of the
x
46
cabin crewrsquos promptness to provide service was still not up to a standard Another
comment was on the flavor of the snacks Although this issue is not directly relevant to
the service it is worthwhile for TG to consider this problem
In conclusion the researcher found both strengths and weaknesses in TGrsquos service
quality Assurance was found the highest satisfaction in the participantsrsquo opinion TG
should maintain the service quality with a focus on this dimension On the other hand
the responsiveness and reliability dimensions were at the lowest satisfaction level among
the five dimensions The company should improve its service quality on these two
dimensions especially with regards to TGrsquos lsquoprompt servicersquo and lsquoproblem solvingrsquo
service to retain its passengers
53 Limitations of the study
This study has some limitations as follows
1 This study was limited to only one domestic route (Bangkok ndash Chiangmai)
Therefore the participants in this study were passengers who traveled only between these
two provinces The results of the study might differ if the study covered another route or
many more routes at the same time Consequently further studies can be conducted for
other domestic destinations such as Phuket and other big cities
2 The research participants were all Thai passengers It would be interesting to
study foreign passengersrsquo satisfaction on TGrsquos in-flight service quality
3 This study focused only on Parasuraman et al (1985)rsquos SERVQUAL
Instrument used to assess the service quality The results might differ if other instruments
were used
47
54 Recommendations for further studies
Further research should be undertaken to validate the results of this study The
researcher has found several opportunities to extend this study as follows
Survey on the lsquoresponsivenessrsquo dimensions
Responsiveness concerns the willingness or readiness of employees to provide
service such as timelines of service and prompt service This dimension was what the
passengers in this study were most concerned about because it was rated as the lowest
level of satisfaction Thus TG should find the countermeasure of how to increase the
level of passengersrsquo satisfaction in the responsiveness dimension
Assessment of the ground service quality
Since this research was conducted on on-board service quality further studies on
ground services such as a reservation or check-in service should be investigated in order
to integrate the results covering every sector of the airline service
Study on passengersrsquo attitude towards the service quality in other airlines
A study on the service quality of other airlines should be conducted in order to
obtain comparative data and find out reasons for their passengersrsquo behavior and attitude
consequently allowing TG to remedy any weak points and increase the number of new
passengers
REFERENCES
REFERENCES
Alegre J amp Pou L (2006) An analysis of the microeconomic determinants of travel
frequency Department of Applied Economics Universitat de les Illes Balears
Bojanic DC (1991) Quality measurement in professional service firms Journal of
Professional Service Marketing 7(2) 27-37
Bojanic D C amp Rosen L D (1994) Measuring service quality in restaurants An
application of the SERVQUAL model Journal of Hospitality Research 18(1)
3-14
Boontaganon W (2002) The study of service quality of fast-food restaurants in Bangkok
using SERVQUAL measurement Thesis MBA (Business Administration)
Bangkok Assumption University Photocopied
Buttle F (1996) SERVQUAL review critique research agenda European Journal of
Marketing 30(1) 8-31
CarmanJ M (1990) Consumer perceptions of service quality An assessment of the
SERVQUAL dimensions Journal of Retailing 69 33-35
Cheaosakul W (2004) Consumers perception of service quality a case study of Thai
Airways International Plc Thesis MBA Bangkok Assumption University
Photocopied
Fick RG amp Ritchie JRB (1991) Measuring service quality in the travel and tourism
industry Journal of Travel Research 30(2) 2-9
Fornell C (1992) A national customer satisfaction barometer the Swedish experience
Journal of Marketing 56 6-21
Gabbie O amp OrsquoNeill M (1997) SERVQUAL and the Northern Ireland hotel sector a
comparative analysis part 2 Managing Service Quality 17(1) 43-49
50
Gilbert DH (1999) Marketing connecting with customers (2nd
ed) Upper Saddle
River NJ Prentice Hall
Gilbert D amp Wong KCR (2002) Passenger expectations and airline services a
Hong Kong based study Surrey Management School Surrey University of
Surrey
Gitman LJ amp Carl DM (2005) The future of business the essentials Mason Ohio
South-Western College Pub
Grifin J (1995) Customer loyalty NY Lexington Book
Gronroos C (1978) A service-oriented approach to marketing of services European
Journal of Marketing 12(8) 588-601
Hennig-Thurau T amp Klee A (1997) The impact of customer satisfaction and
relationship quality on customer retention a critical reassessment and model
development Masterrsquos Project MA (Psychology amp Marketing) Hanover
University of Hanover
Heesawat C (2005) The opportunities and problems in making services more tangible
PhD Dissertation Bangkok Assumption University Photocopied
Juran JM amp Gryna FM (1974) Quality control handbook NY McGraw-Hill
Kholthanasep G (2001) A study of customerrsquos expectations and perceptions of service
quality delivery by first class hotels in Bangkok metropolitan area Thesis
MBA Bangkok Assumption University Photocopied
Kotler P amp Scheff J (1997) Standing room only strategies for marketing the
performing arts Boston Mass Harvard Business School Press
Kotler P (1997) Marketing management analysis planning and control (9th
ed) Upper
Saddle River NJ Prentice Hall
51
Kotler P Bowen J amp Makens J (1999) Marketing for hospitality and tourism (2nd
ed) NJ Prentice Hall
Kotler P (2000) Marketing management the millennium edition (10th
ed) NJ Prentice
Hall
Lages FL amp Fernandes CJ (2005) The SERVQUAL scale a multi-item instrument
for measuring service personal values Journal of Business Research 58(11)
1562-1572
Oberoi U amp Hales C (1990) Assessing the quality of the conference hotel product
London The Service Industries Journal 10(4) 700-722
Ostrowski PL Orsquobrien TV amp Gordon GL (1993) Service quality and customer
loyalty in the commercial airline industry Journal of Travel Research 32(2)
16-24
Palin M (1996) Flight catering transportation and loading (2nd
ed) London Longman
Group Limited
Panittumrong P (2004) The consumerrsquos opinion towards Clark Hatch Fitness Center
Master Project MBA (Management) Bangkok Graduate School
Srinakharinwirot University Photocopied
Parasuraman A Zeitmal VA amp Berry LL (1985) A concept model of service
quality and its implications for future research Journal of Marketing 49 41-50
Parasuraman A Zeitmal VA amp Berry LL (1988) SERVQUAL a multiple item
scale for measuring customer perceptions of service quality Journal of
Retailing 64(1) 64
Parasuraman A amp Berry LL (1991) Marketing services competing through quality
NY The Free Press
52
Pirsig RM (1987) Zen and the art of motorcycle maintenance an inquiry into values
(Mass Market Paperback) NY Bantam Books
Poonlarbtawee K (1987) Statistics for research Bangkok Physic Center Printing
Reid RD amp Bojanic DC (2001) Hospitality marketing management NJ John Wiley
amp Son Inc
Rueangthanakiet P (2008) Memberrsquos satisfaction of fitness service quality a case study
of California Wow Xperience Plc Masterrsquos Project MA (Business English for
International Communication) Bangkok Graduate School Srinakharinwirot
University Photocopied
Sachukorn S (2006) Reception and service excellence Bangkok Saitharn
Schiffman LG amp Kanuk LL (1994) Consumer behavior (5th
ed) London Prentice-
Hall International
Somwang C (2008) An assessment of passengersrsquo views of service quality in Thai low
cost carriers Inter Program MA (Communicative English) Bangkok
Ramkhamhaeng University Photocopied
Suriya K (2005) Airline market segments after low cost airlines in Thailand passenger
classification using neural networks and logit model with selective learning
Faculty of Economics Chiangmai Chiangmai University
Suthirungkul N (2003) The study of customer expectations and perceptions of service
quality of the Clark Hatch fitness center of Silom road branch Bangkok Thesis
MBA (Business Administration) Bangkok Assumption University
Photocopied
Thai Airways International (2008) Traffic program information (Introduction of summer
200809) Bangkok THAI Printing Office
53
Thai Airways International (2009) Traffic program information (Introduction of winter
200910) Bangkok THAI Printing Office
THAI AIRWAYS INTL Official 4-Star Ranking of Product and Service Quality (2009
October) Retrieved February 14 2010 from
httpwwwairlinequalitycomAirlinesTGhtml
Travel Planning (2010 February 12) Retrieved February 12 2010 from
httpwwwsuite101comlessoncfm1848818243
Wangpen N amp Inthornma S (2007) Membersrsquo satisfaction in fitness centers in
Bangkok Thesis MA (Hotel and Tourism Management) Bangkok Graduate
School Naresuan University Photocopied
Zeithaml VA amp Bitner MJ (2000) Services marketing (2nd
ed) NY McGraw Hill
Zeithaml VA Parasuraman A amp Berry LL (1990) Delivering quality service
balancing customer perceptions and expectations NY Free Press
APPENDICES
55
APPENDIX A
แบบทดสอบความพงพอใจของผโดยสารการบนไทย
เรยนทานผโดยสารทเคารพ กระผมนาย วลาศ มนคงวณชกล พนกงานตอนรบสายการบนไทย และนกศกษาปรญญาโท หลกสตรภาษาองกฤษธรกจเพอการสอสารนานาชาต มหาวทยาลยศรนครนทรวโรฒ ไดจดท าแบบสอบถามนเพอเปนสวนหนงของการส ารวจความพงพอใจของผโดยสารทมตอคณภาพงานบรการ เทยวบนภายในประเทศของการบนไทย โดยมงหวงทจะน าขอมลทไดรบจากการส ารวจมาเปนประโยชนตอการสงเสรมสนบสนนการปฏบตงานใหเกดประสทธผล จงขอความกรณาจากทานในการตอบแบบสอบถามทกขอตามขอเทจจรงและความเหนของทาน ขอมลทงหมดเปนความลบ จะใชเพอการวจยเทานน และขอขอบคณในความรวมมอของทาน
helliphelliphelliphelliphelliphelliphelliphelliphelliphelliphelliphelliphelliphelliphelliphelliphelliphelliphelliphelliphelliphelliphelliphelliphelliphelliphelliphelliphelliphelliphellip
ค าชแจง โปรดท าเครองหมาย (x) ลงในชองวาง ทตรงกบค าตอบของทาน
ตอนท 1 ขอมลทวไป
1 เพศ ( ) ชาย ( ) หญง 2 อาย ( ) ตากวา 20 ป ( ) 21-40 ป ( ) 41-60 ป ( ) 60 ปขนไป 3 อาชพ ( ) ขาราชการ รฐวสาหกจ ( ) พนกงานบรษท ( ) ธรกจสวนตว ( ) นกเรยน นกศกษา ( ) เกษยณ ( ) อนๆ 4 รายได เดอน ( ) ตากวา 20000 ( ) 20001- 40000 บาท ( ) 40001- 60000 บาท ( ) 60001 บาท ขนไป 5 จดประสงคการเดนทาง ( ) ธรกจ ( ) พกผอน ( ) เยยมเยยนญาตมตร เพอนฝง ( ) อนๆ 6 ความถในการเดนทางกบการบนไทย (ในรอบ 12 เดอน) ( ) ครงแรก ( ) 2-3 ครง ( ) 4-10 ครง ( ) 10 ครงขนไป
56
ตอนท 2 ความพงพอใจของทานตอการบรการ (5 = เหนดวยอยางยง 4= เหนดวย 3= ปานกลาง 2=ไมเหนดวย 1=ไมเหนดวยอยางยง)
ระดบความพงพอใจ
การบรการของการบนไทย 5 4 3 2 1 1 เมอเจาหนาทสญญาทจะใหบรการทานในเรองใด จะทาตามนนเสมอ
2 การใหบรการของเจาหนาท สรางความเชอมนใหกบทาน
3 อปกรณบนเครองบนมรปแบบททนสมย (เชน จอทว ทนง)
4 บรษทฯกาหนดเวลาการใหบรการบนเครองเหมาะสม
5 เจาหนาทใหบรการทดนบตงแตกาวแรกบนเครอง
6 เจาหนาทมความตงใจดทจะชวยเหลอทาน เมอทานมปญหา
7 ทานรสกปลอดภยเมออยบนเครองบน
8 สงอานวยความสะดวกตางๆบนเครอง มรปลกษณทดงดดใจ (เชน กลองอาหาร) 9 เจาหนาทไมเขาใจความตองการของทาน ในบางกรณ
10 เจาหนาทไมไดระบเวลาในการใหบรการผโดยสารบนเครองทแนนอน 11 เจาหนาทพยายามทางานโดยไมใหเกดขอผดพลาด
12 เจาหนาทปฎบตงานดวยความสภาพเสมอ
13 เจาหนาทแตงกายเรยบรอยและดด
14 บรษทฯใหความเอาใจใสกบผโดยสารเปนรายบคคล
15 บางครงเจาหนาทไมเตมใจทจะใหบรการผโดยสาร
16 บรษทใหบรการทานตรงเวลาทกาหนด
17 เจาหนาทสามารถใหขอมลเกยวกบการเดนทางไดอยางถกตอง
18 เอกสารของบรษทฯทเกยวของกบการบรการ (เชน แผนพบ นตยสาร) มขอมลครบถวน และรปแบบสวยงาม 19 เจาหนาทใหบรการทานดวยสมผสความเปนไทย
20 เจาหนาทใหบรการผโดยสารอยางรวดเรว
ทานจะกลบมาใชบรการของการบนไทยตอไป จะใชบรการตอไป ไมใชบรการ
ขอเสนอแนะ_______________________________________________________
_____________________________________________________________ ขอบพระคณอยางสงในความรวมมอของทาน
57
APPENDIX B
Questionnaire
Dear Honorable Passengers
My name is Wilas Mankongvanichkul -- a THAI cabin crew and masterrsquos student of business English
for international communication program Srinakharinwirot University This questionnaire is about
an exploration of passengersrsquo satisfaction with service quality of Thai Airways International (TG)rsquos
domestic flights Data gained will be utilized for THAI service operation Please kindly complete the
questionnaire The data gained will be kept confidential and used for the research study only Your
kind cooperation is greatly appreciated
helliphelliphelliphelliphelliphelliphelliphelliphelliphelliphelliphelliphelliphelliphelliphelliphelliphelliphelliphelliphelliphelliphelliphelliphelliphellip
Direction Please mark (x) your answer in the space provided
Part 1 Personal Information
1 Gender
( ) Male ( ) Female
2 Age
( ) Under 20 years ( ) 21-40 years
( ) 41-60 years ( ) Above 60 years
3 Occupation
( ) Government official State enterprise employee
( ) Business employee
( ) Business owner ( ) Student
( ) Retiree ( ) Others
4 Monthly income
( ) Up to 20000 baht ( ) 20001- 40000 baht
( ) 40001 ndash 60000 baht ( ) 60001 baht and above
5 Purpose of travel
( ) Business trips ( ) Holidays
( ) Visits ( ) Others
6 Frequency in traveling with THAI (during the last 12 months)
( ) First time ( ) 2-3 times
( ) 4-10 times ( ) More than 10 times
58 Part 2 Your satisfaction with the service
(5=Strongly Agree 4= Agree 3=Uncertain 2=Disagree 1= Strongly Disagree)
Level of Satisfaction
The Service of THAI 5 4 3 2 1
1 When cabin crew promise to do something by a
certain time they do so
2 You can trust THAI cabin crew
3 TG has modern on board equipment
(such as TV screen passengersrsquo seats)
4 TG has operating hours on board convenient to all
passengers
5 Cabin crew offer good services upon boarding
6 When passengers have a problem cabin crew show a
sincere interest in solving it
7 Passengers feel safe on-board
8 The physical facilities of TG are visually appealing
(such as meal boxes)
9 Cabin crew do not understand your special needs in
some cases
10 Cabin crew do not tell passengers exactly when
services will be offered
11 Cabin crew insist on error-free records
12 Cabin crew are consistently courteous to passengers
13 Cabin crew are well-dressed and neat in appearance
14 TG gives passengers individual attention
15 Cabin crew are not always willing to help passengers
16 TG provides its services at the time it promises to
do so
17 Cabin crew are knowledgeable to answer passengers
travel-related questions
18 Documents about service are informative and appealing
(such as pamphlets and magazines)
19 Services provided have a ldquoThai Touchrdquo
20 Cabin crew are quick to respond to passengersrsquo requests
Will you come back for TGrsquos service Yes No
Suggestions________________________________________________________________
________________________________________________________________________ Thank you very much for your kind cooperation
59
APPENDIX C
Questionnaire Specification Based on SERVQUAL measurement (Parasuraman et al 1985)
Passengers satisfaction level toward service quality factors
No Service Quality Features (RATER)
Str
on
gly
ag
ree
Ag
ree
Un
certa
in
Dis
ag
ree
Str
on
gly
Dis
ag
ree
(5) (4) (3) (2) (1)
1 When cabin crew promise to do something by a certain time they do so Reliability
2 You can trust THAI cabin crew Assurance
3 TG has modern on board equipment (such as TV screen passengersrsquo seats) Tangibles
4 TG has operating hours on board convenient to all passengers Empathy
5 Cabin crew offer good services upon boarding Responsiveness
6 When passengers have a problem cabin crew show a sincere interest in solving it
Reliability
7 Passengers feel safe on-board Assurance
8 The physical facilities of TG are visually appealing (such as meal boxes) Tangibles
9 Cabin crew do not always understand your special needs in some cases Empathy
10 Cabin crew do not tell passengers exactly when services will be offered Responsiveness
11 Cabin crew insist on error-free records Reliability
12 Cabin crew are consistently courteous to passengers Assurance
13 Cabin crew are well-dressed and neat in appearance Tangibles
14 TG gives passengers individual attention Empathy
15 Cabin crew are not always willing to help passengers Responsiveness
16 TG provides its services at the time it promises to do so Reliability
17 Cabin crew are knowledgeable to answer passengers travel-related questions Assurance
18 TGs documents associated with services are informative and appealing (such as pamphlets and magazines)
Tangibles
19 Services provided have a ldquoThai Touchrdquo Empathy
20 Cabin crew are quick to respond to passengersrsquo requests Responsiveness
VITAE
61
VITAE
Name Wilas Mankongvanichkul
Date of Birth February 14 1980
Place of Birth Bangkok
Address 688 Soi Phaholyothin 32 Chankasem Jatuchak
Bangkok 10900
Present Occupation Cabin Crew
Thai Airways International Public Company Limited
89 Vibhavadi Rangsit Road Bangkok 10110
Education Background
2010 Master of Art (Business English for International
Communication)
Srinakharinwirot University
2001 Bachelor of Business Administration Bangkok University
1997 High School Saint Dominic School
- Cover
- Abstract
- Chapter 1
- Chapter 2
- Chapter 3
- Chapter 4
- Chapter 5
- Bibliography
- Appendix
- Vitae
-
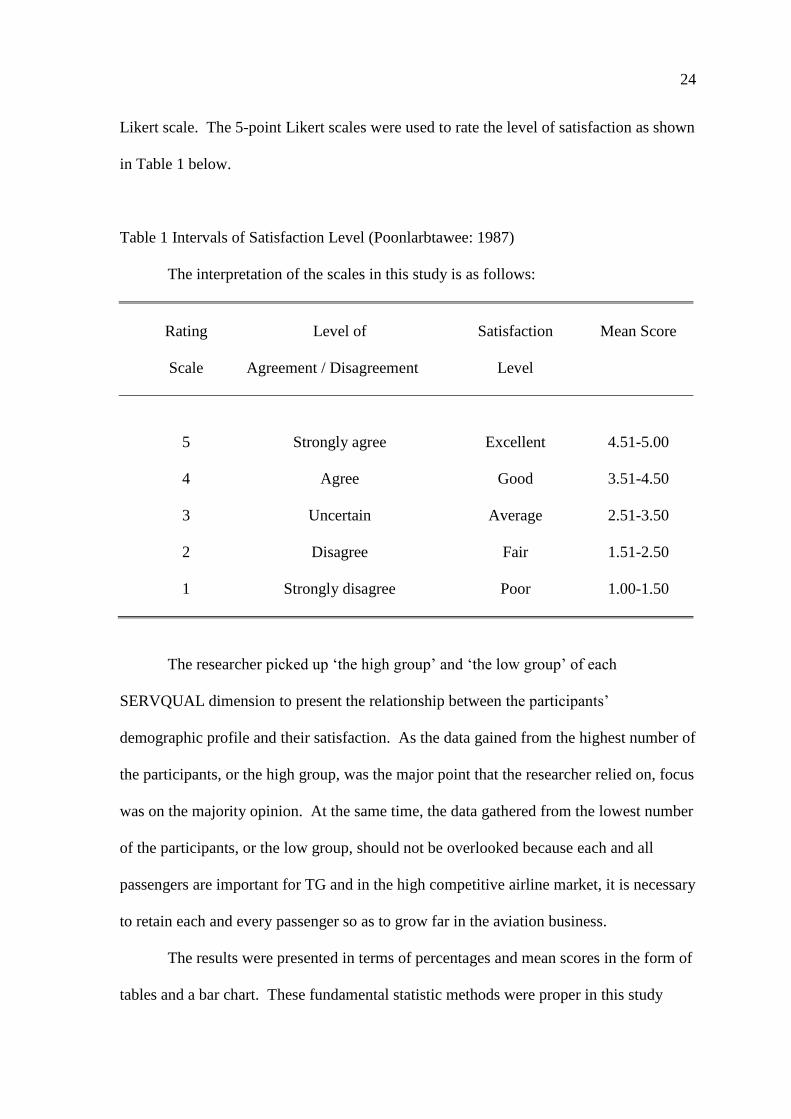
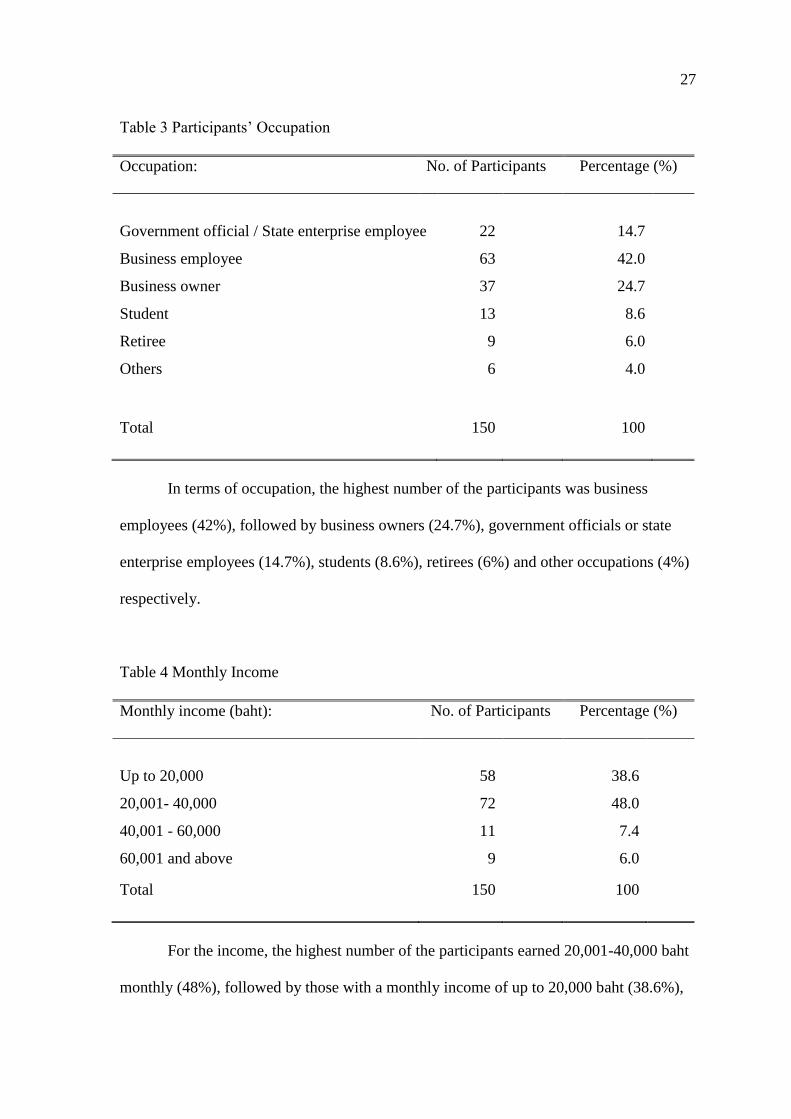
27
Table 3 Participantsrsquo Occupation
Occupation No of Participants Percentage ()
Government official State enterprise employee
Business employee
Business owner
Student
Retiree
Others
22
63
37
13
9
6
147
420
247
86
60
40
Total 150 100
In terms of occupation the highest number of the participants was business
employees (42) followed by business owners (247) government officials or state
enterprise employees (147) students (86) retirees (6) and other occupations (4)
respectively
Table 4 Monthly Income
Monthly income (baht) No of Participants Percentage ()
Up to 20000
20001- 40000
40001 - 60000
60001 and above
58
72
11
9
386
480
74
60
Total 150 100
For the income the highest number of the participants earned 20001-40000 baht
monthly (48) followed by those with a monthly income of up to 20000 baht (386)
28
of 40001-60000 baht monthly (64) and of 60001 baht and above monthly was the
lowest (6)
Table 5 Purpose of Travel
Purpose of travel No of Participants Percentage ()
Business trips
Holidays
Visits
Others
41
79
27
3
273
527
180
20
Total 150 100
Regarding the purpose of travel the highest number of the passengers traveled via
TG on holidays (527) followed by those who traveled on business trips (273)
Meanwhile those who made a visit were at 180 and who traveled with other purposes
were at 2
Table 6 Frequency of Travel
Frequency in traveling with THAI
(during the last 12 months)
No of Participants Percentage ()
First time
2-3 times
4-10 times
More than 10 times
39
99
10
2
260
660
67
13
Total 150 100
29
The last demographic data derive from the frequency in traveling with THAI
66 of the participants indicated that they traveled 2-3 times during the last 12 months
26 traveled for the first time while 67 for 4-10 times and 13 for more than 10
times during the last 12 months
In conclusion the demographic data shown in the tables above indicated that lsquothe
high grouprsquo comprised the following characteristics The age group of the majority
number of the participants ranged from 21-40 years (567) Most of them were business
employees (42) The highest number of the passengersrsquo monthly income was around
20000 ndash 40000 baht per month (48) The majority of the passengers traveled on
holidays (527) by TG 2-3 times in the past 12 months (66)
Meanwhile lsquothe low grouprsquo was found having the following characteristics The
lowest number of the research participants was under 20 years old or 53 Only 47 of
the participants had other kinds of occupation which were not indicated on the
questionnaire while only 6 of the participants earned 60001 baht or above monthly
2 of the participants traveled on other purposes besides those shown on the
questionnaire Lastly 13 of the passengers were those who traveled by TG more than
10 times in the past 12 months
42 Level of Passengersrsquo Satisfaction
Figure 1 below is the conclusion from the second part of the questionnaire The
150 participants were asked to rate the level of service quality that they perceived from
the TGrsquos domestic flights on Bangkok - Chiangmai route The questionnaire was divided
into five dimensions of SERVQUALrsquos (Parasuraman et al 1985) service quality which
comprised reliability assurance tangibles empathy and responsiveness The scales 1 to 5
ranged from lsquostrongly disagreersquo to lsquostrongly agreersquo
30
0
5
Reliability Assurance Tangibles Empathy Responsiveness
280
345 334307
269
SERVQUAL Dimension
Figure 1 Overall Level of Participants Satisfaction
Mean scores
Figure 1 shows the average mean score of all 150 passengersrsquo satisfaction on five
dimensions of service quality ranging from the mean scores of 345 to 269 The results
revealed that the most important service quality dimension for the whole samples group
of passengers was assurance ( 345) followed by tangibles ( 334) empathy ( 307)
reliability ( 28) and responsiveness ( 269) respectively The overall average mean
was 307
43 Passengersrsquo Satisfaction Level in Relationship with Their Demographic Data
This section shows the relationship between the demographic data (age
occupation monthly income purpose of travel and travel frequency) of the participants
and their satisfaction with the service quality of TGrsquos in-flight service
The researcher focused on each category of demographic characteristics of two
major groups a group with the highest score and the other with the lowest score In fact
the most important data were the majority opinion of the sample group In other words
for this study it was lsquothe high grouprsquo However the researcher as a TG cabin crew gave
importance to the low group as well since each and every passenger is significant to TG
x
x x x
x x
31
business particularly in the high competitive market of airline business The researcher
was interested to know what the passengers in the lsquolow grouprsquo thought about the in-flight
service and what their feedback was
The following tables (Tables 7-11) illustrate the relationship between each
dimension of the demographic data and the SERVQUAL service assessment tool and the
following symbols are applied in the tables below
lsquoNrsquo means the number of the participants
lsquo rsquo means the mean score
lsquoThe high grouprsquo means the group that comprises the highest number of participants
lsquoThe low grouprsquo means the group that comprises the lowest number of participants
Table 7 Relationship between the Participantsrsquo Age and their Satisfaction with In-flight
Service
SERVQUALrsquoS
RATER
Average
Mean Score
of All Groups
The High Group
(Age 20-40 Yrs Old)
N = 85567
The Low Group
(Age Under 20 Yrs Old)
N = 853
Mean Score of Each Group
Reliability 280 278 270
Assurance 345 378 335
Tangibles 334 331 328
Empathy 307 309 314
Responsiveness 269 267 290
Table 7 reveals the connection between the participantsrsquo age and the five
dimensions of the SERVQUAL instrument The high group had higher mean scores for
x
32
three dimensions than the low group In other words the participants with an age range
of 20-40 years were more satisfied with TGrsquos service quality in terms of reliability
assurance tangibles than those who were under 20 years old Meanwhile the low group
had higher mean scores for two dimensions than the high group This means the
participants who were lower than 20 years old were more satisfied with the in-flight
service in terms of empathy and responsiveness than those whose ages ranged from 20-40
years
Interestingly it was found that both groups have a lower mean score for the
reliability dimension ( 278 and 270) than the average mean score of all the age groups
in this study ( 28)
Table 8 Relationship between the Participantsrsquo Occupation and their Satisfaction with In-
flight Service
SERVQUALrsquoS
RATER
Average
Mean Score
of All Groups
The High Group
(Business Employee)
N = 63420
The Low Group
(Others)
N = 640
Mean Score of Each Group
Reliability 280 275 284
Assurance 345 347 348
Tangibles 334 331 336
Empathy 307 310 305
Responsiveness 269 264 277
Table 8 illustrates the connection between the participantsrsquo occupations and the
five dimensions of the SERVQUAL instrument The low group had higher mean scores
x
x
33
for almost all the dimensions of SERVQUALrsquos RATER than the high group except for
one dimension In other words the participants who worked as business employees were
less satisfied with TGrsquos service quality in terms of reliability assurance tangibles and
responsiveness than those whose occupations were not specified in the questionnaire
Empathy was the only dimension of service quality that the participants who were in the
high group were satisfied with
Table 9 Relationship between the Participantsrsquo Income and their Satisfaction with In-
flight Service
SERVQUALrsquoS
RATER
Average
Mean Score
of All Groups
The High Group
(20001-40000)
N = 72480
The Low Group
(60001 and above)
N = 960
Mean Score of Each Group
Reliability 280 273 285
Assurance 345 349 350
Tangibles 334 332 321
Empathy 307 301 325
Responsiveness 269 262 273
Table 9 indicates the connection between the participantsrsquo monthly income and
the five dimensions of the SERVQUAL instrument The low group had higher mean
scores for almost all the dimensions of RATER than the high group except for one
dimension In other words the participants who earned monthly income of 20001 ndash
40000 baht were less satisfied with TGrsquos service quality in terms of reliability assurance
empathy and responsiveness than those who earned monthly income of 60001 baht and
34
above The tangibles dimension was the only service quality issue that the participants
who were in the high group were satisfied with
Table 10 Relationship between the Participantsrsquo Purpose of Travel and their Satisfaction
with In-flight Service
SERVQUALrsquoS
RATER
Average
Mean Score
of All Groups
The High Group
(Holidays)
N = 79527
The Low Group
(Others)
N = 320
Mean Score of Each Group
Reliability 280 279 285
Assurance 345 353 349
Tangibles 334 335 338
Empathy 307 308 312
Responsiveness 269 270 275
Table 10 reflects the connection between the participantsrsquo purpose of travel and
the five dimensions of the SERVQUAL instrument The low group had higher mean
scores for almost all the dimensions than the high group except for one dimension In
other words the participants who traveled on holidays were less satisfied with TGrsquos
service quality in terms of reliability tangibles empathy and responsiveness than those
whose purpose of travel were not specified in the questionnaire Assurance was the only
dimension of service quality that the participants who were in the high group were
satisfied with
35
Interestingly it was found that both groups has a higher satisfaction level for the
assurance tangibles empathy and responsiveness dimensions than the average mean
scores of the whole sample group
Table 11 Relationship between the Participantsrsquo Frequency of Travel with THAI and their
Satisfaction with In-flight Service
SERVQUALrsquoS
RATER
Average Mean
Score of All
Groups
The High
Group
(2-3 timesyear)
N = 99660
The Low Group
(more than 10
timesyear)
N = 213
Mean Score of Each Group
Reliability 280 281 295
Assurance 345 346 360
Tangibles 334 335 343
Empathy 307 308 321
Responsiveness 269 270 292
Table 11 presents the connection between the participantsrsquo frequency of travel
with THAI and the five dimensions of the SERVQUAL instrument The low group had
higher mean scores for all the dimensions of RATER than the high group In other
words the participants who traveled 2-3 times in the last 12 months were less satisfied
with TGrsquos service quality in terms of reliability assurance tangibles empathy and
responsiveness than those whose frequency of travel were more than 10 times in the last
12 months
36
Interestingly it was found that both groups has a higher satisfaction level for all
the five RATER dimensions than the average mean scores of the whole sample group in
this study
44 Other Comments
The last part of the questionnaire was designed to ask whether the participants
would continue using TGrsquos service The findings disclosed that 142 participants or
946 indicated that they would while 8 of them or 54 declined
Also at the end of the questionnaire there was a blank space for the participants to
freely express their own ideas and suggestions on TGrsquos service However only 7
participants or 46 gave suggestions regarding the in-flight service Four of the
participants were dissatisfied with the flavor of the snacks provided on board One
complained that it was not cool enough in the cabin while one was upset for not being
granted for a request for a blanket The last one commented that the passengerrsquos seat was
not comfortable
In summary the passengersrsquo satisfaction level of the service quality in connection
with their demographic data was introduced Five out of the six demographic
characteristics the participantsrsquo age occupation monthly income purpose of travel and
frequency of travel were analyzed in connection with the five dimensions of SERVQUAL
instrument reliability assurance tangibles empathy and responsiveness It was observed
that there were some connection between these two matters in various ways as earlier
discussed Lastly it was found that one hundred and forty-two participants would
continue using TGrsquos service while the rest refused Only seven of all the participants or
46 gave some comments on the open-ended suggestion part
CHAPTER FIVE
CONCLUSION AND DISCUSSION
This chapter presents the conclusion discussion limitations of the study and
recommendations for further studies
51 Conclusion
This research aimed to examine the service quality provided by Thai Airways
International on its domestic flights One hundred and fifty passengers who traveled by
TG on the Bangkok - Chiang Mai route were the research participants The SERVQUAL
instrument was used as an instrument for data collection in the survey This instrument
was based on five determinants proposed by Panasuraman etal (1985) in terms of
reliability assurance tangibles empathy and responsiveness This research was also
conducted on the demographic characteristics comprising gender age occupation
monthly income purpose of travel and frequency in traveling and the relationship of these
characteristics except the gender with the passengersrsquo satisfaction with TGrsquos in-flight
service quality The questionnaires were distributed in early March 2010
The results showed that all the participantsrsquo satisfaction based on the five
dimensions was at the average level The highest level of passengersrsquo satisfaction was
placed on the assurance dimension followed by tangibles and empathy dimensions
accordingly The two lowest levels of the passengersrsquo satisfaction were placed on the
responsiveness and reliability dimensions
In addition a summary of the demographic characteristics showed that the high
group or the group with the highest number of participants was business employees The
highest number of the participants was between 21-40 years old The highest number of
38
the participantsrsquo income ranged from 20000 ndash 40000 baht monthly Also the high
grouprsquos purpose of travel was to go on holiday Lastly the highest number of the
participants traveled via TG only 2-3 times during the past 12 months
Meanwhile the low group or the group with the lowest number of participants
was passengers with other kinds of occupations which were not specified on the
questionnaire The low group of the participants was under 20 years old The low group
of the participantsrsquo income ranged from 60001 baht monthly or higher Also the low
group revealed that they traveled via TG for other purposes which were not indicated on
the questionnaire Lastly the passengers who traveled via TG more than 10 times during
the past 12 months belonged in the low group
It has also been discovered that as a whole both groups the high and low groups
were in the same direction in their satisfaction with the five dimensions of service quality
The two groups were satisfied with the service quality dimensions in terms of assurance
at the highest level followed by tangibles empathy reliability and responsiveness
respectively
However when analyzing each demographic characteristic the participants who
were under 20 years old rated the responsiveness dimension higher than the reliability
dimension Also for those participants whose income was around 60001 or higher the
empathy dimension was rated higher than the tangibles Regarding the occupation
business people were satisfied with the reliability and responsiveness dimensions at a
very low level Meanwhile the participants who traveled via TG on their holidays rated
the assurance dimension at a very high level Lastly frequent fliers who traveled by
THAI more than 10 times were most satisfied with TGrsquos service since they rated all
RATER aspects highly
39
52 Discussion
The findings have revealed the answers to the research questions First the
demographic data of the participants gender age occupation monthly income purpose
of travel and frequency of travel were shown Second the level of the passengersrsquo
satisfaction toward the service quality on Thai Airways Internationalrsquos domestic flights in
terms of the SERVQUAL instrument (Parasuraman et al 1985) reliability assurance
tangibles empathy and responsiveness was disclosed Also the results about the
relationship between the passengersrsquo satisfaction and their demographic data were pointed
out
The results of the survey indicated that out of the five dimensions assurance was
rated at the highest level ( 345) followed by tangibles ( 334) and empathy ( 307)
(See Figure 1) In addition passengers rated their highest satisfaction with the assurance
dimension which included cabin crewrsquos job knowledge their courtesy confidence in their
service ability and safety while traveling It may be because TG cabin crew are well-
trained prior to their actual service work on board This can also ensure passengersrsquo
safety Particularly the safety and security features have been the most concerns of
airline passengers since the 9-11 incidents in New York USA This is why most
customers rated their highest satisfaction with the assurance dimension (Carman 1990)
The findings of this study are also consistent with those of Fick and Ritchie (1991)
who studied the operation of the SERVQUAL instrument in three major tourism sectors
airlines restaurants and ski area services It was revealed that the most important
dimensions of the service were assurance and tangibles If companies were unable to
inspire trust and confidence in their customers and the tangibles are not impressive it
would be difficult for them to achieve a high level of customerrsquos satisfaction (Sachukorn
2000)
x x x
40
Responsiveness is often found as the lowest level of satisfaction among customers
in the service industry It is plausible that the staff were too busy to provide prompt and
good service (Kholthanasep 2001) In this study the results revealed that the
responsiveness dimension was rated at the lowest score ( 269) among the five
dimensions followed by the reliability ( 280) dimension It was highly possible that the
passengersrsquo dissatisfaction occurred when passengers did not receive prompt service from
TG when they needed help
Prompt service is an important factor of customersrsquo expectation Customers
generally rate the service as poor when the speed of service does not meet their
expectations (Kholthanasep 2001) Bojanic and Rosen (1994) examined the nature of the
association between service quality as perceived by consumers and its determinants by
applying SERVQUAL in a restaurant setting They found that customers rated
responsiveness as the lowest satisfaction in their studies Zeithaml et al (1990) explained
that the responsiveness dimension in the SERVQUAL was willingness to help customers
and provide prompt service As the responsiveness dimension in this research comprised
prompt service willingness on-time service and quick response therefore it will be
beneficial to TG if the company can ensure that the service provided by its cabin crew
especially the willingness to help passengers and to provide prompt service meet
passengersrsquo satisfaction
Regarding the relationship between the participantsrsquo demographic data and their
satisfaction with the service quality there are many points of interests to be discussed as
follows
Firstly regarding the relationship of the passengersrsquo satisfaction with the service
and their age those who were under 20 years old rated satisfaction with the
responsiveness dimension ( 290) higher than the reliability dimension ( 270) (See
x
x
x x
41
Table 7) It was possible that young passengers usually gave priority to the dimension of
care and service when compared with that of the service providersrsquo accurate and
dependable manner (Panittumrong 2003) In addition young customers had less
experience in a service and it was difficult to compare the current service with the past
experience consequently they were more satisfied with the service provided than senior
customers
Another point was raised about the participantsrsquo age The study revealed that the
number of the high group with the age range of 21- 40 was at 567 However that of
the second highest group of the participants with the age range of 41-60 was at 30
which was rather high This latter grouprsquos level of satisfaction on the service quality was
also close to the average mean score It was found that the average mean score of the
reliability dimension was 280 while that of the second highest group was 281 the
average mean score of the assurance dimension was 345 while that of the second highest
group was 347 the average mean score of the tangibles dimension was 334 while that of
the second highest group was 335 the average mean score of the empathy dimension and
that of the second highest group was rated at 307 equally and the average mean score of
the responsiveness was 269 while that of the second highest group was 271 In sum if
consider the two groups in terms of the participantsrsquo age one of the high group and the
other with the second high group the results confirmed that the satisfaction level of the
majority of passengers was at the above average level
Secondly regarding the relationship between the participantsrsquo satisfaction and
their occupation business employees who were found at the highest number (42) had
very low satisfaction with the service quality in terms of reliability ( 275) and
responsiveness ( 264) while the mean scores of the whole sample group for these two
dimensions were at 280 and 269 respectively (See Table 8) The findings strongly
x
x
42
correlated with that of Cheaosakul (2004) who studied the consumersrsquo perception of
airline service quality with a focus on occupations It was found that the group of
business employees had the highest score on expectations Cheaosakul (2004)rsquos study
also revealed that business employees did not frequently travel compared with people of
other occupations such as tourists It was found in this particular study that the number of
the participantsrsquo purpose of travel with TG for business trips was only at 273 (See
Table 5) while the highest number of the participants went on holiday was at 52
Cheaosakul (2004) indicated that business people therefore had high expectations than
the other group who traveled more frequently
Thirdly an even more interesting point was raised when comparing the level of
satisfaction of the passengers who were government officials or state enterprise
employees and business owners Although passengers who were government officials or
state enterprise employees came third in terms of participants they are considered
valuable customers of TG since according to the governmentrsquos policy they are required
to take only TG which is a national airline whenever they travel by air There are few
exceptions though However it is almost impossible for Thai government officials who
travel on business trip and are funded by the governmentrsquos budget to fly with other
airliners It was found from this study that government officials were less satisfied with
TG quality service in terms of reliability ( 277) and responsiveness ( 264) than the
average level of which the mean scores of the two dimensions were at 280 and 269
respectively
Another issue of discussion regarding the participantsrsquo occupation business
owners came second It was observed that business owners rated the reliability ( 282)
and responsiveness dimensions ( 270) higher than the average scores of all groups (See
Table 8) It is possible that business owners had more positive attitude with TGrsquos service
x x
x
x
43
than the other groups TG seemed popular among business owners and they were the
most important group of customers This was supported by Suriya (2005) who studied
airline market segments after the launch of the low cost airlines in Thailand Suriya
(2005) identified that merchants or business owners were the major group of customers in
the full-service airline market
Fourthly regarding the monthly income of the research participants of the low
group passengers who earned an income of around 60001 or higher rated the empathy
( 325) dimension higher than tangibles ( 321) dimension (See Table 9) This may
be because the high income passengers sensitively felt that the facilities and equipment
found on their domestic route looked quite old-fashioned due to TGrsquos cost reduction The
company saved costs after the Suvannabhumi airport was closed in the 2008 crisis The
result is similar to the findings of Wangpen and Inthornma (2007) in that high income
customers had higher expectations towards the service It was possible that they had
more tendencies to be dissatisfied with the service failures The two researchers
concluded that passengers with different incomes were satisfied with the services at
different levels because they had different attitudes expectations and abilities to pay for
the service
Fifthly as it was found from this study that the highest score for the purpose of
travel was going on holiday (527) and the participants who were tourists rated the
assurance dimension at the highest level or the mean score of 353 (See Table 10) much
higher than the mean score of the whole group which was at 345 It was rather surprising
that the highest score for the travel purpose was not for business trips It is possible to
explain that this group spent for the travel cost on their own and they might want to make
sure that they chose the best service for themselves The result is parallel with Gabbie
and OrsquoNeill (1997) who examined customer satisfaction in the hotel sector using the
x x
44
SERVQUAL tool This study showed that the holiday guests who paid for
accommodation on their own rated assurance much higher than other dimensions It is
plausible to explain that passengers traveling on their own budget must make sure that
they already chose the service that was worth the money spent
However when analyzing the satisfaction on service quality of the participants
whose purpose of travel via TG was for business it was also found that this business
participants rated the high score for the tangibles dimension at the mean score of 340
compared with the average mean score of all groups of 334 Passengers who traveled on
business included government officials and state enterprise employees were major
customers of TG It was therefore interesting to find out from this study that their
satisfaction score in terms of tangibles or the appearance of physical factors such as
equipment facilities and personnel was above the average score of all groups Although
the score was not much higher the gap was bigger than that of the other RATER
dimensions as seen from the following information the passengers who traveled on
business trip showed their satisfaction on the reliability dimension at the mean score of
281 the assurance dimension at 347 the empathy dimension at 309 and the
responsiveness dimension at 270 while the average of all groups was at 280 345 307
and 269 respectively
The last point that the researcher wanted to point out is that this study revealed
that the participants who traveled more than 10 times for the last 12 months were lowest
in number (13) However it was interesting that these frequent flyers showed the high
rate of satisfaction with TGrsquos in-flight service quality The mean scores in all dimensions
showed the high rate of satisfaction (See Table 11) It is possible that passengers who
traveled very often via TG had high loyalty The brand loyalty made passengers happy in
every feature of service This result however contrasts with Ostrowski et al (1993) who
45
investigated service quality and customer loyalty in the commercial airline industry The
study examined whether the high levels of service quality existed in the US commercial
airline industry and how service quality could potentially lead to customer loyalty The
main results indicated that the levels of perceived service quality were below potential
and that customer loyalty to airlines was low It is plausible to say that the data of the two
studies were different The data collected on two air carriers in USA might have
different characteristics from the demographic information of Thai people and the number
of the participants in the two studies might differ However TG still needs to listen to the
voice of all passengers especially the frequent flyers Even if the number of this sample
group was few every customer is valuable for any firm Also it would be valuable to
implement a relevant strategy to expand this group of passengers since they had a positive
attitude for TG
Interestingly the findings from the last part of the questionnaire also showed that
the majority of the participants (946) showed their willingness to use TGrsquos service in
the future It can plausibly be explained that the participants were satisfied with TGrsquo
service quality at the moderate level ( 307) Their satisfaction with the five dimensions
of SERVQUAL was also moderate They might think that TG is a reliable airline that
they can depend on Thai passengers have confidence and trust in the service of Thai
cabin crew in terms of courtesy Also it is possible that they might not trust the low cost
airlinesrsquo service of the crew
There were only seven remarks on the in-flight service when the participants were
asked to freely give suggestions The tangible dimension problematic Passengers
pointed out about the small size of passengersrsquo seats and the quality of the air-
conditioning system One problem was on the responsiveness dimension which happened
when a passenger asked for a blanket but she was not offered indicating that some of the
x
46
cabin crewrsquos promptness to provide service was still not up to a standard Another
comment was on the flavor of the snacks Although this issue is not directly relevant to
the service it is worthwhile for TG to consider this problem
In conclusion the researcher found both strengths and weaknesses in TGrsquos service
quality Assurance was found the highest satisfaction in the participantsrsquo opinion TG
should maintain the service quality with a focus on this dimension On the other hand
the responsiveness and reliability dimensions were at the lowest satisfaction level among
the five dimensions The company should improve its service quality on these two
dimensions especially with regards to TGrsquos lsquoprompt servicersquo and lsquoproblem solvingrsquo
service to retain its passengers
53 Limitations of the study
This study has some limitations as follows
1 This study was limited to only one domestic route (Bangkok ndash Chiangmai)
Therefore the participants in this study were passengers who traveled only between these
two provinces The results of the study might differ if the study covered another route or
many more routes at the same time Consequently further studies can be conducted for
other domestic destinations such as Phuket and other big cities
2 The research participants were all Thai passengers It would be interesting to
study foreign passengersrsquo satisfaction on TGrsquos in-flight service quality
3 This study focused only on Parasuraman et al (1985)rsquos SERVQUAL
Instrument used to assess the service quality The results might differ if other instruments
were used
47
54 Recommendations for further studies
Further research should be undertaken to validate the results of this study The
researcher has found several opportunities to extend this study as follows
Survey on the lsquoresponsivenessrsquo dimensions
Responsiveness concerns the willingness or readiness of employees to provide
service such as timelines of service and prompt service This dimension was what the
passengers in this study were most concerned about because it was rated as the lowest
level of satisfaction Thus TG should find the countermeasure of how to increase the
level of passengersrsquo satisfaction in the responsiveness dimension
Assessment of the ground service quality
Since this research was conducted on on-board service quality further studies on
ground services such as a reservation or check-in service should be investigated in order
to integrate the results covering every sector of the airline service
Study on passengersrsquo attitude towards the service quality in other airlines
A study on the service quality of other airlines should be conducted in order to
obtain comparative data and find out reasons for their passengersrsquo behavior and attitude
consequently allowing TG to remedy any weak points and increase the number of new
passengers
REFERENCES
REFERENCES
Alegre J amp Pou L (2006) An analysis of the microeconomic determinants of travel
frequency Department of Applied Economics Universitat de les Illes Balears
Bojanic DC (1991) Quality measurement in professional service firms Journal of
Professional Service Marketing 7(2) 27-37
Bojanic D C amp Rosen L D (1994) Measuring service quality in restaurants An
application of the SERVQUAL model Journal of Hospitality Research 18(1)
3-14
Boontaganon W (2002) The study of service quality of fast-food restaurants in Bangkok
using SERVQUAL measurement Thesis MBA (Business Administration)
Bangkok Assumption University Photocopied
Buttle F (1996) SERVQUAL review critique research agenda European Journal of
Marketing 30(1) 8-31
CarmanJ M (1990) Consumer perceptions of service quality An assessment of the
SERVQUAL dimensions Journal of Retailing 69 33-35
Cheaosakul W (2004) Consumers perception of service quality a case study of Thai
Airways International Plc Thesis MBA Bangkok Assumption University
Photocopied
Fick RG amp Ritchie JRB (1991) Measuring service quality in the travel and tourism
industry Journal of Travel Research 30(2) 2-9
Fornell C (1992) A national customer satisfaction barometer the Swedish experience
Journal of Marketing 56 6-21
Gabbie O amp OrsquoNeill M (1997) SERVQUAL and the Northern Ireland hotel sector a
comparative analysis part 2 Managing Service Quality 17(1) 43-49
50
Gilbert DH (1999) Marketing connecting with customers (2nd
ed) Upper Saddle
River NJ Prentice Hall
Gilbert D amp Wong KCR (2002) Passenger expectations and airline services a
Hong Kong based study Surrey Management School Surrey University of
Surrey
Gitman LJ amp Carl DM (2005) The future of business the essentials Mason Ohio
South-Western College Pub
Grifin J (1995) Customer loyalty NY Lexington Book
Gronroos C (1978) A service-oriented approach to marketing of services European
Journal of Marketing 12(8) 588-601
Hennig-Thurau T amp Klee A (1997) The impact of customer satisfaction and
relationship quality on customer retention a critical reassessment and model
development Masterrsquos Project MA (Psychology amp Marketing) Hanover
University of Hanover
Heesawat C (2005) The opportunities and problems in making services more tangible
PhD Dissertation Bangkok Assumption University Photocopied
Juran JM amp Gryna FM (1974) Quality control handbook NY McGraw-Hill
Kholthanasep G (2001) A study of customerrsquos expectations and perceptions of service
quality delivery by first class hotels in Bangkok metropolitan area Thesis
MBA Bangkok Assumption University Photocopied
Kotler P amp Scheff J (1997) Standing room only strategies for marketing the
performing arts Boston Mass Harvard Business School Press
Kotler P (1997) Marketing management analysis planning and control (9th
ed) Upper
Saddle River NJ Prentice Hall
51
Kotler P Bowen J amp Makens J (1999) Marketing for hospitality and tourism (2nd
ed) NJ Prentice Hall
Kotler P (2000) Marketing management the millennium edition (10th
ed) NJ Prentice
Hall
Lages FL amp Fernandes CJ (2005) The SERVQUAL scale a multi-item instrument
for measuring service personal values Journal of Business Research 58(11)
1562-1572
Oberoi U amp Hales C (1990) Assessing the quality of the conference hotel product
London The Service Industries Journal 10(4) 700-722
Ostrowski PL Orsquobrien TV amp Gordon GL (1993) Service quality and customer
loyalty in the commercial airline industry Journal of Travel Research 32(2)
16-24
Palin M (1996) Flight catering transportation and loading (2nd
ed) London Longman
Group Limited
Panittumrong P (2004) The consumerrsquos opinion towards Clark Hatch Fitness Center
Master Project MBA (Management) Bangkok Graduate School
Srinakharinwirot University Photocopied
Parasuraman A Zeitmal VA amp Berry LL (1985) A concept model of service
quality and its implications for future research Journal of Marketing 49 41-50
Parasuraman A Zeitmal VA amp Berry LL (1988) SERVQUAL a multiple item
scale for measuring customer perceptions of service quality Journal of
Retailing 64(1) 64
Parasuraman A amp Berry LL (1991) Marketing services competing through quality
NY The Free Press
52
Pirsig RM (1987) Zen and the art of motorcycle maintenance an inquiry into values
(Mass Market Paperback) NY Bantam Books
Poonlarbtawee K (1987) Statistics for research Bangkok Physic Center Printing
Reid RD amp Bojanic DC (2001) Hospitality marketing management NJ John Wiley
amp Son Inc
Rueangthanakiet P (2008) Memberrsquos satisfaction of fitness service quality a case study
of California Wow Xperience Plc Masterrsquos Project MA (Business English for
International Communication) Bangkok Graduate School Srinakharinwirot
University Photocopied
Sachukorn S (2006) Reception and service excellence Bangkok Saitharn
Schiffman LG amp Kanuk LL (1994) Consumer behavior (5th
ed) London Prentice-
Hall International
Somwang C (2008) An assessment of passengersrsquo views of service quality in Thai low
cost carriers Inter Program MA (Communicative English) Bangkok
Ramkhamhaeng University Photocopied
Suriya K (2005) Airline market segments after low cost airlines in Thailand passenger
classification using neural networks and logit model with selective learning
Faculty of Economics Chiangmai Chiangmai University
Suthirungkul N (2003) The study of customer expectations and perceptions of service
quality of the Clark Hatch fitness center of Silom road branch Bangkok Thesis
MBA (Business Administration) Bangkok Assumption University
Photocopied
Thai Airways International (2008) Traffic program information (Introduction of summer
200809) Bangkok THAI Printing Office
53
Thai Airways International (2009) Traffic program information (Introduction of winter
200910) Bangkok THAI Printing Office
THAI AIRWAYS INTL Official 4-Star Ranking of Product and Service Quality (2009
October) Retrieved February 14 2010 from
httpwwwairlinequalitycomAirlinesTGhtml
Travel Planning (2010 February 12) Retrieved February 12 2010 from
httpwwwsuite101comlessoncfm1848818243
Wangpen N amp Inthornma S (2007) Membersrsquo satisfaction in fitness centers in
Bangkok Thesis MA (Hotel and Tourism Management) Bangkok Graduate
School Naresuan University Photocopied
Zeithaml VA amp Bitner MJ (2000) Services marketing (2nd
ed) NY McGraw Hill
Zeithaml VA Parasuraman A amp Berry LL (1990) Delivering quality service
balancing customer perceptions and expectations NY Free Press
APPENDICES
55
APPENDIX A
แบบทดสอบความพงพอใจของผโดยสารการบนไทย
เรยนทานผโดยสารทเคารพ กระผมนาย วลาศ มนคงวณชกล พนกงานตอนรบสายการบนไทย และนกศกษาปรญญาโท หลกสตรภาษาองกฤษธรกจเพอการสอสารนานาชาต มหาวทยาลยศรนครนทรวโรฒ ไดจดท าแบบสอบถามนเพอเปนสวนหนงของการส ารวจความพงพอใจของผโดยสารทมตอคณภาพงานบรการ เทยวบนภายในประเทศของการบนไทย โดยมงหวงทจะน าขอมลทไดรบจากการส ารวจมาเปนประโยชนตอการสงเสรมสนบสนนการปฏบตงานใหเกดประสทธผล จงขอความกรณาจากทานในการตอบแบบสอบถามทกขอตามขอเทจจรงและความเหนของทาน ขอมลทงหมดเปนความลบ จะใชเพอการวจยเทานน และขอขอบคณในความรวมมอของทาน
helliphelliphelliphelliphelliphelliphelliphelliphelliphelliphelliphelliphelliphelliphelliphelliphelliphelliphelliphelliphelliphelliphelliphelliphelliphelliphelliphelliphelliphelliphellip
ค าชแจง โปรดท าเครองหมาย (x) ลงในชองวาง ทตรงกบค าตอบของทาน
ตอนท 1 ขอมลทวไป
1 เพศ ( ) ชาย ( ) หญง 2 อาย ( ) ตากวา 20 ป ( ) 21-40 ป ( ) 41-60 ป ( ) 60 ปขนไป 3 อาชพ ( ) ขาราชการ รฐวสาหกจ ( ) พนกงานบรษท ( ) ธรกจสวนตว ( ) นกเรยน นกศกษา ( ) เกษยณ ( ) อนๆ 4 รายได เดอน ( ) ตากวา 20000 ( ) 20001- 40000 บาท ( ) 40001- 60000 บาท ( ) 60001 บาท ขนไป 5 จดประสงคการเดนทาง ( ) ธรกจ ( ) พกผอน ( ) เยยมเยยนญาตมตร เพอนฝง ( ) อนๆ 6 ความถในการเดนทางกบการบนไทย (ในรอบ 12 เดอน) ( ) ครงแรก ( ) 2-3 ครง ( ) 4-10 ครง ( ) 10 ครงขนไป
56
ตอนท 2 ความพงพอใจของทานตอการบรการ (5 = เหนดวยอยางยง 4= เหนดวย 3= ปานกลาง 2=ไมเหนดวย 1=ไมเหนดวยอยางยง)
ระดบความพงพอใจ
การบรการของการบนไทย 5 4 3 2 1 1 เมอเจาหนาทสญญาทจะใหบรการทานในเรองใด จะทาตามนนเสมอ
2 การใหบรการของเจาหนาท สรางความเชอมนใหกบทาน
3 อปกรณบนเครองบนมรปแบบททนสมย (เชน จอทว ทนง)
4 บรษทฯกาหนดเวลาการใหบรการบนเครองเหมาะสม
5 เจาหนาทใหบรการทดนบตงแตกาวแรกบนเครอง
6 เจาหนาทมความตงใจดทจะชวยเหลอทาน เมอทานมปญหา
7 ทานรสกปลอดภยเมออยบนเครองบน
8 สงอานวยความสะดวกตางๆบนเครอง มรปลกษณทดงดดใจ (เชน กลองอาหาร) 9 เจาหนาทไมเขาใจความตองการของทาน ในบางกรณ
10 เจาหนาทไมไดระบเวลาในการใหบรการผโดยสารบนเครองทแนนอน 11 เจาหนาทพยายามทางานโดยไมใหเกดขอผดพลาด
12 เจาหนาทปฎบตงานดวยความสภาพเสมอ
13 เจาหนาทแตงกายเรยบรอยและดด
14 บรษทฯใหความเอาใจใสกบผโดยสารเปนรายบคคล
15 บางครงเจาหนาทไมเตมใจทจะใหบรการผโดยสาร
16 บรษทใหบรการทานตรงเวลาทกาหนด
17 เจาหนาทสามารถใหขอมลเกยวกบการเดนทางไดอยางถกตอง
18 เอกสารของบรษทฯทเกยวของกบการบรการ (เชน แผนพบ นตยสาร) มขอมลครบถวน และรปแบบสวยงาม 19 เจาหนาทใหบรการทานดวยสมผสความเปนไทย
20 เจาหนาทใหบรการผโดยสารอยางรวดเรว
ทานจะกลบมาใชบรการของการบนไทยตอไป จะใชบรการตอไป ไมใชบรการ
ขอเสนอแนะ_______________________________________________________
_____________________________________________________________ ขอบพระคณอยางสงในความรวมมอของทาน
57
APPENDIX B
Questionnaire
Dear Honorable Passengers
My name is Wilas Mankongvanichkul -- a THAI cabin crew and masterrsquos student of business English
for international communication program Srinakharinwirot University This questionnaire is about
an exploration of passengersrsquo satisfaction with service quality of Thai Airways International (TG)rsquos
domestic flights Data gained will be utilized for THAI service operation Please kindly complete the
questionnaire The data gained will be kept confidential and used for the research study only Your
kind cooperation is greatly appreciated
helliphelliphelliphelliphelliphelliphelliphelliphelliphelliphelliphelliphelliphelliphelliphelliphelliphelliphelliphelliphelliphelliphelliphelliphelliphellip
Direction Please mark (x) your answer in the space provided
Part 1 Personal Information
1 Gender
( ) Male ( ) Female
2 Age
( ) Under 20 years ( ) 21-40 years
( ) 41-60 years ( ) Above 60 years
3 Occupation
( ) Government official State enterprise employee
( ) Business employee
( ) Business owner ( ) Student
( ) Retiree ( ) Others
4 Monthly income
( ) Up to 20000 baht ( ) 20001- 40000 baht
( ) 40001 ndash 60000 baht ( ) 60001 baht and above
5 Purpose of travel
( ) Business trips ( ) Holidays
( ) Visits ( ) Others
6 Frequency in traveling with THAI (during the last 12 months)
( ) First time ( ) 2-3 times
( ) 4-10 times ( ) More than 10 times
58 Part 2 Your satisfaction with the service
(5=Strongly Agree 4= Agree 3=Uncertain 2=Disagree 1= Strongly Disagree)
Level of Satisfaction
The Service of THAI 5 4 3 2 1
1 When cabin crew promise to do something by a
certain time they do so
2 You can trust THAI cabin crew
3 TG has modern on board equipment
(such as TV screen passengersrsquo seats)
4 TG has operating hours on board convenient to all
passengers
5 Cabin crew offer good services upon boarding
6 When passengers have a problem cabin crew show a
sincere interest in solving it
7 Passengers feel safe on-board
8 The physical facilities of TG are visually appealing
(such as meal boxes)
9 Cabin crew do not understand your special needs in
some cases
10 Cabin crew do not tell passengers exactly when
services will be offered
11 Cabin crew insist on error-free records
12 Cabin crew are consistently courteous to passengers
13 Cabin crew are well-dressed and neat in appearance
14 TG gives passengers individual attention
15 Cabin crew are not always willing to help passengers
16 TG provides its services at the time it promises to
do so
17 Cabin crew are knowledgeable to answer passengers
travel-related questions
18 Documents about service are informative and appealing
(such as pamphlets and magazines)
19 Services provided have a ldquoThai Touchrdquo
20 Cabin crew are quick to respond to passengersrsquo requests
Will you come back for TGrsquos service Yes No
Suggestions________________________________________________________________
________________________________________________________________________ Thank you very much for your kind cooperation
59
APPENDIX C
Questionnaire Specification Based on SERVQUAL measurement (Parasuraman et al 1985)
Passengers satisfaction level toward service quality factors
No Service Quality Features (RATER)
Str
on
gly
ag
ree
Ag
ree
Un
certa
in
Dis
ag
ree
Str
on
gly
Dis
ag
ree
(5) (4) (3) (2) (1)
1 When cabin crew promise to do something by a certain time they do so Reliability
2 You can trust THAI cabin crew Assurance
3 TG has modern on board equipment (such as TV screen passengersrsquo seats) Tangibles
4 TG has operating hours on board convenient to all passengers Empathy
5 Cabin crew offer good services upon boarding Responsiveness
6 When passengers have a problem cabin crew show a sincere interest in solving it
Reliability
7 Passengers feel safe on-board Assurance
8 The physical facilities of TG are visually appealing (such as meal boxes) Tangibles
9 Cabin crew do not always understand your special needs in some cases Empathy
10 Cabin crew do not tell passengers exactly when services will be offered Responsiveness
11 Cabin crew insist on error-free records Reliability
12 Cabin crew are consistently courteous to passengers Assurance
13 Cabin crew are well-dressed and neat in appearance Tangibles
14 TG gives passengers individual attention Empathy
15 Cabin crew are not always willing to help passengers Responsiveness
16 TG provides its services at the time it promises to do so Reliability
17 Cabin crew are knowledgeable to answer passengers travel-related questions Assurance
18 TGs documents associated with services are informative and appealing (such as pamphlets and magazines)
Tangibles
19 Services provided have a ldquoThai Touchrdquo Empathy
20 Cabin crew are quick to respond to passengersrsquo requests Responsiveness
VITAE
61
VITAE
Name Wilas Mankongvanichkul
Date of Birth February 14 1980
Place of Birth Bangkok
Address 688 Soi Phaholyothin 32 Chankasem Jatuchak
Bangkok 10900
Present Occupation Cabin Crew
Thai Airways International Public Company Limited
89 Vibhavadi Rangsit Road Bangkok 10110
Education Background
2010 Master of Art (Business English for International
Communication)
Srinakharinwirot University
2001 Bachelor of Business Administration Bangkok University
1997 High School Saint Dominic School
- Cover
- Abstract
- Chapter 1
- Chapter 2
- Chapter 3
- Chapter 4
- Chapter 5
- Bibliography
- Appendix
- Vitae
-
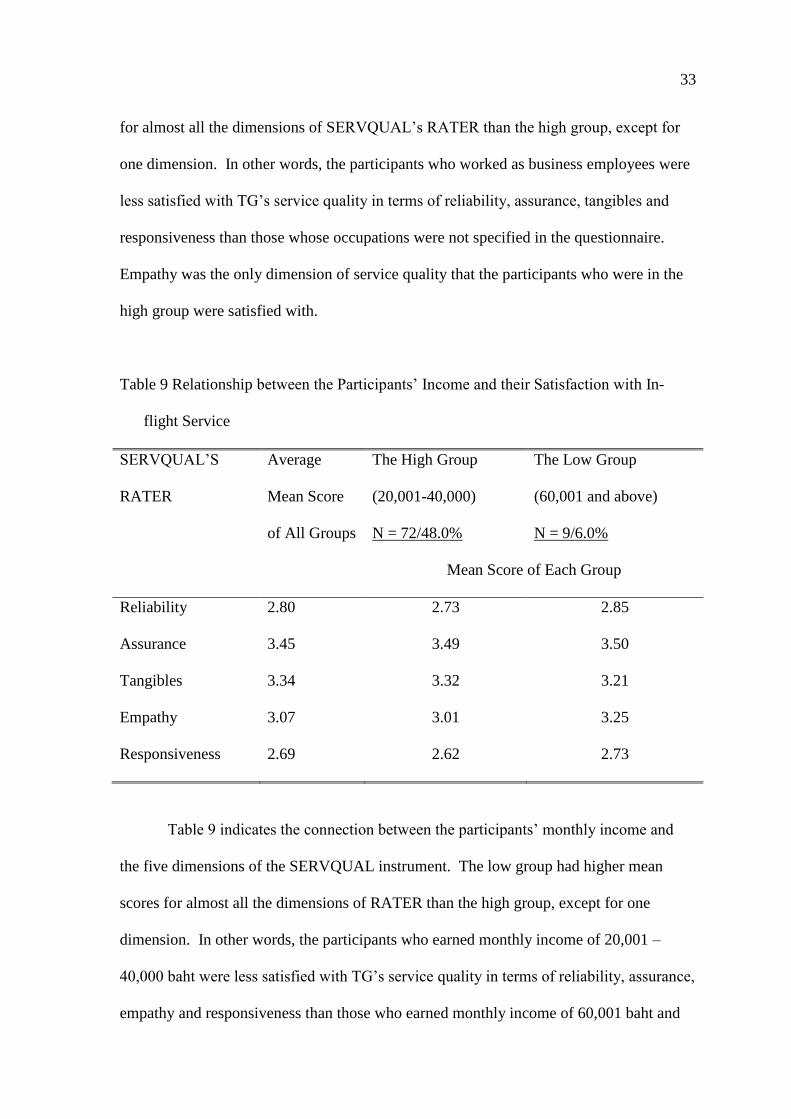

REFERENCES
REFERENCES
Alegre J amp Pou L (2006) An analysis of the microeconomic determinants of travel
frequency Department of Applied Economics Universitat de les Illes Balears
Bojanic DC (1991) Quality measurement in professional service firms Journal of
Professional Service Marketing 7(2) 27-37
Bojanic D C amp Rosen L D (1994) Measuring service quality in restaurants An
application of the SERVQUAL model Journal of Hospitality Research 18(1)
3-14
Boontaganon W (2002) The study of service quality of fast-food restaurants in Bangkok
using SERVQUAL measurement Thesis MBA (Business Administration)
Bangkok Assumption University Photocopied
Buttle F (1996) SERVQUAL review critique research agenda European Journal of
Marketing 30(1) 8-31
CarmanJ M (1990) Consumer perceptions of service quality An assessment of the
SERVQUAL dimensions Journal of Retailing 69 33-35
Cheaosakul W (2004) Consumers perception of service quality a case study of Thai
Airways International Plc Thesis MBA Bangkok Assumption University
Photocopied
Fick RG amp Ritchie JRB (1991) Measuring service quality in the travel and tourism
industry Journal of Travel Research 30(2) 2-9
Fornell C (1992) A national customer satisfaction barometer the Swedish experience
Journal of Marketing 56 6-21
Gabbie O amp OrsquoNeill M (1997) SERVQUAL and the Northern Ireland hotel sector a
comparative analysis part 2 Managing Service Quality 17(1) 43-49
50
Gilbert DH (1999) Marketing connecting with customers (2nd
ed) Upper Saddle
River NJ Prentice Hall
Gilbert D amp Wong KCR (2002) Passenger expectations and airline services a
Hong Kong based study Surrey Management School Surrey University of
Surrey
Gitman LJ amp Carl DM (2005) The future of business the essentials Mason Ohio
South-Western College Pub
Grifin J (1995) Customer loyalty NY Lexington Book
Gronroos C (1978) A service-oriented approach to marketing of services European
Journal of Marketing 12(8) 588-601
Hennig-Thurau T amp Klee A (1997) The impact of customer satisfaction and
relationship quality on customer retention a critical reassessment and model
development Masterrsquos Project MA (Psychology amp Marketing) Hanover
University of Hanover
Heesawat C (2005) The opportunities and problems in making services more tangible
PhD Dissertation Bangkok Assumption University Photocopied
Juran JM amp Gryna FM (1974) Quality control handbook NY McGraw-Hill
Kholthanasep G (2001) A study of customerrsquos expectations and perceptions of service
quality delivery by first class hotels in Bangkok metropolitan area Thesis
MBA Bangkok Assumption University Photocopied
Kotler P amp Scheff J (1997) Standing room only strategies for marketing the
performing arts Boston Mass Harvard Business School Press
Kotler P (1997) Marketing management analysis planning and control (9th
ed) Upper
Saddle River NJ Prentice Hall
51
Kotler P Bowen J amp Makens J (1999) Marketing for hospitality and tourism (2nd
ed) NJ Prentice Hall
Kotler P (2000) Marketing management the millennium edition (10th
ed) NJ Prentice
Hall
Lages FL amp Fernandes CJ (2005) The SERVQUAL scale a multi-item instrument
for measuring service personal values Journal of Business Research 58(11)
1562-1572
Oberoi U amp Hales C (1990) Assessing the quality of the conference hotel product
London The Service Industries Journal 10(4) 700-722
Ostrowski PL Orsquobrien TV amp Gordon GL (1993) Service quality and customer
loyalty in the commercial airline industry Journal of Travel Research 32(2)
16-24
Palin M (1996) Flight catering transportation and loading (2nd
ed) London Longman
Group Limited
Panittumrong P (2004) The consumerrsquos opinion towards Clark Hatch Fitness Center
Master Project MBA (Management) Bangkok Graduate School
Srinakharinwirot University Photocopied
Parasuraman A Zeitmal VA amp Berry LL (1985) A concept model of service
quality and its implications for future research Journal of Marketing 49 41-50
Parasuraman A Zeitmal VA amp Berry LL (1988) SERVQUAL a multiple item
scale for measuring customer perceptions of service quality Journal of
Retailing 64(1) 64
Parasuraman A amp Berry LL (1991) Marketing services competing through quality
NY The Free Press
52
Pirsig RM (1987) Zen and the art of motorcycle maintenance an inquiry into values
(Mass Market Paperback) NY Bantam Books
Poonlarbtawee K (1987) Statistics for research Bangkok Physic Center Printing
Reid RD amp Bojanic DC (2001) Hospitality marketing management NJ John Wiley
amp Son Inc
Rueangthanakiet P (2008) Memberrsquos satisfaction of fitness service quality a case study
of California Wow Xperience Plc Masterrsquos Project MA (Business English for
International Communication) Bangkok Graduate School Srinakharinwirot
University Photocopied
Sachukorn S (2006) Reception and service excellence Bangkok Saitharn
Schiffman LG amp Kanuk LL (1994) Consumer behavior (5th
ed) London Prentice-
Hall International
Somwang C (2008) An assessment of passengersrsquo views of service quality in Thai low
cost carriers Inter Program MA (Communicative English) Bangkok
Ramkhamhaeng University Photocopied
Suriya K (2005) Airline market segments after low cost airlines in Thailand passenger
classification using neural networks and logit model with selective learning
Faculty of Economics Chiangmai Chiangmai University
Suthirungkul N (2003) The study of customer expectations and perceptions of service
quality of the Clark Hatch fitness center of Silom road branch Bangkok Thesis
MBA (Business Administration) Bangkok Assumption University
Photocopied
Thai Airways International (2008) Traffic program information (Introduction of summer
200809) Bangkok THAI Printing Office
53
Thai Airways International (2009) Traffic program information (Introduction of winter
200910) Bangkok THAI Printing Office
THAI AIRWAYS INTL Official 4-Star Ranking of Product and Service Quality (2009
October) Retrieved February 14 2010 from
httpwwwairlinequalitycomAirlinesTGhtml
Travel Planning (2010 February 12) Retrieved February 12 2010 from
httpwwwsuite101comlessoncfm1848818243
Wangpen N amp Inthornma S (2007) Membersrsquo satisfaction in fitness centers in
Bangkok Thesis MA (Hotel and Tourism Management) Bangkok Graduate
School Naresuan University Photocopied
Zeithaml VA amp Bitner MJ (2000) Services marketing (2nd
ed) NY McGraw Hill
Zeithaml VA Parasuraman A amp Berry LL (1990) Delivering quality service
balancing customer perceptions and expectations NY Free Press
APPENDICES
55
APPENDIX A
แบบทดสอบความพงพอใจของผโดยสารการบนไทย
เรยนทานผโดยสารทเคารพ กระผมนาย วลาศ มนคงวณชกล พนกงานตอนรบสายการบนไทย และนกศกษาปรญญาโท หลกสตรภาษาองกฤษธรกจเพอการสอสารนานาชาต มหาวทยาลยศรนครนทรวโรฒ ไดจดท าแบบสอบถามนเพอเปนสวนหนงของการส ารวจความพงพอใจของผโดยสารทมตอคณภาพงานบรการ เทยวบนภายในประเทศของการบนไทย โดยมงหวงทจะน าขอมลทไดรบจากการส ารวจมาเปนประโยชนตอการสงเสรมสนบสนนการปฏบตงานใหเกดประสทธผล จงขอความกรณาจากทานในการตอบแบบสอบถามทกขอตามขอเทจจรงและความเหนของทาน ขอมลทงหมดเปนความลบ จะใชเพอการวจยเทานน และขอขอบคณในความรวมมอของทาน
helliphelliphelliphelliphelliphelliphelliphelliphelliphelliphelliphelliphelliphelliphelliphelliphelliphelliphelliphelliphelliphelliphelliphelliphelliphelliphelliphelliphelliphelliphellip
ค าชแจง โปรดท าเครองหมาย (x) ลงในชองวาง ทตรงกบค าตอบของทาน
ตอนท 1 ขอมลทวไป
1 เพศ ( ) ชาย ( ) หญง 2 อาย ( ) ตากวา 20 ป ( ) 21-40 ป ( ) 41-60 ป ( ) 60 ปขนไป 3 อาชพ ( ) ขาราชการ รฐวสาหกจ ( ) พนกงานบรษท ( ) ธรกจสวนตว ( ) นกเรยน นกศกษา ( ) เกษยณ ( ) อนๆ 4 รายได เดอน ( ) ตากวา 20000 ( ) 20001- 40000 บาท ( ) 40001- 60000 บาท ( ) 60001 บาท ขนไป 5 จดประสงคการเดนทาง ( ) ธรกจ ( ) พกผอน ( ) เยยมเยยนญาตมตร เพอนฝง ( ) อนๆ 6 ความถในการเดนทางกบการบนไทย (ในรอบ 12 เดอน) ( ) ครงแรก ( ) 2-3 ครง ( ) 4-10 ครง ( ) 10 ครงขนไป
56
ตอนท 2 ความพงพอใจของทานตอการบรการ (5 = เหนดวยอยางยง 4= เหนดวย 3= ปานกลาง 2=ไมเหนดวย 1=ไมเหนดวยอยางยง)
ระดบความพงพอใจ
การบรการของการบนไทย 5 4 3 2 1 1 เมอเจาหนาทสญญาทจะใหบรการทานในเรองใด จะทาตามนนเสมอ
2 การใหบรการของเจาหนาท สรางความเชอมนใหกบทาน
3 อปกรณบนเครองบนมรปแบบททนสมย (เชน จอทว ทนง)
4 บรษทฯกาหนดเวลาการใหบรการบนเครองเหมาะสม
5 เจาหนาทใหบรการทดนบตงแตกาวแรกบนเครอง
6 เจาหนาทมความตงใจดทจะชวยเหลอทาน เมอทานมปญหา
7 ทานรสกปลอดภยเมออยบนเครองบน
8 สงอานวยความสะดวกตางๆบนเครอง มรปลกษณทดงดดใจ (เชน กลองอาหาร) 9 เจาหนาทไมเขาใจความตองการของทาน ในบางกรณ
10 เจาหนาทไมไดระบเวลาในการใหบรการผโดยสารบนเครองทแนนอน 11 เจาหนาทพยายามทางานโดยไมใหเกดขอผดพลาด
12 เจาหนาทปฎบตงานดวยความสภาพเสมอ
13 เจาหนาทแตงกายเรยบรอยและดด
14 บรษทฯใหความเอาใจใสกบผโดยสารเปนรายบคคล
15 บางครงเจาหนาทไมเตมใจทจะใหบรการผโดยสาร
16 บรษทใหบรการทานตรงเวลาทกาหนด
17 เจาหนาทสามารถใหขอมลเกยวกบการเดนทางไดอยางถกตอง
18 เอกสารของบรษทฯทเกยวของกบการบรการ (เชน แผนพบ นตยสาร) มขอมลครบถวน และรปแบบสวยงาม 19 เจาหนาทใหบรการทานดวยสมผสความเปนไทย
20 เจาหนาทใหบรการผโดยสารอยางรวดเรว
ทานจะกลบมาใชบรการของการบนไทยตอไป จะใชบรการตอไป ไมใชบรการ
ขอเสนอแนะ_______________________________________________________
_____________________________________________________________ ขอบพระคณอยางสงในความรวมมอของทาน
57
APPENDIX B
Questionnaire
Dear Honorable Passengers
My name is Wilas Mankongvanichkul -- a THAI cabin crew and masterrsquos student of business English
for international communication program Srinakharinwirot University This questionnaire is about
an exploration of passengersrsquo satisfaction with service quality of Thai Airways International (TG)rsquos
domestic flights Data gained will be utilized for THAI service operation Please kindly complete the
questionnaire The data gained will be kept confidential and used for the research study only Your
kind cooperation is greatly appreciated
helliphelliphelliphelliphelliphelliphelliphelliphelliphelliphelliphelliphelliphelliphelliphelliphelliphelliphelliphelliphelliphelliphelliphelliphelliphellip
Direction Please mark (x) your answer in the space provided
Part 1 Personal Information
1 Gender
( ) Male ( ) Female
2 Age
( ) Under 20 years ( ) 21-40 years
( ) 41-60 years ( ) Above 60 years
3 Occupation
( ) Government official State enterprise employee
( ) Business employee
( ) Business owner ( ) Student
( ) Retiree ( ) Others
4 Monthly income
( ) Up to 20000 baht ( ) 20001- 40000 baht
( ) 40001 ndash 60000 baht ( ) 60001 baht and above
5 Purpose of travel
( ) Business trips ( ) Holidays
( ) Visits ( ) Others
6 Frequency in traveling with THAI (during the last 12 months)
( ) First time ( ) 2-3 times
( ) 4-10 times ( ) More than 10 times
58 Part 2 Your satisfaction with the service
(5=Strongly Agree 4= Agree 3=Uncertain 2=Disagree 1= Strongly Disagree)
Level of Satisfaction
The Service of THAI 5 4 3 2 1
1 When cabin crew promise to do something by a
certain time they do so
2 You can trust THAI cabin crew
3 TG has modern on board equipment
(such as TV screen passengersrsquo seats)
4 TG has operating hours on board convenient to all
passengers
5 Cabin crew offer good services upon boarding
6 When passengers have a problem cabin crew show a
sincere interest in solving it
7 Passengers feel safe on-board
8 The physical facilities of TG are visually appealing
(such as meal boxes)
9 Cabin crew do not understand your special needs in
some cases
10 Cabin crew do not tell passengers exactly when
services will be offered
11 Cabin crew insist on error-free records
12 Cabin crew are consistently courteous to passengers
13 Cabin crew are well-dressed and neat in appearance
14 TG gives passengers individual attention
15 Cabin crew are not always willing to help passengers
16 TG provides its services at the time it promises to
do so
17 Cabin crew are knowledgeable to answer passengers
travel-related questions
18 Documents about service are informative and appealing
(such as pamphlets and magazines)
19 Services provided have a ldquoThai Touchrdquo
20 Cabin crew are quick to respond to passengersrsquo requests
Will you come back for TGrsquos service Yes No
Suggestions________________________________________________________________
________________________________________________________________________ Thank you very much for your kind cooperation
59
APPENDIX C
Questionnaire Specification Based on SERVQUAL measurement (Parasuraman et al 1985)
Passengers satisfaction level toward service quality factors
No Service Quality Features (RATER)
Str
on
gly
ag
ree
Ag
ree
Un
certa
in
Dis
ag
ree
Str
on
gly
Dis
ag
ree
(5) (4) (3) (2) (1)
1 When cabin crew promise to do something by a certain time they do so Reliability
2 You can trust THAI cabin crew Assurance
3 TG has modern on board equipment (such as TV screen passengersrsquo seats) Tangibles
4 TG has operating hours on board convenient to all passengers Empathy
5 Cabin crew offer good services upon boarding Responsiveness
6 When passengers have a problem cabin crew show a sincere interest in solving it
Reliability
7 Passengers feel safe on-board Assurance
8 The physical facilities of TG are visually appealing (such as meal boxes) Tangibles
9 Cabin crew do not always understand your special needs in some cases Empathy
10 Cabin crew do not tell passengers exactly when services will be offered Responsiveness
11 Cabin crew insist on error-free records Reliability
12 Cabin crew are consistently courteous to passengers Assurance
13 Cabin crew are well-dressed and neat in appearance Tangibles
14 TG gives passengers individual attention Empathy
15 Cabin crew are not always willing to help passengers Responsiveness
16 TG provides its services at the time it promises to do so Reliability
17 Cabin crew are knowledgeable to answer passengers travel-related questions Assurance
18 TGs documents associated with services are informative and appealing (such as pamphlets and magazines)
Tangibles
19 Services provided have a ldquoThai Touchrdquo Empathy
20 Cabin crew are quick to respond to passengersrsquo requests Responsiveness
VITAE
61
VITAE
Name Wilas Mankongvanichkul
Date of Birth February 14 1980
Place of Birth Bangkok
Address 688 Soi Phaholyothin 32 Chankasem Jatuchak
Bangkok 10900
Present Occupation Cabin Crew
Thai Airways International Public Company Limited
89 Vibhavadi Rangsit Road Bangkok 10110
Education Background
2010 Master of Art (Business English for International
Communication)
Srinakharinwirot University
2001 Bachelor of Business Administration Bangkok University
1997 High School Saint Dominic School
- Cover
- Abstract
- Chapter 1
- Chapter 2
- Chapter 3
- Chapter 4
- Chapter 5
- Bibliography
- Appendix
- Vitae
-
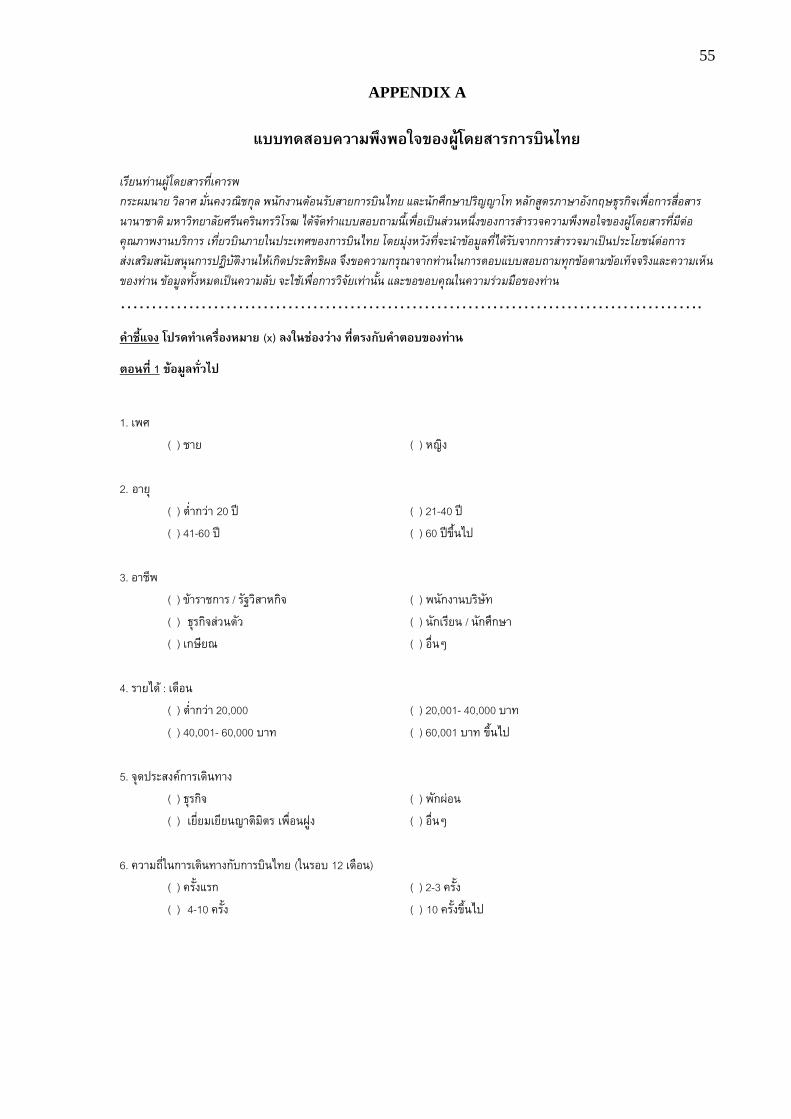
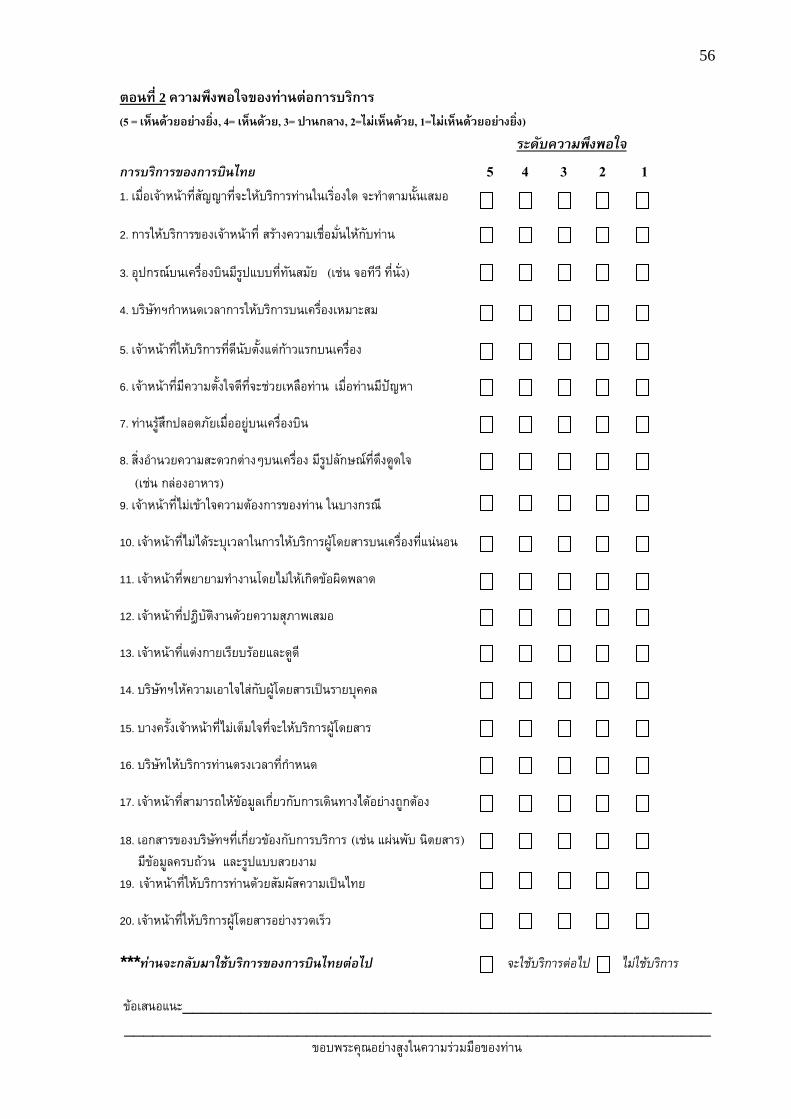
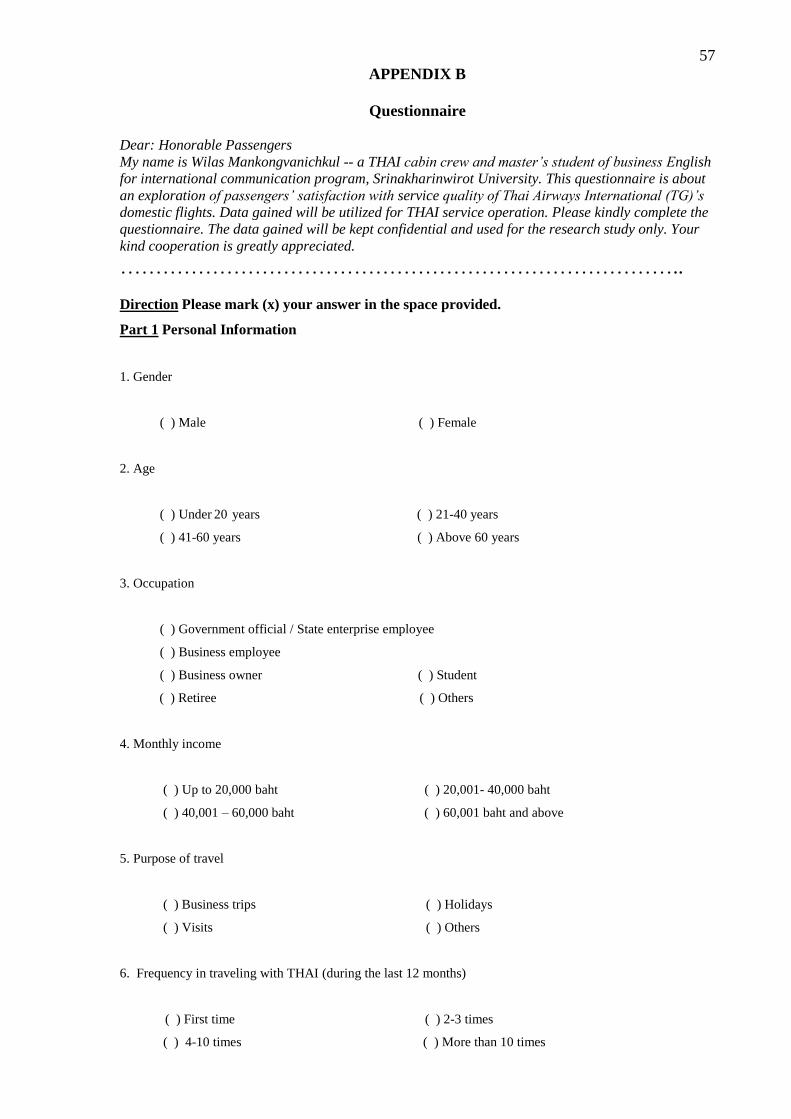

VITAE
61
VITAE
Name Wilas Mankongvanichkul
Date of Birth February 14 1980
Place of Birth Bangkok
Address 688 Soi Phaholyothin 32 Chankasem Jatuchak
Bangkok 10900
Present Occupation Cabin Crew
Thai Airways International Public Company Limited
89 Vibhavadi Rangsit Road Bangkok 10110
Education Background
2010 Master of Art (Business English for International
Communication)
Srinakharinwirot University
2001 Bachelor of Business Administration Bangkok University
1997 High School Saint Dominic School
- Cover
- Abstract
- Chapter 1
- Chapter 2
- Chapter 3
- Chapter 4
- Chapter 5
- Bibliography
- Appendix
- Vitae
-