a study of thermal fatigue . acceleration in box beams...
TRANSCRIPT

C.P. No. 1342
PROCUREMENT EXECUTIVE, MINISTRY OF DEFENCE
AERONAUTICAL RESEARCH COUNCIL
A Study of Thermal Fatigue .
Acceleration in Box Beams
under Mechanical and Thermal Stress
bY
F. E. Kiddle, R. 1. Kite and R. F. Mousley
Structures Dept., R.A.E., Farnborough
LONDON: HER MAJESTY’S STATIONERY OFFICE
1976
PRICE f2-30 NET

UDC 539.388.1 : 624.072.2 : 620.178.38
**CP No.1342 March, 1975
A STUDY OF THERMAL FATIGUE ACCELERATION IN BOX BEAMS UNDER MECHANICAL AND THERMAL STRESS
.
L F. E. Kiddle R. J. Kite
R. F. Mousley
In the full-scale fatigue testing of the Concorde there is a need to
accumulgte damage at a higher rate than in service in order to meet certifica- tion requirements. One contribution to the more rapid testing of the Concorde
comes from accelerating the rate of thermal fatigue damage by increasing the range of temperatures applied to the aircraft and hence increasing the associated thermal stress in each thermal cycle. This Report describes tests
in which thermal stresses were generated in a representative structural specimen and were adjusted to give a designed acceleration factor of 2. It is shown that
this method of accelerating thermal damage was reasonably accurate. Further work
is discussed which will investigate the acceleration of thermal fatigue damage under conditions more representative of Concorde in service and in the full- scale fatigue test, particularly in representing times at temperature.
* Replaces RAE Technical Report 75039 - ARC 36487.

I INTRODUCTION
2 SPECIMEN 3 TESTING RIG 4 FATIGUE TESTING
5 RESULTS
6 DISCUSSION
7 FUTURE WORK a CONCLUSIONS Appendix A Test specimen and attached transducers Appendix l3 Description and operation of testing rig Appendix C Flight-by-flight, load and temperature sequences used
in fatigue tests
Appendix D Temperature and stress distributions in the specimen and their relevance to the mode of fatigue cracking
Appendix E Variation in fatigue cracking at the butt strap joint in the box specimen
Appendix F Scatter in results
Appendix G The prediction of test acceleration factors
Appendix H Fatigue-creep interaction Tables 1-4
References Illustrations Figures
Page
3 4 4
5 7
8 10 11 13 14
16
18
20 22 23 25
27 31
1-31
4

3
1 INTRODUCTION
In the full-scale fatigue testing of the Concorde it is necessary to
accelerate the accumulation of fatigue damage to at least three times the rate in service. In full-scale testing of subsonic aircraft much testing time is saved by omitting from the test programme the periods during which the aircraft is on the ground or undergoing steady load in flight. However for supersonic aircraft it is important to simulate kinetic heating as this induces thermal stresses of significant magnitude in the structure and in addition it is
necessary to represent those phases of the flight cycle during which temperatures are stablising and time-dependent effects such as overageing and creep occur. The heating and cooling cycle which must therefore be applied is time consuming and new methods of test acceleration have to be developed to achieve the required rate of testing.
One contribution to the more rapid testing of the Concorde comes from accelerating the thermal fatigue by increasing the range of temperatures applied
to the aircraft and hence increasing the associated thermal stress amplitude. To study the feasibility of accelerating in this way , a progranuae of testing has been conducted at RAR in collaboration with RAC, to study the fatigue behaviour of structural box specimens under the combined action of mechanical and thermal
stress. The specimen, which was, at the time of its design, typical of Concorde fuselage structure, was tested under a flight-by-flight sequence of mechanical and thermal loading.
The acceleration technique is based on the assumption that thermal fatigue
damage can be increased in a predictable way by increasing the stress amplitude according to the S-N relationship obtained from mechanical fatigue tests at ambient temperature'. This presupposes that the mechanisms of thermal fatigue are fundamentally the same as those in mechanical fatigue and that changes in
time dependent effects such as overageing and creep are small.
In this investigation two different combinations of thermal and mechanical fatigue stresses were used and for each case the effect was studied of increas- ing thermal stress amplitude by a factor of 1.26 in order theoretically to
double the thermal damage caused by each thermal cycle; at the same time the balance between mechanical and thermal fatigue damage was preserved by doubling the number of mechanical loads per temperature cycle, In the following sections it is shown how thermal stresses were generated in a representative specimen

4
and how this method of accelerating testing by increasing the thermal fatigue damage accumulated per flight cycle achieved, with a reasonable degree of predictability, a test acceleration factor of 2. Further work is discussed
which will investigate the acceleration of thermal fatigue damage for tempera- tures and times at temperature more representative of Concorde in service and
in the full-scale fatigue test.
2 SPECIMEN
The specimens were fabricated boxes approximately 16 in square and 10 ft long, constructed mainly from CM001 sheet (clad RR58 material). They were
designed to be representative in material, design principles, and manufacturing techniques of fuselage structure at that time, but not to represent a specific part of the aircraft. The depth of the specimen was chosen so that significant thermal stresses developed when the specimen was differentially heated and cooled at rates not very different from those on the aircraft.
Fig.1 is a general diagram of the box specimen which consists of four riveted skin-stringer panels joined together by diaphragm plates and boom angles; the top and bottom panels form the flanges of the beam, and the side panels form the webs. Detailed drawings of the construction are shown in Figs.2 to 5 and a
description of the construction and instrumentation is given in Appendix A. The main area of interest in the specimen in this investigation is the aluminium- alloy-riveted butt strap joint at the centre of the tension flange (see Fig.5).
Each specimen was instrumented with strain gauges, platinum resistance thermometers and thermocouples in order to measure the thermal and mechanical stresses and the temperature distribution. The temperature of the box through- out the thermal cycle was controlled from platinum resistance thermometers and monitored from thermocouples.
3 TESTING RIG
'The function of the testing rig was to apply a programme of bending loads and temperature to the specimen. Loading of the specimen was in four-point
bending, and heating and cooling was by convection from air passed over the surface of the specimen. The general arrangement of the rig is shown in Fig.7; a description of the rig and its operation is given in Appendix B.
Thermal stresses were induced in the specimen by heating the web and flange surfaces differentially. A mechanical system of hydraulic jacks, control valves

5
and control gauges applied the mechanical loads to the specimen. The thermal
system consisted of two insulated duct systems, one to heat and cool the webs and the other to heat and cool the flanges (see Fig.7). The two duct systems were isolated from each other and were each connected to re-circulation circuits. Heat was obtained from banks of I kW commercial fire bars, and the coolant was a mixture of air and liquid nitrogen controlled to provide a predetermined cooling rate of the specimen.
4 FATIGUE TESTING
The fatigue test used a simplified flight-by-flight load and temperature sequence representative of that encountered in Concorde fuselage structure (see Fig.8). The mechanical loading simulated the ground-air-ground (GAG)
cycle, pressurisation cycle and gust cycles. During the cruise phase of this
flight cycle when the load was steady, thermal stresses were superimposed by heating and cooling the flanges and webs differentially to represent conditions in deep structure at the beginning and end of the supersonic cruise.
This general form of the flight cycle was adapted in three ways in order
to study particular aspects of the acceleration technique which will be discussed later in this section. In the first form of flight cycle, used for testing at ambient temperature under mechanical loading only (see Fig.Ba), load was first applied to represent take-off and fuselage pressurisation and
then reduced to represent depressurisation; this was followed by 13 cycles of loading to simulate gust loading, and finally the remaining mechanical load was removed to represent landing. This flight cycle differs from the mechanical loading part of the general form of the flight cycle (Fig.8) in that, to save testing time, the first load which represents the combination of ground- air load and fuselage pressurisation was not sustained. It should be noted that
in a limited number of tests additional high loads were included in this flight cycle (see Fig.9b) to represent the occasional rough flight encountered. A fuller description of the reasons for these tests is given in Appendix C. The second form of the flight cycle (see Fig.lOa) included thermal stresses
superimposed on the steady load representing the combination of ground-air and fuselage pressurisation loads. When the thermal stresses had reduced to zero, the mechanical load was reduced, cycled 13 times to represent gust loading and
finally removed to complete the flight cycle. In a third form of test (see

6
Fig.lOb), this flight cycle was followed by a single repetition of the mechanical load sequence. The two forms of test containing temperature cycles were differentiated by the term cycle ratio, the number of mechanical flight
cycles to each temperature cycle, e.g. a cycle ratio of one signifies that temperature was cycled during each flight cycle, and a cycle ratio of 2 signifies that temperature was cycled during alternate flight cycles. Appendix C
gives fuller details of the three forms of the flight cycles and describes how they are generated by the rig.
Table 1 lists the conditions for the 11 fatigue tests conducted. The
test conditions fall into two groups differing in the severity of the mechanical and thermal stresses imposed. In Group I which includes the bulk of the tests, the stress levels were sufficiently severe to achieve results in reasonably short testing times. Group 2 includes tests in which the gross stress levels were considered at the time of testing to correspond approximately to the air- craft design values and for which therefore testing times were appreciably longer.
The principle of the tests can be followed by reference to Group 1. Test Condition 1, which is under mechanical loading only at ambient temperature, provides a measure of the fatigue performance of the specimen which is useful
in the evaluation of cumulative damage behaviour in the tests with thermal cycling. Condition 2 employs the same mechanical loading with one temperature cycle of the flanges and webs applied during each test cycle at the time of
maximum mechanical stress (i.e. representative of supersonic flights in service). Condition 3 is similar but the thermal stresses are increased by adjusting the maximum and minimum temperature so that the temperature differential between flange and web is increased by a factor of 1.36 in both the heating and cooling phases. This increase was selected on the basis of an empirical relationship between thermal stress and temperature differential and of S-N data for small bolted joint specimens in aluminium alloy], with the object of increasing the thermal fatigue damage from each temperature cycle, considered in isolation, by a factor of 2. Condition 4 used a similar temperature cycle to that for Condition 3 but restored the original balance between mechanical and thermal fatigue damage by using a cycle ratio of 2, i.e. two mechanical test cycles were
associated with each of the enhanced temperature cycles. It will be appreciated from this that comparison of fatigue performance under Conditions 2 and 4 provides an indication of the success with which fatigue testing can be

7
accelerated by the techniques of increasing thermal stress amplitude while increasing the number of cycles of mechanical stress. Information from
Conditions I and 3 is useful in assessing the relative damage from mechanical
and thermal stresses.
The test conditions in Group 2 follow a similar pattern to Group 1 but employ less severe levels of mechanical and thermal stress. The temperature
cycle in the accelerated condition No.7 corresponds to the unaccelerated condition No.2 of Group 1.
We have seen that both groups of tests have been designed to test the
practicability of doubling thermal fatigue damage per temperature cycle by adjustment of temperature range. It should be noted however that no attempt has been made to relate the creep and overageing by, for example, adjusting times
at temperature, the principle concern being to achieve the reversal of thermal stress without delay. The implications of this will be discussed in section 6.
Fatigue tests were interrupted at intervals for crack detection. Visual examination of the general interior of the specimen was conducted with probes
inserted through access holes in the ends of the box and the area of the butt strap joint was also examined by radiographs. In general, fatigue cracks could be detected at the butt strap joint before propagating beyond the periphery of the rivet head, i.e. when somewhat smaller than 0.1 inch in length. The main
interest was damage at the butt strap joint and therefore when damage was detected at other locations it was repaired without delay.
5 RESULTS
Before presenting the results of the fatigue tests it is useful to consider the temperature and stress distributions achieved within the specimen and their relevance to the mode of fatigue cracking under mechanical loading only and under combined thermal and mechanical loading. It is shown in Appendix D that a satisfactory overall temperature distribution was obtained,
but due to local irregularities in temperature at the butt strap joint, strain
gauge readings near the joint were not reliable and it proved impossible to derive a satisfactory estimate of the relationship between thermal stress and temperature in this region. Due to the geometry of the box specimen, under mechanical fatigue loading alone cracking in the butt strap joint generally
initiated at the boom angle attachment which connects the flange tension skin to the shear webs (Figs.18-20). However when thermal stresses were induced in the

8
specimen, cracks initiated in the butt strap near the longitudinal centreline (see Figs.21 to 29) due to the thermal stress being a maximum at the centreline.
Two stages of fatigue damage were most readily identified in each specimen, the initiation of the first crack and complete failure. The first crack is defined as the earliest crack detected by radiographic examination and was generally smaller than 0.1 in in length (see section 4), and final failure is defined as static failure of the joint. In general, one of the two modes of cracking described above occurred in all tests, but in some tests the first crack was not positively identified because the frequency of radiographic exam- ination was inadequate, or again the condition of failure was not reached before
irreparable damage occurred at another location and stopped the test prematurely. However, sufficient information on the accumulation of damage in the butt strap was obtained so that in all tests a reasonably consistent estimate could be made of the numbers of mechanical flights to first crack and final failure (see Appendix E).
Table 2 presents results for the three specimens, numbers 2, 10 and 7, tested under the lower mechanical stress conditions (see Fig.9a - stress A) and Figs.18, 21 and 22 show damage in the butt straps. The results from the remain- ing specimens, tested under the higher mechanical stress condition (see Fig.9a - stress B) are presented in Table 3 and Figs.19, 20 and 23 to 28 illustrate the accumulation of damage in the butt straps.
6 DISCUSSION
The aim of this investigation is to substantiate one of the techniques used in Concorde full-scale testing viz. an increase in the thermal fatigue damage occurring during each temperature cycle in order to increase the rate
of testing. In the tests described the range of differential temperature, and hence the thermal stress amplitude, applied to the box specimens was increased
by an amount calculated to double the thermal fatigue damage during each temperature cycle; a corresponding increase in mechanical fatigue damage was achieved by doubling the number of mechanical load cycles applied. In the following discussion the success of this method of acceleration is assessed.
Assessments are made on the basis of the number of flight cycles leading to the first crack rather than to failure as, for reasons given in Appendix E, these are considered to give more reliable test results.
9
To assess the success of the method of test acceleration, it is first necessary to obtain a measure of the scatter in the results. In Appendix F,
it is shown how a measure of the scatter was obtained from pooling the results of tests which included a thermal fatigue cycle in the loading sequence. The
standard deviation obtained from these results is 0.021, which is consistent with fatigue behaviour under a load spectrum containing an appreciable number of large stress amplitudes. With this value of standard deviation, calculated
acceleration factors based on the log mean number of flights to first crack will be accurate to +lO% with 95% expectation.
Success of the method of test acceleration can be judged by a direct comparison of the number of flight cycles to reach a given state of damage in the accelerated and unaccelerated tests. By comparing the number of flight cycles to first crack for test conditions numbers 4 and 2 (stress condition B -
see Table 3), and for numbers 7 and 6 (stress condition A - see Table 2), test acceleration factors of 2.15 and 1.6 respectively were obtained as given in Table 4. Target values of acceleration factors on the basis of Separate Cycle damage accumulation (i.e. taking each separate loading action in sequence - see Appendix G) were 2.0 and 1.9 respectively - values calculated using measurements
of thermal stresses at station B (see Fig.17). It is seen that errors in pre-
diction lie within +20X, of the achieved values. In view of the earlier assessment that the accuracy of determination of the achieved test acceleration factors was +10X, it is concluded that acceleration in this test programme was predictable with reasonable accuracy.
It is explained in Appendix G that due to the inadequacy of the strain gauge readings it was not possible to predict acceleration factors by an alternative type of stress cycle analysis known as the 'Peak-to-Peak Method'. However in section 7 of this Report a second series of tests is described for which it is anticipated that comparison will be possible between the two methods of predicting acceleration factors. ,
Having discussed the test acceleration factors achieved, it is of interest to determine to what extent the thermal fatigue damage contributed to the test acceleration. This carries the implication that the separate cycle method is relevant and that there is no interaction between the mechanical and
thermal damage. On this basis formulae are defined in Fig.29 for the four test conditions studied from which it is possible to derive the thermal fatigue acceleration factors, i.e. the acceleration of the damage due to the thermal

10
stress cycle alone. Average damage rates calculated in this way are shown in
Tables 2 and 3. Using mean values for each test condition, the acceleration factors have been calculated for each accelerated test and are given in Table 4. Test Conditions 4 and 7 in this table are the fatigue tests in which thermal and mechanical fatigue are both accelerated under the two different temperature and stressing conditions; Condition 7 is the test with the smaller temperature range and mechanical fatigue stresses. It can be seen from this table that the
thermal fatigue acceleration factors are similar to the test acceleration factors; this is not surprising as, on a separate cycle assessment, the thermal damage is much greater than the mechanical damage.
This programme was designed to investigate the acceleration of thermal fatigue tests by increasing the temperature range and hence the thermal stresses applied to the specimen; no attempt was made to investigate the effect of creep or overageing on the life of the specimen by, for example, adjusting time at maximum temperature. Appendix H outlines some of the fatigue-creep interaction
information available at present and indicates the implication of this informa- tion to the programme reported here. It is concluded that the influence of fatigue-creep interaction in thermal fatigue is complex and to arrive at a quanti- tative measure of interaction effects, work is planned on simple structural elements in which thermal stresses, mechanical stresses and temperature will be closely controlled.
7 FUTURE WORK
The results obtained from the investigation reported here show that thermal damage can be accelerated with a reasonable degree of predictability by increas- ing the temperature range and hence the thermal stress induced in the specimen. However, the test conditions considered in this first series of tests are not
entirely realistic compared with service conditions for Concorde or with those to be used in the Concorde Major Fatigue Test. A second series of tests is now proceeding to extend the investigation in the following ways:
(a> Monel rivets instead of aluminium alloy rivets have been used to match the standard of the Major test specimen.
(b) The shear webs in the specimens have been strengthened to discourage pre- mature failure at this location.

11
(cl Levels of stress and temperature are more closely related to the aircraft and the major test, whilst ensuring failure of the specimens within an acceptable time. Some stress levels in the first series of tests were ~ unrealistically severe.
<h) The ratios of thermal to mechanical fatigue damage used in the first series of tests were large (ranging from 6:l to 14:l). In the second series two ratios are chosen (4:l and 2:3) to represent locations with severe and moderate rates of thermal damage.
(4 The principal concern of the first series of tests was to achieve the reversal of thermal stress without delay and hence no attempt was made to
represent correct times at temperature. In the second series of tests the
cruise at elevated temperature is represented for both the aircraft and the major
test.
(f) To improve assessment of acceleration factors, three specimens are tested
at each condition.
(Ed Visual and radiographic inspections are carried out at more frequent intervals in order to improve detection of the first crack and the definition of crack propagation rates.
(W Using an extensively instrumented specimen, the relationship between temperature and induced thermal stress has been established for positions
remote from the joint, and used in determining the temperature ranges for the
accelerated tests.
8 CONCLUSIONS
The following conclusions were reached from a study of thermal fatigue
acceleration in box beams under mechanical and thermal stresses.
(a> Under combined mechanical and thermal fatigue, the thermal fatigue can be
accelerated with a reasonable degree of predictability by increasing the temperature range and hence the thermal stress amplitude. A study of two
different flight cycles, representing differing proportions of thermal and
mechanical fatigue damage (14:l and 6:l) indicated test acceleration factors to the appearance of the first crack of 2.2 and 1.6 respectively compared with predictions of 2.0 and 1.9 by the Separate Cycle Method of damage accumulation.

12
(b) An extension of this work is in progress to investigate the acceleration of thermal fatigue damage under conditions more representative of those in the Concorde aircraft and in the Concorde Major Fatigue Test, particularly in representing times at temperature. In this new work more equitable proportions of thermal and mechanical fatigue will be represented; two conditions will be studied corresponding with ratios of 4:l and 2:3 between the thermal and mechanical fatigue damage.

13
Appendix A
TEST SPECIMEN AND ATTACHED TRANSDUCERS
The specimens used in this investigation were fabricated boxes, mainly
constructed from CM001 sheet (clad RR58 material), and were 16 in square and
approximately 10 ft long. They were designed to be representative of the
material, design and manufacturing techniques for fuselage structure which were
current at the time of construction, but did not represent a specific part of
the aircraft . All specimens were manufactured by BAC using the same techniques
as for aircraft production. Before final assembly, each specimen was instrumented
with strain gauges, thermocouples and platinum resistance thermometers.
Fig. I is a general diagram of the box specimen which consisted of four
riveted skin stringer panels joined together by diaphragm plates and boom
angles. Before assembly of the box, all parts were cleaned and then painted
with one coat of barium chromate primer ICI F580/2022. Joints were assembled
with Viton interfay which was allowed to cure naturally at room temperature.
Detailed drawings of the box construction are shown in Figs .2 to 5. The side
panel or web assembly (see Fig.21 had four loading attachments so that the box
could be loaded in four-point bending. Detailed drawings of the loading attach-
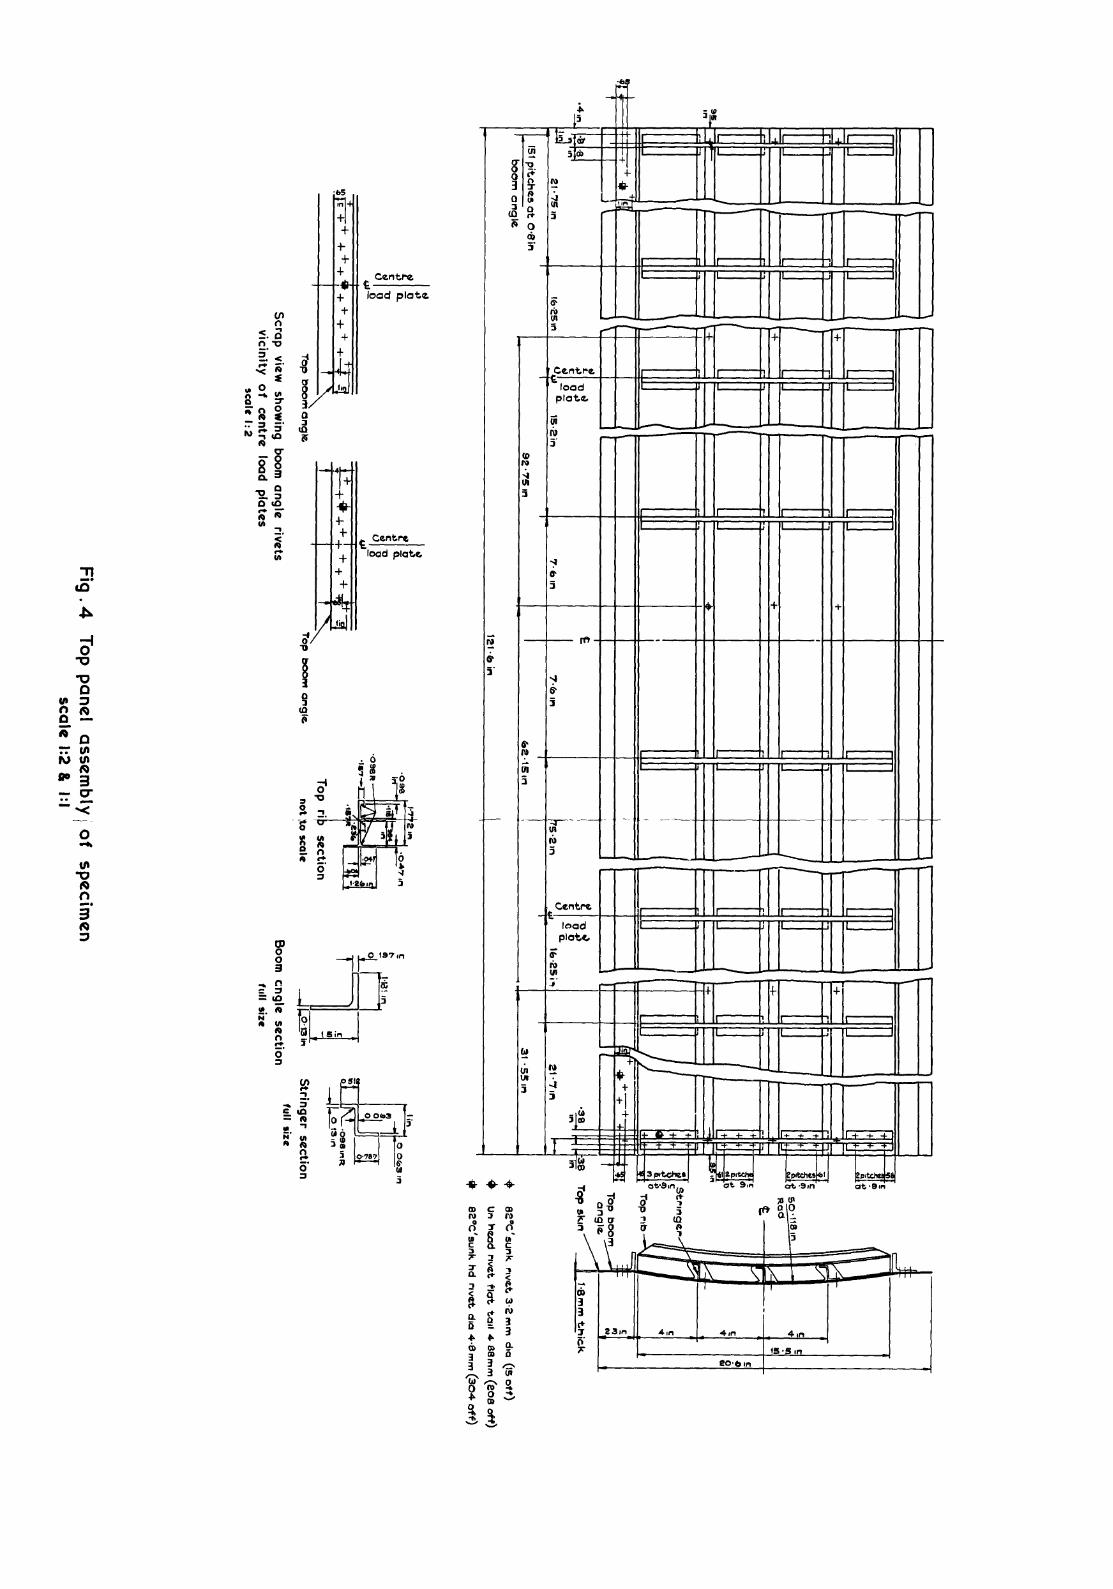
ments are ,given in Fig .3. The top panel of the box (see Fig.41 was normally
loaded in compression and was curved to inhibit buckling. The main area of
interest in the bottom panel or tension skin of the box was the centreline
aluminium-alloy-riveted butt strap joint (see Fig.5).
Each box was instrumented with strain gauges, platinum resistance thermo-
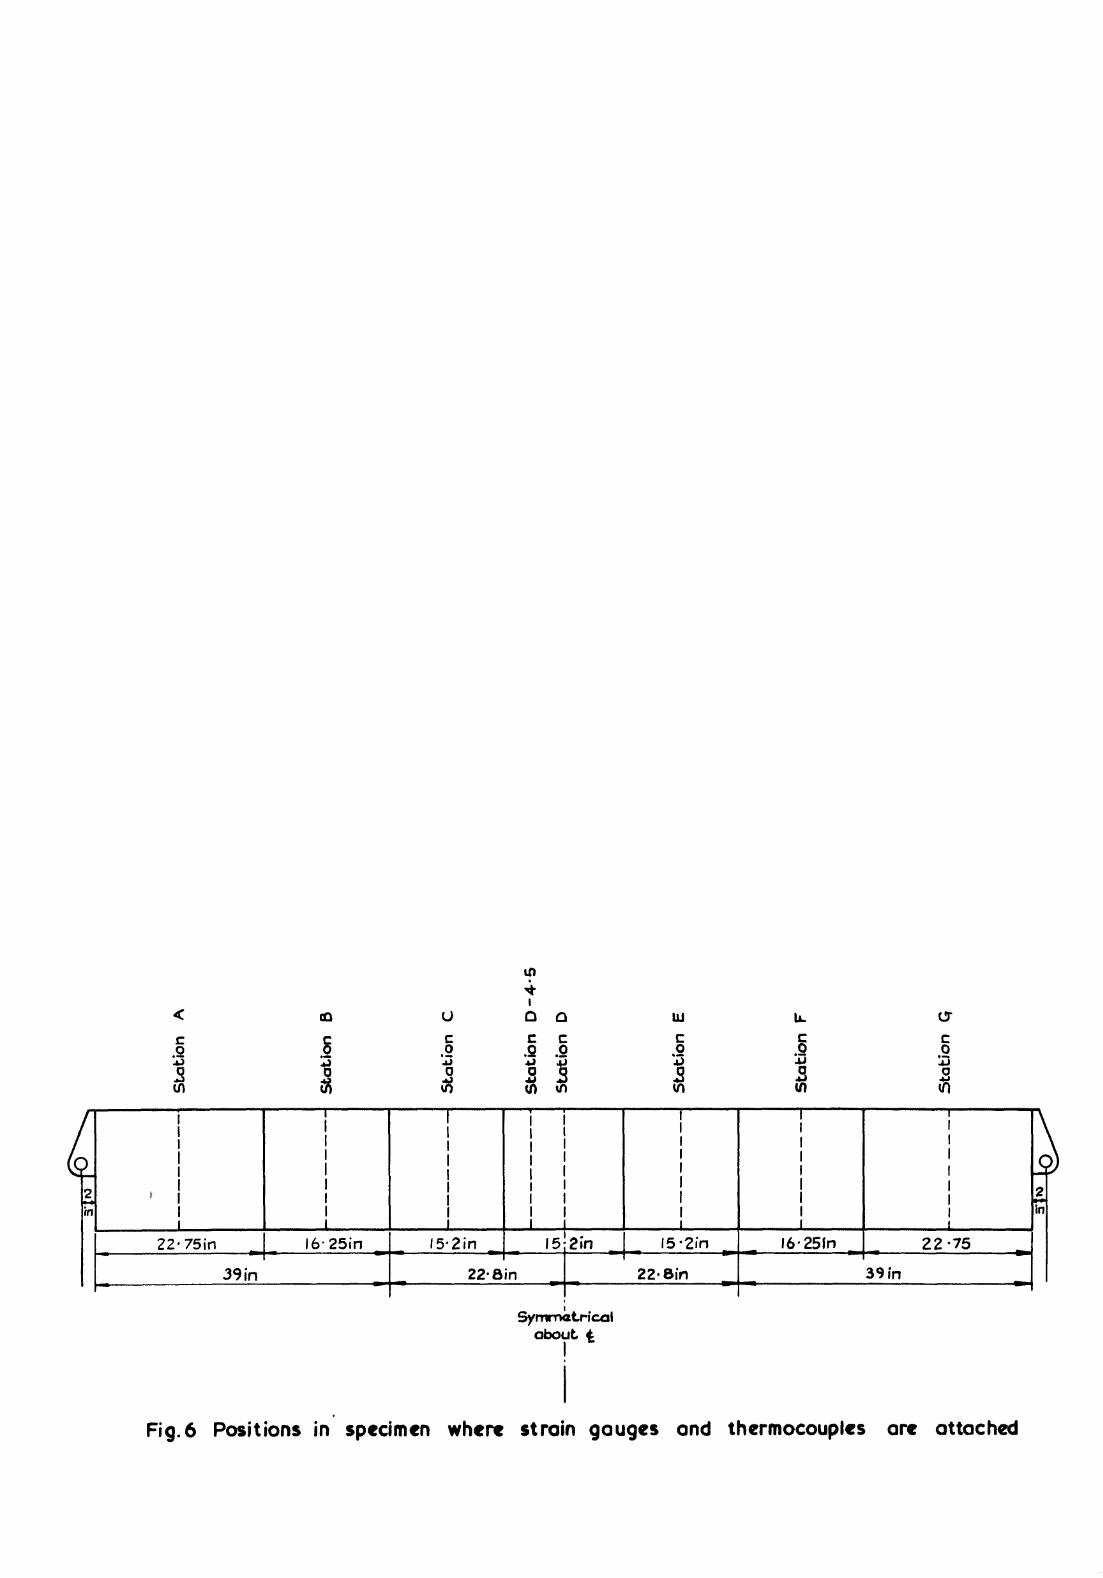
meters, and thermocouples at various stations along the box. Fig.6 shows the
division of the box into eight stations for the purpose of instrumentation. The
temperature of the box was controlled from the platinum resistance thermometers
positioned at Station S and temperature was monitored from thermocouples
attached generally at each station along the longitudinal centreline of the webs,
the compression skin and the tension skin. At station D, additional thermo-
couples were attached in order to measure the variation in temperature across the
tension skin and shear webs of the box specimen. Strain gauges were attached at
Station B, D and D-4.5 in only, on the centreline of the webs, compression and
tension skins. All wires or cables leading from the transducers were supported
clear of the surfaces to avoid interference with the airflow over the surfaces
which might cause uneven temperature distributions.

14
Appendix B
DESCRIPTION AND OPERATION OF TESTING RIG
The function of the testing rig was to apply a programme of bending loads
and temperature to the specimen. Loading of the specimen was in four-point bending and heating and cooling was by convection from air passed over the surfaces of the specimen. The general arrangement of the rig is shown in Fig.7.
The specimen was supported in the rig by two 'A' frames which in turn
were mounted on reaction beams. One 'A' frame was free to move along the longitudinal axis of the specimen so that its thermal expansion and contraction was unrestricted. Low friction hydraulic jacks applied upward loads at the corners of the specimen to produce uniform bending in the centre section of the box. Bending of reverse sign was produced by a single hydraulic jack at each
end of the specimen, pulling down on the loading points. The different load levels called for during one complete flight cycle were controlled by electro- mechanical selector valves; the rate of loading was governed by the hydraulic pump output and specially developed pressure relief valves. During mechanical fatigue cycling, the amplitude of the loads was controlled by Budenberg Max-Min electrical contact pressure gauges; all loads applied were within +l% of nominal. The complete mechanical loading programme was regulated by a Post Office type uniselector switch and associated relay logic.
The mechanical loads applied to the specimen were calibrated against a Macklow-Smith hydraulic load cell which was checked against a secondary standard. The pressure in the hydraulic loading system was checked daily,and at intervals throughout the test the loads applied to the specimen were rechecked against the load cell. Pressure switches, pressure relief valves and deflection limit switches were incorporated in the rig to protect the specimen against overload.
Thermal stresses were induced in the specimen by heating the webs and flanges of the specimen differentially. The insulated duct system over the specimen was divided by flexible membranes of aluminised asbestos cloth and the divisions were connected to separate re-circulation circuits as indicated in Fig.7. Each circuit was equipped with a centrifugal fan, a source of heat input, a liquid nitrogen injection system and a system of flaps to provide either open- or closed-loop operation. The heating sources were banks of 1kW commercial fire bars and cooling was by mixtures of ambient air and liquid nitrogen, Temperatures at various positions in the specimen were monitored by

Appendix B 15
copper/constantin thermocouples and platinum resistance thermometers. The out-
puts from the platinum resistance thermometers were used to trigger electro- mechanical switches and valves to control the temperature cycle.
The heating cycle applied to the specimen consisted basically of heating
and cooling the top and bottom flanges of the specimen (representing external surfaces of the structure) more rapidly than the webs (representing internal structure) to produce a temperature lag between the two and induce thermal stress.
This was achieved by heating the flanges first to the required maximum tempera- ture. Before the maximum temperature was reached the heaters were switched off and the residual heat in the duct system was sufficient to drive the specimen up to the required temperature. The temperature of the flanges was then maintained
to within +li'C by using a constant source of heat and switching a smaller source
of heat. Once the flanges reached the maximum required temperature, heat was
applied to the webs to bring them to the same temperature as the flanges. As soon as the flanges and webs were at the same temperature, all heating was switched off and the flaps in the flange duct circuit were operated to allow ambient air to be blown over the flange surfaces to cool them. In the web duct
circuit, the centrifugal fan was stopped so that the web would cool comparatively slowly; heat was lost by conduction to the flanges. When ambient air could no longer sustain the required rate of cooling of the flanges, liquid nitrogen was introduced into the air-stream in controlled quantities to maintain the rate of cooling until the required minimum temperature of the flanges was achieved.
At this point the controllable flaps in the web duct circuit were operated, and ambient air was used to increase the cooling rate of the webs. Coincidentally,
in the flange duct circuit, liquid nitrogen injection in the air stream was stopped and ambient air was used to raise the temperature of the flanges. When
all the specimen test section was at a common temperature, one temperature cycle had been completed.
Throughout the thermal phase of the testing cycle the specimen was protected
against incorrect maximum and minimum temperatures and various stages of the thermal cycle were timed and protected by time switches to avoid unrepresentative dwells occurring due to malfunction. To cater for variations in the temperatures of the liquid nitrogen and ambient air, the rate of cooling was controlled by comparing the readings from the control platinum resistance thermometers at Station C of the specimen (see Fig.6) and an electrical voltage ramp. Adequate
interlocks between the thermal and mechanical load controllers ensured that both sequences were correctly phased.

16
Appendix C
FLIGHT-BY-FLIGHT, LOAD AND TEMPERATURE SEQUENCES USED IN FATIGUE TESTS
The fatigue test used a simplified flight-by-flight, load and temperature
sequence (see Fig.8) representative of that encounted in Concorde fuselage
structure. The mechanical loading simulated the ground-air-ground (GAG) cycle,
pressurisation cycle and gust cycles. During the cruise phase of this flight
cycle, thermal stresses were superimposed by heating and cooling the flanges
and webs differentially to represent conditions in deep structure at the
beginning and end of the supersonic cruise. A detailed account of the sequence
now follows.
At the start of the sequence (Fig.lOa) when the flange and web are at the
same temperature, load is applied to represent take-off followed by fuselage
pressurisation. The flanges are then heated rapidly by forced convection while
the webs in still air heat up only slowly by conduction from the flanges. The
difference between flange and web temperatures results in the development of
thermal stresses - compressive in the flanges and tensile in the webs - which
reach a maximum value at the time when flange temperature reaches its maximum
value. The flange temperature is then maintained and the webs are heated
rapidly by forced convection until they also reach maximum temperature thus
reducing the thermal stresses to zero. The flanges are then cooled by introduc-
ing a cold airflow followed by controlled liquid nitrogen injection, to a
temperature lower than the starting point of the cycle while the webs cool slowly
in still air by the conduction of heat to the flanges. When the flanges reach
minimum temperature, thermal stresses reach a maximum in the opposite sense -
tensile in the flanges and compressive in the webs. At this stage the webs are
cooled by ambient airflow and the flanges are heated using ambient airflow and
heat conduction from the webs until the webs and flanges return to their initial
value as the thermal stresses decay once more to zero. Once the temperatures
of the webs and flanges differ by less than -7’C, the flight cycle is completed
by reducing the mechanical stress to represent depressurisation of the fuselage,
then applying thirteen cycles of load to represent gust loading, and finally
removing the remaining mechanical loading to represent landing.
In certain tests the general form of the load-temperature sequence was
varied by following the cycle described above by a single repetition of the
mechanical load sequence while the specimen temperature was maintained at its

Appendix C 17
starting value, 42oC (see Fig.lOb). The two forms of test are differentiated
by the term cycle ratio which is the number of mechanical flight cycles to each temperature cycle, i.e. a cycle ratio of 1 signifies that temperature was cycled
during each flight cycle, and a cycle ratio of 2 signifies that temperature was cycled during alternate flight cycles.
In a third form of test, specimens were tested at ambient temperature, i.e. under mechanical loading only. The load sequence was of the same general
form except that in order to reduce testing time, the first peak load (see Fig.9a) which represents the combination of ground-air load and fuselage pressurisation was not sustained, i.e. the cruise period was not represented. Tests 2 and 5 (see Tables 2 and 3) had a modified form of this loading sequence illustrated in Fig.9b in which high loads were applied during the load sequence once every 500 flight cycles. These high loads were included to represent
occasional rough flights, but due to difficulty in application, only two specimens were tested using this form of loading sequence. As these high loads occurred only once every 500 flight cycles and because, for the following reasons, their effect on subsequent fatigue damage was considered negligible,
results from tests with and without high loads were treated similarly. If the
high loads had caused yield at the butt strap joint they could have had a significant effect on the subsequent fatigue by changing the local residual state of the joint. However, the magnitude of these high loads were such that it is unlikely that local yielding occurred. Even had local yielding occurred
it is considered that it would have affected the subsequent fatigue damage rate in only a few of the following flight cycles because the AGA cycle included in each flight cycle would have tended to negate the effect.

18
Appendix D
TEMPERATURE AND STRESS DISTRIBUTIONS IN THE SPECIMEN AND THEIR RELEVANCE TO THE MODE OF FATIGUE CRACKING
For the purposes of instrumentation, eight stations were selected along
the specimen (see Fig.6); in general, at each station strain gauges and thermo- couples were positioned around the surface of the specimen. Temperatures were monitored on thin skin at a position 13.6 in from the butt strap (Station C) and typical temperature cycles on the centrelines of the tension flange and the shear web at this station for the two accelerated test conditions studied are
shown in Figs.11 and 12. The nominal temperature cycles for the flange had a maximum of 135'C or llO°C and a minimum of -3OOC or -12OC respectively. It is seen that the actual temperatures reached were in good agreement with these nominal values. Figs.13 and 14 indicate how the temperature cycle for the
flange and web varied along the length of the specimen for one of these tempera- ture cycles. In general temperatures exceeded the nominal values at stations upstream of Station C, whereas downstream, where the airstream was slightly cooler having lost heat to the specimen, temperatures were smaller than nominal.
At local areas in the specimen where additional mass causes thermal lag, variation to this general rule occurred. The distribution of temperature across the width of the specimen at the butt strap is illustrated in Figs.15 and 16 for flange and shear web respectively. Because of conduction between flange and web, the temperature at the centres of the flange and web were closer to the nominal value than the temperatures at the edges of the specimen. As a result, a higher thermal stress was developed at the centre of the specimen at the butt strap than at the edges. The relevance of this to the mode of failure will be discussed later.
Combined mechanical and thermal stresses were determined from the readings of a pair of strain gauges mounted longitudinally on opposite surfaces of the tension skin on the centreline at Station B. Typical examples of the change in stress of the flange tension skin during one temperature cycle for the four test conditions studied are shown in Fig.17. These show that the applied nominal mechanical stress was modified by the superimposed thermal stress; first it was decreased to a minimum value by the compressive thermal stress, then
increased to a maximum at the peak tensile thermal stress, and finally decreased again to the nominal value. Fatigue gust loading was applied when the tempera-
ture cycle was completed.

Appendix D 19
Although cracking occurred at numerous sites in the specimens only one form of damage occurred consistently in all 11 specimens. This was in the butt strap joint where cracking initiated at rivet holes in the rows of rivets adjacent to the transverse centreline of the joint and propagated through the
butt strap across the specimen (see Fig.18 for typical example) leading to static failure of the joint. The position in the joint at which the first crack appeared varied from specimen to specimen, but in general, two main locations of cracking initiation could be distinguished. In all cold control tests (Figs.18 to 20) cracks initiated originally under the boom angle attach-
ment which connects the flange tension skin to the shear webs. This would be
expected as the boom angle transfers the load from the shear web into the flange tension skin and a local complex stress situation is likely to be present in which some stresses will be higher than nominal. In addition it is probable that fretting was not eliminated completely in this joint even though interfay- ing compounds were used inbetween all connecting surfaces. When thermal stress
was induced in the specimen however, cracks initiated in the butt strap near the longitudinal centreline, either under one of the two longitudinal stringers or at rivet holes in the butt strap between them (see Figs.21 to 28). In the previous discussion on the temperature distribution across the width of the specimen at the butt strap joint, it was shown that a greater temperature range was experienced at the centreline than at the corners (see Fig.15). Thus a larger thermal stress occurred at the centreline and it is likely that this accounts for the difference in mode of failure between the cold control tests and those with thermal cycling.

20
Appendix E
VARIATION IN FATIGUE CRACKING AT THE BUTT STRAP JOINT IN THE BOX SPECIMEN
In order that the test acceleration factors for this programme can be calculated accurately, and hence the feasibility determined of accelerating testing by increasing the thermal fatigue damage accumulated per flight cycle a particular stage of fatigue damage must be identified in a specific part of
each specimen. Although cracking occurred at numerous sites in the specimen, only cracking in the butt strap joint occurred consistently in all 11 specimens; cracking elsewhere was regarded as incidental and repaired. Two stages of fatigue damage were most readily identified; the first appearance of cracking and final failure. First crack was defined as the smallest crack which can be detected using radiographic examination, i.e. smaller than 0.1 in in length, and the number of flights to final failure was defined as the number of flights to propagate a crack through the butt strap to static failure of the joint, In practice, the first crack was sometimes not detected because the frequency of radiographic examinations was inadequate. Another difficulty was that irreparable damage occurred at other locations so that sometimes the test was suspended before final failure occurred in the butt strap joint. However, sufficient information on the accumulation of damage in the butt strap joint was obtained so that in all tests a reasonably accurate estimate could be made of the number of mechanical flights to initiation of first carck and to final failure. Let us now consider the individual results and how they were adjusted to meet the above definitions.
Table 2 presents results from the series of specimens tested under the
lower mechanical stress conditions (see Fig.9 - stress A). The accumulation of damage in the butt strap is illustrated in Figs.18, 21 and 22 for the three specimens, numbers 2, 10 and 7. For the cold control test (Fig.18) cracking, although extensive, was not full width across the specimen before the test was suspended and thus the number of flights to failure would have been larger than the number quoted in the table. No adjustment was made to the number of flights to failure as it is much greater in the cold control case than in tests including thermal cycles, and thus quite large variations in the number of flights to failure would have no appreciable effect on the simple cumulative damage sums made to investigate thermal fatigue acceleration factors. Observations for specimens 10 and 7 were consistent with the definition of first crack and failure and no adjustments were made to test results.

Appendix E 21
In Table 3, for the series of specimens tested under the higher mechanical stresses (see Fig.9 - stress B), final failures were less consistent
and a number of adjustments were made. For specimens 5 and 9 (cold control
tests - see Figs.19 and 20) cracking was not very extensive before irreparable damage occurred in the shear webs and tests were suspended. It is considered unlikely that failure would have occurred under 50000 mechanical flights in either specimens and, as in the previous series of tests, this number is much
greater than the number of flights to failure for tests including thermal cycles. Thus a more accurate estimate of the number of flights to failure is unnecessary for evaluating thermal fatigue acceleration factors. Specimen 3 (Fig.23) was
removed from the test rig before failure of the butt strap but as cracking was extensive it was estimated that failure was imminent and thus only a small adjustment in the number of flights to failure has been made, i.e. from 9834 to
10000 mechanical flight cycles. In specimen 11 (Fig.24) failure occurred in the
tension skin away from the butt strap. It was considered that the crack in the
tension skin tended to inhibit growth of the crack in the butt strap. By comparing the relative positions of the first cracks to appear and the number
of flights required to initiate them in both specimens tested under the same test condition, an estimate was made of the number of flights to failure for specimen 11. The frequency of inspection proved to be too low to detect the onset of cracking in specimens 4 and 6 (Figs.25 and 27). For these specimens
the values in the table for initiation of the first crack represent a range of possible values between the largest number of flights at which no crack was detected and the number of flights at which a substantial crack had developed. In calculations for determining test acceleration factors, the mean of these values has been used. In specimen 12 (Fig.28) final failure occurred in the
tension skin within the area of the butt strap joint although a crack did initiate in the butt strap itself. It was considered that cracking in the tension skin inhibited crack growth in the butt strap and therefore it was only
possible to estimate approximately the number of flights required to cause failure in the butt strap by comparing cracking in this specimen with that in
its companion specimen. For the purposes of test acceleration factor calcula- tions, the number of flights to failure was considered to be greater than 8400, the number of flights at which failure occurred in the tension skin.

22
Appendix F
SCATTER IN RESULTS
If the number of flight cycles to first crack and to failure in Table 3 are considered, it can be seen that fewer adjustments were made in the number of
flight cycles to first crack than the corresponding number to failure. The adjustments were made in cases where the first crack could not be detected due to the frequency of radiographic examinations being inadequate, and where irreparable damage occurring at different places in the specimen forced suspen- sion of the test before final failure occurred in the butt strap joint. As
fewer adjustments were made to the number of flights to detection of first crack, this parameter was considered to give a more reliable indication of the scatter in results.
A measure of the scatter could only be obtained from results given in
Table 3 as it was only in this series of tests that sufficient results were available. It was assumed that the distribution of times to crack initiation was log normal under all conditions, To evaluate the standard deviation of this distribution it has been further assumed that the influence of heat was such that the scatter in the number of flight cycles to crack initiation would
be the same at each test condition, but that the mean of the distribution would differ from condition to condition. To make these assumptions seems reasonable as the predominant loading was the thermal fatigue cycle for which the number of cycles to failure was small, i.e. this is basically low cycle fatigue for which scatter is low and distribution of endurances is log-normal 2 . In addition it has been concluded by Stagg3 that heat tends to reduce scatter in results which would probably tend to bring the standard deviations of the results at each test condition to a uniform low value. By assuming that the results at each test condition had the same scatter, i.e. the variances of the
respective populations were not significantly different, then the standard deviation could be evaluated by the method of pooled populations4. Basically, for the two tests at each condition the deviation of each result was taken from the mean of the pair and then it was assumed that the deviations from all test conditions related to one population. The standard deviation was evaluated by summing the squares of the deviations and dividing by the sum of the degrees of
freedom; the squares of the deviations were obtained in terms of the log number of flights to first crack. The value of the standard deviation obtained by this method was 0.021, a value compatible with a low number of cycles to failure in
a riveted joint structure.
23
Appendix G
THE PREDICTION OF TEST ACCELERATION FACTORS
Two methods of stress cycle analysis have been considered by BAC Ltd.5 for use in the prediction of the acceleration of thermal fatigue testing and have
been called the Separate Cycles Method and the Peak-to-Peak Method. Both methods are based on the same principle, the division of the flight cycle into discrete component cycles, i.e. stress cycles containing one peak and one trough,
and evaluation of the total fatigue damage in each flight cycle by summing the damage attributable to each of these component cycles using a linear cumulative
damage law. The damage attributable to each of the component cycles was obtained from S-N data for typical light alloy aircraft bolted joints' (see Fig.30). The two methods differ in the way the flight cycle is analysed into component cycles.
.
The Separate Cycle method of analysis, as implied by its name, required the
division of the flight cycle into separate loading actions, e.g. fuselage pressurisation, gust loads and thermal stress variation. An example of how one accelerated test cycle was divided into its separate fatigue cycles is given in
Fig.31; the accelerated test cycle was considered for cumulative damage calcula- tions to be equivalent to one thermal stress cycle plus two ground-to-air cycles
plus 26 gust cycles. It should be remembered that the thermal stresses in the accelerated test cycles discussed in this Report were defined as the stresses required to give predicted acceleration factors of 2 by the Separate Cycle method
of analysis. The Peak-to-Peak method of analysis is illustrated also in Fig.31; this is generally similar to the Rain Flow Cycle Counting method6. In these methods the highest peak in the test or flight cycle is associated with the
lowest trough, and the next highest peak is associated with the next lowest trough, and so on, irrespective of their relative positions in the complex cycle. The total damage per flight cycle is then calculated as before, i.e. as the sum of the damage attributable to each of these component cycles.
In order to evaluate acceleration factors using the Peak-to-Peak method of
analysis an accurate measure of thermal stress at a moderate distance from the butt strap was needed. Unfortunately, in the tests reported here, thermal stresses were measured with acceptable accuracy only at Station B in the box (see Fig.l7), a position well away from the butt strap. Strain gauges attached closer to the butt strap proved unserviceable. The thermal stress amplitudes measured at Station B could be considered to be the same as those induced at
stations closer to the butt strap but the absolute values of the peaks or troughs

24 Appendix G
would differ because of changes in the mechanical applied stresses between the
stations, upon which the thermal stress amplitudes were superimposed. It proved
impossible to evaluate meaningful acceleration factors using the Peak-to-Peak method of analysis in the absence of the absolute values of the thermal stress.
However, by definition , only the amplitudes of thermal stress need to be known accurately in order to predict acceleration factors by the Separate Cycle method of analysis. In Table 4 of this Report, predicted and achieved test acceleration factors are compared.

25
Appendix H
FATIGUE-CREEP INTERACTION
Fatigue-creep interaction has been extensively studied in various programmes aimed at providing back-up information to assist in the certification of Concorde. Specimens tested in these programmes ranged from simple structural elements such as notched, lug or joint specimens, to more complex structures such as shallow rectangular box specimens which represent certain design features of the real aircraft. Periods of heat have been applied either at discrete stages during the life of the specimens or on a flight-by-flight basis. Generally the load applied during the periods of heat was maintained at a fixed value, and the values studied ranged from tension to compression. No specific work to date
other than that reported in this paper, has been undertaken to investigate the interspersion of thermal and mechanical fatigue. Although it is outside the scope of this Report to attempt to quantify the influence of fatigue-creep interaction on thermal fatigue, it is relevant to outline the general results on fatigue-creep interaction in a qualitative way.
A paper by Heath-Smith7 summarised the findings of much of the work done before 1969 on studying the effects of intermittent heat and intermittent creep on fatigue crack initiation and crack propagation for loading in fluctuating
tension. Subsequent work has tended to support the conclusions in that paper. It is shown that heat at zero creep stress reduces the duration of crack initia- tion and crack propagation, the effect on initiation being somewhat greater. Tensile creep (i.e. heat with steady tensile load) has, by comparison with heat alone, some beneficial effect on crack-initiation but the effect of creep during crack propagation varies with creep stress; at moderate stresses there is some improvement whereas at high stresses a substantial loss in performance is obtained which is attributed to creep cracking. There are indications that riveted joints in built-up structures show more favourable interaction than
'simple riveted joint specimens and this is attributed to the additional effect of redistribution of load between the rivets, under both heat and creep conditions. Performance, in general, reduced with increasing temperature more rapidly for creep than for heat alone.
From the above observations it is apparent that fatigue-creep interactions
in the work reported here are likely to be many and complex. For example, the acceleration of thermal damage by increasing the temperature range applied to the specimen necessitates a higher maximum temperature in the thermal cycle. The

26 Appendix H
magnitude of the fatigue-creep interactions is dependent on this temperature, and thus interactions will vary in degree from one thermal cycle to another. The minimum stress induced in the butt strap joint during the thermal cycle is a function of the mechanical fatigue mean stress and the induced thermal stress,
and therefore it varies from one test condition to another. Information from
fatigue-creep interaction tests show that heat at zero creep stress is more damaging than heat at positive creep stresses. Thus positive values of minimum stress during the thermal cycle may tend to improve fatigue performance. On the other hand, under severe stress and temperature conditions, creep damage
could occur especially during the crack propagation phase.
It should be appreciated from the above examples alone, that the influence of fatigue-creep interaction on thermal fatigue is complex. To get a better understanding of this relationship, work is planned on simple structural elements in which thermal stresses, mechanical stresses and temperatures can be closely controlled thus enabling a quantitative measure of interaction effects to be made.

.
Test Condition Description of Specimen Ref. No. test numbers
_-__-~-- ..~ Cold control 5,9
Basic thermal fatigue test 3,ll 110 -12 42
Accelerated thermal fatique test 498 135 -30 42
Accelerated tnermal and mechanical fatigue test
Cold control
Basic thermal fatigue test
Accelerated thermal ant mechanical fatigue test
Table I
DETAILS OF TEST CONDITIONS
6,12
2
10
7
Skin temperatures
Maximum OC Minimum 'C
20
135
20
100
110 -12 42
20
-30 42
20
+9
T- Ambient temperature
OC
20
20
49
Mechanical stress cycle*
Cycle Ratio
-_ ..- B
B
B
B
A
A
A
* See Fig. 9

Table 2
RESULTS FROM TESTS UNDER MRCHANICAL STRESS CONDITION 'A' (See Fig.91
Test Condition Ref. No.
Specimen number
2
10
7
Temperature cycle OC
None
100°C to +9Oc - I 94520
I >142 058
I 10.6
I c7.0
1,
llO°C to -12Oc 2 I 12207 I 27166 I
Cycle Ratio
Life of E butt strap in mechanical flights
1st crack I Failure
Average mechanical damage
per mechanical flight x lo6
1st crack Failure
Average thermal damage
per temperature cycle x IO6
I.f
90.8 33.0
142.2 I
59.5

.
Test Condition Ref. No.
1
2
Specimen number
Temperature cycle
OC
Life of $ butt strap Average mechanical
Cycle in mechanical flights damage per mechanical
flight x Ratio
1st crack
5 None 25000
9 None 31700
3
11
4
8
6
12
Table 3
RESULTS FROM TESTS UNDER MECHANICAL STRESS CONDITION 'B' (see Fig.9)
1
llO°C to
-12Oc
1
135Oc to
-3oOc
135Oc to
-3oOc
1 7632
I 7228
2722 < 54444 1 i.e. 4083*
1 3562
5981 < 7727 2 i.e. 6800*
2 7021
1 oooo* ,I 12000*
5444 11 5317
7913 I, '8412
Failure
c20.0
II
II
Average thermal damage per temperature
cycle x IO6
1st crack
209.4
245.2 1 227.3
223.2 218.5
213.8
163.7
168.1
* These values have been adjusted (see Appendix E)

Table 4
THERMAL FATIGUE AND TEST ACCELERATION FACTORS
Accelerated test reference number*
3 (compared with tests Ref.2 & 1)
4 (compared with tests Ref.2 & 1)
7 (compared with tests Ref.6 & 5)
* See Tables 2 and 3.
Thermal fatigue** acceleration
factor (AT)
Achieved
First crack I Failure
2.3 2.3
2.2 c2.9
1.6 1.8
Test acceleration factors **
Achieved Predicted using Separate
First crack Failure Cycles Method
1.94 1.94 2.0 2.0 1.8 1.8
2.15 2.15 c2.7 c2.7 2.0 2.0
1.6 1.6 1.8 1.8 1.9 1.9
** For methods of analysis of acceleration factors see Fig.29 (achieved) and Fig.31 (predicted).

31
REFERENCES
No . -
1
Author
2 F.E. Kiddle
3 A.M. Stagg
4
Title. etc.
Structural design data sheets, Vo1.3, 43.3.4 and 43.3.8. BAC Ltd.
A study of fatigue endurance, crack nucleation characteristics and crack sensitivity of four aluminium-copper alloys in the form of notched, lug
and joint specimens. ARC CP 1259 (1972)
An investigation of the scatter in constant amplitude fatigue test results of 2024 and 7075 materials.
ARC CP 1093 (1969)
Data sheets on fatigue: No.68016 'Comparison of samples'.
Engineering Sciences Data Unit, Royal Aeronautical Society (1968)
5 P.M. Crosse Cumulative damage calculations associated with R.J. Wyse accelerated thermal fatigue tests.
BAC Ltd., Ref.SST/B74S-5/9039 (1969)
6 N.E. Dowling Fatigue failure predictions for complicated stress- strain histories. Journal of Materials, JMLSA, Vo1.7, No.1, 71-87 (1972)
7 J.R. Heath-Smith Effect of intermittent heat and creep on fatigue crack
initiation and propagation in CM001 material. Unpublished MOD(PE) material


Heater/ cools - -in9
I/ - I I - \ I I
E I I\ e/ ’ ’ T-A ----
l- ---
\ \
-
Specimen’ pliydraulic jack
Reaction beam lk ‘A’ frames
Shear webs <
Section A A
/ Flange-compression skin
Y Flanqe - tension skin
Fig. 7 Schematic arrangement of the testing rig

Strass ond tczmparoturcz
42*C
O’(
I
I I I I b-w L-
Machanical stress in flanqcz ---e Temparature of f lanqe
-------- TQmperat.urQ of web
Mechanical stress cycle
‘&ok drassczs occur
‘Min tamp
‘\ \ \
\ \ \ \ \ \ \.
+-essurisation StrQss
Ground /air stms5
Fig. 8 General form of load-temperoture sequence
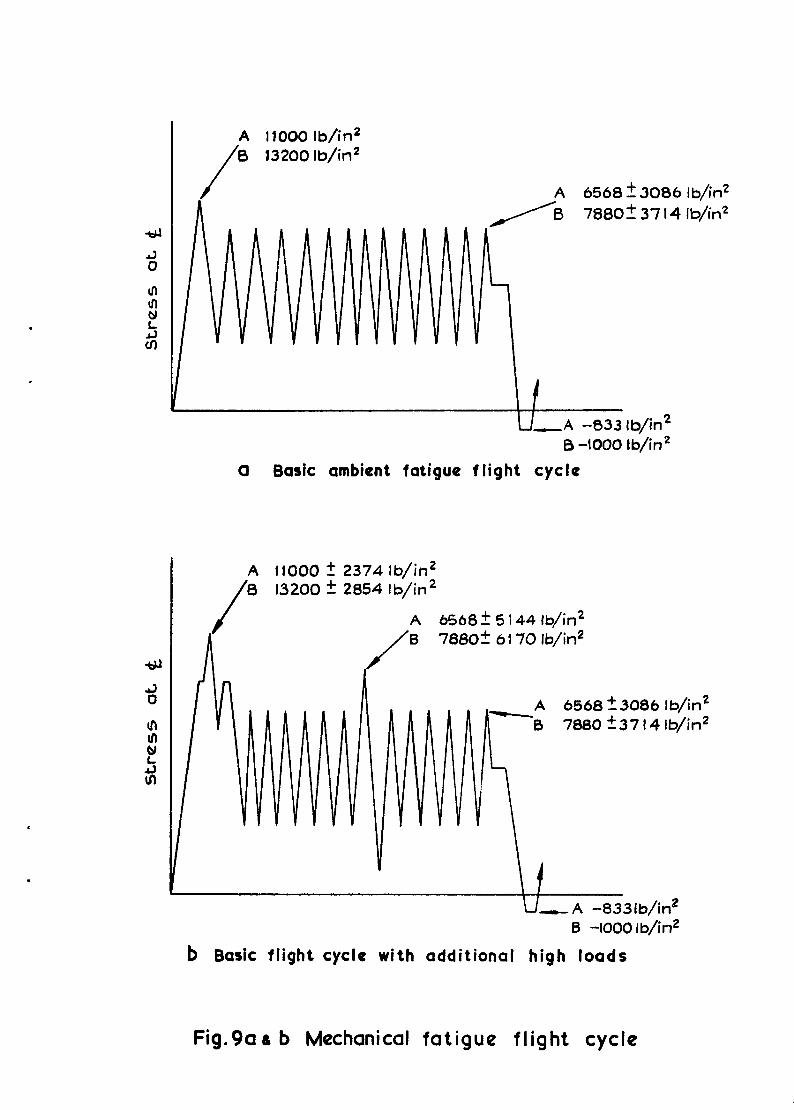
A 6568 I! 3086 lb/in* 2 37 I4 lb/in*
lb/in* B -1000 lb/in2
0 Basic ambient fatigue flight cycle
A It000 t 2374 lb/in*
A 6568-+ 5 144 lb/in* 6 78802 6 170 lb/in2
A 6568 23006 lb/in* 0 7860 537 I4 lb/in2
U-A -833lb/in’ 6 -I000 I b/in2
b Basic flight cycle with additional high loads
FigAlas b Mechanical fatigue flight cycle

I^\ ’ ‘w
/ \ Thermal stress
: \ \
I \
Mechanical stress
0 Flight cycle with a cycle ratio of one
Pressurisation stress
Ground /air stress
Thermal stress
Mechanical stress I
b Flight cycle with a cycle ratio of two
Fig. IO a 6 b Thermal fatigue flight cycle

. * , I
140
120
loo
I 80 c) 0
i!
2 60
b
I? (j 40
20
0
-20
Nominal temperature cycle Max. temp. 135% Min. temp. -3OOC
ThQrmOCOUpkS pOsitiOnQd at station C ; the stotion at
which tQmpQraturQs wQrQ
at
Fig . II Typica I temperature cycles at the centre lines of the tension skin - nominal temperature range 135OC to -35OC
8 10 12 14
V 16
TimQ (min)-
84 the shear web

IX
IOC
80
f u 60 0
E 3 t 40 8 E e
20
0
-20
Nominal tampt2rature cycle
1 I I I I I \ /I I I 2 4 6 0 Tim~(min)
J - 12 14 16 I0 20
Fig. 12 Typical temperature cycles at the centrelines of the tension flange and the shear web- nominal temperature range IIO°C to -12OC
* ” d .

Station D -4.5 Station D -4.5
Flanqa - tension skin Nominal tamparatura cycle :
Max temp 135°C Win temp -30°C
Thermocouples positioned along kmqitudinal centrelina of box For key of stations sac Fiq. 6
6 12 Tirne’ymin) -
2
\\\\I Station D -4.5
Stations C,E and G
Station A
Fig. 13 Variation in tension skin temperature cycle along specimen

16C
140
120
I 100 0 0
tf J 80
z g
Shear web Nominal temperature cycle :
Max. temp. 135OC Min. temp. 40eC
Thermocouples positioned along longitudinal length of box specimen See Fig. 6 for key of stations
I I 1 I I I I I I I I I
0 2 4 6 8 IO I2 14 lb I0 20 22 Time (min) -
Fig. 14 Variation in shear web temperature cycle along specimen

. .
140
120
loo
80
60
40
20
0
-2c
Time (min) - 2
Flange -tension skin Nominal temperature cycle
Max. temp. 135OC Min. temp. -3OOC
Thermocouples positioned along transverse centre line Of box specimen
Station 0 (for key of stations s~tz Fig 6)
Fig .I5 Variation in tension flange temperature butt strao joint
cycle across specimen at

Sheor web Nominal temperature cycle
Max temp 135OC Min temp 40°C
Thermocouples pod tionQd along 9 transverse tronsuczrse centrelina of box specimen
Station D (For key of stations see Fiq.b)
0 2 4 6 0 IO I2 14 I6 I8 20 22 Time (min) -
Fig. I6 Variation in shear web temperature cycle across specimen
* Y . \

* 4
Strass meosuras ore ovcmaqa values from two strain qaqes positionud back to bock at the cantra of tha tension skin at, station 8 (saa Fiq. 6) 135OC to -3OOC tempQratur4: cycle
(machanical stress condition 0)
110°C to -12°C temperature cycle 110°C to -12°C temperature cycle (mechanical strass condition 0) (mechanical strass condition 0)
llO°C to -12OC temperature cycie llO°C to -12OC temperature cycie (mechanical &t-ass condition A) (mechanical &t-ass condition A)
IOOOC to IOOOC to +9OC Lempet-&we cycle +9OC Lempet-&we cycle (mechanical stress condition A) (mechanicai stress condition A)
Time from &art of thermal cycla Time from &art of ttw-mol cycia (sczcond~
Fig. 17 Stress cycles at station B on flange tension skin

E E Q-\-\\\~
I

c .
Bottom boom angle
AS
Bt
c+
Df, .= : d E 6
F+: E
0+
Ht
\ + +5 + +‘+ +
t ? ,- - - ==--zz-=== = z':
-I-
t
+ t
-
--
+
z:
1 t + + ? +
- --
t
-C
b
t T t t + t t
*= - - - - - - - -*=-y ---
t
+
+
+
t ss :
+
+
t
+
Fig. 19 Fatigue failure of specimen No.5 -test condition No. I (for results see table 3)

ii Ii
.--------a-“&,-- ----_ 1. -. .
!+ II himE II ” tSt2-C
. . ” OOQ& II
+ II ” OlOOtr
+ ii II
t If II I, I,
+ II
+ II II II
+ + + +I!+ + t +
0 IL

Bottom boom angle
Butt strop 6ottom skin b \
A+
Et+
ct
0+ me--. .---. E+
f+
G+
H+
----
+ -I-
-t i=
== ==..
I
I’
(3 I
iii I
8 1 .+---qx---+---+-- I
-I+>>>> t<< < -K< I
--------------.---=-.==. .---v-----_---e.--- m. 4
F Cc+ ’ I
4
I
c Q I Es I
I
1
I 24970
Fig. 21 Fatigue failure of specimen NO. IO -test condition NO. 6
@or results see table 2)

Bottom boom angle
Butt strap Bottom skin \ \
\ +
s + + -o+ + + + -t +” + :-
- Rupture 27166
b
+ ‘+” + + + + AS
Bt
c+
DS --- --- Et
F-C
4+
W+
H
-- - -
+ + r t--t ---- ---
2 Q) d
,-I+-, + \ r-------eT----- - - -= --- == +--+---+--
.l m--w
i-“+
1 L= :
t-4--
- - - -
+
+
+
+ == -+
+
+
+
Fig. 22 Fatigue failure of specimen No.7-test condition No.7 (for results see table 2)

. 2

t + + ii
-up- +- + t
/
-
t ii
3t If II
--~~~~-----~------ ---___ t II
I! hi-
i-t &iK II + 11 II
t 11 - IL611
t + /j+ OLZ8
IL611
I

+ + + +;l+ + + +I

++++

Butt strap Bottom skin \ \ N
A-l-
B+
C+
D+ .--m --- E+
F+
Gf
Hf
---. ++ + f == T -- -.
\
I
I
I
“‘--t-- + ---+.P+--+~-+--+~
. .-a - - - - - - - - - - - - - . - - - - - - - - - - - - - - - - - - ,
1
i
I 1
1
1
/
- -.
+
+- ==
-
-- -
+++s+
-Rupture 7913 -
b
+ T + -+ + +
- +--+-.+--+-+--$d
m-s---- __-___. m--w--- _______
+
-t
+
+ ==
+
+
+
+
Fig. 27 Fatigue failure of specimen No 6 - test condition No 4 (for results see table 3)

ii II-t --t II
t ii
I II
I II _ -------- ---------
‘A- ll
t 1' II
-t + 1 I, I I
t + -t !! t t

The average damage per flight in cold control test
The average damage per Plight asic thermal fatigue test
Where Df is the average mechanical damage per Flight ; a flight consists of all applied stresses between two’ successive ground to air cycles
ie Dt = 1
No. of flight5 to first crack or failure
Dr is the average thermal damage per flight
AT is the thermal fatigue acceleration factor
04 and - D2
is the test acceleration factor
Fig. 29 Formulae for acceleration factor calculations

Graph from refercz:ncQ I
I
to3 I I
Enduranctz (N)- cyclas
Fig.30 S- N data for typical light alloy aircraft bolted joints
f L’ 4 .

\~Thurmal s&ass cycla
\ \ I
cjround to air cycla
5 7
Onu OccelQratad tQ6L CyClQ
3 I
+hermal stress cycle
C@n~nd to air cycb
9ust cycles
Saparate cycle m&hod of analy?A f+zak to peak method of analysis
1
6
*-;--; 4
;” yst cyclQs
2 Time
5 7
Fig.31 Graphic representation of separate cycle and peak to peak methods of analysis
Printed m England for Her Majesty j: Statwnery Offwe b-y the Ro val Arrcraft Bstabhshment, Farnborough. Dd 289030 K4 2176

539.388.1 . 624.072.2 : 620.178.38
ARC CP No.1342 March 1975
F. E. Kiddle R. J . Kite R. F. Mousley
A STUDY OF THERMAL FATIGUE ACCELERATION IN BOX BEAMS UNDER MECHANICAL AND THERMAL STRESS
In the full-scale fatigue testmg of the Concorde there is a need to accumulate damage at a higher rate than in service m order to meet certification requirements. One contribu- tion to the more rapid testmg of the Concorde comes from acceleratmg the rate of thermal fatigue damage by mcreasmg the range of temperatures applied to the aircraft and hence increasmg the associated thermal stress m each thermal cycle. This Report describes tests in which thermal stresses were generated m a representatlve structural specimen and were adJusted to give a designed acceleration factor of 2. It is shown that this method of acceleratmg thermal damage was reasonably accurate. Further work is discussed which will mvestigate the acceleration of thermal fatigue damage under con- ditions more representative of Concorde in service and m the full-scale fatigue test, par- ticularly 111 representmg times at temperature.
______-------- --- _--_-----
ARC CP No.1342 March 1975
F. E. Kiddle R. J. Kite R. F. Mousley
539.388.1 : 624.072.2 : 620.178.38
A STUDY OF THERMAL FATIGUE ACCELERATION IN BOX BEAMS UNDER MECHANICAL AND THERMAL STRESS
In the full-scale fatigue testing of the Concorde there is a need to accumulate damage at a higher rate than in service m order to meet certification requirements. One contribu- tion to the more rapid testing of the Concorde comes from accelerating the rate of thermal fatigue damage by increasing the range of temperatures apphed to the aircraft and hence increasmg the associated thermal stress in each thermal cycle. This Report describes tests in which thermal stresses were generated in a representative structural specimen and were adjusted to give a designed acceleration factor of 2. It is shown that this method of accelerating thermal damage was reasonably accurate. Further work is discussed which will mvestlgate the acceleration of thermal fatigue damage under con- ditions more representative of Concorde m service and in the full-scale fatigue test, par- ticularly m representing times at temperature.
I I I I I
I I
I
I I I
I I
I
I
__--__------------------- 1 DETACHABLE ABSTRACT CARDS
, . .
ARC CP No.1 342 March 1975
539.388.1 : 624.072.2 : 620.178.38
F. E. Kiddle R. .I. Kite R. F. Mousley
A STUDY OF THERMAL FATIGUE ACCELERATION IN BOX BEAMS UNDER MECHANICAL AND THERMAL STRESS
In the full-scale fatigue testmg of the Concorde there is a need to accumulate damage at a higher rate than m service m order to meet certification requirements. One contribu- tion to the more rapid testmg of the Concorde comes from acceleratmg the rate of thermal fatigue damage by mcreasmg the range of temperatures apphed to the aircraft and hence mcreasmg the associated thermal stress m each thermal cycle. This Report describes tests m which thermal stresses were generated m a representative structural specimen and were adlusted to give a designed acceleration factor of 2. It is shown that this method of acceleratmg thermal damage was reasonably accurate. Further work IS discussed which will mvestigate the acceleration of thermal fatrgue damage under con- ditions more representative of Concorde m service and m the full-scale fattgue test, par- ticularly m representmg times at temperature.
_____ -_--_--w------e-----
DETACHABLE ABSTRACT CARDS
-- l
I I
I
I - - - -Cuthere- - -

C.P. No. 1342
Q crown eqpyright
1976
Published by HER MAJESTY’S STATIONERY OFFICE
Government Bookshops
49 High Holborn, London WClV 6HB 13a Castle Street, Edinburgh EH2 3AR
41 The Hayes, Cardiff CFI IJW Brazennose Street, Manchester M60 8AS
Southey House, Wine Street, Bristol BSI 2BQ 258 Broad Street, Bmmingham Bl 2HE 80 Chichester Street, Belfast BT1 4JY
Government Publications are also avadable through booksellers
C.P. No. 1342 ISBN 011 470952 I