civil aircraft airworthiness data recording...
TRANSCRIPT

C.P. No. I 182
ti PROCUREMENT EXECUTIVE, MINISTRY OF DEFENCE
AERONAUT/CAL RESEARCH COUNClL
/CURRENT PAPERS
Civil Aircraft Airworthiness Data Recording Programme
Hard Landings Encountered by Subsonic Civil Jet Aircraft
bY
The CAADRP Specml Events Workmg Party
(Co-ordrnoted by G. B. Hutton)
Structures Dept., R.A.E., Farnborough
LONDON: HER MAJESTY’S STATIONERY OFFICE
1971
PRICE f/.35 NET


UDC 629.13.08X
C.P. No.1182
November 1970*
CIVIL AIRCRAFT AIRWORTHINESS DATA RECORDING PROGRAMME
HARD LANDINGS ENCOUNTERED BY SUBSONIC CIVIL JET AIRCRAFT
The CAADRP Specml Events Working Party
(Co-ordinated by G. B. Hutton)
SUMMARY
A number of jet aircraft m normal airline service were fitted with
recorders producing continuous trace records of 14 parameters. Throughout the
recording period, representing 11462 scheduled airline flights, the records were
searched for unusual occurrences, and each one studied to determine Its nature
and, where possible, factors contributing to its cause.
This Report describes a selection of events which involved hard landings
occurrzng on two types of aircraft during the period December 1965 to
October 1969. The event descriptions include comments, most of which mentmn
contributory causes of the hard landings. A particular study 1s made of the
normal CG acceleration at touchdown and of aircraft manoeuvres during the flare.
It 1s shown that all the hard landings followed abnormal flare manoeuvres.
* Replaces RAE Technical Report 70187 - ARC 33031

CONTENTS
1 INTRODUCTION
2 NOTE ON SELECTION OF SPECIAL EVENTS
3 SPECIAL EVENTS
4 MEASUREMENTS
5 DISCUSSION 5.1 The component parts of the normal CG acceleration
5.2 Acceleration response of aircraft types to landing impact
5.3 Aircraft speed at touchdown
5.4 Types of flare manoeuvre
5.5 Undercarriage loads and relative severities of second and third impacts
Page 3 3 4 5 7 7 8 8
10 11
5.6 Visibility conditions 5.7 Crew awareness to impact severity
5.8 Effect of hard landings on the aircraft structure 6 RECOMMENDATION
7 CONCLUSIONS
Appendix Tables 1-5 References Illustrations Detachable abstract cards
12 12 12 13 13 15
17-21 22
Figures l-40

3
1 INTRODUCTION
The object of the Civil Ancraft Airworthiness Data Recording Programme is
a systematic study of the normal operational flight of civil transport aircraft.
A small number of aircraft in regular anline service are fitted with analogue
paper trace recorders which collect data in the form shown in Flg.1. AddItional
parameters have been introduced .slnce the start of recording and the whole
prograxmne 1s described fully elsewherel.
From time to time unusual or extreme events (Special Events) are noted and
this Report contains a selection of such events comprising hard landings.
Accident investigation summaries* show that during five years up to the middle
of 1968 heavy landings were a major or contributory cause of ten of the 130
reported civil aircraft accidents. The hard landngs presented in this Report
were all manual landings and occurred on two types of passenger-carrying subsonic
jet aircraft in scheduled airline service (i.e. excluding training and test
flights) during the period December 1965 to October 1969. The aircraft are
denoted Types D and E and two aircraft of each type were instrumented. The
recording period covered by individual aircraft ranged from two years to three
years five months; Type D completed 4161 landings and Type E 7301 landings.
The Special Events are presented in the form of a reproductxn* of the
original record, together with information about the event and comments which
represent the opinion of a Working Party comprising members of RAE, ARB, Board
of Trade, CI Data Centre, Meterological Office and the airlIne concerned.
Special events relating to other aspects of flight are the subjects of
earlier Reports and Technical Memoranda.
2 NOTE ON SELECTION OF SPECIAL EVENTS
After the photographx record has been developed it is examined and
annotated by the alrline concerned. It is then scrutinised by a member of the
Working Party for Special Events, and fInally examined in detail at the Data
Centre (CI Data Centre) during routine analysis. There are thus at least three
stages in which a Special Event occurring during a recorded flight may be
detected. It should be noted, however, that it is not normally possible to
relate the frequency of Special Events to the frequency of operational
occurrences.
*Defnntion is necessarily lost in photographic reproduction of records; comments are frequently based on observation from the orlgznal records. Values quoted are also measured from these.

It 1s not possible to lay down a hard and fast guide as to what 1s
regarded as an unusual or extreme event, but the following is a summary of the
type of occurrences looked for ln the search.
(a) Normal CG (centre of gravity) acceleration increments of about fl.O g or
larger while airborne.
(b) Rapid and large changes in height or airspeed.
Cd Excessive application of any flight control.
Cd) Infrequent operational events, such as abandoned take-offs, missed
approaches, engine failures, engine-out landings, etc.
(e) Unusual oscillations on any of the traces.
(f) Exceedances of operatmnal limitations such as maximum operatmg speeds.
For the purpose of this Report landings regarded as being eventful were
those which contained an incremental CG acceleratmn of 0.8 g, or above,
relative to the 1 g datum.
Despite the fact that each record is examined at least three times, it 1s
unlikely that every unusual event will be detected; this is particularly true
of certain of the operational events, such as engine failure. Hence, any
frequencies derived from these data should be treated with caution; nevertheless
It is considered that a very high proportion of hard landings, as defined above,
have been detected. It is mtended that frequency data will be sumarmed m one
form or another from time to tune, and will be based on the information contained
in the full routme analysis programme.
3 SPECIAL EVENTS
Fig.1 shows a sample of a normal flight and landing to famliarise the
reader with recorded parameters.
The events have been grouped according to arcraft type as follows:
Figs.2 to 16, aircraft Type D.
Flgs.17 to 38, aircraft Type E.
In each group the events are presented m the order in which they
occurred.
5
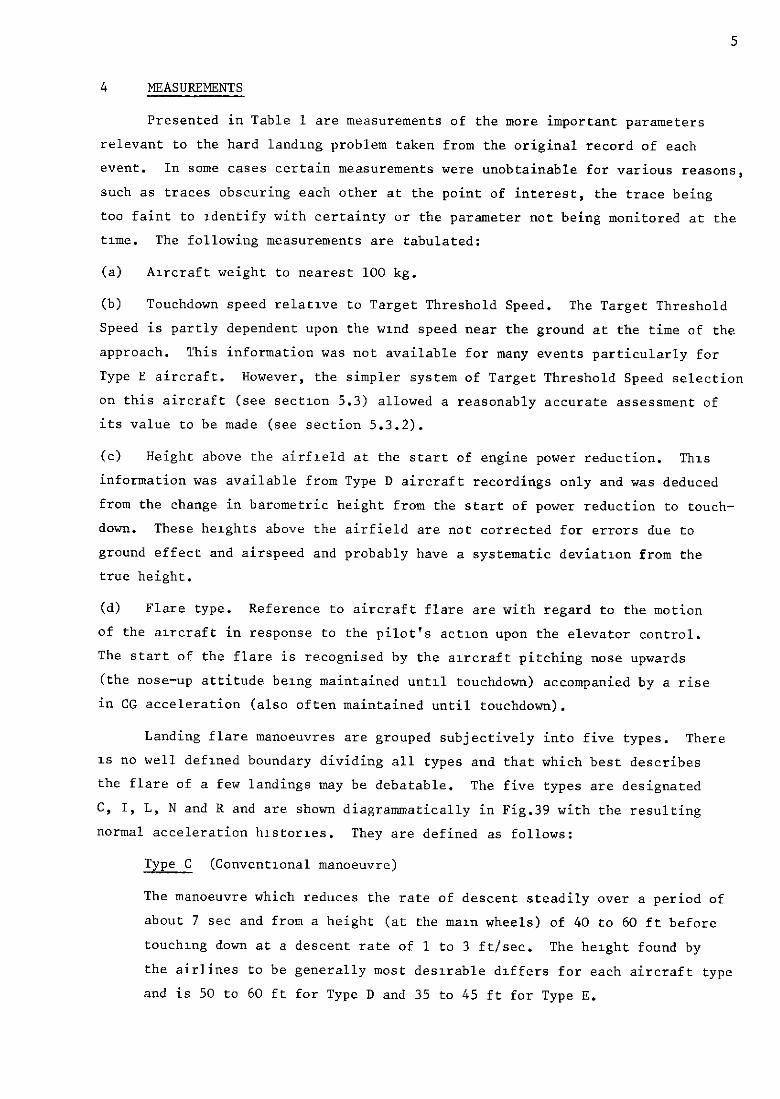
4 MEASUREMENTS
Presented in Table 1 are measurements of the more important parameters
relevant to the hard landing problem taken from the original record of each
event. In some cases certain measurements were unobtainable for various reasons,
such as traces obscuring each other at the point of interest, the trace being
too faint to Identify with certainty or the parameter not being monitored at the
tulle. The following measurements are tabulated:
(a) Axrcraft weight to nearest 100 kg.
(b) Touchdown speed relative to Target Threshold Speed. The Target Threshold
Speed is partly dependent upon the wind speed near the ground at the time of the
approach. This information was not available for many events particularly for
Type E aircraft. However, the simpler system of Target Threshold Speed selection
on this aircraft (see sectmn 5.3) allowed a reasonably accurate assessment of
its value to be made (see section 5.3.2).
Cc) Height above the airfleld at the start of engine power reduction. This
information was available from Type D aircraft recordings only and was deduced
from the change in barometric height from the start of power reduction to touch-
down. These heights above the airfield are not corrected for errors due to
ground effect and airspeed and probably have a systematic deviation from the
true height.
Cd) Flare type. Reference to aircraft flare are with regard to the motion
of the arcraft in response to the pilot's actlon upon the elevator control.
The start of the flare is recognised by the arcraft pitching nose upwards
(the nose-up attitude bang maintained until touchdown) accompanied by a rise
in CG acceleration (also often maintained until touchdown).
Landing flare manoeuvres are grouped subjectively into five types. There
1s no well defined boundary dividing all types and that which best describes
the flare of a few landings may be debatable. The five types are designated
C, I, L, N and R and are shown diagrammatically in Fig.39 with the resulting
normal acceleration hIstorIes. They are defined as follows:
(Conventional manoeuvre) Type C
The manoeuvre which reduces the rate of descent steadily over a period of
about 7 set and from a height (at the man wheels) of 40 to 60 ft before
touching down at a descent rate of 1 to 3 ft/sec. The heqht found by
the airlines to be generally most desirable differs for each aircraft type
and is 50 to 60 ft for Type D and 35 to 45 ft for Type E.

6
(Insufficient flare) Type I
The flare is initiated at a time of more than 3 set before touchdown but
the average positive normal acceleration applied over this period is
insufficient to reduce the rate of descent to an ideally low level.
(Late flare) Type L
The flare is initiated late, at a time of 3 set or less before touchdown,
insufficient time being available to reduce the descent rate sufficiently
to avert a hard landing.
(No flare) Type N
No flare is applied, or is initiated so late before touchdown that the
rate of descent is reduced by less than 1 ft/sec.
Type R (Rate of descent increased after flare)
On completion of a successful flare-out an increased rate of descent
is re-introduced before touching down.
(=) Rate of descent at touchdown. This was estimated from radio height and
normal acceleration and is accurate to within about 20%. Since a known radio
height time history was essential estimates were obtained for aircraft Type E
0*ly.
(0 Total maximum normal CG acceleration increment above the 1 g datum. This
is the peak value recorded and includes oscillations caused by structural
vibrations of airframe modes at frequencies up to about 12 Hz. Fig.4CI shows the
frequency response of the instrumentation fitted in each aircraft type. The
events from aircraft Type E in Fig.17 and 18, however, were obtained using the
accelerometer system for Type D.
(9) Aerodynamic lift above the 1 g datum at touchdown.
W Rate of change of lift imediately prior to touchdown.
(9 Maximum normal acceleration increment above the 1 g datum ignoring the
oscillations caused by structural vibration. Due to the recording film speed
employed the mean level through the 'structural' oscillations could only be
determined approximately; values are quoted to the nearest 0.05 g but all
values are not necessarily to this accuracy.

7
(j) Angle of aircraft bank at the instant of touchdown. Positive sign
indicates starboard wing down in accordance with British standard nomenclature.
Recordmg sensitivity allowed an accuracy of no better than plus and minus
one degree from the stated value.
Measurements (f), (g), (i) and (j), are given for each impact in multiple-
Impact landings.
Actual indicated airspeed at threshold was also measured from Type E
recordings (this was unobtainable from Type D records) and is presented in
Table 2 together with aircraft weight, Target Threshold Speed and speed at
touchdown.
5 DISCUSSION
5.1 The component parts of the normal CG acceleration
This study assumes the overall CG acceleration envelope during the
landing Impact to be composed of three components, each being due to one of
the following factors:
(9 Aerodynamic lift.
(il) Structural vibration.
(iii) Undercarriage oleo load.
The CG accelerometer was situated very close to the aircraft centre of gravity
and the instrument was influenced insignificantly by aircraft pitching. Accurate
correlation cannot be assumed to exist between peak CG acceleration and
structural loads owing to the Individual components of the acceleration being
generated by loading actions on different parts of the aircraft. Separation of
the undercarriage load component (1.e. maximum acceleratwn above the lift datum
Ignoring structural oscillations) was accomplished but the results (see 5.5
below) are approximate owing to the lack of detail definition on the analogue
records. This, however, should not be a problem on dlgital records with a
sampling rate of at least 16/set. This component separation technique provides
more realistic data which should aid designers in catering for actual operating
conditions and assist investigators in determining spheres in need of
particular attention.
The oscillations superimposed upon the undercarriage load component were probably related to airframe resonance modes. The amplitude of these high fre-
quency components varied widely from landing to landing and in the most extreme
8
aase (Fig.37) 37% of the overall peak acceleration was estimated* to have been
produced by an airframe mode; possibly the first fuselage mode at about 4 Hz. Load assessments from these higher frequency oscillations on the analogue records are not possible owing to their frequencies being unresolvable and the particular mode being excited thus unidentifiable.
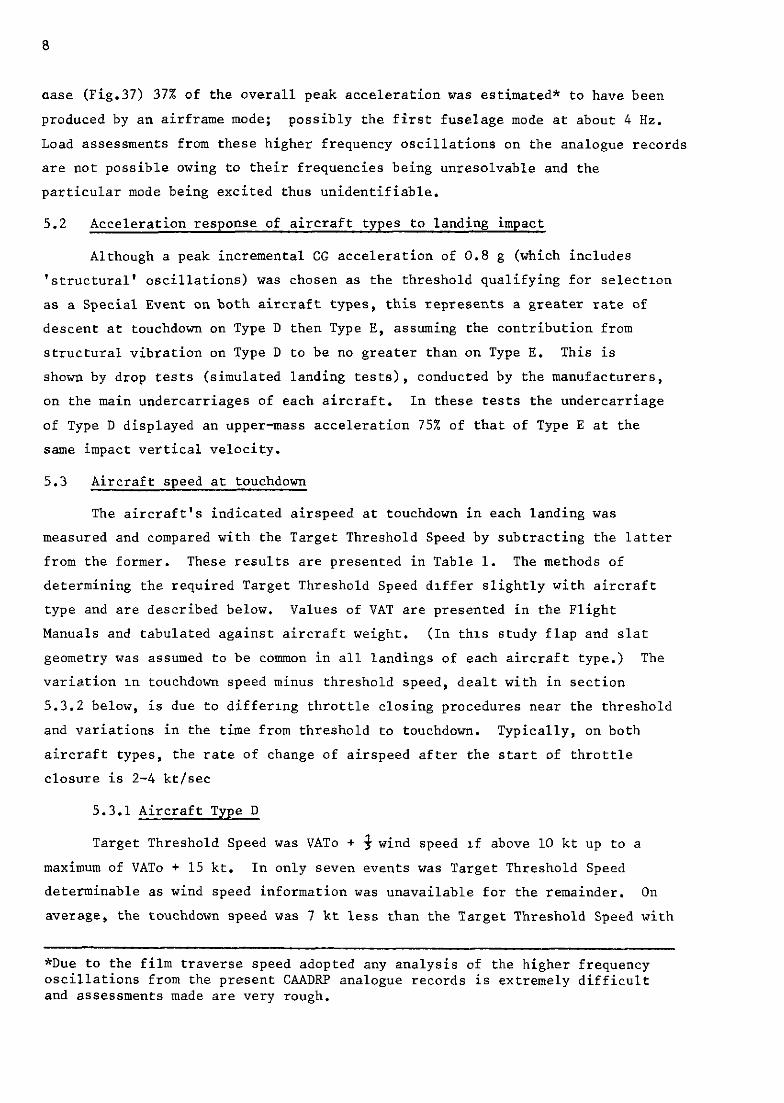
5.2 Acceleration response of aircraft types to landing impact
Although a peak incremental CG acceleration of 0.8 g (which includes 'structural' oscillations) was chosen as the threshold qualifying for selectIon
as a Special Event on both aircraft types, this represents a greater rate of
descent at touchdown on Type D then Type E, assuming the contribution from
structural vibration on Type D to be no greater than on Type E. This is
shown by drop tests (simulated landing tests), conducted by the manufacturers, on the main undercarriages of each aircraft. In these tests the undercarriage
of Type D displayed an upper-mass acceleration 75X of that of Type E at the same impact vertical velocity.
5.3 Aircraft speed at touchdown
The aircraft's indicated airspeed at touchdown in each landing was measured and compared with the Target Threshold Speed by subtracting the latter from the former. These results are presented in Table 1. The methods of determining the required Target Threshold Speed differ slightly with aircraft type and are described below. Values of VAT are presented in the Flight Manuals and tabulated against aircraft weight. (In this study flap and slat geometry was assumed to be common in all landings of each aircraft type.) The variation in touchdown speed minus threshold speed, dealt with in section 5.3.2 below, is due to differing throttle closing procedures near the threshold and variations in the time from threshold to touchdown. Typically, on both aircraft types, the rate of change of airspeed after the start of throttle closure is 2-4 kt/sec
5.3.1 Aircraft Type D
Target Threshold Speed was VATo + 3 wind speed If above 10 kt up to a maximum of VATo + 15 kt. In only seven events was Target Threshold Speed determinable as wind speed information was unavailable for the remainder. On average, the touchdown speed was 7 kt less than the Target Threshold Speed with
*Due to the film traverse speed adopted any analysis of the higher frequency oscillations from the present CAADRP analogue records is extremely difficult and assessments made are very rough.

9
a standard deviation of 7.7 kt. The actual speed at threshold could not be
measured as the speed generally fell continuously during the final approach and the threshold point could not be determined.
5.3.2 Aircraft Type E
For the landings in Figs.17 to 34 the Target Threshold Speed was VAT + 10 kt for all conditions. For the remaining landings (Figs.35 to 38),
due to a change in operating procedure, the Target Threshold Speed was
VAT + 5 in smooth conditions and when wind shear or gusts were likely, VAT + 10 kt was required. In the landings in Figs.35 to 38 the appearance of the fine airspeed trace was used to judge the gustiness of the wmd and thus determine which speed was most likely required. VAT + 10 kt was assumed in cases where gusts of greater than i5 kt amplitude were evident in the last
minute of approach. Accordingly actual indicated touchdown speed relative to Target Threshold Speed was obtained for all landings except one for which
aircraft weight was unavailable. The average value of touchdown speed minus Target Threshold Speed was -9 kt with a standard deviation of 6.4 kt. The airspeed during the final approach was steady to within 2 or 3 kt until the start of flare in nearly all the landings on this aircraft type as auto-throttle
is usually in use. This characteristic enabled the actual airspeed at threshold also to be measured with reasonable accuracy and compared with the Target Threshold Speed and touchdown speed. These values are presented in Table 2. Additionally touchdown speed minus actual speed at threshold (1.e. speed lost
in flare expressed as a negative quantity) is shown, also actual threshold speed minus Target Threshold Speed. On average the actual indicated airspeed at threshold was only 1 kt below the Target Threshold Speed, the standard deviation being 3.5 kt. The average value of touchdown speed minus threshold speed for landings with Type R flares was -22 kt, the three values being -35, -19, and -21 kt; in these landings the throttle was not closed earlier than is normal and was after the height had reduced to 50 ft, i.e. after crossing the threshold. For those landings with Type I flares the average was -7 kt with a standard deviation of 5.7 kt and those with flare Types L and N was -5 kt with a standard deviation of 10.7 kt. These values serve to illustrate the large amount of alrspeed which is lost during Type R flare manoeuvres compared with that lost during other types of manoeuvre.

10
5.4 TJpes of flare manoeuvre
Section 4 defines various types of flare manoeuvre and the flare performed
in each event is classified accordingly. In six events the flare was of Type I. In each case it was performed over a reasonable time period, ranging from 3 to 10 set, but the mean level of normal acceleration was too low to reduce the rate of descent sufficiently for a light landing. In 21 events flare was Initiated late in the landing process, at a time of 3 set or less before touchdown, and is designated Type L. In three events the flare manoeuvre was of
Type N. The manoeuvre began at less than half a second before touchdown
(although the pilot initiated elevator movement up to about 1.3 set before touchdown) and the rate of descent reduction, estimated from the normal acceleration, was less than 1 ft/sec. Manoeuvres of Types L and N may be a result of the pilot not being able to Identify with sufficient accuracy his height above the runway.
Three events (Figs.25, 28 and 34) were regarded as possibly being inten- tionally firm landings due to the runway surface being covered with rain water or slush at the time; It is recommended ln the flying manuals that a 'firm' or 'positive' landing be made in order to reduce the risk of loss of tyre adhesion by aquaplaning in these conditions.
The flare manoeuvre in six events was of Type R where, following a successful flare-out, the aircraft was still airborne and was then caused to descend more rapldly again. This possibly suggests that the flare was performed too briskly and/or too high and the pilot then became anxious to land the aircraft before losing an excessxve amount of airspeed. One event (Fig.20) displays a flare manoeuvre which is a development of Type R. After the initial flare-out the aircraft's nose was pushed downwards and then flared again, this
being repeated. The aircraft thus descended in a series of steps. It was during the third flare that the aircraft landed. This 'stepping' technique is often used in an attempt to achieve a light landing when the flare-out has been performed too high or too briskly. It is also considered m airline circles to be a useful technique when out of practice in landing the aircraft. Fig.20 possibly serves to Illustrate the pilot's difficulty in such a situation in achievuxg a light landing and yet not taking an excessive time over the procedure and thus losing too much airspeed. The speed in this event had
droned to 124 kt by touchdown and at these low speeds elevator control effect- lv=~eSS 1s often considerably reduced and excessive pitch angles would be required to effect sufficient reductions in descent rate to avert a bard landing.

11
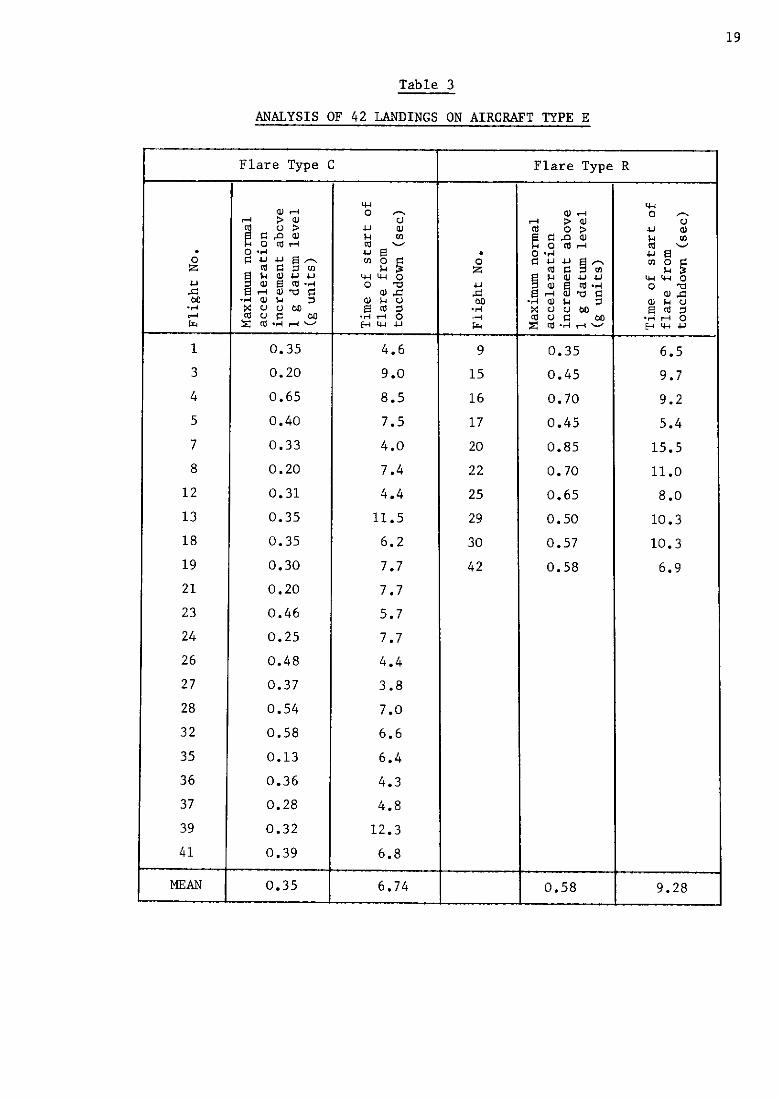
It is clear that flare Types I, L and N would result in harder landings than would Type C (conventional flare manoeuvre) starting from the same initial descent rate but the general result of Type R manoeuvres is not so certain. For this reason a series of 42 consecutive landings was studied and the landing severities from flares of Type R ware compared with those resulting from flares of Type C. This exercise is presented in the Appendix and Table 3 shows that the landings resulting from flare manoeuvres of Type R were generally more severe than those from Type C. The mean of the peak CG accelerations on impact (including contributions from structural vibrations of the lower modes) of Type R was 0.58 Ag and of Type C was 0.35 Ag.
The probable reason for Type R flare vary often resulting in a hard landing is that, after re-instating the increased descent rate following the initial
flare, the height, and hence time, which the pilot has remaining in which to
control the aircraft's attitude and flight path is very small (in most cases less than 10 ft). A light landing will result if either (a) the aircraft's height on initiation of increased descent rate is less than 2-3 ft or (b) the height 1s suffxient (viz greater than about 20 ft) to allow the pilot to perform
a further complete flare. If this height is below about 20 ft a light landing is very largely fortuitous.
5.5 Undercarriage loads and relative severities of second and third impacts
Presented in Table 4 for each landing impact in each event are values of maximum CG acceleration measured above the aerodynamic lift level and ignoring oscillations attributable to structural vibration modes. These values approxi- mately represent the maximum vertical loads transmitted via the undercarriages. It can be seen that in six events (Figs.4, 5, 6, 8, 16 and 35) this load is higher on the second impact than the first, whereas in only two (Figs.5 and 8) is the overall landing severity (as indicated by the total peak CG acceleration) greater on the second impact. On aircraft Type D the most severe undercarriage vertical loads appear to be produced on the second impact. However, under- carriage drag loads may be considerably lower on the second impact depending upon the amount of wheel spin-up generated at the initial impact.
On no impact in any landing studied was there evidence of the nosewheel contacting the ground before the main wheels. There were, however, two landings which, for all practical considerations, included three-point landing impacts. These were the third impact in the landing of Fig.4 and the second impact in
Fig.18. whether or not the nosewheels were clear of the ground at impact was

12
deduced from the aircraft pitch angle. If the angle at impact was greater than during the landing run-out the nosewheels were considered to be clear. In three landings (Figs.2, 30 and 35) this information was unobtainable, due either to the pitch attitude not being recorded or the trace being obscured by another at the pomt of interest.
From the foregoing it can be appreciated that events following the initial
touchdown must also be monitored in order to observe the most severe landing loads.
Ref.3 demonstrates factors influencing the severity of second (and subsequent) landing impacts and shows how this might be alleviated.
5.6 Visibility conditions
Table 5 presents the visual conditions prevailing at the time of each
landing, the second to last column indicating daylight or darkness and the last column the visual range (visibility) dictated by the weather conditions, The visibility was obtainable for only eight landings. None of these were critical, the visibility in the worst case being 4 nautical miles. Darkness was considered to range from half an hour after sunset to half an hour before sunrise. Of the total 37 landings 19 took place in daylight and 15 in darkness (the times of three landings were unavailable) representing a day/night ratio of 1.3:1. The ratios for the individual aircraft types were 2.1 for Type D and 0.9 for Type E. These values compare with 2.4 and 2.8 for all recorded landings during two years
and one year from Types D and E respectively. This indicates that, for aircraft Type E especially, darkness is a contributory factor towards hard landings.
5.7 Crew awareness to impact severity
There is little evidence to show that pilots are able to judge the severity of a landing impact; the two cases for which any crew comment is available being too few to form any conclusions. In one event (Fig.22) on aircraft Type E on being subsequently asked to recall the landing the pilot could not remember the Impact as being abnormally hard. Following another event (Fig.l3), on aircraft Type D in this case, the pilot reported the landing as being 'firm' in the flight log and this is the only occasion when a flight log report was made on the severity of a landing impact during the 11462 landings covered by this study.
5.8 Effect of hard landings on the aircraft structure
Discussions with operators and manufacturers of both aircraft types revealed that it is improbable that any have suffered structural damage as a

13
result of hard landings during scheduled flights and no reports of damage resulting from the events discussed in this Report have come to the notice of CAADRP .
6 RECOMMENDATION
A study to ascertain the factors resulting in the various types of flare
manmuvre occurring is recomended. From such a study certain piloting difficulties (e.g. visual cues) may become apparent which, if alleviated, should reduce the incidence of hard landings and render the landing phase of flight less hazardous.
Where possible, landing studies should investigate the significance of aerodynamic lift and structural vibration at touchdown and also of bounce and subsequent landings after initial touchdown.
7 CONCLUSIONS
The 37 Special Events represent the hardest landings found in nearly four years of CAADRF' recording on four passenger-carrying subsonic jet aircraft. The arcraft were of two types (D and E) and in this period Type D performed a total of 4161 operational landings and Type E 7301.
The recorded normal CG acceleration at touchdown is generated from three principal sources. The respective components are separated and the overall acceleration level and two of the components (the contributions from aerodynamic lift and undercarriage load) are tabulated. This data should provide designers and design requirement authorities with an improved understanding of the nature of severe landings.
All the hard landings followed abnormal flare manoeuvres and the greater proportion (24 of the 37 landings) were caused by late flare initiation relative to the moment of touchdown, at a time of three seconds or less before touchdown.
A study to ascertain the reason for these abnormal flares may lead to easing the pilot's task and alleviating the incidence of hard landings.
In a few landings where bounce occurred the maximum CG acceleration, ignoring vibration from structural modes, (i.e. the contribution from the undercarriage load) measured on the second impact was greater than on the first. Thus the initial contact with the ground on landing is not necessarily the most critical for undercarriage loading.


15
Appendix
It has been observed from CAADRF' recordings that the flare manc~euvre
preceding many landings is characterised by the aircraft being fully, or almost fully, flared followed by the descent rate being increased again, by the pilot pushing the elevator control forward, to the point of touchdown. This
manoeuvre has been called Type R. It is most clearly witnessed in recordings
from aircraft Type E on which radio height is recorded at altitudes below 400 to 500 ft; this gives a clear history of the aircraft's flight path with respect to time when over flat terrain. The descent rate achieved after the initial flare-out prior to pushing the aircraft's nose over again has ranged from a normal landing descent rate to a negative rate (i.e. the aircraft ascending).
The reasons for this type of flare manoeuvre occurring are not clear but it is likely that in these cases the pilot has misjudged his height above the ground during the flare and found himself still airborne when the flare was deemed complete. From this point the additional action is necessary in order to elther land the aircraft at all or prevent its alrspeed falling too low before touching down.
The effect of this type of manoeuvre on the severity of the subsequent landing is not so obvious as the effect of other flare types and for this reason a brief study was conducted, on aircraft Type E, in which the landing severities resulting from flare manoeuvres of this type (R) were compared with those resulting from what is considered the correct flare procedure (Type C) where the descent rate is reduced steadily over several seconds up to the moment of impact.
Details of study
Fig.39 displays diagrammatically the time hlstories of height and normal CG acceleration during flare manoeuvres of Types C and R and others, all of which categorise most landings recorded by CAADRF'.
A recording of 42 consecutive flights was selected which contained a large proportion of landings having a flare manoeuvre of Type R. The flares of 22
landings were found to conform to Type C and of 10 landings to Type R.
The value of peak normal CG acceleration at touchdown was measured from each of the 32 landings and those resulting from flares of Type R were compared to those resulting from Type C. The values are presented in Table 3 and it is

16
seen that the mean value for Type R is 0.58 Ag compared to 0.35 Ag for Type C. Also shown in the table is the time taken from the start of flare (deduced
primarily from the pitch and CC acceleration traces) to touchdown. As would be expected the mean time taken performing Type R manoeuvre exceeds that of Type C,
the time for Type R being 9.28 set and for Type C 6.74 sec.
The main conclusion to be drawn from this study is that flare manoeuvres
of Type R in general produce harder landings than Type C (the probable reasons are explained in section 5.4 of the main Report), but the study in the main Report shows that Type L manoeuvres produce the most severe landings which occur mm-e rarely.

17
- -T- 1

18
-
?ig. Jo.
- 17 18 19 20 21 22
23 24 25 26 27 28 29 30 31 32 33 34 35 36 37 38
-
4ircraf weight
(1000 k
a 0 0 Target Actual IAS
threshold IAS at at speed threshold touchdown (kt) (kt) (kt)
45.3 149
43.1 145
41.0 142
43.0 145
45.2 149
44.9 149
45.5 150 44.8 149 42.8 145
43.6 147 45.8 150
46.7 152
45.8 150 43.5 147 44.4 147 44.5 149 46.3 150 45.8 150 44.5 144 46.7 147
45.4 144
Table 2
TARGET AND ACTUAL INDICATED LANDING SPEEDS (IAS) AIRCRAFT TYPE E
152 150 -2
147 142 -5
139 135 -4 149 124 -25
152 143 -9 147 144 -3
145 138 -7 149 141 -8
140 137 -3
145 137 -8
146 127 -19
148 146 -2
152 142 -10
148 148 0
143 141 -2
143 126 -17
148 144 -4
143 138 -5
157 147 -10 146 137 -9 148 145 -3
146 125 -21
yg’
+3 +2 -3 +4 +3 -2 -5 0
-5
-1 -2
0 -2
-4 -4 -1 -7 +7 +2 +1 +2
~la?X :YPe
L I L R L N L L L L R L L L I I L I L L L R
19
Table 3
ANALYSIS OF 42 LANDINGS ON AIRCRAFT TYPE E
Flare Type C
. 2 2 .Y ‘;: 1 3 4 5 7 8
12 13 18 19 21 23 24 26
27 28 32
35 36 37 39 41
0.35 4.6 0.20 9.0 0.65 8.5 0.40 7.5 0.33 4.0 0.20 7.4 0.31 4.4 0.35 11.5 0.35 6.2 0.30 7.7 0.20 7.7 0.46 5.7 0.25 7.7 0.48 4.4 0.37 3.8 0.54 7.0 0.58 6.6 0.13 6.4 0.36 4.3 0.28 4.8 0.32 12.3 0.39 6.8
. 2 2 .Y 2 9
15
16 17 20 22 25 29 30 42
0.35 6.5 0.45 9.7 0.70 9.2 0.45 5.4 0.85 15.5 0.70 11.0 0.65 8.0 0.50 10.3 0.57 10.3 0.58 6.9
MEAN 0.35 6.74 0.58 9.28
f
Flare Type R

20
-
% % 2 z 2 .rl K=l - 2 3 4 5 6 7 8
9 10 11 12 L3 14 15 16 i7 18 19 !O -
T
Table 4
TOTAL MAXIMUM CG ACCELERATION AND MAXIMUM CG ACCELERATION ABOVE LIFT DATUM IGNORING HIGH FREQUENCY OSCILLATIONS
1st Impact
0.95
0.87 1.16 0.75 1.17 0.84 0.70 0.80 0.93 1.18 1.17 0.93 0.80 0.80 0.83 0.98 0.95 1.16 0.85
0.70 0.66
0.55 0.80 0.65 0.40 0.55 0.62 0.65 0.70 0.69 0.60 0.39 0.55 0.60
0.80 0.65
2nd Impact I
0.64 0.72
0.80 0.75 1.10 0.70 1.17 1.05 0.45 0.40 1.22 0.84
0.50 0.50 0.37 0.24 0.63 0.55 0.30 0.35
0.40 0.50
0.78 0.72
0.46 -
T 3rd Impact - T
: -2 2 I? 23 2 - !l
!2 13 !4 !5
!6 27 !8 29 30 31 32 33 34 35 36 37 38
-
1st Impact -
1.96 1.94 1.01 3.85 1.33 3.86 1.10 3.80 1.06 1.10 I.94 I.94 1.02 I.95 I.92 1.95 1.02
-
0.73 0.70 0.69
0.73
0.86 0.93 0.57 0.77 0.60 0.72 0.76 0.65 0.55
0.48 0.70
2nd Impact
0.36 0.43 0.43 0.50 T 0.24 0.20 0.55 0.50 0.47 0.54 0.68 0.68
0.50 0.48 0.45 0.59 0.60 0.55 0.23 0.27 0.37 0.46
0.44 0.65 0.40 0.41 0.29 0.36
3rd Impact
I.29 .36
Note: 1 Appropriate spaces are left blank where a second or third impact did not OCCUT.
2 A dash is inserted where the parameter was not measurable for any reason.

21
Table 5
VISIBILITY CONDITIONS DURING HARD LANDINGS
FlgUX NO.
2
3
4
5
6
7
8
9
10
11
12
13
14
15
16
17
18
19
20
21
22
23
24
25
26
27
28
29
30
31
32 33
34
35
36
37
38
onth islbility
(NM1 1
DeC
NOV
Feb
June
June
June
June
July
July
July
JUlY
Ott
De2
Jan
July
Ott
Ott
Jan
July
Feb
M=Y
M=Y JUW
June
July
July
sept
Sept
Ott
Ott
NW NOV
Jail
APT
APT
M==Y
June
--
Tl!lE Anport “IDYlSCZ unset
lght (L)
GMT) (GMT) (GMT) D::k (D) --
0108 Nassau 1144 2221 D
1925 NC3SS.W 1126 2220 L
1755 Mont. Bay 1141 2252 L
0013 NY (JFK) 0926 0020 L
2125 Bermuda 0911 2327 L
0218 Mont. Bay 1035 2346 II
2117 Chicago 1017 0132 L
0031 Boston 0917 0022 L
2343 Chicago 1027 0126 L
0342 Colombo 0032 1300 L
1135 Tehran 0140 1545 L
1236 Prestwick 0724 1639 L
0329 Antigua 1030 2134 D
0306 Mont. Bay 1141 2252 D
2330 Barbados 0942 2232 D IppTO,
2127 Zurich 0535 1652 D LRR - -
1926 LHR 0802 1622 D
1359 LHR 0755 1658 L LHR - -
0748 Paris (LB) 0414 1918 L
1546 Brussels 0352 1925 L LHR - -
1448 LHR 0349 2023 L
1622 Brussels 0345 1950 L
2121 LHR 0401 2014 D
2119 Basle 0510 1719 D
1452 Pans (ORLY) 0542 1740 L
1735 Frankfurt 0536 1650 D
2020 LHR 0650 1640 D
1724 Paris (ORLY) 0712 1602 D 1650 Frankfurt 0654 1532 D
2014 Glasgow 0838 1614 D
0750 Zurich 0437 1815 L
1851 LHR 0508 1858 L
2152 kllstm. 0536 1800 D
1018 Pals (ORLY) 0345 1956 L --
A dash 1s Inserted where the mformatmn was "nobtamable
15
12
10
15
5
35
4
10

22
REFERENCES
NO. Author(s) - Title, etc.
1 The CAADRP Technical Panel The Civil Aircraft Airworthiness Data
Recording Programme.
RAE Technical Report 64004 (ARC 26490)
(1964)
2 International Civil Aviation Aircraft Accident Digest
Organisation (ICAO) Numbers 15-17
3 H. Hall Operational and Theoretical Studies on
C. B. Hutton the effects of pilot action on heavy
landings.
A.R.C. C.P. No.1119 (1969)

OUTSIDE AIR TRW. FINE HEIGHT
[OATI IWWI
COARSE
I
FINE AIRSPEED MINUTE AIRSPEED iEi%E FINE HEIGHT Eisii
IIvSK31 MARKER PITCH [A/S(P)1 ITFT IHW‘)l ANNOTATION tHt(Ol
I I I I I \
“2EF ROLL AILERON RUDDER LCCALISER
ML1 IRUDI WC1 GLIDE SLOPE NORMAL CG ELEVATOR
ACCELERATION [R.PM 1
[WI [&I
WI
(ALTERNATIVELY THROTTLE SETTING)
Note: The abbreviations in square brackets ore used in Figs.2 to 38
Fig.l. Sample record


Information on Event in Fig.2
Aircraft Type: D
Airport: Nassau
Date: December 1965
Peak CG acceleration:
Runway: 09
Time : 01.08 GMT
1st impact: 0.95 Ag (see Cements below)
2nd impact: 0.64 Ag
Aircraft speed at initial touchdown: 138 kt ias
Camments :
During the last 10 seconds of the approach up to the start of flare the
rate of descent was approximately 171 ft/sec, estimated from the barometric
height time history. This is well above the usual rate of 10 to 12 ft/sec and,
as the air speed of 140 kt was correct , suggests that the aircraft was
descending on a line above the correct glide slope. The glide slope deviation
unfortunately was not available.
Just discernible on the orlginal record but invisible in the reproduction
opposite is a fine peak extending to 1.32 Ag. This is considered to be either
spurious or of such a high frequency as to be meaningless from both structural
and physiological points of view.


Information on Event in Fig.3
Aircraft Type: D Au-port: Nassau Date: November 1966 Peak CG acceleration: Ancraft speed at touchdown: Meteorological conditions:
Runway: 32 Time: 19.25 GMT 0.87 Ag 124 kt ias
Visibility (Nml)
Cloud
19.00
26.6 26.6
020'/10 kt 360'/10 kt
15 2/a cu
at 2300 ft
15 l/8 cu
at 2300 ft
20.00
Cements:
Landing performed while aircraft slightly banked. The aircraft had been oscillating in roll for a high proportion of the last three minutes of the approach, probably due to turbulent conditions.


Information on Event in Fig.4
Aircraft Type: D
Airport: Montego Bay Runway: 06 Date: February 1967 Time: 17.55 GMT Peak CG acceleration:
1st impact: 1.16 Ag 2nd impact: 0.80 Ag 3rd impact: 0.43 Ag
Aircraft speed at first touchdown: 130 kt ias
Meteorological conditions:
Time (GMT) 17.00 18.00
Temp ('C)
Wind
Visibility (Nml)
Pressure (mb)
Cloud
Rainfall
26.1 26.8
090'/19 kt 090'/21 kt
12 12
1016.2 1015.7
3/S Cu SC 218 Cu SC at 2500 ft at 2500 ft
Nil within last 6 hours
comments:
An abnormal approach was followed by a heavy landing and two bounces. The second and third impacts were performed with a small degree of aircraft roll angle. Possible causes for the poor landing are as follows:-
(1) The angle of approach 1s low; about 2.16'.
(2) Excessive power is being used to maintain the approach.
(3) Aircraft pitch-up is high to generate lift. This generates high drag.
(4) The threshold speed is 130 kt but should be 138 + 7 kt = 145 kt in the prevailing wind. This means that the aircraft is low, slow and under excessive thrust to maintain the situation.
(5) At about 100 ft there is a slight power reduction and shortly afterwards an up elevator input and a further increase in the pitch angle. This means that
(a) thrust has been reduced;
(b) drag has been increased;
(4 the aircraft is now entering the wind gradient effect.

Information on Event in Fig.4 (Contd)
The result is a sudden decay in airspeed of about 10 kt in 3 seconds.
(6) The aircraft has entered into the high sink rate associated with
entry into the power-on stall.
(7) The heavy landing is inevitable. More lift is available by
increasmg the angle of attack but there is not enough elevator to produce it
and the rate of increase of drag ensures that there is insufficient speed to
provide the lift required.


Fi

Information on Event in Fig.5
Aircraft Type: D
Airport: New York (JFK)
Date: June 1967
Peak CG acceleration:
1st impact:
2nd impact:
3rd impact:
Aircraft speed at first touchdown:
Meteorological ground conditions:
Runway: 2z.L
Time: 00.13 GMT
0.75 Ag
1.10 Ag
0.45 Ag
124 kt ias
Wind 2OOo/17 kt, gusting 33 kt
Collmlents:
Rapid oscillatory applications of elevator during landing is considered to
aggravate a tendency to bounce and a gradual reduction in elevator angle is
desirable3.

Fig.

Information on Event in Fig.6
Aircraft Type: D
Airport: Bermuda Runway: 12
Date: .~une 1967 Time: 21.25 GMT
Peak CG acceleration:
1st impact: 1.17 Ag
2nd impact: 1.17 Ag
Aircraft speed at first touchdown: 133 kt ias
Comments :
The flare was attempted too late and the elevator usage is similar to
that m Fig.5 (see Comments appertaining to Fig.5).


Information on Event in Fig.7
Aircraft Type: D
Airport: Montego Bay
Runway: 06
Time: 02.18 GMT
Date: June 1967
Peak CG acceleration: 1st impact: 1.17 Ag
2nd impact: 0.30 Ag
Aircraft speed at initial touchdown: 125 kt ias
Meteorological conditions:
Time (GMT): 02.00 03.00
Temp ('C): 23.2i21.1 22.7120
Wind: Calm 100'/06 kt
Visibility (Nml): 10 10
Cloud: Trace at 2000 ft, Trace at 2000 ft 2 at 2700 ft
QNH: 1014.9 mb, 1015.4 mb, 29.97 in 29.99 in
Power was reduced early causing the airspeed to decrease rapidly.
the rate of elevator application was high.

Fi

Information on Event in Fig.6
Aircraft Type: D
Airport: Chicago Runway: 27
Date: June 1967 Time: 21.17 GMT
Peak CG acceleration: 1st impact: 0.70 Ag 2nd impact: 1.22 Ag
3rd impact: 0.60 Ag
Aircraft speed at first touchdown: 133 kt ias
Meteorological conditions:
Time (GMT):
Temp ('0:
Wind:
Vlsibllity (Nml):
Sea level pressure (mb):
Cloud:
Dew point ('C)
20.55 21.25 21.55
30
270’18 kt gusting 14 kt
15
1010.4
Scattered cloud at 45000 ft
17.2
30
270'17 kt gusting 14 kt
15
1010.4
30
270'17 kt
15
1010.4
Sky clear Sky clear
16.7 17.7
Comments :
The aircraft bounced twice during the landing and the second impact was harder than the first. The throttle usage was unusual and pitch control poor. The first and third impacts were performed at a significant bank angle of about 10'.
The pilot may have feared that he was about to land slightly short of the threshold and took corrective action in the last few seconds before touchdown. Gradual closure of the throttle began at a height of 175 ft but then at one second prior to the start of flare power was increased again to 90% max rpm, possibly in an attempt to gain lift and avert the short landing.


Information on Event in Fig.9
Aircraft Type: D
Airport: Boston Runway: 22
Time: 00.31 GMT Date: July 1967 Peak CG acceleration: 1st impact: 0.80 Ag
2nd impact: 0.50 Ag Aircraft speed at initial touchdown: 124 kt ias Meteorological conditions:
ColMnents :
Time (GMT):
Temp ('C):
Wind:
Visibility (Nml):
Cloud:
Altimeter:
Dew point:
Pressure (mb)
00.10 00.30 01 .oo
25 25 25.5
140°/18 kt 180°/10 kt 190°/10 kt
5 in haze and smoke As before As before
High, thin broken cloud with few cumulus
29.88 in 29.88 in 29.88 in
19.5 19.5 19.5
1012.2 1012.2 1012.6
The flare began rather late at 14 set before touchdown.


Information on Event in Fig.10
Aircraft Type: D
Airport: Chicago
Runway: 32
Time : 23.43 GMT
Date: July 1967
Peak CG acceleration: 1st impact: 1.18 Ag
2nd impact: 0.63 Ag
Alrcraft speed at first touchdown: 139 kt ias
Conmlents :
A particularly high proportion of the total peak acceleration consists of
a high frequency component.

.ll
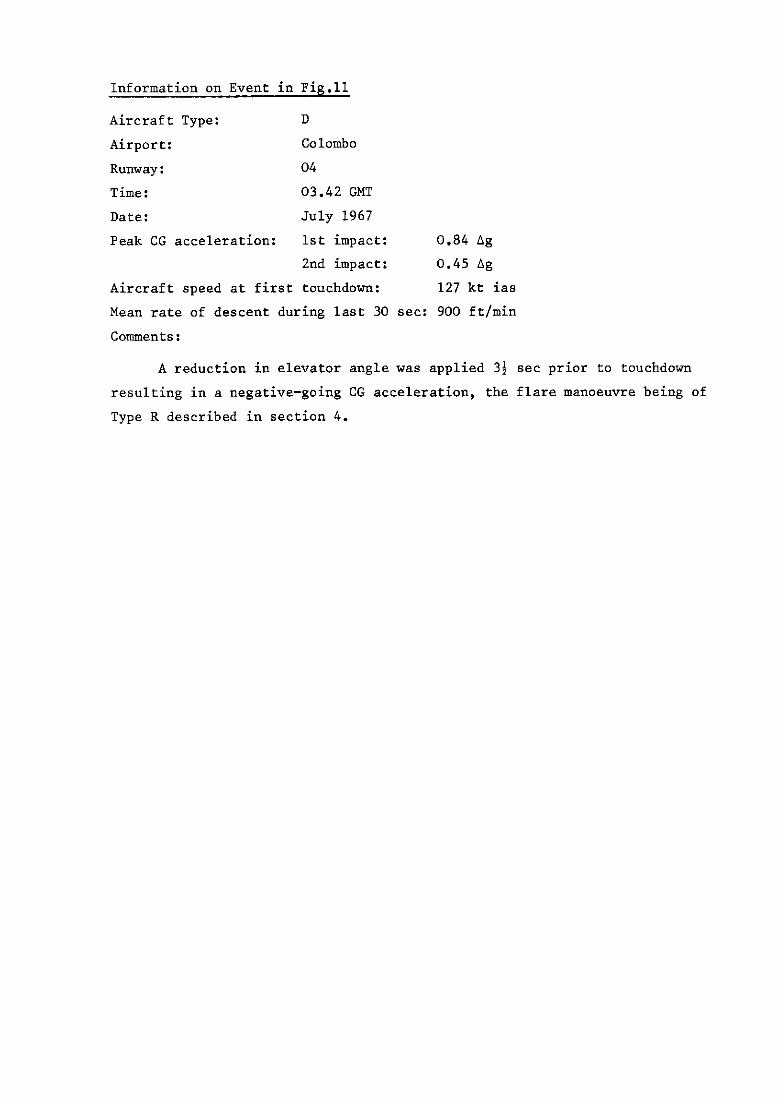
Information on Event in Fig.11
Aircraft Type: D
Airport: Colombo
Runway : 04
Time: 03.42 GMT
Date: July 1967
Peak CG acceleration: 1st impact: 0.84 Ag
2nd impact: 0.45 Ag
Aircraft speed at first touchdown: 127 kt ias
Mean rate of descent during last 30 set: 900 ft/min
Comments:
A reduction in elevator angle was applied 31 set prior to touchdown
resulting in a negative-going CG acceleration, the flare manoeuvre being of
Type R described in section 4.

Fi

Information on Event in Fig.12
Aircraft Type: D
Airport: Tehran
Runway: 29
Time: 11.35 GMT
Date: July 1967
Peak CG acceleration: 1st impact: 0.93 Ag
2nd impact: 0.37 Ag
Aircraft speed at initial touchdown: 123 kt ias
Cements:
The landing impact CG acceleration is composed very largely of an
oscillating component, signifying that the landing was not performed at an
abnormally high vertical velocity but that some other source produced the high
peak acceleratmn, such as a rough runway surface at the impact point.


Information on Event in Fig.13
Alrcraft Type: D
Airport: Prestwick
Date: October 1967
Peak CG acceleration: 0.93 Ag
Aircraft speed at touchdown: 125 kt ias
comments:
Runway: 31
Time: 12.36 GMT
The landing was reported in the log as being 'firm'. Six seconds prmr to
impact a large elevator input was applied and removed again in one continuous
movement. As can be seen from the CG acceleration trace, the vertical velocity
reduction achieved by the elevator application was regained in the last two
seconds due to over-correction of elevator 34 seconds before touchdown.
The landing was performed by the co-pilot.

.ld

Information on Event in Fig.14
Aircraft Type: D
Airport: Antigua
Date: December 1967
Peak CG acceleration: 0.93 Ag
Aircraft speed at touchdown: 138 kt ias
Cements:
Runway: 25
Time: 03.29 GMT
The landing was performed at night on a runway which slopes slightly
upward from the threshold and has no approach lighting.


Information on Event in Fig.15
Aircraft Type: D Airport: Montego Bay Runway: 06 Date: January 1968 Time: 03.06 GMT Peak CG acceleratmn:
1st mpact: 0.80 Ag 2nd impact: 0.40 Ag
Aircraft speed at initial touchdown: 137 kt ias Comnlents :
The approach and landing were normal apart from the flare being left until a late stage resulting in the moderately hard landing.

Fi

Information on Event in Fig.16
Aircraft Type: D
Airport: Barbados Runway: 09 Date: July 1968 Time: 23.30 GMT (approx) Peak CG acceleration:
1st impact: 0.83 Ag 2nd impact: 0.78 Ag
Aircraft speed at initial touchdown 126 kt ias Meteorological conditions:
Comments :
Time (GMT) : 23.00 24.00
Temp ('C): 26 26
Wind: 070/07 080107
Vlsibllity (Nml): 35 30
Cloud: Z/8 at 2500 ft Z/8 at 2500 ft
Dew point ('C): 22 22
QNH: 1014.7 1015.6
The aircraft pitched slowly up over last minute at constant power causing the airspeed to decrease. Power was not reduced significantly until the first touchdown.


Information on Event in Fig.17
Aircraft Type: E
Airport: Zurich
Date: October 1966
Peak CG acceleration: 0.98 Ag
Aircraft speed at touchdown: 150 kt ias
Conmlents:
Runway: 16
Time : 21.27 GMT
Judging by the heading trace it is apparent that the landmg took place
in a crosswind. On landing the drifting aircraft the pilot applied rudder in
order to align the aircraft with the runway. Aircraft heading was over-corrected
but stability was achieved 5 seconds after touchdown.


Information on Event in Fig.18
Aircraft Type: E
Airport: London (Heathrow)
Runway : 28L
Time: Unavailable
Date: October 1966
Peak CG acceleratmn: 1st impact: 0.95 Ag
2nd impact: 0.46 Ag
Aircraft speed at initial touchdown: 142 kt ias
Cements :
The heading and roll traces indicate that the aircraft landed in a cmss-
wind. It is seen from the traces that difficulty was experienced in trying to
hold the aircraft level and It was landed while drifting.


Informatmn on Event in Fig.19
Aircraft Type: E
Alrport: London (Heathrow) Runway: 1OL
Date: January 1967 Time: 19.26 GMT
Peak CG acceleration: 1.16 Ag
Aircraft speed at touchdown: 135 kt
Meteorological conditions:
Colmnents:
Time (GMT) 19.20
Wind 130'18 kt
Cloud 8/8 base at 1000 ft
QNH hb) 1027
QFE hb) 1024
Temp ('C) 1
Dew pant ('C) 0
Flare began late (approximately 1 second prior to touchdown) and
consequently the approach descent rate of 13 ftfsec could not be reduced
sufficiently for a satisfactory landing to be achieved.

Fi

Information on Event in Fig.20
Aircraft Type: E
Airport: London (Heathrow) Date: July 1967 Peak CG acceleration: 0.85 Ag Aircraft speed at touchdown: 124 kt
Comments:
Runway: 28R Time: 13.59 GMT
A poor final approach was made XI gusty conditions. A complete Initial flare-out was carried out at a height of 15 feet and 11 seconds before initial
touchdown. The aircraft was brought down in a series of steps. This technique has been observed in other landings but resulting in impacts of lower severity
(see Appendix). It may be somewhat fortuitous, however, when the aircraft lands at an instant in time corresponding with a low rate of descent in the oscillating flight path when performing this manoeuvre.


Information on Event in Fig.21
Aircraft Type: E
Anport: London (Heathrow)
Date: February 1968
Peak CG acceleration:
1st impact: 0.89 Ag
2nd Impact: 0.36 Ag
Aircraft speed at initial touchdown: 143 kt
Comments:
Runway: 1OL
Time: Unavailable
The final approach descent rate is low at about 10.75 ftjsec. The heavy
landing is accounted for by the late flare and consequential insufficient
reduction of descent rate prmr to impact. Vertical velocity at touchdown is
estmated to be 7 ft/sec from normal acceleration and radio height time
histories.


Information on Event in Fig.22
Aircraft Type: E
Airport: Le Bourget Runway: Unknown
Date: May 1968 Time: 07.48 GMT
Peak CG acceleration:
1st impact: 0.96 Ag
2nd impact: 0.43 Ag
Aircraft speed at Initial touchdown: 144 kt ias
Comments :
The pllot did not recall the landing as being hard. Little or no flare
was performed resulting in the aircraft touching down at the final approach
descent velocity, which according to the radio height trace was fortunately low
at approximately 5 ft/sec.


Information on Event in Fig.23
Aircraft Type: E
Airport: BrUSSelS Runway: 26L
Date: May 1968 Time: 15.46 GMT
Peak CG acceleration:
1st impact: 0.94 Ag
2nd impact: 0.24 Ag
Aircraft speed at initial touchdown: 138 kt
Comments :
The rate of descent at touchdown is estimated to be 8 ft/sec from the
normal acceleration and radio height time hlstories. The pitch angle at touchdown
is higher than normal at 61'. The high mpact Ag (a large proportion of which
appears to be of high frequency) was a result of the moderately high descent rate
at the moment of touchdown and the long bounce was possibly due to the high
pitch angle producing a lift of 1.15 g (abs) still increasing at impact.

Fi

Information on Event in Fig.24
Aircraft Type: E
Airport: London (Heathrow)
Runway: Unknown
Time : Unknown
Date: June 1968
Peak CG Acceleration:
1st mpact:
2nd impact:
3rd impact:
Aircraft speed at initial touchdown:
Cements :
1.01 Ag
0.55 4g
0.29 Ag
141 kt ias
The descent rate at a height of 100 ft was low (9 ft/sec) and, possibly
because of this, the flare was begun late, at a height of 20 ft. The descent
rate reduction was therefore small and the residual descent rate at touchdown
was 7 ft/sec estimated from normal acceleration and radio height time histones.

Fi

Runway: Unknown Time: 14.48 GMT
Aircraft Type: E
Airport: London (Heathrow) Date: June 1968
Peak CG acceleration: 1st impact: 0.85 Ag 2nd impact: 0.47 Ag
Aircraft speed at initial touchdown: 137 kt Meteorological conditions: Raining and thundery Cements:
Information on Event in Fig.25
Very little flare applied. The runway was obviously wet and a firm landing may have been intentional to avoid the risk of aquaplaning.


Information on Event in Fig.26
Aircraft Type: E
Airport: B-CUSS62lS
Runway: 26
Time : 16.22 GMT
Date: July 1968
Peak CG acceleration:
1st impact: 1.33 Ag
2nd impact: 0.68 Ag
Aircraft speed at initial touchdown: 137 kt ias
comments:
Flare began late at about 1.1 set prior to touchdown at a height of
about 13 ft and reduced the descent rate from 12 ft/sec to 8 ft/sec at
touchdown.

Ei

Informatmn on Event in Fig.27
Alrcraft Type: E
Airport: London (Heathrow)
Runway: Unknown
Time : 21.21 GMT
Date: July 1968
Peak CG acceleratmn: 0.86 hg
Aircraft speed at touchdown: 127 kt ias Cements:
Flare began very mildly at a height of about 70 ft and was continued satisfactorily until at about 11 set prior to touchdown when the aircraft accelerated downward gaining approximately 2: ft/sec in descent veloczty from some cause indeterminable from the record.


Information on Event in Fig.28
Aircraft Type: E
Airport: BClsle
Runway: 16 Time: 21.19 GMT Date: September 1968 Peak CG acceleration: 1.10 Ag Aircraft speed at touchdown: 146 kt ias Meteorological Conditions:
, Time (GMT):
Temp (OC):
Wind
Visibility (Nm):
Cloud:
Dew point ('C):
QNH :
cements :
I 21.20
14
280'/08 kt
4 (raining)
% at 1000 ft; 2 at 2300 ft; 8/8 at 8000 ft
13
1004
The aircraft landing weight was quite high, there was a slight tail wind component the runway was 7775 ft in length and wet and it was dark. These factors would have made it desirable to perform a firm landing but almost certainly a landing of this severity would not be intentional.

Fi

Informatmn on Event in Flg.29
Aircraft Type: E
Airport: Paris (Orly)
Runway: 26
Time : 14.52 GMT
Date: September 1968
Peak CG acceleration:
1st impact: 0.80 Ag
2nd impact: 0.50 Ag
Alrcraft speed o-r initial touchdown: 142 kt ias
Comments:
The character of the alrspeed trace mdicates that the air was rather
turbulent during the approach and landing, rendering fine control of the aircraft
more difficult. The roll trace shows the aircraft to be oscillating in roll up
to ?4' durmg the 10 set prior to and durmg the landing.
The quoted aircraft weight is 430 kg (950 lb) above the maxmum landing
weight.


Information on Event in Fig.30
Aircraft Type: E
Airport: Frankfurt
Runway: UIlkIlOWn
Time: 17.35 GMT
Date: October 1968
Peak CG acceleration:
1st impact: 1.06 Ag
2nd impact: 0.45 Ag
Aircraft speed at initial touchdown: 148 kt ias
Meteorological Conditions:
Wind: 190'/09 kt
Comments:
Flare did not begin until 3 sac prmr to touchdown. The flare was also
of an oscillatory nature, the cumulative effect during the last 3 sac being to
reduce the rate of descent only by about 3 ft/sec from 114 ft/sec.
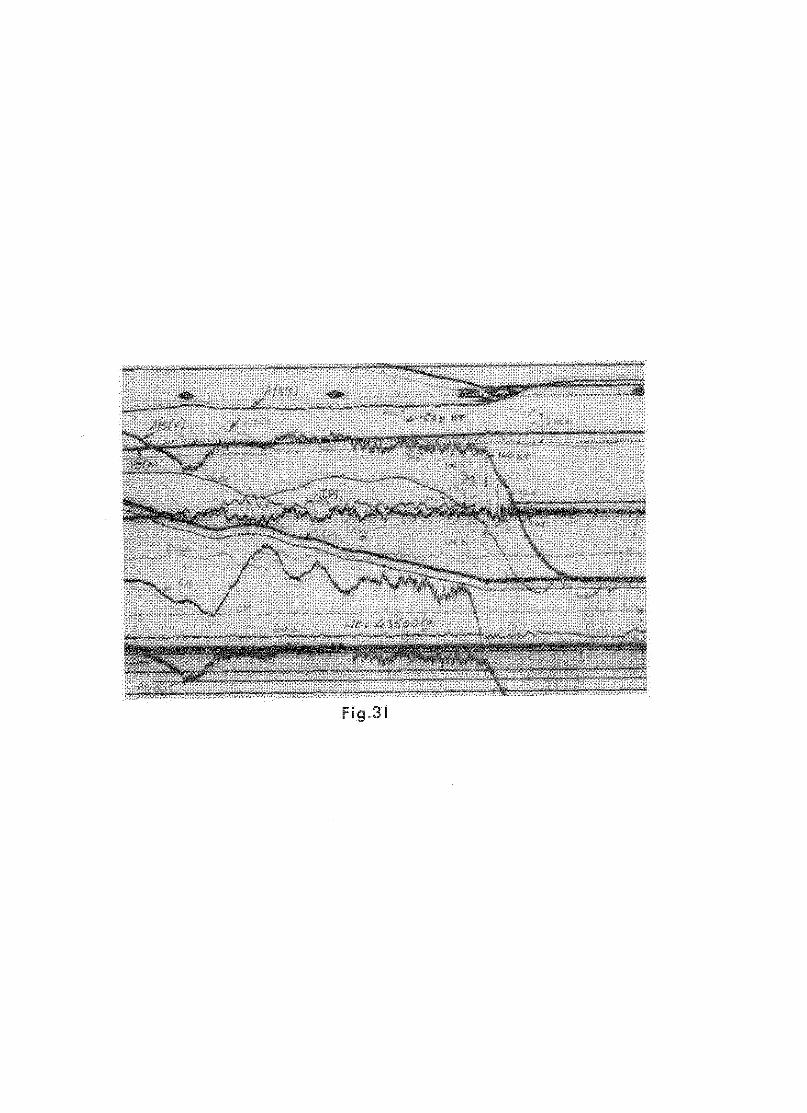
Information on Event in Fig.31
Aircraft Type: E
Airport: London (Heathrow)
Runway: 28
TlllE: 20.20 GMT
Date: October 1968
Peak CG acceleration:
1st impact: 1.10 Ag
2nd impact: 0.60 Ag
Aircraft speed at initial touchdown: 141 kt ias
Meteorologxal Conditions:
Wind: 260°/06 kt
cements:
The apparent severity of the first impact 1s exaggerated by the oscillatory
component of the CG acceleration having a large amplitude. After smoothing out
the high frequency component the maximum acceleration is reduced to approximately
0.6 Ag.


Information on Event in Fig.32
Aircraft Type: E
Airport: Paris (Orly)
Runway: 26
Time: 17.24 GMT
Date: November 1968
Peak CG acceleration:
1st Impact: 0.94 Ag
2nd impact: 0.37 Ag
Alrcraft speed at initial touchdown: 126 kt ias
Comments:
The landmg was intended to be an Autoland. However, at a height of 43 ft
and 7 sac prior to the touchdown the autopilot disconnected itself and the
pilot initiated flare at a height of 26 ft and 4.3 sac from touchdown.


Information on Event in Fig.33
Aircraft Type: E
Airport: Frankfurt
Runway: 25
Time : 16.50 GMT
Date: November 1968
Peak CG acceleration: 1.02 Ag
Aircraft speed at touchdown: 144 kt ias
comments:
Late start of flare at approximately 21 set before touchdown.


Information on Event in Fig.34
Aircraft Type: E
Airport: GlWgOW
Runway: 06
Time: 20.14 GMT
Date: January 1969
Peak CG acceleration:
1st impact: 0.94 Ag
2nd impact: 0.23 Ag
Aircraft speed at initial touchdown: 138 kt ias
A/c speed Normal accel Pitch angle Descent rate (ias) (Ad (Des) (ft/sec)
At 50 ft height 135 0 4.0 13.0
At start of flare 145 0 3.1 7.2
At touchdown 137 0.94 4.4 5.7
Comments:
At the time of landing the runway had a covering of 3 mm of slush, and a
firm touchdown may have been intentional to reduce the risk of aquaplaning or
skiddlng.


Information on Event in Fig.35
Aircraft Type: E
Airport: zurrch
Runway: 16
Time: 06.50 GMT
Date: April 1969 Peak CG acceleration:
1st impact: 0.95 Ag 2nd impact: 0.44 Ag
Aircraft speed at Initial touchdown: 147 kt ias Meteorological conditions: Wind: 240'117 kt Visibility: 10 Nml Cloud: 4/8 Cu at 3300 ft The meteorological Special Group reported 'Unstable air and cumulus cloud'.
cements:
The whole approach and landing was carried out m light turbulence and a 17 kt crosswind. The fact that the meteorological Special Group reported conditions to the pilot indicates that unusual conditions were present. The record shows the flare to have started late but the turbulence and crosswind obviously produced difficulties in performing an ideal landing.

Fi

Information on Event m Fig.36
Aircraft Type: E
Anport: London (Heathrow)
Runway: 28L
Time : 18.51 GMT
Date: April 1969
Peak CG acceleration:
1st impact: 0.92 Ag
2nd impact: 0.40 Ag
AIrcraft speed at imtial touchdown: 137 kt ias
Cements :
The flare was performed late causing the aircraft to land at a rather
high descent rate of about 7 ft/sec.


Information on Event in Fig.37
Aircraft Type: E Airport: Amsterdam
Runway: 01
Time : 21.52 GMT Date: May 1969 Peak CG acceleratmn:
1st impact: 0.95 Ag
2nd impact: 0.29 Ag Aircraft speed at initial touchdown: 145 kt ias Comm?nts:
The flare began late but the severity of the impact acceleration 1s exaggerated more than usually by the large amplitude of the high frequency
content. Ignoring the high frequency component the maximum acceleration is about 0.48 Ag.
The 'nouse' on the localiser signal, commencing half a minute before touchdown, is characteristic of this runway.


Information on Event in Fig.38
Aircraft Type: E
Airport: Paris (Orly)
Runway: 26
Time: 10.18 GMT
Date: June 1969
Peak CG acceleration: 1.02 Ag
Aircraft speed at touchdown: 125 kt ias
Comments:
On completion of a successful flare the aircraft was still airborne and it
was necessary for the pilot to initiate descent again in order to prevent the
aircraft travelling too far along the runway before alighting. This flare manoeuvre is in type category R as defined in section 4 and discussed in
section 5.

tG acceln !‘~.
rime - I
Tvpe C Type 1
-4 \
Type N Type R Fig.39 Height 8 normal acceleration time histories
during various types of flare manoeuvre

5 04 +2
a E 6
0.2
I 2 4 6 a IQ 20 40 60 2.0 100
Frequency Hz
Fig. 40 Frequency response of the normal C G acceleration instrumentation
l’nn ted m England for Her Majesty’s Statronery Office by the Royal Arrcraft Estabbshment, Farnborough D&-02109. K 4.


u.C.C.P.Na.ll82 629.13.067 r”“b” 1970
tltcCAADRPSp&aJEvcnt,WoxkmgPmty Co-animated hy G, 8. Huttoo)
CIVIL AIRCRAFT AIRWORTHINESS DATA RECORDING PROGRMdME HARD LANDMGS ENCOUNTERFD BY SUBSONIC CIVIL JET AIRCR@I
/ ___ _ -__ __-- - - -_-- _- - - - - - - - - - - - - - - - - 1
OL61 =‘I-QN Lmx1’629 281 I-ON ‘63 TP’V
awr;~3musev 3wwv13a


C.P. No. I 182
C.P. No. I 182
SBN 11 470450 3