a study of the relationship of class size and student
TRANSCRIPT

Western Michigan University Western Michigan University
ScholarWorks at WMU ScholarWorks at WMU
Dissertations Graduate College
8-1989
A Study of the Relationship of Class Size and Student A Study of the Relationship of Class Size and Student
Achievement on the Michigan Educational Assessment Program Achievement on the Michigan Educational Assessment Program
Fourth Grade Test Fourth Grade Test
Ralph Burde Western Michigan University
Follow this and additional works at: https://scholarworks.wmich.edu/dissertations
Part of the Curriculum and Instruction Commons, and the Educational Assessment, Evaluation, and
Research Commons
Recommended Citation Recommended Citation Burde, Ralph, "A Study of the Relationship of Class Size and Student Achievement on the Michigan Educational Assessment Program Fourth Grade Test" (1989). Dissertations. 2129. https://scholarworks.wmich.edu/dissertations/2129
This Dissertation-Open Access is brought to you for free and open access by the Graduate College at ScholarWorks at WMU. It has been accepted for inclusion in Dissertations by an authorized administrator of ScholarWorks at WMU. For more information, please contact [email protected].
A STUDY OF THE RELATIONSHIP OF CLASS SIZE AND STUDENT ACHIEVEMENT ON THE MICHIGAN EDUCATIONAL ASSESSMENT PROGRAM FOURTH GRADE TEST
byRalph Burde
A Dissertation Submitted to the
Faculty of The Graduate College in partial fulfillment of the
requirements for the Degree of Doctor of Education
Department of Educational Leadership
Western Michigan University Kalamazoo, Michigan
August 1989
R eproduced with perm ission of the copyright owner. Further reproduction prohibited without perm ission.
A STUDY OF THE RELATIONSHIP OF CLASS SIZE AND STUDENT ACHIEVEMENT ON THE MICHIGAN EDUCATIONAL ASSESSMENT PROGRAM FOURTH GRADE TEST
Ralph Burde, Ed.D.Western Michigan University, 1989
In this study the relationship and differences in student achievement and class size were investigated. The population of the study was the 111,199 students who completed the fall 1988 Michigan Educational Assessment Program (MEAP, Michigan State Board of Education, 1988) fourth grade test. The MEAP is a criterion referenced test and is the state of Michigan's only achievement test.
The independent variable of the study was class size. The dependent variables of the study were student achievement as measured by the students' fall 1988 MEAP reading, mathematics, and combined reading and mathematics test scores. The hypothesis of the study, supported by the findings of Glass and Smith (1978; M. L. Smith & Glass, 1979) was that there is an inverse relationship between class size and student achievement.
Data for completing the research design and statistical analysis were secured from National Computer Systems (NCS), the firm which completes all MEAP computer reporting services for the Michigan Department of Education. A listing of 400
R eproduced with perm ission of the copyright owner. Further reproduction prohibited without perm ission.

students' (200 males and 200 females), class size, MEAP test scores for reading and mathematics, and sex of each student was provided by NCS and identified as the study's first sample. A second and third sample were derived from the original listing of 400 students that allowed the testing of two operational hypotheses.
The results of the hypotheses testing did not support the presence of an inverse relationship between the independent variable class size and the dependent variables of student achievement as measured by the fourth grade MEAP reading, mathematics, or combined reading and mathematics test scores. This was the case when a Pearson product-moment correlation coefficient was used with all the data as well as when the class sizes of 15 to 20 students were compared with class sizes of 30 to 34 students.
The relatively high test scores, absence of a normal distribution of test scores, and the resulting limited variation of tests scores, all of which can be expected with a criterion referenced test were identified as suspected explanations for the findings of the study. Suggestions were made for further research.
R eproduced with perm ission of the copyright owner. Further reproduction prohibited without perm ission.
INFORMATION TO USERS
The most advanced technology has been used to photograph and reproduce this manuscript from the microfilm master. UMI films the text directly from the original or copy submitted. Thus, some thesis and dissertation copies are in typewriter face, while others may be from any type of computer printer.
The quality of this reproduction is dependent upon the quality of the copy submitted. Broken or indistinct print, colored or poor quality illustrations and photographs, print bleedthrough, substandard margins, and improper alignment can adversely affect reproduction.
In the unlikely event that the author did not send UMI a complete manuscript and there are missing pages, these will be noted. Also, if unauthorized copyright material had to be removed, a note will indicate the deletion.
Oversize materials (e.g., maps, drawings, charts) are reproduced by sectioning the original, beginning at the upper left-hand corner and continuing from left to right in equal sections with small overlaps. Each original is also photographed in one exposure and is included in reduced form at the back of the book. These are also available as one exposure on a standard 35mm slide or as a 17" x 23" black and white photographic print for an additional charge.
Photographs included in the original manuscript have been reproduced xerographically in this copy. Higher quality 6" x 9" black and white photographic prints are available for any photographs or illustrations appearing in this copy for an additional charge. Contact UMI directly to order.
UMIUniversity Microfilms International
A B e l l H o w e l l Information Company 300 Nortfi Zeeb Road, Ann Arbor, Ml 48106-1346 USA
313/761-4700 800/521-0600
R eproduced with perm ission of the copyright owner. Further reproduction prohibited without perm ission.

Reproduced with permission of the copyright owner. Further reproduction prohibited without permission.

Order N um ber 8923553
A study o f the relationship o f class size and student achievem ent on th e M ichigan Educational A ssessm ent Program fourth-grade test
Burde, Ralph H., Ed.D.
Western Michigan University, 1989
C o p y ri^ t ©1989 by Burde, Ralph H. All rights reserved.
UMI300 N. Zeeb Rd.Ann Arbor, MI 48106
R eproduced with perm ission of the copyright owner. Further reproduction prohibited without perm ission.

Reproduced with permission of the copyright owner. Further reproduction prohibited without permission.

Copyright by Ralph Burde
1989
R eproduced with perm ission of the copyright owner. Further reproduction prohibited without perm ission.

ACKNOWLEDGMENTS
The author feels a very sincere need to acknowledge the assistance and support of some very special persons who were supportive in the completion of this degree. These would include the following:
- Jesus Christ, our Lord and Savior, who makes all things possible through Himl
- Marylou, Sara, and Michael, the best family a man could ask for, who were understanding, patient, and enduring.
- Dr. Uldis Smidchens, committee chair, counselor, teacher, advisor, friend, whose linearity was consistent and allowed the course to be stayed.
- Dr. Larry Schlack, committee member and advocate, who was my first contact with the department and never failed to provide encouragement. ^
- Dr. Richard Hogancamp, committee member, who never allowed the ultimate goal to be lost or forgotten.
- The Newaygo Public Schools Board of Education members over the last 4 years, namely, Edward Haynor, Donald Terrill, Patricia Collins, Paul Eno, Marrianne Harris, Les Salacina, Linda Vasicek, KerriAnne Meuwenburg, and Robert Hance, who provided encouragement and understanding.
- Mrs. Barbara Billerbeck, proof reader extraordinaire, for time, commitment, and professionalism.
ii
R eproduced with perm ission of the copyright owner. Further reproduction prohibited without perm ission.

- The administrators, supervisors, and administration office staff of Newaygo Public Schools.
Ralph Burde
1 1 1
R eproduced with perm ission of the copyright owner. Further reproduction prohibited without perm ission.

TABLE OF CONTENTS
ACKNOWLEDGMENTS .......................................... ü
LIST OF T A B L E S ............................................. viiiLIST OF FIGURES........................................... X
CHAPTERI . INTRODUCTION.................................... 1
Definition of T e r m s ......................... 6Organization of Study ....................... 7Statement of the Problem ..................... 7
II. REVIEW OF L I T E R A T U R E ............................ 14Early Research on Class Size and Student Achievement.................................. 17Large Group Research on Class Size andStudent Achievement ......................... 18Additional Research on Class Size and Student Achievement Prior to 1978 20Summary of Research Reviews to 1978 23Glass and Smith Research on Class Size . . . . 24Reactions to Glass and Smith's Class Size Research...................................... 27Class Size as One of Many Factors Related to Student Achievement....................... 30Class Size and Student Achievement ResearchAfter Glass and S m i t h ....................... 31Class Size Related to Classroom Environmental Conditions.................................... 33Conclusions.................................. 34
IV
R eproduced with perm ission of the copyright owner. Further reproduction prohibited without perm ission.

Table of Contents— Continued
CHAPTERIII. METHODOLOGY...................................... 37
Introduction .................................. 37
S a m p l e s ................................... . 38Instrumentation . . . ? ..................... 39Source of D a t a ................................ 40Operational Hypotheses ....................... 41Null H y p o t h e s e s .............................. 45Procedures for Drawing Conclusions .......... 49
IV. DATA ANALYSIS.................................... 54Population.................................... 54Description of the Samples................... 55
Sample 1 .................................. 55Sample 2 .................................. 55
Sample 3 .................................. 56Class S i z e .................................... 58Combined Reading and Mathematics TestScores........................................ 59Reading Test S c o r e s ......................... 60Mathematics Test Scores ..................... 61Tests of the First Operational Hypothesisand Its Subhypotheses....................... 62
The Relationship of Class Size and Achievement in Reading and Mathematics for Both Malesand Females................................ 63
R eproduced with perm ission of the copyright owner. Further reproduction prohibited without perm ission.

CHAPTER
Table of Contents— Continued
The Relationship of Class Size and Achievement in Reading for BothMales and Females......................... 64The Relationship of Class Size and Achievement in Mathematics forBoth Males and F e m a l e s ................... 65The Relationship of Class Size and Readingand Mathematics Achievement for Males . . . 66The Relationship of Class Size andAchievement in Reading for Males ........ 67The Relationship of Class Size and Achievement in Mathematics forM a l e s ...................................... 68The Relationship of Class Size and Achievement in Reading andMathematics for Females ................... 69The Relationship of Class Size andAchievement in Reading for Females . . . . 70The Relationship of Class Size and Achievement in Mathematics forFemales.................................... 71
Summary of the Tests of the First Operational Hypothesis and Its Eight Subhypotheses . . . . 72Test of the Second Operational Hypothesisand Its Subhypotheses....................... 73
Class Size and Differences With BothReading and Mathematics Achievement . . . . 73Class Size and Achievement Differences in Reading.................................... 75Class Size and Achievement Differences in Mathematics................................ 77
VI
R eproduced with perm ission of the copyright owner. Further reproduction prohibited without perm ission.

Table of Contents— Continued
CHAPTERSummary of the Tests of the Second Operational Hypothesis and ItsTwo Subhypotheses............................ 77
V. CONCLUSIONS AND RECOMMENDATIONS ................... 79Introduction ................................ 79Conclusions .................................. 79Discussion of Results ....................... 80Recommendations .............................. 82S u m m a r y ...................................... 84
A P P E N D I C E S ............................................... 86A. Contract and Communications With National
Ccanputer Services................................ 87B. Listing of 400 Randomly Selected Students Fall
1988 Michigan Educational Assessment Reading and Mathematics Tests Scores and Class Sizeof Each Student.................................. 91
C. Human Subjects Review Board Approval ofP r o t o c o l .............. \ ........................ 100
D. 1988-89 Fourth Grade Michigan Educational Assessment Program T e s t ........................... 102
BIBLIOGRAPHY ............................................... 172
Vll
R eproduced with perm ission of the copyright owner. Further reproduction prohibited without perm ission.

L I S T OF TABLES
1. Means and Standard Deviations of Variables,Sample 1 ............................................ 56
2. Means and Standard Deviations of Variables, .Sample 2 ............................................ 57
3. Means and Standard Deviations of Variables,Sample 3 ............................................ 58
4. Correlation Coefficient of Class Size of Males andFemales and Combined Reading and MathematicsScores............................................... 64
5. Correlation Coefficient of Class Size of Males and Females and Reading Scores......................... 65
6. Correlation Coefficient of Class Size of Males and Females and Mathematics Scores ..................... 66
7. Correlation Coefficient of Class Size of Males and Combined Reading and Mathematics Scores ........... 67
8. Correlation Coefficient of Class Size of Males and Reading Scores ...................................... 68
9. Correlation Coefficient of Class Size of Males and Mathematics Scores .................................. 69
10. Correlation Coefficient of Class Size of Femalesand Combined Reading and Mathematics Scores . . . . 70
11. Correlation Coefficient of Class Size of Femalesand Reading Scores.................................. 71
12. Correlation Coefficient of Class Size of Femalesand Mathematics Scores .............................. 72
13. Summary of Computed Correlation Coefficients,Number of Subjects, Means and Standard Deviations of Class Size, Means and Standard Deviations of Achievement,and Levels of Significance......................... 74
Vll l
R eproduced with perm ission of the copyright owner. Further reproduction prohibited without perm ission.

List of Tables— Continued
14. Test of Difference for Independent Means—Achievement in Both Reading andMathematics........................................ 75
15. Test of Difference for Independent Means—Reading Achievement................................ 76
16. Test of Difference for Independent Means—Mathematics Achievement........................... 78
IX
R eproduced with perm ission of the copyright owner. Further reproduction prohibited without perm ission.

LIST OF FIGURES
1. Glass and Smith Curve Relating to Class Size andAchievement........................................... 25
R eproduced with perm ission of the copyright owner. Further reproduction prohibited without perm ission.

CHAPTER I
INTRODUCTION
The state of Michigan, since 1985, has provided an incentive grant of additional state aid to public schools that have provided a pupil teacher ratio of 25:1 or less in lower primary grades. From the beginning of the 1985-86 school year to the end of the 1987-88 school year, over $44 million in additional state aid was paid to Michigan schools that maintained a pupil teacher ratio of 25:1 or less in the prescribed primary grades (Michigan Department of Education, 1986, 1987, 1988). The Michigan Department of Education's only achievement test is the Michigan Educational Assessment Program (MEAP, Michigan State Board of Education, 1988) test. The purpose of this study was to determine if there is a relationship between class size and student achievement on the Michigan Educational Assessment Program, fourth grade reading and mathematics tests.
The relationship of class size and student achievement has been a topic of educational research since 1902 (Rice, 1903). Some argue that it is logical that reduced class size should have a positive benefit for students and teachers (Bain, 1986). Others suggest the common sense of expecting reductions in class size to result in the teacher having more time to spend with each child and increased learning being the outcome
R eproduced with perm ission of the copyright owner. Further reproduction prohibited without perm ission.
2(Carrington, Mourie, Meckens, & Lovelace, 1981).
One thing that is certain when considering the class size issue, teachers prefer smaller classes. Teachers believe that smaller classes allow more creative and energetic teaching; a more desirable classroom environment; and consequently, a higher level of student achievement (Albritton, 1984). The public believes that children in the primary grades benefit from small class sizes because of their need for individualized instruction and teacher attention (Helmich & Wasem, 1985).
The class size issue for educational policy makers and politicians reaches the heart of budgeting and funding of schools. Approximately 80% to 85% of resources provided for schools are spent on staff salaries. Since the amount of dollars spent on staff salaries varies inversely with the average class size, any change in average class size will have immediate consequences for the required level of educational funding (Larkin & Keeves, 1984). \
Research from that of Rice (1903) to the late 1970s did not support the logic, common sense, and/or teacher arguments that smaller class sizes are related to, make a difference in, or much less result in increased student achievement. In a 1960 review of all known research on the issue, Goodlad summarized that, "there is nothing in the evidence to support that large classes materially affect attainment in subject matter" (p. 225). In a 1978 review of literature. Educational Research Services (ERS) reported a "general consensus is that the
R eproduced with perm ission of the copyright owner. Further reproduction prohibited without perm ission.

3research findings on the effects of class size on pupil achievement across all grade levels are contradictory and inconclusive" (p. 68).
Glass and Smith, in 1978, through the use of the statistical technique of meta analysis of previous research findings, became the first nationally recognized researchers to unequivocally report that reduced class size can be expected to produce increased academic achievement (ERS, 1980, p. 239). Glass and Smith concluded that "the relationship of class size to pupil achievement is remarkably strong" (p. 50). The relationship reported by Glass and Smith was most evident in well controlled studies in which pupils were randomly assigned to classes of different sizes.
The implications of Glass and Smith's (1978) work are widespread relative to the direction that education policy makers take (Larkin & Keeves, 1984). Glass and Smith not only confirmed the logic and common sense arguments in favor of small classes but also the intuitive reasons cited by teachers in supporting small classes.
As expected, the findings and work of Glass and Smith (1978) attracted criticism. The most extensive critique and criticism of their work was from the Educational Research Service (ERS), an organization strongly supported by school administrators (Larkin & Keeves, 1984). In summary, ERS (1980) stated that Glass and Smith only confused the class size issue, failed to provide practical guidelines for making class size
R eproduced with perm ission of the copyright owner. Further reproduction prohibited without perm ission.

4decisions, and unjustifiably encouraged proponents of general class size reductions. ERS continued to stand on its 1978 research brief, completed by Porwoll, which concluded that within the midrange of about 25-34 pupils, class size seems to have little if any decisive impact on the academic achievement of most pupils in most subjects. Yet, this same research brief supported the findings that reduced class sizes may result in improved reading scores for primary aged children (Porwoll, 1978).
The findings of Glass and Smith (1978) initiated a renewed interest in the study of class size and student achievement (Bain, 1986). Three studies in particular have attracted attention since 1978. The first of these was completed in the Virginia Beach School District, Virginia. The Virginia Beach Board of Education wanted to know what would be the relationship of lowering class size to reading scores for first grade students. The results of the study were that first grade students, both boys and girls, in classes of 21 had higher reading achievement gains than students in classes of 29. The California Achievement Test, a nationally norm referenced test, was the measure of reading achievement with this study (Carrington et al., 1981).
A second post-1978 study was an investigation of the effects of Indiana's Project PRIME TIME. PRIME TIME began as a 2-year experiment to lower selected kindergarten to Grade 2 class sizes to 14. In 1984, PRIME TIME modified its goal to
R eproduced with perm ission of the copyright owner. Further reproduction prohibited without perm ission.

5lower class size to 18 in kindergarten to Grade 3. With the Iowa Test of Basic Skills as the measure of student achievement, the first year results reflected overwhelming gains for the students in the smaller classes as compared to the students in classes of 23 (Swan, 1985). Reported gains for the students in the smaller classes in subsequent years were less dramatic.A third year was added to the project. The results at the end of the third year were no achievement differences between the students in the large or small classes (Albert, 1988).
The third study was the Tennessee State University Class Size Project. In this study the relationship of students in classes of 15 and classes of 25 was investigated. The findings of the study, with the California Achievement Test as the measure of student achievement, were that students from smaller classes demonstrated greater academic achievement (Bain, 1986).
After the reported findings of Glass and Smith (1978) and in addition to the response of ERS (1980), Cacha (1982), Halloran (1984), Mayhew (1983), and others continued to summarize class size literature reviews with conclusions that class size reductions do not necessarily result in improved academic achievement. The class size issue remains controversial with more questions remaining than have been answered in spite of over 80 years of research efforts. The research hypotheses of this study, supported by the work of Glass, Cahen, Smith, and Filby (1979) was that an inverse relationship exists between class size and student achievement.
R eproduced with perm ission of the copyright owner. Further reproduction prohibited without perm ission.
Definition of Terms
Each of the following terms was used in this study and defined as follows:
Academic achievement; "Knowledge attained or skills developed in school subjects usually designated by test scores" (Good, 1973, p. 7).
Achievement: "Accomplishment or proficiency of performance in a given skill or body of knowledge" (Good, 1973, p. 7).
Class size; "The number of children enrolled in a class" (Good, 1973, p. 103).
Larger enrollment: For the purposes of this study, classrooms with an enrollment between one and two standard deviations above the mean classroom enrollment of a larger sample of classrooms. The definition allowed data from approximately 34% of the classrooms above, yet near the mean, and the data from classrooms with extremely large enrollments to be excluded from any comparative manipulations.
Pupil teacher ratio: "An index of the number of pupilsper teacher in a school or school system." (Good, 1973, p. 472).
Smaller enrollment: For the purposes of this study,classrooms with an enrollment between one and two standard deviations below the mean classroom enrollment of a larger sample of classrooms. The definition allowed data from approximately 34% of the classrooms below, yet near the mean, and
R eproduced with perm ission of the copyright owner. Further reproduction prohibited without perm ission.
7data from the classrooms with extremely small enrollments to be excluded from any comparative manipulations.
Organization of Study
The introduction, definition of terms, and statement of the problem are included in Chapter I. A review of the literature is provided in Chapter II. Chapter III focuses on the
methodology of the study with discussion of the study's population, subjects, procedures for the selection of subjects and source of data, samples, instrumentation, operational and null hypotheses and subhypotheses, and procedures for drawing conclusions. The data analysis, including descriptive data regarding the variables of the study, discussion of the population and samples of the study, and hypotheses testing, is presented in Chapter IV. Chapter V includes the conclusions and recommendations of the study.
Statement of the Problem
In 1984 A Nation at Risk was released, along with numerous other reports on the condition of public education in the United States. Public reaction to these reports led to a heightened awareness and concern for improving schools that came to be referred to as the excellence movement. Reducing class size became identified as an aspect of the excellence movement (Ferenbaugh, Nash, & Thompson, 1973; Michigan Association of School Boards, 1984).
R eproduced with perm ission of the copyright owner. Further reproduction prohibited without perm ission.

8This study addressed and investigated if there is an
inverse relationship between class size and student achievement on the fourth grade MEAP (Michigan State Board of Education, 1988) test. The independent variable of this study was class size in self-contained classrooms for males and females. The dependent variables were the number of correct objectives attained, for both male and female fourth grade students, for the reading, mathematics, and combined reading and mathematics on the Fall 1988 fourth grade MEAP reading and mathematics test.
Beginning with Michigan's 1985-86 School Aid Act, the state's public school districts were allocated additional state aid dollars for maintaining a pupil teacher ratio of 25:1 or less in kindergarten and Grade 1. Since that first state aid act which included a pupil teacher ratio incentive grant, the requirement to qualify for the additional state aid dollars has been extended to include a ratio of 25:1 or less in kindergarten to Grade 3. The Michigan legislature, in 1988, contemplated a mandate that elementary classes be reduced to 18 students or less in kindergarten to Grade 3 and 23 students in Grades 4 and 5 (Michigan Association of School Administrators, 1988). Where public expenditures for class size reduction are made, policy should reflect current thinking in the field and interpretation of research findings (Bennett, 1987).
Hundreds of research studies addressing class size and student achievement have been completed. Recommendations for additional research of class size and its relationship to
R eproduced with perm ission of the copyright owner. Further reproduction prohibited without perm ission.
9student achievement have been commonplace- With few exceptions, these class size studies have used norm referenced tests to measure student achievement (Bennett, 1987). The measure of student achievement with this study was the fourth grade Michigan Educational Assessment Program (Michigan State Board of Education, 1988) reading and mathematics test.
The Michigan Educational Assessment Program test is the Michigan State Board of Education's (1988) and the Michigan Department of Education's only K-12 achievement test. MEAP is a criterion referenced test, administered by local school districts, that addresses basic skills and represents an attempt to find out what Michigan students know compared to what they should know (Michigan State Board of Education, 1970).
The Michigan Educational Assessment Program was mandated by the legislature in August, 1969 (Public and Local Acts of the Legislature, 1969). The two purposes of the MEAP at the time of its inception, according to then State Superintendent for Public Instruction, Ira Polley, were to provide accurate, comprehensive information concerning student achievement and to provide for improved decision making and rationale for the distribution of state and federal aid to Michigan's public schools (Polley, 1969).
The first 4 years of MEAP tests were norm referenced with the instrumentations provided by Educational Testing Service.In 1972, the Michigan State Board of Education approved the change from a norm referenced to a criterion or objective
R eproduced with perm ission of the copyright owner. Further reproduction prohibited without perm ission.
10referenced test. The advantages of a criterion referenced test were cited to be that scores can determine the areas where students need additional help and scores can reflect the effectiveness of specific programs (McCormick, 1978).
While there are 28 reading and 33 mathematics MEAP objectives, only 25 reading and 28 mathematics objectives are included and reported with each year's testing. Not until the test is administered is it known which of the 28 reading and 33 mathematics objectives are being measured in that particular year. The fourth grade MEAP reading objectives deal with the following topics:
Vocabulary meaning: prefixes, suffixes, multiple meanings, synonyms, antonyms, and context.
Literal comprehension: main idea, main idea detail, sequence, cause/effect, and likeness/difference
Inferential comprehension: main idea, cause/effect,probable outcome, main idea details, sequence, likeness/difference, conclusions, analogies, and characters.
Critical reading skills: author's purpose.Positive response/reading: Read in free time, visit read
ing places, and request extra reading.Related study skills: references, awareness; references,
use; summarizing; and alphabetizing.
The fourth grade MEAP mathematics objectives are:Numeration: Order sets, fewer; order sets, fewest; place
value, hundred chart; expand 2-digit numeral; expand 3-digit
R eproduced with perm ission of the copyright owner. Further reproduction prohibited without perm ission.

11numeral; ABC > CBA or ABC < CBA; order set of numerals; and next number in sequence.
Whole numbers; AB + C, no regrouping; AB + CD, no regrouping; AB + C, with regrouping; AB + CD, with regrouping; subtraction, number; AB - C, no regrouping; AB - CD, no regrouping; A + A + A . . . = A X B; A x B = A + A t A . . . ;A X 1 = ?
Fractions: identify incongruent parts and shaded regions,1/2, 1/3, and 1/4.
Metric measurement: length, nearest cm, and temperature.Nonmetric measurement; time, nearest hour.Geometry: shapes and properties of figures.Correlated objectives: numeration, odd or even; whole
numbers, subtraction; whole numbers (A - B; A,B;< 19); whole numbers, AB - CD; whole numbers, 2 x A = ?; whole numbers, word problems; and geometry, shapes.
The assumption with MEAP, as with any criterion referenced test, is that professional educators, scholars, and citizens with a vested interest can reach agreement on a common set of educational goals. The 1988 MEAP (Michigan State Board of Education) was a test of minimal performance objectives written by specialists and professional educators from all over the state. The administration of MEAP occurs in the early fall of the school year by each of the local public school districts in the state. There are three multiple choice questions for each of the MEAP objectives tested. If the student answered two of
R eproduced with perm ission of the copyright owner. Further reproduction prohibited without perm ission.

12the three questions correctly, the student was credited to have mastered the objective (Roberts, 1988).
There is no documentation of fourth grade MEAP test validity or reliability coefficient measures available aside from those provided by the Michigan State Board of Education in Technical Report, Volume I, Michigan Educational Assessment Program and Technical Report, Volume II, Michigan Educational Assessment Program (Phelps, Donovan, Roeber, Carr, & Caswell, 1980). Content validity of test items is supported by the item writing, tryout, and rewriting procedures that involve representatives of the Michigan Reading Association, the Michigan Council of Teachers of Mathematics, and the American Institute of Research.
Reliability coefficients for internal consistency and item discrimination are reported by objective. Reliability for internal consistency, by objective, ranges from .40 to .99, with higher coefficients for the viathematics test than for the reading test. With the mathematics test, 20 of 28 objectives have a demonstrated internal consistency reliability coefficient in a range between .70 and .99. With the mathematics test, 19 of 25 objectives have a demonstrated internal consistency reliability coefficient in a range between .40 and .59. Reliability for item discrimination (i.e., the degree of relationship between performance on an individual item and performance on the other two items measuring a given objective) ranges from .20 to .89. As with reliability measures for internal
R eproduced with perm ission of the copyright owner. Further reproduction prohibited without perm ission.
13consistency, item reliability coefficients for the mathematics test are higher than for the reading test (Phelps et al., 1980).
Staten (1980) completed a study of the correlation between student performance on the MEAP reading test items and the Stanford Achievement Test (SAT). The SAT is a norm referenced test. The findings of Staten were that high performing students score high on both the SAT and MEAP reading test and lower performing students had higher mean performance on the MEAP reading test than on the SAT. Staten concluded that there is a definite correlation between student performance on the MEAP reading test and the SAT reading test.
Michigan is a state which is providing an incentive of
additional state aid dollars to school districts that are maintaining class sizes of 25 or less students in kindergarten to Grade 3. The Michigan legislature in 1988 began considering a mandate that elementary class sizes be reduced in kindergarten through Grade 5. This study provided an investigation of whether or not there is an inverse relationship between class size and student achievement on the state's only achievement test.
R eproduced with perm ission of the copyright owner. Further reproduction prohibited without perm ission.

CHAPTER II
REVIEW OF LITERATURE
Median class size in United States elementary schools during the 1986 school year was 24 students. This compared to 30 students being the median class size in 1961 (J. Stern,1988) and 37 students in 1880 (Halloran, 1984). In spite of these reductions in class size over the past century, especially during the past 25 years, Michigan's 1985-86 State School Aid Act for the first time provided an $8.35 per pupil incentive grant to the state's public schools that maintained a pupil teacher ratio in kindergarten and first grade of 25 students or less. This incentive grant was paid not only for those students in kindergarten and first grades. Rather, if a school district maintained the pupil teacher ratio of 25 students or less in kindergarten and first grade, the $8.35 was paid for each of the school district's full-time equated students. An example of the implication of this policy would be School A ha^'ing a total 1985-86 full-time equated enrollment of 1,500, with grades K-12 having 100 students each plus 200 fulltime equated community education students. School A, if the
kindergarten and first grade pupil teacher ratio was 25:1 or less, would have received an additional $12,525 in state aid (i.e., $8.35 X 1,500), rather than $1,670 (i.e., $8.35 x 200)
14
R eproduced with perm ission of the copyright owner. Further reproduction prohibited without perm ission.

15(Michigan Ccmpiled School Aid Act, 1985-86).
Michigan's 1986-87 State School Aid Act extended the pupil teacher ratio of 25:1 requirement to include kindergarten, first grade, and second grade and increased the incentive grant to $12 (Michigan Compiled School Aid Act, 1986-87). The state's 1987-88 school aid act again extended the pupil teacher ratio of 25:1 requirement to include kindergarten, first, second, and third grade and, again, increased the incentive grant to $14 (Michigan Compiled School Aid Act, 1987-88). The entire state aid appropriations to fund the incentive grants, in all qualifying Michigan schools, was $10,453,607 in the 1985-86 school year, $15,460,545 in the 1986-87 school year, and $18,113,410 in the 1987-88 school year (Michigan Department of Education, 1986, 1987, 1988). Further, Michigan's legislaturein 1988 began contemplation of a mandate to require lower class sizes in kindergarten through Grade 5 (Michigan Association of School Administrators, 1988). The purpose of this paper was to determine if there is an inverse relationship between class size and student achievement of fourth grade students on the MEAP (Michigan State Board of Education, 1988) reading and mathematics tests.
Research on class size has gone through four stages. These are: (a) 1900-1920, preexperimental era; (b) 1920-1940,primitive experimental era; (c) 1950-1970, large group experimental era; and (d) 1970-present, individualization era. Class size was not a major research issue in the 1940s (Glass &
R eproduced with perm ission of the copyright owner. Further reproduction prohibited without perm ission.

16
Smith, 1978). Generally, class size and achievement research has used results of classrooms, yet it is also possible to view the students, as was the case with this study, as the unit of analysis (Larkin & Keeves, 1984).
Many class size studies have been concerned with the relationship between the number of students in the classroom and student achievement levels in different subjects (Larkin & Keeves, 1984). Yet most studies supporting small classes are concerned with factors other than raw achievement (Templeton,1972).
After more than 75 years of study and investigation, most researchers of class size agree on the following:
1. Small classes result in increased student teacher contact.
2. Reductions in class size to less than 20 students without changes in instructional methods cannot guarantee improved academic performance.
3. No single class size is optimal for all grade levels and subjects.
4. Smaller classes appear to result in greater achievement gains for students with academic, economic, and/or social disadvantages.
5. Classroom management improves when class sizes are smaller.
6. Smaller classes result in higher teacher morale and reduced stress.
7. Individualization is more likely to occur in small classes.
8. Class size reduction does not necessarily lead to adoption of dramatically different instructional methods.
R eproduced with perm ission of the copyright owner. Further reproduction prohibited without perm ission.

179. Class size appears to have more influence on
student attitudes, attention, interest, and motivation than on academic achievement.
10. Small classes are beneficial for children at the primary level, particularly in reading and mathematics.
11. Very small classes of five students or less produce considerably higher achievement. (Bennett,1987, p. 3)
Overall, research on class size and academic achievement has produced confusing, conflicting, and sometimes, controversial results.
Early Research on Class Size and Student Achievement
The earliest research regarding the issue of class size and student achievement is often credited to Rice (1903), who reported that scores for arithmetic students did not seem to differ for students in smaller or larger classes. Three dec
ades later, Horn (1937) completed a study of literature regarding class size and student achievement. His conclusion was that class size is not an important factor in determining achievement.
Blake, in 1954, completed a review of 267 class size research studies and articles. Eighty-five of those studies and articles were considered to represent original data, yet only 22 met Blake's undefined criteria for adequate experimen
tal controls. Blake's findings were that 16 studies favored small class size, 3 favored large class size, and 3 studies
R eproduced with perm ission of the copyright owner. Further reproduction prohibited without perm ission.

18were inconclusive (Blake's study cited in California Elementary School Administrators, 1966).
In 1959 the California Elementary School Administrators(1966) completed a literature review and reported the results of an investigation of 275 class size studies, articles, and papers. Of the 275 studies, only a very few were found to be statistically sound with the results of those studies supporting Blake's findings.
As late as 1969, Balow reported that very little experimental work relative to class size and student achievement had been completed (Balow, 1969). Yet, in 1954, Spitzer reported his findings of an experimental study of the relationship of class size and student achievement. Average achievement in reading, study skills, language arts, and arithmetic was computed for all of the third and fifth grade classes in Iowa cities of 5,000 or more. The Iowa Every Pupil Test of Basic Skills was used to measure achievement. A large class was considered to be one with 30 or more pupils, a small class, one with 26 or less pupils. Spitzer found no statistically significant difference in average achievement for the large or small classes (Spitzer, 1954).
Large Group Research on Class Size and Student Achievement
M. Johnson and Scriven (1967) completed a study involving data of 70,000 seventh and eighth grade students in the state
R eproduced with perm ission of the copyright owner. Further reproduction prohibited without perm ission.

19of New York. Classrooms were classified according to size with large classes being considered those with 34 or more students; small classes, those with 24 or less students. Two-thirds of all classes were found to have between 25 and 33 pupils. The Iowa Test of Basic Skills was utilized as the measure of student achievement. The findings were that achievement gains with respect to class size were small and inconsistent. This conclusion was found when comparing all classes, but was also true when the middle two-thirds of the classrooms were removed from the comparison.
Woodson (1968) completed a study of class size and student achievement in 95 school systems. The evidence from his study led to the conclusion that there is a small inverse relationship between academic achievement and class size, that small classes produce higher achievement for low ability reading students, and that class size is a less important factor when related to student achievement in higher grades than in lower grades.
Furno and Collins (1967) completed a 5-year longitudinal study of the relationship of class size and student achievement in reading and mathematics in the Baltimore School District. The study involved 16,449 students. Using school district norm referenced achievement tests, students in smaller classes in both the regular and special education curriculum were found to make greater achievement gains than students in larger classes. Smaller classes (n = 1 to 25) were also found to be more
R eproduced with perm ission of the copyright owner. Further reproduction prohibited without perm ission.
20productive for white than nonwhite students.
Balow, in 1969, reported the results of his 5-year longitudinal study of class size and primary grade student reading achievement. The study, conducted in Riverside, California, investigated the results of reducing class size by 50%, from 30 to 15 students. The reduction was completed by having half of each class come to school early and half of each class attend school later in the afternoon. The Metropolitan Achievement Test and Sequential Test of Educational Programs were the measures of students' achievement. The findings of the study were; (a) Students in the small classes 2 or more years scored higher, (b) effects of achievement for students in the small classes were cumulative, and (c) improved achievement for boys was greater than improved achievement for girls. Only class size was varied in this study, leading to the conclusion that "the increased achievement for the experimental group appears to be a function of class size a\one" (Balow, 1969, p. 187).
Additional Research on Class Size and Student Achievement Prior to 1978
Frymier (1964) conducted a study in 1961 of the effect of class size on reading achievement of first grade students in 12 schools in a single Florida school district. Large classes were considered those with 36 or more students, small classes those with 30 or less. Results from the May testing indicated that mean achievement for students in the smaller classes was
R eproduced with perm ission of the copyright owner. Further reproduction prohibited without perm ission.

21greater than for those in the large classes and that the difference between these means was statistically significant.
Flinker (1972) completed a study of the relationship of class size and student achievement in Brooklyn, New York, in 1970. The sample consisted of 123 seventh grade students. The achievement of a large class of 55 students was compared to the achievement of two smaller classes of 34 students. The teachers of the large and smaller classes met throughout the year long experiment to keep course content, materials, and lessons as equal as possible. The Metropolitan Achievement Test was utilized as both the pretest and posttest. Flinker reported no statistically significant difference in reading or mathematics achievement for the larger or the two smaller classes.
L. Johnson and Garcia-Quintana (1978) investigated the effects of class size and teacher in-service training with a study of the results of the South Carolina First Grade Pilot Project. The study examined data from 50 first grade classrooms in both the 1975-76 school year and the 1976-77 school year. Reading, mathematics, language, and overall student achievement were assessed with the Comprehensive Test of Basic Skills. In 1975-76 the small class size was 19 and the large class size was 27. In 1976-77 small class size was 20 and the large class size 29. Sex and race variables were controlled in the assignment of students to large and small classes. Before the 1975-76 school year, some of the teachers in both small and large classes received in-service training. Additionally, 19
R eproduced with perm ission of the copyright owner. Further reproduction prohibited without perm ission.

22teachers from both large and small classes were assigned para- professionals. The findings from 1975-76 were that students from both the small and large classes whose teacher received in-service training scored higher, students in the smaller classes achieved higher reading and overall scores, and there was no difference in mathematics and language scores. In 1976- 77 all teachers received in-service training. The 1976-77 results of the study were no difference in reading, mathematics, language, or overall achievement. The suggestion was made that other factors, in this case, teacher in-service training, might be more important than class size in improving student achievement.
Madison Public Schools (1976) completed a 3-year study of reading achievement for 517 elementary students. The Sequential Test of Educational Progress was the measure of achievement. The findings of the study were that class size is virtually nonpredicative of reading achievement.
Applebee (1978) conducted a study of the impact of large classes on secondary English teachers. Among other findings, he reported that all 1977 National Council of Teachers of English Achievement Awards in writing were students from what he labeled as smaller classes.
Kean (1979) reported the results of a 1975-76 study of reading instruction of 1,800 Philadelphia fourth grade students. The small size of classes was found to be a variable that produced no difference in reading achievement scores.
R eproduced with perm ission of the copyright owner. Further reproduction prohibited without perm ission.

23Summary of Research Reviews to 1978
In spite of the reported findings of Furno and Collins(1967), Balow (1969), Woodson (1968), Frymier (1974), and others up to the late 1970s, the conclusions of those completing class size research reviews continued to discount the relationship of class size and student achievement. H. Smith (1970), in a review of 34 studies, concluded that class size had little or no effect on student achievement. Templeton (1972) reported that, "The literature uniformly emphasizes the tremendous impact of class size on school budgets. It does not, however, uniformly agree on the effect of class size on educational quality, whether quality is measured by student achievement or other standards" (p. 2). Laughlin (1976) concluded that the benefits of small classes are sociological and psychological, but not academic. McClusky (1978) concluded
that if the goal is better achievement, there is no guarantee that class size should be lowered as class size alone does not control achievement scores. A report from University of North Carolina-Chapel Hill (1978) summarized that if neither method and/or content area are changed, then reducing class size will have no significant effect on achievement. Haddad (1978) reported that an increase in class size does not necessarily lead to decreases in academic achievement and a decrease in class size does not guarantee an improvement in learning. Hess (1978) reported that there was little correlation between class
R eproduced with perm ission of the copyright owner. Further reproduction prohibited without perm ission.

24size and academic success. Thompson (1978) concluded that class size, in itself, rarely has had a substantial effect on educational achievement.
Porwoll completed and Educational Research Services (ERS) published an often cited review of class size literature in 1978. The conclusion on this report was that not enough research has been done to validate the presumed superiority of
smaller class sizes in terms of pupil achievement. The report's other conclusions were as follows;
1. Research findings on class size document repeatedly that the relationship between pupil achievement and class size is highly complex.
2. There is a general consensus that the research findings on the effects of class size on pupil achievement across all grade levels are contradictory and inconclusive.
3. Research to date provides no support for the concept of an optimum class size in isolation from other factors. (Porwoll, 1978, p. 68)
Glass and Smith Research on Class Size
In 1978, Glass and Smith, in the face of the research reviews summarized here and much of the research regarding class size, published the results of their first meta analysis of previous class size research. The Glass and Smith study was the first by nationally recognized researchers to make unequivocal statements about the effects of smaller classes on
pupil achievement (Larkin & Keeves, 1984).
R eproduced with perm ission of the copyright owner. Further reproduction prohibited without perm ission.
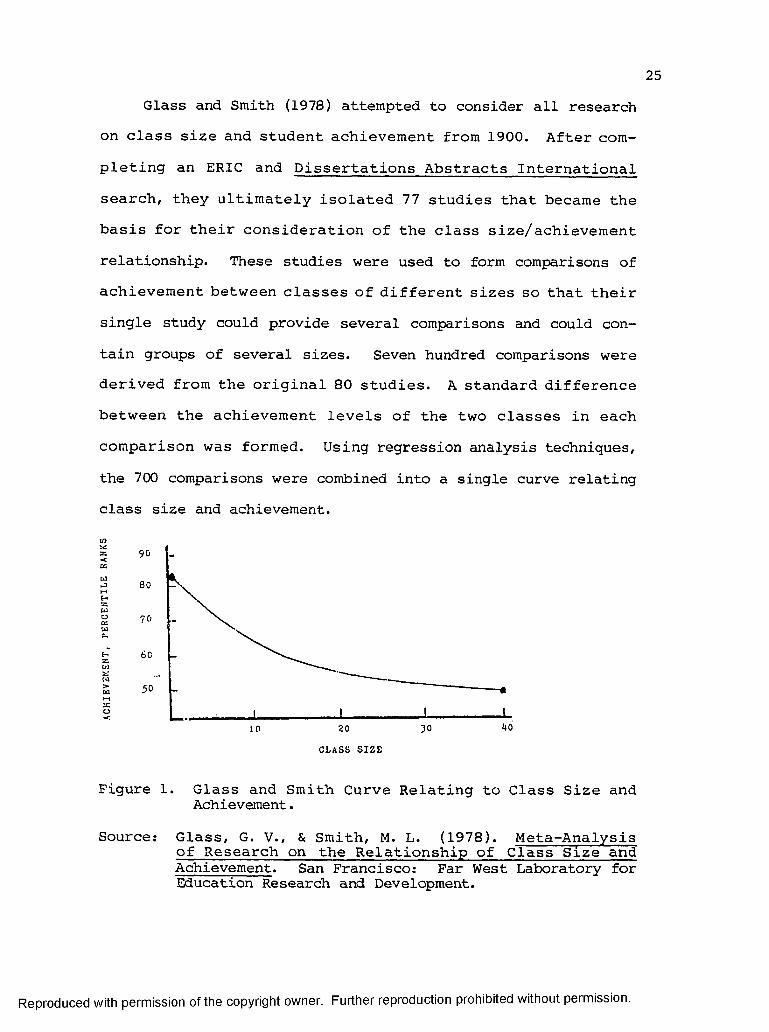
25Glass and Smith (1978) attempted to consider all research
on class size and student achievement from 1900. After completing an ERIC and Dissertations Abstracts International search, they ultimately isolated 77 studies that became the basis for their consideration of the class size/achievement relationship. These studies were used to form comparisons of achievement between classes of different sizes so that their single study could provide several comparisons and could contain groups of several sizes. Seven hundred comparisons were derived from the original 80 studies. A standard difference between the achievement levels of the two classes in each comparison was formed. Using regression analysis techniques, the 700 comparisons were combined into a single curve relating class size and achievement.
«zcc
80
70
60
40302010
CLASS SIZE
Figure 1. Glass and Smith Curve Relating to Class Size and Achievement.
Source: Glass, G. V., & Smith, M. L. (1978). Meta-Analysisof Research on the Relationship of Class Size and Achievement. San Francisco: Far West Laboratory forEducation Research and Development.
R eproduced with perm ission of the copyright owner. Further reproduction prohibited without perm ission.

26The Glass and Smith (1978) curve implies that there are 38
percentile ranks between level of achievement of an individually taught student and the student taught in a class of 40. The curve illustrates a dramatic improvement in academic achievement as class size is reduced below 20 pupils (Mayhew, 1983).
When completing their comparisons, Glass and Smith (1978) noted the grade level, subject taught, ability of students, and the level of experimental control in the original study. Neither grade level, subject taught, nor ability of students affected the basic relationship. Smaller classes were found to be slightly more beneficial at the secondary level. The only factor to alter the curve significantly was the level of experimental control in placing students or teachers in small or large classes. About 100 of the comparisons came from well controlled studies. The curve from poorly controlled studies provided an inverse relationship,\but the relationship was much weaker than for the controlled studies. Glass and Smith concluded that more was learned in small classes, regardless of the circumstance. In summary, the research shows that there is "a clear relationship between class size and achievement" (Glass et al., 1979, p. 44).
In 1979, M. L. Smith and Glass and others applied a similar meta analysis to nonachievement outcomes of class processes, assessment of learning environments, student attitudes, and teacher satisfaction. Seventy studies provided over 300
R eproduced with perm ission of the copyright owner. Further reproduction prohibited without perm ission.
27comparisons. Using both instructional and attitude measurements, again a single inverse curve between class size and nonachievement was constructed. The curve for nonachievement outcomes was more pronounced than for achievement outcomes. The difference in nonachievement outcomes between a class of 1 and a class of 40 was 46 percentile ranks. The improvement in nonachievement outcomes from decreasing class size was most evident at the primary level (M. L. Smith & Glass, 1979).
From each study Glass and Smith (1978; M. L. Smith & Glass, 1979) and their associates concluded that class size influences not only achievement, but also classroom environment and student and teacher attitudes. Perhaps independently or perhaps because of these relationships, smaller classes were also associated with improved achievement (Cahen & Filby,1979).
Reactions to Glass and Smith's Class Size Research
The Glass and Smith findings sparked nothing less than what has been viewed as a classic debate (Bain, 1986). The chief and leading critic of Glass and Smith became ERS. "As examination of Glass and Smith's meta analysis continued, it became clear that in light of the magnitude of the harm that could occur, ERS should publish a full critique" (ERS, 1979, p. 239). ERS (1978) stood by its earlier conclusions that not enough research had been done to validate the presumed superiority of smaller classes in terms of pupil achievement.
R eproduced with perm ission of the copyright owner. Further reproduction prohibited without perm ission.

28The ERS (1980) criticism of Glass & Smith's findings
centered on the following:1. A substantial portion of the comparisons
used in the meta analysis graph below 20 students dealt with either one-to-one tutorial or class sizes of two to five.
2. Glass and Smith relied on too few studies. Seventy-three percent of the comparisons used in the graph came from four of the studies Glass and Smith considered well controlled.
3. By mixing and comparing well and poorly done studies, Glass and Smith reduced the value of the meaningful studies to the validity of the least valid study. (p. 68)Others criticized Glass and Smith's findings, albeit not
so aggressively as ERS. Cacha (1982) questioned the meta analysis statistical methodology of integrating results of many different studies. In summary. Cacha warned against acceptance of Glass and Smith's generalizations and asserted that class size remains a complex issue.
Hess (1979) claimed that there were various flaws in the Glass and Smith methodology. Hess questioned the assumption of Glass and Smith that the large size of the analysis assured randomization, when in fact, the sample was fixed by the variety of experiments and research. Hess pointed out that Glass and Smith forced results from what were, in many cases, multidimensional studies to a linear scale. Hess also questioned the influence of the time variable of the studies between 1900 and 1979. Finally, Hess argued that the Glass and Smith large sample compounded the errors of past studies.
R eproduced with perm ission of the copyright owner. Further reproduction prohibited without perm ission.

29Slavin (1984) examined each of the studies that were
included in the conclusions of the Glass and Smith's 1978 meta analysis and observed that some of these, citing research
regarding tennis lessons, had little or no relationship to conventional classroom instruction. Secondly, Slavin noted that no serious research based claims should be made about secondary schools as there has been almost no research completed on class size and achievement in secondary schools.
Other researchers have supported Glass and Smith's findings. Hedges and Stock (1983) repeated the meta analysis of Glass and Smith (1978) with a final product being a four dimensional graph. Statistically, Hedges and Stock used an unbiased estimator rather than a biased estimator of standard deviation. Hedges and Stock disregarded studies that were biased or included insignificant information. The results of the Hedges and Stock study were to confirm most of the conclusions of Glass and Smith. In summary, the findings were, "Tests of significance confirmed that class size accounts for a substantial amount of achievement variation. Smaller class sizes still lead to higher expected achievement than larger classes"(p. 83).
Cotton and Savard (1980) reported significant advantages of smaller classes regarding low ability, special education, and primary students. Further, Cotton and Savard reported support for a hypothesis that small classes have a positive
R eproduced with perm ission of the copyright owner. Further reproduction prohibited without perm ission.
30effect on academic achievement of both elementary and secondary students.
Class Size as One of Many Factors Related to Student Achievement
Many researchers support the concept that factors beyond simply reducing class size are necessary and/or important for increased achievement. Vignocchi (1980) suggested that there may be a relationship between methods of instruction, age of students, class size, and student achievement. Berger (1982) explained that the contradictory nature of class size research evidence is due to the failure of viewing class size as one of the many factors which affect the teaching and learning process. Albritton (1984) indicated that many factors combine with class size to determine the quality of the achievement experience. ERS (1978) reported that "research to date provides no support for the concept of an optimum class size in isolation from other factors" (p. 69). Yet, the Michigan State School Aid Acts of 1985-86, 1986-87, and 1987-88 did not include any other factors, such as teacher aides or teacher in- service, in order for public schools to qualify for the primary grade incentive grants. The isolated factor of a pupil teacher ratio of 25:1 or less was the requirement for a public school to receive additional incentive grant state aid.
R eproduced with perm ission of the copyright owner. Further reproduction prohibited without perm ission.

31Class Size and Student Achievement Research
After Glass and Smith
The Glass and Smith (1978) study and findings were used as a point of departure into new research regarding the relationship of class size and achievement (Albritton, 1984). Larkin and Keeves (1984), using 1969 data from classrooms in Australia, completed a study which had conclusions rejecting the findings of Glass and Smith. Larkin and Keeves examined the ways in which class size affected the other facets of the educational environment of the classroom. In this study academically advanced students were grouped in larger classes than their less able peers. The study concluded that there is a need for increased understanding of the effects of ability grouping, teacher motivation, teacher activities, and other factors related to student achievement before class size alone can be said to affect student achievement.
In 1980 Shapson reported hvS 2-year investigation of 62 classes of Grades 4 and 5 students in Toronto. The study included 16 classrooms of 16 students, 16 classrooms of 23 students, 15 classrooms of 30 students, and 15 classrooms of 37 students. The findings of the study were that there was no difference attributable to class size for art, composition, vocabulary, reading, or mathematics problem solving achievement. The only inverse relationship of class size and achievement attributed to class size was mathematics concepts, with classes of 16 compared to classes of 30. Other variables in
R eproduced with perm ission of the copyright owner. Further reproduction prohibited without perm ission.

32the study that resulted in a finding of an inverse relationship to class size were teacher attitudes and opinions (Shapson,1980).
Mazareas (1981) concluded that only in reading did class size affect achievement for first grade students. Research of reading, mathematics, and language arts achievement in Arkansas resulted in findings that class size accounts for less than 12% of the total variation in achievement scores (Tetter, Bradley,& Shull, 1983). Murdock (1985) studied achievement of older students in Grades 1 to 5 in Utah and found that students in smaller classes in Grades 1, 2, and 5 experienced greaterachievement. Levin and Meister (1986)) in a study of cost effectiveness, reported that reducing class size is less cost effective in improving achievement than either providing computer assisted instruction or peer tutoring. Similarly, Slavin (1984) concluded that the only stable and significantly effective class size is tutorial. A California study, when controlling for race and achievement, yielded results that did not support the belief that small classes were more conducive to improved student achievement (Halliman & Sorenson, 1985).D. Stern (1987), in another California study, concluded that raising teacher salaries was more effective than lowering class sizes if the desired result was improved achievement.
A review of the literature on the class size issue demonstrates its complexity (Albritton, 1984) and confusing results (Bennett, 1987). It has been suggested that perhaps in those
R eproduced with perm ission of the copyright owner. Further reproduction prohibited without perm ission.

33districts that have smaller classes there are more dollars to pay for better teachers and more affluent parents with higher expectations for their children (Jencks, 1972).
Class Size Related to Classroom Environmental Conditions
A 1966 study of kindergarten class size found that students in smaller classes (m = 24.75) made friends more easily and were more creative. Teachers in the smaller classes experienced greater satisfaction and sense of accomplishment. Students in the larger classes (m = 38.50) were involved in more aggressive acts than the children in the small classes (Cannon, 1966). While Cannon's study did not address the relationship of class size and achievement, it did focus on consideration of environmental conditions in classrooms that may be directly related to the issue of student achievement (Albritton, 1984).
Cannon's (1966) findings reflect a consistent theme of much of the literature related to class size and student achievement; small classes produce conditions necessary, though not sufficient, for successful teaching and learning (Bennett,1987). Cotton and Savard (1980) contended that smaller classes have the potential for teachers to develop and use a wider variety of instructional skills, yet caution that this development and use does not occur automatically with the reduction of class size. Haddad (1978) reported that small classes allow greater instructional variety, increased interaction and
R eproduced with perm ission of the copyright owner. Further reproduction prohibited without perm ission.

34improved relations among students, more creative activity, more divergent thinking, and fewer discipline problems. Chang and Ogletree (1979) agreed with others that smaller classes offer the possibility for, but do not insure, a teacher's improved instructional method. Class size could influence what goes on in classrooms, what teachers do, how they handle students, what activities are available to students, and how students behave; and all of these could be a cause of achievement outcomes (Larkin & Keeves, 1984). A reason for the outcomes of the Balow (1969) and Purno and Collins (1967) longitudinal studies, where smaller classes had higher achievement than larger classes, may have been due to teachers having the time to learn new instructional techniques for use in small classes. Yet teachers often fail to adjust to small classes and fail to adjust to these advantages (Lindbloom, 1970).
Conclusions
Glass and Smith's conclusions did not provide explanations as to why small classes produced higher achievement levels as the research methodologies of their studies was descriptive, not inferential (Larkin & Keeves, 1984). A part of the research methodology of this study, like those of Glass and Smith, was descriptive. The purpose of this study was to determine if there is an inverse relationship between class size and achievement on the fourth grade MEAP (Michigan State Board of Education, 1988) reading and mathematics tests.
R eproduced with perm ission of the copyright owner. Further reproduction prohibited without perm ission.

35The findings of this study expanded previous research with
the use of a measure of student achievement that is a statewide, criterion referenced instrument. The first procedure to test the research hypothesis of this study was designed to determine if relationships exist between class size and student achievement with the use of all classes. The second procedure used in this study, to test the same hypothesis, was designed to exclude classrooms with extremely large or small enrollments and those classrooms with an enrollment within one standard deviation of the mean enrollment of all classrooms. This procedure reflected that used by M. Johnson and Scriven (1967) and allowed an ERS criticism of the Glass and Smith research findings, namely, including cases of very small class sizes to be included in their meta analysis, to be addressed in the design of the study.
Achievement in two subjects, reading and mathematics, as in this study, have been most popular for investigation of the relationship between class size and achievement. Virtually all class size research at the primary level has been with these two subjects (Larkin & Keeves, 1984).
Bivariate correlational studies are unusual (Kerlinger,1973). Studies involving inferential techniques that do not allow for consideration of interaction between variable are among those receiving less current emphasis in behavioral research (Isaac Sc Michael, 1981). Yet, the state of Michigan's state aid class size incentive grant is available to school
R eproduced with perm ission of the copyright owner. Further reproduction prohibited without perm ission.

36districts providing class sizes of 25:1 or less and is not tied to providing teacher in-service, teacher aides, increased teacher salaries, modified curriculum, or any of the other factors identified in a review of the literature as explaining a possible inverse relationship or difference existing between class size and academic achievement. The review of the literature not only failed to answer the research question of this study, the review of the literature presented the issue as complicated, complex, and supporting further exploratory research .
R eproduced with perm ission of the copyright owner. Further reproduction prohibited without perm ission.

CHAPTER III
METHODOLOGY
Introduction
The study's research design provided for: (a) an ex postfacto bivariate correlational and (b) a causal comparative study. The population of this study was all school year 1988- 89 fourth grade students in the state of Michigan who completed the fall 1988 Michigan Educational Testing Program (MEAP, Michigan State Board of Education, 1988) reading and mathematics test. A total of 111,199 students completed the fall 1988 fourth grade MEAP tests (Michigan Department of Education,1989). The subjects in this study were 200 male and 200 female randomly selected fourth grade students who completed the fall 1988 MEAP fourth grade reading and mathematics test.
A contract with National Computer Systems (NCS) resulted in the random selection of the 400 subjects. The NCS is the company that the Michigan Department of Education contracts with for computer scoring and data analysis of individual classroom, school district, and statewide MEAP (Michigan State Board of Education, 1988) test results. The contract and
communications with NCS are in Appendix A. The listing of the 400 subjects is in Appendix B. The confidentiality of the subjects was guaranteed as their names were never made known to
37
R eproduced with perm ission of the copyright owner. Further reproduction prohibited without perm ission.

38the researcher. The confirmation of protocol of the research design by the Western Michigan University Human Subjects Review board relative to this study is in Appendix C.
Samples
The study involved the use of three samples. The 400 students randomly selected by NCS, and the individual classroom enrollments represented by those students, were treated as Sample 1. While it would be expected that there would be only one student from any single classroom represented in this study, information is not available to confirm this. Sample 2, which included 50 males and 50 females, was derived from the listing of students provided by the contract with NCS. Every fourth male and every fourth female student from the list of 400 students from NCS was selected for inclusion with Sample 2. Sample 2 was used in the test of the operationalized hypothesis that there is an inverse relationship between class size and student achievement. The size of Sample 2, a total of 100 students, reflects the position that "it can be assumed that if a relationship exists, it will be evident with a sample of moderate size, 50-100" (Ary, Jacobs, & Razavieh, 1979, p. 306). Sample 3 included those fourth grade students, both male and female, who were enrolled in classrooms with enrollments either between one and two standard deviations above or below the mean classroom size of the 400 students provided by NCS. The configuration of Sample 3 allowed the ERS (1979) criticism of the
R eproduced with perm ission of the copyright owner. Further reproduction prohibited without perm ission.
39Glass and Smith's (1978) findings, namely, including extremely small classes in their comparisons, to be addressed by the design of the study. Sample 3 was used to test the operationalized hypothesis that there is a difference in mean achievement between students in classrooms with smaller enrollments and students in classrooms with larger enrollments and achievement is greater for the students in the classrooms with the smaller enrollments.
Instrumentation
The instrument used in this study was the school year 1988-89 fourth grade Michigan Educational Assessment Program (MEAP, Michigan State Board of Education, 1988) test. The MEAP test is criterion referenced and is the Michigan State Board of Education's and the Michigan Department of Education's only achievement test. The school year 1988-89 fourth grade MEAP test is in Appendix D. The MEAP test is administered to all regular education 4th, 7th, and 10th grade students attending public schools in Michigan. Private schools are permitted to have their students complete the MEAP test if a participation fee is paid. The administration of MEAP is completed by local school districts and occurs in the early fall of each school year. Schools return the completed MEAP test to the Michigan Department of Education. The Michigan Department of Education then advances the completed test to NCS for scoring and data analysis.
R eproduced with perm ission of the copyright owner. Further reproduction prohibited without perm ission.

40There is no documentation of fourth grade MEAP (Michigan
State Board of Education, 1988) test validity or reliability coefficient measures available aside from those provided by the Michigan State Board of Education. The Michigan State Board of Education cites the involvement of representatives of the Michigan Reading Association, the Michigan Council of Teachers of Mathematics, and the American Institute of Research in the item writing, tryout, and rewriting procedures as support for content validity. Reliability coefficients for internal consistency are reported by individual MEAP objectives and range from .40 to .99, with higher coefficients for the mathematics test than the reading test. Item discrimination coefficients range between .20 and .89, with higher coefficients again reported for the mathematics test than for the reading test (Phelps, Donovan, Roeber, Carr, & Caswell, 1980). In addition to the findings of the Michigan State Board of Education, Staten (1980) reported a relationship between student scores on the MEAP and the norm referenced Stanford Achievement Test.
Source of Data
In addition to the random selection of subjects, the contract with NCS also provided the following data: (a) the totalnumber of MEAP (Michigan State Board of Education, 1988) reading objectives attained by each subject, (b) the total number of MEAP mathematics objectives attained by each subject, (c) the class size of each subject, and (d) the sex of each
R eproduced with perm ission of the copyright owner. Further reproduction prohibited without perm ission.

41subject. NCS acquired each of the listed items of data in the process of completing scoring and data analysis functions for the Michigan Department of Education.
Operational Hypotheses
The hypothesis of this study was that there is an inverse relationship between class size and student achievement. This hypothesis was extended as the first operational hypothesis of this study: There is an inverse relationship between fourthgrade students' class size, for both males and females, and the students' fourth grade MEAP (Michigan State Board of Education,1988) test scores that can be demonstrated with Sample 2 of this study by a Pearson product-moment correlation coefficient being within a range of -0.24 to -1.00 (Fisher & Yates, 1974).
The following were the operational subhypotheses of this study:
1. There is an inverse relationship between fourth grade students', both male and female, class size and the students' fourth grade MEAP (Michigan State Board of Education, 1988) reading test scores that can be demonstrated with Sample 2 of this study by a Pearson product-moment correlation coefficient being within a range of -0.24 to -1.00.
2. There is an inverse relationship between fourth grade students' class size and the students' fourth grade MEAP (Michigan State Board of Education, 1988) mathematics test scores that can be demonstrated with Sample 2 of this study by
R eproduced with perm ission of the copyright owner. Further reproduction prohibited without perm ission.

42a Pearson product-moment correlation coefficient being within a range of -0.24 to -1.00.
3. There is an inverse relationship between male fourth grade students' class size and the students' fourth grade MEAP (Michigan State Board of Education, 1988) combined reading and mathematics test scores that can be demonstrated with Sample 2 of this study by a Pearson product-moment correlation coefficient being within a range of -0.332 to -1.00 (Fisher & Yates,1974).
4. There is an inverse relationship between male fourth grade students' class size and the students' fourth grade MEAP (Michigan State Board of Education, 1988) reading test scores that can be demonstrated with Sample 2 of this study by a Pearson product-moment correlation coefficient being within a range of -0.332 to -1.00.
5. There is an inverse relationship between male fourth grade students' class size and the students' fourth grade MEAP (Michigan State Board of Education, 1988) mathematics test scores that can be demonstrated with Sample 2 of this study by a Pearson product-moment correlation coefficient being within a range of -0.332 to -1.00.
6. There is an inverse relationship between female fourth grade students' class size and the students' fourth grade MEAP (Michigan State Board of Education, 1988) combined reading and mathematics test scores that can be demonstrated with Sample 2 of this study by a Pearson product-moment correlation
R eproduced with perm ission of the copyright owner. Further reproduction prohibited without perm ission.

43coefficient being within a range of -0.332 to -1.00.
7. There is an inverse relationship between female fourth grade students' class size and the students' fourth grade MEAP (Michigan State Board of Education, 1988) reading test scores that can be demonstrated with Sample 2 of this study by a Pearson product-moment correlation coefficient being within a range of -0.332 to -1.00.
8. There is an inverse relationship between female fourth grade students' class size and the students' fourth grade MEAP (Michigan State Board of Education, 1988) mathematics test scores that can be demonstrated with Sample 2 of this study by a Pearson product-moment correlation coefficient being within a range of -0.332 to -1.00.
The hypothesis of this study, that there is an inverse relationship between class size and student achievement, was extended to a second operational hypothesis: There is a difference in the mean achievement, as measured by the fourth grade MEAP (Michigan State Board of Education, 1988) reading and mathematics test scores, for fourth grade students in classrooms with an enrollment between one and two standard deviations below the class size mean and mean achievement of fourth grade students in classrooms with an enrollment between one and two standard deviations above the class size mean, achievement is greater for the students in the smaller classes, and the difference in achievement can be measured by the value of the test statistic t for independent means exceeding the
R eproduced with perm ission of the copyright owner. Further reproduction prohibited without perm ission.

44appropriate critical value for the test statistic t with an alpha level of .05. The sample used with the test of the second operational hypothesis was Sample 3.
The following are the subhypotheses extended from the study's second operational hypothesis:
1. There is a difference in the mean achievement, as measured by the fourth grade MEAP (Michigan State Board of Education, 1988) reading test scores, for fourth grade students in classrooms with an enrollment between one and two standard deviations below the class size mean and mean achievement of fourth grade students in classrooms with an enrollment between one and two standard deviations above the class size mean, achievement is greater for the students in the smaller classes, and the difference in achievement can be measured by the value of the test statistic ;t for independent means exceeding the appropriate critical value for the test statistic t with an alpha level of .05. The sample used with the test of the first operational subhypothesis of the second operational hypothesis was Sample 3.
2. There is a difference in the mean achievement, as measured by the fourth grade MEAP (Michigan State Board of Education, 1988) mathematics test scores, for fourth grade students in classrooms with an enrollment between one and two standard deviations below the class size mean and mean achievement of fourth grade students in classrooms with an enrollment between one and two standard deviations above the class size
R eproduced with perm ission of the copyright owner. Further reproduction prohibited without perm ission.
45mean, achievement is greater for the students in the smaller classes, and the difference in achievement can be measured by the value of the test statistic t for independent means exceeding the appropriate critical value for the test statistic t with an alpha level of .05. The sample used with the test of the second operational subhypothesis of the second operational hypothesis was Sample 3.
The study's operational hypotheses and subhypothe ses were supported by the findings of, among others. Hedges and Stock (1983), Glass and Smith (1978), Balow (1969), Woodson (1968), and Furno and Collins (1967). The findings of Larkin and Keeves (1984), L. Johnson and Garcia-Quintana (1976, 1977), Madison Public Schools (1976), and Shapson (1980) did not support the study's operational hypotheses and various subhypotheses .
Null Hypotheses
The following null hypothesis was tested to determine the tenability of the study's first operational hypothesis: Thecorrelation between fourth grade students' class size and the students' fourth grade MEAP (Michigan State Board of Education, 1988) combined reading and mathematics test scores is zero and any correlation observed is a function of chance. The following eight null subhypotheses, extended from the first operational hypothesis were also tested to determine the tenability of the study's first operational hypothesis and to further
R eproduced with perm ission of the copyright owner. Further reproduction prohibited without perm ission.

46investigate the relationship between class size and student achievement on the MEAP fourth grade test.
1. The correlation between fourth grade students' class size and the students' fourth grade MEAP (Michigan State Board of Education, 1988) reading test scores is zero and any correlation observed is a function of chance.
2. The correlation between fourth grade students' class size and the students' fourth grade MEAP (Michigan State Board of Education, 1988) mathematics test scores is zero and any correlation observed is a function of chance.
3. The correlation between male fourth grade students' class size and the male students' fourth grade MEAP (Michigan State Board of Education, 1988) combined reading and mathematics test scores is zero and any correlation observed is a function of chance.
4. The correlation between male fourth grade students' class size and the male student^»' fourth grade MEAP (Michigan State Board of Education, 1988) reading test scores is zero and any correlation observed is a function of chance.
5. The correlation between male fourth grade students' class size and the male students' fourth grade MEAP (Michigan State Board of Education, 1988) mathematics test scores is zero and any correlation observed is a function of chance.
6. The correlation between female fourth grade students' class size and the female students' fourth grade MEAP (Michigan State Board of Education, 1988) combined reading and
R eproduced with perm ission of the copyright owner. Further reproduction prohibited without perm ission.

47mathematics test scores is zero and any correlation observed is a function of chance.
7. The correlation between female fourth grade students' class size and the female students' fourth grade MEAP (Michigan State Board of Education, 1988) reading test scores is zero and any correlation observed is a function of chance.
8. The correlation between female fourth grade students' class size and the female students' fourth grade MEAP (Michigan State Board of Education, 1988) mathematics test scores is zero and any correlation observed is a function of chance.
The following null hypothesis was tested to determine the tenability of the study's second operational hypothesis; There is no difference in the mean achievement, as measured by fourth grade MEAP (Michigan State Board of Education, 1988) reading and mathematics test scores, for fourth grade students in classrooms with an enrollment between one and two standard deviations below the class size mean and mean achievement of fourth grade students in classrooms with an enrollment between one and two standard deviations above the class size mean and any difference observed is a function of chance. The following two null subhypotheses, extended from the second operational hypothesis, were also tested to determine the tenability of the study's second operational subhypotheses designed to further investigate the relationship between class size and student achievement on the MEAP fourth grade test:
R eproduced with perm ission of the copyright owner. Further reproduction prohibited without perm ission.
481. There is no difference in the mean achievement, as
measured by fourth grade MEAP (Michigan State Board of Education, 1988) reading test scores, for fourth grade students in classrooms with an enrollment between one and two standard deviations below the class size mean and mean reading achievement of fourth grade students in classrooms with an enrollment between one and two standard deviations above the class size mean and any difference observed is a function of chance.
2. There is no difference in the mean achievement, as measured by fourth grade MEAP (Michigan State Board of Education, 1988) mathematics test scores, for fourth grade students in classrooms with an enrollment between one and two standard deviations below the class size mean and mean mathematics of fourth grade students in classes with an enrollment between one and two standard deviations above the class size mean and any difference observed is a function of chance.
The findings of Balow (1969), Shapson (1980), and Mazareas (1981) support testing of the null hypothesis and subhypotheses of no relationship and/or difference of class size and fourth grade MEAP (Michigan State Board of Education, 1988) reading, mathematics, and combined reading and mathematics test scores. Further, the findings of the same researchers also support the testing of the null subhypotheses of no relationship and/or difference of class size and achievement for both males and females combined and for males and females separately. The findings of Larkin and Keeves (1984), L. Johnson and
R eproduced with perm ission of the copyright owner. Further reproduction prohibited without perm ission.

49Garcia-Quintana (1976, 1977), Madison Public Schools (1976), and Shapson (1980) did not support the study's null hypotheses and various null subhypotheses.
Procedures for Drawing Conclusions
The Pearson product-moment correlation coefficient, as described by Hinkle, Wiersma, and Jurs (1979), was determined for the variables of the study within the following nine categories to allow testing of the null hypothesis and the eight null subhypotheses of the first operational hypothesis and its subhypotheses :
1. The class size and the combined reading and mathematics MEAP (Michigan State Board of Education, 1988) scores of the 100 students included with Sample 2.
2. The class size and MEAP (Michigan State Board of Education, 1988) reading scores of the 100 students included with Sample 2.
3. The class size and MEAP (Michigan State Board of Education, 1988) mathematics scores of the 100 students included with Sample 2.
4. The class size and combined MEAP (Michigan State Board of Education, 1988) reading and mathematics scores of the 50 male students included with Sample 2.
5. The class size and MEAP (Michigan State Board of Education, 1988) reading scores of the 50 male students included witli Sample 2.
R eproduced with perm ission of the copyright owner. Further reproduction prohibited without perm ission.

506. The class size and MEAP (Michigan State Board of
Education, 1988) mathematics scores of the 50 male students included with Sample 2.
7. The class size and combined MEZiP ( Michigan State Board of Education, 1988) reading and mathematics scores of the 50 female students included with Sample 2.
8. The class size and MEAP (Michigan State Board of Education, 1988) reading scores of the 50 female students included with Sample 2.
9. The class size and MEAP (Michigan State Board of Education, 1988) mathematics scores of the 50 female students included with Sample 2.
The critical value of the Pearson product-moment correlation coefficient for a one-tailed test with a level of significance of .01 for a sample size of 100 has been identified to be -.24 (Ary et al., 1979; Fisher & Yates, 1974). The critical value of the Pearson product-moment correlation coefficient for a one-tailed test with a level of significance of .01 for a sample size of 50 has been identified to be -.332.
If the Pearson product-moment correlation coefficient, when the sample size is 100, is between -0.24 and -1.00, the null hypothesis or null subhypothesis represented by that particular category can be rejected and the operational hypothesis or subhypothesis found to be tenable. If the Pearson product- moment correlation coefficient, when the sample is 100, is b etween -0.239 and +1.00, the null hypothesis or null
R eproduced with perm ission of the copyright owner. Further reproduction prohibited without perm ission.
51subhypothesis represented by that particular category can be accepted and it can be concluded that any relationship in that particular category between class size and student achievement is a function of chance.
If the Pearson product-moment correlation coefficient, when the sample is 50, is between -0.332 and -1.00, the null subhypothesis represented by that particular category can be rejected and the operational subhypothesis found to be tenable.If the Pearson product-moment correlation coefficient, when the sample is 50, is between -0.331 and +1.00, the null subhypothesis represented by that particular category can be accepted and it can be concluded that any relationship in that particular category between class size and student achievement is a function of chance.
A coefficient may be low in value and yet permit the rejection of the null hypothesis and allow for the tenability of the first operational hypothesis. Such a finding of the tenability of the first operational hypothesis or one of several of its operational subhypotheses would indicate only that the correlation coefficient between the variables considered with that particular population is not zero (Ary et al., 1979). Nevertheless, support of the first operational hypothesis or operational subhypotheses of this study would allow prediction, at a greater than chance level, of greater academic success on the fourth grade MEAP (Michigan State Board of Education, 1988) test when class sizes are lowered.
R eproduced with perm ission of the copyright owner. Further reproduction prohibited without perm ission.

52The t test for independent means, used with the null
hypothesis, > Wg' when ^ as described by Hinkleet al. (1979), was completed with the second operational hypothesis and its extended subhypotheses. With this statistical procedure, if the value of the test statistic ;t for independent means exceeds the appropriate critical value of the test statistic t, the null hypothesis can be rejected and the alterna
tive or operational hypothesis or subhypothesis found to be tenable. If the value of the test statistic t for independent means does not exceed the appropriate critical value of the test statistic t, the null hypothesis cannot be rejected and it can be concluded that any difference in the mean achievement of the two groups is a function of chance.
A value of a test statistic t for independent means that exceeds the appropriate critical value of the test statistic t indicates only that the difference in the means of the two groups is not a function of chance. Such an occurrence would permit the rejection of the null hypothesis and allow for the tenability of the second operational hypothesis and/or its extended subhypotheses. Such a finding of the tenability of the second operational hypothesis or one of its two subhypotheses would allow for greater understanding of the impact of class size on student achievement.
Various tables were completed to facilitate data analysis in Chapter IV. Tables were constructed to demonstrate various descriptive data regarding the study's variables, as well as to
R eproduced with perm ission of the copyright owner. Further reproduction prohibited without perm ission.
53demonstrate the necessary information used in testing the operational hypotheses or operational subhypotheses.
R eproduced with perm ission of the copyright owner. Further reproduction prohibited without perm ission.

CHAPTER IV
DATA ANALYSIS
This chapter includes a review of the study's population, a description of the samples, the results of data analysis of the variables of the study, and hypotheses testing. The study was designed to determine if there is a relationship between Michigan fourth grade students' class size and the students' achievement as measured by the Michigan Educational Assessment Program (MEAP, Michigan State Board of Education, 1988) test of reading and mathematics. The independent variable of the study was class size and the dependent variables were fourth grade students' fall 1988 MEAP reading, mathematics, and combined reading and mathematics test scores.
Population
The population of the study was all fourth grade students in Michigan who completed the fall 1988 MEAP (Michigan State Board of Education) reading and mathematics test. A total of 111,199 students completed the fall 1988 MEAP test.
54
R eproduced with perm ission of the copyright owner. Further reproduction prohibited without perm ission.

55Description of the Samples
Sample 1
A contract with National Computer Systems (NCS) resulted in the random selection of 400 students, 200 male and 200 female, who completed the fall 1988 MEAP (Michigan State Board of Education) reading and mathematics test. Under the terms of this contract, a listing of the sex, reading test score, mathematics score, and class size was provided for each of the 400 students. The identity of the 400 students was not provided.The study's Sample 1 was these 400 randomly selected students. The means and standard deviations of the study's variables for these 400 students is included in Table 1.
Sample 2
Sample 2 was derived from the data provided by the contract with National Computer Systems. From the listing of the 400 students of Sample 1, every fourth male and every fourth female student was selected for inclusion with Sample 2, the sample used in the test of the study's first operational hypothesis and its eight subhypotheses. That first operational hypothesis and its eight subhypotheses were designed to test and determine if there is a relationship between class size and student achievement. Table 2 summarizes the means and standard deviations of the study's variables for Sample 2.
R eproduced with perm ission of the copyright owner. Further reproduction prohibited without perm ission.

56Table 1
Means and Standard Deviations of Variables, Sample 1
Variable
Males and females (n = 400)
Males (n =
only200)
Females only (n = 200)
Mean SD Mean SD Mean SD
Class size 25.34 5.04 25.60 4.98 25.20 5.10Reading test scores 21.64 4.73 21.16 4.96 22.24 4.44
Mathematics test scores 24.92 3.88 24.58 4.39 25.39 3.25
Combined reading and mathematics test scores 46.56 7.78 45.73 8.44 47.63 6.95
Sample 3
Sample 3 was derived from the listing of Üie 400 students of Sample 1. Sample 3 included students in classrooms with an enrollment between either one and two standard deviations above or below the mean classroom size of Sample 1. The mean class
room size of Sample 1 was 25.38 with a standard deviation of5.04. Ninety-nine students were enrolled in such classrooms and comprised Sample 3. Thirty students of Sample 3 were assigned to one group and were in classrooms with an enrollment between one and two standard deviations below the mean classroom enrollment of the 400 students of Sample 1, (i.e., between
R eproduced with perm ission of the copyright owner. Further reproduction prohibited without perm ission.
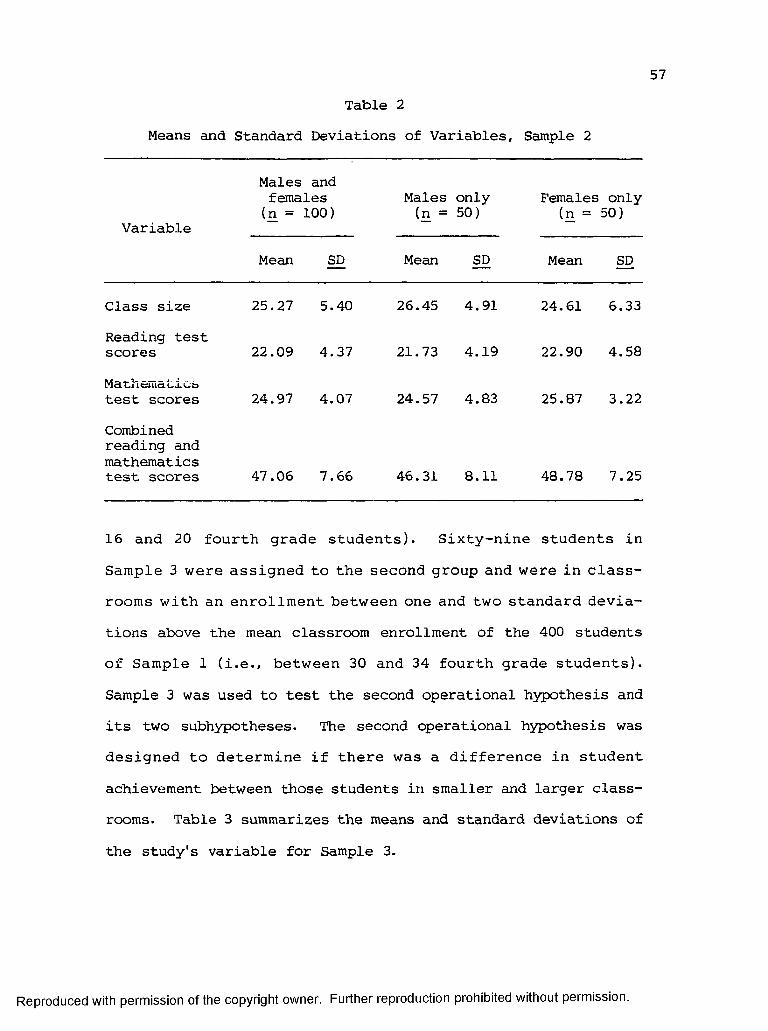
57Table 2
Means and Standard Deviations of Variables, Sample 2
Variable
Males and females (n = 100)
Males (n =
only50)
Females (n =
only50)
Mean SD Mean SD Mean SD
Class size 25.27 5.40 26.45 4.91 24.61 6.33Reading test scores 22.09 4.37 21.73 4.19 22.90 4.58Mathematics test scores 24.97 4.07 24.57 4.83 25.87 3.22Combined reading and mathematics test scores 47.06 7.66 46.31 8.11 48.78 7.25
16 and 20 fourth grade students). Sixty-nine students in Sample 3 were assigned to the second group and were in classrooms with an enrollment between one and two standard deviations above the mean classroom enrollment of the 400 students of Sample 1 (i.e., between 30 and 34 fourth grade students). Sample 3 was used to test the second operational hypothesis and its two subhypotheses. The second operational hypothesis was designed to determine if there was a difference in student achievement between those students in smaller and larger classrooms. Table 3 summarizes the means and standard deviations of the study's variable for Sample 3.
R eproduced with perm ission of the copyright owner. Further reproduction prohibited without perm ission.

58Table 3
Means and Standard Deviations of Variables, Sample 3
Variable
Class16(n
size = to 20 = 30)
Class30(n
size = to 34 = 69)
Mean SD Mean SD
Class size 19.38 1.39 31.82 1.21Reading test scores 23.03 3.33 21.21 4.97
Mathematics test scores 25.72 3.17 25.41 3.06Combined reading mathematics test
andscores 48.76 5.54 46.62 7.13
Class Size
The mean class size enrollment for the entire group of 400 students provided by NCS was 25.34 with a standard deviation of5.04. The mean class size of the 200 males was higher than the females. The standard deviation of the mean class size of the males was smaller than that of the females indicating smaller variation in the class size of the males than the females.
The mean class size enrollment of the 100 students included in Sample 2 (which was derived from the group of 400 students) was 25.27 with a standard deviation of 5.40, both similar to the class size mean and standard deviation of Sample
1. The 50 males had an average class size enrollment of 1.83 more students per classroom than the females. The standard
R eproduced with perm ission of the copyright owner. Further reproduction prohibited without perm ission.

5 9
deviation of the mean classroom enrollment was 1.42 smaller for males than for females, again indicating smaller variation in class size of the males than the females.
The mean class size of the entire 99 students of Sample 3 was 27.82 with a standard deviation of 5.97. The 30 students from the smaller classes had a mean class size enrollment of 19.38, while the 69 students from the classrooms with larger enrollments had a mean class size enrollment of 31.82. Not surprising, given the methodology of the study, the standard deviation of the mean class size enrollment for both students from the classrooms with the smaller enrollment and the students from the classrooms with the larger enrollments was less than 1.5, much smaller than with 400 students included with Sample 1 or the 100 students included with Sample 2, each of which included a full range of class sizes.
Combined Reading and Mathematics Test Scores
The mean combined reading and mathematics test score for Sample 1, the group of 400 students, was 46.56 with a standard deviation of 7.78. When the 200 males of this group were considered separately from the 200 females, one observes that the mean combined reading and mathematics test score of the males was lower than the females' score. The mean combined reading and mathematics test score and standard deviation of Sample 2, the group of 100 students derived from Sample 1, was similar to the group of 400 students. As with the group of 200
R eproduced with perm ission of the copyright owner. Further reproduction prohibited without perm ission.

60male students of Sample 1, the 50 male students of Sample 2 experienced a mean combined reading and test score lower than the females. As expected, the 30 students of Sample 3, from classrooms with smaller enrollments, had a higher combined reading and mathematics mean test score with a smaller standard deviation than the 69 students from the classrooms with larger enrollments.
The combined reading and mathematics mean test score, when added to the appropriate standard deviation, exceeded the maximum test score possible for each group, regardless of sex or class size. This was the case with the 400 students of Sample 1, the 200 males of Sample 1, the 200 females of Sample 1, the 100 students of Sample 2, the 50 males of Sample 2, the 50 females of Sample 2, the entire 99 students of Sample 3, the 30 students of Sample 3 from the classrooms with smaller enrollments, and the 69 students of Sample 3 from the classrooms with larger enrollments.
Reading Test Scores
The mean reading test score for Sample 1, the group of 400 students, was 21.64 with a standard deviation of 4.73. As with the combined reading and mathematics mean test score, when the mean reading test score was considered separately by sex, one observes that the 200 male students scored lower than female students. The mean reading test score for the 100 students of Sample 2 was 22.09 with a standard deviation of 4.37. As with
R eproduced with perm ission of the copyright owner. Further reproduction prohibited without perm ission.

61the group of 400 students, when the mean reading test scores were considered separately by sex, the 50 males scored lower than the females. The mean reading test score of the entire 99 students of Sample 3 was 21.53 with a standard deviation of 4.57. As expected, the 30 students from the classrooms with smaller enrollments had a higher mean reading test score than the 69 students from the classrooms with higher enrollments.
As was the case with the combined reading and mathematics mean test scores, mean reading test scores, when added to the appropriate mean reading test score standard deviation, exceeded the maximum reading test score possible for each group, regardless of sex or class size. Again, this was the case with the 400 students of Sample 1, the 200 males of Sample 1, the 200 females of Sample 1, the 100 students of Sample 2, the 50 males of Sample 2, the 50 females of Sample 2, the entire 99 students of Sample 3, the 30 students of Sample 3 from the classrooms with smaller enrollments, and the 69 students of Sample 3 from the classrooms with larger enrollments.
Mathematics Test Scores
The mean mathematics test score for Sample 1, the group of 400 students, was 24.92 with a standard deviation of 3.88. The mean mathematics test score of the 200 males was less than the mean score of the 200 females. The mean mathematics test score for Sample 2, the group of 100 students, was 24.97 with a standard deviation of 4.07. As with the mean combined reading
R eproduced with perm ission of the copyright owner. Further reproduction prohibited without perm ission.

6 2
and mathematics test scores and reading test scores, the mean mathematics test score of the 50 females included with Sample 2 exceeded the mean score of the males. The mean mathematics test score of the entire 99 students of Sample 3 was 25.41 with a standard deviation of 3.08. Again, as with the mean combined reading and mathematics test scores and the mean reading test scores, the 30 students from the classrooms with a smaller enrollment had a higher mean mathematics test score than the 69 students from the classrooms with larger enrollments.
Again, as was the case with both combined reading and mathematics mean test scores and when only mean reading test scores were considered, the mean mathematics test scores added to the appropriate standard deviation, exceeded the maximum mathematics test score possible for each group, regardless of sex or class size. Again, this was the case with the 400 students of Sample 1, the 200 males of Sample 1, the 200 females of Sample 1, the 100 students of Sample 2, the 50 males of Sample 2, the 50 females of Sample 2, the entire 99 students of Sample 3, the 30 students of Sample 3 from the classrooms with smaller enrollments, and the 69 students of Sample 3 from the classrooms with larger enrollments.
Tests of the First Operational Hypothesis and Its Subhypotheses
The results of the tests of the study's first operational hypothesis and subhypotheses are presented in this section.
R eproduced with perm ission of the copyright owner. Further reproduction prohibited without perm ission.

63The test of the correlation coefficients of two population variables was used with the first operational hypothesis and its eight subhypotheses that addressed the relationship of class size and student achievement. Sample 2 was used in each of these tests.
The Relationship of Class Size and Achievement in Reading and Mathematics for Both Males and Females
The literature of Glass and Smith (1978), Balow (1969), and others indicated that it was reasonable to assume that there would be an inverse relationship between class size and student achievement. The first operational hypothesis of this study was that there is an inverse relationship between fourth grade students' class size, for both males and females, and the student achievement as measured by the students' fourth grade combined reading and mathematics MEAP (Michigan State Board of Education, 1988) test scores. The results of the test of the correlation coefficient of the two variables, class size and combined MEAP reading and mathematics test scores for Sample 2, determined that support does not exist for the operational hypothesis since the value of the correlation coefficient was -.097. (For purposes of comparison, the correlation coefficient for these two variables for Sample 1 [200 males and 200 femalesJ was -.090). Table 4 summarizes the test of the first operational hypothesis.
R eproduced with perm ission of the copyright owner. Further reproduction prohibited without perm ission.

64Table 4
Correlation Coefficient of Class Size of Males and Females and Combined Reading and
Mathematics Scores (n = 100)
Variable Mean SD r ^ v
Class size 25.27 5.40
Combined reading and mathematics score 47.06 7.66
-.097 -.24
The Relationship of Class Size and Achievement in Reading for Both Males and F anales
The first subhypothesis extended from the first operational hypothesis was that it was reasonable to assume that there would be an inverse relationship between fourth grade students' class size, for both males and females, and the students' achievement as measured by the fourth grade MEAP (Michigan State Board of Education, 1988) reading test scores. The results of the test of the correlation coefficient of these two variables, class size and reading test scores for Sample 2, determined that support does not exist for the first operational hypothesis's first subhypothesis since the value of the correlation coefficient was -.115. (For purposes of comparison, the correlation coefficient for these two variables for Sample 1 [200 males and 200 females] was -.100.) Table 5
R eproduced with perm ission of the copyright owner. Further reproduction prohibited without perm ission.

6 5
summarizes the test of the first subhypothesis extended from the first operational hypothesis.
Table 5Correlation Coefficient of Class Size of Males
and Females and Reading Scores (n = 100)
Variable Mean SD r £cv
Class size 25.27 5.40-.115 -.24
Reading score 22.09 4.37
The Relationship of Class Size and Achievement in Mathematics for Both Males and Females
The second subhypothesis extended from the first operational hypothesis was that it was reasonable to assume that there would be an inverse relationship between fourth grade students' class size, for both males and females, and the students' achievement as measured by their fourth grade MEAP (Michigan State Board of Education, 1988) mathematics test scores. The results of the test of the correlation coefficient of these two variables, class size and mathematics test scores for Sample 2, determined that support does not exist for the first operational hypothesis's second subhypothesis since the value of the correlation coefficient was -.016. (For purposes of comparison, the correlation coefficient for these two
R eproduced with perm ission of the copyright owner. Further reproduction prohibited without perm ission.
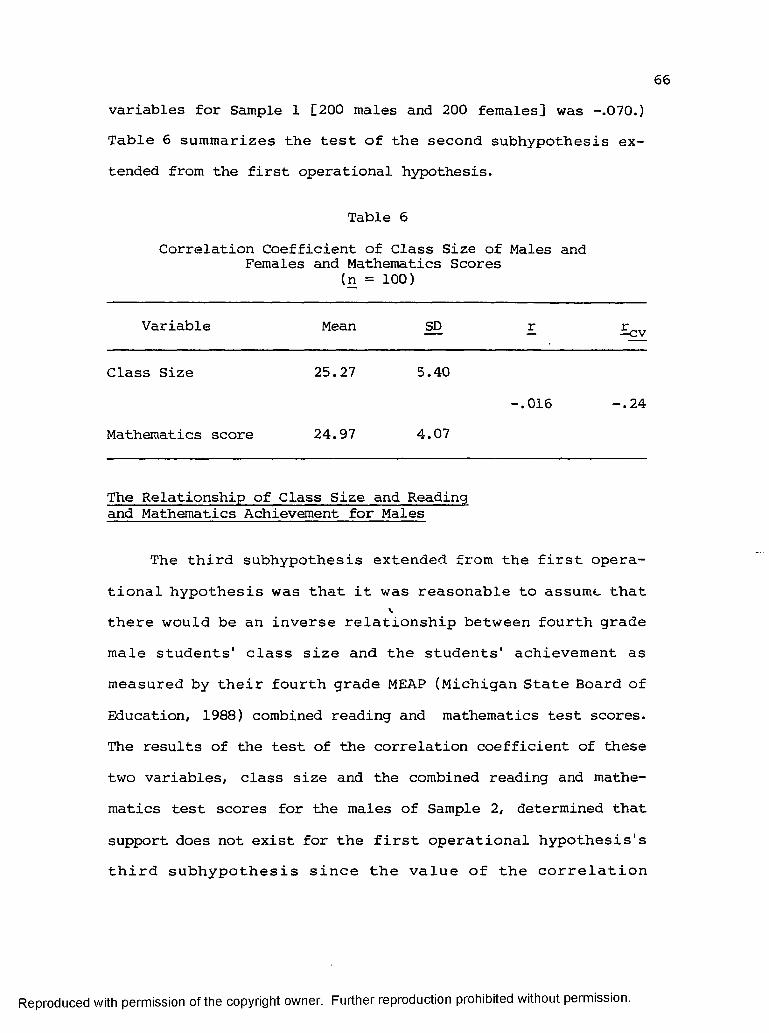
66variables for Sample 1 [200 males and 200 females] was -.070.) Table 6 summarizes the test of the second subhypothesis extended from the first operational hypothesis.
Table 6Correlation Coefficient of Class Size of Males and
Females and Mathematics Scores (n = 100)
Variable Mean r % v
Class Size 25.27 5.40-.016 -.24
Mathematics score 24.97 4.07
The Relationship of Class Size and Reading and Mathematics Achievement for Males
The third subhypothesis extended from the first operational hypothesis was that it was reasonable to assume that there would be an inverse relationship between fourth grade male students' class size and the students' achievement as measured by their fourth grade MEAP (Michigan State Board of Education, 1988) combined reading and mathematics test scores. The results of the test of the correlation coefficient of these two variables, class size and the combined reading and mathematics test scores for the males of Sample 2, determined that support does not exist for the first operational hypothesis's third subhypothesis since the value of the correlation
R eproduced with perm ission of the copyright owner. Further reproduction prohibited without perm ission.

6 7
coefficient was .005. (For purposes of comparison, the correlation coefficient for these two variables for Sample 1 [200 males] was zero.) Table 7 summarizes the test of the third subhypothesis extended from the first operational hypothesis.
Table 7Correlation Coefficient of Class Size of Males and
Combined Reading and Mathematics Scores (n = 50)
Variable Mean r -Ecv
Class size 26.45 4.91
Combined reading and mathematics score 46.31 8.11
.005 -.332
The Relationship of Class Size and Achievement in Reading for Males
The fourth subhypothesis extended from the first operational hypothesis was that it was reasonable to assume that there would be an inverse relationship between fourth grade male students' class size and the students' reading achievement as measured by their fourth grade MEAP (Michigan State Board of Education, 1988) reading test scores. The results of the test of the correlation coefficient of these two variables, class size and the reading test scores for the males of Sample 2, determined that support does not exist for the first operational hypothesis's fourth subhypothesis since the value of the
R eproduced with perm ission of the copyright owner. Further reproduction prohibited without perm ission.

68correlation coefficient was -.041. (For purposes of comparison, the correlation coefficient for these two variables for Sample 1 [200 males j was .020.) Table 8 summarizes the test of the fourth subhypothesis extended from the first operational hypothesis.
Table 8Correlation Coefficient of Class Size
of Males and Reading Scores (n = 50)
Variable Mean SD £ £cv
Class size 26.45 4.91-.041 -.332
Reading score 21.73 4.19
The Relationship of Class Size and Achievement in Mathematics for Males
The fifth subhypothesis extended from the first operational hypothesis was that it was reasonable to assume that there would be an inverse relationship between fourth grade male students' class size and the students' mathematics achievement as measured by their fourth grade MEAP (Michigan State Board of Education, 1988) mathematics test scores. The results of the test of the correlation coefficient of these two variables, class size and the mathematics test scores for the males of Sample 2, determined that support does not exist for
R eproduced with perm ission of the copyright owner. Further reproduction prohibited without perm ission.

6 9
the first operational hypothesis's fifth subhypothesis since the value of the correlation coefficient was .040. (For purposes of comparison, the correlation coefficient for these two variables for Sample 1 [200 males] was -.020). Table 9 summarizes the test of the fifth subhypothesis extended from the first operational hypothesis.
Table 9Correlation Coefficient of Class Size of Males
and Mathematics Scores (n = 50)
Variable Mean SD r
Class Size 26.45 4.91.040 -.332
Mathematics score 24.57 4.83
The Relationship of Class Size and Achievement in Reading and Mathematics for Females
The sixth subhypothesis extended from the first operational hypothesis was that it was reasonable to assume that there would be an inverse relationship between fourth grade female students' class size and the students' achievement as measured by their fourth grade MEAP (Michigan State Board of Education, 1988) combined reading and mathematics test scores. The results of the test of the correlation coefficient of these two variables, class size of female students and the combined
R eproduced with perm ission of the copyright owner. Further reproduction prohibited without perm ission.

70reading and mathematics MEAP test scores for the females of Sample 2, determined that support does not exist for the first operational hypothesis's sixth subhypothesis since the value of the correlation coefficient was -.149. (For purposes of comparison, the correlation coefficient for these two variables for Sample 1 [200 females] was -.200.) Table 10 summarizes the test of the sixth subhypothesis extended from the first operational hypothesis.
Table 10Correlation Coefficient of Class Size of Females
and Combined Reading and Mathematics Scores(n = 50)
Variable Mean SD r % v
Class size 24.61 6.33
Combined reading and mathematics score 48.78 7.25
-.149 -.332
The Relationship of Class Size and Achievement in Reading for Females
The seventh subhypothesis extended from the first operational hypothesis was that it was reasonable to assume that there would be an inverse relationship between fourth grade female students' class size and the students' reading achieve
ment as measured by their fourth grade MEAP (Michigan State Board of Education, 1988) reading test scores. The results of
R eproduced with perm ission of the copyright owner. Further reproduction prohibited without perm ission.

71the test of the correlation coefficient of these two variables, class size of the female students and the reading test scores for the females of Sample 2, determined that support does not exist for the first operational hypothesis's seventh subhypothesis since the value of the correlation coefficient was -.210. (For purposes of comparison, the correlation coefficient of these two variables for Sample 2 [200 females] was -.220.) Table 11 summarizes the test of the seventh subhypothesis extended from the first operational hypothesis.
Table 11Correlation Coefficient of Class Size
of Females and Reading Scores (n = 50)
Variable Mean SD r £çv
Class size 24.61 6.33-.210 -.332
Reading score 22.90 4.58
The Relationship of Class Size and Achievement in Mathematics for Females
The eighth subhypothesis extended from the first operational hypothesis was that it was reasonable to assume that there would be an inverse relationship between fourth grade female students' class size and the students' mathematics achievement as measured by their fourth grade MEAP (Michigan
R eproduced with perm ission of the copyright owner. Further reproduction prohibited without perm ission.

72State Board of Education, 1988) mathematics test scores. The results of the test of the correlation coefficient of these two variables, class size of the female students and the mathematics test scores for the females of Sample 2, determined that support does not exist for the first operational hypothesis's eighth subhypothesis since the value of the correlation coefficient was -.033. (For purposes of comparison, the correlation coefficient for these two variables for Sample 1 [200 females] was -.120.) Table 12 summarizes the test of the eighth subhypothesis extended from the first operational hypothesis.
Table 12Correlation Coefficient of Class Size of Females
and Mathematics Scores (n = 50)
Variable Mean SD r ■ï v
Class Size 24.61 6.33-.033 -.332
Mathematics score 25.87 3.22
Summary of the Tests of the First Operational Hypothesis and Its Eight Subhypotheses
The study's first operational hypothesis, that it was assumed that there was an inverse relationship between class size and student achievement, and the eight subhypotheses extended from the first operational hypothesis were tested with
R eproduced with perm ission of the copyright owner. Further reproduction prohibited without perm ission.

73the study's Sample 2. Sample 2 consisted of 100 students, 50 males and 50 females, who completed the fall 1988 MEAP (Michigan State Board of Education, 1988) reading and mathematics test. The results of these tests demonstrate that neither the study's first operational hypothesis or any of its eight subhypotheses can be supported. A summary of the tests of the study's first operational hypothesis and the eight subhypotheses extended from it is demonstrated with Table 13.
Test of the Second Operational Hypothesis and Its Subhypotheses
The tests of the study's second operational hypotheses and two subhypotheses extended from it are presented in this section. The ;t test for independent means was used with the testing of the second operational hypothesis and its two subhypotheses that addressed the differences in achievement for students in classrooms with smaller enrollments and students in classrooms with larger enrollments. Sample 3 was used in each of these tests.
Class Size and Differences With Both Reading and Mathematics Achievement
The literature of Glass and Smith (1978), Balow (1969), and others indicated that it was reasonable to assume that there would be a difference in the achievement of students between those in classrooms with a smaller enrollment and those enrolled in classrooms with a larger enrollment and the
R eproduced with perm ission of the copyright owner. Further reproduction prohibited without perm ission.

CD■ DOQ.CgQ.
■ DCD
C/)Wo'303CD
8■D( O '3"13CD
"nc3.3"CD
CD■DOQ.CaO3■DOCDQ.
■DCD
(/)(/)
Table 13Summary of Computed Correlation Coefficients, Number of Subjects, Means and
Standard Deviations of Class Size, Means and Standard Deviations of Achievement, and Levels of Significance
Independent Dependentvariable
No. ofClass size Achievement
variable subjectsMean SD Mean SD
r £cv
Males and females
Reading and mathematics 100 25.27 5.40 47.06 7.66 -.097 -.240Reading 100 22.09 4.37 -.115 -.240Mathematics 100 24.97 4.07 -.016 -.240
Males Reading and mathematics 50 26.45 4.91 46.31 8.11 .005 -.332Reading 50 21.73 4.19 -.041 -.332Mathematics 50 24.57 4.83 .040 -.332
Females Reading and mathematics 50 24.61 6.33 48.78 7.25 -.149 -.332Reading 50 22.90 4.58 -.210 -.332Mathematics 50 25.87 3.22 -.033 -.332

7 5
difference in achievement would be greater for those students in the classrooms with a smaller enrollment. Class size was the independent variable with the t test for independent means. The results of the ;t test for independent means of the dependent variable, the combined reading and mathematics test scores for the students of Sample 3, determined that support does not exist for the second operational hypothesis since the value of t was 0.897, not exceeding the critical value of t, which was 1.668. Table 14 summarizes the test of the second operational hypothesis.
Table 14Test of Difference for Independent Means— Achievement
in Both Reading and Mathematics
Classsize n
Meanachievement SD ^ t* icv
16-20 30 48.76 5.5472.53 0.897 1.668
30-34 69 46.62 7.13
*£ > .05.
Class Size and Achievement Differences in Reading
The first subhypothesis extended from the second operational hypothesis was that it was reasonable to assume that there would be a difference in the reading achievement of students between those in classrooms with a smaller enrollment
R eproduced with perm ission of the copyright owner. Further reproduction prohibited without perm ission.

76and those in classrooms with a larger enrollment and that the difference in achievement would be greater for those students in the classrooms with a lower enrollment. Class size was the independent variable with the t test for independent means. The dependent variable with the _t test for independent means with the first subhypothesis of the second operational hypothesis was fourth grade students' student achievement as measured by their fourth grade MEAP (Michigan State Board of Education, 1988) reading test scores. The results of the t test for independent means of the dependent variable, the reading test stores for the students of Sample 3, determined that support does not exist for the first subhypothesis of the second operational hypothesis since the value of t was 1.557, not exceeding the critical value of t, which was 1.666. Table 15 summarizes the test of the first subhypothesis extended from the second operational hypothesis.
Table 15Test of Difference for Independent Means—
Reading Achievement
Classsize n
Meanachievement SD t*
16-20 30 23.03 3.3369.31 1.557 1.666
30-34 69 21.21 4.97
*£ > .05,
R eproduced with perm ission of the copyright owner. Further reproduction prohibited without perm ission.

77
Class Size and Achievement Differences in Mathematics
The second subhypothesis extended from the second operational hypothesis was that it was reasonable to assume that there would be a difference in the mathematics achievement of students between those in classrooms with a smaller enrollment and those in classrooms with a larger enrollment and that the difference in achievement would be greater for those students in the classrooms with a lower enrollment. Class size was the independent variable with the _t test for independent means. The dependent variable with the ;t test for independent means with the second subhypothesis of the second operational hypothesis was the fourth grade students' achievement as measured by their fourth grade MEAP (Michigan State Board of Education, 1988) mathematics test scores. The results of the jt test for independent means of the dependent variable, the mathematics test scores for the students of Sample 3, determined that support does not exist for the second subhypothesis of the second operational hypothesis since tlie value of t was -0.258, not exceeding the critical value of t, which was 1.673. Table 15 summarizes the test of the second subhypothesis extended from the second operational hypothesis.
Summary of the Tests of the Second Operational Hypothesis and Its Two Subhypotheses
The study's second operational hypothesis, that it was assumed that there was a difference in the achievement of
R eproduced with perm ission of the copyright owner. Further reproduction prohibited without perm ission.

78Table 16
Test of Difference for Independent Means— Mathematics Achievement
Classsize n
Meanachievement SD t* ■îov
16-20 30 25.72 3.1756.42 -0.258 1.673
30-34 69 25.41 3.06
*2 .05.
fourth grade students between those in classrooms with a smaller enrollment and those in classrooms with a larger enrollment and that the difference in achievement would be greater for those students in the classrooms with a lower enrollment, and the two subhypotheses extended from the second operational hypothesis were tested with the study's Sample 3. Sample 3 consisted of 99 fourth grade students who completed the fall 1988 fourth grade MEAP (Michigan State Board of Education, 1988) reading and mathematics test. The results of these
tests demonstrate that neither the study's second operational hypothesis nor either of its two subhypotheses can be supported .
R eproduced with perm ission of the copyright owner. Further reproduction prohibited without perm ission.

CHAPTER V
CONCLUSIONS AND RECOMMENDATIONS
Introduction
This study was designed to determine if there is an inverse relationship between class size and fourth grade student achievement. The independent variable of the study was the class size of fourth grade students. The dependent variables of the study were the fourth grade students' achievement as measured by the fall 1988 fourth grade MEAP (Michigan State Board of Education) reading, mathematics, and combined reading and mathematics test scores. Chapter V conclusions are based on the results of the study. The chapter also includes discussion of the findings and suggestions for future research, as well as a summary of the study. ^
Conclusions
The conclusions reached as a result of hypothesis and subhypotheses testing indicate that the data analysis did not demonstrate support of the study's first operational hypothesis, that an inverse relationship exists between class size and student achievement. The conclusions reached as a result of hypothesis and subhypotheses testing indicate that the data analysis did not demonstrate support of the study's second
79
R eproduced with perm ission of the copyright owner. Further reproduction prohibited without perm ission.

80operational hypothesis, that there is a difference in student achievement between those in classrooms with a smaller enrollment and those in classrooms with a larger enrollment and that achievement favored those students in classrooms with smaller enrollment. Regardless, it cannot be concluded (due to the potential of committing a Type II error) that there is no relationship between class size and achievement. In seven of the total of nine tests of the first operational hypothesis and its eight subhypotheses, the relationship was in the expected direction. In the total of three tests of the second operational hypothesis and its two subhypotheses, two positive values of the test statistic t were identified.
Discussion of Results
In view of the literature previously cited, especially the work of Glass and Smith (1978; M. L. Smith & Glass, 1979) and Balow (1969), one is left to speculate as to why there were no inverse relationships or differences in achievement found or evidenced in the results of this study. Logic and literature point to the relatively high mean achievement test scores in concert with the relatively low standard deviations of those mean test scores as a reason for these results.
The relatively high test score means and accompanying low
standard deviation of mean test scores were found with each of the three samples considered with this study. In considering achievement for the three samples (n = 400, n = 100, and
R eproduced with perm ission of the copyright owner. Further reproduction prohibited without perm ission.

81n = 99), 21 separate mean test scores and standard deviations of those mean test scores were computed (i.e., male and female combined reading and mathematics test scores, male and female reading test scores, male and female mathematics test scores, male combined reading and mathematics test scores, male reading test scores, male mathematics test scores, female combined reading and mathematics test scores, female reading test scores, and female mathematics test scores). In every case, the mean of each of these test scores, plus the appropriate standard deviation of each, when added together exceeded the maximum MEAP (Michigan State Board of Education, 1988) test score possible.
The Michigan State Board of Education acknowledges that a feature of criterion referenced tests, such as MEAP, (Michigan State Board of Education, 1988), is that they do not have a normative distribution of scores and that the variation of scores may be limited. Tests such as MEAP are not designed to predict behavior. "The test itself is the criterion of performance" (Phelps et al., 1980, p. 26). "When there is a restricted range of scores on either or both of the variables, the correlation coefficient will be smaller" (Hinkle et al., 1979, p. 82).
The inability of MEAP (Michigan State Board of Education, 1988), like most criterion referenced tests, to provide, by design, a normative distribution, may, in part, have resulted in the statistical measures of this study to underestimate both
R eproduced with perm ission of the copyright owner. Further reproduction prohibited without perm ission.

82relationships and differences in class size and achievement. The MEAP test's limited number of test items (i.e., only three questions per objective) further results in smaller variation of test scores. Finally, one can suspect that there is some truth to the charges of "teaching to the test" given the nature of the publication of MEAP test score results, including the comparison of scores by school district, in many of Michigan's larger newspapers, results in generally higher than expected scores (Bemis, 1989).
Recommendations
This study was confined to fourth grade students who completed the fall 1988 MEAP (Michigan State Board of Education) fourth grade reading and mathematics tests. With major changes in the MEAP test possible in the coming years, it would be inappropriate to generalize the findings of this study beyond 1988. Nevertheless, the findings of this study should be considered by policy makers, both in the legislature, Michigan Department of Education, and local boards of education, when considering the class size issue.
While a great deal of research on the issue of class size and student achievement has been completed, as noted in Chapter II, further research is recommended. Policy makers should have current and reliable research data prior to decision making on the iss'"1 of mandated class size and or providing incentives for school districts maintaining certain class sizes.
R eproduced with perm ission of the copyright owner. Further reproduction prohibited without perm ission.

83Two additional research questions that remain are:
(a) Might the results and findings be different if this study were replicated with the dependent variables being the fall 1989 MEAP reading and mathematics test scores if the fall 1989 MEAP test represents major changes from the test of the fall 1988? (b) How might the results and findings be different ifthis study were replicated with the dependent variables being the scores from a national norm referenced test? Addressing either of these two research questions would provide additional important data to policy makers regarding the issue of class size and achievement.
A replication of this study, with the additional control on teaching methodologies, would be helpful. Such a study would involve the identification of a group of teachers who primarily use individualized teaching methodologies and the identification of a group of teachers who primarily use large/ whole group teaching methodologies. Through a factorial design, the academic achievement of the students, as measured by MEAP test scores, in the classrooms with a smaller enrollment and the students in classrooms with larger enrollments that are characterized by individualized teaching methodologies could be compared to each other, as well as, the academic achievement of students in classrooms with smaller enrollments and the students in classrooms with larger enrollments that are characterized by large/whole group teaching methodologies.
R eproduced with perm ission of the copyright owner. Further reproduction prohibited without perm ission.

84Summary
In this study the relationship and differences in student achievement and class size were investigated. The population of the study was the 111,199 students who completed the fall 1988 Michigan Educational Assessment Program (MEAP, Michigan State Board of Education) fourth grade test. The MEAP is a criterion referenced test and is the state of Michigan's only achievement test.
The independent variable of the study was class size. The dependent variables of the study were student achievement as measured by the students fall 1988 MEAP (Michigan State Board of Education) reading, mathematics, and combined reading and mathematics test scores. The hypothesis of the study, supported by the findings of Glass and Smith (1978; M. L. Smith & Glass, 1979), was that there is an inverse relationship between class size and student achievement.
Data for completing the research design and statistical analysis were secured from National Computer Systems (NCS), the firm which completes all MEAP (Michigan State Board of Education, 1988) computer reporting services for the Michigan Department of Education. A listing of 400 students' (200 males and 200 females), class size, MEAP test scores for reading, mathematics, and the sex of each student was provided by NCS and identified as the study's first sample. A second sample and a third sample were derived from the original listing of
R eproduced with perm ission of the copyright owner. Further reproduction prohibited without perm ission.

85400 students that allowed the testing of two operational hypotheses .
The results of the hypotheses testing were not able to support the existence of an inverse relationship between class size and student achievement as measured by the fourth grade MEA.P (Michigan State Board of Education, 1988) reading, mathematics, or combined reading and mathematics test scores. The relatively high test scores, absence of a normal distribution of test scores, and the resulting limited variation of test scores, all of which can be expected with a criterion referenced test, were identified as suspected explanations for the findings of the study. Suggestions made for further research included replication of the study with the use of a national norm referenced test of achievement, replication of the study when and if the MEAP test is modified, and replication of Llie study using a factorial design which allows for controlling of teacher methodologies.
R eproduced with perm ission of the copyright owner. Further reproduction prohibited without perm ission.

A PPEN DICES
86
R eproduced with perm ission of the copyright owner. Further reproduction prohibited without perm ission.

Appendix A
Contract and Communications With National Computer Services
87
R eproduced with perm ission of the copyright owner. Further reproduction prohibited without perm ission.

88INFORMATION SERVICES
QUOTATION
Customer Ralph Burde Date 2-10-89Brief Title Providing 1988-89 HEAP Data for Selected Grade 4 Students____
PRICE: $966.00 WORK STATEMENT
NCS will use the 1988-89 individual student MEAP data tape (alphabetical by school) to randomly select 400 grade 4 students according to an interval specified by Dr. E. Roeber or a designee of Mr. Burde. The sample will be selected such that it will yield 200 males and 200 females. For each of these selected students, the following information will be provided:
1. School number,2. district number,3. total number of core reading objectives attained,4. total number of core math objectives attained,5. total class size, and6. sex of student
Because students are not grouped by classroom on the data tape, a name matchwill be used to identify the total number of fourth graders within a schoolwho have the same teacher name in their records as that in the record of the selected student. No individual student names will be provided on the printout.
Both a data tape and a hard copy listing will be provided.V
MICHIGAN DEPARTMENT OF EDUCATION NATIONAL COMPUTER SYSTEMS, INC.^By: ____________________________ By: ATitle: _________________________ Title: ______Date: _________________________ Date: D j ! O / )?
R eproduced with perm ission of the copyright owner. Further reproduction prohibited without perm ission.
89
P ost O llice Box 30, Iowa City, lA 52244 / Phone 319 354 9200 NATIONALCOMPUTERSYSTEMSINFORMATION SERVICES
f£Bl4 1989February 10, 1989
Mr. Ralph Burde Superintendent Newaygo Public Schools 360 3. Mill St.Newaygo, MI 49337Dear Mr. Burde:Enclosed is a Work Statement describing the process NCS will use to provide you with the grade 4 Meap data you need for your study. Please sign it and return it to my attention.The price quoted is good for sixty (60) days from the date of this letter.
We will invoice you when the work is complete.I wish you luck with your study and your degree pursuit!
Sincerely,
Ô- CO-ÙC>Jr<.LiMartha S. Caswell Manager, Marketing Supportcc: M. Larson
E. Roeber, MDE R. Trolliet
Enel.MC : sc
R eproduced with perm ission of the copyright owner. Further reproduction prohibited without perm ission.

90
NATIONALCOMPUTERSYSTEMS INVOICE
P L -A S E IN D IC A TE INVOICE NUM BER W HEN PAYMENT IS l.'ADE
FE D ER A L 1 .0. N O . 41-CH50527 AN EQ U A L O P P O R T U N IT Y EMPLOYER INVpiCEtNO.»..
901077:. ■X V . ' .r )
Date: 02/24/89
'harge to Customer -Customer Code :Z000038171 Name/Address : NEWAYGO PUBLIC SCHOOLS
ATTENTION:HR. RALPH BURDE SUPERINTENDENT 360 SOUTH MILLAN ST.
NEWAYGO, HI 49337
Contract Number:Requisition Number:Cust. Order Number:
Cust. Order Date: 02/01/89 j'eneral Order Number: H90rJS34
REMIT TO:National ; Computer Systems, ISC. Dept. L175PPittsburgh, Pa. 15264-0175
INQUIRIES;National Computer SystemsInformation ServicesP.O. Box 30Iowa City, la 52244319/339-6628 - ACCOUNTS RECEIVAlil
Terms: NET ON PRESENTATION Page -
TEHN O DESCRIPTION
PRODUCTCODE
U N IT OF
MEASURE
HEAP DATA TAPE BIE9Î6170
A
"W E C E R T IF Y T H A T T H E M A T E R IA L S A N D S E R V IC E C O V E R E D B Y T H IS IN V O IC E W E R E P R O D U C E D A N D R E N D E R E D IN C O N F O R M IT Y W IT H THE F A IR LA B O R S T A N D A R D S A C T O F 1939 . A S A M E N D E D . A N D TH E R E G U L A T IO N S A N D O R D E R S O F THE U N IT E D S T A T E S D E P A R T M E N T O F L A B O R .'
INVOICETOTAL
CUSTOMER copy
R eproduced with perm ission of the copyright owner. Further reproduction prohibited without perm ission.

Appendix B
Listing of 400 Randomly Selected Students Fall 1988 Michigan Educational Assessment Reading and
Mathematics Tests Scores and Class Size of Each Student
91
R eproduced with perm ission of the copyright owner. Further reproduction prohibited without perm ission.

PLEASE NOTE:
Copyrighted m aterials in this docum ent have not been filmed at the request of the author. They are available for consultation, however, in the author’s university library.
These consist of pages;
Ap p e n d ix B 9 2 - 9 9
UMI
R eproduced with perm ission of the copyright owner. Further reproduction prohibited without perm ission.

Appendix C
Human Subjects Review Board Approval of Protocol
100
R eproduced with perm ission of the copyright owner. Further reproduction prohibited without perm ission.

H u m an S u b je c is Instilu tional Review B oard
101
K alam azoo . M ichigan 49008-3899
WESTERN M ic h ig a n u n iv e r s it y
TO: _ Ralph H. Burde, Jr.
FROM: Ellen Page-Robin, Chair
RE: Research Protocol
DATE: February 15, 1989
This letter will serve as confirmation that your research protocol, "A Study of the Relationship of Class Size and Student Achievement on the Michigan Educational Assessment Test" has been approved as exempt by the HSIRB.
R eproduced with perm ission of the copyright owner. Further reproduction prohibited without perm ission.

Appendix D
1988-89 Fourth Grade Michigan Educational Assessment Program Test
Note. Copyright 1988 by Michigan State Board of Education. Reprinted by permission. (Reduced to 80% of original)
102
R eproduced with perm ission of the copyright owner. Further reproduction prohibited without perm ission.

PLEASE NOTE:
Copyrighted m aterials in this docum ent have not been filmed at the request of the author. They are available for consultation, however, in the author’s university library.
These consist of pages:
App en di x D 1 0 3-17 1
UMI
R eproduced with perm ission of the copyright owner. Further reproduction prohibited without perm ission.

BIBLIOGRAPHY
Albert, B. (1988, April 2). PRIME TIME overrated study claims. Indianapolis Star, p. D2.
Albritton, T. (1984). A review of recent literature on the effects of class size, with implications for English and language arts instruction. Unpublished manuscript. (ERIC Document Reproduction Service No. ED 248 517)
Applebee, A. N. (1978). A survey of teaching conditions in English. Research in the Teaching of English, 12, 339-348.
Ary, D., Jacobs, L. C., & Razavieh, A. (1979). Introduction to research in education (2nd ed.). New York: Holt,
. Rinehart and Winston.Bain, H. P. (1986). Small class size once again: An experi
ment in grades one, Metro-Nashville Public Schools. Unpublished manuscript. (ERIC Document Reproduction Service No. ED 271 196)
Balow, I. H. (1969). A longitudinal evaluation of reading achievement in small classes. Elementary English, 46, 184-
Bem.is, D. L. (1989, April). Bemis sees teacher training, retraining key to science improvements. MASB Journal, pp. 6-7.
Bennett, S. (1987). New dimensions in research on class sizeand academic achievement. Unpublished manuscript. (ERIC Document Reproduction Services No. ED 288 854)
Berger, M. A. (1983). Class size is not the issue. Unpublished manuscript. (ERIC Document Reproduction Service No. ED 231 061)
Blake, H. (1954). Class size: A summary of selected studiesin elementary and secondary schools. Unpublished doctoral dissertation, Columbia University, New York.
Cacha, F. B. (1982). The class size and achievement controversy. Contemporary Education, 54(1), 13-16.
172
R eproduced with perm ission of the copyright owner. Further reproduction prohibited without perm ission.

173Cahen, L. S., & Filby, N. N. (1979). The class size/achieve
ment issue: New evidence and a research plan. Phi DeltaKappan, 60, 492-495, 538.
California Elementary School Administrators. (1966). Reports on class size. Childhood Education, 43(1), 11-13.
Cannon, G. M. (1966). Kindergarten class size. Childhood Education, 43(1), 9-11.
Carrington, T., Mourie, J. C., Meckens, P. E., & Lovelace, D. W. (1981). Class size project, 1980-81, final report. Virginia Beach, VA: Virginia Beach City Public Schools.(ERIC Document Reproduction Service No. ED 237 521)
Chang, S., & Ogletree, E. (1979). The effect of class size on academic achievement. Unpublished manuscript. (ERIC Document Reproduction Service No. ED 182 311)
Cotton, K., & Savard, W. C. (1980). Class size. Research on school effectiveness project; Topic summary report. Portland, OR: Northwest Regional Educational Laboratory.(ERIC Document Reproduction Service No. ED 214 705)
Educational Research Services. (1978). Class size: A summaryof research. Educational Digest, 44(4), 68-70.
Educational Research Services. (1979). Class size research: A critique of recent meta-analysis. Phi Delta Kappan, 62, 239-241.
Educational Research Services. (1980). Class size research; A critique of recent meta analysis. Arlington, VÂi Author.
Ferenbaugh, D., Nash, D., & Thompson, J. (1983, October 10). The bold quest for quality. Time, pp. 58-66.
Fisher, R. A., & Yates, F. (1974). Statistical tables for biological, agricultural, and medical research. New York: Hafner.
Flinker, I. (1972). Optimum class size: What is the magicnumber. Clearing House, 46, 471-473.
Frymier, J. R. (1964, November). The effect of class size upon reading achievement in first grade. The Reading Teacher, 18, 90-93.
Furno, O. F., & Collins, G. J. (1967). Class size and pupil learning. Baltimore, MD; Baltimore City Public Schools. (ERIC Document Reproduction Service No. ED 025 003)
R eproduced with perm ission of the copyright owner. Further reproduction prohibited without perm ission.

174Glass, G. V., Cahen, L. S., Smith, M. L., & Filby, N. N.
(1979). Class size and learning. Today's Education, 68(2), 42-44.
Glass, G. V., & Smith, M. L. (1978). Meta-analysis of research on the relationship of class size and achievement. San Francisco; Far West Laboratory for Education Research and Development.
Good, C. V. (1973). Dictionary of education. New York: McGraw-Hill.
Goodlad, J. I. (1960). Classroom organization. In C. W. Harris, Jr. (Ed.), Encyclopedia of educational research (pp. 171-178). New York: Macmillan.
Haddad, W. D. (1978). Educational effects of class size. Washington, DC: World Bank. (ERIC Document ReproductionService No. ED 179 003)
Halliman, M. T., & Sorenson, A. B. (1985). Class size,ability group size, and student achievement. American Journal of Education, 94(1), 71-89.
Halloran, M. (1984). Class size and academic achievement. Unpublished manuscript. (ERIC Document Reproduction Service No. ED 260 845)
Hedges, L. V., & Stock, W. (1983). The effects of class size: An examination of rival hypotheses. American Educational Research Journal, 20(1), 63-85.
Helmich, E., & Wasem, L. (1985). Class size for kindergartenand primary grades: A review of the research. Springfield:Illinois State Board of Education, Department of Planning, Research and Evaluation. (ERIC Document Reproduction Service No. ED 260 827)
Hess, F. (1978). Class size and student achievement. Unpublished manuscript! (ERIC Document Reproduction Service No. ED 158 394)
Hess, F. (1979). Class size revisited: Glass and Smith inperspective. East Syracuse, NY: Minoa Central Schools.(ERIC Document Reproduction Service No. ED 172 402)
Hinkle, D. E., Wiersma, W., & Jurs, S. G. (1979). Applied statistics for the behavioral sciences. Boston: HoughtonMifflin.
R eproduced with perm ission of the copyright owner. Further reproduction prohibited without perm ission.

175Horn, E. (1937). Methods of instruction in the social
studies. New York: Charles Scribner's Sons.Isaac, S., & Michael, W. B. (1981). Handbook in research and
evaluation. San Diego: EdiTS.Jencks, C. (1972). The Coleman report and the conventional
wisdom. In F. Mosteller & D. P. Moynihan (Eds.), On equality of educational opportunity (pp. 69-115). New York: Random House.
Johnson, L., & Garcia-Quintana, R. A. (1978a). South Carolinafirst grade pilot project, 1976-77. Columbia: SouthCarolina Department of Education. (ERIC Document Reproduction Service No. ED 151 088)
Johnson, L., & Garcia-Quintana, R. A. (1978b). South Carolinafirst grade pilot project, 1976-77, and the effects of classsize on reading and mathematics achievement. Columbia; South Carolina State Department of Education. (ERIC Document Reproduction Service No. ED 151 087)
Johnson, M., & Scriven, E. (1967). Class size and achievement gains in seventh and eighth English and mathematics. School Review, 75, 300-310.
Kean, M. H. (1979). What works in reading? Summary and results of a joint school district: Federal Reserve Bank empirical study in Philadelphia. Philadelphia: PhiladelphiaSchool District, Office of Research and Evaluation. (ERIC Document Reproduction Service No. ED 176 216)
Kerlinger, F. N. (1973). Foundations of behavioral research(2nd ed.). New York: Holt, Rinehart and Winston.
Larkin, A. I., & Keeves, J. P. (1984). The class size question: A study of different levels of analysis (ResearchMonograph, No. 26). Hawthorn, Australia: Australian Council for Educational Reseaich. (ERIC Document ReproductionService No. ED 261 017)
Laughlin, S. J. (1976). A sacred cow: Class size. College and University, 51, 339-347.
Levin, H. M., & Meister, G. (1986). Is CAI cost effective?Phi Delta Kappan, 67, 745-749.
Lindbloom, D. H. (1970). Class size as it effects instructional procedures and educational outcomes. Unpublished manuscript. (ERIC Document Reproduction Service No. ED 003 969)
R eproduced with perm ission of the copyright owner. Further reproduction prohibited without perm ission.

176Madden, J. V. (1968). An experimental study of student
achievement in general mathematics in relation to class size. School Science and Mathematics, 68, 619-622.
Madison Public Schools. (1976). Effects of class size on reading achievement in grades 1-3 in the Madison Metropolitan School District (1974-1976). Madison, WI; Author. (ERIC Document Reproduction Service No. ED 140 256)
Mayhew, H. C. (1983). published manuscript. No. ED 237 480)
Related literature on class size. Un- (ERIC Document Reproduction Service
Mazareas, J. (1981). Effects of class size on the achievement of first grade pupils (Doctoral Dissertation, Boston University, 1981). Dissertation Abstracts International, 42, 2490A.
McClusky, L. (1978). Class size or mode of instruction; What makes the difference in classroom process? Unpublished manuscript. (ERIC Document Reproduction Service No. ED 158 409)
McCormick, D. R. (1978). The controversial development of the Michigan Education Assessment Program, 1969-77 (Doctoral dissertation, Michigan State University, 1978). Dissertation Abstracts International, 39, 4090A.
Michigan Association of School Administrators. (1988). SJR K. MASA Fortnighter, 18(8), 1-2.
Michigan Association of School Boards. (1984). ports: Seven steps to excellence. Lansing:
Michigan Cottpiled School Aid Act, 1985-86.Michigan Compiled School Aid Act, 1986-87.Michigan Conpiled School Aid Act, 1987-88.Michigan State Board of Education. (1970, November 20). Un
published Minutes of meetings.Michigan State Board of Education. (1988). Michigan Educa
tional Assessment Program. Lansing: Author.
Michigan Department of Education. (1986). R 2749, 1985-86state aid financial status report. Lansing: Author.
Michigan Department of Education. (1987). R 2749, 1986-87state aid financial status report. Lansing: Author.
Education re- Author.
R eproduced with perm ission of the copyright owner. Further reproduction prohibited without perm ission.

177Michigan Department of Education. (1988). R 2749, 1987-88
state aid financial status report. Lansing: Author.Michigan Department of Education. (1989, January 24). Michi-
gan State Board of Education News. [Newsrelease]Murdock, J. B. (1985). The effects of age, gender, class
size, and school on academic achievement and social adjustment in grades one through five. Dissertation Abstracts International, 46, 2189A. (University Microfilms No.85-22,587)
Phelps, J. L., Donovan, D. L., Roeber, E. D., Carr, R. A., & Caswell, M. S. (1980). Technical report: Vols. 1-2.Michigan Educational Assessment Program. Lansing: MichiganState Board of Education.
Polley, I. (1969). The assessment of educational programs in Michigan. Memorandum to Michigan Department of Education.
Po’rwoll, P. (1978). Class size: A summary of research.Arlington, VA: Educational Research Services.
Public and local acts of the legislature, 1969. (1969).Public Acts 307 and 578.
Rice, J. M. (1903). Education research: A test of arithmetic. The Forum, 34, 281-297.
Roberts, D. B. (1988). Michigan Education Assessment Program handbook, 1988-89. Lansing: Michigan State Board of Educa-tion.
Shapson, S. M. (1980). Optimum class size? An experimental study of the effects of class size. American Educational Research Journal, 17, 141-152.
Slavin, R. (1984, October). Meta-analysis in education: Howhas it been used? Education Research, 13, 6-15.
Smith, H. (1970). Class size: Does it make a difference.Urbana, XL: National Council of Teachers of English. (ERICDocument Reproduction Service No. ED 058 210)
Smith, M. L., & Glass, G. V. (1979). The relationship of class-size to classroom processes, beacher satisfaction and pupil effect: A meta-analysis. San Francisco: Far WestLaboratory for Educational Research and Development.
R eproduced with perm ission of the copyright owner. Further reproduction prohibited without perm ission.

178Spitzer, H. F. (1954). Class size and pupil achievement in
elementary school. The Elementary School Journal, 43(10), 82-86.
Staten, T. V. (1980). Student performance and readability levels on the Stanford Achievement Test and the Michigan Educational Assessment Program Test (Doctoral dissertation. University of Michigan, 1980). Dissertation Abstracts International, 41, 1391A.
Stern, D. (1987). Teachers' salaries, class size, and student achievement in grades 3 and 6: Some new evidence. Unpublished manuscript. (ERIC Document Reproduction Service No. ED 288 241)
Stern, J. (1988). The condition of education. Washington, DC: U.S. Government Printing Office.
Swan, E. (1985). The educational effects of a state supported reduced class size prograrci; A comprehensive evaluation of Indiana's Project PRIME TIME at the North Gibson School Corporation. Terre Haute: Indiana State University, School ofEducation. (ERIC Document Reproduction Service No. ED 276 109)
Templeton, I. (1972). Class size (Educational Management Review Series, No. 8). Eugene: Oregon University. (ERICDocument Reproduction Service No. ED 066 779)
Tetter, T. A., Bradley, R. H., & Shull, R. B. (1983). Factors related to student achievement in Arkansas Schools: 1981-1982. (ERIC Document Reproduction Service No. ED 248 272)
Thompson, S. (1978). Class size (ACSA School Management Digest, Serial No. 12. ERIC/CEM Research Analysis Series No. 39). Eugene: Oregon University, Association of California School Administrators. (ERIC Document Reproduction Service No. ED 154 471)
University of North Carolina-Chapel Hill, School of Education. (1978). It bears asking. High School Journal, 62, 44-46.
Vignocchi, N. (1980). Research on the effect of class size on academic achievement. Unpublished manuscript. (ERIC Docu- ment Reproduction Service No. ED 190 508)
Woodson, M. S. (1968). Effect on class size as measured by an achievement test criterion. New York; Columbia University, New York Institute of Administrative Research. (ERIC Document Reproduction Service No. ED 021 320)
R eproduced with perm ission of the copyright owner. Further reproduction prohibited without perm ission.