the relationship between gender and student engagement in ...cpr.indiana.edu/uploads/gender and...
TRANSCRIPT
The Relationship between
Gender and Student Engagement in College
Jillian Kinzie1
Indiana University Bloomington
Robert Gonyea Indiana University Bloomington
George D. Kuh
Indiana University Bloomington
Paul Umbach University of Iowa
Charlie Blaich
Wabash College
Ali Korkmaz Indiana University Bloomington
1 Address correspondence to: Jillian Kinzie, Center for Postsecondary Research, 1900 E 10th St., #419 Eigenmann Hall, Indiana University, Bloomington, IN 47406. E-mail: [email protected] phone: 812-856-1430, Fax: 812-856-5150.
1
The Relationship between Gender and Student Engagement in College
Abstract
This paper examines the engagement patterns of male and female undergraduates in different
types of baccalaureate-granting institutions. Descriptive statistics and hierarchical linear
modeling show that on balance, undergraduate women participate more frequently than their
male counterparts in educationally purposeful activities. Male first-year and senior students
devote less time and effort to academic challenge tasks, such as working hard to meet
expectations and spending time studying; senior males also participated less often in active and
collaborative learning activities. Institutional type is unrelated to gender differences in
engagement. The results point to areas where institutions could focus efforts to enhance the
quality of the undergraduate experience for all students.
2
The Relationship between Gender and Student Engagement in College
For more than a quarter century, undergraduate women have outnumbered their male
counterparts at U.S. colleges and universities (U.S. Department of Education, 2001; Peter &
Horn, 2005). Although the number of bachelor’s degrees awarded to men has increased during
this period (King, 2006), undergraduate enrollment at most baccalaureate-granting institutions is
about 55% female and rising (Wilson, 2007). In fact, for every 100 men, one hundred and thirty-
three women receive a bachelor’s degree (U.S. Department of Education, 2001). Mortenson
(1999, 2006) contends the growing disparity between degrees awarded to men and women
signals an unfortunate downturn in the engagement and educational attainment of male students.
These trends have prompted some policy makers and university administrators to conclude that
the educational system faces a “boy crisis.”
On the one hand, focusing on male students may temporarily divert attention from
persistent and pervasive inequities in higher education (King, 2000). On the other hand, to
redress gender inequities in education requires a reasoned, balanced examination of the quality of
male undergraduate students’ experiences relative to that of women (King, 2000, 2006; Weaver-
Hightower, 2003). In addition, educational researchers are ethically bound to better understand
the experiences of men in college in order to help create the conditions to foster success for all
students (Weaver-Hightower, 2003). The manner in which this work is done is also important.
For example, in its Women at Work report, the American Association of University Women
(AAUW, 2003) cautions against asking research questions that advantage one gender over
another because such an approach does not raise the quality of education for all.
This study compares the engagement patterns of male and female undergraduates at a
broad array of baccalaureate-granting institutions. The student engagement concept represents
3
two key components (Kuh, 2001; 2003). The first is the amount of time and effort students put
into their studies and other educationally purposeful activities. For example, if men are less
engaged in educational activities, is the deficit concentrated in one or two areas, or is it
manifested across the spectrum of college activities? The second is how institutions of higher
education deploy resources and organize the curriculum, other learning opportunities, and
support services to encourage students to participate in activities associated with desired
outcomes, such as persistence, learning, and degree attainment. What the institution does is of
particular interest, as it may represent what the institution contributes to student engagement.
In this study, we take into account both student- and institution-level variables to examine
the engagement of undergraduate men and women. Of additional interest is whether any
observed gender differences are conditional, such as varying within or between different types of
institutions. Toward these ends, two questions guided the study:
1. To what degree is gender related to differences in the intensity and extensity of
undergraduate student engagement?
2. If gender differences exist, do they differ by institutional type?
What the Literature Says About Gender and Student Success in College
Two strands of research are especially pertinent to understanding the role of gender in the
undergraduate experience. The first focuses on the educational pipeline, or the rates by which
women and men prepare for and enroll in college and subsequently attain a baccalaureate degree.
The second emphasizes the nature and quality of the collegiate experiences of men and women,
with an emphasis on student engagement, a concept consistent with Pace’s (1980) quality of
effort measures and Astin’s (1984) theory of involvement.
College Preparation, Enrollment and Attainment
4
Research on gender and academic achievement in K-12 education reveals some
intriguing and at times disconcerting differences between how boys and girls learn and what they
experience in schools (American Association of University Women, 1992, 1999; Berkam, Lee &
Smerdon, 1997; Sax, 2005). Some differences are fairly well-established, such as girls being
more motivated and performing better on tests of reading and writing (Sadker & Sadker, 1994);
boys score higher on standardized tests, particularly those that feature questions on math and
science (Berkam, Lee & Smerdon, 1997). Nonetheless, since the mid-1990s, the gender gap has
narrowed in science and math performance and academic achievement (Freeman, 2004).
The gender gap has also closed in educational access since the 1970s. In fact, the nearly
20% increase over the past 30 years of new high school graduates in college is mostly due to the
admission of more women, lower-income students, as well as students of color (Peter & Horn,
2005). Women earned 57% of all bachelor’s degrees in 2001-02, a slightly higher proportion
than their representation among undergraduates that year (U.S. Department of Education, 2004).
The number of women earning degrees within six years exceeds the number of men who did the
same by more than 85,000 students (Carey, 2005) a pattern that persists for all racial-ethnic
categories. Older African-American females and Latinas are much more likely than their male
counterparts to attend college, especially in the two-year sector (King, 2000, 2006). Also, men
remain underrepresented in traditionally female-dominated fields such as education, nursing, and
areas in the humanities (Flood, Bates, & Potter, 2000; Lackland & De Lisi, 2001).
Despite these trends toward parity, gender differences persist in terms of educational
attainment, subject area achievement, and choice of majors and careers. For example, although
similar percentages of men and women high school seniors complete the traditional college
preparatory curriculum (U.S. Department of Education, 2001) and highest level of high school
5
mathematics courses (Peter & Horn, 2005), men are disproportionately represented at both ends
of the achievement spectrum – the strongest and poorest performers (Mickelson, 2003;
Mortenson, 2006). Men also have lower educational aspirations (Bae, Choy, Geddes, Sable, &
Snyder, 2000). In part, women get better grades in high school because they are more engaged
than men; that is, they study more hours, interact more often with their teachers, and so forth
(Epstein, Elwood, Hey, & Maw, 1998; McCarthy & Kuh, 2006; Mortenson, 2006). Low income
African American males are least likely to complete the traditional college prep curriculum
(King, 2000). As a result, more men start college less inclined to read or actively take part in
various aspects of campus life (McCarthy & Kuh, 2006). No wonder that men’s grades in college
on average tend to be lower than those of women (Gose, 1999).
Quality of and Participation in the Undergraduate Experience
Although women are better prepared academically for college than their male
counterparts, studies of undergraduate perceptions of the learning climate indicate that women
tend to view their campus to be less supportive of their academic and social needs, which in turn
adversely affects their learning and personal development (Belenky, Clinchy, Goldberger &
Tarule, 1986; Pascarella et al., 1997; Sandler, Silverberg, & Hall, 1996). For example,
moderately sized negative relationships were found between women’s perceptions of campus
climate and selected intellectual and personal development outcomes, such as gains in writing
and thinking skills, science knowledge, and arts and humanities knowledge (Pascarella et al.,
1997; Whitt, Edison, Pascarella, Nora, & Terenzini, 1999).
Men and women also differ in terms of participating in activities that are positively linked
to higher levels of student learning and development. For example, as in high school, women
undergraduates tend to spend more time preparing for class and they read and write more (Hu &
6
Kuh, 2002, 2003). Some of these differences may be a function of major, as women tend to be
overrepresented in areas that demand more writing than others, such as the humanities and social
sciences compared with science, technology, engineering, and mathematics (STEM) fields.
Certain of these advantages vary, depending on whether women attend a two- or a four-year
college. For example, women at baccalaureate-granting colleges gain more than men in critical
thinking over the course of college, whereas women attending two-year colleges tend to gain less
during the first year than do men (Pascarella & Terenzini, 2005).
The educational value of student-faculty interaction is almost unequivocal (Kuh & Hu,
2001; Pascarella & Terenzini, 2005). Frequent, meaningful interactions between students and
faculty, both inside and outside the classroom, are important to learning and personal
development, and a host of gains including academic skill development, social self-confidence,
academic and social integration, and leadership (Astin, 1993; Pascarella & Terenzini, 1991;
2005; Smart, Feldman, & Ethington, 2000). While little of this research examines gender
differences (Pascarella & Terenzini, 2005), some research has shown no difference (Kuh & Hu,
2001), while others have found that women have more frequent and positive interactions with
their faculty than do men (Sax, Bryant & Harper, 2005).
Male students are less likely to seek academic assistance from tutors, perhaps because of
gender-related socio-linguistic factors and cultural pressures (Wright, 2003). Yet, men more
frequently work on research projects with faculty members (Drew & Work, 1998), gain more in
quantitative mathematical problem-solving strategies (Baker & Jones, 1993; Halpern, 2000;
Stumpf & Stanley, 1996), and report higher levels of satisfaction with digital learning
environments (Blum, 1999). Some of these advantages are evident as early as the first grade
(Fennema, et al., 1998). Even though girls tend to earn better grades in high school mathematics
7
classes, once in college men enroll in and complete higher level STEM courses (Davis, et al.,
1996; Nelson & Rogers, 2004). Another study showed that women majoring in math and science
gain more in math self-concept than men during college (Pascarella & Terenzini, 2005).
In terms of co-curricular involvement, men tend to be overrepresented in higher status
campus leadership positions on coeducational campuses (Astin, 1993; Valian, 1998). Men are
also more likely to participate in intercollegiate athletics, and intramural and recreational
athletics, but are less likely to study abroad (Open Doors, 2004) or take part in service learning
(Campus Compact Statistics, 2003) and internships.
Not all the findings from studies examining gender effects offer conclusive results. Some
studies show that men more frequently participate in class discussions than females (Fassinger,
1995; Tannen, 1990), other studies found no effect (Howard, James & Taylor, 2002), while
others indicate that women contribute to class more frequently (Drew & Work, 1998). Although
Fritschner (2000) found no gender effect on active participation in class, gender had some
influence on student fears (of professor’s criticism and peer disapproval), confidence, and
preparation that might affect learning in other ways including interaction with faculty and
academic performance. Few if any significant gender differences exist in terms of self-reported
educational gains in broad areas such as general education, openness to diversity, vocational
training, and specialization (Drew & Work, 1998; Pascarella & Terenzini, 2005).
Gender and Institutional Type
Although the research is limited, the gender gap appears to play out differently across
institutions. The greatest enrollment imbalance is at liberal arts colleges -- particularly those
without intercollegiate sports programs (Gose, 1999) and at some co-ed Historically Black
Colleges and Universities where the proportion of women reaches 70 percent (Wilson, 2007).
8
Private baccalaureate-granting liberal arts institutions have experienced greater declines in the
percent of degrees awarded to men than public institutions overall (Mortenson, 2001). These
imbalances prompted initiatives to attract and retain men, including focused recruitment efforts,
expanded athletic opportunities, and promotion of majors that appeal to men (Wilson, 2007).
Some research suggests that women’s colleges provide a qualitatively different
experience for women compared to coeducational institutions, including higher levels of
academic challenge, opportunities for active and collaborative learning, and greater support for
women in STEM majors (Kinzie, Thomas, Palmer, Kuh & Umbach, 2007; Pascarella &
Terenzini, 1991). Given the few men’s colleges remaining, research on differences between
attending a men’s college versus a coeducational college for men is limited.
Summary
On balance, research suggests that gender differences that exist prior to college persist as
students move through postsecondary education. However, before declaring a crisis for male
students, more information is needed to determine whether men underperform in terms of
participating in effective educational practices and whether the engagement patterns of men and
women differ systematically across colleges and universities. Studying these issues is
challenging because it is possible that focusing on gender may obscure other conditional effects,
such as college environments, socio-economic status and race and ethnicity in mediating the
nature and quality of student experiences in college (Pascarella & Terenzini, 2005).
Methods
The data for this study are from the National Survey of Student Engagement (NSSE)
project which annually collects data from hundreds of thousands of undergraduates at four-year
colleges and universities in the U.S. and Canada. NSSE assesses the extent to which students are
engaged in empirically-derived good educational practices and what they gain from their college
9
experience (Kuh, 2001). The main content of the survey represents student behaviors that are
positively correlated with desirable learning and personal development outcomes of college.
The sample for this study consisted of 472,985 randomly sampled first-year and senior
undergraduate students attending 487 different baccalaureate-granting colleges and universities
who completed the NSSE survey in 2005 or 2006. Thirty six percent were male and 91% were
enrolled full-time. Seven percent were African American, 5% Asian American or Pacific
Islander, 5% Latino/a, less than 1% Native American, and 75% White. Almost half (46%) lived
on campus and 15% percent were adult students over 25 years of age. About two fifths (39%) of
the seniors started college at a different institution. The institutions varied in terms of their
Barron’s Profiles of American Colleges 2005 (2004) selectivity rating (mean=3.3 on a scale of 1
through 6) and undergraduate enrollment size (mean=5,873 students, median=3,173 students).
The data were analyzed in three steps. In step one we reviewed descriptive statistics
which provided a partial answer to the first research question – whether men and women differ in
terms of their level of engagement in educationally purposeful activities. Specifically, we
examined the individual items contributing to the five scales described in Table 1: academic
challenge, student-faculty interaction, active and collaborative learning, experiences with
diversity, and supportive campus environment. We focused on activities where, after collapsing
the item frequencies into dichotomous values, there was more than 5% difference between men
and women. Because of the very large sample size overall sampling error was no greater than +/-
0.03%, so the 5% difference is not likely due to sampling error. We also took mean differences
into account by computing effect size differences based on the respective item scale (i.e. 4-point
or 7-point scale). Effect sizes of an absolute value of .10 or greater were considered sizeable
enough for consideration as a gender difference.
10
<Insert Table 1 here >
In step two we built separate models for first-year students and seniors to examine the
effect of gender on engagement levels. Because of the nested nature of the data and our desire to
estimate institutional effects, we used hierarchical linear modeling (HLM) (Raudenbush & Bryk,
2002). At the student level we controlled for race/ethnicity, transfer status (seniors only),
enrollment status, living on campus, parental education, age, and major. At the institution level
we controlled for institution type using the Basic 2005 Carnegie classification (Carnegie
Foundation for the Advancement of Teaching, 2005), Barron’s (2004) selectivity, and
institutional control (public, private). We allowed the intercept to vary, thereby partitioning the
variance that can be attributed to institution-level effects.
In step three we randomized the slope of the variable ‘male,’ (i.e., gender coded as
male=1 and female=0) in order to partition the variance that may exist due to institutional
differences in the dependent variable attributable to being male. The continuous independent and
dependent measures are standardized, meaning that the unstandardized coefficients in all of the
tables represent effect sizes. An effect size is the proportion of a standard deviation change in the
dependent variable as a result of a one-unit change in an independent variable. The larger the
effect size the more likely the differences between groups represent performance that warrants
serious discussion and, perhaps, institutional action. As suggested by Rosenthal and Rosnow
(1991), we consider an effect size of .10 or less to represent a trivial difference, between .10 and
.30 small, between .30 and .50 moderate, and greater than .50 large. Because statistical
significance is sensitive to sample size, effect sizes are particularly important for consideration in
this study. The large number of cases used at both the student- and institution-level makes it
more likely that very small differences will be statistically significant.
Results
11
The first research question focused on whether gender was related to different levels of
engagement in educationally purposeful activities. Tables 2 and 3 list the activities that were
done more frequently by men and women respectively. In general, both first-year and senior
male students devoted more time to non-academic activities, such as relaxing and socializing,
exercising and participating in physical fitness, and co-curricular activities. Men also more often
came to class unprepared than their female counterparts. The one activity counter to this pattern
is that male students more frequently discussed ideas with faculty members outside of class.
In contrast, female students devoted more time and effort to academic activities such as
studying, preparing multiple drafts of papers, and making class presentations. They also attended
more art exhibits and plays, participated more often in community-based projects and in a
learning community, and communicated more frequently with their instructors via email. Senior
female students spent more time taking care of their dependents. Women also report higher
grades than men, a difference that grows between the first to the senior year of college.
< Insert Table 2 here> < Insert Table 3 here>
Table 4 displays the differences in engagement for men and women majoring in STEM
fields. As noted earlier, fewer women pursue STEM majors. In general, the gender differences
reflected in Tables 2 and 3 also hold for men and women in STEM majors. Table 4 shows only
activities where differences exist that do not appear in Table 2 and Table 3. For example, female
students report more memorizing and synthesizing in their coursework. They also report greater
gains in personal development, which includes self understanding, and understanding people of
other racial and ethnic groups. Female students more often talked about their career plans with
faculty, discussed readings with others, and received more feedback. On the other hand, male
12
students reported greater gains in solving complex, real-world problems, and more frequently
tutored other students and worked with classmates outside of the class on academic matters.
< Insert Table 4 here>
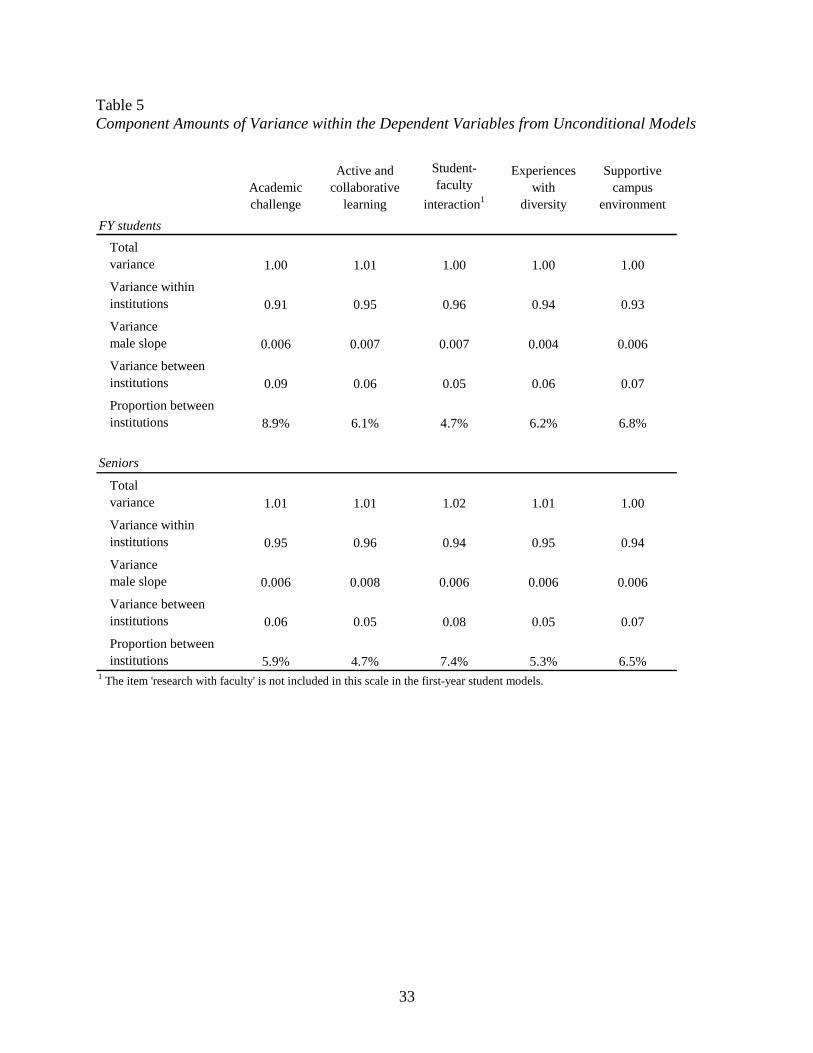
Table 5 presents the variance components for the dependent variables in the
unconditional two-level models (i.e., the models having no student- or institution-level variables
entered). The total variance is approximately equal to one for each variable because they were
standardized. The variance between institutions represents the dispersion of institutional mean
scores for the dependent variables, and the variance within institutions is a measure of the
dispersion of individual students’ scores on the dependent variables. The male slope variance
represents the amount that any differences in male and female engagement vary among
institutions. The proportion between institutions is computed by dividing the total variance by
the between institution variance. This between institution variance, ranging from 4.7% to 8.9%,
is small compared to the within-institution variance which is well above 90% for all variables.
This means that students within institutions can vary greatly from low to high engagement while
institutional means vary less. This point is relevant to this study because the second research
question asks if gender differences vary by institutional type. Because a relatively small amount
of variance exists at the institution level, it is also a given that gender differences between
institutions, where they do exist, cannot account for much of the overall variance.
Tables 6 (first-year students) and 7 (seniors) present the level 2 effect sizes and
significance levels for both the unconditional models (i.e., those with no predictors added), and
the full models that include student and institutional characteristics. These tables present the
variance components between institutions, within institutions, and in the distribution of male
slopes among institutions. In HLM, the intercept is interpreted as the average of the institutional
means of the dependent variable. By allowing the intercepts to vary, HLM is able to estimate the
amount and significance of the variance in the distribution of institutional means. Predictors
13
within these intercept models are listed in the top panel of Tables 6 and 7 and include the
Carnegie types, sector (private=1, public=0), and Barron’s selectivity. It is also possible to allow
the institutional coefficients (slopes) to vary, thus creating a second type of institution-level
variance that can be modeled.
< Insert Table 5 here> < Insert Table 6 here> < Insert Table 7 here>
To answer the first research question, “to what degree do gender differences exist in
engagement?’, we examined the significance and magnitude of the male slope coefficients in the
unconditional and full models. This coefficient represents the average institutional difference
between men (1) and women (0) on the dependent variable.
Academic Challenge. Both first-year and senior women scored significantly higher than
men on academic challenge; the effect sizes of -.15 (p<.001) for first-year students and -.18
(p<.001) for seniors were larger than those of any other dependent variables. Student and
institutional controls reduced the magnitude of the effect sizes only slightly, indicating that there
is a small, persistent, gender effect on the level of academic challenge reported by students. The
effect size for seniors in the full model indicate that men score on average about one-sixth of a
standard deviation lower than women in academic challenge. Randomizing the male slope
explained a statistically significant, but tiny amount of additional variance in both first year and
senior models (.006; p<.001), indicating that the gap in academic challenge between men and
women varies slightly across different institutional types. Consistent with all models, student
level variables were statistically significant in both the first-year and senior academic challenge
models, although they generally explained only a trivial amount of the within variance. Senior
engineering and physical science majors reported moderately strong levels of challenge relative
to business majors. Institution-level variables explained 62% of the between-institution variance
for first year students and 60% for seniors. Small to moderate institutional differences were
14
found between institutional types on academic challenge for seniors favoring baccalaureate-arts
and sciences colleges (the omitted Carnegie type), private, and selective institutions.
Active and Collaborative Learning. Significant gender effects also emerged on the active
and collaborative learning scale, although in opposite directions for first-year students and
seniors. In the full models, first-year men report more active and collaborative learning than their
female counterparts, although the difference is trivial in magnitude with an effect size of .03
(p<.001) indicating that men score on average a trivial .03 of a standard deviation higher than
women on active and collaborative learning. On the other hand, senior men score lower than
senior women on this measure, though the effect size of -.07 (p<.001) is still in the trivial range.
However, the net shift of -.10 (from .03 in the first year to -.07 in the senior year) is worth noting
and may be considered non-trivial. That is, men in the first year are at least on par with women,
if not slightly higher on this measure, but senior men seem to fall below women. Do women
learn to become more engaged through their undergraduate careers, or do men decrease their
participation in this form of engagement over the years?
Randomizing the male slope explained a statistically significant, but tiny amount of
additional variance in both first year (.007) and senior models (.008), indicating that the gender
gap in active and collaborative learning varies slightly across different institutional types. Again,
student-level variables were a small factor in explaining engagement. Black and Latino students
reported more such activities (relative to Whites) and full-time students had a modest effect size,
especially for seniors. Contrary to the patterns with academic challenge, senior business majors
compared favorably with several of the other disciplines in terms of active and collaborative
learning. Institution-level variables explained 45% of the between-institution variance for first-
year students and 44% for seniors. In the full models, doctoral-level institutions had a small
15
negative effect on active and collaborative learning relative to the baccalaureate-arts and sciences
colleges; private schools have a small positive effect.
Student-Faculty Interaction. Senior men and women do not differ significantly with
regard to their interactions with faculty members. While first-year males scored significantly
higher on this measure, the effect size is a trivial .05 (p<.001) in the full model. Recall that the
male slope coefficient represents the average gender differences among institutions, indicating
whether any gender difference varies from one institution to the next. Randomizing the male
slope accounted for a statistically significant but again very small amount of additional variance
for both first year and senior students (in full models both are equal to .006; p<.001), indicating
that the gender gap in student-faculty interaction varies slightly across different institutional
types. First-year and senior full-time, Black and Latino students interact more with faculty than
their counterparts. In the senior year, major plays a moderately strong role where students in
most disciplines have more contact with their faculty compared with business majors; biological
and physical science majors interact more frequently than any other group. Institution-level
variables explained 49% of the between-institution variance for first year students and 67% for
seniors. The full model shows that, especially among senior students, baccalaureate-arts and
sciences colleges have small, positive effects relative to the other Carnegie groups. Private
institutions also have a small positive effect. Consistent with other studies, selectivity has no net
effect on student-faculty interaction (Kuh & Pascarella, 2004; Pascarella, Cruce, et al, 2006).
Experiences with Diversity. No significant differences were found in male and female
experiences with diversity. Randomizing the male slope explained a statistically significant, but
slim amount of additional variance for both first-year students (.004; p<.001) and seniors (.005;
p<.001), indicating that any differences in diversity experiences between men and women vary
16
only slightly across different institutional types. Institution-level variables only explained 35%
and 16% of the between-institution variance for first-year and senior students respectively.
Students of color, full-time students, and those living on campus report more experiences with
diversity. The effects by major field are generally weak, with social sciences showing the largest
of the effect sizes (.18 for first-year and, 19 for senior students) relative to business. Little of the
variance in this dependent measure is explained by institutional type.
Supportive Campus Environment. Both first-year and senior men perceive their campus
environments to be less supportive than women, though again the magnitudes are trivial (-.04 for
first year students and -.07 for seniors). Randomizing the male slope explained a statistically
significant, but slim amount of additional variance (.006) for both first-year students and seniors,
indicating that any gender difference varies only slightly across different institutional types.
Student-level variables explained but 1.1% of the variance in both first-year and senior full
models with generally small to trivial coefficient sizes. Black and Latino students are somewhat
more favorable in their ratings of the campus environment relative to Whites; living on campus,
at least for first-year students, had a small positive effect. Institution-level variables explained
56% of the between-institution variance for first-year students and 45% for seniors. All Carnegie
types with the exception of baccalaureate-diverse and smaller program master’s institutions have
small to moderate negative effects relative to the baccalaureate-arts and sciences institutions.
Also, being a private institution has a small positive effect in the models.
To answer the second research question, “where gender differences exist, do they differ
by institutional type?”, we observed the size and statistical significance of the male slope
variance. The male slope variances, although significant at the p<0.001 level in all of the models,
were minute, ranging from .004 to .008. These tiny amounts of variance in gender difference
17
among institutions were not sufficient to model using institution-level variables. An example of
this slim variance is shown in Table 8 which lists the number and percent of institutions within
various effect size ranges on the academic challenge benchmark; that is, the male/female mean
difference divided by the standard deviation. Table 8 also shows that more than 90% of
institutions have small gender differences that are clustered near the observed gender gap
favoring women on this benchmark, similar to the coefficients of the male slope in other tables.
Thus, though the size of the gender gap varies somewhat between institutions, they do not appear
to range far from the center. Indeed, only about 4% of institutions show positive effect sizes over
.20 favoring males. This finding suggests that though the gender gap varies somewhat from one
institution to the next, factors such as campus culture which are not represented in the
institutional variables used in this analysis may contribute to these differences.
<Insert Table 8 here>
Limitations Although the institutions that participated in NSSE 2005 and 2006 mirror all U.S.
colleges and universities in terms of institutional characteristics such as Carnegie classification
and control, generalizations are limited because institutions elect to participate.. This means that
our results and conclusions most appropriately apply to institutions in this study. In addition,
comparisons made between students at different types of institutions are made without
controlling for pre-college measures of students’ levels of engagement or their predispositions
toward college. Consequently, it is possible that differences between students may be due to
institutional cultures and other contextual variables or entering student characteristics.
Discussion and Implications
Over the past several decades, most of the research on gender differences in college
student experiences concluded that women were shortchanged in a variety of ways. With two
18
exceptions, the results of this study suggest that any differences in undergraduate student
engagement generally are small and mixed. The major area of concern is academic challenge
where male students are systematically less engaged than their female counterparts. This is more
than mildly troubling, inasmuch as this cluster of educationally purposeful activities represents
core academic experiences such as the amount of time spent preparing for class, working up to
one’s potential in meeting instructors’ standards, rewriting papers to produce crisp, persuasive
prose, and completing challenging assignments that require the integration and synthesis of ideas
and information from a variety of sources. In addition, male seniors participate less often in
active and collaborative learning activities, such as contributing to class discussions, making
class presentations, and working with peers on projects during class. In fact, senior males are
much less likely to engage in such activities than first-year men, a somewhat perplexing finding.
Although there is some evidence that men are more inclined to be independent learners (Drew &
Work, 1998), this situation is disconcerting as these are the kinds of experiences that purportedly
help prepare students for the messy, unscripted problems they will encounter during and after
college. Equally important, working effectively with co-workers is considered an essential skill
in the 21st century (Association of American Colleges and Universities, 2007).
Although gender differences in engagement are slight, they illuminate aspects of
undergraduate education long associated with qualitative differences in the learning experiences
of men and women. For example, the descriptive results indicate that women dedicate greater
effort to working hard to meet an instructor’s standards or expectations, checking in with faculty
via email, serving others via community-based projects and service, and caring for dependents.
Unlike their male counterparts who devote more time to interacting with faculty members about
ideas and are actively involved in co-curricular activities and exercise, female students are more
19
likely to dedicate time to working hard and serving others. These differences illustrate the
persistence of gender-related patterns of behavior and learning and warrant further investigation
for the differential impact they may have on student learning and success.
Gender stereotypes, prior experiences, aspirations, and expectations explain some of the
gender differences in student engagement. For example, it is sad but not surprising that the
pattern of low male student engagement in academic activities evident in high school persists in
the postsecondary environment. In the case of women, even though increasing numbers are
enrolling in postsecondary education, many continue to gravitate toward what have been
traditionally female-dominated occupations and dedicate themselves to a greater extent than
males to activities such as community service that strengthen social relations among groups.
Thus, it is not surprising that male undergraduates are less involved in service learning and
seniors report less involvement in doing community service or volunteer work in college.
Similarly, shibboleths such as the humanities and social sciences are “female domains” and math
and science are “male domains” perpetuate tendencies for educators and parents to overestimate
and underestimate abilities based on gender. This has the untoward effect of male students
believing that because they are not “expected” to do well in English or writing there is little
payoff for devoting time and effort to these subjects; the effect for females is that what may be
authentic interest and talent in science and math are repressed and subjugated for channeling
their energy to other venues such as writing. Thus, gendered expectations may well influence the
extent to which male and female students engage in various educationally purposeful activities.
Although the advancement of women in STEM fields has been a longstanding concern of
educational policymakers, gender gaps persist in terms of choice of major, persistence to degree,
and participation in STEM graduate and professional school. Given the real gender gap, it is not
20
surprising that the gender differences identified in our descriptive results hold for STEM majors,
and a few more emerge. Notably, female students spend more time interacting with faculty about
career plans and receiving feedback. Combined, these activities suggest that women in STEM
fields are more reliant on faculty to gauge how well they are doing. The practice of receiving
feedback is particularly relevant given concerns about the retention of women in STEM. Women
attach more informational value to feedback (Roberts, 1991) and report that feedback,
particularly negative, contained more information relevant to their abilities (Roberts & Nolen-
Hoeksema, 1989). Considering the relationship of self-concept and belief in ones ability (Sax,
1994) to women’s participation and progress in STEM fields, it is important to insure that STEM
faculty members are sensitive to gender-related patterns regarding feedback. In addition,
women’s tendency to participate in community-based research and service learning suggests
pedagogical practices that could more effectively engage and support women in STEM fields.
The results of this study corroborate existing research demonstrating gender differences
in activities that complement and enrich undergraduate education. Male students are less inclined
to take advantage of enriching learning activities including study abroad, attending arts events,
and completing foreign language coursework, while women are less likely to participate in co-
curricular activities on campus. Again, the gender gaps in these areas expose qualitatively
different undergraduate experiences for men and women. It would be instructive to examine this
particular gender gap at an institutional level to better understand the extent to which
programmatic interventions could be designed to monitor and address the imbalance.
The magnitudes of differences in student engagement between men and women in this
study are not large enough to declare that the college male is in crisis. At the same time, the
results give us pause because they indicate that men -- on average -- do not put as much into or
21
by their own report get as much out of their studies as do women. Given the empirical and
conceptual links of student engagement to student learning, persistence, and educational
attainment (Kuh, Kinzie, Buckley, Bridges & Hayek, 2007), it is essential to determine the
factors and conditions that contribute to these differences and develop interventions to ameliorate
them. For example, because men appear to be less challenged academically and senior men less
often take part in active and collaborative learning activities, institutions could consider
educational practices that require students to spend more time on educationally purposeful tasks.
Among these potentially “high impact” practices are learning communities, first-year seminars,
writing-intensive courses, student-faculty research, study abroad, internships, and capstone
seminars (Association of American Colleges and Universities, 2007; Kuh et al., 2007). Some
educationally effective institutions assign peer writing tutors to courses with demanding writing
assignments; students are required to share drafts with a tutor before submitting assignments to
the instructor (Kuh, Kinzie, Schuh, Whitt & Associates, 2005). Of course, practices that
encourage students to participate in these activities will benefit all students, not just males.
As with other studies, the results of this investigation indicate that students at
baccalaureate-arts and sciences colleges and private institutions are more engaged than their
peers at comprehensive colleges and research universities (Hu & Kuh, 2002; Kuh et al., 2007).
However, gender differences by institutional type as defined by Carnegie were generally trivial.
This is probably because the effects of gender socialization are institution-neutral, especially as
campus boundaries become increasingly permeable to societal values and mores. Colleges and
universities both influence and mirror societal norms, including gender socialization processes.
Centuries of socialization that shape male and female behavior are difficult to overturn once
students matriculate. But this does not mean that institutions should not continue to develop
22
programs and policies to counter these unacceptable, often deleterious patterns of beliefs and
behaviors. Taken together, these findings suggest that individual institutions should identify
aspects of the undergraduate experience where male students may be lagging, and develop
approaches to foster male academic challenge, and sustained active and collaborative learning
opportunities for upper division courses. Equally important, the results of this study underscore
the need to develop a more balanced, nuanced understanding of the effect of gender on important
aspects of the undergraduate experience. Finally, it would be instructive to identify institutions
where men and women engage equally at high levels in educationally productive activities so
that other schools might learn from them.
Conclusion
Compared with their female counterparts, male undergraduates engage less frequently in
academically challenging activities; in addition, senior men participate less often in active and
collaborative learning activities, a disappointing reversal from their performance in the first
college year. Since little of the gender gap can be explained by institutional type and other
institutional characteristics, more information including entering students’ expectations and
preparation is necessary to better understand the proximal causes of gender differences and to
identify those male students who are under-engaged in college. Even though the scales appear to
have tipped with women undergraduates being the majority in postsecondary education, it is
premature to conclude that men are now systematically disadvantaged in terms of educational
opportunity. At the same time, it is important to continue to monitor the nature and quality of
college experiences for both men and women in order to advocate for policies and practices that
enhance the quality of education for all.
23
References
American Association of University Women. (1992). How schools shortchange girls. Washington, DC: Author.
American Association of University Women. (1999). Gender gaps: Where schools still fail our children. New York: Marlowe.
Association of American Colleges and Universities. (2007). College learning for the new global century. Washington, DC: Association of American Colleges and Universities.
Astin, A. W. (1984). Student involvement: A developmental theory for higher education.
Journal of College Student Development, 25(4), 297–308. Astin, A. W. (1993). What matters in college? Four critical years revisited. San
Francisco: Jossey-Bass.
Bae, Y., Choy, S., Geddes, C., Sable, J., & Snyder, T. (2000). Trends in educational equity of girls and women (NCES 2000-030). Washington, DC: U.S. Government Printing Office.
Baker, D.P., & Jones, D.P. (1993). Creating gender equality: Cross-national gender stratification and mathematics performance. Sociology of Education, 66, 91-103.
Barron’s Profiles of American Colleges, 2005. (2004). (26th ed.). Hauppauge, N.Y: Baron’s Educational Series Inc.
Belenky, M.F., Clinchy, B.M., Goldberger, N.R., & Tarule, J.M. (1986). Women’s ways of knowing: The development of self, voice and mind. New York: Basic Books.
Berkam, D.T., Lee, V.E & Smerdon, B.A. (1997). Gender and science learning early in high school: subject matter and laboratory experiences. American Educational Research Journal, 34(2), 297-331.
Blum, K.D. (1999). Gender differences in asynchronous learning in higher education: Learning styles, participation barriers, and communication patterns. Journal of Asynchronous Learning Networks, 3(1), 46-66.
Campus Compact Statistics. (2003). Retrieved January 10, 2007, from http://www.compact.org/about/statistics/2003/community_service_statistics.
Carey, K. (2005). One Step from the Finish Line: Higher College Graduation Rates are Within Our Reach. Education Trust. Washington DC.
Carnegie Foundation for the Advancement of Teaching. (2005). Basic classification. Retrieved February 13, 2007, from http://www.carnegiefoundation.org/classifications/index.asp.
24
Davis, C., Ginorio, A. B., Hollenshead C. S., Lazarus, B. B., Rayman, P. M., & Associates. (1996). The equity equation: Fostering the advancement of women in the sciences, mathematics, and engineering. San Francisco: Jossey-Bass.
Drew, T. L., & Work, G. G. (1998). Gender-based differences in higher education: Gaining a broader perspective. Journal of Higher Education, 69(5), 542-555.
Epstein, D., Elwood, J., Hey, V., & Maw, J. (1998). Failing boys? Issues in gender and achievement. Buckingham: Open University Press.
Fassinger, P.A. (1995). Understanding classroom interaction: Students' and professors' contributions to students' silence. Journal of Higher Education, 66(1), 82-96.
Fennema, E., Carpenter, T.P., Jacobs, V.R., Franke, M.L. & Levi, L.W. (1998). A longitudinal study of gender differences in young children’s mathematical thinking. Educational Researcher, 27, 6-11.
Flood, C.; Bates, P.; & Potter, J., (Eds.) (2000). Gender Equity for Males. WEEA Digest. Newton, MA: Women's Educational Equity Act Resource Center, Education Development Center.
Freeman, C.E. (2004). Trends in educational equity of girls and women: 2004 (NCES 2005-016). U.S. Department of Education, National Center for Education Statistics. Washington, DC: U.S. Government Printing Office.
Fritschner, L. M. (2000). Inside the undergraduate college classroom: Faculty and students differ on the meaning of student participation. Journal of Higher Education, 71, 342–362.
Gose, B. (1999). Colleges looking for ways to reverse a decline in enrollment of men. Chronicle of Higher Education, 46, 14, A73-75.
Hall, R. M., & Sandler, B. R. (1982). The classroom climate: A chilly climate for women? Washington, DC: Association of American Colleges.
Halpern, D.F. (2000). Sex differences in cognitive abilities. Mahwah, NJ: Erlbaum.
Howard, J. R., James, G. H. III, & Taylor, D. R. (2002). The consolidation of responsibility in the mixed-age college classroom. Teaching Sociology, 30, 214–234.
Hu, S. & Kuh, G.D. (2002). Being (dis)engaged in educationally purposeful activities: The influences of student and institutional characteristics. Research in Higher Education, 43(5), 555-575.
Hu, S., & Kuh, G.D. (2003). Diversity experiences and college student learning and personal development. Journal of College Student Development, 44, 320-334.
25
King, J.E. (2000). Gender equity in higher education: Are male students at a disadvantage? Washington, D.C: American Council on Education.
King, J.E. (2006). Gender Equity in Higher Education: 2006. Washington, D.C: American Council on Education.
Kinzie, J., Thomas, A.D., Palmer, M.M., Kuh, G.D., & Umbach, P.D. (2007). Women students at coeducational and women’s colleges: How do their experiences compare? Journal of College Student Development, 48(2), 145-165.
Kuh, G.D. (2001). Assessing what really matters to student learning: Inside the National Survey of Student Engagement. Change, 33(3), 10-17, 66.
Kuh, G.D. (2003). What we’re learning about student engagement from NSSE. Change,
35(2), 24-32. Kuh, G. D., & Hu, S. (2001). The effects of student-faculty interaction in the 1990s. The
Review of Higher Education, 24, 309-332. Kuh, G.D., Kinzie, J., Buckley, J., Bridges, B., & Hayek, J.C. (2007). Piecing together
the student success puzzle: Research, propositions, and recommendations. ASHE Higher Education Report, 32(5). San Francisco: Jossey-Bass.
Kuh, G. D., Kinzie, J., Schuh, J. H., Whitt, E. J. & Associates (2005). Student success in
college: Creating conditions that matter. San Francisco: Jossey-Bass.
Kuh, G.D., & Pascarella, E.T. (2004). What does institutional selectivity tell us about educational quality? Change, 36(5), 52-58.
Lackland, A.C. & De Lisi, R. (2001). Students' choices of college majors that are gender traditional and nontraditional. Journal of College Student Development, 42 (1), 39-48.
McCarthy, M.M., & Kuh, G.D. (2006). Are students ready for college? What student engagement data say. Phi Delta Kappan, 87, 664-669.
Mickleson, R.A. (2003). Gender, Bourdieu, and the anomaly of women’s achievement
redux. Sociology of Education, 76, 373-375. Mortenson, T. (1999, August). The growing gap in higher education. College Board
Review, 188. Mortenson, T. (2001, February). Where the Guys Are Not: The Growing Gender
Imbalance in College Degrees Awarded. Postsecondary Opportunity, 104. Mortenson, T. (2006, September). The State of American Manhood. Postsecondary
Opportunity, 171.
26
Nelson, D. J. & Rogers, D.C. (2004). An Analysis of Diversity in Science and Education
Faculties at Research Universities. Available: http://www.now.org/issues/diverse/diversity_report.pdf
Open Doors 2004: Report on International Educational Exchange (2004). Institute of
International Education, NY. Pace, C. R. (1980). Measuring the quality of student effort. Current Issues in Higher
Education, 2, 10–16.
Pascarella, E.T., Cruce, T., Wolniak, G.C., Kuh, G.D., Umbach, P.D., Hayek, J.C., Carini, R.M., Gonyea, R.M., Zhao, C-M. (2006). Institutional selectivity and good practices in undergraduate education. Journal of Higher Education, 77, 251-285.
Pascarella, E. R., & Terenzini, P.T. (1991). How college affects students: Findings and
insights from twenty years of research. San Francisco: Jossey-Bass. Pascarella, E. R., & Terenzini, P.T. (2005). How college affects students: A third decade
of research. San Francisco: Jossey-Bass. Pascarella, E. T., Whitt, E. J., Edison, M. I., Nora, A., Hagedorn, L. S., Yeager, P. M., &
Terenzini, P. T. (1997). Women's perceptions of a "chilly climate" and their cognitive outcomes during the first year of college. Journal of College Student Development, 38(2), 109-124.
Peter, K., & Horn, L. (2005). Gender differences in participation and completion of
undergraduate education and how they have changed over time (NCES 2005-169). U.S. Department of Education, National Center for Education Statistics, Washington D.C.: U.S. Government Printing Office.
Raudenbush, S. W. & Bryk, A. S. (2002). Hierarchical linear models: Applications and
data analysis methods. Thousand Oaks, CA: Sage Publications.
Roberts, T. (1991). Gender and influence of evaluations on self-assessments in achievement settings. Psychological Bulletin, 109, 297-308.
Roberts, T., & Nolen-Hoeksema, S. (1989). Sex differences in reaction to evaluative
feedback. Sex Roles, 21, 725-747. Rosenthal, R., & Rosnow, R.L. (1991). Essentials of behavioral research: methods and
data analysis (2nd ed.). New York: McGraw-Hill. Sadker, M., & Sadker, D. (1994). Failing at fairness: How our schools cheat girls. New
York: Touchstone.
27
Sandler, B.R., Silverberg, L.A., & Hall, R.M. (1996). The chilly classroom climate: A guide to improve the education of women. Washington, D.C: National Association for Women in Education.
Sax, L. (2005). Why gender matters: What parents and teachers need to know about the emerging science of sex differences. New York: Doubleday.
Sax L. J. (1994). Mathematical self-concept: How college reinforces the gender gap.
Research in Higher Education, 35(2), 141–166 Sax, L.J., Bryant, A.N., & Harper, C.E. (2005). The differential effects of student-faculty
interaction on college outcomes for women and men. Journal of College Student Development, 46(6), 642-657.
Smart, J. C., Feldman, K. A., & Ethington, C. A. (2000). Academic disciplines: Holland’s
theory and the study of college students and faculty. Nashville, TN: Vanderbilt University Press. Stumpf, H. & Stanley, J.C. (1996). Gender-related differences on the College Board’s
Advanced Placement and Achievement tests, 1982-1992. Journal of Educational Psychology, 88, 353-364.
Tannen, D. (1990). You Just Don't Understand. New York: Harper Collins. U.S. Department of Education, National Center for Education Statistics. (2001). Digest of
Education Statistics 2000 (NCES 2001-034). Washington, DC: U.S. Department of Education, Office of Educational Research and Improvement.
U.S. Department of Education, National Center for Education Statistics. (2004). Digest of
Education Statistics 2003 (NCES 2005-025). Washington, DC: U.S. Government Printing Office.
Valian, V. (1998). Why so slow? The advancement of women. Cambridge, MA: MIT Press.
Weaver-Hightower, M. (2003). The “boy turn” in research on gender and education. Review of Educational Research, 73(4), 471-498.
Whitt, E. J., Edison, M. I., Pascarella, E. T., Nora, A., & Terenzini, P. T. (1999). Women's perceptions of a "chilly climate" and cognitive outcomes in college: Additional evidence. Journal of College Student Development, 40(2), 163-177.
Wilson, R. (2007, January 26). The New Gender Divide. The Chronicle of Higher Education, 53(21), A36.
Wright, R.R. (2003). Real men don't ask for directions: Male student attitudes toward peer tutoring. Journal of College Reading and Learning, 34(1), 61-75.
28
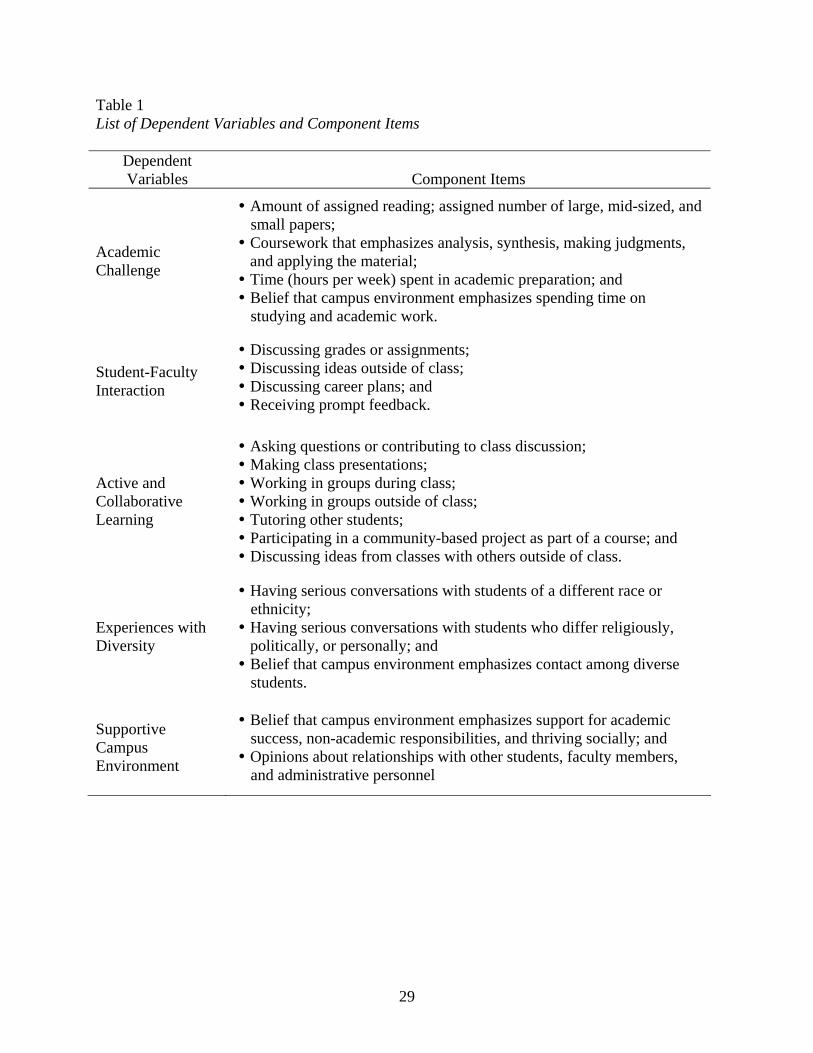
Table 1 List of Dependent Variables and Component Items
Dependent Variables Component Items
Academic Challenge
Amount of assigned reading; assigned number of large, mid-sized, and small papers;
Coursework that emphasizes analysis, synthesis, making judgments, and applying the material;
Time (hours per week) spent in academic preparation; and Belief that campus environment emphasizes spending time on studying and academic work.
Student-Faculty Interaction
Discussing grades or assignments; Discussing ideas outside of class; Discussing career plans; and Receiving prompt feedback.
Active and Collaborative Learning
Asking questions or contributing to class discussion; Making class presentations; Working in groups during class; Working in groups outside of class; Tutoring other students; Participating in a community-based project as part of a course; and Discussing ideas from classes with others outside of class.
Experiences with Diversity
Having serious conversations with students of a different race or ethnicity;
Having serious conversations with students who differ religiously, politically, or personally; and
Belief that campus environment emphasizes contact among diverse students.
Supportive Campus Environment
Belief that campus environment emphasizes support for academic success, non-academic responsibilities, and thriving socially; and
Opinions about relationships with other students, faculty members, and administrative personnel
29
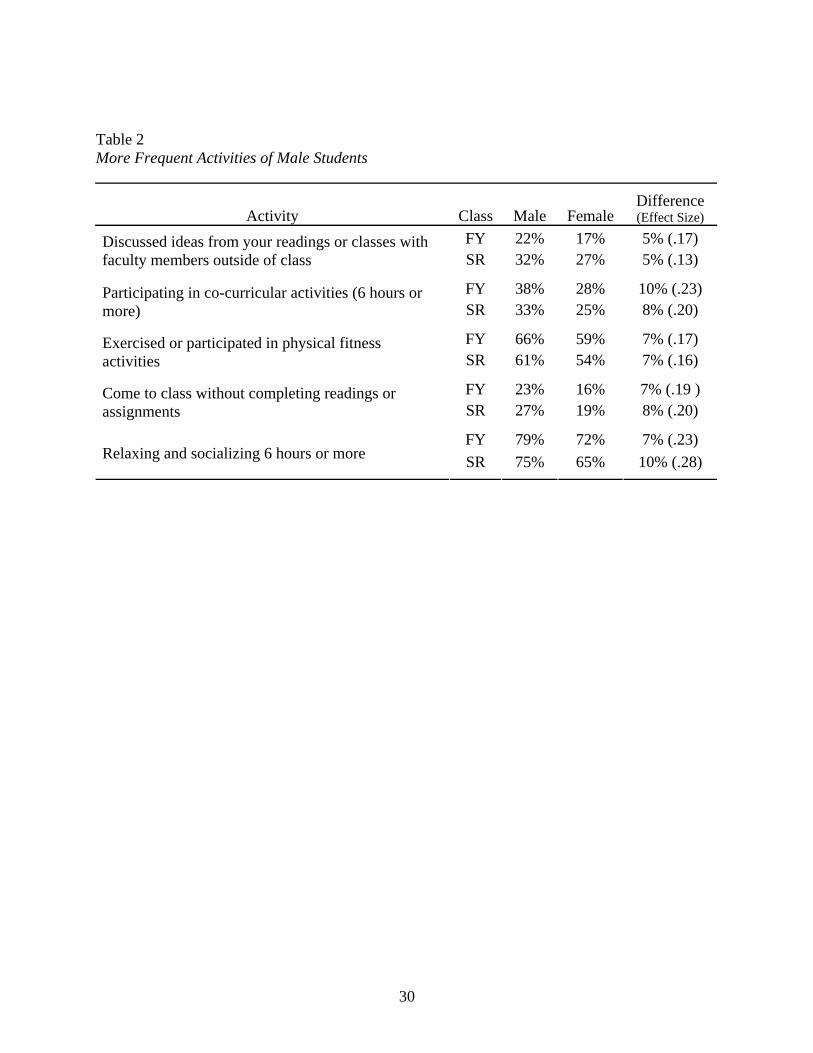
Table 2 More Frequent Activities of Male Students
Activity Class Male Female Difference (Effect Size)
FY 22% 17% 5% (.17) Discussed ideas from your readings or classes with faculty members outside of class SR 32% 27% 5% (.13)
FY 38% 28% 10% (.23) Participating in co-curricular activities (6 hours or more) SR 33% 25% 8% (.20)
FY 66% 59% 7% (.17) Exercised or participated in physical fitness activities SR 61% 54% 7% (.16)
FY 23% 16% 7% (.19 ) Come to class without completing readings or assignments SR 27% 19% 8% (.20)
FY 79% 72% 7% (.23) Relaxing and socializing 6 hours or more SR 75% 65% 10% (.28)
30
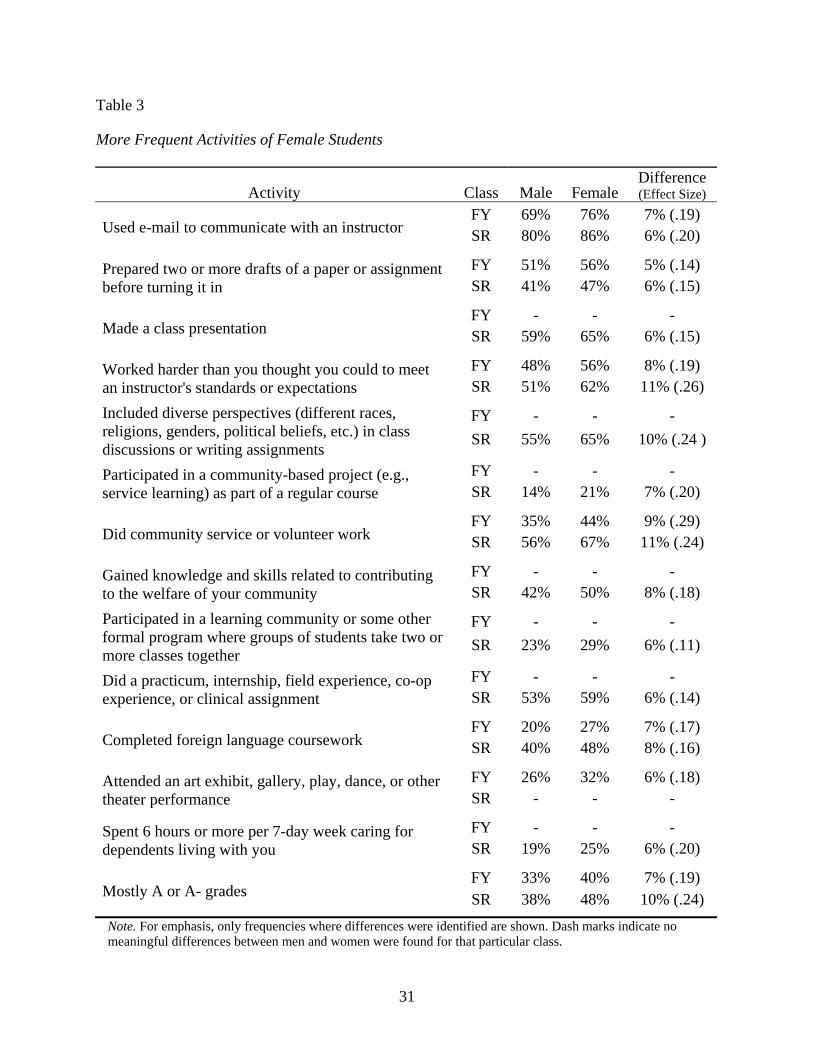
Table 3
More Frequent Activities of Female Students
Activity Class Male Female Difference (Effect Size)
FY 69% 76% 7% (.19) Used e-mail to communicate with an instructor SR 80% 86% 6% (.20)
FY 51% 56% 5% (.14) Prepared two or more drafts of a paper or assignment before turning it in SR 41% 47% 6% (.15)
FY - - - Made a class presentation SR 59% 65% 6% (.15)
FY 48% 56% 8% (.19) Worked harder than you thought you could to meet an instructor's standards or expectations SR 51% 62% 11% (.26)
FY - - - Included diverse perspectives (different races, religions, genders, political beliefs, etc.) in class discussions or writing assignments SR 55% 65% 10% (.24 )
FY - - - Participated in a community-based project (e.g., service learning) as part of a regular course SR 14% 21% 7% (.20)
FY 35% 44% 9% (.29) Did community service or volunteer work SR 56% 67% 11% (.24)
FY - - - Gained knowledge and skills related to contributing to the welfare of your community SR 42% 50% 8% (.18)
FY - - - Participated in a learning community or some other formal program where groups of students take two or more classes together SR 23% 29% 6% (.11)
FY - - - Did a practicum, internship, field experience, co-op experience, or clinical assignment SR 53% 59% 6% (.14)
FY 20% 27% 7% (.17) Completed foreign language coursework SR 40% 48% 8% (.16)
FY 26% 32% 6% (.18) Attended an art exhibit, gallery, play, dance, or other theater performance SR - - -
FY - - - Spent 6 hours or more per 7-day week caring for dependents living with you SR 19% 25% 6% (.20)
FY 33% 40% 7% (.19) Mostly A or A- grades SR 38% 48% 10% (.24) Note. For emphasis, only frequencies where differences were identified are shown. Dash marks indicate no meaningful differences between men and women were found for that particular class.
31
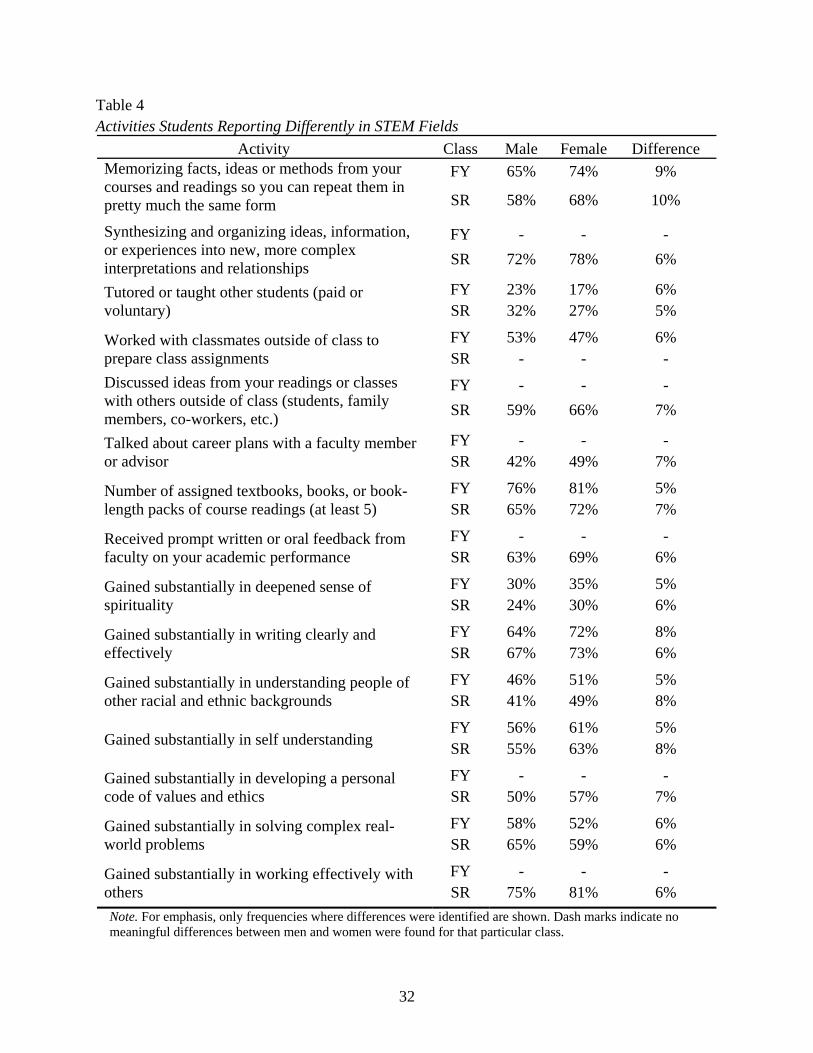
Table 4 Activities Students Reporting Differently in STEM Fields
Activity Class Male Female Difference FY 65% 74% 9% Memorizing facts, ideas or methods from your
courses and readings so you can repeat them in pretty much the same form SR 58% 68% 10%
FY - - - Synthesizing and organizing ideas, information, or experiences into new, more complex interpretations and relationships SR 72% 78% 6%
FY 23% 17% 6% Tutored or taught other students (paid or voluntary) SR 32% 27% 5%
FY 53% 47% 6% Worked with classmates outside of class to prepare class assignments SR - - -
FY - - - Discussed ideas from your readings or classes with others outside of class (students, family members, co-workers, etc.) SR 59% 66% 7%
FY - - - Talked about career plans with a faculty member or advisor SR 42% 49% 7%
FY 76% 81% 5% Number of assigned textbooks, books, or book-length packs of course readings (at least 5) SR 65% 72% 7%
FY - - - Received prompt written or oral feedback from faculty on your academic performance SR 63% 69% 6%
FY 30% 35% 5% Gained substantially in deepened sense of spirituality SR 24% 30% 6%
FY 64% 72% 8% Gained substantially in writing clearly and effectively SR 67% 73% 6%
FY 46% 51% 5% Gained substantially in understanding people of other racial and ethnic backgrounds SR 41% 49% 8%
FY 56% 61% 5% Gained substantially in self understanding SR 55% 63% 8%
FY - - - Gained substantially in developing a personal code of values and ethics SR 50% 57% 7%
FY 58% 52% 6% Gained substantially in solving complex real-world problems SR 65% 59% 6%
FY - - - Gained substantially in working effectively with others SR 75% 81% 6% Note. For emphasis, only frequencies where differences were identified are shown. Dash marks indicate no meaningful differences between men and women were found for that particular class.
32
33
Academic challenge
Active and collaborative
learning
Student-faculty
interaction1
Experiences with
diversity
Supportive campus
environmentFY students
Total variance 1.00 1.01 1.00 1.00 1.00Variance within institutions 0.91 0.95 0.96 0.94 0.93Variance male slope 0.006 0.007 0.007 0.004 0.006Variance between institu
Proportinstitu
Seniors
Total varian
Varianinstitu
Varianmale s
Varianinstitu
Proportinstitu
1 The ite
Table 5 Component Amounts of Variance within the Dependent Variables from Unconditional Models
tions 0.09 0.06 0.05 0.06 0.07ion between
tions 8.9% 6.1% 4.7% 6.2% 6.8%
ce 1.01 1.01 1.02 1.01 1.00ce within tions 0.95 0.96 0.94 0.95 0.94ce lope 0.006 0.008 0.006 0.006 0.006ce between tions 0.06 0.05 0.08 0.05 0.07
ion between tions 5.9% 4.7% 7.4% 5.3% 6.5%
m 'research with faculty' is not included in this scale in the first-year student models.
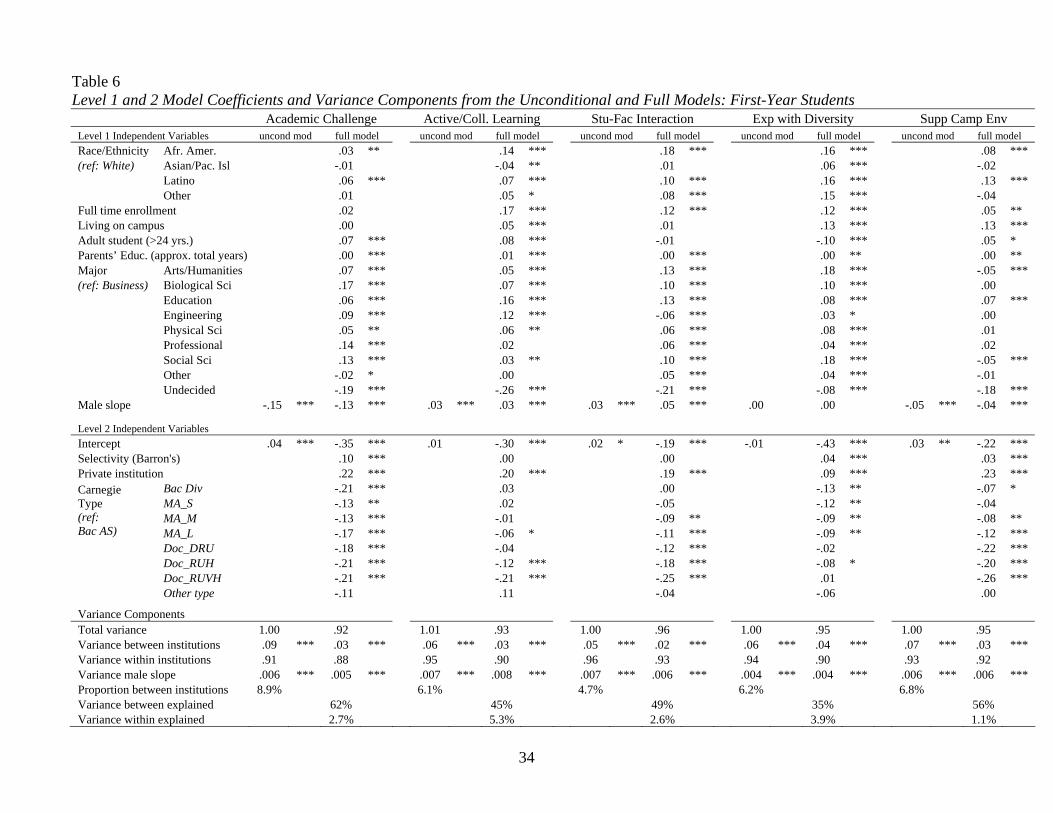
Table 6 Level 1 and 2 Model Coefficients and Variance Components from the Unconditional and Full Models: First-Year Students Academic Challenge Active/Coll. Learning Stu-Fac Interaction Exp with Diversity Supp Camp Env Level 1 Independent Variables uncond mod full model uncond mod full model uncond mod full model uncond mod full model uncond mod full model Race/Ethnicity Afr. Amer. .03 ** .14 *** .18 *** .16 *** .08 *** (ref: White) Asian/Pac. Isl -.01 -.04 ** .01 .06 *** -.02 Latino .06 *** .07 *** .10 *** .16 *** .13 *** Other .01 .05 * .08 *** .15 *** -.04 Full time enrollment .02 .17 *** .12 *** .12 *** .05 ** Living on campus .00 .05 *** .01 .13 *** .13 *** Adult student (>24 yrs.) .07 *** .08 *** -.01 -.10 *** .05 * Parents’ Educ. (approx. total years) .00 *** .01 *** .00 *** .00 ** .00 ** Major Arts/Humanities .07 *** .05 *** .13 *** .18 *** -.05 *** (ref: Business) Biological Sci .17 *** .07 *** .10 *** .10 *** .00 Education .06 *** .16 *** .13 *** .08 *** .07 *** Engineering .09 *** .12 *** -.06 *** .03 * .00 Physical Sci .05 ** .06 ** .06 *** .08 *** .01 Professional .14 *** .02 .06 *** .04 *** .02 Social Sci .13 *** .03 ** .10 *** .18 *** -.05 *** Other -.02 * .00 .05 *** .04 *** -.01 Undecided -.19 *** -.26 *** -.21 *** -.08 *** -.18 *** Male slope -.15 *** -.13 *** .03 *** .03 *** .03 *** .05 *** .00 .00 -.05 *** -.04 ***
Level 2 Independent Variables Intercept .04 *** -.35 *** .01 -.30 *** .02 * -.19 *** -.01 -.43 *** .03 ** -.22 *** Selectivity (Barron's) .10 *** .00 .00 .04 *** .03 *** Private institution .22 *** .20 *** .19 *** .09 *** .23 ***
Bac Div -.21 *** .03 .00 -.13 ** -.07 * Carnegie Type MA_S -.13 ** .02 -.05 -.12 ** -.04
MA_M -.13 *** -.01 -.09 ** -.09 ** -.08 ** (ref: Bac AS) MA_L -.17 *** -.06 * -.11 *** -.09 ** -.12 *** Doc_DRU -.18 *** -.04 -.12 *** -.02 -.22 *** Doc_RUH -.21 *** -.12 *** -.18 *** -.08 * -.20 *** Doc_RUVH -.21 *** -.21 *** -.25 *** .01 -.26 *** Other type -.11 .11 -.04 -.06 .00
Variance Components Total variance 1.00 .92 1.01 .93 1.00 .96 1.00 .95 1.00 .95 Variance between institutions .09 *** .03 *** .06 *** .03 *** .05 *** .02 *** .06 *** .04 *** .07 *** .03 *** Variance within institutions .91 .88 .95 .90 .96 .93 .94 .90 .93 .92 Variance male slope .006 *** .005 *** .007 *** .008 *** .007 *** .006 *** .004 *** .004 *** .006 *** .006 *** Proportion between institutions 8.9% 6.1% 4.7% 6.2% 6.8% Variance between explained 62% 45% 49% 35% 56% Variance within explained 2.7% 5.3% 2.6% 3.9% 1.1%
34
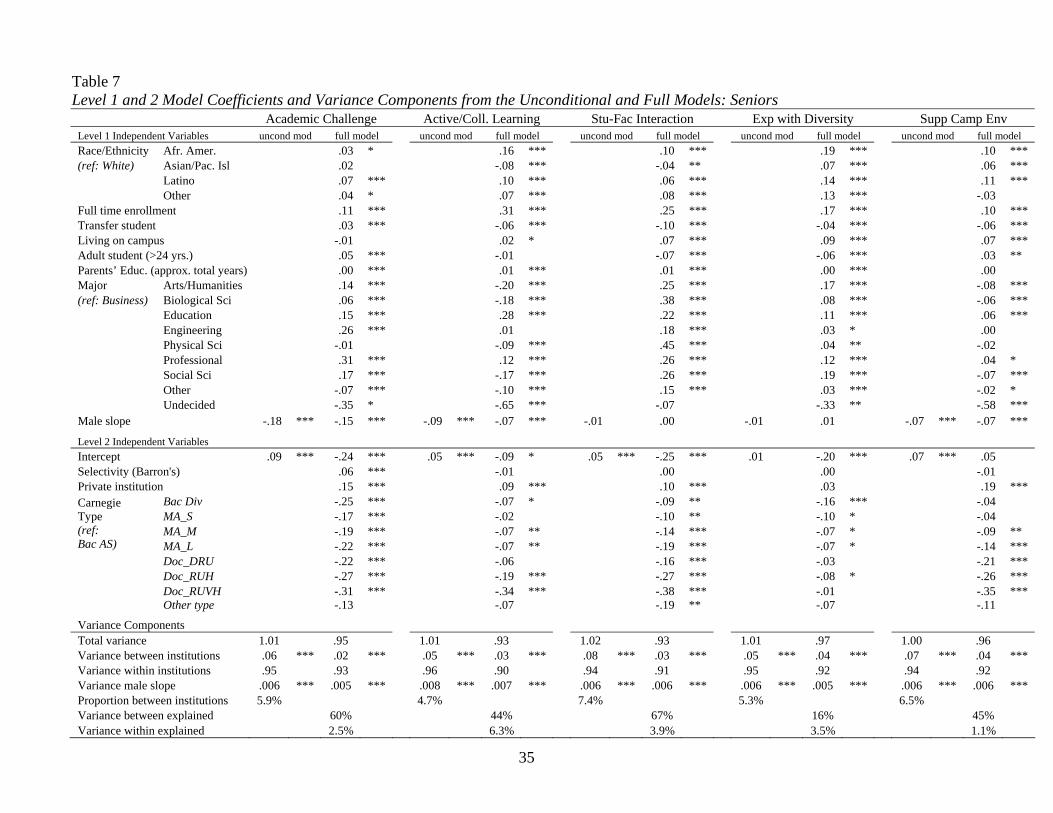
Table 7 Level 1 and 2 Model Coefficients and Variance Components from the Unconditional and Full Models: Seniors Academic Challenge Active/Coll. Learning Stu-Fac Interaction Exp with Diversity Supp Camp Env Level 1 Independent Variables uncond mod full model uncond mod full model uncond mod full model uncond mod full model uncond mod full model Race/Ethnicity Afr. Amer. .03 * .16 *** .10 *** .19 *** .10 *** (ref: White) Asian/Pac. Isl .02 -.08 *** -.04 ** .07 *** .06 *** Latino .07 *** .10 *** .06 *** .14 *** .11 *** Other .04 * .07 *** .08 *** .13 *** -.03 Full time enrollment .11 *** .31 *** .25 *** .17 *** .10 *** Transfer student .03 *** -.06 *** -.10 *** -.04 *** -.06 *** Living on campus -.01 .02 * .07 *** .09 *** .07 *** Adult student (>24 yrs.) .05 *** -.01 -.07 *** -.06 *** .03 ** Parents’ Educ. (approx. total years) .00 *** .01 *** .01 *** .00 *** .00 Major Arts/Humanities .14 *** -.20 *** .25 *** .17 *** -.08 *** (ref: Business) Biological Sci .06 *** -.18 *** .38 *** .08 *** -.06 *** Education .15 *** .28 *** .22 *** .11 *** .06 *** Engineering .26 *** .01 .18 *** .03 * .00 Physical Sci -.01 -.09 *** .45 *** .04 ** -.02 Professional .31 *** .12 *** .26 *** .12 *** .04 * Social Sci .17 *** -.17 *** .26 *** .19 *** -.07 *** Other -.07 *** -.10 *** .15 *** .03 *** -.02 * Undecided -.35 * -.65 *** -.07 -.33 ** -.58 *** Male slope -.18 *** -.15 *** -.09 *** -.07 *** -.01 .00 -.01 .01 -.07 *** -.07 ***
Level 2 Independent Variables Intercept .09 *** -.24 *** .05 *** -.09 * .05 *** -.25 *** .01 -.20 *** .07 *** .05 Selectivity (Barron's) .06 *** -.01 .00 .00 -.01 Private institution .15 *** .09 *** .10 *** .03 .19 ***
Bac Div -.25 *** -.07 * -.09 ** -.16 *** -.04 Carnegie Type MA_S -.17 *** -.02 -.10 ** -.10 * -.04
MA_M -.19 *** -.07 ** -.14 *** -.07 * -.09 ** (ref: Bac AS) MA_L -.22 *** -.07 ** -.19 *** -.07 * -.14 *** Doc_DRU -.22 *** -.06 -.16 *** -.03 -.21 *** Doc_RUH -.27 *** -.19 *** -.27 *** -.08 * -.26 *** Doc_RUVH -.31 *** -.34 *** -.38 *** -.01 -.35 *** Other type -.13 -.07 -.19 ** -.07 -.11
Variance Components Total variance 1.01 .95 1.01 .93 1.02 .93 1.01 .97 1.00 .96 Variance between institutions .06 *** .02 *** .05 *** .03 *** .08 *** .03 *** .05 *** .04 *** .07 *** .04 *** Variance within institutions .95 .93 .96 .90 .94 .91 .95 .92 .94 .92 Variance male slope .006 *** .005 *** .008 *** .007 *** .006 *** .006 *** .006 *** .005 *** .006 *** .006 *** Proportion between institutions 5.9% 4.7% 7.4% 5.3% 6.5% Variance between explained 60% 44% 67% 16% 45% Variance within explained 2.5% 6.3% 3.9% 3.5% 1.1%
35
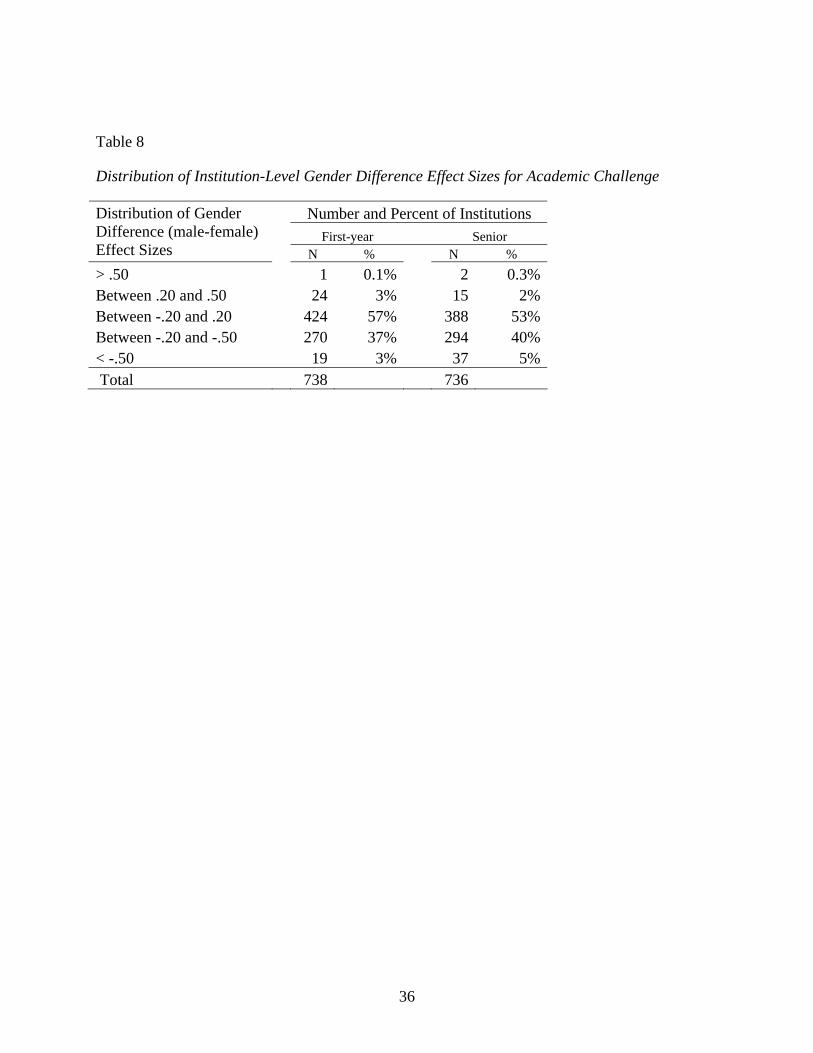
Table 8
Distribution of Institution-Level Gender Difference Effect Sizes for Academic Challenge
Number and Percent of Institutions First-year Senior
Distribution of Gender Difference (male-female) Effect Sizes N % N % > .50 1 0.1% 2 0.3%Between .20 and .50 24 3% 15 2%Between -.20 and .20 424 57% 388 53%Between -.20 and -.50 270 37% 294 40%< -.50 19 3% 37 5% Total 738 736
36