a study of some energy dependent characteristics of x-ray
TRANSCRIPT

A Study of Some Energy Dependent Characteristics of X-ray Screens
Used in Diagnostic Radiology Screen-Film Sensitivity, MTF and Some Related Factors
by
MIKAEL KARLSSON
Umeå 1983 From the Department of Radiation Physics
University of Umeå, Sweden


A Study of Some Energy Dependent Characteristics of X-ray Screens
Used in Diagnostic Radiology Screen-Film Sensitivity, MTF and Some Related Factors
AKADEMISK AV HANDLING
som m ed ve derbörligt tillstånd av rektorsämbetet vid Umeå u niversitet för avläggande av filosofie doktors
examen ko mmer a tt offentligen försvaras i Jubileums
klinikens föreläsningssal, lasarettsområdet, tisdagen den 31 maj 1983, kl 09.00.
av
Mikael Karlsson fil kand
Umeå 1983

ABSTRACT
A S TUDY O F S OME E NERGY D EPENDENT CH ARACTERISTICS O F X- RAY SC REENS U SED IN DIAGNOSTIC R ADIOLOGY. Screen-Film Sensitivity, MTF and So me Relate d Factors. Mikael Karlsson, Radiation Physics Department, University of Umeå, S-901 85 Umeå, Sweden.
Fluorescent x-ray screens are used i n medical x-ray diagnostics to absorb x-ray photons and convert these x-ray photons to visible light. The light distribution from these screens are then registered on ph otographic film to give an x -ray image. Both the sensitivity and the resolution characteristics of these systems are dependent on the x-ray photon energy. To enable a study of these and so me o ther energy dependent characteristics of x-ray screens a number o f almost monoener-getic radiation sources were constructed, tested with regard to their purity and calibrated. Both film and a photo-multiplier tube were used as light detectors.
The sensitivity of screens with three different screen phosphors were studied as a function of the photon energy and la rge variations in sensitivity was found for different photon en ergies and screen phosphors. The light from the screens has been com pared t o the absorbed energy in the screens and t his comparison shows that the energy depen dence o f the screens can appro ximately be p redicted by calculations of the absorbed energy, except at low photon e nergies where ot her effects like increased light absorption in the screens is present.
The mod ulation transfer factor (MTF) was s tudied both experimentally and t heoretically as a function of photon e nergy. Two e ffects were shown to influence the energy depen dence o f the MTF. At low energies an in creased light diffusion will destroy the MTF and a t energies above the K-edge of the high-Z elements in the screens the production and re-absorption of K-radiation will deteriorate the MTF.
Both the energy depen dence o f the screen-film sensitivity and the MTF have been calculated for some n ormally used s pectral distributions from x-ray tubes and s ignificant changes due t o choice of kV and filtra tion of the beam wer e found.
Other effects such as the number o f interacting photons in the screens per unit area, contribution of K-radiation from one screen to the other, and light contribution to the front emulsion of the film compared to the back emulsion have also been investigated as a function of photon energy.
Optimization of x-ray systems and c linical routines to give the lowest possible radiation dose to the patient with an acce ptable image quality is an i mportant task to carry out. The energy depende nt characteristics of x-ray screens studied in this work is a lead in the optimizing of the system w ith regard to choice of x-ray screens, film and radiation quali ty.
Key word s: Intensifying screens, x-ray screens, fluorescent screens, modul at ion transfer function, MTF, x-ray screen sensitivity, fluorescent K-radiation sources.
ISBN 91-7174-132-1

A Study of Some Energy Dependent Characteristics of X-ray Screens
Used in Diagnostic Radiology Screen-Film Sensitivity, MTF and Some Related Factors
by
Mikael Karlsson
Umeå 198 3
K • O 1/
Y' *J. 3 1>
--tx S
Radiation Physics Department
University of Umeå S-901 85 UMEÅ Sweden

ABSTRACT
A S TUDY O F S OME E NERGY D EPENDENT CH ARACTERISTICS O F X- RAY SC REENS U SED IN DIAGNOSTIC R ADIOLOGY. Screen-Film Sensitivity, MTF and S ome Related Factors. Mikael Karlsson, Radiation Physics Department, U niversity of Umeå, S-901 85 Um eå, Sweden.
Fluorescent x-ray screens a re used in medical x-ray diagnostics to absorb x-ray photons and convert these x-ray photons to visible light. The light distribution from these screens are then registered on photographic film to give an x- ray image. Both the sensitivity and the resolution characteristics of these systems are dependent on the x-ray photon energy. To enable a study of these and so me o ther energy dependent characteristics of x-ray screens a number o f almost monoe ner-getic radiation sources were constructed, tested with regard to their purity and calibrated. Both film and a photo-multiplier tube were used as light detectors.
The sensitivity of screens with three different screen phosphors were studied as a function of the photon energy and large variations in sensitivity was found for different photon energie s and screen phosphors. The light from the screens has been com pared to the absorbed energy in the screens and this comparison sho ws t hat the energy depe ndence of the screens can approxim ately be pr edicted by calculations of the absorbed energy, except at low photon ene rgies where oth er effects like increased l ight absorption in the screens is present.
The mod ulation transfer factor (MTF) was stu died both experimentally and theoretically as a function of photon energy. Two e ffects were shown t o influence the energy depe ndence of the MTF. At low e nergies an in creased light diffusion will destroy the MTF and a t energies above the K-edge o f the high-Z elements in the screens the production and re-absorption of K-radiation will deteriorate the MTF.
Both the energy depe ndence o f the screen-film sensitivity and the MTF have been c alculated for some n ormally used spectral distributions from x-ray tubes and significant changes due to choice of kV and filtration of the beam wer e found. Other effects such as the number of interacting photons in the screens per unit area, contribution of K-radiation from one screen to the other, and light contribution to the front emulsion of the film compared to the back emulsion have a lso been i nvestigated as a function of photon ener gy. Optimization of x-ray systems and clinical routines to give the lowest possible radiation dose to the patient with an accept able image q uality is an im portant task to carry out. The energy dependent characteristi es of x-ray screens studied in this work is a lead in the optimizing of the system w ith regard to choice of x-ray screens, film and radiation qua!i ty. Key words: Intensifying screens, x-ray screens, fluorescent screens, modulation transfer function, MTF, x-ray screen sensitivity, fluorescent K-radiation sources.
ISBN 91-7174-132-1
CONTENTS
Chapter 1. GENERAL INTRODUCTION
page
1
2 RADIATION FACI LITIES 7 - Radiation sources 7 - Purity of the radiation sources 12
- Homogeneity of the radiation field 16 - Measurements of the maximum ene rgy of the
x-ray spectrum a t different kV-meter
settings 16 - Air-kerma measurements 20 - Results and discu ssion 26
3. THE PR OPERTIES O F FIL M A ND P M-TUBES F OR LI GHT
MEASUREMENTS 27 - Measurements of screen-light with a PM-tube 27
- Measurements of screen-light with photographic film 28
4. MEASUREMENT A ND CALCULATION O F AT TENUATION IN X-RAY SC REENS 47
5. THE SE NSITIVITY O F X- RAY SCREENS A T DI FFERENT
PHOTON E NERGIES 56 - Methods and experiment 56 - Result and discussion 61
6. THE R ELATION B ETWEEN E MITTED SC REEN-LIGHT AND THE A BSORBED E NERGY IN THE S CREENS A T DI FFERENT PHOTON E NERGIES 67 - Calculations 67 - Result and discussion 74
(continued)

7. A C OMPARISON O F SC REEN-LIGHT FROM T HE F RONT AND T HE B ACK S CREEN O F A S CREEN PA IR 79 - Experiment and calculations 80 - Result and disc ussion 82 - Summary 91
8. VARIATIONS IN THE M TF O F X- RAY SC REENS W ITH PHOTON-ENERGY 92 - Introduction 92
- Experimental determination of the LSF 96
- Calculations of the spatial deposition of
the fluorescent K-radiation in the screens and its effects on th e LSF and M TF 108
- Results 121 - Discussion 126 - Summary and conclusions 129
9. CALCULATIONS O F SE NSITIVITY AN D M TF F OR D IFFERENT SPECTRAL DIS TRIBUTIONS FR OM X -RAY TU BES 132 - Calculations 133 - Results and discussion 137
APPENDIX 1; CALCULATIONS O F PR ODUCTION, ESCAPE A ND RE-ABSORPTION O F F LUORESCENT K-R ADIATION 140
GENERAL S UMMARY 159
ACKNOWLEDGEMENTS 162
LIST O F S YMBOLS 163
REFERENCES 171

1
CHAPTER 1
GENERAL INTRODUCTION
Intensifying screens are used in x-ray diagnostics together with photographic film to increase the sensitivity of the system ( figure
l . i ) .
supporting layer
^(reflecting layer)
• screen phosphor ^•(protecting surface) ^ film emulsion
film base _ -film emulsion •(protecting surface) —screen phosphor ""(reflecting layer)
-supporting layer
Figure 1:1 Schematic drawing of a film-screen system.
An x -ray screen i s composed of a fluorescent layer (the screen phosphor)
which is mounted on a supporting layer. A re flecting layer is often placed between the supporting layer and the fluorescent layer and in
some screens a thin protecting surface is placed on t he top of the screen. The screens are placed on each side of a double emulsion

2
photographic film. About 50 % of the photons, for commonly used
diagnostic x-ray qualities, incident on t he intensifying screen w ill be absorbed i n the fluorescent layers of the screens. Some o f the
absorbed photon energy will be converte d to light photons and this
light will expose th e two f ilm emulsions. In some cases a photographic film without screens is used behind the patient, but this system doe s
not absorb photons as efficiently as the x-ray screens. This method is therefore much less sensitive and th e examinations have to be
carried out with much larger absorbed dose s to the patient.
There are some important characteristics of x-ray screens which
could be o f interest in the comparison o f different screens. The speed o r sensitivity of a screen-film system descr ibes how m uch radiation, expressed as a specific physical quantity, has to be used to achieve net film density 1.0. The modulat ion transfer function
(MTF) of the system i s a mea sure of the resolution of the system. The MTF o f a screen-film system shows how w ell an o bject with a known spatial frequency distribution is imaged by the system. The MTF concept has been discussed on a basic level by, among others,
Kusoffsky and Carlsson (1973), Nielsen (1980), Nielsen (1981) and in more d etail by D ainty and Sh aw (1974).
Other characteristics of the imaging system are the contrast of the system and the image no ise. An important contribution to the image noise is the quantum mottle, which i s a mea sure of statistical fluc
tuations in the number o f photons that produce the image.
Screen-film systems can be manufactured with different speed, MTF and
noise characteristics. This can be accomplished by changing screen thickness, grain size, fluorescent phosphor components, film etc. A thicker screen will, for example, increase the speed and decrease the quantum mo ttle but at the same time the image will be mo re b lurred,
and the MTF th ereby lower. Different types of screen phospho rs will often have different attenuation characteristies, absorbed energy to

3
emitted screen-light conversion capabilities etc.
The speed o f a screen-film system, expressed as the inverse of the
value of the air kerma giving net film density 1.0, has been me asured as a function of x-ray beam qu ality by a number o f authors (SPRI-report S67 1977, Moores and Walk er 1978, Rossi et coll 1976, Raynolds et coll 1976).These me asurements were carried out with spectral
distributions from diagnostic x-ray tubes. Screen phosphors with approximately the same thickness were found to differ in speed by as
much as a factor of four and in some cases even more f or the same photon q uality. This is mainly due to differences in the energy-to-light conversion capabilities of the phosphors, but also different photon a bsorption characteristies of the screens will contribute to this effect. The speed o f a given system wa s also shown to change
with x-ray quality. This quality dependence i s much mor e pronounced
in screens u sing Gd as high-atomic number element in the phosphor instead of Ba, La and W and the characteristics of the screens are heavily influenced by these heavy elements. There are also differences
between the phosphor ma terials such as the wavelength o f the emitted
light, light scatter in the screens, light transmission etc.
MTF i n x-ray screens has been shown to change with x-ray quality in some x -ray screens (Arnold and Bjärnegaard 1979). This change wa s believed to be an effect of K-radiation which was produc ed in the high-Z elements of the screens and re-absorbed in some o ther part of the screen p air. This effect should therefore be depen dent on both the choice of high-Z element in the screen phosphor and the x-ray photon energy. Also the screen phosphor thickness can be expected to influence the re-absorption probability of the K-radiation and thereby the MTF-reduction.
Change i n radiographic mottle with x-ray quality has been demonstr ated
by Barnes (1976). He has studied a number of screen-film combinations and found a kilovoltage dependence which was d ifferent for different screen phosphors. This difference was a ttributed to differences in
4
absorption characteristies of the screens.
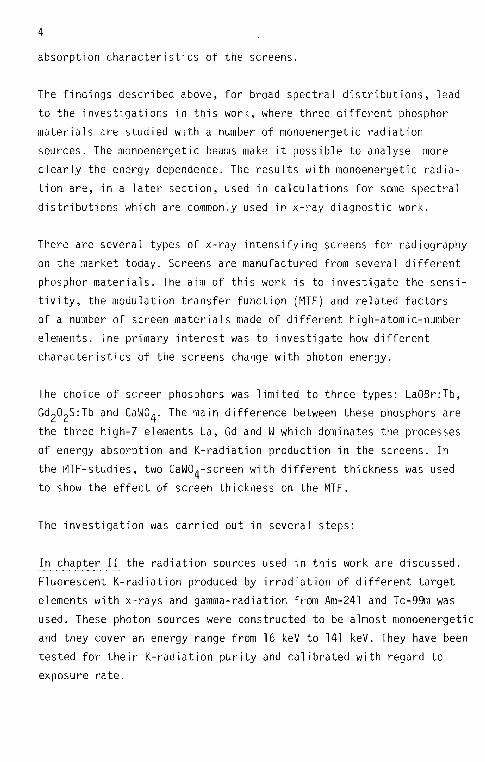
The findings described above, for broad spectral distributions, lead
to the investigations in this work, where t hree different phosphor materials are studied with a number of monoenergetic radiation sources. The monoenergetic beams ma ke i t possible to analyse more
clearly the energy depen dence. The results with monoenergetic radia
tion are, in a later section, used in calculations for some spectral
distributions which ar e commonly used i n x-ray diagnostic work.
There are several types of x-ray intensifying screens for radiography on t he market today. Screens are manufactured from several different phosphor m aterials. The aim o f this work is to investigate the sensitivity, the modulation transfer function (MTF) and related factors of a number of screen ma terials made o f different high-atomic-number elements. The primary interest was to investigate how d ifferent
characteristi es of the screens change w ith photon energ y.
The choice of screen phospho rs was l imited to three types: LaOBr:T.b, Gd^O^SiTb and C aWO^. The main difference between these phosphors are
the three high-Z elements La, Gd and W which dominates the processes of energy absorption and K- radiation production in the screens. In the MTF-studies, two CaW O^-screen with different thickness was used to show the effect of screen thickness on t he MTF.
The investigation was carried out in several steps:
In chapter II the radiation sources used in this work are discussed.
Fluorescent K-radiation produced by irradiation of different target elements w ith x-rays and gamma-radiation from Am-241 and Tc- 99m wa s
used. These photon sources were constructed to be almost monoenergetic and they cover an energy range from 16 keV to 141 keV. They have been tested for their K-radiation purity and calibrated with regard to exposure rate.

5
In chapter III the light sensitive detectors, film and photo-multi
plier tube, are discussed. These det ectors have been used i n the experiments to register the light from the intensifying screens.
In chapter IV measurements of attenuation in the x-ray screens were carried out. This was mainly made to establish the thickness in
_ 2 kg-cm of the screen phosphors.
In chapter V the speed of the screen-film systems was st udied as a
function of photon energy. These m easurements enable calculations
of the speed of screen-film systems to be m ade whe n different x-ray
spectras are used.
In chapter VI the screen light falling on the film has been com pared
to the absorbed energy i n the screens. The screen light could, as a first approximation, be expected to be p roportional to the absorbed
energy in the screen-pair. However, this does not always seem t o be true (Vyborny et coll,1980). One of the factors contributing to the noise in the x-ray image is the random f luctuations in the number of photons in the image or the quantum mot tle. The number of photons
needed to give a suitable film density is dependent on photon e nergy; /thus the image no ise could be expected to be depend ent on ra diation quality. Calculations of the number o f interacting photons giving unity film density were carried out to demonstrate the energy dependence o f this effect.
In chapter VII the light contributions from the front and the back
screens a re compared. Double-emulsion film is often more exposed by light from the x-ray screens on t he side facing towards the x-ray tube, due to increased absorption of x-ray photons in the front screen, especially at low photon en ergies and just above the K-edge of the heavy element in the phosphor. This effect has been s tudied here as both the contrast and the sensitivity of the system cou ld be depen dent
on t his asymmetry (Vyborny, 1979).

6
In chapter VIII the change i n MTF w ith photon energy is discussed. If
there are changes in the MTF, depending on photon e nergy, then this is of importance in clinical practice. The choice of x-ray screens ought then to be m ade w ith regard to the energy o f the x-ray beam use d and the comparison o f different screens must be ma de a t the photon energies at which the screens are to be used. In this investigation the MTF of the different screens wa s studied at different photon
energies. The LSF (line spread f unction) was me asured wh en the screens were irradiated with monoenergetic photons. From th at data the MTF-curves were calculated. The change i n MTF as a function of photon energy was als o theoretically investigated by calculating the distribution of the K-radiation which was produce d and re-absorbed in the
screens.
In chapter IX some o f these energy-dependent screen c haracteristies are calculated for a few spectral distributions which a re commonly used i n clinical practice.
7
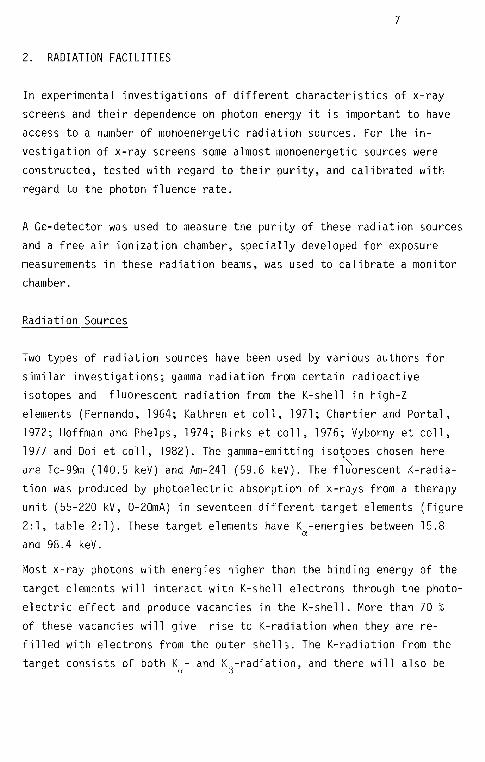
2. RADIATION FACILITIES
In experimental investigations of different characteristics of x-ray screens and their dependence on photon energy i t is important to have access to a number of monoenergetic radiation sources. For the in
vestigation of x-ray screens some almost monoenergetic sources were constructed, tested with regard to their purity, and calibrated with regard to the photon f luence rate.
A Ge-detector was used t o measure the purity of these radiation sources and a free air ionization chamber, specially developed for exposure measurements in these radiation beams, was used t o calibrate a mon itor chamber.
Radiation Sources
Two types of radiation sources have been used by various authors for similar investigations; gamma ra diation from certain radioactive isotopes and fluorescent radiation from the K-shell in high-Z
elements (Fernando, 1964; Kathren et coll, 1971; Chartier and Portal, 1972; Hoffman and Phelp s, 1974; Birks et coll, 1976; Vyborny et coll, 1977 and Doi et coll, 1982). The gamma-emit ting isotopes chosen here are Tc-99m (140.5 keV) and Am-241 (59.6 keV). The fluorescent K-radia-tion was produc ed by photoelectric absorption of x-rays from a therapy unit (55-220 kV, 0-20mA) in seventeen d ifferent target elements (figure 2:1, table 2:1). These ta rget elements have K^-energies between 15.8 and 98.4 keV.
Most x -ray photons with energies higher than the binding energy o f the
target elements will interact with K-shell electrons through the photoelectric effect and produce vacancies in the K-shell. More than 70 % of these vacancies will give rise to K-radiation when they are refilled with electrons from the outer shells. The K -radiation from the target consists of both K - and K-radiation, and there will also be 3 a 3

8
some co herently and in coherently scattered photons. Special filters
have been used to reduce this scattered radiation and the K^~ component in the radiation field (Chartier and Po rtal, 1972; Birks et
coll, 1976; Vyborny et coll, 1977, and Doi et coll, 1982). These
filters have been chose n so that the K-absorption energy o f the filter lies between the K^- and the K^-energy o f the target
radiation (figure 2:2). With this method most of the K^-radiation and the scattered radiation will be absorbe d in the filter.
Filmcassette
Lead wall
20 mA
Monitor
0 2 cm
(pos.2) @
\\\\\\\̂ x\̂
30 cm 10 -150 cm
Figure 2:1 The K-radiation generator. 1 K-radiation target used to produce K-radiation. 2 Filter used to filter out K^- and scattered radiation 3 Collimator

9
£~ O 5
CU O
~a ra u.
c o
4-> n3 Q
-Q fÖ I—
CU -t-> fö fö ^—-E £ i—
1 X cu * 00 O 00 CO CVI o ro ro oo 00 l\ 1̂ . ro CVI 1̂ . ro
CU >} • Q. S- 4-> CD 1— CVJ cvj CVJ OO CVJ CVJ 1— CVI 1— 1— i— CVJ r— CVJ CVJ CVJ O-T- fö p.
<C fö
<D cn cr> s- eu s~ fö CU -C <D X— S-. c: 4-> 4-> > 1 LO 1 00 1 o ro LO r-̂ cn LO LO i 1̂" 1 LO CU CL) i— cu > i t+- T- C\J ro ud UD UD r»» 00 cn O O CVJ O
<C —I o q- — 1— 1— 1— 1— CVJ CU
c cu cn o cu 4-> > ~o •r- _C -—-, CO O cu 1 o 1 CVI 1 o ro LO CO 4-> Z3 JD 1 CO •<—> fö o o o ro o i— ro ro UD UD O CVJ 1 O •r- -C i— 1— CVJ E cn i- CU 00 3 cu cn C O 4-> -t-> O ~o fö S~ i— CO i— cu S- -C • i— =3 CU 1 1 CNJ 1 cn 1 UD LO CVJ r-v CVJ cn cn cr> ro 1 cn
1— + -> 4- •r-)-Q CVI ro CVJ LO ro UD LO LO LO CVJ UD UD
cu _Q 13 +-> CU >
CO LO LO LO LO LO LO LO LO o o o o o O LO LO LO >> fö v -- LO UD 00 00 00 oo r— 1— i— ro LO LO oo 1— fö +-> t— t— T— CVJ i- r—
1 O X >
>> CD
CU S-cn cu fö e — 00 LO CVI ro CVJ «vi r--. i— O r— LO ro oo o "=3_ «3-
cu > • CU 1 eu LO t\ CVJ LO CVJ ro o ro (Ti CVJ r̂ > cn oo LO ro 00 > ö 1— 1— CVJ CVJ ro ro ro •=3" LO LO LO UD r̂ cn cn < ̂
00 00 CU CVJ
S- C 1 CU E CO ro r-̂ o oo ro UD 1— O UD i— i— o LO LO CVJ
+-> O • i 'r— O) o 1— CVI i— CVJ CVJ i— CVJ i— CVJ CVJ CVI CVJ UD CVJ •vJ- ro •r- _£Z Ü_ +->
( fö
%- -r-CU i-+-> cu 1— &- p— cn i— fö fÖ CU E "O s- -Q JQ Z3 =3 -C
1— 4-> c c <=C <C CQ _J O oo CJ3 LU >- >- 32 <c O \— T- fÖ Li- E
00 co cu ev i -V
4-> C 1 (J CU - V E CO o o CVJ 00 ro UD i— o UD i— LO O LO o CVJ •r-cn o » • • • JZ
-r- CD r— r— 1— r— CVJ T— CVI i— CVI CVJ CVJ CVJ UD CVJ ro +-> rö -C
1— 4-> v— 4-> C O) o r— to fö CU 4-> • 1— S- cu i- o cn e fö fÖ CU E "O £- JD fÖ -Q _c O CT) cu M c 00 CQ o oo o LU >- 1— 3 <c Q_ 1— ZD =3 S- +->
i— fö fö Li— -M E
S-
c: O) O) s-
q-o
e o S~ M—
CU s~
"O cu s-fO CU

10
H Z 0.5
n TT, i \
05
ft —ftp2
fe S 0.5 Z H uj g
o 100 120 140 20 60 80 40 PHOTON ENERGY/keV
Figure 2:2 Schematic re presentation of photon spectra and photon
attenuation of the K-radiation source. a) the attenuation characteristies of the K-radiation target
b) the secondary r adiation from the target c) the attenuation characteristics of the filter
d) the filtered K-radiation
11
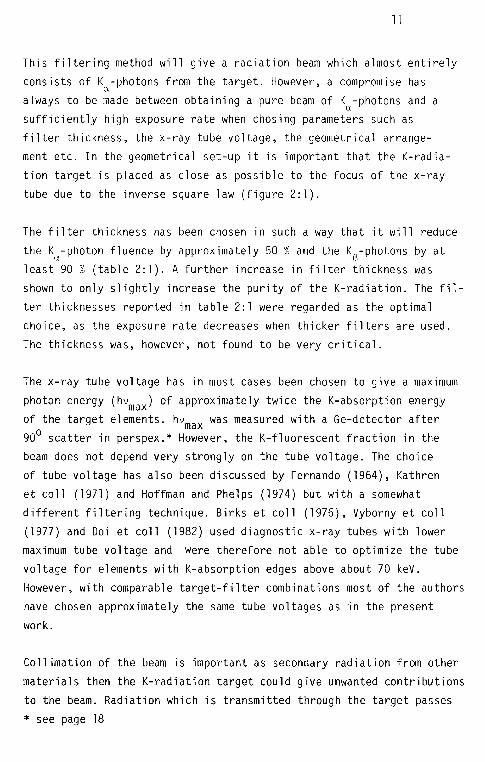
This filtering method w ill give a radiation beam which almost entirely
consists of K^-photons from the target. However, a compromise has
always to be m ade between obtaining a pure beam of K^-photons and a sufficiently high exposure r ate when chosing parameters such as filter thickness, the x-ray tube voltage, the geometrical arrangement etc. In the geometrical set-up it is important that the «-radiation target is placed as close as p ossible to the focus of the x-ray
tube due to the inverse square law (figure 2:1).
The filter thickness has been chose n in such a way t hat it will reduce
the K^-photon fluence by approximately 50 % and the K^-photons by at least 90 % (table 2:1). A fu rther increase in filter thickness was
shown to only slightly increase the purity of the K-radiation. The filter thicknesses reported in table 2:1 were regarded as the optimal
choice, as the exposure rate decreases when thicker filters are used. The thickness was, however, not found to be ver y critical.
The x-ray tube voltage has in most cases been chose n to give a ma ximum
photon energy (hvmax) of approximately twice the K-absorption energy of the target elements, hv w was m easured with a Ge -detector after 3 max 90 scatter in perspex.* However, the K-fluorescent fraction in the beam doe s not depend very strongly on t he tube voltage. The c hoice of tube voltage has al so been discussed by Fernan do (1964), Kathren
et coll (1971) and Hoffma n and Phelps (1974) but with a somewhat different filtering technique. Birks et coll (1976), Vyborny et coll
(1977) and Doi et coll (1982) used dia gnostic x-ray tubes with lower maximum tube voltage and were therefore not able to optimize the tube voltage for elements with K-absorption edges above about 70 keV.
However, with comparable target-fiIter combinations most of the authors have chosen approx imately the same tube voltages as in the present
work.
Collimati on o f the beam is important as secondary r adiation from other
materials then the K-radiation target could give unwanted c ontributions to the beam. Radiation which is transmitted through the target passes
* see pag e 18
12
into a lead enclosure, see fi gure 2.1, and is not able to re-enter the beam or leak out to give 'background' radiation. The K -radiation targets and f ilters have a min imum diameter of 25 mm. The e ffective size of the radiation source was co llimated down to 10 or 20 mm in diameter when a circular beam w as used. In some case s, a slit-formed beam w as used, with the dimensions of the collimator being 25 mm X 5 mm.
Purity of the radiati on sources
Contamination of K^-radiation beams with photons of other energies have been studied.These measu rements were used both to optimize the K-radiation sources and to give some e stimation of errors due t o impurities of the K-radiation beams.
9!d§l2Ïl˧_2f _ 5tl§_QËZ tor
The p urity of the K-fluorescent radiation has been evalu ated by spec
tral measurements with a high purity Ge-detector (PGT 210). The energy resolution of the system f or full width at half maximum (F VHM) was
0.3 keV at 16 keV and 0.5 keV at 140 keV, The sensitive volume o f the cylindrical detector has a diameter of 16 mm a nd a thickness of 10 mm.
There i s a thin gold contact layer on the frontal surface of the 2 detector. This gold layer is less than 50 yg per cm and co rrections
for absorption in and secondary r adiation from this thin layer are
insignificant for the purpose of this investigation. The d etector is placed in a cryostat with a 0.5 mm thick beryllium window in front of
the detector. This beryllium window w ill attenuate low energy photons
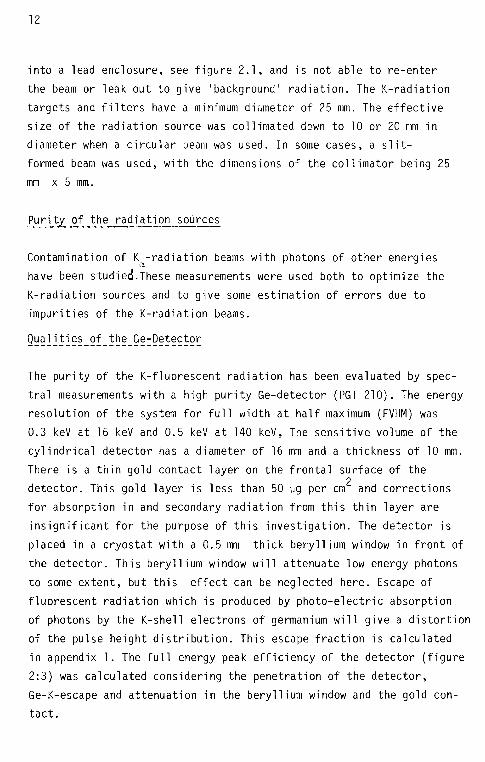
to some e xtent, but this effect can be neglected here. Escape of fluorescent radiation which is produced by photo-electric absorption of photons by the K-shell electrons of germanium w ill give a distortion of the pulse height distribution. This escape f raction is calculated in appendix 1. The full energy peak efficiency of the detector (figure 2:3) was ca lculated considering the penetration of the detector,
Ge-K-escape and a ttenuation in the beryllium window and the gold contact.
13
Another factor influencing the pulse height distribution is the escape of compton-scattered photons. At energies above about 60 keV this
effect has to be c orrected for. Above this energy most o f the escaping
photons w ill leave the detector through the front surface. As can be seen from figure 2:4, the energy o f the scattered photons (90° to 180°) contain much m ore tha n half the energy o f the primary photon.
The energy o f the compton electron which is absorbed in the detector
will therefore be m uch lower than that of the primary photon. Calculations of compton escape have been c arried out by a number of authors
e.g. Yaffe et coll (1976) and Swahn (1977). The d etectors used by
these two au thors were 5 mm th ick. An approximate recalculation of their data to the present 10 mm thi ck detector was c arried out by
correcting for the increased attenuation in the detector. This also gave a decrease in escape through the exit surface of the detector. The num ber of compton photons escaping has been est imated to be le ss than 8 % of the number of incident photons with energy of 140 keV, less than 3 % at 100 keV and less than 1 % below 70 keV. These figures are in good agreement with later results from Mont e Carlo calculations carried out by Chen et coll (1980). The d etected compton electrons will in general be o f such a low energy t hat, with regard to the present filtration, no photons in that low energy interval could be pre sent in the photon beam. These pulses could therefore
be i dentified as compton-escaping photons.
o 100
80
60
40
60 100 20 40 120 140
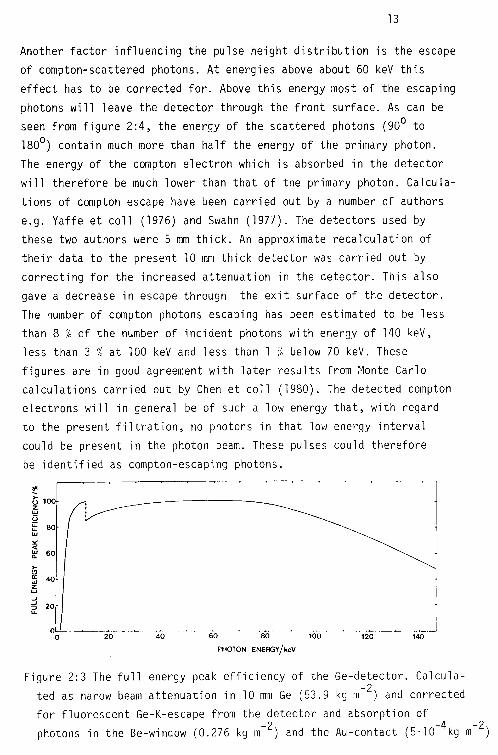
Figure 2:3 The full energy peak e fficiency of the Ge-detector. Calcula-_ 2 ted as narow be am att enuation in 10 mm G e (53.9 kg m ) and corrected
for fluorescent Ge-K-escape from the detector and absorption of -2 -4 photons in the Be-window (0.276 kg m ) and the Au-contact (5-10 kg m

14
45' scattering angle
ENERGY OF PRIMARY PHOTONS/ keV
Figure 2:4 The energy o f incoherent-scattered photons (solid line)
and electrons (broken line) at different scattering angles as a function of the initial photon energy.
As the photon be ams are approximately monoenergetic corrections for compton escape can easily be m ade w ith a knowledge o f the compton-escape f raction, approximate energy d istribution of secondary comp ton electrons and f iltration in the photon bea m.
The radiation geometry in these spectral measurements was chos en so that the photon f luence rate on the detector would not be high er than 2 000 photons per second. A highe r fluence rate would m ake i t necessary to decrease the time constant in the amplifier, which was chos en to be 10 ys. A sh orter time constant will give some re duction of the
energy r esolution of the system and a t higher pulse rates there will be so me pile-up in the system even wh en the pile-up rejector is used.

15
The photon be am w as collimateci by an ap erture of 1 mm diameter in
front of the detector. Both the detector and the x-ray tube were lead-shielded to prevent scattered radiation from reaching the detector. Background c ontributions were mea sured and subtracted
from all pulse height distributions.
Pynîy_Check_of the_Tc-99m and_Am-241 _Gamma Sourc es
Tc-99m has been used as a radiation source with a main gamma energy
of 140.5 keV. The a ctivity used wa s approximately 3 000 MBq i n a solution of 5 to 10 ml. The source wa s surrounded by a lead shield but the irradiation geometry wa s arranged so that no c ontribution
of secondary r adiation from the lead shield could enter into the beam. A f ilter of 0.3 mm Cu was used t o reduce the contribution from
low-energy compton-scattered photons. The spectral contribution of the photons wa s mea sured w ith the Ge-detector. The reason f or these measurements was mainly to determine the contribution of photons which are incoherently scattered in the solution. In these meas urements a
contribution from photons of energies below 50 keV was observe d in the pulse height distribution. This contribution was about 3 % of the total number of pulses in the spectrum (after corrections for transmission through the detector were carried out). This figure should be com pared t o the calculated compton escape f raction when the detector is irradiated by 140.5 keV photons. This fraction was as about 8 % but some o f these interactions will give so l ittle energy to the secondary e lectron in the detector that they not will be dete cted. In the measurements all pulses detected below 50 keV have therefore been regarded as being due to compton escape induced by the
140.5 keV photons. The m aximum err or in this approximation is estimated
to be 1 % of the total number of photons, 88 % of the photons in the pulse height spectrum were found in the keV-peak and 91 % after correction for compton escape from the detector. The r est of the photons were compton scattered in the solution. The dominant part of this contribution had energies between 90 and 141 keV.

16
The 59.6 keV photons from Am-241 were used i n attenuation measurements on t he x-ray screens and in a constancy check on the sensitivity of
the screen-film system. This source i s capsuled in such a way th at most o f the gamma ra diation with energies lower than 59.6 keV is
absorbed in the source. Only very small amounts o f lower energy radiation were detected.
Purity Check_of_the_K-radiation__Sources
The fluorescent K-radiation sources wa s tested with regard to the fraction of photons in the and K^+K^ peaks. The fraction of K -radiation in the beam wa s meas ured to be betwe en 82-94 % of the a total number o f photons and th e fraction of and between 91-95 7o9 see table 2:2. For some f luorescent sources suitable filter
ing elements with the K-edge betw een K^- and K^-energy could not be
found. In these cases other filters were used and the purity of K^-and Ka -photons was lower but never less than 62 % and 80 %
respectively. Some t ypical measured puls e height distributions are presented in figure 2:5. These fin dings are very similar to experiments carried out by Vyborny et coll (1977) and Doi et coll (1982)
except at energies where no suitable filter was found and a t higher energies where t heir diagnostic x-ray unit not was abl e to give as
high kV as would have bee n needed.
In these purity measurements, the filter was placed in two d ifferent positions to check the contribution of secondary r adiation from the filter. In position 1 the filter was placed about 10 cm in front of the target foil and in position 2 about 2 cm from the target (figure 2:1). The contribution of K-radiation from the filter was found to
be betwe en 1 and 4 % of the total number of K^-photons when the filter was placed in position 2 (table 2:2). With the filter in position 1
no de tectable contribution was presen t in the beam.

17
1.0
OS
Target: Mo
Filter: Zr
1 1.0 LU »-z
0 0.5 cc LU Z LU
0 K (/) §1.0
5 1 CL
0.5
Target: Y b
Filter : Er
1 1 ii i i i
Target: U
Filter : Th
JL 20 40 60 80 100 120
PHOTON ENERGY/ keV
Figure 2: 5 Examples of measured pu lse height distributions of the
fluorescent K-radiation when d ifferent sets of K-radiation targets and filters are used.
The most important contamination of the K^-radiation is scattered radiation and K-radiation from the target which to some e xtent
p penetrate the filter. Typical for these contaminating photons are that they have energies very close to that of the K^-radiation. These contaminating photons have to be c orrected for if screens with dis
continuous or very rapidly changing c haracteristies within a small
energy interval are investigated.

18
Homogeneity of the Radiation Field
The homogeneity of the radiation field was check ed usi ng an intensifying screen-film system i n a cassette. The film was expo sed to give a total optical density of about 1.0. The d ensity distribution was
then measu red and re calculated to an exposure d istribution making use of the relation between film density and film exposure (HeD-curve;
chapter 3) This HeD-curve was determined from mea surements carried out for approximately the same i rradiation time as in the homogeneity measurement. With this method th e homogeneity of the field 50 cm from the target was found to the better than + 1 % within a diameter of 1 cm an d + 3 % within 2.5 cm. Most me asurements have been carried out with radiation fields smaller than 1 cm in diameter.
Measurements of the Maximum En ergy o f the X-ray Spectrum a t different kV-meter Settings
The "true" kV of our x-ray unit had to be kno wn fo r intercomparisons with the x-ray quality used by other authors. As the kV-settings of the therapy unit used i n the experiments were not calibrated, the maximum photo n energy o f the x-ray spectrum had to be determined. The tube was fi xed in a position so that direct measurements in the beam
would have been complicated. Instead the spectral distribution of 90° scattered photons from the x-ray tube was m easured with the Ge-
detector. From these measurements the maximum ener gy of the primary spectrum was determined. This method has been used by others to measure
the spectral distribution from x-ray tubes e.g. Yaffe et coll (1976). Most o f the photons which are detected in these mea surements are
incoherently scattered once in the perspex scatterer. The incoherent scatter cross section for 90° scattering was ca lculated and compared
to the cross-section for coherent scatter. Form fa ctors and scatter functions published by Hubbe l et coll (1975) were used. These calculated
cross sections indicate that the fraction of coherent-scattered photons could be neg lected.

19
1— CO £Z (XI C\J O 4-> C cu O O S- _c • 1— Z3 Q- -M cn 1 -d •!-4— -M co M— O cu •i- O • 4-> !S Q-CU i— cu "O cn •i— C o a> fÖ 4— fÖ -I-S- CO cu 13 ZJ c CU Q- S~ O cu JZ 1 CU CO cu o +-> ca +->
s .̂ + •— c fÖ <u C Ö o Q_ •1— ^ 4— 4-> fö (XI "O OJ fö s- JO cu fÖ -C cu +-> 4-> _c CO +-> <u c CU _c o > E +-> 4-> O o O -Q U- o _c fÖ M— +-> c_ fö CU C cn 4— Q-o c O 1 • (— • 1— ca 4-> "O CU fö S- cn CU •i— o fÖ JC "O o +-> 4-> fö CJ c fÖ s~ fÖ cu S cu 1 o o Q_ CO i— 1 cn cu cu Ö cu c Q_ -Q .c •r—
+-> +-> 4-> 4- cu O CO CO 1 C CO >> > o 4-> +-> fÖ •r— o cu S- -a sz o_ =3 sz Cu 1 Q. fÖ ca <4- CU + -a CO O _c S cu s- 4-> cu CU 13 -t-> cn C co r— fÖ •r-fö •1— 4-> <u q- c: fö E CU cu
#* CJ Cl CU +-> %- i -C cu cu Ö 4-> cn Cl. S-£Z fÖ O +->
fÖ c %-4-> cu CU fÖ 4-> Q s i— LL. CM
OsJ -»-> CU CU cn -Q S-fÖ fö 1— 1—
O C \ J C \ J C \ J C \ J O O P O C O C O L D
CO CM ̂ n 00 ro O O O O C O C O O O P O C \ J O O
ro co N oj w co po po po ro po
Oi CTi (TI CT) cn oo cn cn cx> cn cn cn cn
cn Ol Ol CTì Oi Ol CT)
cn o r-oo cn
oo oo
i— cn i— c C <c fö <Ö CU E "O OO CD
O cn "iE <C
fö fö CU Z3 -Q C Q-

20
The ma ximum ene rgy of the scattered spectrum was estimated by extra
polation of the slope of the high energy p art of the pulse height distribution. The ma ximum ene rgy of the primary spectrum was then calculated with regard to the energy o f the 90° incoherent scattered
photons. The accuracy of these results depend on how e xactly the scattering angle can be defined, the resolution of the detector, and how ac curately the maximum ene rgy can be estimated from the measured
pulse height distribution. This could be an effect of high voltage variations, some pu lse pile-up even when the pile-up rejector is used and perhaps small contributions of coherent-scattered photons. The uncertainty is considerably smaller than + 5 keV and thus was
considered to be an acceptable value for this investigation.
Air Kerma Mea surements
The speed o f screen-film systems are often in terms of the inverse of
exposure or air kerma at the surface of the cassette when the cassette is absent. This is a practical quantity to use as ionization chambers are often calibrated for exposure or air kerma meas urements. When m ono-energetic radiation is used i t is also quite simple to determine the
energy fluence or photon f luence from exposure or air kerma measur ements .
A fr ee air ionization chamber was con structed for the measurement o f
the exposure rate from monoenergetic photon sources with low exposure rates and energies between 16 and 140 keV. Air kerma, photon fluence and energy f luence were then calculated from these exposure measur ements. When t he fluorescent radiation sources were used i n the
irradiation of, for example, x-ray screens a thin transmission ionization chamber was used as a mo nitor. This monitor was then calibrated against the free-air ionization chamber.
21
Th^_f r§Ë_§lî2_ 2 2Dl?§5l2G_9
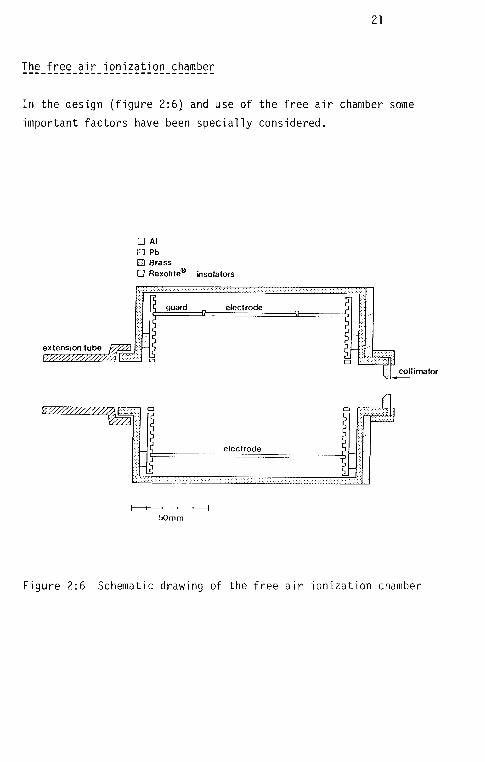
In the design (figure 2:6) and use o f the free air chamber some important factors have been s pecially considered.
• Al • pò E3 Brass • Rexolite® insolators
extension tube ^
guard ^ electrode
SH collimator
Y//////////77777,_
electrode
I < » » 1 1 50mm
Figure 2:6 Schematic drawing of the free air ionization chamber

22
There has to be charged p article equilibrium within the measuring
volume o f the chamber and the secondary electrons should not reach any e lectrode before they have lost all their initial kinetic energy i.e. the dimensions o f the chamber should be s ufficiently large compared t o the electron range. For a primary photon w ith energy o f 100 keV the maximum ener gy of a secondary electron is 28 keV. The
path length of this electron is approximately 20 mm in air (Berger and Seltzer, 1964). The d istance between the collimator and the
measuring volume has been chose n to be l arger than 40 mm a nd the
distance between the edge o f the photon beam and th e electrode is larger than 30 mm.
Contributions from photons which have been s cattered outside the
measuring volum e is less than 0.5 % but this contribution will approximately be com pensated by the loss of secondary e lectrons (NBS Ha ndbook No 64, 1957). The exact sum of these two dist urbances
is not well known b ut it is believed to be small and no c orrections were applied.
In this chamber it is possible to change the distance between the collimator and the measuring volume. Such chan ges d id not affect the response wh en co rrections for changes in air attenuation were carried out.
The attenuation of photons betwe en the collimator and the measuring volume has been c alculated. This distance is less than 76 mm a nd the attenuation is less than 0.6 % for photons w ith energies between 16
and 141 keV.
The electric field strength between the electrodes need be no larger
than 250 V/cm (N BS Ha ndbook No 64, 1957) for air kerma rates smaller than 8 mGy s~\ As the kerma rate in the photon be am from the K-fluorescent sources used in this work is less than 3 yGy s ^ it should be po ssible to use smaller electric fields. A dista nce between the electrodes of 9 cm w as used. (In this chamber it is also possible

23
to change the distance between the electrodes, see fi gure 2:6). It
was found by measuring the recombination in different electric fields
that 100 V/cm, which wa s normally used, was m ore than sufficient at these low exposure r ates.
The chamber is equipped with a collimator defining the width of the measuring volume. These co llimators was m ade o f 4 mm thi ck lead with circular holes.The diameter of the collimator holes are 5, 10, and 20 mm.
The penetration of the lead-shielded wall of the chamber and scatter
of photons in through the exit hole of the chamber was chec ked by using a lead plate instead of a collimator. The c ontribution of pene
tration and scatter was found to be le ss than 0.3 % for photon bea ms of much larger field areas than the chamber if the exit hole was shielded with an e xtension tube to prevent scatter into the chamber (see figure 2:6). Without this extra shielding of the exit hole, the scatter contribution, which varies with photon energy and field size,
was, in some cases , found to be m uch larger.
The measuring volum e is not well defined. Special guard wires are normally used for this purpose but in order to simplify the
construction of this chamber it was on ly equipped with three guard-plates with rather large potential difference between each o f them. Therefore it is not possible to define the measuring volume e xactly, which ma kes a calibration of the chamber necessary. The response of
this chamber should, however, be independent of photon energy making calibration at more than one photon energy unnecessary.
The c alibration constant in Gy per nC o f the chamber has been determined both by calibration at the national standards laboratory (SSI) and by c alculation. In the latter case th e effective volume of the chamber was on ly approximately estimated. The calibration was made w ith a collimator of 20 mm in diameter. Correction for pressure and temperature has been c arried out to the references 101.325 kPa
24
ana 295° K respectively. The correction for air humidity was d isre
garded. The calibrations have been m ade in x-ray beams with different kV and f iltration to check the response of the chamber, see figure
2:7.
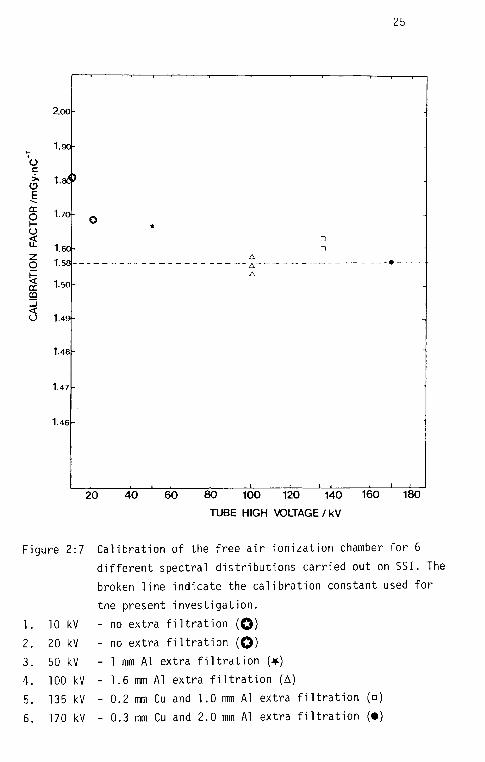
At energies higher than 100 kV and 1.6 mm Al -fi1tration the spread o f the calibration values is less than + 3 %. In the low energy beams
(below 100 kV and 1.6 mm AI) SSI could not guarantee better accuracy tnan + 10 % . Consequently these meas urements were regarded as less
significant. The calibration constant from the measurements at higher energies was used i n this case. The chamber response calculated from the chamber dimensions was 5 % lower than this value (i.e. 1.58 riiGy n C~\ see fi gure 2:7) obtained from calibration in the high energy
range. Part of the discrepancy may po ssibly be exp lained by the
insufficiently well-defined electric field.
25
20 40 60 80 100 120 140 160 180 TUBE HIGH VOLTAGE/kV
Figure 2:7 Calibration of the free air ionization chamber for 6 different spectral distributions carried out on SSI. The
broken line indicate the calibration constant used f or
the present investigation.
1. 10 kV - no e xtra filtration (O)
2. 20 kV - no e xtra filtration (O)
3. 50 kV - 1 mm Al extra filtration (*)
4. 100 kV - 1.6 mm Al extra filtration (A)
5. 135 kV - 0.2 mm Cu and 1.0 mm Al extra filtration ( n
6. 170 kV - 0.3 mm Cu and 2.0 mm Al extra filtration (•:

26
In these experiments on x -ray screens, this accuracy is acceptable compared to other factors which ar e very difficult to define and which will give much larger variations in the absolute sensitivity of a screen-film system. Most importantly it is possible to keep the air kerma mea surements constant and independent of the photon
energy. In this respect a free air ionization chamber of a simple design can be regarded as a good air kerma meter even if the absolute
value of the calibration constant may be in error by as mu ch as 5 % .
M°ni tor_Chamber
During the irradiation of the screen-film systems a transmission ionization chamber with thin walls of mylar foil was use d as a
monitor. This monitor was placed in the beam (fi gure 2:1). A lead shield with a small hole was placed 'downstream' from the monitor to prevent any change i n back-scatter to the monitor from the x-ray screens, detectors etc, which could influence the calibration value of the monitor.
Results and D iscussion
Nineteen almost monoenergetic radiation sources were constructed.
Studies of the photon spectrum from these sources show th at almost all photons have energies within a very narrow energy range. This makes these sources suitable to use in studies of energy behaviour of, for example, different types of radiation detectors. A l imiting factor of their use is the rather low air-kerma rate. This was always less than 3 yGy s~^ at a distance of 30 cm from the source.

27
CHAPTER 3
THE PR OPERTIES O F FIL M A ND P M-TUBES F OR LI GHT M EASUREMENTS
Both photographic film and a photomulti piier tube (PM-tube) have been used t o measure light from x-ray screens. These dete ctors have
different properties which ma ke them su itable for use in different types of measurements. Both the PM-tube and the film can be manufac
tured with different spectral sensitivities. If the absolute values of the screen sensitivities are to be com pared the spectral sensitivity of the light detector must be considered as the different screens
have different light spectra. In this case t he choice of light detector will be ra ther critical. None o f the detectors used i n
this work are, however, optimized to enable such mea surements to be m ade. Here the different screen-film systems have been tr eated as a complete system and most interest has been pa id to the energy dependence of the screen-film characteristics. Geometrical conditions, linearity of the system, correction for different distortions etc has also to be consider ed in the choice of light sensitive detector. In this section these factors are discussed and the light-measurement set-up is described.
The films used in this work were either IIford Rapid R, Agfa Gevaert RP1 or 3Ms XD-film. In the choice of PM-tube the only criterion was to achieve an acc eptable signal-to-dark current ratio of the system.
Measurements of Screen-Light with a PM-tube
The PM-tub e has a linear relationship between the light to the PM-tube and the measurement signal, which simplifies the evaluation of
the measurements. There i s, however, a small leakage current in the PM-tube so , in the measurements of small currents, a correction is needed.

28
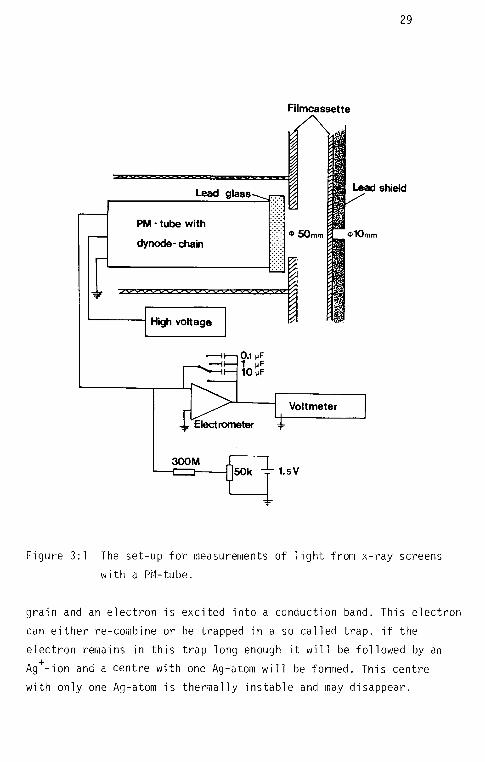
The photomultipiier, which was sh ielded with lead glass, was placed on the back of an o rdinary film-screen cassette (figure 3:1). The dynode cha in of the PM-tube was connected t o a stabilized high voltage power supply and the current from the PM-tube was in tegrated
with an i ntegrator-coupled electrometer. A sp ecial current was connected a nti-parailei to the signal to compensate for the dark current in the PM-tube. The voltage on t he input side of the integra
tor will change wh en the signal and thereby the voltage over the condensator changes. Therefore, the compensating current may als o vary during the measurement if precautions are not taken to minimize this effect. The voltage level in the compensating circuit must be chosen so that it is much larger than the voltage change on the input siae of tne integrator. This will make the relative voltage change across the 300 Mft-resistor (figure 3:1) small and the change in the compensating current will thus be s mall.
The linearity of the system was check ed and the sensitivity to x-ray photons was me asured and found to be n eglible.
Measurements of Screen-Light with Photographic Film
In most of the experiments film has been chosen as light detector
when film normally is used as the light detector between x- ray screens in clinical practice. The use of a PM-tube instead will (in
most cases) exclude the possibility of making mea surements on bo th
screens in a cassette, i.e. in the geometry of clinical interest. If measurements are carried out on o nly one screen, effects of secondary r adiation produced in one screen and re-absorbed in the
other one would, for example, not be included in the measurements.
Photographic film as a light-sensitive detector can be described in a simple way by , for example, the Gurney-Mott model (Dixon and Ekstrand, 1976; James, 1977). This model describes the physical process in the film emulsion when i t is irradiatied with visible
light (figure 3:2). A l ight quanta is absorbed in a silver bromide
29
Filmca ssette
Lead shield Lead glass
PM - tube with
dynode- chain
High voltage
0.1 nF 1 JiF 10 mF
Voltmeter
300M 150k 4-1.5V
Figure 3:1 The set-up for measurements of light from x-ray screens
with a PM-tube.
grain and an el ectron is excited into a conduction band. This electron can e ither re-combine or be tr apped in a so c alled trap, if the
electron remains in this trap long enough i t will be fo llowed by an
Ag+-ion ana a c entre with one Ag-atom w ill be formed. This centre with only one Ag-atom is thermally instable and ma y d isappear.

30
The average lifetime of such a centre is about 8 seconds. If more electrons and Ag+-ions are trapped at this centre it will be mo re stable but it will not be developable before it is large enough. When t he film is further illuminated the stable centre will grow and norma lly form an developable grain. The developing of a film will normally start in a developable centre or in a d efect of the film (defects will give fog in the film).
Figure 3:2a Schematic diagram of the nucleation stage of latent-image
formation, according to a mod ified version of the Gurney-Mott theory (James 1977).
Figure 3:2b Schematic diagram of the growth stage of a latent image
formation (James, 1977).

31
The o ptical film density as a function of the amount o f light falling
on t he film (usually referred to as light exposure) is called the HsD-curve (figure 3:3). At low film exposure the density increases
very slowly. This is called the toe of the HeD-curve and is dependent on t he fact that many of the induced c entres not are developable. The
shoulder of the film curve is reached wh en m ost of the Ag-atoms have bee r used up and the density cannot be very much further increased. Between the toe and the shoulder of the HeD-curve there is a part which can
be regarded as approximately proportional to the logarithm of the exposure of the film. If the film is irradiated with ionizing radiation
instead of light the toe in the HeD-curve w ill be absent as one "hit" by a secondary electron is usually sufficient to make a grain develop
able. More t han one interaction is normally not needed.
È 2" </) s D
U.
100 10 1 FILM EXPOSURE/ARB.UNITS
Figure 3:3 Film density versus exposure. Curve 1: for a typical photographic material. Curve 2: for the same ma terial after a u niform post-exposure at low intensities or an exposure at a constant very low intensity of light (James 1977). Curve 2 can als o be obta ined with ionizing radiation.

32
It}Ë_§2Ë95irÊl _§§•§! ïiyiîy_2f_ïtiË_f ili}
X-ray screens f or clinical use e mit light in the wave le ngth region between 375 and 624 nm. This light is emitted as a continuous spectrum in some screens and as line spectrum in other screens (Stevels, 1975).
Different types of film emulsions are made to fit the colour of the
emitted light from the. . screens. Some of them are so-called blue-sensitive and others are green-sensitive. In the measurements of the MTF th e same b lue-sensitive film was used w ith both the blue- and the green-emitting screens. This should not affect the relative change i n
MTF as a function of photon energy but it may a ffect the true MTF as light of a d ifferent colour may be transmitted, scattered etc in different ways i n the films. Light cross-over between the film-emulsions
may als o produce different effects on t he MTF, depending on th e matching of film and s creen-light colour. This effect should not change w ith photon energy.
The colour of the emitted light from the screens was ass umed not to change w ith x-ray photon energy wh en only one phosphor ma terial was used in the screens. The d ifference in speed between screen-film systems w ith the same screens but different films has therefore been regarded as independent of photon energy. Calculations of the screen-
film sensitivity when d ifferent films were used with a screen p air were ma de wi th an ex perimentally determined energy independent factor. This factor was m easured as the quotient of the sensitivity of screen-film systems when d ifferent films were used with the screens. These m easurements were carried out in an 80 kV x-ray beam wi th extra filtration of 20 mm Al. The exposure time was 0.1 s.
The colour of the screen-light was as sumed not to change the HeD-curve
and the reciprocity law failure^ of the films (James, 1977). This reciprocity failure is,however, different for different films.
ty ' When a film is exposed to visible light up to a specified film
density the reciprocity law says that the exposure time should be inversely proportional to the light intensity. This is normally not valid and the deviation from this reciprocity law is called "reciprocity law failure" or simply "reciprocity failure".

33
Corrections for Different Film Sensitivity Depending on M anufacturing, Storing and Developing
The sensitivity of the film batch may chan ge w ith time if there has been chan ges in storing-time, developing etc. To enable corrections for these changes a small area of each film used in the experiments
was placed between two x-ray screens and the screen-film system wa s irradiated with an Am -241 g amma source. This gamma source was mo unted
in a fixed geometry and the exposure time was appro ximately 3 minutes. This time is comparable t o the exposure time used i n the experiment.
From t his the correction factor for changes in film sensitivity was
found. To fu rther decrease any p ossible errors all measurements on a given screen were don e on the same f ilm.
Reciprocity Law_Fai lure_i n_Fi lm_Emul si oris
The sensitivity of a photographic emulsion to light is dependent on the light intensity during the exposure. This effect is called the reciprocity law failure and has to be c orrected for when d ifferent
exposure times for photographic films are used.
The reciprocity law failure in a film emulsion depends on two types
of processes which decreases the sensitivity of the photographic material. The r eciprocity law failure is of importance both at high and low light intensities (figure 3:4). In the experiments in this work when the screen-film system is irradiated with x-ray sources of
low intensity, only the low intensity reciprocity failure is of im
portance. The low intensity reciprocity failure is due to recombination of instable centres with too few Ag-atoms. This reciprocity failure will be l arge at low light intensities when the time between each
ionization at a centre is large; centres with only one Ag-atom w ill then often recombine before a second i onization occurs. A cen tre with only one Ag-a tom i s very instable but a centre with two o r more Ag-
atoms has an average lifetime of about 24 hours. The further building
up o f a stable centre will then continue with the same e fficiency

34
independent of the light intensity. At low intensities every new stable centre will grow further and be deve lopable. Small instable
centres will to a large extent recombine and disappe ar. The fraction of small, non-developable centres will therefore be s maller when lower exposure rates are used. This will then influence the HeD-curve and es pecially the toe part of the curve (figure 3:3).
The high intensity reciprocity law failure is due to the limited
mobility rate of Ag+-ions (according to the Gurney-Mott m odel). In high intensity exposures a lot of ionizations will occur but no mo re than a few e lectrons can e xist at the same s ite when no Ag+-ions are present. The Ag+-ions are needed t o electrically neutralize the electrons. High intensity exposures will thus prociuce many centres which are so small that they are undevelopable or instable.
LU O z ILI 3 _1 LL I-X O -I
LOG.LIGHT FLUENCE RATE
Figure 3:4 A re ciprocity curve of an emulsion showing both high
intensity and low intensity reciprocity law failure; Light fluence needed t o achieve a given net film density when the light fluence rate is varied (James, 1977).
When photog raphic emulsions are directly irradiated with x-ray photons a whole show er of electrons will be produce d around th e centre. A developable centre will normally be produced by only one x -ray photon and th ere will therefore not be any reciprocity failure when x -ray
35
photons are used. The toe part of the HeD-curve will in principle not be pres ent either.
The r eciprocity law failure of the film was me asured w ith the film
between two x-ray screens. These screens were irradiated by a tungsten
x-ray tube with a 6-pulse generator at 75 kV. 20 mm AI was used as extra filtration in the beam ( this thickness was used i n order roughly
to simulate the filtration in a patient) and only a small fraction of the incoherent scattered radiation from the filter was ass umed to reach the cassette. The mea surements were carried out for different exposure times and the tube current (mA) was va ried to achieve net
film density 1.0. The light from the front screen was me asured w ith a PM-tube during the exposure (figure 3:1). The r atio of the light contributions from the front and the back screens was ass umed t o be constant as any chan ge i n radiation quality was small during the
experiment. Measurements of the light from the screens instead of the x-ray exposure of the cassette will decrease the errors in the experiment as crianges in radiation quality nay change th e sensitivity of the screen-film system and thereby also change the light fluence. The film was expos ed to net film density 1.0 for different combinations of intensities and exposure times. A m easure o f the reciprocity
law failure was then given by the amount of light required by the film when d ifferent exposure times were used (figure 3:5). These data were then normalized to unity at the exposure time of 0.1 sec which is a commonly used exposure time in routine x-ray diagnostics.

36
10 min
ao
Q- o ~ O 20
1.0 1.0 EXPOSURE TIME/min
Figure 3:5 Measured co rrection factor for the reciprocity law
failure in the I Iford Rapid R film. The correction factor is normalized to 1.0 at the exposure time 0.1 s.
The reciprocity failure may chan ge depending on both the developing
conditions and the temperature during the exposure (James, 1977). The former will mostly produce effects in film which is exposed during short exposure times, i.e. the fraction of non-developable centres is influenced by the developing conditions. The temperature
during the film exposure will have effects on t he ion mobility in the emulsion. The reciprocity failure will increase when the light intensity is low and the temperature is increased. Variations in reciprocity failure between d ifferent types of film emulsions can be la rge (Arnold, 1978) but repeated measurements on the film type used in this work show only insignificant differences. The small changes during the film exposure and developing were therefore not assumed to have any ap preciable influence on the low intensity reciprocity fai lure.
37
If photographic film is illuminated with pulsed light it has been
found that the low intensity reciprocity failure is dependent on t he
pulse frequency if this frequency is low enough so that the recombination effects between the pulses are of importance. The p ulse form of
the x-ray generator could therefore be suspected of influencing the
reciprocity failure of the film, e:g. if the reciprocity failure corrections were meas ured with a 6-pulse generator. When screens with relatively long afterglow are used t his effect could be somewhat
reduced. As the average recombination time for instable centres is
approximately 8 sec (James, 1977) the pulse frequencies of an x -ray generator, which are about 50 to 600 per second, should be m uch higher than the critical frequency (about 0.2 per second) and the pulse frequency from the x-ray generator should therefore not affect the reciprocity failure. This latter assumption i s supported by the
fact that the 1ow-intens i ty reciprocity failure is seen to change
very little at exposure times shorter than 0.1 sec. The x-ray tube which was used t o produce t he K-radiation works with a 6-pulse generator with approximately the same pu lse form as that of the x-ray generator used to measure the reciprocity failure. The irradiation with Tc-99m and Am-241 was, of course, continuous and i n this case
the reciprocity failure was ass umed t o be t he same as that measured
with the 6-pulse generator.
The r eciprocity law failure measured by illuminating the film with x-ray screens in a photon beam has been com pared t o measurements where the film was d irectly illuminated by visible light from a tungsten lamp (Seeling and Danzer, 1978). These m ethods were found to give the same r esults. Some s ort of difference could have been
expected depending on the difference in light distribution. The tungsten lamp illuminates the film with continuous and homogeneous
light distribution but the x-ray screen illuminates the film with
light flashes from crystals in the phosphor.

38
Contributions to the Film Density from Directly Absorbed X-Ray Photons
When a film-screen system i s irradiated with x-ray photons most of the photons which contribute to the final image in teract in the screens and th e fluorescent light from the screen phosphor r esults in film
blackening. A sma ll fraction of the x-ray photons will, however, be directly absorbed i n the film emulsion and thus give a direct contribution the the film density. The fraction of direct contributions to the film density is dependent on photon energy and choice of x-ray screens but this contribution is normally less than a few per cent of the total film density. The r eciprocity failure may inc rease the contribution by a factor of about three, especially when o nly one side of the film is illuminated. This contribution will to some e xtent be co rrected for when the correction for reciprocity failure is applied as the contribution of directly absorbed photons is also present in this correction. The contribution of directly absorbed photons was estim ated by screening the light from the x-ray screens
with a sheet of light-tight paper and irradiating the cassette during the time which wa s normally needed t o obtain film density 1.0. It is, however, not at all obvious that the contribution measured i n this way should be d irectly added to the film density. The so-called
Villard effect (James, 1977) states that if film is first irradiated with x-rays and then with light, then the total density will be le ss than the sum of the separate contributions. This is assumed to be an effect of the light exposure which p artly destroys the latent image of the x-ray exposure. At high intensity exposures with both x-ray and light photons, an e ffect which i s the opposite to the Villard effect could be seen in some emulsions (the Bequerel effect; James,
1977) but the Villard effect is the most common and w ill probably apply better to the conditions in the experiments of this work. The
Calyden effect (James, 1977) is very similar to the Villard effect but in this case t he x-ray irradiation is supposed to make the
emulsion less sensitive to the following light exposure.
39
All these effects are dependent on th e choice of film emulsion, the light intensity, the proportions between light and x-ray photons,
exposure time and so on. During an exposure whe n both x-rays and
light are used together as was th e case i n the experiments of this
work, it is possible that all of these de-sensitizing effects will to some e xtent be pr esent. The total effect of the direct x-ray contribution should therefore be even s maller than the very small
contributions measured wh en the light was screened o ff.
Changes in the HeD-curve due to Asymmetric Illumination of Double Emulsioned Fil m
The speed and the HeD-curve of a film could be expected to change if the film is illuminated with a given amount of light but with different fractions on the two emul sions. These cha nges were calculated in a simple way. An e xperimentally determined HeD-cur ve was used f or the case wh en both emulsions were symmetrically illuminated and from this the asymmetric cases were calculated, The calculations were carried out for the ratios of the light to the front and to the back screen (front/back) equal to 1, 2, 3, 4, and 5 (figure 3:6).
The change i n reciprocity law failure is not included in these cal
culations. An approximate estimation of the effect of the reciprocity failure says that if the intensity is increased in the front screen and decreased in the back screen then the reciprocity failure will decrease in the front emulsion and increase in the back emulsion. The total sum of these effects should not change the HeD-curve very
much, especially if there is a significant amount of light cross-over
between the emulsions.
The cross-over effect in the film was not included in the calculations as it is not well known. This effect seems to be ra ther large and in
the practical case i f one wishes to calculate and approximate HeD-cu rve when the film is asymmetrically illuminated and the cross-over fraction

40
is known, the results in figure 3:6 could be used b ut the quotient
front/back should be reduced with regard to the cross-over effect. The change i n HeD-curve of double-coated film when i t is illuminated by different intensities on the two emulsions has been i nvestigated by Vyborny (1979). He found only small changes in the HeD-curve. The reason why these changes were so small was exp lained by the cross
over between the emulsions. The cross-over contribution in the investigated films were found to vary between 0.22 and 0.51. However, there are also some d iagnostic films where t his cross-over effect is
effectively reduced (Gopala and Panos, 1979).
front/back
•1.0 2.4
» 1 8 t S B
li. 1.2
0.6
O 2 FILM EXPOSURE/ARB. UNITS 5
Figure 3:6 Calculated HeD-curves when the double-emulsioned film was asym metrically illuminated. The proportions front/
back were chose n as 1, 2, 3, 4, and 5.

41
Changes in HeD-curve due t o asymmetric illumination is one of the reasons why two films were used in some o f the experiments. By usin g
two f ilms it is possible to make corrections when the film density
is not equal to 1.0. The change i n film sensitivity which could be a result of inhomogeneous irradiation of the film is also avoided.
Determination of the HeD-Curve with Constant Exposure Tim e or Constan Exposure Rate. Pre-Exposure of Film to Obtain a mor e Linear Relation
between_Light_Exposure and_Fi]m_Density
HeD-curves intended for use in the determination of light to the filr can be determined in different ways. These curves can e ither be
measured w ith a constant time but with varying light intensity (or exposure rate) or it could be me asured w ith constant light intensity
but with changing exposure time. The meth od w ith constant exposure time is that which b est simulates the clinical case but with constant-light-intensity method i t is often easier to obtain HeD-curves with with good accuracy.
In the sensitivity measurements on x -ray screens these HeD-curves
measured w ith constant intensity were used for corrections when the
net film density not was equal to 1.0. This will then give a corrected value of both the exposure t o the cassette and the exposure ti me. The correction for reciprocity failure, which a lso has to be a pplied, will then be c arried out with regard to the
corrected exposure time.
When the exposure time is increased the number of non-developable
centres will decrease and the "toe part" of the HeD- cu rve will
therefore change. However, the gradient of the curve at film densities between 0.7 and 1.4 was found not to change s ignificantly for exposure times between 0.05 sec and 7 minutes. This enabled the use of the same HeD-c urve i n the corrections mentioned above.
In the measurements of the line spread fu nction (LSF), on t he other

42
hand, one has to use an HcD-curve which is determined for a constant
exposure time as the whole LSF-curve i s exposed during the same time. If an HeD-c urve which is exposed with constant light intensity is used the results have to be sp ecially corrected for reciprocity failure as different light intensities is produced i n different parts of the LSF-image. This correction is already included in the HeD-curve mea sured
during constant time with different light intensities.
Rossman et coll (1964) pointed out that HeD-curves determined from the
exposure of a 0.1 mm w ide film area will be markedly different from curves determined by u sing larger areas. Rossman explain ed this with the Eberhart effect which is an e ffect in the film emulsion g iving higher densities when small areas are exposed compared to the
density in larger areas. In later references (Strubler et coll, 1973) this effect has been regarded to be of very small importance in
measurements on x -ray screens as the image from the screens a re rather blurred och the wide aperture HeD-curve is perhaps more like the real conditions in the experiment. Therefore, all HeD-
curves used in this work have been me asured w ith the wide aperture technique.
When double-emulsioned film is used, the front and the back emulsions
will not have identical images and the HeD-curve ma y not always be valid for these exposures. However, this effect has been shown to be
small in screen-film systems which a re not very asymmetric (Doi, 1973).
The toe and shoulder region of the HsD-curve are not suitable for use in the calculations of light to the film from the film density. Different methods have been used t o overcome t his problem. The most common method i s to make mor e than one LSF-exposure for different exposure times and onl y use the approximately linear part of the HeD-curve
(Strubler et coll, 1973). Others (Morgan et coll, 1964) have pre-exposed the film to reduce the toe region and by this method i t is
possible to determine the LSF with only one exposure. The measu rements and ca lculations will be e asier and faster with this later

43
method bu t the total film density interval which can be used i s not
so large. In this work a somewhat improved v ersion of the pre-exposure method wa s used as described below.
It has been sho wn (James, 1977) that the effect of two exposures after each other, one with high intensity and the other with low
intensity will be l arger than the sum of the two individual exposures. This effect was used i n the LSF-measurements. The film was pre-exposed
at rather high light intensity. This will produce ma inly non-develop
able centres and the following LSF-exposure which is done w ith low intensity will build further on t he non-developable centres and very
few non-developa ble centres from the LSF-exposure w ill then be pres ent in the image. In this way the toe part of the HeD-curve will be almost enti rely eliminated.
The effect on t he HeD-curve due to different types of pre-exposure have been t ested. Two x -ray screens were used to illuminate the film. These screens were irradiated by an Am -241 gam ma-source with the activity 18.5 GBq to produce the HeD-curve and an x -ray tube for the
pre-exposure. The exposure rate from the gamma source was changed by varying the distance between the gamma-source and th e film-screen cassette. The r elative light intensity from the screens was m easured with a PM-tube as a function of distance between the gamma-source
and the cassette. In the experiment the film was pre-exposed bo th during a r elatively long time (about 1 minute) and during a short
exposure time (about 0.005 sec). The films were a lso pre-exposed to different density levels between net densities 0.1 and 0.8. To avoid unnecessary increase in the quantum mot tle level and thereby decreasing the signal-to-noice ratio in the measured LSF, all the pre-exposures were carried out with diffuse light.
The HsD-curv es meas ured with low-intensity pre-exposure (figure 3:7)
indicate that the pre-exposure must be done t o a d ensity level between 0.5 and 0.8 in order to eliminate the toe region in the HeD-curve. The problem w ith this high pre-exposure is that the available density region in the film will be con siderable reduced.The He D-

44
curves with high intensity pre-exposure (figure 3:8) show a very small
toe area at a pre-exposure giving a film density of only about 0.35.
With this method th e available density region in the film will be larger. In this way th e HeD-curve will be m uch mor e linear but the measured LSF has to be co rrected for the current HsD-curve.

45
2.0
0.5
3 2 0 1 FILM EXPOSURE/ARB. UNITS
Figure 3:7 HeD-curves meas ured under constant exposure time (i.e.
varying the exposure rate) on f ilm which is pre-exposed to different levels during long time and low intensity
measured HsD-c urve
linear curve fit

o 1 2 3 FILM EXPOSURE/ARB.UNITS
4
Figure 3:8 HeD-curves mea sured under constant exposure time (i.e. varying the exposure rate) on f ilm which is pre-exposed to different levels during short time and high intensity
measured HeD- curve
linear curve fit

47
CHAPTER 4
MEASUREMENT A ND C ALCULATION O F A TTENUATION IN X-RAY SC REENS
Attenuation measurements in the screens were carried out mainly to _ 2 obtain the thickness (in kg-m ) of the screen phosphor. This is
required in order to calculate the absorbed energy in the screens, the K-radiation escape from the screens and the LSF of the re-absorbed K-radiation in the screens. It cannot simply be ge ometrically measured beca use th e density and the exact chemical composition is not well known. The d ensity was determined by comparing the measured
_ 2 mass thickness in kg-m and the linear thickness of the screen phosphor. The specification of chemical composition of high-Z elements given by the manufacturer was checked by the comparison of experimentally found and calculated attenuation characteristics.
Attenuation in x-ray screens mainly take place in the screen phosphor
and to a lesser extent in the supporting layer, reflecting layer and the binder of the screen. In the calculations of attenuation the
supporting layer, binder and r eflecting layer were approximated by _ 2 a total thickness of 0.5 kg-m (500 ym) of water. The attenuation
of photons with energies higher than 20 keV is less than 2 % in this material.
The mea surements of attenuation in the screens and the cassette were carried out with the K-fluorescent sources and gamma-radiation from
Tc-99m and Am -241 (c hapter 2). The photon energy distributions of
these sources were mea sured w ith the Ge-detector. Only the photons in the K -peak of the fluorescent radiation, the 59.6 keV-peak of the Am-241 and th e 140.5 keV-peak of the Tc-99m r adiation were counted.
Both calculations and mea surements of the attenuation were c arried out to be v alid in narrow-beam geometry as this is the most straightforward way t o calculate and measu re. With data from these meas urements
it is also possible to calculate the absorbed photon energy i n the

48
screens (chapter 6). However, the geometry of the measuring set-up was such that photons scattered in the screens w ith scattering angles less than 2° could enter the detector and thus be included in the
measurements. A small fraction of the coherent scattered radiation can i n this way in troduce some minor errors in the results. The
total contribution over all angles of coherent scattering to the attenuation cross section could be as large as 13 % (figure 4:1a-c).
The d ifferential coherent cross section at different scattering angles has been ca lculated with data from Hubbe l et coll (1975) and the
contribution of coherent scattered photons hitting the detector has been estim ated to always be less than 3 %. This contribution will then approximately compensate, within + 2 %9 for the photon a ttenuation in the non-fluorescent material of the x-ray screen. Consequently this has not been comp ensated for.
The attenuation coefficient of the phosphor is the sum of the photoelectric attenuation, incoherent and coherent scattering attenuation
coefficients (y= t + + acoh)* attenuation coefficient of the whole screen phosphor is made up of contributions from the different elements and was ca lculated for the different screen phosphors using data from Storm and Is rael (1970) (table 1). Coherent, incoherent and photo-electric attenuation coefficients are separately calculated (table 1) and i n figure 4:1 a-c given as a fraction of the total attenuation coefficient of the screens. This comparison shows that photo-electric attenuation dominates at all photon energies and
that the coherent and incoherent contribution always is less than 20% of the total attenuation.
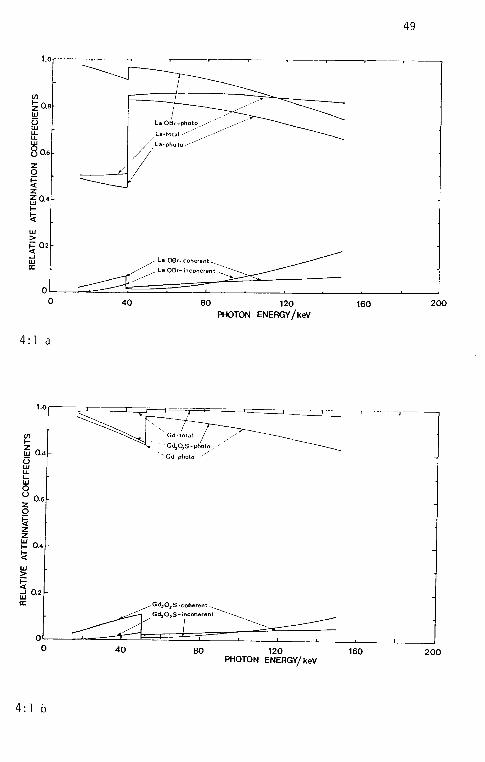
49
1.0
0.8
La-photo 0.6
H Û2 La 06r-coherent^ La OBr- incoherent
0 40 80 120 160 200 PHOTON ENERGY/keV
4:1 a
1.0
Gd202S - photo ̂ / ^Gd-photo
0.6
h- 0.4
-J 0.2
GdjOjS-coherent ^ GdjOjS-incoherent
0 40 80 120 160 200 PHOTON ENERGY/keV
4:1 b
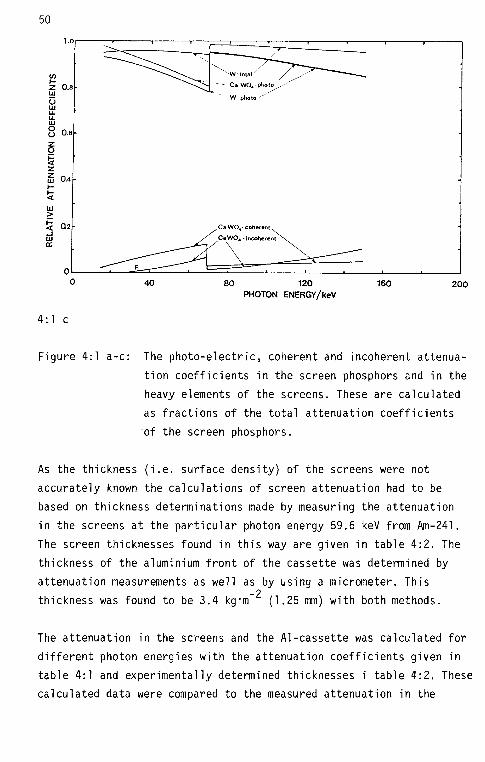
50
b 0 .6
0.4
, Ca W04- coherent.
Ca W04 - incoherent
o 40 80 120 160 200 PHOTON ENERGY/keV
4:1 c
Figure 4:1 a-c: The p hoto-electric, coherent and inco herent attenua
tion coefficients in the screen phosphor s and in the heavy elements of the screens. These are calculated as fractions of the total attenuation coefficients
of the screen phosphors.
As the thickness (i.e. surface density) of the screens were n ot accurately known the calculations of screen attenuation had to be based on thickness determinations made by measuring the attenuation in the screens a t the particular photon energy 59.6 keV from Am-241.
The screen thicknesses found in this way are given in table 4:2. The thickness of the aluminium f ront of the cassette was determined by
attenuation measurements as well as by u sing a microme ter. This _ 9
thickness was found to be 3.4 kg*m (1.25 mm) with both methods.
The attenuation in the screens and the Al-cassette was ca lculated for different photon energies with the attenuation coefficients given in
table 4:1 and exp erimentally determined thicknesses i table 4:2. These calculated data were compared to the measured a ttenuation in the

51
screens (figure 4:2) and found to be i n good agreement. This verifies
the chemical composition of the screens and indicates that the
attenuation can be meas ured a t one photon energy and then be calculated for all other energies.
The linear thickness of the screen phosphor, including the binding material, was m easured with a microscope (table 4:2). This thickness is needed in the MTF-calculations due to the re-absorbed K-radiation in the screens (chapter 8). The d ensity of the screen phosphor s was
also calculated from these data (table 4:2). It was found that the density of the screens wa s approximately half of that of the fluores
cent material itself. The reason for this is the crystalline structure
of the phosphors and the binding material, which is mixed with the crystal s.
Birch et coll. (1979), Venerna (1979) and Vyborny et coll (1980) have
also measured the attenuation and henc e determined the thickness of some x -ray screens. When th ey made me asurements on screens of the same type as those in this work their thickness was found to be w ithin 11 % of the present results. These diff erences could partly be due to use o f different attenuation data but the true difference between
the screens c ould very well be as large as that given by these comparisons as the screen manufacturers often make changes in the screens even i f the same na me is used.

52
0.8
0.7
0.6-
(0.59kg m"2)
0.4 r~~LaOBr L 0.49 kg n
Z 0.3
Q1 CaW04 (0.23kg
140 120 80 100
PHOTON ENERGY/keV 60 40 20
Figure 4:2 Calculated ( ) and m easured ( * ) attenuation in the screens and calculated attenuation in the Al-front of the cassette (—). The curves were n ormalized (see text)
at 59.6 keV indicated with the symbol Q

53
TABLE 1 Attenuation coefficients calculated for components of the screen-
phosphors and fo r the total screen-phosphors at photon energies
between 15 and 150 keV (attenuation data for the separate elements are taken from Storm and Is rael, 1970).
LaOBr La Photon Incoh Coh Photo Total Photo Total energy keV (m2 kg"1) (m2 kg" 1 )(m2 kg-1 ) (m2 kg"1) (m2 kg"1; ) (m2 kg"1
15.0 0. 008 0.155 7. 602 7. 766 3. 822 3. 942 20.0 0.009 0.110 3. 492 3. 612 1. 734 1.822 30.0 0.011 0. 063 1. 135 1. 209 0. 559 0.613 38.9 0. ,011 0. 042 0. 557 0. ,611 0. 274 0.313 38.9 0. ,011 0. 042 1. 878 1. 931 1. 595 1. ,634 40.0 0. 011 0. 041 1. 752 1. ,804 1. 495 1. ,532 50.0 0. ,012 0. 029 0. 956 0. 996 0. 821 0. ,849 50.2 0. 012 0. 028 0. ,926 0. 966 0.795 0. ,823 50.2 0. ,012 0. 028 0. 926 0. ,966 0. 795 0. ,823 60.0 0. ,012 0. 021 0.579 0. ,613 0. 505 0. ,528 69.5 0. ,012 0. 016 0.385 0. ,413 0. 333 0. ,353 69.5 0. ,012 0. 016 0. ,385 0. ,413 0. 333 0. ,353 80.0 0. .012 0. 013 0. ,264 0. ,288 0. 230 0. ,246
100.0 0. ,011 0. 009 0. ,140 0. ,160 0. 123 0. ,136 150.0 0. .011 0. 004 0. ,044 0. ,059 0. ,039 0. .048
Gd2Û2S Gd
Photon Incoh Coh Photo Total Photo Total energy 15.0 0.008 0. ,195 7. ,614 7. ,818 7. ,477 7. .674 20.0 0. ,009 0. ,139 3. ,494 3. ,642 3. ,436 3. .579 30.0 0. .010 0. ,092 1. .143 1. .235 1. ,126 1. .214 38.9 0. .011 0. ,058 0. ,548 0. .617 0. ,541 0, .606 38.9 0. .011 0. ,058 0. .548 0. .617 0. .541 0, .606 40.0 0. .011 0. ,053 0. .513 0. .577 0. .506 0. .566 50.0 0. .011 0. ,037 0. .277 0. .326 0. .274 0. .319 50.2 0. .011 0. ,037 0. .274 0. .322 0. .270 0, .315 50.2 0. .011 0. ,037 1. .499 1. .547 1. ,495 1, .540 60.0 0, .011 0. ,028 0. .941 0. .988 0. .939 0, .975 69.5 0, .011 0. ,020 0. .637 0. .688 0. .636 0, .664 69.5 0. .011 0. .020 0, .637 0, .688 0, .636 0, .664 80.0 0, .011 0. .017 0, .437 0. .465 0. .436 0, .462
100.0 0. .011 0. .011 0, .236 0, .259 0, .236 0, .256 150.0 0, .011 0. .005 0, .078 0, .094 0, .078 0, .092
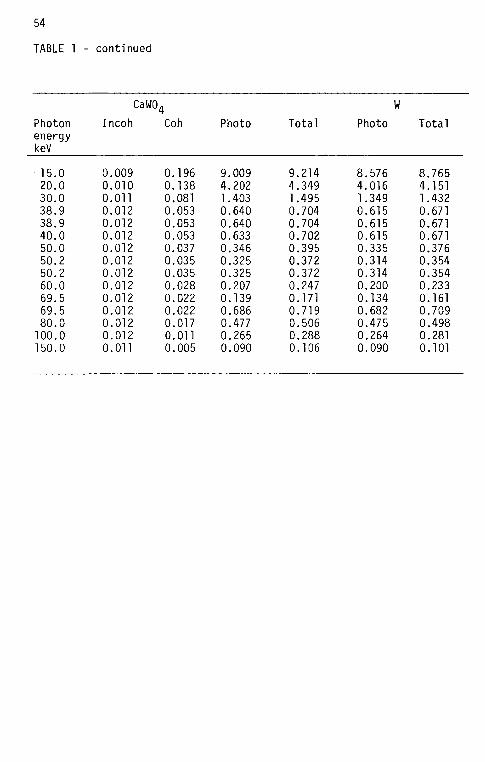
54
TABLE 1 - continued
CaW04 W
Photon Incoh Coh Photo Total Photo Total energy keV
15.0 20 .0 30.0 38.9 38.9 40.0 50.0 50.2 50.2 60 .0 69.5 69.5 80.0
100.0 150.0
0.009 0 .010 0 .011 0 .012 0 .012 0 .012 0 .012 0 .012 0 .012 0 .012 0 .012 0 .012 0 .012 0 .012 0 .011
0.196 0.138 0.081 0.053 0.053 0.053 0.037 0.035 0.035 0.028 0.022 0.022 0.017 0.011 0.005
9.009 4.202 1.403 0.640 0.640 0.633 0.346 0.325 0.325 0.207 0.139 0.686 0.477 0.265 0.090
9.214 4.349 1.495 0.704 0.704 0.702 0.395 0.372 0.372 0.247 0.171 0.719 0.506 0 .288 0.106
8.576 4.016 1.349 0.615 0.615 0.615 0.335 0.314 0.314 0.200 0.134 0 .682 0.475 0.264 0.090
8.765 4.151 1.432 0.671 0.671 0.671 0.376 0.354 0.354 0.233 0.161 0.709 0.498 0.281 0 .101

55
TABLE 2
Experimental data on t he x-ray screens.
Screen Screen-phosphor phosphor-thickness
{ v m\
phosphor-mass per unit area
(kg nf2)
phosphor-density
(kg m"3)
CaWO S E4
3M, a8
CEA, Universal standard
DuPont, High Plus
LaOBr:Tb
Gd202S:Tb
CaWO,
CaWO/,
180
190
90
200
0.48
0.59
0.23
0.56
2.7
3.1
10°
10°
2 . 6 * 1 0 °
2.8 • 10°
56
CHAPTER 5
THE SEN SITIVITY OF X- RAY SC REENS A T DI FFERENT PH OTON E NERGIES
The sensitivity or speed o f the x-ray screen-film systems is here determined as the inverse value of the air-kerma (free in air),to
the screen-film cassette,giving net film density 1.0 (S^). The sensitivity is also given in two o ther ways, namely, the inverse value of
the photon fluence (S$) and th e inverse value of the energy f luence (S ) giving unity film density.
X-ray screens are manufactured w ith a g reat variety of fluorescent
materials, thickness, binding material etc. Screens w ith different phosphors w ill attenuate and absorb photons in different ways and consequently different screens show di fferent spectral sensitivities. The dominating elements with regard to photon a bsorption in the screens used here are W, Gd and La.
This section describes the measurement o f the screen sensitivity as a function of photon energ y. A nu mber of monoenergetic radiation sources (chapter 2) was used to irradiate the screens and film was used as the light-sensitive detector. This data will show the
difference in speed betwe en d ifferent screen-film systems. The main purpose of this section is, however, to show the detailed energy dependence of the screen-film system speed. The data for monoenergetic
photon radiation will further be used i n chapter 9 to calculate the speed o f the systems when spectral distributions from x-ray tubes are use<
The x-ray screens used in these experiments are CaW0-SE4 (LaOBr:Tb), Trimax a8 (Gd^O^SiTb) and C EA Unive rsal Standard (CaWO^).
Methods and experiment
The screens, placed in a cassette with a 1.25 mm thi ck aluminium f ront,
were irradiated with K-radiation from the fluorescent sources and
57
gamma radiation from Am-241 and Tc-9 9m (c hapter 2). The light emitted from the screens was me asured w ith two f ilms in the cassette. Film
types used were I lford Rapid R, Agfa Gevaert RP1 and 3M- XD. A whit e opaque sheet of paper was used betwe en the films to prevent the light from exposing both films. The light from each screen was thereby measured s eparately. This separation of the light contribu
tions from front- and back-screens was necessary to enable corrections for reciprocity failure in the film (chapter 3) when the two screens give different light fluence rates to the two f ilm emulsions. Furthermore, errors could occur due to difference in the HeD-curve when the films are i 11uminated very asymmetrically by one screen on each side of the double emulsion film (chapter 3). However, the
introduction of the two films may als o introduce errors in the measurements due t o the increased fraction of direct absorbed r adiation
in the film emulsions. This absorption never exceeds 2 % of the energy fluence to the cassette and was neglec ted here.
The air kerma free in air at the position of the film-screen cassette was m easured by the calibrated beam monitor (see chapter 2) and the exposure time was m easured to enable a correction to be m ade for reciprocity failure in the films. The air kerma at the position of the cassette was chose n to give a n et film density of approximately
1.0 in both films. In some cas es, when most of the photons were absorbed in the front-screen, this could not be achieved with a single
exposure. To get film densities close to 1.0 in both films,two separate exposures with different irradiation times were needed f or
the front and back film. The correct air kerma value and exposure time for film density 1.0 were achieved after correction with regard
to the HeD-curve. This HeD-curve was obtain ed by irradiating a film-screen system w ith a konstant kerma r ate and var ying exposure time (chapter 3). With this HeD-curve the reciprocity failure of the film is included in such a way t hat both the measured a ir kerma value and
the exposure tim e was co rrected to values that should have given the
film density 1.0. With help of the corrected irradiation time a correction for the reciprocity law failure of the film was ca rried
58
out. The irradiation time in the experiments varied between 1.0 and 10 minutes which is long compared to approximately 0.1 seconds that is a
common exposure time in x-ray diagnostics. When lon ger exposure times are used th e low-intensity reciprocity failure will make the film less sensitive to light photons. The mea sured speed of the screen-film system wa s corrected for this effect by u sing the experimental
values of reciprocity failure determined in chapter 3. This will then give the correct kerma value for the irradiation time of 0.1 s.
A constancy check w ith a 59.6 keV-gamma r adiation source (Am-241) was performed to enable a correction to be m ade f or variations in the developer, altered film sensitivity etc (chapter 3). To reduce the use o f this correction each series of exposures on a given screen pair were ma de on d ifferent areas of the same f ilm and a ll screens were used together with blue-sensitive film. For the green emitting screen (Trimax a8) another correction constant was als o used to make
the results valid for use w ith the green sensitive film, 3M-XD. The sensitivity values for the blue emitting screens, refer to use w ith the blue sensitive film, Ilford Rapid R.
Later measurements on t he screens were corrected using the constancy check if the total sensitivity of the system wa s different from that
of the first measurements, which wa s used as reference value. It was not regarded as important to get an ex act value of the screen-film
system speed as the absolute sensitivity of the screen-film system varies with several parameters. Also the relations between different screens ma y depe nd on the choice of film and the fit between spectral sensitivity of the film,and the emitted light spectrum from the
screens. Corrections of the ionization chamber meas urements for varying pressure and temperature were routinely carried out.
The d etermination of the screen-film sensitivity (hv) for one screen were carried out for the different photon energies by first calculating the exposure time that would gi ve film density 1.0»(t-|):

59
'l " V 'dens <"f> <5il>
where tß is the exposure time used i n the experiment, C^ens is the correction factor for the HeD-curve and is the film density.
Then t he air kerma value that would giv e film density 1.0 at photon
energy (hv) for exposure time 0.1 sec (K-j (hv) ) was ca lculated. The kerma calibration factor (Cca-|(hv)) and the meter reading (M) corrected for pressure (P) and temperature (T) will give the air kerma. This was then corrected with regard to the HeD-curve
(CdenS(Df))> the reciprocity failure ( Crec ( t-j ) ) » the constancy check (Cdev) ancl the "colour correction" factor (cco]our) which i s 1.0 for the "blue-emitting" screens and 2.76 for the green e mitting
Gd2Û2S:Tb-screen (chapter 3).
Ccal ' T ' P0 Cdens(Df) ' Cdev 'Ccolour ( 5:2) K-j (hv) = T0 * P Crec (ti)
T0 is 293° K and P 0 is 101.325 kPa
The screen-film sensitivity (S^(hv) is the inverse of this kerma value
sK = n< "̂(Fv)
And the sensitivity of the whole screen pair is the sum of the front and the back screen sensitivity.
The sensitivity expressed as the inverse value of photon fluence giving net film density of 1.0 (S ) is obtained from:
s, = SK • (£ • hv ) (5:3)
(-) is the kerma per energy f luence at the energy o f interest. The inverse value of the energy f luence for unit film density (S^) is obtained from:
sw = S • A (b:4)

60
Corrections_for_the_Absorgtlon_and_Scatter in the_Cassette
Calculations were carried out to correct the screen-sensitivity for the attenuation in the 1.2b m m thi ck front of the aluminium c assette.
These ca lculations will show ho w the cassette changes the sensitivity of the screen-film system. They a re also needed in the investigation of the relation between screen light to the film and absorb ed energy in the screens (chapter 6).
In these attenuation calculations for the aluminium c assette, coherent scattered photons were ass umed not to change th e photon fluence to the screens as their scattering angles are small. In the incoherent scattering there will be photons with scattering angles so l arge that
the scattered photons will not reach the screens. This fraction of scattered photons is dependent on photon energy bu t as a rough figure two-tnirds of the incoherent scattered photons were estimated not to reach the screen pair in the cassette. No c orrection was ap plied for
tne energy decrease of the scattered photons as this energy d egradation is small when the scattering angles are small and the photon energy is low. In the photo-electric absorption all of the interacting photons will be absorbed i n the aluminium f ront of the cassette. Correction of the sensitivity for absorption and sc attering in the aluminium o f the cassette was c arried out according to the formula:
S = K,corr
exP Ht+o- h)-d)+ J T+pCOh ••(1-exPt-(T + gincoh>-d>> ° incoh
where is the sensitivity measured w ith the cassette, CQrr is the calculated sensitivity without the Al-front of the cassette and d is the thickness of the cassette front. Similar expressions were
used for SY,corr and S$,corr"
As less than 5 % of the photons a re incoherently scattered in the
front of the cassette this rather approximate c alculation has been estimated to result in an e rror of less than 1 % in the screen-film

61
sensitivity. Some minor errors in the calculations due to the non
parallel direction of the scattered photons c ould, however, be expected.
This effect is difficult to estimate but as the scattered fraction of photons re aching the screen is always less than about 3 %9 these errors wi11 be smal 1.
Result and Discussio n
The sensitivities S ^ ( h v ) , S ^ ( h v ) and S ^ ( hv ) of the system were d etermined as a function of the photon energy and are presented both as
the sensitivity of the screen-film system i n the cassette and the sensitivity of the system w ithout a cassette (see figures 5:1-5:3).
S^, is the sensitivity value that best apply to measurements when
ionization chambers are used i n x-ray beams as the measured io nizations is approximately proportional to the air kerma, independent of the
photon energy. Automatic exposure timers registrate a value which is also approximately proportional to the air kerma. Furthermore, the
air kerma is closely proportional to the radiation dose in tissue ana will therefore often be o f interest. will thus roughly be approximately inversely proportional to the exit dose to the patient for a given optical film density if only the primary radiation is
considered. Calculations for scattered radiation using cannot be carried out as the present data on screen sensitivity are valid only for photons perpendicular to the screen p air.
In a comparison o f the sensitivity of the three screens, figures 5.1-5.3 the most striking difference is the discontinuous sensitivity change at the K-edge o f the heavy elements in the fluorescent phosphors.
The discontinuity appears at different energies for different phosphors: 38.9 keV i LaOBr:Tb, 50.2 keV in Gd202S:Tb and 69.5 keV in CaW04. The discontinuities are effects of the rapid increase in the photo electric attenuation coefficient as the photon energy exceeds the binding energy o f the K-electron in La, Gd, and W respectively. At
low photon en ergies the sensitivity is rather heavily influenced by
absorption and scattering in the aluminium ca ssette.

62
Sy corrs figure 5.2, which is relating to the energy f luence hitting the screens decreases continuously with photon en ergy, except at the K-edge, The reason i s the increased penetration of photons with energy. At energies below 20-25 keV S^ CQrr decreases a little in some screens. This could be an effect of increased self-absorption of light in the screens. At these low photon en ergies most of the photons are absorbed in the frontal parts of the front screen and the average d istance
for the light to travel before hitting the photographic emulsion will
be l arger (chapter 7). Therefore the selfabsorption of the light in the screens could be expected to increase at low photon e nergies. When the energy r ises above the K-edge o f the heavy elements in the phosphor the sensitivity will increase over a small energy re gion due to the increased photo-electric attenuation coefficient. At these energies K-fluorescent radiation will be produced i n the K-shell of the heavy element. Some o f this K-radiation will escape from the screens or be re-abso rbed in other parts of the screen p air. The r est of the photon energy w ill be l ocally absorbed. This escaping energy is approximately constant and independent of photon energy at energies above th e K-edge (appendix 1). It is, of course, dependent on t he screen-phosphor components and the phosphor thickness. At energies above the K-edge t he absorbed energy per attenuated photon increases with increasing photon energy as the escaping energy is constant. The attenuation coefficient on t he other hand, decrease with increasing energy and the resulting effect is that in some screens the dependence of sensitivity on th e energy i s small just above the K-edge. At higher energies the sensitivity will decrease with increasing energy.
For S^ (figure 5:3 a-c) the energy of the photon w ill influence the energy depe ndence du e to the fact that a photon w ith larger energy can gi ve more absorbed energy and thus produce more l ight in the
screen.
If the sensitivity of the La-screen or the Gd-screen i s compared to
a W-screen a mark ed increased sensitivity will always be seen a t energies between the K-edge o f the La- or Gd-screen and the K-edge

63
3.0
2.0
1.0
3.0 • -io*
>»
CO* 2o
h-> h-</> z LU </>
0.6 -10'
0.5
0.4
0.3
0.2
O 140 80 100 120 40 60 20 PHOTON ENERGY/keV
Figure 5:1 The sensitivity of the screen pair as a function of photon
energy,expressed as the inverse of the air kerma giving net film density 1.0. Full line S^; broken l ine —
^KjCorr a) the LaOBr:Tb - screen b) the Gd^SiTb - screen
c) the CaWO^- screen
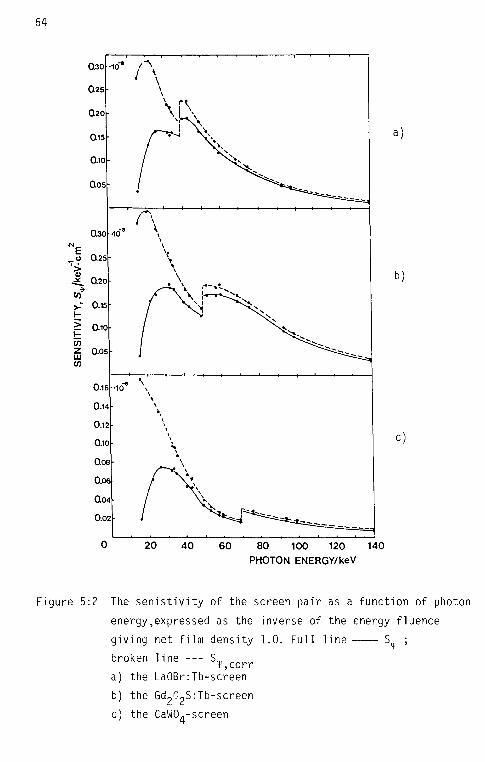
0.30 •10"
Q25
Q20
0.10
QOS
Q30 • -10"
0.15
0.10
Z 0.05
0.16--10"
0.14
0.12
0.10
Q08
0.06
O04
0.02
0 20 40 80 60 100 120 140 PHOTON ENERGY/keV
ure 5:2 The senistivity of the screen p air as a function of photon
energy,expressed as the inverse of the energy f luence
giving net film density 1.0. Full line ; broken line — S„, y ,corr a) the LaOBr:Tb-screen b) the Gd^O^SiTb-screen
c) the CaWO^-screen

65
8.0
6.0
4.0
2.0
•io-8 12.0 C M g 10.0 o "ï 8.0 «0 ^ 6.0 H
4.0 > t c/) Z LU C/)
2.0
3.5
3.0
2.5
2.0
1.0
0.5
20 40 60 80 100 120 PHOTON ENERGY / keV
140
Figure 5:3 The sensitivity of the screen pair as a function of photon
energy expressed as the inverse of photon fluence giving net film density 1.0. Full line S$ ; broken line
—- S $,corr a) the LaOBr:Tb-screen
b) the Gd202S:Tb-screen c) the CaWO^-screen

66
of the W-screen. The d ata on could be comb ined with the different
spectral distributions used in x-ray diagnostics to give the
sensitivity of the whole system (chapter 9). Changes in sensitivity when screens, filtration in the beam, patient thickness etc are varied was studied by these calculations.
Investigations of x-ray screens similar to those in this chapter have also been c arried out by others (Fernando, 1964; Stevels, 1975; Birks
et coll., 1976; Vyborny et coll., 1977). Stevels studied some screen types with a PM-tube as light detector. Stevels calculated the sensitivity of some theoretical screens but he wa s not able to include effects of self absorption etc. Birks et coll used fluorescent K-radiation with enrgies between 17.4 and 68.2 keV and compared the sensitivity of screen-film systems composed o f Y^O^S:Tb t o the sensitivity of only photographic film. Vyborny et coll measured th e speed of some screen-film systems at photon en ergies between 14 and 74 keV. They used only one film between two screens-and me asured the x-ray
photon fluence with a N al-detector.
The results of these authors are not comparable to those of this work as other screen-film systems were studied but the general trend of their results is similar to that found here.
From the measurements of screen-film sensitivity at different photon energies it is seen that CaWO^-screens are comparably mo re sensitive to low energy photons than the other screens. This has lead to
speculations that the CaWC^-screens should be mo re sensitive to scattered radiation. The investigation by N ielsen (1979) indicates
that this is so b ut it also shows that the relative sensitivity for scattered radiation is dependent on screen thickness.

67
CHAPTER 6
THE RE LATION B ETWEEN E MITTED S CREEN L IGHT AND T HE AB SORBED E NERGY IN THE SC REENS A T DI FFERENT PHOTON E NERGIES
The light produced by the screens can be expected t o be p roportional to the energy absorbed i n the screen phospho r and independent of photon e nergy, if there is no energy dependent effect present in the
light production or light transmission to the film. To i nvestigate if the light to the film is proportional to the absorbed energy in
the screen phospho r the absorbed energy has been c alculated from the measured at tenuation in the screens. These results have been com pared to the experimentally determined light output from the screens. This
light output was m easured both with film on t he whole screen pair
(chapter 5) and on on ly one screen with a PM-tube.
From these data on l ight to the film per absorbed energy in the screens, the number of photons needed t o produce a given film density
was ca lculated. This quantity is a fundamental contribution to the quantum mo ttle which is experienced in diagnostic x-ray images.
Calculations
The calculation of energy a bsorption in the screen p air is not as
straightforward as the attenuation (chapter 4) due to the fact that the energy o f a photon that undergoes an i nteraction is not always directly absorbed by the attenuating material. Photoelectric absorption in the heavy elements of the screen ma terial is the dominant
interaction and so me o f the K-radiation produced in these interactions will escape from the screen p air. Incoherent scattering accounts for between 0.1 and 18 % of the total attenuation coefficient, depending
on photon energy. This fraction of energy absorbed i n the screens has been calculated by an approximate method. Coherent scattered
photons gives no ab sorption and as the scattering angles of these
photons are small, the change i n direction of the scattered photons was no t taken into account. The calculation of absorbed energy i n a
screen pair is illustrated in a schematic wa y in figure 6:1.

68
Absorption and escape o f photon energy in the screen phospho r
c,esc
Absorbed energy
Relative contribution to the photoelectric cross section ~~ from the high-Z material
high-Zv
Absorbed energy
Relative K-snell contribution to the photoelectric cross section.. y
,TK,high-ZN
high-Z Absorbed energy
The K -fluore-scent yield -
Absorbed energy
Escaping fracti on (PK,esc)
Absorbed energy Average energy
of the escaping ^ K-radiation
Primary^^ photon energy
Re-absorption
K-photons
Incoherent (and coherent)
Interaction
Escape due to incoherent scattering
Photoelectric
she! 1
Escaping K-radiation energy
photons and Auger e lectrons
Photoelectric in the K-s he11
Photoelectric in the low-Z material of the phosphor
Photoelectric in the high-Z material
Figure 6:1 Schematic d escription of the energy ab sorption in a screen-pair

69
The secondary electrons normally have short pathlengths and wer e
considered to be locally absorbed but the escape f raction of K-
radiation from the high-Z elements in the screens and the incoherent scattered photons had to be c alculated. About 90 % of the photo
electric absorbed photons in the K-shell of the high-Z elements will produce K -radiation. Between 15 and 55 % of this K-radiation will be
re-absorbed in the screen p air depending on screen phosphor and screen thickness, appendix 1. Thus the absorbed f raction of energy f luence
to the screens (^^/^g) be c ritically dependent on the value of the escape f raction (P^ esc) for the K-radiation. A de tailed estimation of this has therefore been m ade (Appendix 1).
The escape of incoherent scattered photons have a t most e nergies a
very small effect on ^^/^g and i s rather complicated to calculate. A simpl e approximate meth od wa s therefore used. The p robability for the scattered photon to escape from the screen-pair (Pc esc) has been
estimated to be the same as the probability for the primary photons
to penetrate the screen-pair. This estimation is based on a number of assumptions; effects motivating an ab sorption probability greater than this are:
1) the energy of the scattered photon is somewhat lower than that of the primary photon and the attenuation cross section will therefore be i ncreased, and 2) the scattered photon will not travel perpendicularly through the
screen and the average pathlength will thus increase. An e ffect going in opposite direction (i.e. lower absorption) is: The scattered photon will be produced i nside the screen-pair and the distance to the screen surface will be s maller than the total thickness of the screen-pair
if the photon travels perpendicular to the screen surface. The approximate calculation of Pc esc should, however, not introduce any significant errors except possibly at higher energies (above about 100 keV) where th e fraction of attenuation due to incoherent scattering increases (chapter 4).
The absorbed fraction of the energy f luence to the screens (total

70
thickness 2d) was ca lculated according to:
*abs /T0 = 1 * exP <" (°incoh + T> • 2d) ~ _ TK,high-Z 'UK h v K
aincoh + T ) h v
P incoh .p
K 'esc ( öincoh + ^ c 'esc (6 :1 )
where ^ is the energy fluence incident on t he screen-film system,
P|< esc is the escaping fraction of K-radiation photons generated in the screen p air and
Pc,esc = exP (" Aincoh + * 2d> ( 6 : 2 )
The small energy d ifference between the coherent scattered photon and
the primary photon energy wa s omitted in eq 6:1 .
The fraction of photons attenuated in the screen-pairs at different photon energies was meas ured (chapter 4) and the absorbed energy was calculated from equation 6:1 using the data for attenuation and screen thickness in chapter 4 and esc in appendix 1. The absorbed energy in the screens i s compared to the attenuation in figure 6:2.
As can be seen from the figure, there is on the average only a small
difference between the attenuated fraction of photons and the absorbed fraction of photon energy below the K-edge o f the heavy element in the screen phosphors. This difference is due to the escape of coherent-and incoherent-scattered photons. At energies above the K-edge, the escape of K-photons accounts for most of the difference between attenuation and absorption.
Combining the data on screen sensitivity CQrr (chapter 5) and the
absorbed energy in the screens as c alculated in equation 6:1 it is possible to calculate for example, the light (expressed as the number
of light photons) from the screens per absorbed energy (N^/fe ) and

71
100 120 PHOTON ENERGY/keV
Figure 6:2 Attenuated fraction of photons ( ) and absorbed fraction of photon energy ( ) to the x-ray screens.
light per interacting (attenuated) x-ray photon The number of light photons in these calculations is determined by use of a factor k which r epresent the number o f light photons giving film density 1.0.
Ihe_number_of_1ight_ghotons_to_the_film_per_energy_absorbed i n the screen-pair (N^/e ) (figure 6:3 a-c) was ca lculated at different photon en ergies as
Ve = k ' Sv,corr 0
abs (6:3)
Sy corr is the film-screen sensitivity per energy f luence (chapter 5)
and (^g/^abs^ ""s the inverse of absorbed f raction of the energy fluence to the screen-pair as c alculated in equation 6:1.
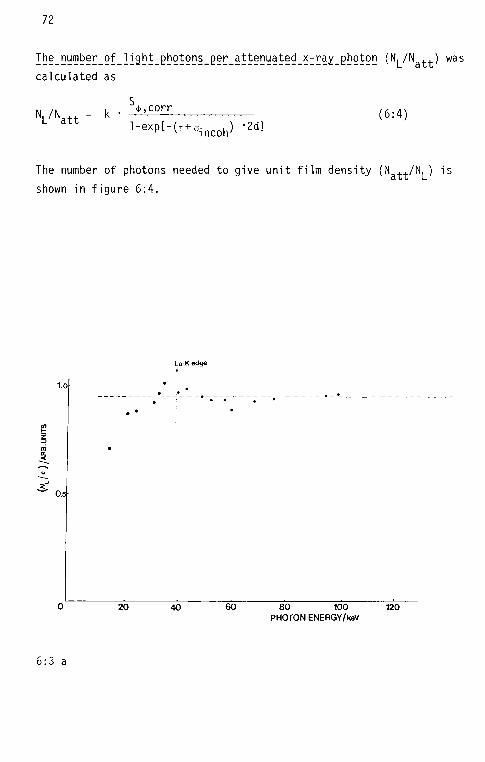
72
Ihe_number_of_]ight_9hotons_ger_attenuated_x-ray_ghoton (N|_/Na^-^) was calculated as
N,/N.+ = k • Sj, 'corr (6:4) l-e»p[-(,t<ìncoh) -2d]
The number o f photons need ed t o give unit film density (Nat^/N[_) ">s
shown in figure 6:4.
La-K edge •
20 40 60 80 100 120 PHOTON ENERGY/keV
6:3 a

73
Gd-Kedge I
ÖS
20 40 60 80 100 120 PHOTON ENERGY/keV
6:3 c
W-K edge •
20 40 60 80 100 PHOTON ENERGY/keV
120
Figure 6:3 The number of light photons per absorbed energy in the
screens (N^/e) determined a t different photon e nergies in: a) the LaOBr:Tb-screen b) the Gd^O^S-.Tb-screen
c) the CaWO^-screen

74
La Gd
0 20 40 60 80 100 120 PHOTON ENERGY/keV
Figure 6:4 The num ber of attenuated photons per unit area giving net film density 1.0. (N^^/N^) calculated for the different
screens, (—), the LaOBrrTb-screen (La), the Gd^SiTb-
screen (Gd) and (—) the CaWO^-screen (W).
Result and Dis cussion
The q uantity (N^/e ) (the "relative efficiency") (figure 6:3 a-c) could
be expected to be independent of photon 1) the light production in the screens was pro portional to the absorbed energy and 2) if all light reached the film without attenuation in the screen phosphor. The value of (N^/e) was found to decrease at low energies. One poss ible explanation of this effect is an incr eased self absorption of the light. This could be expected as a consequence of an in creased average path length of the light photons before reaching the film at low x-ray photon en ergies (chapter 7).
At photon energies just above th e K-edge o f the heavy elements the

75
attenuation in the screens is large and some increase in self-absorption of screen light might therefore also be expected at these
energies. This effect is not large but in the La- and Gd-screens some
decrease in (N^/e) above the K-edge o f La and Gd may be seen (figure 6:3 a-b). The d iscontinuous and r apid change i n sensitivity of the system just at the K-edge w ill make the observation of this small effect rather uncertain. This effect has also been sho wn by Vyborny et coll (1980), At higher energies, especially in the La-screen the contribution of re-absorbed incoherent scattered photons will be
significantly increased. This contribution was not fully taken account of in the calculations of absorbed energy i n the screens and
the greater amount of light produced pe r estimated absorbed energy (figure 6:3 a) could possibly be ex plained by the uncertainty in
these calculations when the escape o f incoherent scattered photons is not well known.
One ef fect which has not been considered in the calculations of absorbed energy in the screen phosphor is the energy ab sorption in the binding gel of the screen. Secondary e lectrons from the fluorescent crystals of the screen will in some cases be absorbed i n the binder and will thus not produce any screen light. This effect
has been mention ed by Shuping and Judy (1977). They es timated the
absorption of electron energy i n the binder to be le ss than 10 % but
the variation with photon e nergy, crystal size, amount of binder> photon energy and so on was not discussed.
Another possible effect which can in fluence the energy depe ndence of
(Nj^/e) is the fluorescent yield of the crystals in the screen phosphor which could be depen dent on the energy o f the secondary e lectrons. This effect has been sho wn fo r other inorganic crystals for, example in NaI:Tl (Prescott and Narayan, 1969).
The p resent calculations are all based on mea surements of screen
sensitivity which were carried out for two screens i n a cassette with
photographic film as light sensitive detector (chapter 5). It is also
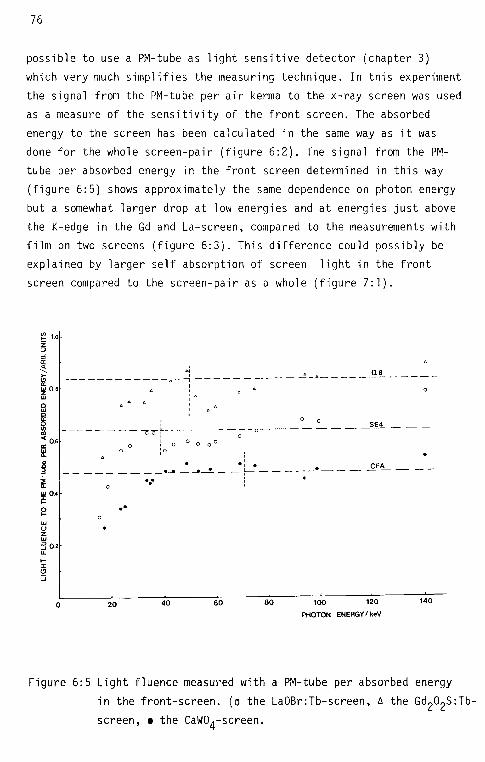
76
possible to use a PM-tube as light sensitive detector (chapter 3) which very much s implifies the measuring technique. In this experiment the signal from the PM-tube per air kerma to the x-ray screen was used as a measure o f the sensitivity of the front screen. The absorbed
energy to the screen has been calculated in the same way as i t was done for the whole s creen-pair (figure 6:2). The signal from the PM-tube per absorbed energy in the front screen determined in this way (figure 6:5) shows approximately the same depe ndence on photon energy but a somewhat larger drop at low energies and at energies just above
the K-edge i n the Gd and La -screen, compared to the measurements with film on two screens (figure 6:3). This difference could possibly be
explained by larger self absorption of screen light in the front screen compared to the screen-pair as a whole ( figure 7:1).
80 100 120 PHOTON ENERGY/keV
Figure 6:5 Light fluence measured w ith in the front-screen, (o the
screen, • the CaWO^-screen.
a PM-tube per absorbed energy LaOBr:Tb-screen, A the Gd^O^Tb-

77
The absorbed energy i n x-ray screens has been ca lculated in different ways by a number o f authors (Shuping and J udy, 1977; Birch et coll.,
1979; Vyborny et coll., 1980). Birch et coll (1979) calculated the
'useful energy a bsorption' but the re-absorbed K-radiation was not regarded as 'useful' in their calculations. Shuping and Judy (1977) calculated the absorbed energy per exposure to the screens in some CaWO^-screens when they were irradiated with different spectral
distributions. In these calculations the re-absorption of K-radiation was in cluded and the re-absorbed fraction calculated for W-screens
of different thickness give results very similar to those in this work. The absorbed energy in x-ray screens calculated by Vyborny et coll.
(1980) was com pared to the light from the screens when they were
irradiated by monoenergetic photons of different energies. These
results are very similar to those in this work.
The re-absorption and escape o f K-radiation from x-ray screens has
been calculated by Vyborny et coll. (1978) and Venerna (1979). The results of these calculations are comparable to the calculated escape of K-radiation in this work. These sets of results are very similar if corrections for the small differences in screen thicknesses are appi i ed.
The number of x-ray photons that produce an image is an important quantity as a ll imaging systems used in diagnostic radiology have to
be op timized to use as little radiation as possible. This optimization
often leads to the use o f such a low number o f 'imaging photons' that quantum mot tle will decrease the image quality. The quantum mottle in an image i s dependent on t he number of light photons contributing to the image. The number o f interacting x-ray photons per unit area needed t o give a certain film density in a screen-film system is dependent on e .g. the absorption characteristies of the
x-ray photons, the light conversion efficiency of the screen light and the sensitivity of the film to the light emitted from the screens.
2 The num ber of photons per cm interacting in the screens and giving a net film density 1.0 was calculated as a function of photon energy for the different screens (figure 6:4). The three systems require
78
different numbers o f photons per unit area for a given film density but the number o f photons is also dependent on photon energy. More photons are needed a t low photon ene rgies compared to high energies
except for effects at the K-edge wher e escape o f K-radiation from the screens have to be comp ensated for with more photons. In all cases
when the quantum mottle limits the use of fast systems, the choice of
photon energy should be cons idered. The quantum mottle at different x-ray qualities has been i nvestigated by Barnes (1976). He found that the quantum mo ttle tended t o increase when the kV of the x-ray unit was incr eased. This is what one would expect with regard to our calculations even if these omit a number o f other effects which a re important in the determination of the quantum mo ttle.

79
CHAPTER 7
A C OMPARISON O F S CREEN-LIGHT FR OM T HE F RONT A ND T HE B ACK S CREEN O F A SCREEN PA IR
The front screen of a screen pair will absorb more x -ray photons
than the back screen whe n two x-ray screens of equal thickness are
used. This difference in absorbed energy is dependent on th e material in the screens, the screen thickness and the photon energy . The difference in light output from the screens is therefore expected
to depend on these factors in the same wa y but here also the self
absorption of the screen-light could be expected to have e ffects on this asymmetry. This difference in light to the two f ilm emulsions has been s tudied for different photon ene rgies as asymmetric illumination of a film with two emulsions could change the HeD curve of the
film (chapter 3). Both the light fluence from the front and the back screen and the absorbed energy in the separate screens were determined
at different photon ene rgies to investigate this asymmetry.
Re-absorption in one screen o f K-radiation which i s produced in the
opposite screen o f the screen p air is an e ffect which is often neglected in simplified measurements and calculations on s creen-film
systems. This contribution was in cluded here in the calculations of absorbed energy in the separate screens. To i llustrate the importance of this effect, curves showing t his contribution as a function of photon energy are presented for the different screens (Figure 7:4, 7:5).
Differences between the experimentally found value of the ratio of light emission from the front and the back screen and the calculated ratio of absorbed energy in these screens c ould be exp lained by d ifferences in the self absorption of the screen light for the two scree ns.
Some simple calculations were carried out to demonstrate this effect.

80
Experiment and Ca lculations
To determine the relative light contribution from the separate screens
in a screen p air, the screens were irradiated by the K-radiation sources and 141 keV-photons from Tc-99m (chapter 2). The light from
the front and the back screen was m easured with two separate films (see chapter 5) and differences in density between the films were
corrected for by the use of measured HeD-curv es. Corrections for differences in reciprocity failure between the front and bac k films were also carried out.
The light production efficiency of a screen used in a front and back
position was comp ared. In another comparison betwe en a front and a
back sc reen, corrections were ma de fo r the photon a ttenuation in the front screen when the light output from the back screen was evaluated. Measured values of the attenuation in the screens (chapter 4) were used to enable these corrections to be m ade. The attenuation was measured i n a narrow beam geometry and doe s not include any secondary
radiation which ma y give contributions to the absorbed energy in the back scr een. The most important contribution is the K-radiation which is produced in the front screen. However, the coherent- and incoherent-scattered photons will also give some a ddition to the back screen.
The absorbed energy in the two screens were calculated by a method similar to that used in chapter 6 but the K-radiation produced in the
other screen o f the screen p air had to be i ncluded. This contribution, which is energy dependent and als o dependent on screen phosphor and screen thickness, has been c alculated in appendix 1.
The self absorption of screen light could be expected to be d ifferent for the front and the back screen as the energy absorption in a screen pair is largest at the front surface of the x-ray screens. The average distance between the film and the point where the photons are absorbed w ill therefore be d ifferent for the front and the back screen. The average distance in the back screen between the point where th e

81
photons are photoelectrically attenuated and the film, perpendicular
to the screen surface has been c alculated according to the
formula:
r d
'o z t * exp( -T 'z)dz back
J t • exp( -T #z) dz o
exp(- T-d)
[1 - exp(- T 'd)]
(7:1)
where d = the screen thickness t = the linear photoelectric attenuation coefficient.
(d - z ) • t • exp ( - i -z)dz ; = _2 = d - X , , (7:2)
front , back v ' J t * exp (- T -z)dz
To ob tain an average light travelling distance for both the front and back screen, the distances in each screen were calculated and weighted
in relation to the absorbed energy i n screen.
*front + exP ("T 'Z)" *back
(1 + exp(-T'd))
T r u r i L U C I L N ( 1 • r X \ Xtot = — ( / . Ó )
In these rather approximate calculations the effects of re-absorbed
K-radiation and other secondary r adiation were not taken into account. This will not give any s ignificant errors at energies below th e K-edges
but above the K-edges the values of x f ront and be somewhat too large as the re-absorbed K-radiation and other secondary r adiation will make th e dose distribution in the screens mor e u niform than was calculated here. Xfr^nt, and are calculated for the different
screens at different photon en ergies and presented in figure 7:1.
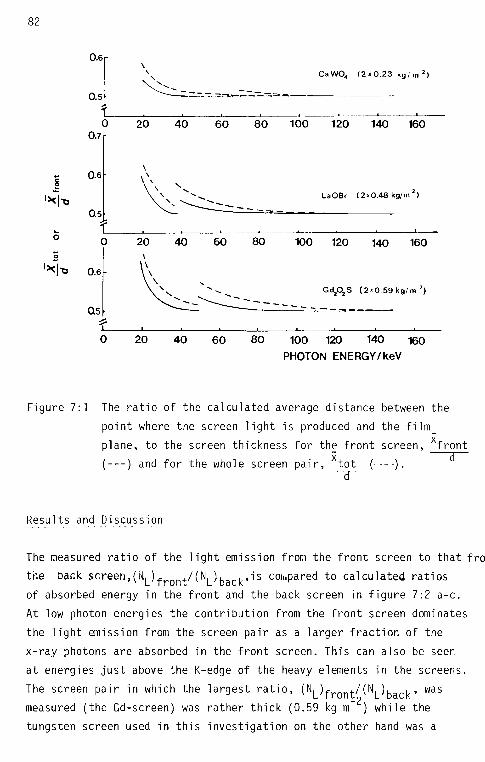
82
0.6
0.5
CaW04 (2x0.23 kg/m 2)
»XI
0 20 40 60 80 100 120 140 160 0.7 r
S 0.6
05
"G 0.6
0.5
LaOBr (2x0.48 kg/m )
20 40 60 80 100 120 140 160
Gd202S ( 2 * 0.59 kg/ m 2)
20 40 60 80 100 120 140 160 PHOTON ENERGY/keV
Figure 7:1 The r atio of the calculated average distance between the
point where th e screen light is produced and the film
plane, to the screen thickness for the front screen, xfront X H
( — ) and for the whole screen pair, tot (-—). cT
Results and D iscussion
The mea sured r atio of the light emission from the front screen to that fro
the back $creeM\)front/(NL)back ,1s COh,Pared to calculated ratios of absorbed energy i n the front and the back screen in figure 7:2 a-c.
At low photon energies the contribution from the front screen dominates the light emission from the screen p air as a larger fraction of the
x-ray photons are absorbed in the front screen. This can al so be seen at energies just above the K-edge o f the heavy elements in the screens.
The screen p air in which the largest ratio, (\)front/C\)back » was
measured (the Gd-screen) was ra ther thick (0.59 kg m~ ^) while the
tungsten screen used in this investigation on t he other hand wa s a

83
-2 fairly thin "universai11 screen (0.23 kg m ). The asymmetry of the
light distribution in thicker tungsten screens will probably be l arger than in this screen.
The difference between mea sured r atios of the light emission, (N^)front
^L^back' anc ' ca^cu^a" tec ' ratios of absorbed energy in the front and the back screen (ep/eg) is largest at low photon en ergies. This difference is also quite large in some screens at energies just above the K-edge o f the elements in the screen phosphor. The d ifference seems to be due to the fact that the light must, on t he average, travel a larger distance in the front screen than in the back screen and thus experience more a bsorption (cf eq 7:1 and 7:2).
*tot The c alculated value of —in figure 7:1 indicate that the average distance that the light photons travel to reach the film is increased
especially at low photon e nergies. This can be expected t o give an increased self-absorption of light photons in the screen phospho r
and lead to lower "efficiency" of the whole screen pair at low energies as was sho wn to be the case i n chapter 6. Theoretical evalua
tion of light absorption in x-ray screens (Riihimäki et coll. 1982, Morlotti 1975) also indicate a decreased "efficiency" for thicker
screens because of decreased c ontributions from the parts of the screens furthest away from the film.
To sho w the difference in "efficiency" of a front and a back screen
as a function of photon e nergy, the measured l ight emission from the back screen was cor rected for the x-ray photon a ttenuation in the
front screen.
The quotient of the light contribution from the front screen and the corrected contribution from the back screen wa s plotted against photon energy (figure 7:3) where the same photon fluence was ass umed t o reach
the two screens. These re sults indicate that the "efficiency" of the two screens is almost the same except at energies where tot (figure
—ï~ 7:1) increases and the self-absorption of screen light could be ex
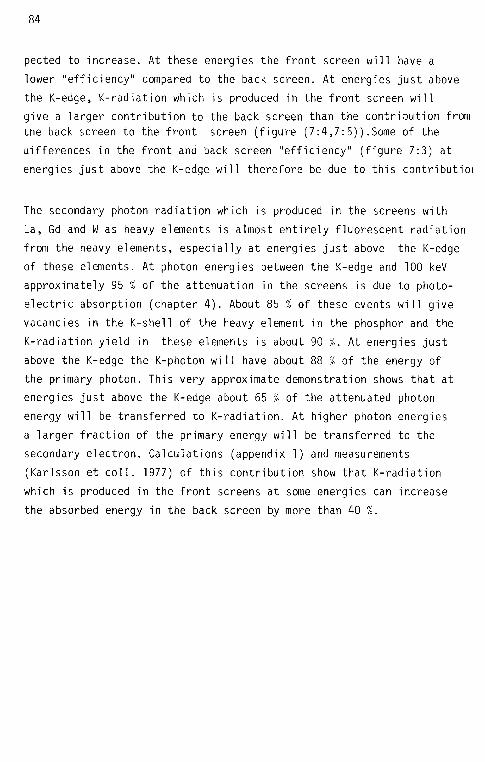
84
pected to increase. At these energies the front screen will have a
lower "efficiency" compared to the back screen. At energies just above the K-edge, K-radiation which i s produced in the front screen w ill give a larger contribution to the back screen than the contribution from the back screen to the front screen (figure (7:4,7:5)).Some of the differences in the front and back screen "efficiency" (figure 7:3) at energies just above th e K-edge w ill therefore be due to this contributioi
The secondary photon r adiation which is produced in the screens with
La, Gd and W as heavy elements i s almost entirely fluorescent radiation from the heavy elements, especially at energies just above the K-edge of these elements. At photon energies between the K-edge and 100 keV approximately 95 % of the attenuation in the screens is due to photoelectric absorption (chapter 4). About 85 % of these events will give vacancies in the K-shell of the heavy element in the phosphor and the
K-radiation yield in these elements is about 90 % . At energies just above the K-edge t he K-photon w ill have about 88 % of the energy o f
the primary photon. This very approximate demonstration shows that at energies just above th e K-edge about 65 % of the attenuated photon
energy w ill be transferred to K-radiation. At higher photon en ergies a larger fraction of the primary energy will be t ransferred to the secondary electron. Calculations (appendix 1) and mea surements
(Karlsson et coll. 1977) of this contribution show th at K-radiation
which is produced in the front screens a t some en ergies can inc rease the absorbed energy in the back screen by mor e than 40 % .

7:2 a
85
La-Kedge
80 100 120 PHOTON ENERGY/keV
ì 5 ' ) e-j
Gd-Kedge
80 100 120
PHOTON ENERGY/keV
7:2 b

86
O 20 40 60 80 100 120 140 W - K edge PHOTON ENERGY / keV
7:2 c
Figure 7:2 The quotient of measured l ight emission from the front
screen to that from the back screen ( (^i_)f ront^^L^back^ ( ) and the quotient of calculated absorbed energy in the front screen to the back screen ( p/ ß) (—-). These
ratios are calculated as functions of photon energy in: a) the LaOBr:Tb-screen
b) the Gd^O^S^b-screen C) the CaWO^-screen

87
Ca WO,
LaOBr
—« • ' 1 «— i i i
20 40 60 80
PHOTON ENERGY/keV
Figure 7:3 The ratios of light emission from the front screen to that
from the back screen a fter correction for attenuation in
the front screen. (NL^front^NL^back ( the same Photon
fluence reaching either' screen).
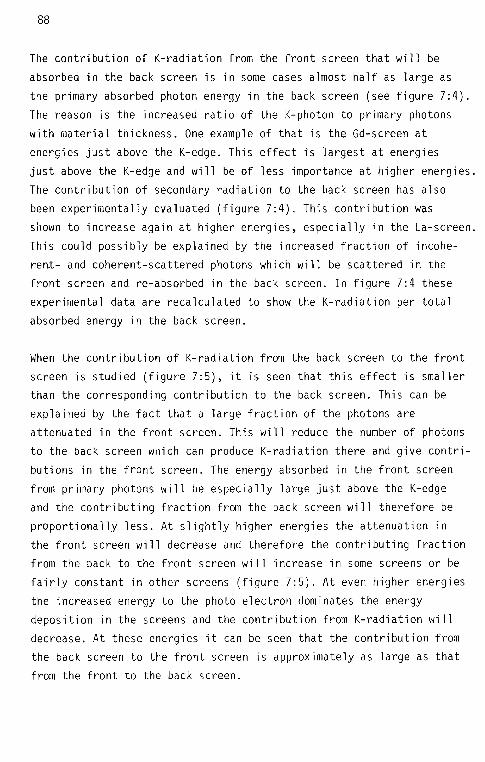
88
The contribution of K-radiation from the front screen that will be absorbed in the back screen is in some cases almost half as large as
the primary absorbed photon energy in the back screen (see figure 7:4).
The reason i s the increased ratio of the K-photon t o primary photons with material thickness. One exam ple o f that is the Gd-screen a t
energies just above the K-edge. This effect is largest at energies just above the K-edge and w ill be of less importance a t higher energies.
The contribution of secondary r adiation to the back screen has also been ex perimentally evaluated (figure 7:4). This contribution was shown to increase again at higher energies, especially in the La-screen. This could possibly be ex plained by the increased fraction of incoherent- and c oherent-scattered photons which w ill be s cattered in the front screen and re-absorbed in the back screen. In figure 7:4 these experimental data are recalculated to show the K-radiation per total absorbed energy in the back screen.
When th e contribution of K-radiation from the back screen to the front screen is studied (figure 7:5), it is seen that this effect is smaller than the corresponding contribution to the back screen. This can be explained by the fact that a large fraction of the photons are attenuated in the front screen. This will reduce the number of photons to the back screen which can produce K -radiation there and g ive contri
butions in the front screen. The energy absorbed i n the front screen from primary photons will be e specially large just above the K-edge and the contributing fraction from the back screen w ill therefore be proportionally less. At slightly higher energies the attenuation in the front screen will decrease and therefore the contributing fraction from the back to the front screen w ill increase in some screens o r be fairly constant in other screens (figure 7:5). At even high er energies the increased energy to the photo electron dominates the energy deposition in the screens and the contribution from K-radiation will decrease. At these energies it can be seen that the contribution from the back screen to the front screen is approximately as large as that from the front to the back screen.

89
0.3
LaOBr
0.2
m t *
0.1
o 20 40 140 60 80 100 120 PHOTON ENERGY/ keV
Figure 7:4 The calculated fraction of absorbed energy i n the back
screen which i s due to the re-absorption of K-radiation produced in the front screen ( ); &= Experimental data from Karlsson et coll (1977) for the LaOBr-screen

90
0.15
0.1 o
U_
LaOBr
0.05
80 100 120 140 0 20 40 60 PHOTON ENERGY/kö/
Figure 7:5 The calculated fraction of absorbed energy in the front
screen which is due to the re-absorption of K-radiation
from the back screen.

91
Summary
The light fluence from the front screen is often much larger than that
from the back screen. This could have effects on both the speed and the HsD-curve o f the double emulsioned film which is used betw een th e
two screens (chapter 3). It is, however, possible to compensate this
asymmetrical illumination by, for example, using a thicker back screen which some systems actually do o r eventually using different screen phosphors in the two scre ens.
The self-absorption of screen light was found to be l arger in the
front screen than in the back screen. This self-absorption of light in the screens is energy depend ent and has to be consider ed in
calculation of, for example, the speed o f x-ray screens. When on ly
one x-ray screen is used in a system, it is clear from this investigation that such a screen should be m ore s ensitive due t o lower light absorption if it is used as a back screen instead of using it in front of the film.
The contribution of secondary r adiation which i s produced in one screen and re-absorbed in the other screen o f a screen p air was found to be
large in some screens, especially at energies just above the K-edge of the heavy element in the screen phosphor. This contribution has to be consider ed when the absorbed energy in the two screens of a screen pair are calculated separately. Measurements o f screen characteristics which a re carried out on on ly one screen c ould be d ifficult to relate to a screen-film system w ith two screens because of the loss of this K-radiation contribution from the other screen in the screen p air.

92
CHAPTER 8
VARIATIONS IN THE M TF O F X- RAY SCREENS W ITH P HOTON E NERGY
Introduction
In this section the resolution of a screen-film system de scribed by the modulation transfer function (MTF) has been s tudied as a function
of photon energ y. There are a number of energy depend ent factors which could affect the resolution of an imaging system w ith two x -ray screens and a double-emulsioned film. Some examp les of such effects
are:
1. The attenuation in the screens i s large, especially at low photon energies and in some cases also just above the K-edge o f a high-Z
element in the screen phosphor. In these cases most of the photons will be absorbed in the frontal parts of the front screen and the light will on the average be produced a t a larger distance from the film than is the case at other photon e nergies. Light which is produced further away from the film can, due to larger diffusion, be expected
to give a poorer resolution and M TF i n the image. This type of decrease in MTF w ith a change i n photon energy has been sho wn both experimentally (Karlsson and Wic kman, 1979) and by calculations of photon absorption and light diffusion in homogeneous x -ray screens (Swank, 1973) ana in image intensifier screens of Csl (Giakoumakis et coll,
1980).
2. Fluorescent K-radiation will be produced i n the screen-pair at
photon energies greater than the binding energy o f the K-electron in
the heavy element in the phosphor. The average path length of this K-radiation is normally large (several screen thicknesses) and some o f this radiation will be reabsorbed in the screens. This re-absorbed K-radiation can, to some e xtent, be expected to cause a decrease in the
resolution of the system (Karlsson and Wic kman, 1976; Karlsson et coll, 1977; Karlsson and Wickm an, 1979).

93
Spatial frequency Spatial frquency
Figure 8:1
The one dimensional spatial frequency distribution of a cut through a vessel shaped o bject (a) and an inf i ni tes ima Hy narrow line (b)

94
object image
object
a cut through the
di stance
image
distance
the spatial frequency distribution of the
object image (MTF)
CD ~a cu
"O Z5
spatial frequency spatial frequency
Figure 8:2 A schematic description of the image, LSF and M TF of an i nfinite-simally narrow line
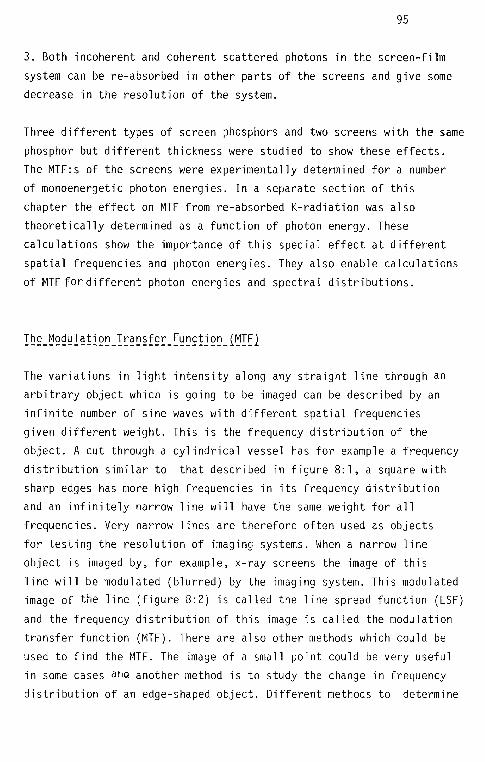
95
3. Both incoherent and coherent scattered photons in the screen-film
system can be re-absorbed in other parts of the screens and g ive some decrease in the resolution of the system.
Three d ifferent types of screen phosphors and two screens with the same
phosphor b ut different thickness were studied to show these effects. The MT F:s o f the screens were experimentally determined for a number
of monoenergetic photon en ergies. In a separate section of this chapter the effect on M TF from re-absorbed K-radiation was als o theoretically determined as a function of photon energy . These
calculations show the importance of this special effect at different
spatial frequencies and photon energies. They a lso enable calculations
of MTF for different photon energies and spectral distributions.
The_Modu]ation I^§nsf er_Function_[MTF]
The variations in light intensity along any s traight line through an arbitrary object which is going to be imaged can be descr ibed by an infinite number o f sine waves with different spatial frequencies given different weight. This is the frequency distribution of the
object. A cu t through a cylindrical vessel has for example a frequency distribution similar to that described in figure 8:1, a square w ith sharp edges has more h igh frequencies in its frequency distribution and an infinitely narrow l ine will have the same we ight for all frequencies. Very narrow lines are therefore often used as objects
for testing the resolution of imaging systems. When a narrow l ine object is imaged by , for example, x-ray screens the image o f this
line will be modulated (blurred) by the imaging system. This modulated image of the line (figure 8:2) is called the line spread function (LSF)
and the frequency distribution of this image is called the modulation transfer function (MTF). There are also other methods which co uld be used to find the MTF. The image of a small point could be ver y useful in some cases ana another method i s to study the change i n frequency
distribution of an edge-s haped o bject. Different methods to determine

96
the MTF have bee n discussed in the literature by e .g. Dainty and Shaw (1974), Nielsen (1980, 1981) and Kusoffsky and Carlsson (1973).
MTF i s a function which tells how we ll different spatial frequencies in an o bject will be recorded by the imaging system. With the knowledge
of MTF and th e spatial frequencies of an o bject it is possible to calculate how t his object will be imag ed by the imaging system.
In experimental determinations of LSF and M TF t here are a number of
distortions that have to be taken care of. LSF and M TF are defined only for linear systems where the output signal always is proportional to the input signal. In the case of film and x-ray screens this means that LSF and M TF should not be determined for the density distribution in the f1 im but rather for the light distribution from the screens which g ives this density distribution. This can be achieved by a detailed knowledge o f the relationship between light fluence and film density (the HsD-curve); Furthermore, LSF and MT F are only defined for images without noise, but as such images are difficult to achieve the noise components have to be reduced by suitable smoothing and averaging methods. In the measurement set-up it is often difficult to achieve an infinitesimally narrow l ine shaped o bject and if the frequency distribution of the input image is not unity for all spatial frequencies, this has to be comp ensated for.
The modula tion of very low spatial frequencies is difficult to measure with this method bu t for the purposes of this work it was regarded as
sufficient to study the energy depe ndence of MTF f or spatial frequencies between 0.5 and 5 mm \ as this covers the most important frequencies in diagnostic x-ray imaging.
Experimental Determination of the LSF
The LSF was obtained by irradiating the screens w ith different mono-energetic x-ray sources through a narrow slit in a platinum plate

97
(figure 8:3). This narrow beam behind the slit simulates a delta func
tion. When the input image i s a delta function then a scan across the light ditribution of the screens will give the line spread fu nction
of the screens (LSF). A fo urier transform of this LSF will then produce the modulation transfer function (MTF) of the screens. In this case with x-ray screens, film and the available photon sources it is not
possible to obtain perfect conditions with regard to the width of the
slit and the requirement of a linear detector response. These effects must therefore be c orrected for.
400 mm 1
radiation ' source
Al-cassette film
slit (0.03 mm) front / back screen
screen / /
screen phosphor
all measures In mm
Figure 8:3 The experimental arrangement in the LSF-measurements.

98
The_Geometry_of_the Platinu m Slit
Morgan et coll (1964) and Rossman and Lubberts (1966) used 1.5 to 2 mm thi ck platinum for preparation of the slit. However, if thick
plates are used the lining up o f the slit will be ver y critical. In
this investigation where ra ther large radiation sources are used and where the distance between the slit and the source is only 400 mm i t is
not possible to align a thick slit properly. The scatter and penetration at the edges of the slit could then change th e image of the
slit with photon energy and thereby the spatial frequency of the input image. Therefore the slit was m ade o f only 1 mm thi ck platinum. The penetration of x-ray photons through 1 mm of Pt is sufficiently small ( 2 % ) to be acceptable at all the photon ener gies considered. When a screen is irradiated through a narrow slit the light intensity within the slit will be reduced by the light diffusion in the screens.
The effective contribution from photons which p enetrate the Pt-plate will therefore depend on the slit width and the LSF of the screen. As the slit is narrow compared to the line spread fu nction this contribution from transmitted radiation was regarded as a homogeneous background and thus the same v alue was sub tracted at all distances from the slit. This was assumed not to influence the results of the measurements. Measurements show th at the contribution from the transmitted x-ray photons always is less than 6 % of the maximum fi lm density for
the slit and screens used in this investigation.
The slit in the Pt-plate is 30 m wide and 10 mm long. The r adiation
source is line-shaped, 5 mm wi de and 25 mm long , and the distance
between the slit and the x-ray screen i s 400 mm (fi gure 8:3). The relatively large radiation source and short source-slit-distance will
not give a perfect image of the slit in the x-ray screens. However rather than correcting the measured LSF for this effect, it is easier
to correct the MTF de rived from these LSF measurements. The spatial frequency distribution of the input image (F^ ) will be som ewhat
different from that theoretically expected f or an image of the 30 ym
wide slit.

99
1.0
0.8
E UT
0.6-
0.4
Q2
SPATIAL FREQUENCY (mm-1)
Figure 8:4 The calculated spatial frequency distribution of the input image F^m used in LSF-measurements of screen-film systems. A "normal" case (—) and a "worse" case
(—)•
The frequency distribution in different input images (F^) has been calculated for different distances between the slit and the screen
and betw een the radiation source and the slit. These calculations consider only the optical image of the 5 mm wi de source a t the image plane of the screens. A cu t through the image o f the slit was ca lculated in the position of the screens. The fourier transform of this
will then give the F. . The geometrical arrangements were first chosen to approximate the normal case, i.e. 2 mm distanc e between slit and screen and 400 mm b etween th e source and the slit, see fi gure 8:3. A worse case wa s also calculated. Here th e slit screen d istance was 3
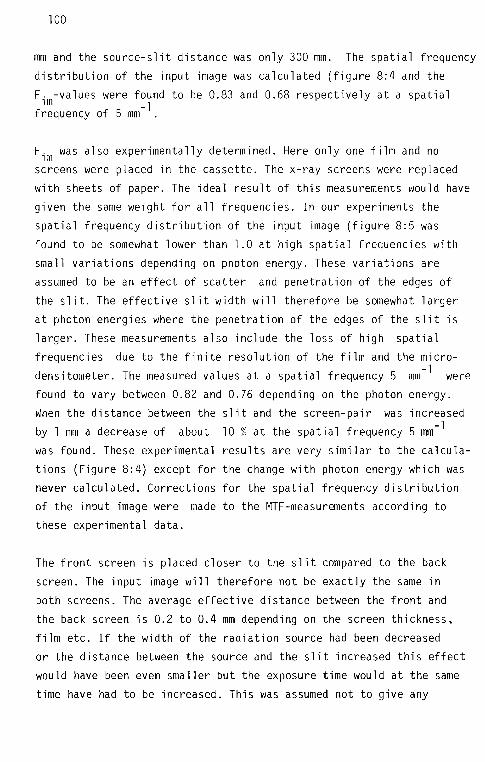
100
mm a rid th e source-slit distance was only 300 mm. The spatial frequency
distribution of the input image was ca lculated (figure 8:4 and the F. -values were found to be 0.83 and 0.68 respectively at a spatial
im 1 r J v
frequency of 5 mm" .
F.jm was als o experimentally determined. Here on ly one film and no screens were placed in the cassette. The x-ray screens were replaced
with sheets of paper. The ideal result of this measurements would have given the same weig ht for all frequencies. In our experiments the spatial frequency distribution of the input image (figure 8:5 was
found to be som ewhat lower than 1.0 at high spatial frequencies with small variations depending on photon en ergy. These v ariations are
assumed t o be an effect of scatter and pe netration of the edges of
the slit. The effective slit width will therefore be som ewhat larger at photon en ergies where t he penetration of the edges of the slit is larger. These mea surements also include the loss of high spatial
frequencies due to the finite resolution of the film and the micro
densi tometer. The mea sured values at a spatial frequency 5 mm ^ were found to vary between 0.82 and 0.76 depending on th e photon ene rgy. When t he distance between the slit and the screen-pair was increa sed by 1 mm a decrease of about 10 % at the spatial frequency 5 mm ^ was found . These experimental results are very similar to the calculations (Figure 8:4) except for the change w ith photon energy which was never calculated. Corrections for the spatial frequency distribution of the input image were made to the MTF-measurements a ccording to these experimental data.
The front screen is placed closer to the slit compared to the back
screen. The input image will therefore not be e xactly the same i n both screens. The average effective distance between the front and the back screen is 0.2 to 0.4 mm d epending on the screen thickness,
film etc. If the width of the radiation source had been decreased or the distance between the source and the slit increased this effect would have been even sm aller but the exposure time would a t the same
time have had to be increased. This was ass umed not to give any

101
significant errors in the MTF of the whole screen pair as used in
the clinical situation.
1.0
Û8
0.6
0.4
Û2
5 4 3 0 1 2 SPATIAL FREQUENCY (mm -1)
Figure 8:5 Experimentally found spatial frequency distribution of
the input image, F ^m, (corresponding the the "normal" case i n Fig 8:4) used i n the LSF-measurement o f screen-
film systems. The frequency distribution for both a low 25 keV, ( — ) and a high, 98 keV, ( ) photon energy is
presented.
102
Use of_Fi]m_to_Determine_the LSF
Several methods can be used to measure LSF and M TF f or x-ray screens but in order to have the screens in the same geometr y as in clinical use, photographic film was chos en as the 1ight-registrering medium. The non-linear relationship between light fluence to the film and film
density must be c orrected for. The meth od chose n here works with film, pre-exposed at high light intensity. This pre-exposure will almost entirely eliminate the toe-region in the HeD-curve and corrections for
the residual non-linearity will be m uch simpler (chapter 3). The measured o ptical density-distribution in the image o f the slit is corrected with the help of an HsD-cu rve mea sured for constant time by
varying the kerma rate. This HsD-curve wa s determined on each occasion but it was seen t hat the change i n the corrections were small if the
film was pre-exposed t o approximately the same de nsity level. It was also seen t hat the H^D-curve wa s very close to linear except at high densities at which the shoulder effect is significant.
If film used in the determination of LSF,cross-over of light between the two f ilm emulsions will influence the LSF. This cross-over will reduce the resolution of the screen-film system and i n some cases the effect could be ra ther large (Sanderson and Clea re, 1974). As this cross-over effect could be expected to change w ith the colour of the screen-light the effect of cross-over might be depen dent on photon energy whe n screens with mixed fluorescent materials are used. However, in this investigation screens w ith mixed fluorescent materials were not used and thus it would be assumed t hat there was no energy dependence in the cross-over effect.
In the determination of LSF (and M TF) in a screen p air the directly absorbed photons in the film will give a sharper image o f the slit compared to the image giv en by the screen light. As the light behind the slit will spread out in the screens over an area which is much
larger than the slit, this will decrease the intensity of the light behind the slit and the contribution of directly absorbed photons

103
over the narrow central part will thus be p roportionally larger. If this directly absorbed p art gives contributions to the film density
this will also result in a "better" LSF than is normally the case.
The LSF is further "improved" if an even s maller slit is chosen. Also an increased reciprocity failure could possibly improve the LSF as the direct contribution will increase relative to the light contribution to the film density.
The d iscussion above is only relevant if the directly absorbed photons give an increased density behind the slit. In some extreme cases there
could even be a decreased d ensity instead, according to James (1977).
Based on t he discussions and mea surements in chapter 3 the contribution from directly absorbed photons has been ass umed t o be small in all x-
ray screens a t all photon ene rgies and this effect was not considered in the calculations of MTF. Lubberts (1969) observed that the effect of directly absorbed photons by increasing the distance between the back-screen and the film emulsion to 100 yra. This problem has a lso
been mentione d by Rossman et coll (1964) and Mo rgan et coll (1964). Rossman and M organ d id not explain or investigate this effect but Rossman says without any ex planation that the contribution of directly absorbed photon should perhaps not be d irectly added to the film
density.
The density distribution in the films were scanned with a mi cro-densitometer (Joyce and Loebel, 3CS) in order to determine the LSF. The e ffective width of measuring aperture was chosen as 10 ym and the
length was 2 mm. When a slit of this length is used one has to align the slit parallel to the LSF-image very carefully. The film density could be samp led i n steps of 4.7, 9.4 or 18.8 ym and the analogous density signal was d igitized by an A DC un it (analog to digital converter) and stored in the memory of a mul tichannel pulse height analyzer (DIDAC 800). The density distribution could be f urther viewed on an oscilloscope screen, plotted on a X-Y-recorder, and

104
transferee! to a larger computer (Cyber 172) where t he measured de nsity distribution was used t o calculate the LSF and M TF of the system.
Rather large errors from several sources may ar ise in the determination
of the LSF with a micro densitometer. Some f actors which ma y introduce errors were studied in detail:
1. The film density was com pared to a density wedge (E 831) in the microdensitometer.The wedge was check ed w ith a calibrated density
step and found to be l inear within the 0.3 % which wa s the resolution of the system.
2. For a non-parallel setting between film-image and scanning a perture,
the recorded slit-profile will be broadene d. It is no problem in making an adjustment between the aperture and the si it-image which gives an angle smaller than 0.4°. This implies that if one end of the
2 mm long aperture is placed at the centre of the LSF-image then the other end of the aperture will be 13 ym of f centre. This would not
significantly change the LSF, a fact which was experimentally verified.
3. The length of the scan must be such that the entire slit-image is covered and the zero-density value is reached. This zero-density was
calculated from the 30 first and 30 last data points in each scan. It was exp erimentally found that the length of the scan should be a t least 2 mm fo r the screens used i n this investigation.
4. The objective of the microdensitometer must be carefully focused and the film must always be kep t at the same d istance from the objec
tive. As there are two emulsions in the film and the distance between
them is about 0.15 mm it is not possible to focus the microdensitometer exactly on both emulsions at the same time. To check this effect the LSF was m easured on a film with the optics focused both on the front emulsion, back emulsion and between these emulsions. No significant difference was found in the LSF or MTF a t spatial frequencies
below 5 mm ^ .

105
5. The film was i lluminated with a light field which had to be l arger
than the aperture of the microdensitometer. If this light field is
much larger than the aperture there will be s ignificant contribution from light scattered into the area which is covered by the aperture
giving unwanted c ontributions to the measurements. This effect was
experimentally investigated by u sing different widths of the light field (20-150 ym). However, only very small changes in the LSF were
seen. To reduce the influence of this effect and to keep the contribution constant if it was pre sent, the light field used was chos en to
be 50 ym wide when a 10 ym wide a perture was used. The centering of this light field was found to be ra ther important and if the light
field was ver y badly centered around the image of the aperture, errors in the LSF-measurements were observed.
6. The width of the microdensitometer aperture was chosen as 10 ym following Rossman an d Cleare(1966) and i ts length was 2 mm. The average of two o r three scans in different parts of each slit image was used
to obtain better statistics in the results. Measurements on the same slit image were al so carried out with different widths of the aperture
(between 10 and 20 ym) and d ifferent lengths (1.5 - 3 mm) to check the effect of these changes. If the angle between t he aperture and
the slit image i s small then the length of the slit only influences
the statistics in the measured d ata. The width of the aperture will also change th e statistics but a wider slit will also change the MTF of the measuring system (about 2 % at 5 mm V
7. The settings of scanning speed, its differential control and the
"pen damping"(time constant) of the microdensitometer scan could be
chosen i n different ways. Values of these controls had to be chosen and checke d in such a way t hat the measured d ensity distribution
would no t be i nfluenced by these parameters. It was sho wn by changing these parameters that when o nly frequencies of less than 5 mm ^ are of interest these controls could be s et within rather wide limits. A low scanning speed (with the differential control at maximum se nsitivity) and low "pen dampin g" (speed = 2, pen damp =2-5, diff = 0) were used in
the LSF measurements.

106
8. The distance between the samples was chos en to 9.2 y m . It has been
shown (Metz et coll, 1972) that if the sampling interval 10 ym is used,
the errors introduced in the MTF i s less than 0.005 at a spatial frequency of 5 mm ^ .
1§512D§_Ï2_ DÊÎÊITI1!
1. The background density was s ubtracted from the measured LSF -image
on t he film. The average value of the 30 values at each end of the scan was used as background. The scan normally contains 400 measured values with a sampling di stance of 9.2 ym.
2. The light distribution or LSF of the screen wa s calculated from the measured de nsity distribution. The HsD-curv e of the film was cor rected
for by u sing a computer program. Here i t was seen th at the HeD-curve
did not change s ignificantly from mea surement to measurement if the film processor was kept under control. The ma ximum densi ty should
not be hi gher than 1.70 (odu). The corrections for the HeD-curve were checked by measuring the same LSF but changing the maximum fil m
density; consistent results were obtained.
3. The meas ured LSF is composed both of the true LSF and statistical noise in the image which has to be reduced by smoothing o f the measured LSF. This noise may in troduce errors in the MTF-calculations (Sanderson, 1968). A spe cial type of smoothing has been used wher e a smoothing wa s
applied to the logarithm of the LSF except for LSF values above the 90 % level where no smoothing was applied. This smoothing used the average valu e of 5 data points according to the formula:
LSFs(x)=exp([ln(LSF(x-2))+ln(LSF(x-l))+ln(LSF(x))+
ln(LSF(x+l))+ln(LSF(x+2)]/5)

107
where x is the data point position in the film scan. LSF(x) is the
LSF-value a t position x.
The LSF can approx imately be desc ribed by an exp onential function - k • I x I e except around the maximum (R ossman et coll, 1964; Arnold et
coll, 1976). k is a constant factor. The logarithm of the LSF is then
approximately a straight line and smoothi ng according to eq (8:1) is therefore appropriate provided that it is not applied in the maximum.
The need for smoothing around the maximum is also smaller as there are more photons to build up the film density in this region i.e. the
quantum mot tle will be l ower. At low film densities this smoothing method cannot be used due to the large statistical spread i n the
measured v alues. Instead a meth od similar to that presented by Doi et
coll (1972) was emplo yed. The tail of the LSF was approximated by an _k•ix I exponential function (e ). This function was ca lculated as a
fit to the slope of the LSF at values below t he 20 % level and wa s joined onto the LSF below th e 7 % level. This fit assumes that the
LSF is a symmetrical distribution; the same f unction was used t o extrapolate the slope at each end of the LSF. If the calculated k-
value was found to be d ifferent in the two slopes this could be an effect of too much n oise in the film image or that the measured density distribution was not symmetrical and had to be re-measured. The LSF was always truncated at levels less than 0.005 of the maximum value. According to Doi (1972) this will not introduce any s ignificant
truncation errors in the MTF. An examp le of measured LSF is shown in figure 8:9. However the main aim of this part of the work was to
determine the MTF using the LSF.
4. The M TF wa s calculated from the LSF as the normalized fourier
transform of the LSF:
oo MTF( v ) = |F LSF(x) exp ( - 2T TÌV X)CIX LSF(x) dx (8 :2 )
— CO
where v is the spatial frequency and x is a distance variable.
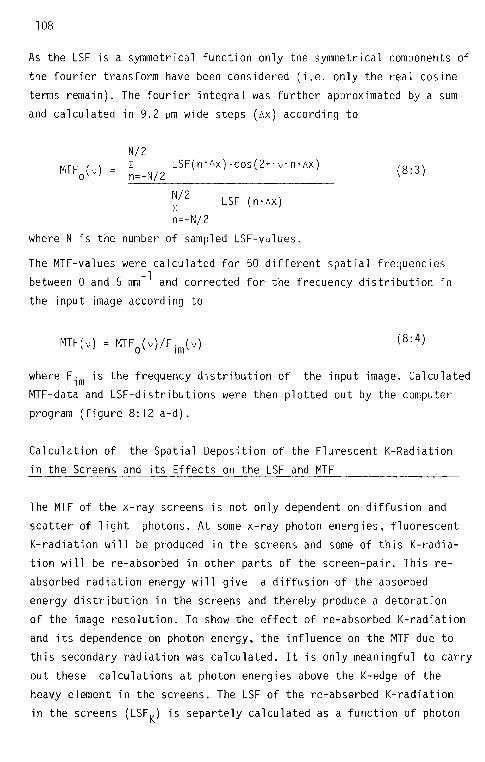
108
As the LSF is a symmetrical function only the symmetrical components of
the fourier transform have been considered (i.e. only the real cosine terms remain). The fourier integral was f urther approximated by a sum and calculated in 9.2 ym wide steps (AX) according to
N/2 MTFo(v) = n=-N/2 LSF(n'Ax)'cos(27, 'v 'n'AX) (8:3)
^ /2 LSF (n*AX)
n=-N/2
where N is the number of sampled L SF-values.
The MTF-v alues were calculated for 50 different spatial frequencies between 0 and 5 mm ^ and corrected for the frequency distribution in
the input image acco rding to
MTF( v ) = MTF0(v)/F i m ( v ) ^
where F_ jm is the frequency distribution of the input image. Calculated MTF-data and LSF-distri butions were then plotted out by the computer program (figure 8:12 a-d).
Calculation of the Spatial Deposition of the Flurescent K-Radiation in the Screens and i ts Effects on t he LSF and M TF
The M TF o f the x-ray screens is not only dependent on d iffusion and
scatter of light photons. At some x -ray photon e nergies, fluorescent K-radiation will be produced i n the screens and some o f this K-radia-tion will be re-absorbed in other parts of the screen-pair. This reabsorbed r adiation energy w ill give a d iffusion of the absorbed energy d istribution in the screens and thereby produce a detoration
of the image resolution. To sho w t he effect of re-absorbed K-radiation
and its dependence on photon energy, the influence on the MTF due t o this secondary r adiation was ca lculated. It is only meaningful to carry
out these calculations at photon energies above t he K-edge o f the heavy element i n the screens. The LSF of the re-absorbed K-radiation
in the screens (LSF^) is separtely calculated as a function of photon

109
energy and will give the MTF of this image deteriorating K-radiation fraction (MTF^). The d iffusion of the total absorbed energy in the
screens is described by a combination of MTF^ and the fraction of
primary photon energy which is absorbed "on the spot". The M TF of this later contribution is 1.0 for all frequencies and when the size
of this fraction is known the total MTF-reduction (MTFR) due to the energy d eposition processes in the screen can be calculated. The M TF of the whole system i s then the result of both the diffusion of photon energy de position (MTFR) and the subsequent diffusion of the
light generated due to this energy d eposition (MTF^).
Calculation of the LSF^ and M TF^ f or the re-abosrbed K-radiation
In these calculations of LSF^ and M TF^ of the K-radiation which is
produced and p artly re-absorbed in the screen-pair, irradiation of the
screens through a 10 ym wide and infinitely long slit was simulated. The screens were assumed t o be hom ogenous and the film between the screens was disr egarded. In order to calculate LSF^ the total absorbed
energy in small volume elements at different distances from the slit was s tudied. The secondary e lectrons have short path lengths and most of them w ill not escape from the small volume elements. Their transport has thus been ignored. The K-radiation produced w ithin the slit could
be regarded as an i nfinite number of isotropic point sources giving their contributions to the LSF. Instead of calculating the contribu
tions at different lateral distances from photons incident on a central slit, the contributions to a central slit from photons incident at different distances from this slit have been c alculated. These methods are equivalent. Thus the K-radiation contribution from one point (P) (figure 8:6) to infinitely long and 10 ym wide sections at different distances from this point (P) were summed in small angular segments (AÇ) parallel to a section through the screen
(figure 8:7) and (AO) parallel to the surface of the screen (figure
8:8). The contributions are further summed from different points P located at different depths in the screen.

110
10 ym
Figure 8:6 Illustration of the calculation method for estimating the MTF of re-absorbed K-radiation. P is the point where the K-radiation is produced.
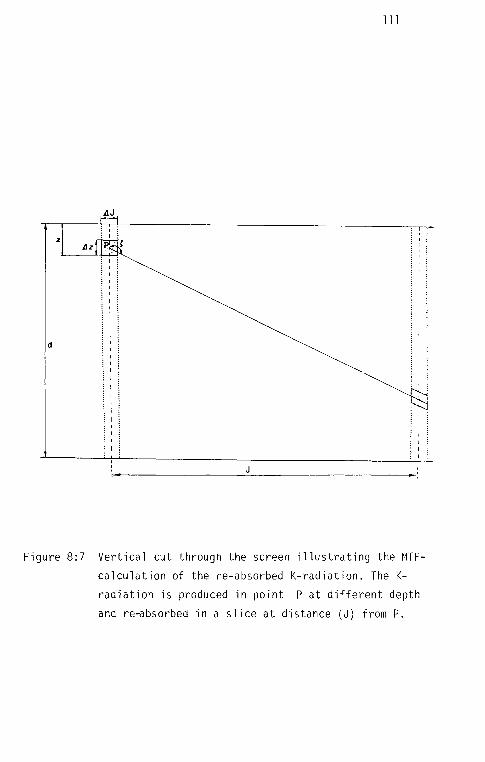
I l l
Lz
Figure 8:7 Vertical cut through the screen i llustrating the MTF-calculation of the re-absorbed K-radiation. The K-
radiation is produced in point P a t different depth
and re-absorb ed in a slice at distance (J) from P.

112
Figure 8:8 Screen view from above illustrating the MTF-calculations of the re-absorbed K-radiation. The K-radiation is produced i n point P.

113
The fluorescent K-radiation energy which is produced w ithin the
volume element P a t different depths in the screen (E^(z)) was
calculated per photon incident on P at the screen surface (NQ).
Mz) tK(hv) - W|/ . • [exp( - [ T ( h v ) + G .r n . ( h v ) ]
N K , TTTTT K K ' uincohv No (T(hv) + Oinco|1(hv) )
• (Z -AZ )) - exp ( - t x ( h v ) + a i n c o h ( h v ) ] • z) (8:4)
where = the fraction of vacancies in the K-shell giving K-radiation
x K ( h v ) the fraction of attenuation processes which g ive
(T("v)+ainCOh(^v) )VaCanCieS in the K-shell
hvK = the weighted average energy o f the K-radiation
Az = thickness of the volume element where t he K-radiation is produced
z = depth in the screen
The K-radiation is assumed to be produced a t a p oint P, in the centre
of the volume element and this K-radiation is assumed t o be isotropi cally emitted.
The K-radiation which is re-absorbed in the slice at the distance J
from the middle section where t he K-radiation is produced was ca lculated as the difference between the energy passing into the slice and
the energy passing out of the slice. This assumes t hat any comp ton events make a negligible contribution to the absorbed energy i n the slice. The calculations are carried out for different angles £ and 0
and different depth z. The contributions are summed acco rding to:

114
eK,abs(J) _ v v v EK^Z^ 1 A5 Aö
N = 7 f o ~ N 7~'77' [ e X p ( " [ l ( h v K ) + a i n c o h ( h v K ) ] N Z R 0 N l T T U . D T T O o
^ p ( J s ^ 5 © ) ) ^ x p ( ^ T ° i n c o h * ß ( J » £ » 0 ) ) ] ( 8 : 5 )
Xp and Xg are functions of J, ç and e; they represent the distance between the point P whe re the K-radiation is produced and the midpoints of the two surfaces of the slice of interest.
J - 0.5 • AJ X = ( 8 : 6 )
sin E, ' cos 0
J + 0.5 • AJ xB = — (8:7)
sin £ • cos 0
aJ is the width of the slice used in the calculations.
The Xp and Xg values given below ( eq. 8.9 and 8:10) are used when the K-radiation does not leave the screen w ithin the slice of interest. This condition could be fo rmulated as:
/'j + 0.5 • Aj\ /\] + 0.5 * AJ \ /o.o\ arctan ) £ ^ < ( T T - arctan —-— — I • /
\z - 0.5 • AJ/ yd - (z - 0.5 • Az)J
When t he angle, £, is smaller than this condition allows, the K-radiation will leave the slice of interest through the front surface
and the distance x^ is then calculated according to:
(z - 0.5 • Az) X = (8:9)
cos 5 • cos 0

115
When t he angle is larger than the condition above (eq. 8:8) allows,
the K-radiation leaves the slice of interest through the back surface of the screen and the distance is then calculated according to:
In these calculations the angle £ was varied in small steps (AÇ) between the angles:
and the angle 0 was va ried in small steps (AG) from 0 to TT/2.
The sum w as ca rried out for K-radiation produced at a sufficiently large number o f different depths z in the screen.
The contribution of K-radiation re-absorbed in the 10 ym wide c entral
slice where the K-radiation is produced, was ca lculated in a similar way as the difference between the K-photon energy produced in this
slice and the K-photon energy leaving it:
z - (z - 0.5 * AZ ) XB = — cos (TT-Ç) • cos O
( 8 :1 0 )
arctan arctan
£K,abs (0) E K ( Z ) as A0 = 111 • — •
Z Ç 0 Nq TT 0.5TT • [l-exp( - [ x ( h v K )
+ aincoh ^K> ] XB^ (8 :12 )
This equation is valid only when the photons do no t leave the screen within this segment, eg wh en the condition below i s valid

116
/ 0.5 * AJ \ /0.5 • AJ \
a r c t a n t z - 0.5 • AZ ^ 1 l* - a r c t a n V d - ( z - 0.5 • AZ) ) ) ( 8 ' 1 3 )
When the K-radiation leaves the screen within the central slice through the front surface then, was ca lculated as in equation 8:9 and when the K-radiation is passing out through the back surface, is
given by equation 8:10.
£ 1/ ahc ( n) The LSF of the K-radiation will then be desc ribed by L SF^(n)=—^
o where n is varied between a negative and a positive value giving LSF^(n) less than 0.005. This should not introduce any significant truncation errors in the calculations (Doi et coll, 1972).
The attenuation data has been taken from Storm and Is rael (1970) and calculations in chapter 4. in the equations includes corrections due t o the fact that some photons are photo-electrically absorbed i n other elements than in the heavy element o f the screen phosphor. Coherent scatter has been disreg arded through this section.
In order to save computer time, the calculations were carried out with as large intervals as p ossible that do no t give any s ignificant errors in the results. With the angular step AÇ of 4° except for the central sections where i t was 1° the error in LSF^ of a 100 ym th ick
screen was le ss than 0.2 %. A sm aller A£ had to be used in the central sections as there otherwise could be l arger errors in some cases.
The sum over the angle 0 was m ade a t angular intervals of AO = 3°
except for the central slices, where 2° was chosen. Use o f smaller
AG w ill not change th e LSF by mor e than 0.5 % in any p oint and in general the change due t o a smaller AG i s not significant, AZ wa s
chosen so t hat not more than 2.5 % of the K-radiation would be attenuated between the first calculation point and the surface of the screen. The thickness of the screen wa s however always d ivided into at least 10 calculation steps. Calculations with smaller steps

117
( A Z ) shows only small differences which a re seen only in the slices
close to the middle section of the LSF.
An i ndirect check on the calculation method has been m ade by summing
the K-radiation contribution to all slices and comparing the total re-absorbed K-radiation in these calculations to the results of the calculations in appendix 1, where the same q uantity is calculated by a different method.
An examp le of the calculated LSF^ i s shown in figure 8:9.
1.0
0.8
0.6
> b-$ HI & -I LU OC
0.2
-0.8 -0.4 0 0.4 0.8 DISTANCE FROM THE CENTRE/mm
1.6 2.0 -1.6 -1.2 1.2
Figure 8:9 The calculated LSF of the K-radiation (-—) and the measured t otal LSF of the screen-film system just below
and j ust above (—) the K-edge (LaOBr-screen). The K-edge ab sorption energy for La i s 38.9 keV

118
The MI F of the re-absorbed K-radiation (MTF^) has been c alculated from LSF^ f or the different screens (figure 8:10). This MTF^ describes the deterioration of the image q uality which is solely due to the energy
deposition from re-absorbed K-radiation. This quantity is useful for the understanding and discussion of this special effect in the screens.
In order to see th e effect of the MTF^ on the total MTF, the MTF of the total energy d eposition in the screens (MTFp had to be c alculated. This quantity has also been c alled "the MTF-reduction factor" in this
work. MTFß is equal to unity below the K-edge. This MTF^ o f the "energy absorption stage" in the screens can then be d irectly multi piied^ by tne MTF^ of the "light-stage" to give the total MTF of the screens. MTFp which is a combination of a u nity MTF f raction for the locally absorbed photon energy and MT F^ fo r the re-absorbed K-radiation has
been c alculated according to:
MTFrH = - Kabs> + H T F K<v> • Kabs (8:14)
where K , is the fraction of absorbed energy in the screens which is a D S due to re-absorbed K-radiation (appendix 1).This MTF^ has been calculated for the different screens and different photon energ ies (figure 8:11). MTF^ (3mm ^) which giv es the value of MTFp a t the spatial frequency 3 mm ^ is given as a function of photon energy in figure 9:2 for the different screens.

119
1.0
0.8
0.6
H 2
_SE4
^8 Q2 Hi Plus
5 1 2 3 4 0 SPATIAL FREQUENCY /mrrf1
Figure 8:10 The calculated MTF o f the re-absorbed K-radiation (MTF^) in the different screens at energies just above the K-edge.

120
aQ Hi Plus at 100 keV
SE 4 38.9 keV CEA 69.5 keV cr8 50.2 keV Hi Plus 69.9 keV
04
0.2
4 0 1 2 3 5 SPATIAL FREQUENCY/mm'1
Figure 8:11 The calculated ivlTF^ of the absorbed energy i n the
screens. MTF^ was ca lculated at an energy just above th e K-edge ( ) and at 100 keV (—) in the different screens.
The M TF f or the whole screen film system i s given by:
MTF = MTF l • MTFr (8:15)
where M TF^ is the MTF due t o light diffusion in the screens. A goo d
approximation to MTF^ is the MTF f or the whole screen film system just below th e K-edge o f the heavy element in the phosphor, where MT F^ = 1 .0.
This could be measured d irectly. MTF^ was then assumed to be independent of photon energy at photon ene rgies above the K-edge. This is an approximation which does n ot consider any energy dependence of the depth distribution of the absorbed energy in the screens. The x-ray photon attenuation in the film was als o disregarded in these calculations.

121
Results
Experimental Results
The M TF o f the screens has been de rived from mea surements of the LSF
at photon energies between 22.2 and 98.4 keV. The M TF f or the different screens is shown for a low photon energy (22.2 keV) , the photon energy just below and just above the K-edge o f the heavy element and for a high photon energy (98 keV) (figure 8:12 a-d).
It can be seen that at 22.2 keV for the "thin" W-screen there is no
significant change i n MTF com pared to the MTF j ust below the K-edge (figure 8:12 c). However, in the thicker screens there is a signifi
cant decrease in MTF a t low photon en ergies (figure 8:12 a,b,d). This could possibly be ex plained by the increased average dis tance between
the point where th e screen light in produced and the film. This increased distance would i ncrease the diffusion of the light before hitting the film. The average distance between the point of light production and the film was ca lculated in an approximate way i n chapter 7.

122
1.0T
0.8
0.6
0.4
0.2
SPATIAL FREQUENCY /mm'1
8:12 a
1.0
0.8
0.6
0.4
Q2
3 SPATIAL FREQUENCY /mm"
5 4
8:12 b

123
Li. H
0.2
SPATIAL FREQUENCY/mm*1
0.8 h
0.6 k
0.2
SPATIAL FREQUENCY/mm'1
8; 12 d
Figure 3:12 Experimentally found MTF at the energies 22.2 keV ( ),
just below the K-edge ( ), just above the K-edge(-«-•••) and at 98 keV (—). Calculated MTF according to eq. 8:16 just above the K-edge (•) and at 100 keV (•).
a) in the LaOBr:Tb-screen b) in the Ga^O^S^b-screen c) in the "thin"CaWO^-screen d) in the"thick"CaWO^-screen

124
At photon ene rgies just below t he K-edge of the heavy elements in the screen phosphor the absorbed energy i n the screens does not change so
much with the depth in the screens. At this energy the best MTF of the systems was m easured (figure 8:12 a-d). This MTF wa s assumed to be due
only to the scatter and diffusion of the screen light.
The MT Fs which were mea sured a t energies just above the K-edge o f the heavy elements in these screens are, as expected, lower than those
measured a t energies just below th e K-edge (figure 8:12 a-d). This is due to the deterioration of the LSF and MT F by re-absorbed K-radiation in the screen p air. In a comparison between thick and t hin screens w ith the same screen phosph or this energy depe ndence of MTF due t o re-absorbed
K-radiation was seen to be l arger in thick screens compared to thinner screens where a larger fraction of the K-radiation escapes from the screens (appendix 1).
At higher photon e nergies where a smaller fraction of the primary absorbed photon energy w ill go to the K-photon the contribution of K-radiation will be l ower. Here the measured M TF al so was found to be improved (figure 8:12 a-d),
Jheoretical_results
Calculations for the different screens of the LSF^ and M TF^ du e to the
re-absorption of K-radiation in the screens have been m ade (figure 8:9 and 8:10). MTF^ describes only the effect of re-absorbed K-radiation, i.e. it does n ot include the MTF of the screen light (MTF^). MTF^ broadly depends on the relation between the screen thichness and the
average path length of K-radiation in the screen ma terial (e.g. if the path length is much less than the screen thickness then the latter will
not influence MTF^). It is seen that MTF^ has higher values in thin screens compared to thicker screens of the same ma terial. The average path length of the K-radiation in the two CaW O^-screens is 1.8 mm which is a factor 4.3 greater than the phosphor thickness in the thicker screen pair and 10 times greater than that in the thin screens.

125
When t he thicker screens o f different fluorescent materials are
compared i t could be seen that the best MTF^ i s found in the La-screen
where the mean p ath length of the K-radiation is only 0.5 mm or 1.4 times the phosphor thickness in the screen p air. This could then be
compared to the Gd-screen with a lower MTF^ wher e the path length of
the K-radiation is 0.7 mm or 1.9 screen-pair thicknesses and the thick
W-screen with the lowest MTF^ wher e the path length is 1.8 mm or 4.3 screen-pair thicknesses. In this comparison two f actors were found to influence the of the K-radiation in the screens. Firstly in thin screens MT F^ is higher compared to that of thicker screens of the same material. Secondly, the MTF^ i s highest in screens of the same th ickness where t he mean p ath length of the K-radiation is least. (These conclusions are valid in the material studied here but they are not investigated in the general case).
In the calculations of MTF^ o nly small changes were seen when the
photon energy wa s varied. Some chan ge in MTF^ co uld be expected as the depth distribution of the K-radiation generation in the screens will
change w ith photon energy.
The MTF-reduc ing effect of the K-radiation depends on both the MTF o f the K-radiation (MTF^) and the fraction of absorbed energy in the
screens which is due t o K-radiation (K k s). This MTF-reduction (MTF^) was ca lculated according to eq 8:14 for the different screens at a
number o f photon energies. MTFp at energies just above the K-edges and at 100 keV in the different screens are shown in figure 8:11. At higher photon en ergies this MTF-reduction is lower because of the decrease in the fraction of the primary photon energy which is trans
ferred to K-radiation.
The total MTF o f the systems was ca lculated for different photon energies (figure 8:12 a-d) according to eq 8:15.
126
Discussion
The calculated LSF of the K-radiation and the measured total LSF just below and just above the K-edges are shown in figure 8:9. A broadening
of LSF due to the re-absorbed K-radiation is clearly seen. This broadening has also been
demonstrated in a very approximate ma nner by Vyborney et coll (1978) but the results are not comparable. Changes in MTF f or Gd^O^SiTb-screens at different radiation qualities has bee n demonstrated with different spectral distributions from an x -ray tube by Arnold and Bjärngard (1979). An att empt to estimate the LSF of the K-radiation in the screens was als o made by these authors. A f ilm was placed between the screens and the light was screened o ff so that the film would register only the primary and seconda ry x-ray photons. When the screens were irradiated through a slit, this film was supp osed to approximately measure the LSF of the absorbed energy in the screens. These measu rements were carried out at energies below and abov e the K-edge, and the difference in LSF was then assumed t o give the LSF of the K-radiation. Their measured LSF of the K-radiation is much broader than those calculated here. The difference could possibly depend on t he variation in response of the film to x-ray photons having different directions.
Thin detectors (i.e. compared to the photon m ean f ree path) could be
expected t o have higher relative sensitivity for photons hitting the detector at larger angles. This would then make the film more sensitive to photons further away from the centre of the slit. This difference between thin and t hick detectors is a similar effect to that of the difference in sensitivity to scattered radiation of x-ray screens o f different thicknesses (Nielsen, 1979). Another way t o look at this difference between a "thick" and a "thin" detector is to compare th e K-photon fluence ("spherical" fluence) with the plane fluence. A "thin" detector could be regarded to register the fluence and a "thick" detector to register the plane fluence (Carlsson and Carlsson, 1982).
127
The experimentally found MT F and a "theoretical" MTF which is built on the theoretically determined M TF of the re-absorbed K-radiation is compared in figure 8:12 a-d. This comparison shows rather good agreement. However, in the La-screen and to some e xtent also the Gd-screen some di fferences are discernible. In these screens the measured
MTF se ems to be som ewhat lower than the calculated one for energies just above the K-edge. This could possibly be an effect of a less
symmetric distribution of the absorbed energy in these screens just above t he K-edge due t o increased attenuation. This would then imply a larger average path length of the screen light before hitting the film which then would give an increased diffusion and thereby a somewhat lower MTF. In the La-screen the experimentally found M TF als o at 100 keV seems to be som ewhat lower than the calculated MTF. This difference
is small but an e ffect of incoherent scattered photons especially in the La-screen at higher energies could possibly explain it; 7.2 % of the total cross section in LaOBr at 100 keV is due to incoherent scattering. This contribution was not included in the calculations.
The incoherent-scattered photons could as a first approximation be regarded as having an isotropic angular distribution. The average energy
of the scattered photon i s about 85 keV. The me an path length of these scattered photons is 1.3 mm in LaOBr (3.7 screen p air thicknesses). This could give some MTF-re ducing e ffect. This is an e ffect which a lso could be expected to be sm aller in phosphors composed o f elements with higher atomic number and at lower energies where the fraction of incoherent scatter is smaller.
In the calculations of MTF^ an d MT Fp, the fluorescent phosphor was assumed t o be hom ogenously d istributed in the fluorescent layer of the screen. Microscopic studies of thin slices of the screens show th at one of the screens is somewhat less transparent closer to the front surface compared to the surface towards the screen support. These va riations
in transparency are difficult to estimate from the microscope image. They c ould possibly be exp lained by the manufacturing processes which in some screens might use sedimentation processes to deposit the fluorescent layer.

128
Both experimentally and theoretically found MTF-d ata above th e K-edge
show approximate ly the same energy depe ndence. If the resolution at different photon en ergies was given by the spatial frequency giving for example M TF = 0 .2, this value was found to change by as mu ch as
0.7 mrn"^ with photon energy for the same screen. The change in MTF coul d also be expressed as the MTF-value at a g iven spatial frequency, for
example 3.0 mm~^ (MTF (3 mm ^) ). This quantity was found to change by as mu ch as 0.070 in the same screen dependin g on photon energy. This change can be compared to the difference in MTF (3 mm ) between the
different screens in this investigation at energies just below the K-edges. This difference is less than 0.110 (the MTF-values were 0.260 for the thinner W-screen and 0.150 for the thicker W-screen. A cha nge in photon energy could therefore in some cases change the image quality as mu ch as a change from a "medium spee d" to a "high speed" x-ray screen a t the same photon energy.
u. H ^ 0.6
O A
just below K-edge 100 keV just abowe K-edge
0.2
0 1 2 3 4 5 SPATIAL FREQUENCY/mm"1
Figure 8 :13 The mea sured M TF of 3M's a 8 - screen (Gd^O^SiTb) at different photon energies ( ) compared to published MTF-data for the a8-screen for unspecified spectral distributions ("•-•) Doi and Ros sman, 1975; ( — ) Arnold et coll, 1976;( ) SPRI 1977.

129
In the MTF-measurements of this work t he principal goal has not been t o
measure th e true MTF w ith very high accuracy. The main purpose has instead been t o study the change i n MTF w ith photon ener gy. There are a
number of published MTF-curves for 3M1 s a8-screens (Arnold et coll, 1976; Doi ana Rossman, 1975; SPRI, 1977). These MT F-curves have, however,
been me asured i n broad and often unspecified spectral distributions. If these curves are compared to the results of this work (figure 8:13) fairly good agreem ent is found, for all but one (SPRI, 1977), and except for low spatial frequencies (< 0.5 mm ^ ) where the uncertainty is
probably large in all the experimental results. The two MTF -curves by Arnold et coll (1976) and Doi and Rossman (1975) lie between the curves measured i n this work for the a8-screen at energies just below and just
above the K-edge. In one curve which de viates very much from these results (SPRI, 1977) the MTF o f the light from only the front screen was m easured w ith an o ptical system. In this case t he MTF wa s found to
be m uch higher compared to when film was used t o measure the MTF o f a screen-film system w ith two screens (figure 8:13).
An empirical equation fitting published experimental MTF-data has been
given by Burgess (1978). In this equation he has u sed, among other parameters, the spatial frequency where M TF = 0.5 called yQ. For HiPlus-
screens the yQ value was given as 1.20 (manuf.), 1.05 (Arnold et coll, 1976). 1.21 (Rossi et coll, 1976) and between 0.89 and 1.19 in this work dependent on photon energy. For a8-screens the yQ value was give n
as 0.97 (manuf), 1.12 (Arnold et coll, 1976), 1.05 (Rossi et coll, 1976) and between 0.91 and 1.15 in this work. However, this kind of comparison between me asurements on d ifferent screens o f the same type can be very misleading, as significant changes in the screen manufacturing sometimes
occur without a change i n the name o f the product.
Summary and conclusions
In this chapter the concept of LSF and M TF wa s first briefly discussed.
The experimental method used to determine LSF and M TF wa s discussed
in detail. The theoretical method used t o determine the MTF of the

130
re-absorbed K-radiation (MTF^) and the total "theoretical" MTF is also described in detail. In a separate section both the experimental and theoretical results are given and after that these results are discussed.
In this chapter two energy-depe ndent factors which influence the MTF of x-ray screens have been d iscussed. At low photon energie s a decrease in MTF wa s observed in the thicker screens. This is probably due to an increased average path length of the light and thereby increased light diffusion in the screens. At energies above the K-edge energy of
the high Z-elements in the screen phospho rs another MTF-decreasing effect was seen. This effect is due to the diffusion of the absorbed energy in the screen-pair when K -radiation is produced in the screens and then absorbed a t other locations in the screen-pair.
The MT F o f the screen-pair was both experimentally and "theoretically" determined. This so-called theoretical MTF i s a combination of the
experimentally found M TF of the screen-light diffusion and a theoreti
cally determined M TF of the absorbed energy distribution in the screens (MTFK ) .
It has been sho wn th at most o f the energy depe ndence of the MTF of a screen-film system can be accounted for by r e-absorption of the K-radiation in the screens. This effect has its largest value in the
energy region which i s of most frequent use in x-ray diagnostics (i.e. approx. 30 to 100 keV. The decrease in MTF a t energies below about 25 keV could be expected to be o f importance when low photon ene rgies are
used (e.g. in mammography examinations). From the results in this investigation it can be deduced that the MTF o f the screen-film systems in clinical use w ill change w ith radiation quality (kV and filtration). One should, therefore, in the determinatio of the MTF of the system use a well-defined radiation quality and this radiation quality should correspond as closely as p ossible to the clinical situation. Furthermore, the MTF of the screens should be determined with both the front and back screen i n the cassette. Otherwise the measurements will not include the contribution of secondary r adiation from one screen to the other in a screen p air and

131
and the fact that the two screens in a screen p air are irradiated from opposite directions.

132
CHAPTER 9
CALCULATION O F SE NSITIVITY AND M TF F OR D IFFERENT SP ECTRAL DIS TRIBUTIONS
FROM X -RAY TU BES
Both sensitivity ("speed") and M TF have been determined as a function of photon energy for monoenergetic photons (chapter 5 and 8). In this section the data on s ensitivity and M TF have been app lied to different spectral distributions. A nu mber o f authors (e.g. Rossi et coll 1976,
Reynolds et coll 1976, Spri 1977, Moores and Walk er 1978) have mea sured the sensitivity of x-ray screens as a function of "kV-setting". Spri (1977) has also measured t he sensitivity with different thickness of aluminium f iltration which should symbolize the difference in patient thickness. Also the MTF o f screen-film systems has been sho wn to be dependent on th e radiation quality (Arnold and Bjärngaard, 1979).
However, Arnold's investigation was c arried out only for screens which mainl y contain Gd as high-Z element and only two r adiation qualities were used wi thout concern f or the filtration in the patient.
Given that MTF and s creen-film sensitivity had already been determined for monoenergetic photon for various screen materials, it was r elatively
straightforward to calculate the same q uantities for a given photon
spectrum. This was ea sier than making mea surements directly on a large number o f different photon spectra. These calculations were
carried out for kV-settings between 50 and 140 kV and wi th filtration in the patient represented by between 0 and 200 mm of water. However,
these spectral distributions do no t include any c ontribution from scattered photons.
The screen-film sensitivity has been c alculated for these spectral
distributions as the inverse value of the air kerma to the x-ray screen cassette giving film density 1.0. The "kV"-dependence of the MTF has been demonstrated by calculating the MTF a t the spatial fre-

133
quency 3 mm \ (MTF(3 mm ^)),for the different spectral distributions.
Calculations
A num ber of spectral distributions with a total filtration of 1 .5 to 2.5 mm alum inium (Birch et coll, 1979) were used. In the calculations the spectra were filtered with between 1.5 and 2.5 mm of extra Al to achieve a total filtration of 4 mm Al. The spectra were further filtered with between 0 and 200 mm of water to simulate the effect of non-scattered photons per unit energy interval hitting the screen-film system, .
The Kerma-spectra K^v (Kerma, d ifferential in photon energy) was calculated from this photon spectra according to:
ytr K , = $ . - h v - ( — ) • ( 9 : 1 ) h v h v v p yair v 1
The attenuation in aluminium and water is calculated with the total
attenuation coefficients without coherent scattering (Hubbel, 1 9 6 9 ) ^ tr a n d ( — — i s t a k e n f r o m H u b b e l ( 1 97 7 ) . Examples of Kerma-spectras
w i th and w i thout "pa t ien t " are g iven in f igure 9 : 1 .
The "speed" of the screen-film system wa s calculated for this spectrum according to:
h v T. max S„ ( h v ) • K. • A h v u n v
S K = H^ ° ( 9 : 2 )
h v max
h = o K , • A h v h v
where S ^ ( h v ) is the experimentally found screen-film sensitivity given
as a function of photon energy (chapter 5).

134
The MT F (3 mm of the screen-film system wa s calculated according to
iiiaA 1 E MTFr (3 mm"1) • SK ( h v ) -Kh •
MTF (3 mm"1) = MTF, (3 mm"1) • ^ 5 h v max £ S j ^ ( h v ) • * A h v h v=o
(9:3)
where M TF^ is describing the light diffusion in the screens and MTFR
describes the diffusion of absorbed energy due to re-absorption in the screens. MTF^ and MT F^ are taken from chapter 8 and Karlsson and
Wickman (1979) ( f igure 9 :2) . MTF R had to be a veraged ove r S ^ ( h v ) •
as this quantity describes the contribution to the film density from photons of energy h v. These calculations of the MTF have been carried out only for the spatial frequency 3 mm ^ and a ll the summations were calculated in steps of 1 keV.
The change i n MTF a t photon energies below th e K-edge i s complicated
to predict theoretically but these effects could be expected to be of minor importance for the radiation qualities used i n these calculations. The experimentally determined M TF a t high energies is
especially in the La-screen somewhat lo wer than the theoretically determined M TF (chapter 8). This effect which is believed to be due to incoherent scattered photons has also been om itted in these calculations. The MTF -dependence on radiation quality could therefore even be som ewhat larger in some cases than that which i s calculated in this section.

135
"3 5 10
Os
< 5 oc £ 0 . 6
LU >
LU
LU
»-< -I LU -J
LU OC
200 120 160 PHOTON ENERGY / keV
80 40
Figure 9:1 The differential distribution of air kerma with respect to photon energy. 80 kV and total filtration of 4 mm Al (—) and with an a dditional filtration of 200 mm wat er
( — ) •

136
40 80 120 160 PHOTON ENERGY/keV
200
Figure 9:2 The MTF-reduction factor at the spatial frequency 3 mm ^ (MTFR (3 mm~^)) given as a function of photon energy (Karlsson and Wickman, 1979). The La-scr een (—), the Gd-screen (-*-) and the "thin" W-screen ( ).

137
Results and D iscussion
The spectral distributions to the screen-film system give n in kerma
per unit energy interval were calculated both with and without an e xtra filtration of 200 mm wat er(figure 9:1). The "speed" of the different screen-film systems is shown to be depend ent on both the choice of x-ray tube voltage and on the filtration in the patient (figure 9:3
a-c). The sensitivity of the Gd-screen (figure 9:3b) changes by
about a factor 2 between 50 kV and 100 kV for the case of a beam filtered in a 200 mm thi ck (water) patient. The sensitivity is also
dependent on p atient thickness and cha nges by almost a factor 2 at 80 kV as the filtration is increased from 0 to 200 mm water ,simulating
filtration in the patient. These va riations in sensitivity are smaller but also quite significant in the other screens. Some chang es in sensitivity for scattered radiation could also be expected but this
effect was not included in these calculations.
The energy d ependent properties of different screens could in
some cases cause significant problems. Suppose, for example, an automatic exposure control unit is used and the radiologist wishes
to use different types of x-ray screens. Then chan ges in sensitivity due to both kV and patient thickness have to be co rrected for in
different ways f or the different screen-film systems.
Figure 9:4 a-c shows MTF (3 m m~^) calculated for different tube voltage and f iltration in the patient. Here i t is seen that dependence o f MTF on tube kV i s quite marked, especially in the thicker screens, but the effect of filtering in the patient seems to be q uite small at
most kV-values. From th is it is obvious that the choice of kV and filtration may s ignificantly change the characteristics of a screen-film system. This change w ill often be o f the same magnitude as the difference in "speed" and MT F betw een q uite different types of x-ray
screens.

138
180
160
LaOBr 20
80
40
180
160
^ 120
80 CO 40
(b)
50
40
30
20
10 (c)
50 110 70 90 150 130 PHOTON ENERGY / keV
Figure 9:3 The sensitivity, S^, of x-ray screen-film systems when different kV and filtration are used (—) with a total filtration of 4 mm a nd ( ) with extra filtration in 200 mm of water.

139
0.3 r
O . 2 :
O .i •
E O.2F E co
2 Q . , .
0.2
0 .1 •
LaOBr
(a)
(b)
CaW04
-i 1 « ( c )
50 70 90 110 130 150
TUBE HIG H VOLTAGE /kV
Figure 9:4 The MT F a t the spatial frequency 3 mm ^ calculated for different spectral distributions. (—) with a total filtration of 4 mm Al and ( ) with extra filtration in 200 mm water. ( — ) represent MTF^ (3 mm""'), the MTF-value just below t he K-edge.

140
APPENDIX 1
CALCULATIONS O F PR ODUCTION, ESCAPE A ND R E-ABSORPTION O F FLUORESCENT K-R ADIATION
Calculations of the production, re-absorption, transmission and escape o f K-radiation from x-ray screens and the Ge-detector when
irradiated by mono-energetic photons of various energies have been carried out in order to:
A. Estimate the escape of K-radiation from the Ge-detector when i t is
irradiated with photons of different energies.
B. Determine the fraction of the interacting photon energy in a pair
of x-ray screens that will escape from the screen pair as fluorescent K-radiation.
C. Determine the fraction of the absorbed energy i n the screens which is due to re-absorbed K-radiation produced in the screens.
D. Determine the fraction of the absorbed energy i n one screen that is due to the absorption of K-radiation produced in the other screen.
E. Calculate the total absorbed energy i n the front screen comp ared to
that of the back screen. In these calculations the re-absorption
of K-radiation has been included.
The meth od used for these calculations is very similar to that used by
others to calculate escape o f K-radiation from a G e-detector (e.g. Fewell and Shuping, 1977).
Calculations
The production of fluorescent K-radiation at different depths in the screens or detector and the escaping fraction of this K-radiation
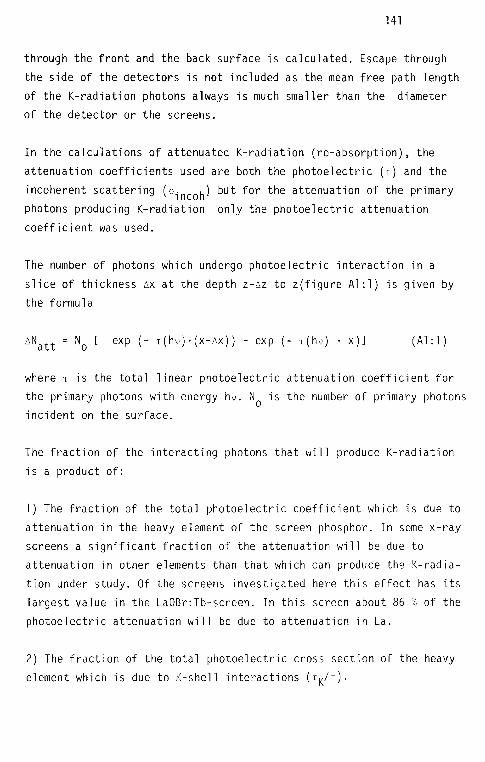
141
through the front and the back surface is calculated. Escape through
the side of the detectors is not included as the mean f ree path length of the K-radiation photons always is much smaller than the diameter of the detector or the screens.
In the calculations of attenuated K-radiation (re-absorption), the attenuation coefficients used are both the photoelectric (t) and the
incoherent scattering (a-jnco^) but for the attenuation of the primary photons pr oducing K-radiation only the photoelectric attenuation coefficient was used.
The number of photons which undergo p hotoelectric interaction in a
slice of thickness AX at the depth Z-AZ to z(figure Al : 1) is given by the formula
ANATT = No [ exp (- - r ( h v ) • (X-AX) ) - exp (- x ( hv ) • x)] (Al : 1 )
where t is the total linear photoelectric attenuation coefficient for
the primary photons with energy h v. Nq is the number of primary photons incident on th e surface.
The fraction of the interacting photons that will produce K-radiation is a product of:
1) The fraction of the total photoelectric coefficient which i s due to
attenuation in the heavy element of the screen phosphor. In some x -ray screens a significant fraction of the attenuation will be due t o attenuation in other elements than that which can produce the K-radia-tion under study. Of the screens investigated here this effect has its
largest value in the LaOBrrTb-screen. In this screen about 86 % of the photoelectric attenuation will be due to attenuation in La.
2) The fraction of the total photoelectric cross section of the heavy
element which is due t o K-s hel 1 interactions

142
3) The fraction of vacancies in the K-shell that will produce K-
radiation, i.e. the fluorescent yield w . K
The K-radiation which is produced betwe en depths x and x+dx is then given by:
AN; AN att _K_ t (Al :2)
The K-radiation which i s produced in a slice of a screen o r detector is assumed to be i sotropically emitted from the point where i t is produced. The fraction of the total amount of K-radiation which i s emi t ted be tween the two con ic a l vo lumes w i th in the ang les 0 - A G and o
(figure Al : 1) is equal to the solid angle between these cones divided by the total solid angle. This fraction (AN) is given by
Figure Al : 1 Schematic d escription of the calculations of the generation, escape and re- absorption of K-radiation in an absor ber.

143
A f t = - I (cos ( 0 - A G ) - cos 0 ) 1 (Al :3)
The distance within different angles from the point where the K-
radiation is produced to the front surface (Xp) and back surface (x^ of the detector or screen was ca lculated according to equation
z - 1 Ä Z X = 2 (Al :4)
C O S ( 0 -1 A 0 )
( d - ( Z - 1 A Z ) ) X n = T2 (Al:5)
C O S ( 0 A 0 ) 2
The escape of K-radiation has been ca lculated separately for escape
through the front (Nesc p) and escape through the back of the screen
Pair (Nesc,B)'
d Nesc,F = ^_0 UNK g=0 An ' exP HT(hv|<) + °incoh (hvK)) ' XF)] (A1:6)
d TT
Nesc,B = z_Q [aNK eXp ("(T(hvK)+aincoh(hvK)) ' XB)] (A1:7'
The total escape i s calculated as the sum of these contributions.
N = N r + N n (Al :8) esc esc,F esc,B v '
This escape wa s calculated separately for the and radiation. In
table Al:l, Al :2 a-d and figure Al :2 the escape of K , K and K in is ^ r a 3 a+ß given per K-photon generated in the screen p air (P^ esc).
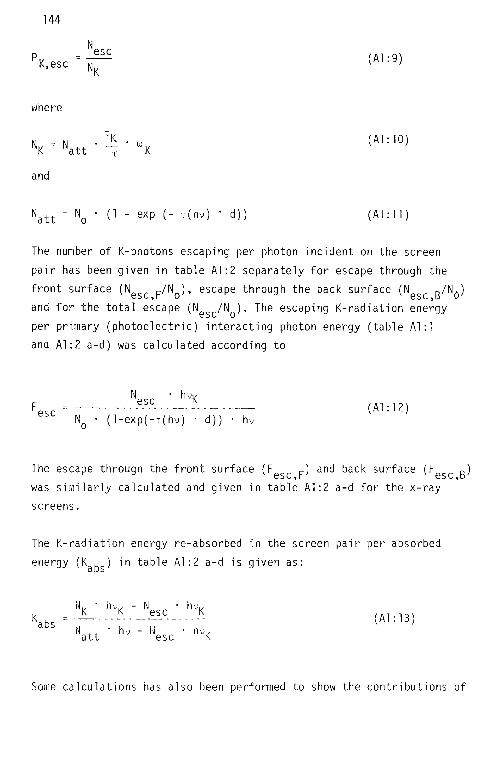
144
K,esc N PK.p (Al:9)
where
N = N • ^ * co (Al:10) 1NK att T K
and
Natt = No ' (1 " exp T(hv^ ' <A1:]1)
The num ber of K-photons escaping per photon incident on th e screen
pair has been give n in table Al :2 separately for escape through the front surface (N F/Nn)> esc^pe through the back surface (N R/Nh) esc ,i- o esc ,b u and for the total escape (^ec;c/N0). The escaping K -radiation energy
per primary (photoelectric) interacting photon energy (table Al : 1 and Al :2 a-d) was ca lculated according to
Nesc " hvK F =— ^ _____ (Al : 12) esc No • (1-exp( - T ( h v ) • d)) • h v
The escape throug h the front surface (F F) and back surface (F R) was s imilarly calculated and given in table Al :2 a-d for the x-ray screens.
The K-radiation energy re-absorbed in the screen pair per absorbed energy ) in table Al:2 a-d is given as:
v fivjv - in * riV|/ K . = — ü (Al : 13)
Natt ' * Nesc • hvK
Some c alculations has also been performed to show the contributions of

145
K-radiation which is generated in one screen and re-absorbed in the
other screen in the screen p air. The number o f K-photons escaping from
only the front screen through the front surface (Np esc p) and the back surface (Nr D) has therefore been calculated: v F,esc,By
d/2 tt/2 V,esc,F = ZLO ÛNK g=o A n exp ["(T(hvK^ + aincoh^hvK^ ' XF] (A1:14)
d/2 TT
V.esc.B = S aNK = A n ' exp H^hv«) + 0incoh(huK» 'XB ] <A1:15> Z - 0 0=tt/2
The summations were ma de fo r thin slices and the K-radiation was
studied in 90 different angular segments. The optimal number of slices
and angular segments wa s obtained by increasing these variables until the change in the results became small.
Tine total escape from the front screen (Np gsc) is given by
'V,esc = 'V,esc,F + NF,esc,B (Al:16)
and t he esca pe from the back screen through its front surface (Ng esc p) and back surface (ND _ D) b,esc,d
W,F = NF,esc,F • *XP(-(M * d/2) (A1:17)
NB,esc,B = NF,esc,B ' exP ("T(hv' ' d/2) (A1:18)
The contribution of K-radiation photons which ar e produced in the back
screen and re-absorbed in the front screen(Ngyp) is then given as:
NBTF = NB,esc,F " Nesc,F + NF,esc,F (Al: 19)
and the contribution from the front screen to the back screen (Npyg)

146
i s :
'Vìe NF,esc,B " "esc,B + NB,esc,B (AL:20)
The number of primary photons interacting in the front screen (Np a^)
and i n the back screen (Ng is given by:
NF,att = No '(1"exp ("x(hv) ' d/2)) (A1:21)
Vatt = NF,att ' exP ' d/2> <A1:22>
From th is the contributions of K-radiation energy from one screen to
the other has been c alculated as a fraction of the primary interacting photon energy i n the screen under study. These calculations are carried out for contributions from the back screen to the front screen
(Fgjp) and for contributions from the front to the back screen (Fpyg).
F _ NBTF ' hvK B T F " N * h v < A 1 : 2 3 )
F,att nv
F _ NFTB ' hvK
F T B " V a « - - ( # ' : 2 , )
The calculated values F^-j-p an d Fp-j-g are given in table Al :2 a-d. The contribution of K-radiation energy from one screen to the absorbed energy in the other has also been c alculated. These calculations,
which are carried out for both the front screen (Kgyp) and the back
screen (Kp-j-g) are presented in table Al :2 a-d.
NBTF • hvK K = _ (Al
h v ' N r . , - h v i / ' N r D - h v i / " N r - + h v i / * N D r F,att K- F,esc,B K esc,F K B,esc,F

147
NpTR ' ^1/ K = Uï 1 __ (Al : 26)
hv ' Nß,att " hvK NB,esc,F " hvK ' Nesc,ß + hvK NF,esc,B
The total absorbed energy in the front screen compared to the absorbed
energy in the back screen has then been ca lculated as:
/e _ NF,att ' hv " NF,esc hvK + NBTF ' hvK (Al-27)
r, |B,att ' hu " IN|B,esc ' hvK + NFTB ' huK
The calculated value of G p/£ß 1S given as a function of photon energy for the different screens in table Al :3.
For the calculation of attenuated primary photons producing K-radiation (eq Al : 1) only the photoelectric coefficient was used. This use o f only the photoelectric attenuation in the calculations could give a slight over-estimation of the number of photons which are photoelectrical^ absorbed i n the slice of interest and the depth distribution of these. This is because some o f the photons may disappear out of the radiation beam b y coherent and incoherent scattering. These photons
will on the other hand nor mally loose only a small fraction of their
energy or none a t all and they will often be abl e to produce K-radiation in other parts of the screen p air or the detector. However, the contribution of incoherent scattered photons is small and errors due to this contribution will not be l arge. All the attenuation coefficients used in this section were calculated for the different screen
materials (chapter 4).
The calculations were carried out separately for and K^-photons.
It was, however, seen that the use o f a weighted average of the
and energies would not give any significant error in the calculations of K-escape from the screens and the detector.

148
Results and D iscussion
K-photon escap e from the Ge-detector which is 10 mm thick and 16 mm in diamter was ca lculated. The dominating escape wa s found to be through the front surface of the detector because of the relatively
large attenuation in the detector. It was found in these calculations
that the number of photons escaping was 14 % of the primary photon number when the energy was 11.1 keV (the K-edge energy in Ge i s 11.1
keV) and 0.9 % when the primary photons had an energy of 50 keV (table Al : 1 and figure Al :2).
V
O 10 20 30 40 50 60 70 80 90
PHOTON ENERGY/keV
Figure Al :2 Calculated escaping fraction of K-radiation photons generated in the Ge-detector (P„ ^ . (v = K0, o = K k 5 es c p a and • = weighted average for and K )
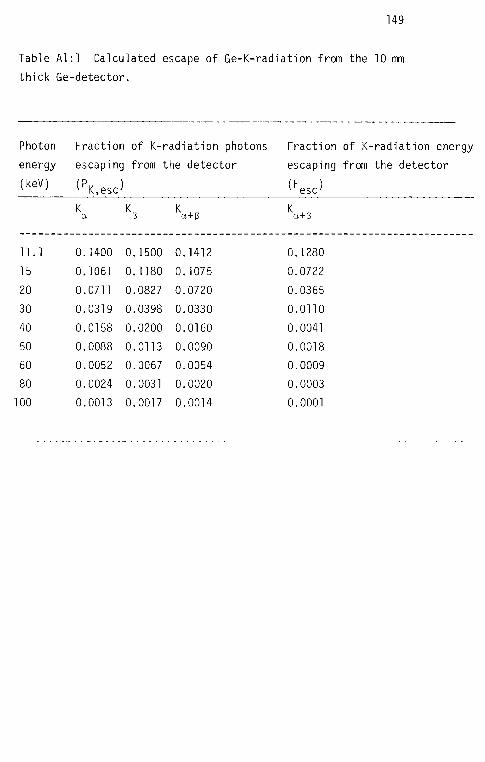
149
Table Al : 1 Calculated escape o f Ge-K-radiation from the 10 mm thick Ge-detector.
Photon Fraction of K-radiation photons Fraction of K-radiation energy energy escaping from the detector escaping from the detector
<M> CK.esc> (%jç)
Ka K6 K«6 K««
11.1 0.1400 0. ,1500 0. ,1412 0. ,1280
15 0.1061 0. ,1180 0. ,1075 0. ,0722 20 0.0711 0. ,0827 0. ,0720 0. ,0365
30 0.0319 0. ,0398 0. ,0330 0. ,0110
40 0.0158 0. ,0200 0. ,0160 0. ,0041 50 0.0088 0. ,0113 0. ,0090 0. ,0018 60 0.0052 0. ,0067 0. ,0054 0. ,0009 80 0.0024 0. ,0031 0. ,0020 0. ,0003
100 0.0013 0. ,0017 0. ,0014 0. .0001
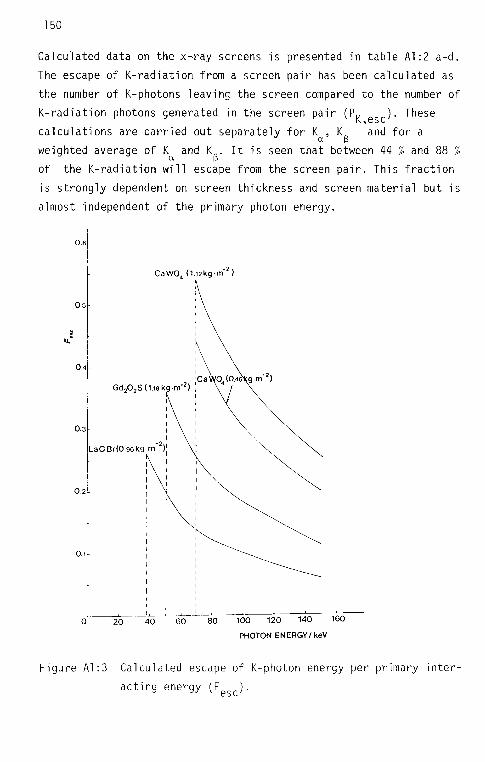
150
Calculated data on t he x-ray screens is presented in table Al :2 a-d. The escape of K-radiation from a screen p air has been c alculated as the number o f K-photons leaving the screen compared to the number of K-radiation photons generated in the screen p air (P^ esc). These
calculations are carried out separately for K^, and for a weighted average of and K . It is seen that between 44 % and 88 %
of the K-radiation will escape from the screen p air. This fraction is strongly dependent on screen thickness and screen material but is
almost independent of the primary photon energy.
0.6
05
U."
0.3
160 100 120 140
PHOTON ENERGY/ keV
80 40 60 20
Figure Al :3 Calculated escape o f K-photon energy per primary inter-
acting energy (Fesc).

151
The number of K-photons escaping per photon i ncident on t he screen pair (Nesc/N ). and the K-radiation energy escaping per interacting
primary photon energy in the screen p air (Fesc) are calculated both with regard to the total escape and w ith regard to escape through
the front surface (F F) and the back surface (F R) (table Al :2
a-d). In figure Al:3, Fesc (i.e. FesCjB + Fesc p) is shown as a function of photon energy for the different screens. A la rge escaping fraction (between 26 and 55 % ) is found at energies just above the K-edge o f the heavy element of the screen phosphor. This fraction is
strongly dependent on both the screen phospho r and the screen thickness. At higher energies the escaping fraction decreases due to
the increasing fraction of the primary photon energy that goes to the photo-electron.
The K-radiation energy which is re-absorbed in the screen p air has been
calculated as a fraction of the total absorbed energy in the screens
(Kabs^* Kabs 1S 9 iven ^or different screens in table Al :2 a-d and in figure Al :4. At energies just above the K-edge as muc h as 45 % of the absorbed energy in the screen p air is due t o re-absorbed K-radiation. This fraction is somewhat lower for the other screens but not less than 23 % for any o f the screens in this investigation. At 100 keV K ^ is between 13 and 20 % . This re-absorbed K-radiation energy is of special
importance as i t will be re-absorbed in other parts of the screens and
thereby decrease the resolution of the screen-film system.
The K -radiation which is produced in one screen and re-absorbed in
the other screen of a screen p air was als o calculated to show h ow the screens in a cassette will influence each other. This K-radiation
contribution has been c alculated relative to the primary interacting
photons energy in the screen (Fgyp and Fp-pg) and relative to the absorbed energy in the screen (Kß-j-p and Kp-^) without the contribution of K-radiation from the other screen (Table Al :2 a-d).

152
0.6
0.5 Gd202S(1.i8kg m 2)
0.4
0.3
0.2
CaWO, /(0.46kg m" )
160 140 100 120
PHOTON ENERGY/keV 80 60 40 20
Figure Al :4 Calculated fraction of the absorbed energy which is due
to re-absorption of K-radiation in the screen p air (Kabs)-

153
Table Al :2 Calculated data for the different screens;
Escaping fraction of K-radiation photons generated in the screens
(P« esc)- Number of escaping photons per photon incident on the screens - through the front surface (Nesc p/NQ) - through the back
surface (Ne$c ß/NQ)5 - the total escape ( Nesc/NQ). K-energy escape
per primary interacting photon energy - escape throu gh the front surface (Fesc p), - through the back surface (Fe$c - the total
escape (Fesc). Re-absorbed K-radiation as a fraction of the total absorbed energy (^a|Z)S)- K-radiation energy from one screen re-a bsorbed in the other screen calculated per primary interacting photon energy -
contribution from the front to the back screen (Fpyg) and back to the
front (Fg-j-p). K-radiation energy from one screen re-absorbed in the other screen per absorbed energy - front to back (Kpyg) " back to
front (Kbtf).
Table Al :2a Calculated data on the LaOBr:Tb-screens (CaWO - SE4)
(PK,esc) Nesc,F /No Nesc,B /No Nesc/No
Ka Kß u
38.9 .446 .529 .461 .149 .098 .248
40 .445 .528 .460 .143 .097 .240
50 .442 .525 .460 .097 .078 .176
60 .440 .524 .455 .067 .059 .125
80 .440 .524 .455 .034 .032 .065
100 .440 .524 .455 .019 .018 .037
150 .440 .524 .455 .006 .006 .012

Table Al:2 a - continued
(hv) (Fesc,F^ ^Fesc,B^ ^Fesc^ 'Kabs^ ^FFTB^ ^FBTF^ ^KFTB^ 'KBTF^
38.9 .156 .103 .259 .400 .205 .039 .239 .056 40 .150 .102 .252 .386 .187 .040 .220 .057 50 .111 .089 .200 .290 .105 .046 .126 .059 60 .089 .078 .166 .233 .075 .045 .088 .054 80 .064 .060 .125 .166 .049 .039 .055 .044
100 .051 .049 .100 .129 .037 .033 .041 .036 150 .033 .033 .066 .083 .024 .023 .025 .024

155
Table Al:2 b Calculated data on the Gd^O^S: Tb screens (3M:s - a 8 )
( h v ) (PK,esc) ( N v esc. ,F/no^ (Nesc ; ,b"V ( N / N ) v esc o'
K a K ß K a + $
50.2 .554 .644 .572 .219 .158 .377 60 .551 .642 .569 .172 .139 .312 80 .549 .640 .567 .105 .095 .200
100 .548 .640 . 566 .061 .058 .119 150 .548 .640 .566 .022 .022 .044
Table Al : 2 b - continued
( h v ) ^esc ,F^ ^esc,B^ <Fesc) <Kabs) (PFTß) ( fBTF' (KFTß) (kBTF'
50.2 .220 .159 .379 .450 .243 .036 .314 .063
60 .174 .141 .315 .344 .142 .043 .189 .066
80 .124 .112 .236 .232 .078 .044 .100 .058
100 .097 .092 .188 .175 .054 .040 .067 .050
150 .063 .062 .126 .108 .033 .030 .037 .034

156
Table Al :2 c Calculated data on the "thin" CaWO^ screens (CEA's Universal Standard)
C») (PK,esc> ("„sc/V "W.b'V (Besc"V
69.5 .842 .876 .849 .087 .085 .172 80 .842 .876 .849 .063 .062 .125
100 .842 .876 .849 .037 .036 .073
150 .842 .876 .849 .013 .013 .026
Table Al :2 c - continued
( h v ) ^ F ESC,F^ ^ESC,B ' I <Fesc> (F FTß) ( F BTF) ( K FTß) ( K BTF
69.5 .279 .275 .554 .234 .049 .036 .108 .082 80 .242 .239 .481 .175 .041 .033 .078 .064
100 .193 .192 .385 .118 .031 .028 .050 .045
150 .128 .128 .257 .065 .020 .019 .027 .026

157
Table Al :2 d Calculated data on the "thick" CaWO^ screens (DuPont's High P lus)
(PK,esc) (Nesc,F /No> (Nesc,B /N0) (Nesc/N0)
Ka KB Ka+3
69.5 .707 .763 .719 .152
80 .706 .763 .718 .117 100 .706 .763 .718 .072 150 .706 .763 .718 .027
.140
.110
.069
.026
.293
.227
.141
.053
Table Al :2 d - continued
(hv) (Fesc,F^ (Fesc,E ) ^esc^ ^ahc) (FFTR) (KFTR) ( K1 abs FTBy BTFy FTBy BTF ;
69.5 .242 .223 .465 .361 .103 .048 .181 .095
80 .208 .196 .404 .282 .080 .047 .130 .081
100 .164 .159 .323 .198 .057 .042 .083 .063
150 .108 .107 .215 .114 .034 .031 .044 .040
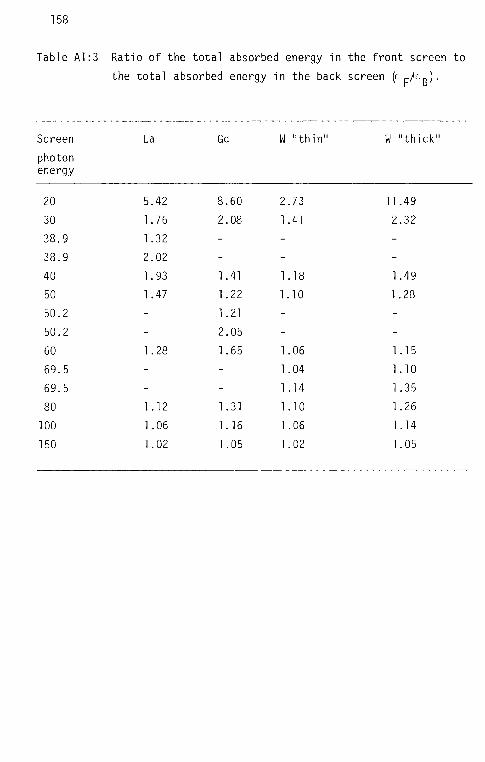
158
Table Al :3 Ratio of the total absorbed energy in the front screen to
the total absorbed energy in the back screen (cp/eg).
Screen La Gd W "thin" W "thick" photon energy
20 5 . .42 8 , .60 2 , .73 11 .49 30 1 . .76 2 , .08 1 .41 2 .32 38 . 9 1 , .32 - - -
38. .9 2 , .02 - - -
40 1 . .93 1 , .41 1 .18 1 .49 50 1 , .47 1 , .22 1 . ,10 1 . ,28 50. .2 - 1 .21 - -
50. ,2 - 2 .05 - -
60 1 . .28 1 .65 1 .06 1 .15
69. ,5 - - 1 .04 1 .10
69. ,5 - - 1 .14 1 .35
80 1 .12 1 .31 1 .10 1 .26
100 1 .06 1 .16 1 .06 1 .14
150 1 .02 1 .05 1 .02 1 .05

159
GENERAL SUMMARY
Optimization of diagnostic x-ray systems with regard to radiation safety
and image q uality is a highly desirable task. The screen and film are
important parts of this system. The aim of this investigation is to study some energy dependent characteristics of x-ray screens.
Three co mmon types of screen phospho rs have been exam ined with regard to their sensitivity, MTF, and so me re lated factors for a number of monoenergetic radiation qualities. Radioisotope and x -ray induced K-radiation sources which were found to be ver y close to monoenergetic have been used (chapter 2),
The screen-film sensitivity was exp erimentally determined (chapter 5). These experimental results were then compared to theoretical determinations of absorbed energy in the screens a t different photon energies
(chapter 6). This comparison betwe en theory and experiment shows an acceptable agreement at energies between about 25 keV and 120 keV.
The energy depe ndence of the screen-film sensitivity could therefore be t heoretically determined for this energy interval instead of carrying out fairly complicated measurements. The screen-film sensitivity as a function of photon energy shows in detail the energy dependent characteristics of the different screen phosphors. This knowledge o f the sensitivity for monoenergetic photons also enable calculations of screen-film sensitivity when d ifferent spectral distributions are used. Effects of change in x-ray tube high voltage and filtration have thus been po ssible to calculate for the different phosphors. For example, it was sho wn th at changes in x-ray tube high voltage or in fi 1tration,within limits normally used in clinical practice, can chan ge the sensitivity of the screen f ilm system by at least a factor of two (chapter 9). Effects of scattered radiation were n ot included in these calculations.
Changes in radiation quality will also have effects on ot her characteristics of the system, e.g. the resolution characteristies (MTF) of the system. At low photon ene rgies (below about 25) a "drop" in the experimentally determined M TF wa s seen in some screens. This seems

160
to be due to increased diffusion of the screen-light. Another effect
on t he MTF which is due t o re-absorption of K-radiation produced in the screens was als o seen. K-radiation which is produced and r eabsorbed w ithin the screen-pair will give a d iffusion of the absorbed
energy d istribution in the screens. This effect was determined both by mea surements of the LSF at different energies and by a theoretically determined LSF of the absorbed energy in the screens. A compa rison between theory and experiment generally shows a good agree ment at energies above about 25 keV. This fact enable calculations of the
energy depend ent change i n the MTF t o be c arried out which then gives much mor e freedom for variations in the model used. For example, the theoretically determined r eduction of MTF due t o re-absorbed K-radiation was calculated for different spectral distributions from diagnostic x-ray tubes (chapter 9). Here significant changes in MTF, especially due to changes in tube high voltage, was found.
One e ffect related to determinations of sensitivity and M TF i s the
contribution to the film density from K-radiation which is produced in one screen and re-absorbed in the other. This effect was shown to be l arge at energies just above the K-edge o f the high-Z elements in the screens (chapter 7). The K -radiation must therefore always be included in measurements or calculations of different screen-film characteristics.
At photon energi es where th e attenuation in the screens is large, a
larger fraction of the energy w ill be absorbe d in the front screen and thus produce more l ight in this screen compared to the back screen. The light from the front and back screens was se parately measured (chapter 7) to determine this effect which can influence both the HeD-curve and the sensitivity of the double emulsioned film used between the screens (chapter 3). The ratio of light from the front and the back screen is largest at low energies and was found to vary between 1.8 and 2.8 for the different screens a t 25 keV. The theoretically determined ratio between abosorbe d energy i n the front and
the back screen was how ever larger than these values (chapter 7).

161
One w ay t o reduce r adiation doses to the patient in routine x-ray diagnostics would be to optimize the film-screen system and the x-
ray quality. In this action effects on t he image q uality, which m ay be unwanted , must however also be con sidered. For instance if the radiation quality is chosen t o give a high screen-film sensitivity, it is most probable that the MTF w ill be lowered and the number of
interacting photons per unit area in the screen ma y also decrease. The knowledge o f the x-ray screen characteristics studied in this
work shoul d increase the possibilities of optimizing the equipment
and routines used in clinical x-ray diagnostics. It should however be p ointed out that the optimization of screen-film systems is only one part of a larger goal to achieve sufficiently good images with a min imum of radiation dose to the patient.

162
ACKNOWLEDGEMENTS
I wish to express m y sincere thanks to professor Gunnar Hettinger, professor Hans Svensson and fil lic Göran Wickman f or their kind interest and help in different parts of this work. To Ph D Alan Nahum
for his critical reading of this thesis, Thord Holmström who helped me w ith the experimental work, Stellan Sandström who made the drawings, Anna Wernblom w ho ha s done mos t of the typing work and Sune Westman who intro duced me i nto computer programming. I would also like to thank my understanding family and all other friends and colleagues at the department of radiation physics who ha ve helped
me to complete t his work.

163
LIST O F S YMBOLS
C -i(nv) = air kerma calibration factor of the monitor at the energy ca i h v
('colour = Correction factor for the spectral light sensitivity of the film (1.0 for CaWO^, and LaOBr:Tb-screens and 2.76 for the Gd^O^S:Tb-screens)
C- (D.) = correction factor with regard to the HeD curve when the aensv f' a
film-density is not unity
Cüev = correction with regard to the constancy check with the Am-241 source
^rec^l^ = correcti°n factor for reciprocity failure
a = thickness of the screen
= film density
= K-radiation contribution from the back screen to the
front screen per primary interacting photon energy in the front screen (back to front)
Fesc = the escaping K -radiation energy per primary interacting photon energy
Fesc k = escaPÏn9 K-radiation energy through the back surface per primary interacting photon enrgy
Fesc p = the escaping K-radiation energy through the front surface
per primary interacting photon energy
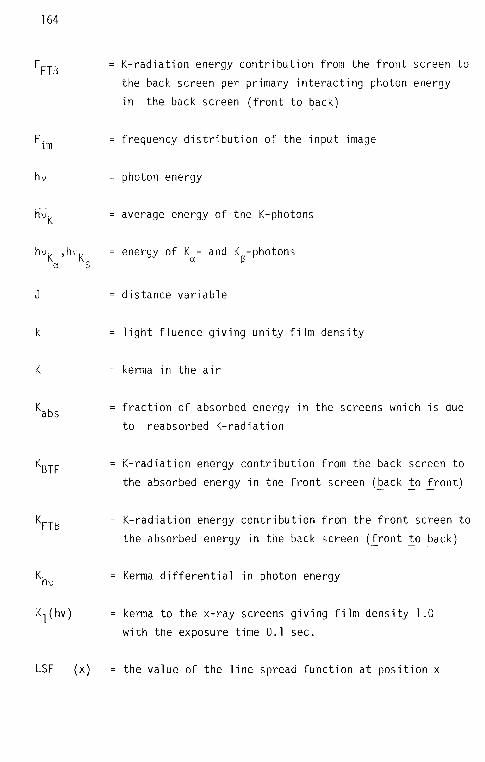
164
= K-radiation energy c ontribution from the front screen to
the back screen per primary interacting photon energy i n t h e b a c k s c r e e n ( f r o n t _ t o b a c k ]
F_jm = frequency distribution of the input image
hv = photon energy
ïïvK = average energy o f the K-photons
'^K = energy of K^- and K -photons a 3
J = distance variable
k = light fluence giving unity film density
K = kerma in the air
Kaks = fraction of absorbed energy in the screens which is due
to reabsorbed K -radiation
Kßyp = K-radiation energy contribution from the back screen to the absorbed energy in the front screen (tack t_o fr ont)
Kp-pk = K-radiation energy c ontribution from the front screen to the absorbed energy i n the back screen (front to back)
= Kerma d ifferential in photon energy
K-j (hv) = kerma to the x-ray screens giving film density 1.0
with the exposure time 0.1 sec.
LSF (x) = the value of the line spread f unction at position x

165
LSF^ = the line spread fu nction due only to K-radiation re-
absorption
M = measurement va lue
MTF = the modulation transfer function
MTFl = MTF due t o only the light diffusion in the screens
MTF^ = MTF of the re-absorbed K-radiation
MTFQ = MTF without correction for the input image
MTF^ = MTF-reduction due to re-absorbed K-radiation
n = summation va riable
N = number of LSF-values sampled
Naj.j. = the number of attenuated photons
Ng ££ = the number of primary photons attenuated in the back screen
nr per R = ^e number °f photons escaping from the back screen d ̂ u j v ^ d through its back surface
Nß esc p = the number of photons escaping from the back screen
through its front surface
Ng-j-p = the number of photons which are produced i n the back screen and re-absorbed in the front screen (t>ack _t o front)
N = the number of escaping photons

166
N c g = the number of escaping photons through the back of the screens
Ngsc p = the number o f escaping photons through the front of the screens
Np = the number of photons attenuated in the front screen
Np esc = the number of photons escaping from the front screen
Np esc g = the number of photons escaping from the front screen through its back surface
NF esc F = numl:)er photons escaping from the front screen through its front surface
Npjg = the number of photons which ar e produced i n the front screen and re-absorbed in the back screen (front _to fc>ack)
N|^ = the number of K-radiation photons produced in the screen/detector
= number of light photons
'\ front^L back = quotient of light from the front screen and light from the back screen
Ni_/Natt = number of light photons per attenuated x-ray photon in the screen p air
N^/e = number of light photons per absorbed energy in the screen p air
Nq = number of incident photons

167
pressure
fraction of incoherent scattered photons escaping from the screen-pair
fraction of K-photons escaping from the Ge-detector or x-ray screens
sensitivity of the screen-film system expressed as the
inverse of the kerma in air giving net film density 1.0
S|^ correc ted for attenuation in the aluminium f ront of the cassette
sensitivity of the screen-film system expressed as the
inverse of the energy fluence giving net film density
1 . 0
Sy corrected for attenuation in the aluminium f ront of the cassette
sensitivity of the screen-film system expressed as the inverse of the photon f luence giving net film density 1 . 0
corrected for attenuation in the aluminium f ront of $ the cassette
exposure time
corrected exposure time = tQ * C^ens^f^
actual exposure time
temperature
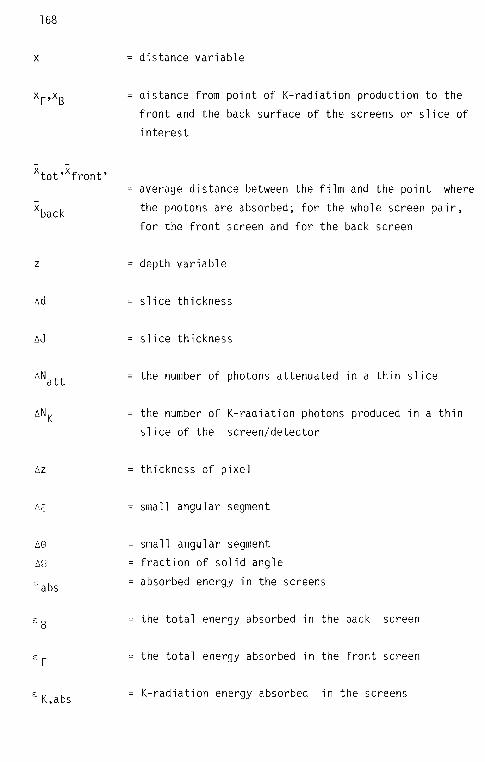
168
X = distance variable
XpjXg = distance from point of K-radiation production to the front and the back surface of the screens or slice of
i nterest
xtot ,xfront5
= average distance between the film and the point where
*bac|< the photons a re absorbed; for the whole screen pair, for the front screen and fo r the back screen
z = depth variable
Ad = slice thickness
aJ = slice thickness
AN t t = the number of photons attenuated in a thin slice
ANk = the number of K-radiation photons produced in a thin slice of the screen/detector
AZ = thickness of pixel
aç = small angular segment
AO = small angular segment Aft = fraction of solid angle
eaks = absorbed energy i n the screens
e g = the total energy absorbed i n the back screen
£p = the total energy absorbed in the front screen
e £ aks = K-radiation energy absorbed in the screens
169
angular variable
angular variable
total linear attenuation coefficient
total mass attenuation coefficient
mass energy transfer coefficient
spatial frequency where M TF = 0.5
photon f luence d i f f e rent ia l in h v
spatial frequency
the coherent attenuation coefficient
the incoherent attenuation coefficient
the total photoelectric attenuation couefficient
the photoelectric attenuation coefficient for the K-shell interaction
the total photoelectric attenuation coefficient of the high Z-element in the screen phospho r
the photoelectric attenuation coefficient for the K-shell of the high-Z-element in the screen phosphor
energy f luence
energy f luence to the screen-film system s urface

170
= absorbed energy fluence
in» = the fluorescent yield in the K-s he 11

171
REFERENCES
Arnolei, B.A. and Bjärnga ard, B.E.: The e ffect of phosphor K x-rays on the MTF of rare-earth screens. Med. Phys 6(6), (1979), 500-503.
Arnold, B.A., Eisenberg, H.E., Bjärngaard, B.E.: The LSF and MTF of rare earth oxysulfide intensifying screens. Radiology 121 (1976) 473-.
Arnold, B.A., Eisenberg, H.E., Bjärngaard, B.E.: Measurement of reciprocity law failure in green-sensitive x-ray films. Radiology 126 (1978) 493-.
Barnes, G.T.: The dependence of radiographic mottle on be am qu ality. Am J Ra diol 127 (1976) 819-.
Berger, M.J. and Seltzer, S.M.: Tables of energy losses and ranges of electrons and positrons. National Aeronautics and Space Administration, Washington, D.C., report SP 3012 (1964).
Birch, R., Marshall, M., Ardran, G.M,: Catalogue o f spectral data for diagnostic x-rays, HPA S cientific Report Series No 30 (1979).
Birks, L.S., Sandelin, J.W., Dozier, C.M.: Calibration of rare-earth x-ray intensifying screens i n the 15-70 keV energy range for use on pulsed x-ray sources. Rev Sei Instrum 47 (1976) 1475-.
Burgess, A.E.: An e mpirical equation for screen MTF:s, Med Phy s 5 (1978) 199-.
Carlsson, G.A. and Carlsson, C.A.: Quantities and Concepts used in Radiation Dosimetry. Int. J. Appi. Radiot. Isot. Vol 33, pp 953-965
Chartier, J.L. and Portal, G.: Production du rayonn ements monoc hromatiques intenses. Nuclear Instruments and Me thods 100 (1972) 107-.
Chen, C.S., Doi, K., Vyborny, C., Chan, H -P., Hol je, G.: Monte Ca rlo simulation studies of detectors used i n the measurement o f diagnostic x-ray spectra. Med. Phys, 7(6)> (1980) 627-,
Dainty, I.C. and Sh aw, R.: Image Science. Academic Press Ine (1974).
Dixon, R.L. and Ekstrand, K.E.: Heuristic model for understanding x-ray film characteristics. Med Ph ys 3 (1976) 340-.
Doi, K., Strubler , K., Rossman, K.: Truncation errors in calculating the MTF of radiographic screen-film systems from the line-spread function. Phys Me d B iol 17 (1972) 241-.

172
Doi, K.: Computer simulation study of screen-film systems nonlinearity in fine detail imaging. Phys Me d B iol 18 (1973) 863-.
Doi, K. and Rossman, K.: Measurement of optical and n oise properties of screen-film systems in radiography. SPIE, Medical x-ray Photo-Optical Systems Ev aluation 56 (1975) 45-.
Doi, K., Vyborny, C.J., Holje, G.: Development of a r igid fluorescent x-ray source for monoenergetic radiation studies in radiographic imaging. Radiology 142 (1982),233-236.
Fernando, P .L.T.: An expe rimental investigation into the quantum efficiency of radiological fluorescent screens to mono-energetic x-rays. Thesis, Dept of Medical Physics, University of Leeds, Leeds, Great Britain, 1964.
Fewell, T.R. and Shuping, R.E.: Photonenergy distribution of some typical diagnostic x-ray beams. Med Phy s 4 (1977) 187-,
Giakoumakis, G.E., Nomikos, C.D., Euthymion, P.C.: Modulation transfer function of fluorescent screens excited by x-rays. Phys Me d B iol 25 (1980) 1105-.
Gopala, U.V.R. and Dan os, P.F.: Evaluation of a new x -ray film with reduced cros sover. Med Phy s 6(3), (1979) 226-,
Hoffman, E .J. and Phelps, M.E.: Production of monoenergetic x-rays from 8 to 87 keV. Phys M ed B iol 19 (1974) 19-.
Hubbel, J.H., Veigele, Wm. J., Briggs, E.A., Brown, R.T. , Cromer, D.T., Howerton, R.J.: Atomic form factors, incoherent scattering function, and photon scattering cross sections. J of Physical and Chemical Reference Data (1975) 471-.
Hubbel, J.H.: Photon ma ss a ttenuation and mass energy a bsorption coefficient for H, C, N, 0, Ar and seven mixtu res 0.1 keV to 20 MeV. Radiation Research 70 (1977) 58-.
Hubbel, J.H.: Photon Cross Sections, Attenuation Coefficients, and Energy Absorption Coefficients From 10 keV to 100 GeV, NSRDS-NBS29, August 1969, Superintendant of Documents, U S Go vernment P rinting Office, Washington, D.C., 20402.
ICRU Report No 33: Radiation quantities and un its. (International Commission on Radiation Units ana Measur ements, Washington, D.C.) 1980.
James, T.H. (editor): The theory of the photographic process. 4th edition (1977). Macmillan Publishing Company Inc. New York.
Karlsson, M. and Wickman, G.: Förstärkningsskärmars känslighet för fotoner i energiområdet 20-100 keV. Proceedings Läkaresällskapets riksstämma, Stockholm, december 1976.
173
Karlsson, M., Wickman, G., Hettinger, G.: Characteristics of x-ray screen phosphors at photon en ergies between 20-140 keV. Proceedings 9tn Nordic Meeting on C linical Physics, Gothenburg June 1977, p 84-.
Karlsson, M. and Wi ckman, G: A th eoretical and experimental study of MTF i n intensifying screens at different photon ene rgies from 20 to 100 keV, V In ternational Conference on Medical Physics, Jerusalem 1979.
Kathren, R.L., Rising, F.L., Larsson, H.V.: K-fluorescent x-rays: A multi-use tool for health physics. Health Physics 21 (1971) 285-.
Kusoffsky, L. and Carlsson, C.A.: Modulationsöverföringsfunktionen, MTF. Avd f ör radiofysik, Linköpings högskola 1973-09-12.
Lederer, C.M. and Shirley, V.S.: Table of Isotopes. 7th edition (1978). John Wiley £ Sons.
Lubberts, G: The line spread fu nction and the modulation transfer function of x-ray fluorescent screen-film systems - problems with double-coated films. Brit J of Roent 105 (1969) 909-.
Löfvander-Thapper, K.: Properties of medical x-ray film. Thesis, Dept of Radiation Physics, University of Lund, Lund, Sweden, 1977.
Metz, C.E., Strubler, K.A and Rossman, K.: Choice of Line Spread Function Sampling D istance for Computing the MTF of Radiographic Screen-Film Systems. Phys M ed B iol vol 17,(1972),638-647.
Morgan, R., Bates, L.M., Gopalarao, U.V., Marinaro, A.: The frequency response characteristics of x-ray films and screens. Am J o f Roent 92 (1964) 426-.
Moores, M.B. and Walker, A.: Light output and x-ray attenuation measurements for some commerc ial intensifying screens. Radiology 128 (1 978), 767-774.
Morlotti, R.: X-Ray efficiency and Modulat ion transfer function of fluorescent rare-earth screens, determined by the Monte Carlo method. The J ournal of Photographic Science, Vol 23,(1975) 181 -.
NBS Ha ndbook No 64: Design o f Free-Air Ionization Chambers. (National Bureau o f Standards, Washington D.C.) 1957.
Nielsen, B.: Inverkan på k ontrasten av förstärkningsskärmars tjocklek och atomä ra sammansättning i närvaro av spridd strålning. Proceedings Föreningsmöte f ör svensk förening för medicinsk radiologi, Linköping 1979, p 35-,
Nielsen, B.: Upplösningsförmåga, oskärpa och M TF. Avd för radiofysik, Linköpings universitet 1980-01-23.

174
Nielsen, B: Mätmetoder för att bestämma mo dulationsöverföringsfunktionen f ör radiologiska system. Avd för radiofysik, Linköpings universitet 1981-08-21.
Prescott and Naraya n 1969: Electron responses and intrinsic line-width in Na I(TI). Nuclear Instruments and Meth ods 75 (1969) 51-55.
Rao, G.U.V. and Fatouros, P.P.: Evaluation of a new x -ray film with reduced crossover. Med Ph ys 6 (1979) 226-.
Raynolds, J., Skucas, J, Gorski, J.: An e valuation of screen-film speed c haracteristics. Radiology 118,(1976), 711-713.
Riihimäki, E.J., Korhda, O.A., Suoranta, H.T, Valle, M.K.: Improvement of X-ray Intensifying Screen E fficiency by Special Design of the Screen. Radiology 142,(1982}, 229-231.
Rossi, R.P., Hendee, W.R., Ahrens, C.R.: An e valuation of rare earth screen-film combinations, Radiology 121 (1976) 465-.
Rossman, K ., Lubberts, G., Cleare, H.M.: Measurement of the line spread function of radiographic systems containing fluorescent screens. J of Optical Society of America 54 (1964) 187-.
Rossman, K: Measurements of the MTF of radiographic systems containing fluorescent screens. Phys Me d B iol 9 (1964) 551-.
Rossman, K. and L ubberts, G.: Some c haracteristics of the line spread function and the modulation transfer function of medical radiographic films and screen-film systems. Radiology 86 (1966) 235-.
Sanderson, G.K.: Erronens p erturbations of the modulation transfer function derived from the line spread fu nction. Phys Me d Bi ol 13 (1968) 6 6 1 - .
Sanderson, G.K. and Cleare, H.M.: MTF of screen-film systems: The inluence of screens and cross-over. Photographic Science and Engineering 18 (1974) 251-.
Seelentag, W.W. and Danzer, W.: Reciprocity law failure with film-screen combinations of mammography. Brit J of Radiology 51 (1978) 259-.
Shuping, R.E. and Judy, P.F.: Energy absorption in calcium tungstate x-ray screens. Mea Phy s 4 (1977) 239-.
SPRI-rapport: Förstärkningsskärmar för röntgenkassetter. S67, 1977-12-31.
Stevels, A.L.N.: New phos phors for x-ray screens. Medicamundi 20 (1975) 1 2 - .

175
Storm, E. and Is rael, H.I.: Nuclear data tables. A7 (1970) 565-. (Academic Press Ine, New York)
Strubler, K., Doi, K., Rossman, K.: Density dependence o f the LSF of radiographic screen-film systems. Phys Me d B iol 18 (1973) 219-.
Swahn, G.: Diagnostic x-ray spectra, a study of the effects of high tension ripple, large x-ray tube currents, extra-focal radiation ana anode a ngulation with Ge(Li)-spectrometry. Thesis, Dept of Radiation Physics, University of Lund, Lund, Sweden, 1977.
Swank, R.K.: Calculation of modulation transfer functions of x-ray fluorescent screens. Applied Optics 12 (1973) 1865-.
Venerna, H.W.: X-ray absorption, speed and luminescent efficiency of rare earth and othe r intensifying screens. Radiology 130 (1979) 765-.
Vyborny, C.J., Doi, K. , Metz, C.E., Hans, A.G.: A simple source of fluorescent x-rays for the study of radiographic imaging systems. Neu Phys 4 (1977) 482-.
Vyborny, C.J., Metz, C.E., Doi, K., Rossman, K.: Screen-film system speed: its dependence on x-ray energy. Radiology 125 (1977) 811-.
Vyborny, C.J., Metz, C.E., Doi, K. Hans, A.G.: Calculated characteristic x-ray reabsorption in radiographie screens. J of Applied Photographic engineering 4 (1978) 172-.
Vyborny, C.J.: H and D curves of screen-film system: factors affecting their dependence on x-ray energy. Med Phy s 6 (1979) 39-.
Vyborny, C.J., Metz, C.E., Doi, K.: Relative efficiencies of energy to photographic density conversions in typical screen-film systems. Radiology 136 (1980) 465-.
Yaffe, M., Taylor, K.W., Johns, H.E: Spectroscopy of diagnostic x-rays by a compton-scatter method. Med P hys 13 &1976) 328-334.

