a study of soil vibro-compaction in medium sands
TRANSCRIPT
http://i-rzeczoznawca.pl/ No. 1, 2020, p. 8-15
DOI: 10.37105/enex.2020.1.1.02
A study of soil vibro-compaction in medium sands
Norbert KUREK 1
Karolina TRYBOCKA 1 1 Menard Ltd., 44c Powązkowska Str., 01-797 Warsaw, Poland
corresponding author: [email protected]
Abstract: The present article offers an analysis of the vibroflotation technique at a test plot set up in central Poland. The role
of the test plot was to examine and evaluate the effectiveness of deep ground compaction and some selected
parameters by applying vibroflotation activities as well as to verify the impact of vibration propagation on the
existing structures. Below are then presented selected results concerning vibration measurements and geotechnical
in-situ tests.
Keywords: vibroflotation; compaction; vibrations; vibration measurements; in-situ tests.
Access to the content of the article is only on the bases of the Creative Commons licence
CC BY-NC-ND 4.0
Please, quote this article as follows:
Kurek N. and Trybocka K., A study of soil vibro-compaction in medium sands, Engineering Expert, p. 8-15,
No. 1, 2020, DOI: 10.37105/enex.2020.1.1.02
1. Introduction
Vibroflotation is deep compaction technique used for non-cohesive soils which is performed by
means of a vibroflot, which vibrates horizontally. Under such cyclic vibrations that propagate in the
ground, the water pressure in the ground pores rises as well. This leads initially to a local liquefaction
of the soil medium but then causes the soil grains to move towards their tighter arrangement. This
results in an overall reduction of the pore volume in the soil of the improved area, and so the material
is allowed to densify.
That vibration method can be used in medium and coarse sands with a content of particle size of
not more than 0.063 mm less than 10%, content of particles ≤ 0.002 mm less than 2 % and a
uniformity coefficient 𝐶𝑢 > 2.5. The fines content in the compacted soil is a key parameter for the
applicability of this ground improvement method. Due to high fines content, the shear stresses
generated by the vibrator are not transmitted that effectively and the vibrations are considerably
damped [1]. The movement of particles, necessary for compaction, is also limited [2].
2. Description of geological conditions
The results of the study and the measurements dealt within this article come from a site in central
Poland, where vibroflotation method was used for soil deep compaction. There are mainly medium
and coarse sands interwoven with layers of fine sands in the site-specific subsoil stratum. The 𝐼𝐷
density index of the sands ranged from 0.25 to 0.75 in their original state. And it grew for coarse-
grained soils with greater depth. An additional increase of 𝐼𝐷 was observed under the groundwater
N. Kurek, K. Trybocka
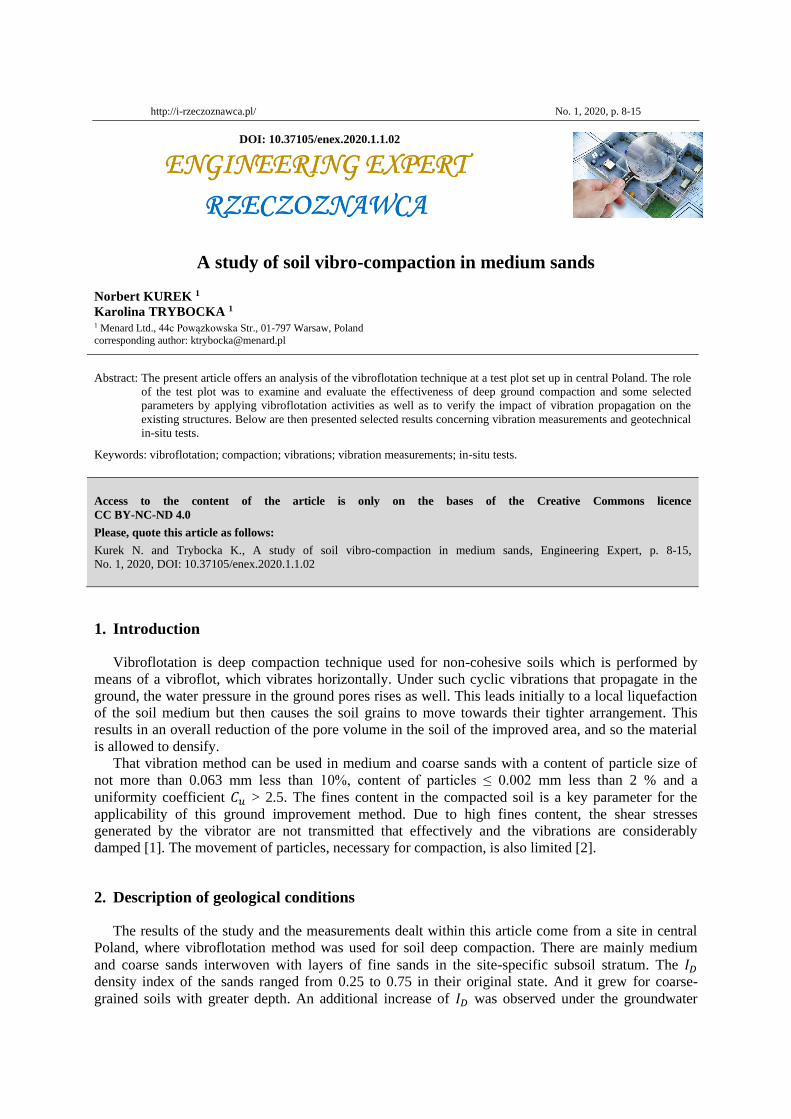
table. The water table was located at the level of approx. 4.5 m below the level of the working
platform, as seen on the schematic geological cross-section in Fig. 1.
Fig. 1. Geological cross-section in the improved area.
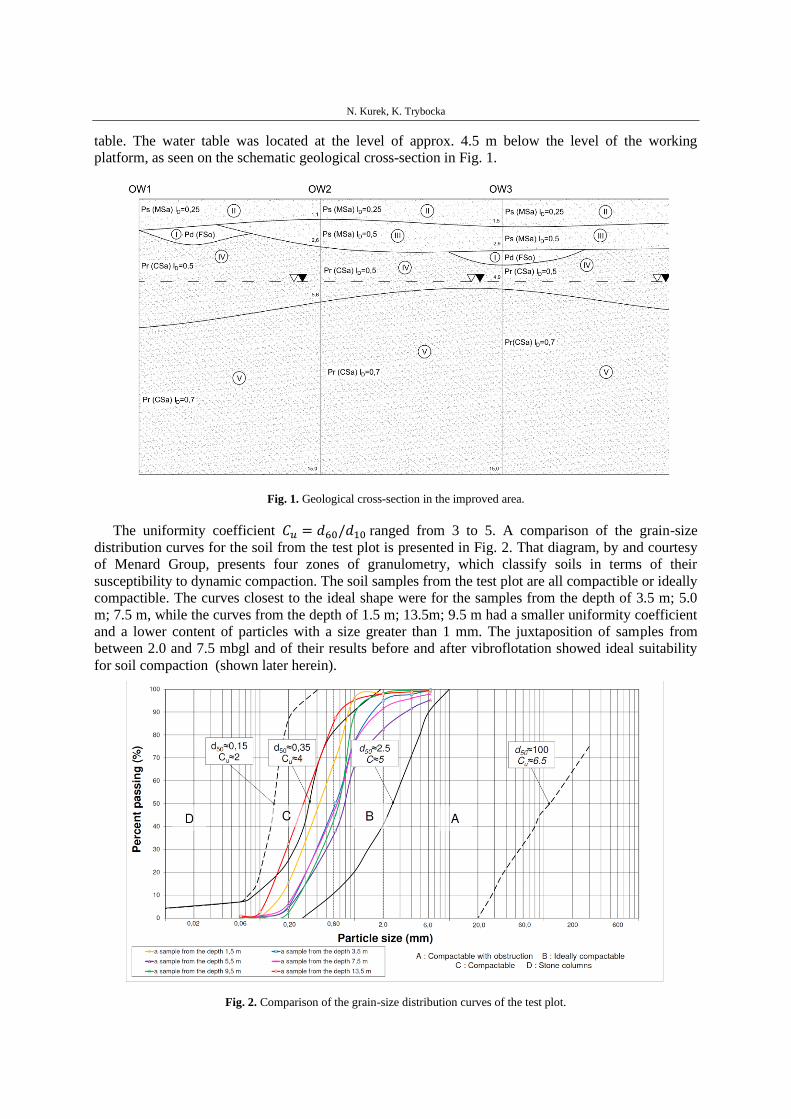
The uniformity coefficient 𝐶𝑢 = 𝑑60/𝑑10 ranged from 3 to 5. A comparison of the grain-size
distribution curves for the soil from the test plot is presented in Fig. 2. That diagram, by and courtesy
of Menard Group, presents four zones of granulometry, which classify soils in terms of their
susceptibility to dynamic compaction. The soil samples from the test plot are all compactible or ideally
compactible. The curves closest to the ideal shape were for the samples from the depth of 3.5 m; 5.0
m; 7.5 m, while the curves from the depth of 1.5 m; 13.5m; 9.5 m had a smaller uniformity coefficient
and a lower content of particles with a size greater than 1 mm. The juxtaposition of samples from
between 2.0 and 7.5 mbgl and of their results before and after vibroflotation showed ideal suitability
for soil compaction (shown later herein).
Fig. 2. Comparison of the grain-size distribution curves of the test plot.

A study of soil vibro-compaction in medium sands
3. Deep compaction method
The soil compaction at the site analyzed was carried out with a vibroflot freely suspended from a
crane. The type of the vibrator used was the V23 model, with power rating of 130 kW, frequency of 30
Hz and vibration amplitude of 23 mm. Vibroflotation points were arranged in a triangular grid system
with a side length of the equilateral triangle of approx. 2.8 m. The depth of deep compaction in
relation to the level of the working platform was approx. 6÷7 m. No additional backfill material was
used during the compaction but only the potential of the subsoil material was exploited.
It should be noted that the vibroflotation technique is not effective in the near-surface zone, that is
up to the depth of approx. 1 m ÷1.5 m below the working platform level. This phenomenon is caused
by low effective stresses in the subsoil layer. The particular depth from which the compaction effect
occurs depends on many factors, including the type of soil, its volumetric weight, possible additional
soil load, frequency and amplitude of vibrations. Loosening of the soil may occur in the subsoil zone.
Additionally, reduction in the volume of pores in the soil medium causes its compaction, which results
in subsiding of the ground level. Allowing for these phenomena it is recommended to form a working
level for the vibroflotation technique at approx. 1.5÷2 m above the foundation level of the future
structure or to apply additional treatments to densify the subsoil layer.
4. Deep compaction method
Appropriate measurements were taken at the test plot to assess the effectiveness of the technique
applied there. Both before and after the compaction, tests were made with a static probe (CPTU),
dilatometer tests (DMT) and geodetic measurements of the working platform level. The post-
compaction probe soundings were located at the intersection of the middle triangles formed of vertices
that were the compaction points. The vibroflotation process caused the working platform to subside in
the test plot by approx. 50 cm on average, which constitutes approx. 8% of the thickness of the
compacted layer.
The results of CPTU static soundings before and 7 days after the compaction process and for the
2.8 m spacing of compaction points are shown in Fig. 3. The comparison of the measurement results
clearly shows a significant increase in the resistance on the 𝑞𝑐 cone. On average this value doubled in
terms of the vibroflot work depth. The 𝐼𝐷 index of soil strengthening defined in accordance with the
formula as suggested in the publication by Dove et al. [9] was on average:
𝐼𝐷 =𝑞𝑐,𝑎𝑓𝑡𝑒𝑟
𝑞𝑐,𝑏𝑒𝑓𝑜𝑟𝑒− 1 ≈ 1 (1)
where:
𝑞𝑐,𝑎𝑓𝑡𝑒𝑟 - cone resistance value after vibroflotation;
𝑞𝑐,𝑏𝑒𝑓𝑜𝑟𝑒 - cone resistance value before vibroflotation.
As expected, up to a depth of 1.5 m below the working platform level no strengthening effect was
obtained, as explained above.
According to DeJong et al. [8] the fs sleeve friction is a parameter that is less sensitive to changes
in soil compaction caused by vibroflotation and is not a reliable parameter for the assessment of the
state of a particular soil. A slight fall in the value of the 𝑓 𝑠 sleeve friction was observed at the test
plot.
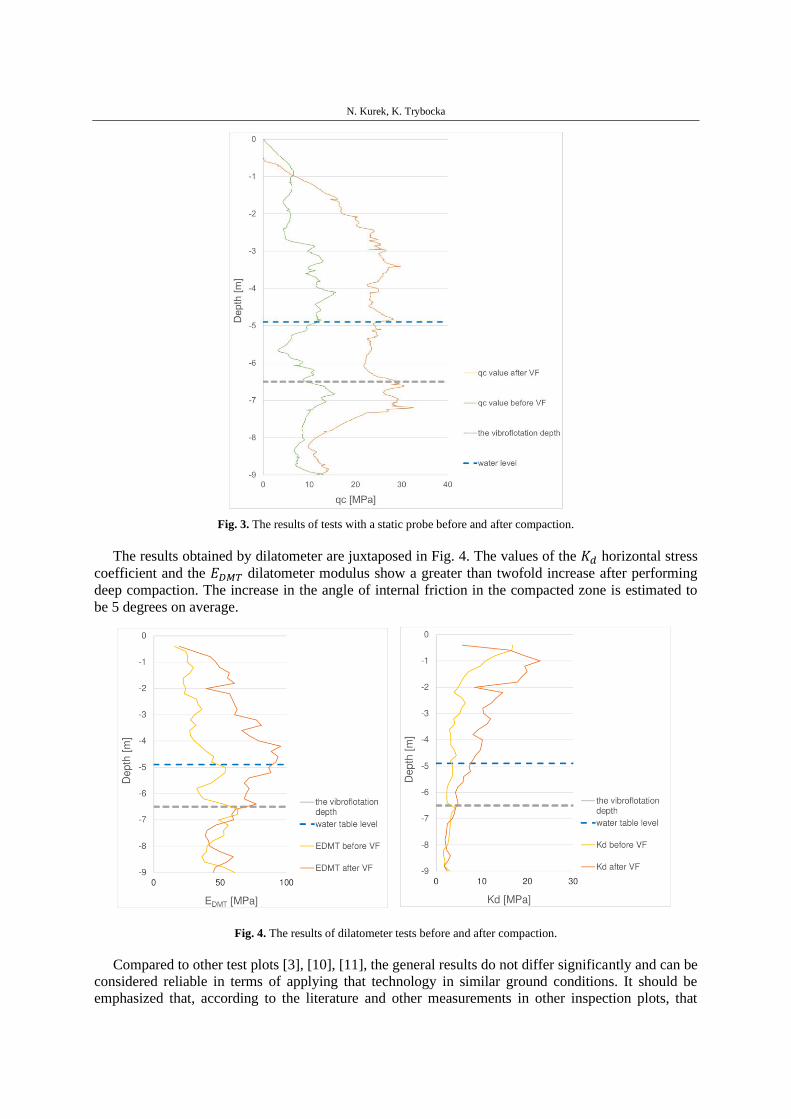
N. Kurek, K. Trybocka
Fig. 3. The results of tests with a static probe before and after compaction.
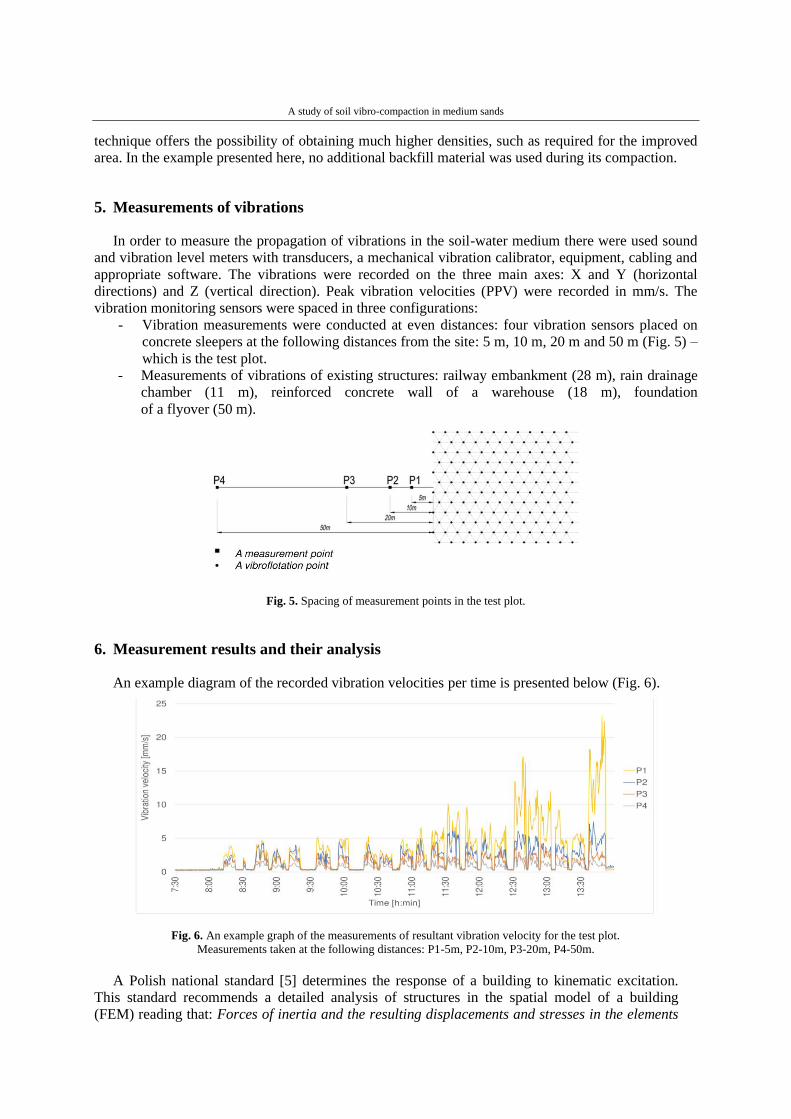
The results obtained by dilatometer are juxtaposed in Fig. 4. The values of the 𝐾𝑑 horizontal stress
coefficient and the 𝐸𝐷𝑀𝑇 dilatometer modulus show a greater than twofold increase after performing
deep compaction. The increase in the angle of internal friction in the compacted zone is estimated to
be 5 degrees on average.
Fig. 4. The results of dilatometer tests before and after compaction.
Compared to other test plots [3], [10], [11], the general results do not differ significantly and can be
considered reliable in terms of applying that technology in similar ground conditions. It should be
emphasized that, according to the literature and other measurements in other inspection plots, that
A study of soil vibro-compaction in medium sands
technique offers the possibility of obtaining much higher densities, such as required for the improved
area. In the example presented here, no additional backfill material was used during its compaction.
5. Measurements of vibrations
In order to measure the propagation of vibrations in the soil-water medium there were used sound
and vibration level meters with transducers, a mechanical vibration calibrator, equipment, cabling and
appropriate software. The vibrations were recorded on the three main axes: X and Y (horizontal
directions) and Z (vertical direction). Peak vibration velocities (PPV) were recorded in mm/s. The
vibration monitoring sensors were spaced in three configurations:
- Vibration measurements were conducted at even distances: four vibration sensors placed on
concrete sleepers at the following distances from the site: 5 m, 10 m, 20 m and 50 m (Fig. 5) –
which is the test plot.
- Measurements of vibrations of existing structures: railway embankment (28 m), rain drainage
chamber (11 m), reinforced concrete wall of a warehouse (18 m), foundation
of a flyover (50 m).
Fig. 5. Spacing of measurement points in the test plot.
6. Measurement results and their analysis
An example diagram of the recorded vibration velocities per time is presented below (Fig. 6).
Fig. 6. An example graph of the measurements of resultant vibration velocity for the test plot.
Measurements taken at the following distances: P1-5m, P2-10m, P3-20m, P4-50m.
A Polish national standard [5] determines the response of a building to kinematic excitation.
This standard recommends a detailed analysis of structures in the spatial model of a building
(FEM) reading that: Forces of inertia and the resulting displacements and stresses in the elements
N. Kurek, K. Trybocka
of an existing structure should be determined in the model of a building according to the principles
of dynamics of buildings and at the same time assuming the kinematic excitation. This standard also
offers simplified methods of dynamic analysis and the scale of dynamic impacts on masonry
construction as well as buildings made of large-scale prefabricated components.
For information purposes, Fig. 7 and Fig. 8 refer to German [6] and French [7] national
standards, respectively, which may be of practical use in the preliminary analysis phase.
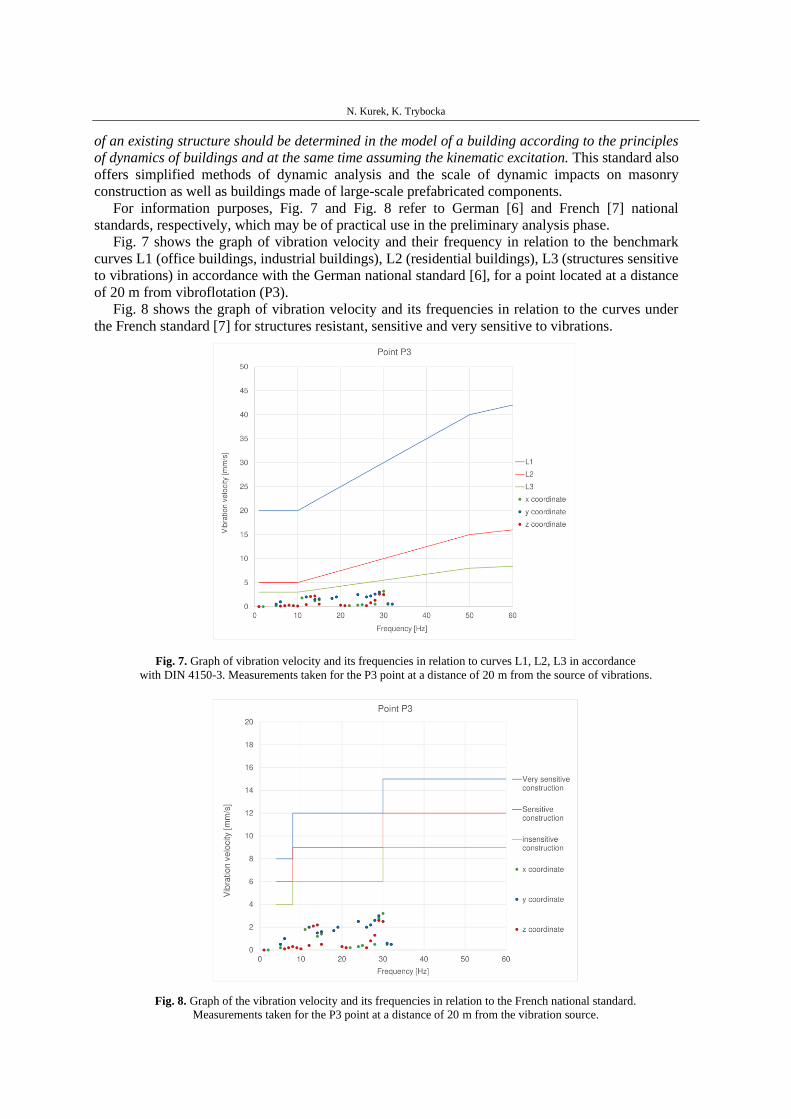
Fig. 7 shows the graph of vibration velocity and their frequency in relation to the benchmark
curves L1 (office buildings, industrial buildings), L2 (residential buildings), L3 (structures sensitive
to vibrations) in accordance with the German national standard [6], for a point located at a distance
of 20 m from vibroflotation (P3).
Fig. 8 shows the graph of vibration velocity and its frequencies in relation to the curves under
the French standard [7] for structures resistant, sensitive and very sensitive to vibrations.
Fig. 7. Graph of vibration velocity and its frequencies in relation to curves L1, L2, L3 in accordance
with DIN 4150-3. Measurements taken for the P3 point at a distance of 20 m from the source of vibrations.
Fig. 8. Graph of the vibration velocity and its frequencies in relation to the French national standard.
Measurements taken for the P3 point at a distance of 20 m from the vibration source.
A study of soil vibro-compaction in medium sands
6. Presentation of analyses
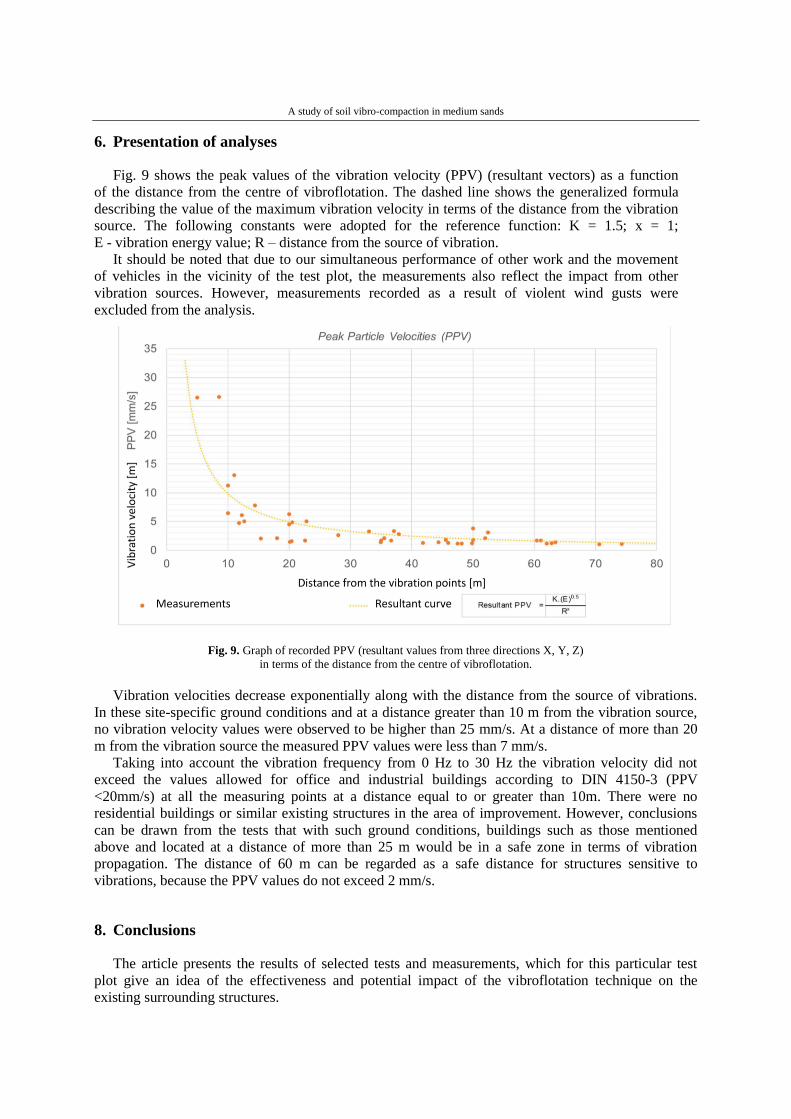
Fig. 9 shows the peak values of the vibration velocity (PPV) (resultant vectors) as a function
of the distance from the centre of vibroflotation. The dashed line shows the generalized formula
describing the value of the maximum vibration velocity in terms of the distance from the vibration
source. The following constants were adopted for the reference function: K = 1.5; x = 1;
E - vibration energy value; R – distance from the source of vibration.
It should be noted that due to our simultaneous performance of other work and the movement
of vehicles in the vicinity of the test plot, the measurements also reflect the impact from other
vibration sources. However, measurements recorded as a result of violent wind gusts were
excluded from the analysis.
Fig. 9. Graph of recorded PPV (resultant values from three directions X, Y, Z)
in terms of the distance from the centre of vibroflotation.
Vibration velocities decrease exponentially along with the distance from the source of vibrations.
In these site-specific ground conditions and at a distance greater than 10 m from the vibration source,
no vibration velocity values were observed to be higher than 25 mm/s. At a distance of more than 20
m from the vibration source the measured PPV values were less than 7 mm/s.
Taking into account the vibration frequency from 0 Hz to 30 Hz the vibration velocity did not
exceed the values allowed for office and industrial buildings according to DIN 4150-3 (PPV
<20mm/s) at all the measuring points at a distance equal to or greater than 10m. There were no
residential buildings or similar existing structures in the area of improvement. However, conclusions
can be drawn from the tests that with such ground conditions, buildings such as those mentioned
above and located at a distance of more than 25 m would be in a safe zone in terms of vibration
propagation. The distance of 60 m can be regarded as a safe distance for structures sensitive to
vibrations, because the PPV values do not exceed 2 mm/s.
8. Conclusions
The article presents the results of selected tests and measurements, which for this particular test
plot give an idea of the effectiveness and potential impact of the vibroflotation technique on the
existing surrounding structures.

N. Kurek, K. Trybocka
Vibroflotation activities belong to a group of subsoil strengthening techniques, for which it is
recommended at each time to carry out measurements of test plots and then select technical and
geometric parameters appropriate for a given area. In addition, it is also recommended to carry out
vibration propagation measurements in the case of existing buildings located between 30 m and 50 m
(depending on the sensitivity of the structure) off the site under improvement.
The article presents the results of the vibration velocity measurements for the waves generated and
propagating during the deep compaction of non-cohesive soils while using the vibroflotation method.
The measured vibration values were compared with the example permissible values. When analyzing
the possibility of using vibration techniques, it should be taken into account that during works a
propagating wave causes compaction of soil in its adjacent area. In the case of expected excessive
vibrations or settlements of the ground it is necessary to modify the technical parameters or apply
solutions that will damp vibrations. Despite the need to calibrate and verify the vibroflotation activities
at each area of improvement due to its site-specific ground conditions it should be emphasized that this
technique may turn out to be economic, fast and effective.
Bibliography
[1] R. Hitchman. An Evaluation of the Phoenix Machine: A New Apparatus for the In-Situ Densification of Soil. A master’s
thesis, The University of British Columbia, 1989.
[2] F.G. Bell. Engineering Treatment of Soil. London E & FN Spon, 1993.
[3] N. Kurek. Quality Control of Deep Compaction of Non-Cohesive Soils. A doctoral dissertation, Gdańsk: Gdańsk
University of Technology, 2013.
[4] Hamidi, B., Varaksin, S. and Nikraz, H., 2011. A Case of Vibro Compaction Vibration Monitoring in a Reclaimed Site.
International Conference on Advances in Geotechnical Engineering (ICAGE 2011), pp. 861-866.
[5] Polish Standard PN-B-02170: 2016-12: Assessment of the Harmfulness of Vibrations Transmitted by the Ground onto
Buildings.
[6] German Standard DIN 4150-3: 1999-02: Structural vibration. Part 3, Effects of vibration on structures.
[7] Regulation “Circulaire du 23/07/86 relative aux vibrations mécaniques émises dans l'environnement par les installations
classées pour la protection de l'environnement” A French regulation.
[8] J.T.DeJong et al. “Effect of Surface Texturing on CPT Friction Sleeve Measurements” in: Journal of Geotechnical and
Geoenvironmental Engineering, pp. 158-168, February 2001.
[9] J.E. Dove et al. “A CPT-Based Index for Evaluating Ground Improvement” in: GeoDenver, 2000, pp. 296-310, Denver
(Colorado), American Society of Civil Engineers, August 2000.
[10] D. Berthier et al. “Marine and Land Based Compaction Works At The Port Botany Project” in: Ground Improvement
Technologies and Case Histories, pp. 221-229, Sydney, January 2009.
[11] Wang D., Chen S., Liang X., Zhou H. (2018) “Application of Cone Penetration Test Technology in Whole Process
Inspection of Reinforcing Hydraulic Fill Sand Foundation” in: Li L., Cetin B., Yang X. (eds) Proceedings of
GeoShanghai 2018 International Conference: Ground Improvement and Geosynthetics, pp. 145-156. GSIC 2018.
Springer, Singapore.