a study of eaf high-chromium stainless steelmaking slags ...417230/fulltext01.pdf · shown that the...
TRANSCRIPT

A Study of EAF High-Chromium Stainless
Steelmaking Slags Characteristics and Foamability
Saman Mostafaee
Doctoral Thesis Stockholm 2011
Department of Materials Science and Engineering Division of Applied Process Metallurgy
Royal Institute of Technology SE-100 44 Stockholm
Sweden Akademisk avhandling som med tillstånd av Kungliga Tekniska Högskolan i Stockholm, framlägges för offentlig granskning för avläggande av Teknologie Doktorsexamen, tisdagen den 24 maj 2011, kl. 10.00 i F3, Lindstedtvägen 26, Kungliga Tekniska Högskolan, Stockholm.
ISRN KTH/MSE--11/12--SE+APRMETU/AVH ISBN 978-91-7415-968-4

ii
Saman Mostafaee: A Study of EAF high-chromium stainless steelmaking slags characteristics and foamability
KTH School of Industrial Engineering and Management Division of Applied Process Metallurgy Royal Institute of Technology SE-100 44 Stockholm Sweden ISRN KTH/MSE--11/12--SE+APRMETU/AVH ISBN 978-91-7415-968-4
© The Author

iii
___________________________ To my beloved; Parichehr

iv

v
ABSTRACT
A good slag practice is essential for production of a high-quality stainless steel. In addition, the electrical and material efficiency of the electric arc furnace (EAF) can considerably be improved by a good slag practice. The metallurgical properties of the slag are strongly influenced by its high-temperature microstructure. Thus, characterization of the phases within the EAF slag as well as the determination of the amount of these phases is of high importance.
In addition, the knowledge about the chemical composition of the liquid slag and solid phases at the process temperatures is instrumental in developing a good slag practice.
In order to study the slag in EAF high-chromium stainless steelmaking, slag samples were collected from 14 heats of AISI 304L steel (two samples per heat) and 7 heats of duplex steel (three samples per heat).
The selected slag samples were petrographically studied both using scanning electron microscopy equipped with energy dispersive X-ray spectroscopy (SEM-EDS) and light optical microscopy (LOM). In some cases, X-ray diffraction (XRD) analyses were also performed. Moreover, computational thermodynamics was used to determine the equilibrium phases in the EAF steelmaking slags at the process temperatures. In addition, parameter studies were performed on the factors influencing the equilibria.
More specifically, a petrographical and thermodynamic characterization was performed on the EAF austenitic steelmaking slags. Thereafter, the microstructural evolution of the slag during the EAF duplex steelmaking process was investigated. Moreover, an investigation with focus on the total amount of precipitates within the high-chromium stainless steelmaking slags was done. Finally, the foamability of these slags was quantified and evaluated.
The petrographic investigations showed that, during the refining stage, in both austenitic and duplex cases, the main constituent of the EAF slag is a melt consisting of liquid oxides. In addition, the slag samples contain solid spinel particles. However, before ferrosilicon-addition (FeSi), the slag may also contain solid stoichiometric calcium chromite. Moreover, depending on the slag basicity, the slag may contain solid dicalcium silicate at the process temperatures.
The evolution of the slag during the refining stage of the EAF was graphically illustrated in the calculated isothermal phase diagrams for the slag system Al2O3-Cr2O3-CaO-MgO-SiO2-TiO2.
It was found that the only critical parameter affecting the amount of solid spinel particles in the slag is the chromium-oxide content. More specifically, it was shown that the amount of the spinel particles in the slag increases with an increased chromium-oxide content of the slag. It was

vi
also shown that a higher basicity and a lower temperature of the slag contribute to the dicalcium silicate precipitation.
In order to evaluate and quantify the foamability of the slags, the slag’s physical properties influencing its foaming index were determined. Computational thermodynamics was used as a tool to calculate the weight fractions of the solid phases within the slag at different EAF process stages. The computational thermophysics was used to estimate the viscosity of the liquid part of the slag samples at the process temperatures. The apparent viscosity of the samples was calculated by combining the above results. By estimating the density, surface tension and the foaming-gas bubble size, the foaming index of the slag samples were quantified. It could be shown that the foaming index of the EAF high-chromium stainless steelmaking slag may be on its minimum as the slag’s basicity takes a value in the range of 1.2 – 1.5. A basicity value of around 1.50 – 1.60 can be suitable for enhancing the foaming index of the slag, during the refining period in EAF high-chromium stainless steelmaking.
Keywords: High-chromium stainless steel, EAF, Slag, Microstructural characterization, Microstructural Evolution, Computational thermodynamics, Solid particles, Viscosity, Foamability, Basicity.

vii
ACKNOWLEDGEMENTS
First and foremost, I would like to express my sincere gratitude and appreciation to Professor Pär Jönsson, for his constant support, patience and motivation throughout my PhD study and research. I could not have imagined having a better advisor and mentor. Pär; you have made available your support for me even in other aspects of life. You are more than a good supervisor to me!
It is also a pleasure to thank my other supervisor Dr. Margareta Andersson for qualified help, discussions and guidance during this study.
My sincere thanks also go to Dr. Malin Selleby of KTH for her assistance in using Thermo-Calc and performing thermodynamic calculations. Thank for your never-ending support.
I wish to thank the Swedish Energy Agency (Energimyndigheten) and the Swedish Steel Producers Association (Jernkontoret, Project No.: JK23028) for financial support. In addition, I am grateful to the members of my research committee in Jernkontoret, especially Jyrki Pitkälä (Outokumpu Stainless AB, Avesta), Marcel Magnusson (Swerea MEFOS), Patrik Undvall (Ovako Hofors AB) and Harry Pettersson (Jernkontoret) for insightful discussions, comments, suggestions and good ideas.
I am also grateful to the Outokumpu Stainless AB and its personnel, especially the EAF operators and engineers, for assistance in performing plant trails and in determining the chemical composition of the steel and slag samples. Many thanks are given to Swerea KIMAB and Avesta Research Centre, especially SEM operators, for assistance in microscopic analyses.
My grateful thanks go to Thermo-Calc software AB and especially to Drs. Lina Kjellqvist and Johan Bratberg for great help with modifying and developing the TCMSI1 slag/steel database.
Thanks to my friends and colleagues at the department of Material Science and Engineering, KTH and special thanks to my friends at the division of Applied Process Metallurgy, especially Mr. Reza Safavi Nick. I greatly value their friendship. Thank you for the shared happy moments!
I’m deeply grateful to my family, my wife’s family and especially my parents for being so caring and supportive all the time. Thank you for your never-ending love!
More than three years ago and in the beginning of my PhD research, in a distance of thousands of kilometers from me, my special and fantastic grandmother passed away. It is an honor for me to express my heartfelt thanks to her for all she has done for me. “Maadar”; I have not forgotten you. Thank you for wishing me the best throughout my childhood!

viii
Most importantly, I would like to express my deepest appreciation to my beloved Parichehr for all encouragement, understanding and spiritual support throughout my PhD research. Parichehr; without your help, it would never have come to reality. To you I dedicate this thesis.
My son Nima and my unborn baby deserve special mention; you have always been a unique source of energy and inspiration for me.
Finally, I offer my best regards and sincerest gratitude to all of those who supported me in any respect during the completion of this research.
Saman Mostafaee
Stockholm, April 2011

ix
SUPPLEMENTS
The present thesis is based on the following supplements:
Supplement 1: “A petrographic and thermodynamic study of slags in EAF stainless steelmaking” Saman Mostafaee, Margareta Andersson, Pär Jönsson Published in Ironmaking and Steelmaking, 2010, 37, (6), 425-436.
Supplement 2: “A petrographical study of the microstructural evolution of EAF duplex stainless steelmaking slags” Saman Mostafaee, Margareta Andersson, Pär Jönsson Published in Ironmaking and Steelmaking, 2011, 38, (2), 90-100.
Supplement 3: “Computational thermodynamics as a tool to study the microstructural evolution of EAF duplex stainless steelmaking slags” Saman Mostafaee, Malin Selleby, Margareta Andersson, Pär Jönsson Accepted for publication in Ironmaking and Steelmaking, Mars 2011.
Supplement 4: “Influence of slag properties on the amount of solid precipitates in high-chromium EAF steelmaking” Saman Mostafaee, Pär Jönsson Submitted for publication in Steel Grips, February 2011.
Supplement 5: “Evaluation of the foamability of the EAF stainless steelmaking slags using computational thermodynamics and thermophysics” Saman Mostafaee, Margareta Andersson, Pär Jönsson ISRN KTH/MSE--11/13--SE+APRMETU/ART

x
The contributions by the author to different supplements of this thesis:
Supplement 1: Literature survey, major parts of plant trails, major parts of petrographical analyses, thermodynamic calculations, evaluation work, major parts of writing.
Supplement 2: Literature survey, major parts of plant trails, major parts of petrographical analyses, evaluation work, major parts of writing.
Supplement 3: Literature survey, thermodynamic calculations, evaluation work, major parts of writing.
Supplement 4: Literature survey, thermodynamic calculations, evaluation work, major parts of writing.
Supplement 5: Literature survey, thermodynamic calculations, thermophysical calculations, evaluation work, major parts of writing.
Some results of the above supplements have been presented in the following conference:
Saman Mostafaee: “Slaggbildningsförlopp i ljusbågsugnar”, JERNKONTORET/KTH, Metallurgmöte, Stockholm, Sweden, 19-20, January, 2011.

xi
CONTENTS
Abstract .................................................................................................................................................. v
Acknowledgements ............................................................................................................................... vii
Supplements .......................................................................................................................................... ix
1 Introduction .................................................................................................................................... 1
2 Experimental methods ..................................................................................................................... 7
2.1 Plant description ...................................................................................................................... 7
2.2 Sampling .................................................................................................................................. 7
2.2.1 AISI 304L stainless steelmaking slag .................................................................................. 7
2.2.2 Duplex steelmaking slag ................................................................................................... 8
2.3 Global (bulk) chemical composition .......................................................................................... 8
2.4 Petrographical analysis ............................................................................................................. 8
3 Computational thermodynamics .................................................................................................... 11
3.1 Thermo-Calc software package as a tool to study equilibria ................................................... 11
3.2 Database TCMSI1 ................................................................................................................... 11
3.3 Modified TCMSI1 database .................................................................................................... 12
4 Result and discussion ..................................................................................................................... 13
4.1 Petrographical and thermodynamic characterization of AISI 304L stainless steelmaking slags (Supplement 1) .................................................................................................................................. 13
4.1.1 Global slag composition .................................................................................................. 13
4.1.2 SEM-EDS and LOM observations ..................................................................................... 14
4.1.3 Thermodynamic determinations ..................................................................................... 19
4.2 Petrographical study of the microstructural evolution of the duplex steelmaking slags (Supplement 2) .................................................................................................................................. 24
4.2.1 Global slag composition .................................................................................................. 24
4.2.2 SEM-EDS and LOM observations ..................................................................................... 25
4.2.3 XRD Analysis ................................................................................................................... 29

xii
4.3 Determination of the microstructural evolution of the duplex steelmaking slags using computational thermodynamics (Supplement 3) ............................................................................... 31
4.3.1 A Comparison between modified and unmodified version of TCMSI1 ............................. 31
4.3.2 Phase distribution as a function of temperature ............................................................. 32
4.3.3 Phase diagram as a function of the MgO- and Cr2O3 content .......................................... 33
4.3.4 Effect of the Cr2O3 content on the precipitation of the chromium-containing phases ...... 35
4.3.5 Influence of the basicity and the temperature on the amount of dicalcium silicate ......... 35
4.3.6 Influence of the CaO content on the phase distribution .................................................. 36
4.4 Influence of slag properties on the amount of solid precipitates in EAF high-chromium steelmaking (Supplement 4) .............................................................................................................. 37
4.4.1 Total amount of solid particles vs. Cr2O3 content............................................................. 37
4.4.2 Influence of the temperature on the total amounts of solid particles.............................. 39
4.4.3 Influence of the basicity on the total amount of the solid particles ................................. 39
4.5 Evaluation and prediction of the foamability of the EAF high-chromium steelmaking slags (Supplement 5) .................................................................................................................................. 41
4.5.1 Determination of the slag’s physical properties .............................................................. 41
4.5.2 Viscosity as function of basicity ...................................................................................... 47
4.5.3 Viscosity as function of temperature .............................................................................. 48
5 Concluding discussion .................................................................................................................... 50
5.1 Global slag composition ......................................................................................................... 51
5.2 Petrographical study (LOM, SEM-EDS and XRD) ...................................................................... 51
5.3 Computational thermodynamics ............................................................................................ 53
5.3.1 Thermo-Calc as a tool to study equilibria ........................................................................ 53
5.3.2 Verification of petrographical observations .................................................................... 53
5.3.3 Phase distribution........................................................................................................... 53
5.3.4 Microstructural evolution of the solid part of the slag .................................................... 54
5.3.5 Influence of the process parameters on the formation and the amount of solid phases .. 54
5.4 Evaluation and quantification of the foamability .................................................................... 55
6 Conclusions ................................................................................................................................... 57
7 Future work ................................................................................................................................... 61
8 References ..................................................................................................................................... 63

1
1 INTRODUCTION
A good slag practice is essential for production of a high-quality stainless steel [1]. In addition, the electrical and material efficiency of the electric arc furnace (EAF) can considerably be improved by a good slag practice [2]. In this context, the knowledge of the microstructure of the slag phases at the process temperature and the amount of these phases is of high importance. The high-temperature character of the solid phases within the slag has a large effect on the process features such as foamability of the slag, chromium recovery, consumption of the ferroalloys and the wear rate of the refractory of the EAF.
Today, the EAF technology in stainless steelmaking is not completely energy efficient. Here, a foaming-slag practice has been proved to be an effective method for reducing the energy consumption in an EAF [3]. Covering the electric arcs by a foamy layer leads to an increase in the heat transfer efficiency and a decrease in the heat losses to EAF sidewalls and the roof [4]. Today, foaming-slag practice is being used successfully in many carbon steelmaking plants in order to improve the thermal efficiency and productivity of the EAF [5]. Although many stainless steel plants have tried to adopt this practice, the adoption of the practice has yet been difficult. This is generally due to the high chromium-oxide content and low iron-oxide content of the stainless steel slags [6]. In addition, it should be considered that the rate of CrOx reduction by carbon is much slower than that of FeOx [7].
The tendency of a slag to generate foam, from either a gas, which is formed within the slag or an injected gas, is demonstrated by a parameter which is called the foaming index (∑). In general, the foaming index is dependent on the physical properties of the slag. This relationship is presented by the following equation [8]:
∑ = CµρD
(1)
where; µ is the viscosity, ρ is the density of the slag and D is the average gas-bubble diameter. The constant C is dependent on the nature of the slag system. Equation 1 correlates the foamability of the slag to its physical properties and the average size of the foaming-gas bubbles, by a dimensional analysis.
It has been proved that, at the process temperatures, the EAF slag contains solid phases [6]. These solid precipitates strongly influence the physical properties and thereby the foamability of the slag in the EAF [7].
The effect of the solid precipitates on the tendency of the EAF slags for the foaming, in the stainless steel production, has been investigated by some researchers. Vidacak et al. [9] observed that slags with a lower amount of chromium-bearing precipitates had higher foaming levels than the slags with a higher amount of chromium-bearing solid particles. The results were

2
unexpected, since the latter contained more solid precipitates that would increase the apparent viscosity and the foaming index of the slag. Also, Kerr and Fruehan [7] proposed a relationship between the foaming index and second phase particles. They reported that when the solubility limit for chromium oxide was exceeded, Cr-containing second phase particles form in the slag. These particles increase the effective viscosity and thereby the foaming index of the slag. However, if the amount and the size of these particles exceed a particular limit, the foamability of the slag contrarily decreases [7].
Considering the relationship between the high-temperature microstructure of the slag and its metallurgical properties, characterization of the microstructure of the EAF slag phases and the determination of the amount of these phases are of high importance. In addition, the knowledge about the chemical composition of the liquid slag and solid phases at the process temperatures is instrumental in developing a good slag practice.
Despite the fact that characterization of the EAF slag is crucial for controlling the microstructural slag evolution, only a limited amount of research has been done regarding this issue. Masucci et al. [6] observed that in the EAF stainless steel slag matrix, many crystals were present. These crystalline particles, which at the process temperature were in solid state, did on average contain 69% Cr2O3. The cross-sectional area of the detected crystallized phase was found to be approximately 21% of the total surface area. Also, Tossavainen et al. [10] analyzed an EAF high-alloyed steelmaking slag (Cr2O3 = 3.3 wt%) sample. They could differentiate a spinel phase from the matrix-forming phases, in the semi-rapidly cooled samples. This solid-solution spinel phase contained Mg, Mn, Cr, Al and O. In addition, Dirk Durinck et al. [2] showed that at EAF process temperatures, the slag generally contains solid spinel particles.
Durinck et al. [2] calculated a qualitative phase diagrams for an EAF standard stainless (Cr = 18 wt%, Ni = 8 wt%) steelmaking slag system using computational thermodynamics. They also qualitatively studied the influence of the parameters such as oxygen partial pressure and temperature on the chromium oxide solubility in the slag. However, there is still very limited information about the influence of the EAF process parameters on the character and the amount of the solid precipitates. More specifically, the influence of the slag composition, basicity and temperature on the microstructural evolution of the slag has to be deeply investigated. This knowledge is essential regarding the determination of the amount and the character of the solid precipitates within the EAF slag.
In addition, in order to be able to predict the foaming character of a slag, the physical properties of that slag should be quantified. As mentioned before, physical properties of the slag and especially the apparent viscosity of the slag are highly influenced by the total amount of the solid phases.
Considering the lack of knowledge on EAF high-chromium steelmaking slag microstructural characteristics, the focus in the first supplement (Supplement 1) is generally on the petrographical and thermodynamic characterization of the EAF austenitic steelmaking slags. The microstructural evolution of the slag during the EAF steelmaking process was investigated and discussed in Supplements 2 & 3. The focus in Supplement 4 is on the total amount of precipitates within high-chromium steelmaking slags. Throughout this study, the aim has been to investigate and discuss the relationships between foaming characteristics of the slag and its high-

3
temperature microstructure. However, one supplement (Supplement 5) is totally dedicated to the evaluation of the foamability of the EAF high-chromium steelmaking slags.
The diagram in Figure 1 demonstrates the relationship between the different supplements in this thesis as well as the major aspects discussed in the supplements. In addition, the focus in different supplements is also illustrated.
Figure 1. Relationship between different supplements as well as major studies in the supplements.
As shortly mentioned above, this thesis consists of five supplements. Supplement 1 is focused on the characterization of the microstructure of EAF austenitic stainless steel slags at the process temperatures. More specifically, petrographic investigations of EAF slag samples in production of AISI 304L steel, namely standard stainless steel grade, have been done. In this regard, microscopic observations and compositional determinations were combined with thermodynamic calculations to quantify the petrographic results. The taken samples were analyzed by light optical microscope (LOM) and scanning electron microscope (SEM) equipped with an energy dispersive X-ray spectroscopy (EDS) analyzer, to reveal the compositional and mineralogical data for slag samples. Additionally, thermodynamic calculations have been used to evaluate the effects of different process parameters such as temperature and composition on the high-temperature microstructure of the slag phases. These, in turn, have a large influence on the foaming behaviour of the slag.
Today, new duplex stainless steel grades are being introduced to replace austenitic stainless steel grades [11]. This is due to their cost efficiency, good mechanical properties, and good corrosion resistance [12]. Here, duplex stainless steels are called “duplex” because it combines both ferritic and austenitic microstructures in the same material [13].
Standard duplex stainless steel is characterized by a higher chromium content (22 wt%) than standard stainless steel (18 wt%) and a lower nickel content (5.5 against 8 wt%). In other word,
Slag characterization
EAF austenitic stainless steelmaking
Petrographical analysis(Supplement 1)
Compuational thermodynamics(Supplement 1)
EAF duplex steelmaking
Microstructural evolution - Petrography
(Supplement 2)
Microstructural evolution - Comp. Thermodynamics (Supplement 3)
Total amount of solid precipitates
(Supplement 4)
Evaluation of the foamability
(Supplement 5)

4
the chromium content of the duplex steel grades is generally around 20% higher than in austenitic steel grades. Considering this, the chromium-oxide content of the EAF duplex steelmaking slags is higher than that for standard stainless steel slags. In this context, it is reasonable to make a distinction between a slag from production of duplex stainless steel and austenitic stainless steel considering their different high-temperature microstructure, which may lead to different physical properties and foamability.
In addition, shortage of high-quality duplex steel scrap with an accurate chemical composition combined with additional requirements for a precise composition of certain elements, such as copper [14] forces the melters to charge larger amounts of ferrochromium into the furnace to obtain the required chromium content. To be sure that the large pieces of the ferrochromium are completely molten, the temperature in the EAF duplex steelmaking process is generally higher than that for austenitic stainless steelmaking. Moreover, it should be considered that the stirring in the EAF is often relatively weak. Thus, another difference between the production process of the duplex and austenitic stainless steel in EAF corresponds to the higher production temperature in EAF duplex steelmaking. Additionally, owing to the higher chromium content of duplex steelmaking slags, the risk for a larger chromium loss to the slag is high. Here, an improved chromium recovery and a better controlled slag practice are demanded.
Since duplex stainless steel grades contain lower amounts of nickel and molybdenum than austenitic stainless steel with the same level of corrosion resistance, they can be produced with a lower cost. Here, an annual growth rate of more than 10% for the global market of duplex stainless steel is expected [11]. In spite of this, no experimental or theoretical investigation on the high-temperature microstructure of the duplex stainless steel slag in EAF has been reported yet.
Supplement 2 is focused on the petrographical characterization of the microstructure of the duplex stainless steel slags at three different EAF process stages. Microstructural evolution of the slag during and at the end of the refining period is investigated, based on the study of 7 EAF duplex stainless steel heats (Cr = 21.5 – 22.5 wt%, Ni = 1.6 – 5.7 wt% and Mo = 0.3 – 3.2 wt%). Microscopic observations are combined with compositional determinations to investigate and characterize the high-temperature microstructure of the slag phases. More specifically, sampling was performed at three stages for each heat, namely before ferrosilicon (FeSi) addition, after FeSi-addition and before tapping. The samples were analyzed by LOM and SEM-EDS analyzer. Thereafter, XRD analysis was used to verify the petrographical results. In addition, the effects of different parameters such as temperature and slag basicity on the stability of slag phases are briefly discussed.
The focus in Supplement 3 is on using computational thermodynamics as a tool to study and determine the microstructural evolution of EAF duplex stainless steelmaking slags. More specifically, the software package Thermo-Calc [15] was used to theoretically verify the petrographical observations. In addition, isothermal phase diagrams for the EAF high-chromium steelmaking slag systems were calculated. These diagrams illustrate the phases, which the samples are composed of, in a two-dimensional space of the MgO content versus the Cr2O3 content. Microstructural evolution of the slag during the refining stage in EAF process was illustrated on the calculated phase diagrams.

5
Moreover, the amount of the high-temperature slag phases, at different EAF duplex steelmaking process stages, is determined. In other words, phase distributions for slag samples are studied. The influences of the slag composition on the phase distribution are also illustrated. Finally, the effect of process parameters such as slag basicity on the amount of solid phases is discussed.
As mentioned before, the amount of the solid particles plays a decisive role in the foaming characteristic of the slag. In this connection, Supplement 4 is focused on studying the effect of the process parameters on the total amount of the solid precipitates within the slag during the EAF high-chromium stainless steelmaking. More specifically, the influence of the slag basicity, temperature and composition on the total amount of the solid particles is illustrated and discussed.
Finally, the focus in Supplement 5 is on evaluating and predicting the foamability of Cr2O3-rich steelmaking slags. More specifically, this supplement (Supplement 5) is focused on the evaluation, prediction and comparison of the foamability of the high-chromium oxide slags during different stages of the EAF stainless steelmaking process. The total amounts of solid particles within the slag were calculated using the Thermo-Calc [15] software package. This was performed both for industrial slag samples as well as Kerr and Fruehan’s laboratory slag sample [7]. In addition, the ThermoSlag software [16] was used to estimate the viscosity of the slag samples at the process temperatures. Thereafter, the apparent viscosity of the samples was calculated by estimating the volume fractions of the solid phases in the slags.
Supplement 5 is a novel attempt to quantify the real viscosity and thereby the foaming index of the industrial slags at high temperatures by taking the effect of the solid precipitates into account. Vidacak et al. [9] also focused their research on quantifying the foamability of the EAF stainless steelmaking slags. However, the large effect of the solid phases on the apparent viscosity of the slag was not taken into account. The knowledge about the real viscosity of the slag at process temperatures is absolutely necessary for predicting and evaluating the slag foaming in production processes.
Unfortunately, the physical properties of the slags at the temperature of interest have not been determined. Therefore, simple models were used to estimate the values for their density and surface tension.
The densities of the liquid slag were determined considering the changes in the density of a multicomponent slag system by the progressive replacement of SiO2 by Cr2O3. In addition, Mills and Keene’s surface tension estimating model [17] was used to calculate and assess the surface tension of the slags. Furthermore, the foaming-gas bubble size was also estimated in different conditions. Finally, the foaming index of the slags samples was estimated and compared to the values reported by other researches [7, 9] for EAF high-chromium oxide steelmaking slags. In addition, the influence of the above parameters on the estimated foamabilities were assessed and discussed.
An overview of the supplements topics, objectives, research methods and using tools and equipments is presented in Table 1.

6
Table 1. An overview on the topics, objectives, methods and using tools and equipments. Supplement 1 2 3 4 5
Topic
Characterization of slag – 304L steelmaking
Petrographical study of the microstructural
evolution of slag – Duplex steelmaking
Thermodynamic study of the microstructural
evolution of slag – Duplex steelmaking
Investigation on the amount of the solid
particles – High-chromium steelmaking slags
Evaluation of the foamability – High-
chromium steelmaking slags
Objectives
• Identify the phases at process temperature
• Calculating the amount of the phases
• Investigating the influence of the process parameters on the amount of the phases
• Identify the phases • Determine the
microstructural evolution of the slag
• Calculating the amount of phases in different process stages
• Illustrating the microstructural evolution of the slag
• Investigating the influence of the other process parameters on the amount of phases
• Parameter study on the total amount of the solid particles
• Investigating the influence/interaction of the process parameters on the total amount of the phases
• Prediction of the foaming index of the industrial slag
• Investigating the influence of the process parameters on the foaming index
• Optimizing the foaming index
Methods
• Industrial Sampling • Petrography • Computational
thermodynamics • Parameter study
• Industrial Multi-sampling
• Petrography • Parameter study
• Computational thermodynamics
• Parameter study
• Computational thermodynamics
• Parameter study
• Computational thermodynamics
• Computational thermophysics
• Parameter study
Tools • LOM* • SEM-EDS** • Thermo-Calc [15]
• LOM • SEM-EDS • XRD†
• Thermo-Calc • Thermo-Calc • Thermo-Calc • ThermoSlag [16]
*: Light optical microscopy **: Scanning electron microscopy equipped with energy dispersive X-ray spectroscopy †: X-ray diffraction

7
2 EXPERIMENTAL METHODS
2.1 Plant description Industrial trials were carried out at Outokumpu Stainless Avesta, Sweden. This company, which is a part of Outokumpu Stainless, is one of the largest producers of stainless steel in the world [18]. The meltshop consists of an EAF with a capacity of approximately 85 tonnes steels. After the melting of scrap and alloys in the EAF, the crude steel and the slag are tapped into the transfer ladle. The slag amount at this stage is around 80-120 kg per tonne molten steel. Thereafter, the crude steel is deslagged prior to charging into the argon oxygen decarburization (AOD) converter.
Avesta’s EAF is a spout-tapping furnace. This EAF is equipped with a lance-manipulator consisting of four lances to inject O2, N2, FeSi and carbon (or carbon-containing mixtures) into the furnace. In combination with electric power, three oxy-fuel burners are also used to supply heat for melting of the steel scrap.
2.2 Sampling Slag samplings in the EAF were performed using a long steel spoon. After the sampling, the spoon content was poured quickly on the cold concrete floor, freezing the high-temperature microstructure of the slag samples. Simultaneously with each slag sampling, the temperature of the steel was measured using temperature lances. These were dipped into the steel melt by an automatic sampling system.
2.2.1 AISI 304L stainless steelmaking slag Slag sampling was performed twice for each heat. A first sample (sample A) was taken at the end of the refining period. This is the point of time where the injection of any kind of refining reactants into the furnace is finished and the evolution of the slag composition is approaching its final stage (4-5 minutes before tapping). Thereafter, a second sample (B) was collected just before tapping. Figure 2 presents a typical operational practice example of the EAF in Avesta during the sampling campaign. The sampling occasions are also presented in the diagram.

8
Figure 2. A typical operation example of the EAF in Avesta under the sampling campaign (AISI 304L Steel).
2.2.2 Duplex steelmaking slag To determine the evolution of the slag composition, sampling was performed at three different EAF process stages for each heat. The first sample (sample A) was taken after melting but before FeSi-injection. Thereafter, a second sample (sample B) was collected after FeSi-addition, halfway during blowing of carbon. Finally, a third sample (sample C) was taken just before tapping. Figure 3 presents a typical operational practice example of the EAF in Avesta during the sampling campaign. The sampling moments are also illustrated in the diagram.
Figure 3. A typical operation example of the EAF in Avesta under the sampling campaign (duplex steel).
2.3 Global (bulk) chemical composition Some different fragments of each slag sample were randomly chosen. The chosen parts were crushed to powder and compacted onto borate plates. Thereafter, the composition of the samples was determined using the X-ray fluorescence spectroscopy (XRF) method. These results represent an average value of the chemical composition of the bulk of the EAF slag. The accuracy of the measurements was up to one decimal place.
2.4 Petrographical analysis Petrography was initially performed for the slag samples using light optical microscopy (LOM). Thereafter, scanning electron microscopy (SEM) using backscattered electrons was done on the
Tim
e
12:4
2
13:0
3
13:2
8
13:3
3
13:3
5
FeSi I.
O2 Injection
Bask
et N
o.1
was
cha
rged
.
Bask
et N
o.2
was
cha
rged
.
Tapp
ing
star
ted.Lime Injection
Burners On
Power On Sam
ple
A
Sam
ple
B
N2 Inj.
Carbon Injection
Tim
e
13:1
7
13:3
4
13:5
4
14:0
2
14:1
2
14:1
4
Bask
et N
o.1
was
cha
rged
.
Bask
et N
o.2
was
cha
rged
.
Sam
ple
A
Sam
ple
B
Sam
ple
C
O2 Injection
FeSi Inj.
Carbon Inj.
N2 Inj.
Power On
Burners On
Lime Injection
Tapp
ing
star
ted.

9
samples. In addition, the SEM instruments were equipped with an energy dispersive X-ray spectroscopy (EDS) analyzer to be able to perform a semi-qualitative composition determination on the phases and particles existing in the specimens. In order to prepare specimens for electron microscopy, three slag fragments from different parts of one slag sample were collected and mounted in a conductive epoxy resin. Thereafter, the specimens were ground and polished (Figure 4). Finally, the surfaces of the specimens were coated with a conductive layer. The SEM-EDS determinations were done using a working distance of 7-10 mm and an acceleration voltage of 20 kV. On average, spot microanalysis for every phase or particle, within one slag fragment, were repeated 8-10 times. In some cases, X-ray diffraction (XRD) analyses were performed on fine-powdered samples to confirm the existence of the observed phases.
Figure 4. A slag specimen prepared for microscopy.

10

11
3 COMPUTATIONAL THERMODYNAMICS
3.1 Thermo-Calc software package as a tool to study equilibria Computational thermodynamics analysis was used as a tool to determine the equilibrium conditions for the slag samples at the measured temperature. The calculations were carried out using Thermo-Calc [15] software package. Generally, the software was used to predict the equilibrium phases within the slag at the process temperatures using the global slag composition.
The Thermo-Calc software package is a strong tool for calculating phase equilibria and phase diagrams [15]. Based upon a powerful Gibbs energy minimization method, Thermo-Calc has the ability to be used for various kinds of thermodynamic analysis and parameter studies. This thermodynamic software package is equipped with several accurate and validated databases for assessing a wide spectrum of various thermodynamic systems and materials [15].
In Supplement 1, the calculations were performed using Thermo-Calc ver. TCCR. However, in other supplements (Supplements 3, 4 & 5) Thermo-Calc ver. TCCS was used.
In addition to the prediction of the most stable phase assemblage, the software was also used to study the influence of the parameters such as the slag’s composition, temperature and basicity on the equilibrium phase assemblage within the slag. Moreover, phase diagrams were calculated using Thermo-Calc. This was done in order to determine and illustrate the microstructural evolution of the slag during EAF process stages. The slag system was defined as; Al2O3-CaO-Cr2O3-FeO-MgO-SiO2-TiO2.
In order to use computational thermodynamics for studying a complex multicomponent system like steelmaking slags, some simplifications and assumptions are inevitable. Here, it was assumed that the EAF slag is homogeneous and that the slag phases are in equilibrium with each other. In addition, based on personal communication with EAF operators and engineers, the slag temperature was assumed to be 50 oC higher than the measured steel temperatures.
Moreover, it was assumed that all solid compounds were in their stoichiometric compositions. This was owing to the fact that the used database (TCMSI1 [19]) has no solid-solution model for determining the solid-solution phases.
3.2 Database TCMSI1 The TCMSI1 (Thermo-Calc metal slag interaction) [19] database includes thermodynamic data concerning steelmaking slag equilibria and metal/slag interactions. The liquid slag phase in the TCMSI database contains the following system: Al2O3-CaO-CrO-Cr2O3-FeO-Fe2O3-MgO-MnO-Na2O-P-S-SiO2-TiO2. This database is not commercially distributed yet and is, presently, only available for internal use within department of Materials Science and Engineering, KTH.

12
Even though some of the binary and ternary subsystems in this database are still under development, it will be shown in the result section (Supplement 1) that this database is a quite accurate, reliable and useful tool for studying the EAF austenitic stainless steelmaking slags. However, preliminary investigations showed that this database suffers some weaknesses regarding high-chromium oxide slags. More specifically, it was shown that the predicted phase assemblage for the slag samples, taken before FeSi-injection in the EAF, is not in complete agreement with petrographical observations. As it will be discussed in the result section, at this stage of the process, the chromium-oxide content is at its highest level. This further clarified the necessity of the reassessment of some of the thermodynamic systems data within the database.
3.3 Modified TCMSI1 database A validated and critically-assessed database is essential for a reliable thermodynamic calculation. In this regard, the TCMSI1 database, within the constraints of EAF steelmaking slags, was examined. This performed for identifying the missing phases or phases that need updated thermodynamic descriptions. Missing or outdated data were updated as they were extracted from the most recent and reliable published literatures on this issue. This was done in a close cooperation with the Thermo-Calc experts at Thermo-Calc Software AB [20].
More specifically, the values for the Gibbs free energy of the formation and also the melting temperature of the chromium containing compounds, namely magnesiochromite (MgO·Cr2O3), calcium chromite (CaO·Cr2O3) and solid chromium oxide (Cr2O3) were reassessed. Finally, the modified database was examined to check that the descriptions of the phases and systems are in a good agreement with published experimental information and results.
Later on, in the result section, it will be shown that the modified version of the TCMSI1 database can also be used for calculation regarding EAF austenitic steelmaking slags.

13
4 RESULT AND DISCUSSION
4.1 Petrographical and thermodynamic characterization of AISI 304L stainless steelmaking slags (Supplement 1)
4.1.1 Global slag composition Table 2 illustrates the measured values presenting the chemical compositions of the all slag samples. The table presents only the major slag components (SiO2, MnO, Cr2O3, Al2O3, CaO, MgO, FeO and TiO2). Other components, which totally were less than 1 wt% of the slag, were neglected. Totally 4 heats (8 samples) out of 14 heats were chosen for in-depth investigations. The selected heats are marked with * in Table 2. Two heats (pair samples: 6A-6B and 11A-11B), which have a composition near to the averaged composition, with a basicity around 1.5, represent the normal EAF operation. The definition of the slag basicity is given by Equation 2:
2SiOCaOB
%%
= (2)
where %CaO and %SiO2 are the percentages of CaO and SiO2 in the slag in wt%.
Table 2. The composition of the slag samples and the averaged values (AISI 304L), in wt%. No. Samples SiO2 MnO Cr2O3 Al2O3 CaO MgO FeO TiO2 Basicity (B)
1 1A 29.3 2.7 8.8 2.9 49.6 4.9 2.1 0.7 1.69 1B - - - - - - - - -
2 2A 29.4 3.2 8.1 3.4 46.7 7.2 1.6 0.6 1.59 2B 31.2 2.2 4.8 3.3 49.7 8.36 1.0 0.6 1.59
3 3A 31.3 3.1 5.2 4.3 47.7 6.1 1.0 0.9 1.52 3B 31.4 2.3 4.4 4.1 48.4 6.8 1.3 0.8 1.54
4 4A 31.8 3.2 5.0 5.6 45.8 5.9 1.0 0.8 1.44 4B - - - - - - - - -
5 5A 29.3 3.0 5.7 3.7 51.0 4.6 1.3 0.8 1.74 5B 32.1 2.6 4.9 3.9 47.4 5.9 1.6 0.8 1.48
6*
6A 31.4 2.2 4.9 3.6 48.5 6.2 1.7 0.8 1.54 6B 33.4 1.9 3.7 3.5 48.9 6.2 1.0 0.8 1.46
7 7A 33.2 3.2 6.4 3.6 45.7 5.2 1.1 0.8 1.38 7B 33.0 3.0 6.1 3.5 46.1 5.4 1.2 0.8 1.40
8*
8A 32.2 3.4 7.4 3.2 44.7 7.1 1.2 0.8 1.39 8B 31.9 3.3 7.2 3.1 44.5 7.3 1.3 0.8 1.39
9 9A 32.1 2.4 4.6 4.6 47.3 6.5 0.9 0.6 1.47 9B - - - - - - - - -
10*
10A 25.6 1.4 3.3 7.6 48.6 10.8 1.3 1.2 1.90 10B 27.3 0.9 1.8 7.8 50.0 10.0 0.6 1.2 1.83
11*
11A 33.5 1.5 2.5 4.4 48.1 7.1 0.8 0.6 1.44 11B 34.3 1.4 2.1 4.7 48.4 7.2 0.5 0.6 1.41
Continued on next page...

14
Table 2. Continued.
12 12A 33.3 1.8 3.1 5.5 46.4 7.5 1.0 0.7 1.39 12B 34.0 1.6 2.6 5.3 46.3 8.2 0.7 0.7 1.36
13 13A 34.4 2.5 4.7 5.5 42.8 7.4 1.4 0.6 1.24 13B 33.6 2.2 4.9 5.2 42.8 8.5 1.7 0.6 1.27
14 14A 31.4 1.1 2.2 5.9 50.4 7.2 0.9 0.6 1.61 14B 31.0 1.0 2.4 5.8 49.6 7.6 1.3 0.6 1.60
Minimum values: 25.6 0.9 1.8 2.9 42.8 4.6 0.5 0.6 1.24 Maximum values: 34.4 3.4 8.8 7.8 51.0 10.8 2.1 1.2 1.90 Averaged values: 31.7 2.3 4.7 4.6 47.4 7.0 1.2 0.8 1.51
Standard deviation: 2.07 0.81 2.00 1.32 2.26 1.40 0.36 0.2 0.16 Relative standard
6.53% 35.55% 42.72% 29.03% 4.76% 19.94% 30.47% 3.08% 10.45%
*: Selected samples
To investigate the impact of the composition deviation on the slag microstructure, two other heats (pair samples: 8A-8B and 10A-10B) were selected. In these cases, the slag compositions deviate from the averaged composition. As can be seen in Table 2, samples 8A and 8B contain 7.4 and 7.2 wt% Cr2O3 respectively. This is higher than the averaged value for this component (4.7%). Similarly, the samples 10A and 10B contained higher amounts of MgO (10.8 and 10.0 wt%) and Al2O3 (7.6 and 7.8 wt%), in comparison to the average values which were 7.0 and 4.6 wt%, respectively. Table 2 shows that, in almost all cases, the second sample (samples marked with B) taken from each heat has a lower Cr2O3 content than the first sample (samples marked with A) from the same heat. This difference, which has been up to 3 wt%, is most likely due to the injection of nitrogen into the steel melt. This enhances the kinetics of chromium recovery by locally mixing the steel and slag. The measured temperatures of the samples for the selected heats are presented in Table 3. As can be seen, the minimum measured slag temperature is 1653 oC (sample 10A) and the maximum measured temperature is 1708 oC (sample 8b).
Table 3. The selected slag samples temperatures, in oC. Heat Samples Slag Temperature*
6 6A 1660 6B 1678
8 8A 1685 8B 1708
10 10A 1653 10B 1667
11 11A 1703 11B 1689
Average temperature of A samples: 1675 Average temperature of B samples: 1686
*: It was assumed that the slag temperature is 50 oC higher than the measured steel temperatures.
4.1.2 SEM-EDS and LOM observations A summary of the optical microscopic observations in the slag samples are presented in Table 4.
Table 4. Optical microscopic observations in the slag samples (AISI 304L). Phases or Particles Slag Samples 6A 6B 8A 8B 10A 10B 11A 11B Darker Matrix x x x x x x x x Bright large angular particles(>5 μm) A few A few x x - - A few A few Bright small angular particles(<5 μm) x x x x x A few x x Bright elongated particles x - x x x - - - Bright dendritic phase x x x x x - x x Metallic spherical particles x x x x x x x x Void x x x x x x x x

15
As can be seen, samples 8A and 8B with a higher chromium-oxide content (Table 2) contain both small and large angular particles. Some of these large angular particles are shown in Figure 5. However, the other samples contain no or just a few large sharp-cornered particles. In some samples with a high chromium-oxide content (not less than 3 wt%) some elongated particles are also observed (see Figure 6). Considering the uneven distribution of large angular particles in the matrix phase, the author believes that these particles have existed in the liquid slag at the process temperatures.
Figure 5. Optical microscopic image - Large angular particles.
Figure 6. Optical microscopic image - Elongated particles.
The chemical compositions of the small angular particles (<5μm), analyzed by EDS, are presented in Table 5. The compositions are normalized to 100%, by considering the following

16
major components; Mg, Al, Ti, Cr, Mn, Fe and O. The result reveals that these particles are mainly composed of chromium, magnesium and oxygen. The composition and angular shape of these particles correspond to the spinel phase with a chemical simplified formula of (Mg2+, Fe2+, Mn2+, Ti4+, Cr2+)(Cr3+, Fe3+, Al3+)2O4. The general formulation of the spinel is A2+B2
3+O4, where A and B are divalent and trivalent cations, respectively [21, 22]. Spinels crystallize in octahedral habits, which is the explanation behind the angularity of the cross section of these particles [21].
Table 5. Averaged composition of the small (<5μm) angular particles, in wt%. Samples Mg Al Ti Cr Mn Fe O
6A 8.3 5.0 0.7 26.6 3.2 2.6 53.6 6B 7.2 5.3 1.8 32.0 5.5 2.3 45.9 8A 6.3 2.9 1.1 51.2 8.3 2.2 28.0 8B 6.5 2.8 0.5 50.0 8.0 2.3 29.9
10A 10.4 3.4 0.3 21.9 1.6 0.5 61.9 10B 9.9 4.0 0.3 20.5 2.1 0.1 63.1 11A 8.0 5.0 1.0 25.7 3.1 3.8 53.4 11B 10.6 4.0 0.5 35.5 2.7 0.6 46.1
Table 6 shows compositions of the spinel particles, with a diameter larger than 5 μm. As can be seen in Table 4, some of the samples contain almost no (10A and 10B) or a few (6A, 6B, 11A and 11B) spinel particles. These large particles also contain high amounts of chromium (36-61 wt%), magnesium (7-11 wt%) and oxygen. Similar to for the small angular particles, these particles also contain some amounts of aluminium, manganese, iron and titanium, as seen in Table 6.
Table 6. Averaged elemental composition of the large (>5μm) angular particles, in wt%. Samples Mg Al Ti Cr Mn Fe O
6A 9.6 5.9 1.4 38.6 4.4 2.7 37.4 6B 10.3 6.7 1.9 33.5 3.5 1.5 42.6 8A 6.3 1.8 0.5 60.7 7.2 1.8 21.7 8B 7.1 1.3 0.4 56.0 5.7 1.5 28.0
10A - - - - - - - 10B - - - - - - - 11A 10.0 3.3 1.1 39.3 3.0 0.8 42.5 11B 10.6 4.2 0.4 36.1 2.6 0.8 45.3
The measured values, representing the chemical compositions of the angular particles, were normalized to 100%, by including only chromium-, magnesium- and aluminium oxide as the major structural components in these particles. In other words, it was assumed that the spinels are constituted of Cr2O3, MgO and Al2O3, which is not the case in reality. The results are plotted in the Al2O3-Cr2O3-MgO ternary oxide system diagram [23] and are illustrated in Figures 7a & 7b. The bold dots in the diagrams represent the compositions of the angular particles. The figures show that these particles are placed in the upper side of the spinel phase area or very close to that. This area is shaded in gray in the diagram. Examination of the ternary diagram reveals that the spinel phase area is a solid solution of MgO·Cr2O3 and MgO·Al2O3.

17
a. Chemical composition of the small spinels (<5μm)
b. Chemical composition of the large spinels (>5μm)
Figure 7. Chemical composition of the spinel particles – Plotted on the Al2O3-Cr2O3-MgO ternary oxide system diagram.
In contrast to the large spinels (>5μm), the small-size spinels (<5μm) are well-distributed in the slag matrix. This shows that it is likely that at least some of these small spinel particles were precipitated during solidification of the slag samples.
Metallic droplets in the slag matrix are shown in Figure 8. These spherical droplets were most likely splashed from the melt bath into the slag layer during the melting process. Electrode heating has a great effect on the splashing of droplets into the slag layer [24]. As can be seen in Figure 8, the droplets are of different sizes. SEM analyses showed that almost all of the droplets are in the size range of a few tenths of a micron to a few microns, in diameter. However, some larger droplets can also be found, even with a size of up to 75 µm in diameter.
Figure 8. Optical microscopic image - Metallic droplets.

18
The droplets were classified into three different groups depending on their sizes: i) smaller than 5μm, ii) between 5 and 20μm and iii) larger than 20μm. These were named small, medium and large droplets. The slag contains a large numbers of small droplets. Interestingly, the population of the medium-size droplets was less than that for large-size droplets. More specifically, the droplets consisted of two main populations i.e. the larger ones (D>20μm) and the smaller ones (D<5μm). Several droplets (5-60 pcs) in every size class were analyzed by SEM-EDS.
Table 7 presents the maximum, minimum and average values of the chromium, iron and nickel contents of the droplets for each class. The chemical compositions were normalized to 100% by only considering the elements chromium, iron and nickel.
Table 7. Chemical composition of the droplets for different size classes, in wt%. Size Classes: D*<5µm 5μm<D<20μm D>20μm
Elements: Cr Fe Ni Cr Fe Ni Cr Fe Ni Maximum Values: 13.6 99.5 10.0 10.5 97.2 7.7 15.0 83.3 46.4 Minimum Values: 0.0 86.4 0.0 0.4 82.7 1.2 4.0 49.2 4.9 Averaged Values: 4.2 93.1 2.7 7.9 88.5 3.6 8.8 68.0 23.2
* D: Diameter
Interestingly, no droplet with the main stainless steel AISI 304L chemical composition (Ni=8-12, Cr=18-20 wt%) could be found. While the chromium content of the steel bath was about 18 wt%, no droplet with chromium contents higher than 15 wt% could be observed. Although the chemical composition of the droplets in the same size group varies considerably from each other, it can be seen that, on average, large droplets contain more nickel and chromium than smaller droplets. In some cases, large droplets with a very high nickel content (up to 46 wt%) could be observed. A possible explanation for this could be that the chromium and iron have higher affinity to oxygen than nickel has. This means that chromium and iron are oxidized before nickel, which leads to a temporary increase of nickel in the droplets. In addition, a high temperature together with a large contact surface area between the reactants, which are both in liquid form, can considerably improve the kinetics of the reactions. Furthermore, the composition of the droplets in the slag samples also depends on the length of the period of time that they have been in contact with the liquid slag, before the sample solidified.
Figure 9 shows a typical dendritic-shaped phase in the slag which is brighter than the matrix. It is believed that this kind of microstructure is evolved during the solidification period and that it does not exist at process temperatures. The result of SEM-EDS analyses showed that the composition of this phase is very similar to spinel particles. More specifically, they are mainly composed of chromium, magnesium, aluminium and oxygen. This similarity implies that these dendrites are secondary spinels which have formed during cooling. Here, it should be noticed that the size and the shape of the dendrites have been found to be dependent on the cooling rate of samples [25].

19
Figure 9. Optical microscopic image – Typical dendritic pattern.
Another microstructure that is also formed during solidification, in some areas of the slag samples, is presented in Figure 10. Two different phases can be distinguished in this structure. The darker phase, marked with “M”, is composed mainly of magnesium, silicon and calcium and oxygen. The composition corresponds to the merwinite phase (3CaO·MgO·2SiO2). In contrast to the merwinite phase, the areas that are marked with “G” contains larger amounts of aluminium (4-10 wt%) and lower amounts of magnesium (0-2 wt%). This phase is mainly composed of silicon, calcium, aluminium and oxygen. The chemical composition of this phase corresponds to the melilite-type compounds and specifically gehlenite (2CaO·Al2O3·SiO2). The position of Al in this compound can be occupied by other elements such as Si, Mn, Fe and Mg.
Figure 10. Backscattered electron image - Darker crystals (marked with M) are merwinite and brighter areas (marked with G) are gehlenite.
4.1.3 Thermodynamic determinations Thermodynamic calculations were performed using the software package Thermo-Calc, version TCCR [15] together with database TCMSI1. In Table 8, a summary of the results is presented.

20
Table 8. Thermodynamic calculations results - Phases theoretically predicted in the slag samples. Phases (amounts in wt%)
Samples Sampling temperature
Liquid Oxides Picrochromitea MgCr2O4
Larniteb Ca2SiO4
Merwinitec Ca3MgSi2O8
Gehlenited Ca2Al2SiO7
Rankinitee Ca3Si2O7
6A 1660 x (88.2) x (5.7) x (6.1) - - - 6B 1678 x (95.9) x (4.1) - - - - 8A 1685 x (91.3) x (8.7) - - - - 8B 1708 x (91.6) x (8.4) - - - -
10A 1653 x (96.8) x (3.2) - - - - 10B 1667 x (98.7) x (1.3) - - - - 11A 1703 x (97.5) x (2.5) - - - - 11 B 1689 x (98.0) x (2.0) - - - -
a Magnesiochromite (spinel) b Dicalcium silicate c Calcium magnesium silicate d Calcium alumina silicate e Tricalcium silicate
x = Phase exists in the slag at sampling temperature - = Phase does not exist in the slag at sampling temperature () = Amount of the phase in wt%
The calculations are based on the assumption that at the sampling temperature, the phases in the slag are in thermodynamic equilibrium with each other. In addition, it was assumed that all phases are in their stoichiometric compositions. For instance, in reality, the MgCr2O4 spinel is not a stoichiometric compound but a solid solution. As can be seen in Table 8, all the slag samples contain the spinel phase. The samples 8A and 8B have the highest content of spinel, 8.7 and 8.4 wt%, respectively. By looking at Table 4, it can be seen that these are in agreement with the LOM observations. On the other hand, the spinel content of the slag sample 10B is low (1.3 wt%), which can very well justify why almost no spinel particles could be found in this specific sample.
Corresponding to the thermodynamic calculations, sample 6A is the only sample that contains dicalcium silicate at the process temperature. However, this could not be verified by petrography. Others phases, listed in Table 8 (merwinite, rankinite and gehlenite), are the phases which are not thermodynamically stable at the sampling temperatures. However, at lower temperatures, they are also stable.
Figure 11 illustrates the phase distribution diagram for sample 6A as a function of temperature. The first crystalline phase that precipitates from the liquid slag is a magnesiochromite spinel (MgCr2O4). Around 1960 K (1690 oC), the crystallization of dicalcium silicate (2CaO·SiO2) initializes followed by the crystallization of the calcium magnesium silicate (3CaO·MgO·2SiO2) at around 1735 K (1460 oC). The vertical line in the diagram presents the sampling temperature (T=1933 K). It is seen that at the process temperature the slag is composed of a liquid part, magnesiochromite spinels and dicalcium silicates.

21
Figure 11. Thermodynamic Calculations - Sample 6A - Weight percent of the phases in the slag versus temperature.
Figures 12a & 12b shows the same diagram but for the samples 8A (the sample with the highest Cr2O3 content) and 10B (the sample with a high MgO content (10.0 wt%) and with the lowest Cr2O3 content).
In Figure 12a, it is seen that, at process temperatures (marked with a dotted line), slag contains around 9 wt% spinel. Sample 10B (Figure 12b), on the contrary, contains only around 1 wt% spinel which is due to a lower content of Cr2O3 content in this sample. In addition, for sample 10B, the MgO precipitation could be observed at temperatures below 1850 K (1577 oC). See Figure 12b. This is obviously related to the high MgO contents of this sample, as seen in Table 2.

22
a. Sample 8A
b. Sample 10B
Figure 12. Thermodynamic Calculations - Samples 8A and 10B - Weight percent of the phases in the slag versus temperature. As discussed in the introduction of the thesis, a moderate amount of solid particles in the slag leads to a higher foaming index. When the chromium content of the slag greatly exceeds the solubility limit of the slag, the precipitated particles become more and larger. These oversized particles are detrimental to the foamability of the slag. In other words, the amount of spinel precipitates has an optimum value, leading to the highest foaming index. In this regard, the influence of the slag temperature, basicity, MgO content and Cr2O3 content on the amount of spinel precipitation was investigated. The results are presented in Figures 13a-13d. When drawing these diagrams, the slag composition is set to the average composition of the slag samples (Table 2). In Figures 13a, 13b & 13c, the composition range of the Cr2O3 in the samples is shaded in light gray. Similarly, in Figure 13d, the composition range of MgO is also shaded. Figure 13a presents the effect of the process temperature on the amount of spinel particles in the slag. It can be seen that by increasing the slag temperature from 1550 oC to 1750 oC the weight percent of the spinel phase is reduced slightly. This decrease is due to the increase
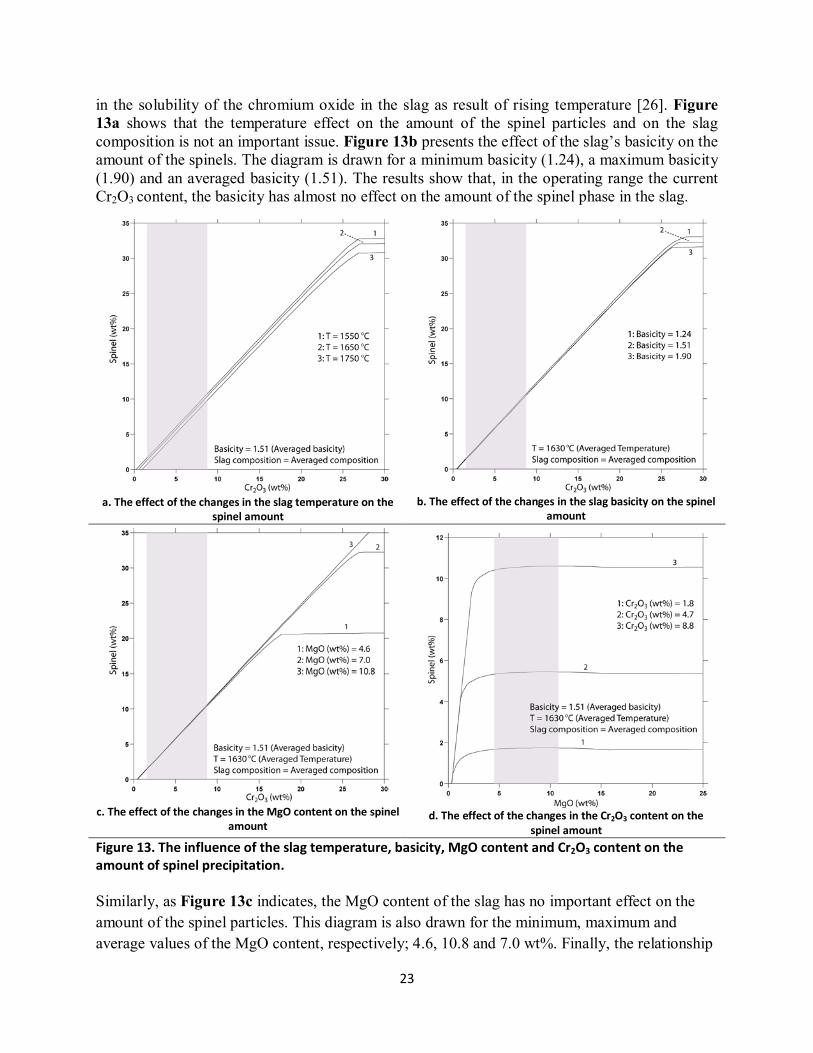
23
in the solubility of the chromium oxide in the slag as result of rising temperature [26]. Figure 13a shows that the temperature effect on the amount of the spinel particles and on the slag composition is not an important issue. Figure 13b presents the effect of the slag’s basicity on the amount of the spinels. The diagram is drawn for a minimum basicity (1.24), a maximum basicity (1.90) and an averaged basicity (1.51). The results show that, in the operating range the current Cr2O3 content, the basicity has almost no effect on the amount of the spinel phase in the slag.
a. The effect of the changes in the slag temperature on the
spinel amount
b. The effect of the changes in the slag basicity on the spinel
amount
c. The effect of the changes in the MgO content on the spinel
amount
d. The effect of the changes in the Cr2O3 content on the
spinel amount Figure 13. The influence of the slag temperature, basicity, MgO content and Cr2O3 content on the amount of spinel precipitation. Similarly, as Figure 13c indicates, the MgO content of the slag has no important effect on the amount of the spinel particles. This diagram is also drawn for the minimum, maximum and average values of the MgO content, respectively; 4.6, 10.8 and 7.0 wt%. Finally, the relationship

24
between the amount of the spinel particles and the chromium-oxide content of the slag is demonstrated in Figure 13d. This diagram is drawn for the minimum (1.8 wt%), maximum (8.8 wt%) and the average (4.7 wt%) value of the Cr2O3 content in the slag. It can be seen that the amount of the spinels increases enormously with an increase in the chromium-oxide content. More specifically, by increasing the Cr2O3 content in the slag from 1.8 to 8.8 wt%, the amount of spinels increases from about 2 to over 10 wt%. By comparing Figures 13a-13d, it can be concluded that the only critical parameter affecting the amount of solid spinel particles is the chromium-oxide content of the slag. Considering the dependency of the foaming index on the amount of the solid particles in the slag [7, 9], it can be deduced that the foaming index is critically dependent on the chromium-oxide content of the slag. In other words, one of the main controlling tools to optimize the slag foamability and thereby the foaming index could be the content of the chromium oxide in the slag.
4.2 Petrographical study of the microstructural evolution of the duplex steelmaking slags (Supplement 2)
4.2.1 Global slag composition The compositional evolution of the slag during the duplex steelmaking was determined by multiple sampling in the EAF. The measured values presenting the compositional range of the slag samples taken at different sampling moments are presented in Table 9. It shows only the major slag components (SiO2, MnO, Cr2O3, Al2O3, CaO, MgO, FeO and TiO2). Other components, which totally were less than 1 wt% of the slag, were neglected.
Table 9. Compositional evolution of the bulk slag (in wt%), average temperature (in oC) and the basicity (CaO/SiO2) of the slag samples during different EAF process stages.
Sample Sampling Moment SiO2 Cr2O3 Al2O3 CaO MgO TiO2 MnO FeO Basicity
(Average) Temperature*
(Average)
A Before FeSi-injection 25-33 (29.8)
10-21 (14.7)
2-3 (1.9)
38-47 (42.5)
3-4 (3.4)
<1.5 (1.1)
2-6 (3.8)
2-6 (2.5)
1.44 1664
B After FeSi-injection 31-36 (34.0)
3-9 (5.4)
2-3 (2.1)
43-50 (47.3)
4-6 (5.3)
<1.5 (1.0)
2-3 (2.4)
1-3 (1.4)
1.40 1726
C Before tapping 31-36 (33.1)
2-7 (4.6)
2-3 (2.1)
46-54 (49.6)
5-6 (5.5)
<1.5 (1.0)
1-3 (1.8)
1-2 (1.1)
1.48 1756
*: It was assumed that the slag temperature is 50 oC higher than the measured steel temperatures. (): Average value
The Cr2O3 content is at its highest level (10-21 wt%) during the oxygen injection and prior to the FeSi-injection. However, it drops to considerably lower levels (3-9 wt%) after the FeSi-injection. Since the silicon has a greater affinity to oxygen, it can reduce the chromium oxide and revert back the chromium to the steel bath. The reduction of chromium oxide by silicon can be expressed by Equation 3 [27].
2Cr2O3, slag + 3Sisteel = 4Crsteel + 3SiO2, slag (3)

25
As can be seen, in this reaction SiO2 is generated. This is the reason for that SiO2 levels rise continuously in the slag (Table 9). In contrast to the FeO and MnO levels, the MgO levels increase as the process proceeds. This is most likely due to the dissolution of the MgO from the refractory of the furnace into the slag.
In addition, Table 9 shows that the average basicity of the slag, after the FeSi-injection, drops from an initial value of 1.44 to a value of 1.40. This is due to the increase in SiO2 levels. Thereafter, the basicity again rises to 1.48, as seen in Table 9. This is due to the increase in the CaO level. An explanation for this increase could be that, as the slag temperature rises from 1726 oC to 1756 oC, the dissolution rate of undissolved CaO, which is in a dicalcium silicate form [28], increases. Undissolved CaO is mostly accumulated far from the centre of the furnace [29]. As a result of an increased CaO dissolution, the slag in the centre region of the furnace becomes richer in CaO. Considering that the slag samples were taken from a region near to the middle of the furnace, it is reasonable that the CaO content in the samples increases to some extent (2-3 wt%) with an increased temperature, as shown in Table 9.
4.2.2 SEM-EDS and LOM observations Figure 14 shows a typical microstructure of slag samples. Similar to austenitic stainless steel slags, duplex steel slag also mainly consisted of a darker matrix, angular spinel particles, spherical metallic droplets and black voids. Apart from these phases and particles, which are common between austenitic stainless steel slags and duplex steel slags, some other phases and structures were observed in the duplex steelmaking samples. These phases will be discussed in detail in the following parts. The most important primarily precipitated phases are as follows; i) Magnesiochromite spinels (MgO·Cr2O3), ii) Calcium chromite (CaO·Cr2O3), iii) Perovskite (CaO·TiO2), and iv) Dicalcium silicate (2CaO·SiO2). In addition, the bulk slag matrix will also be discussed. Here again, the secondary-precipitated merwinite phase could be detected in all samples, except in the A-samples.
Figure 14. Optical microscopic image – A typical microstructure of the EAF slag samples (84167C).
4.2.2.1 Magnesiochromite Spinels (MgO·Cr2O3) Once more, the angular shape spinels could be found in all the slag samples. These angular particles, which are normally unevenly distributed within the slag samples, have existed in the

26
liquid slag at the process temperatures. The precipitation and dissolution of the magnesiochromite spinels can be presented by Equation 4. It should be considered that magnesiochromite spinel is not a stoichiometric compound [2].
MgO (l, slag) + Cr2O3 (l, slag) = MgO·Cr2O3 (s) (4)
The observed angular spinels were in different sizes (from less than 2 µm to larger than 20 µm in diameter). The size of the spinels is dependent on the slag temperature, the retention time of the spinels in the slag and the oxygen partial pressure [30]. More specifically, by increasing the temperature, the retention time and the oxygen partial pressure, the size of spinel crystals increases [30]. It should be mentioned that, during the sampling period, it was experienced that before FeSi-injection, at the time that the Cr2O3 content is at its highest level (10-21 wt%), the slag has a high viscosity. The A-samples indicated that the slag contained large amount of undissolved particles. Qualitatively expressed, petrographic investigations showed that the amount of the spinel particles increased with an increased chromium-oxide content of the sample. As mentioned before, in contrast to the angular spinels, the dendritic spinels evolve continuously during solidification and do not exist at process temperatures [30]. This is despite that the chemical compositions of the dendritic and angular spinels were fairly similar.
Table 10 shows the averaged composition of the large spinels (> 15 µm) in the slag at three different stages of the process. The compositions are normalized to 100%, by considering the following major components; Cr, O, Mg, Al, Ti, Mn, Fe and Ca. Although the compositional heterogeneities of the spinels from one and the same slag sample (Table 10), the angular shape and the composition of these particles correspond to the magnesiochromite spinels (MgO·Cr2O3). As can be seen, here again, the spinels particles are solid solutions with a chemical simplified formula of (Mg2+, Fe2+, Mn2+, Ti4+, Ca2+, Cr2+)(Cr3+, Fe3+, Al3+)2O4.
Table 10. Averaged elemental composition (in wt%) of the large spinel particles in three different sampling moments.
Sample n* O Mg Al Ca Ti Cr Mn Fe 84142A 24 13.3 (1.1) 8.9 (0.5) 0.7 (0.2) 1.2 (0.5) 0.3 (0.2) 62.2 (1.6) 8.0 (0.7) 5.5 (1.7) 84142B 9 19.8 (0.8) 9.8 (0.1) 1.3 (0.1) 0.1 (0.2) 0.7 (0.1) 59.2 (0.8) 5.6 (0.2) 2.7 (0.2) 84142C 17 12.0 (1.5) 10.5 (0.4) 1.3 (0.2) 0.9 (0.3) 0.9 (0.3) 64.8 (1.5) 6.5 (0.4) 3.2 (0.5)
*: n represents the number of large spinels analyzed in each sample. (): Numbers in parentheses indicate the average standard deviation of the analyses performed on a slag sample.
While the MgO content of the spinels increases continuously, the Cr2O3 content of the large spinels drops initially after FeSi-injection due to reaction (3). Thereafter, it rises again towards the end of melting process. Toppani et al. [30] have shown that the content of different oxides within the spinel crystals is strongly influenced by the oxygen partial pressure and the temperature. Furthermore, the duration of the existence of the spinel particles in the slag also have an effect on their composition. However, a more detailed discussion of these influences on the spinel composition is beyond the scope of this study.
4.2.2.2 Calcium Chromite (CaO·Cr2O3) In contrast to the magnesiochromite, which is a solid solution [2], calcium chromite is a stoichiometric compound [23, 31]. As illustrated in Figure 15, this compound could be observed

27
in the slag samples taken before the FeSi-addition (A samples), where the chromium-oxide content is high (10-21 wt%) and the MgO content is at its lowest level (3-4 wt%). See Table 10.
Figure 15. Backscattered electron image – Calcium chromite crystals (84142B). CC: Calcium Chromite crystals (CaO·Cr2O3)
An averaged chemical composition of this phase in one slag sample can be seen in Table 11. The proportions of the chromium, calcium and oxygen atoms in the observed crystals strongly correspond to the stoichiometric calcium chromite phase.
Table 11. Averaged elemental composition (in wt%) of calcium chromite crystals analyzed in the sample 84147A, in comparison to stoichiometric composition (in wt%) of calcium chromite.
Elements: O Mg Al Si Ca Ti Cr Fe 84147A 32.9 0.5 0.2 0.1 18.9 0.1 47.3 0.6
Theoretical stoichiometric composition 30.8 0.0 0.0 0.0 19.3 0.0 50.0 0.0
García-Ramos et al. [32] have shown that the standard Gibbs free energy for the formation of MgO·Cr2O3 is more negative than that for CaO·Cr2O3. Thereby, the formation of magnesiochromite is favoured over the formation of calcium chromite. Thus, it will occur earlier than the precipitation of CaO·Cr2O3. However, as reaction (4) proceeds, the MgO level and, correspondingly, its activity in the slag decreases. Thereby it will reduce the possibility of reaction (4) to take place. At this step, unreacted Cr2O3 in the slag reacts with CaO and forms CaO·Cr2O3. This reaction is illustrated by Equation 5:
CaO (l, slag) + Cr2O3 (l, slag) = CaO·Cr2O3 (s) (5)
4.2.2.3 Perovskite (CaO·TiO2) Perovskite with the overall chemical formula of CaO·TiO2 was observed in the samples with a higher slag basicity (> 1.55). As can be seen in Table 12, apart from Ca and Ti, perovskite crystals contain also noticeable amounts of other elements, especially Si. The general chemical formula of perovskite is reported as (Ca, Mg, Al, Fe)(Ti, Al, Si)O3 [33].

28
Table 12. Averaged elemental composition (in wt%) of perovskite crystals analyzed in the sample 84147B.
Sample O Mg Al Si Ca Ti Cr Mn Fe 84147B 26-35 2-4 1-5 10-15 31-40 9-14 0-3 1-2 1-4
Figure 16 shows perovskite crystals in the slag, adjacent to magnesiochromite spinels. The observed crystals were often finer and brighter than magnesiochromite crystals. The diameter of these crystals was less than 10 µm. Like magnesiochromite spinels, perovskite crystals were also unevenly distributed in the slag matrix (Figure 16). This implies that the crystals were most likely formed before the sample solidified. Perovskite is produced in the molten slag by the combination of Ca2+ and TiO3
2- [34].The reaction is illustrated by Equation 6:
Ca2+ + TiO32- = (CaO·TiO2) (6)
It has been reported that the precipitation and growth of perovskite crystals is promoted with an increased slag basicity [34, 35]. This is in accordance with that observed in this study as the perovskite crystals were only found in the samples with a higher slag basicity (> 1.55).
Figure 16. Backscattered electron image – Perovskite crystals in comparison with magnesiochromite spinels (84147B). CT: Perovskite crystals (CaO·TiO2) MC: Magnesiochromite spinels (MgO·Cr2O3)
4.2.2.4 Dicalcium Silicate (2CaO·SiO2) Dicalcium silicate was detected by SEM-EDS analyses in all the slag samples. The crystals contained high amounts of Ca, Si and O, which corresponds to calcium silicate phases. The composition was most consistent to dicalcium silicate (2CaO·SiO2). As can be seen in Figure 17a, the dicalcium silicate crystals have grown evenly and collided with each other, resulting in clear borders between the particles. This very likely indicates that the crystals were formed after sampling. However, in a few cases, clustered and unevenly distributed dicalcium silicate crystals could be observed also. These crystals, most likely, were precipitated in the slag before

29
sampling. Figure 17b shows primary precipitated dicalcium silicate particles. No clear compositional difference could be distinguished between these two types of microstructure.
a. Dicalcium silicate crystals: Precipitated during solidification (84147A)
b. Primary dicalcium silicate crystals and clusters: Existed in the bulk slag before sampling (84142A)
Figure 17. Backscattered electron images - Dicalcium silicate crystals. DS: Dicalcium Silicate (2CaO·SiO2)
Park et al. [31] studied an AOD slag with a very similar composition to the present samples from the EAF, especially the A-samples (taken before Fe-Si addition). They detected primary precipitated dicalcium silicate phases in the slag samples using SEM-EDS. It is noteworthy that the slag samples were rapidly solidified by pouring them onto a water-cooled copper plate. Park et al. [31] proposed the general chemical formula of [Ca2+, Mg2+, Mn2+]2SiO2 for the observed dicalcium silicate crystal. However, the author also detected Al, Ti and Cr, in very low amounts, in the analysed dicalcium silicate crystals.
Moreover, it is of interest to mention that some of the slag samples with a higher basicity (> 1.6) disintegrated into a fine powder after the cooling. It is believed that this total disintegration is due to the transformation of the monoclinic β-dicalcium silicate to the orthorhombic γ-dicalcium silicate. This transformation is accompanied with an 11% increase in volume and results in disintegration [36].
4.2.2.5 Matrix Phase Qualitatively expressed, the main constituent of the bulk slag, for a duplex stainless steel slag, is the molten part of the slag. During the solidification procedure, this part of the bulk slag, which is in liquid state at sampling temperatures [2], can completely or partially transform into an amorphous structure depending on the cooling rate [10].
The chemical composition of the glassy matrix was determined to be, more or less, similar to the global composition of the bulk slag [6]. However, the chromium-oxide content in the slag matrix phase was always found to be several weight percent lower than that in the bulk slag. This is due to the concentration of chromium in the chromite crystals [2].
4.2.3 XRD analysis Figure 18 illustrates an XRD pattern of a slag sample taken before FeSi-injection (sample A). Magnesiochromite, calcium chromite phases were clearly detected. These data verify the results

30
from the SEM-EDS determinations fairly well. In contrast to the samples A, the peaks originating from calcium chromite could not be observed in the spectra for other samples. A relative large noise-to-signal ratio (Figure 18), combined with a low amount of perovskite crystals within the slag sample, make it difficult to definitely recognize the characteristic peaks of this phase.
Figure 18. A XRD spectrum of a slag sample taken before FeSi-injection (84197A).
Table 13 summarizes the petrographical observations performed in Supplement 2.
Table 13. A summary of the phases and particles identified in the slag samples at different EAF process stages.
Primary phases and particles
Process stage Glassy matrix Magnesiochromite
(MgO·Cr2O3) Calcium chromite
(CaO·Cr2O3) Perovskite (CaO·TiO2)
Dicalcium silicate (2CaO·SiO2)
Metallic droplets
Before FeSi-addition X X X X* X** X After FeSi-addition X X - X* X** X
Before tapping X X - X* X** X X = Phase exists in the slag - = Phase does not exist in the slag * = Phase observed in the slags with a basicity higher than 1.55 ** = It is possible that a part of or the whole precipitation has occurred during the solidification

31
4.3 Determination of the microstructural evolution of the duplex steelmaking slags using computational thermodynamics (Supplement 3)
4.3.1 A Comparison between modified and unmodified version of TCMSI1
As mentioned before, the unmodified version of TCMSI1 [19] had been used by the author to perform thermodynamic calculations on EAF stainless steelmaking slags (Supplement 1). In order to compare and assess the validity of the gained results, some of the performed calculations in that study were repeated by using the Thermo-Calc ver. TCCS equipped with a modified version of TCMSI1. It was shown that, the presented data in Supplement 1 is in a fairly good agreement with the results achieved when using the modified version of TCMSI1. It should be noted that, in Supplement 1, the slag at the refining stage of the EAF austenitic stainless steelmaking was investigated. In this stage the chromium-oxide content of the slag is much lower (around 10 wt% lower) than that before the FeSi-addition to the furnace. In other words, it could be proved that the modified version of the TCMSI1 database can also be used for EAF austenitic steelmaking slags.
Figure 19 illustrates two phase distribution diagrams for an EAF standard stainless steelmaking slag sample (Supplement 1, sample 8a) taken after FeSi-injection. One calculated by using the unmodified version of TCMSI1 and the other by using the developed version of TCMSI1, respectively Figures 19a & 19b. As can been seen, the trends in the diagrams, in general, are very similar to each other. Furthermore, the amounts of the spinel phase at T=1958 K have very similar values. However, a closer consideration reveals that the melting point of the spinel phase (line 2) differs slightly in the two diagrams.
It should be mentioned that Figure 19a is actually the same as Figure 12a which was discussed in a previous section. The figure is repeated here in order to make the comparison more convenient.
a. Calculated by unmodified TCMSI1. b. Calculated by modified TCMSI1.
Figure 19. Phase distribution diagrams drawn for a typical EAF standard stainless steelmaking slag.
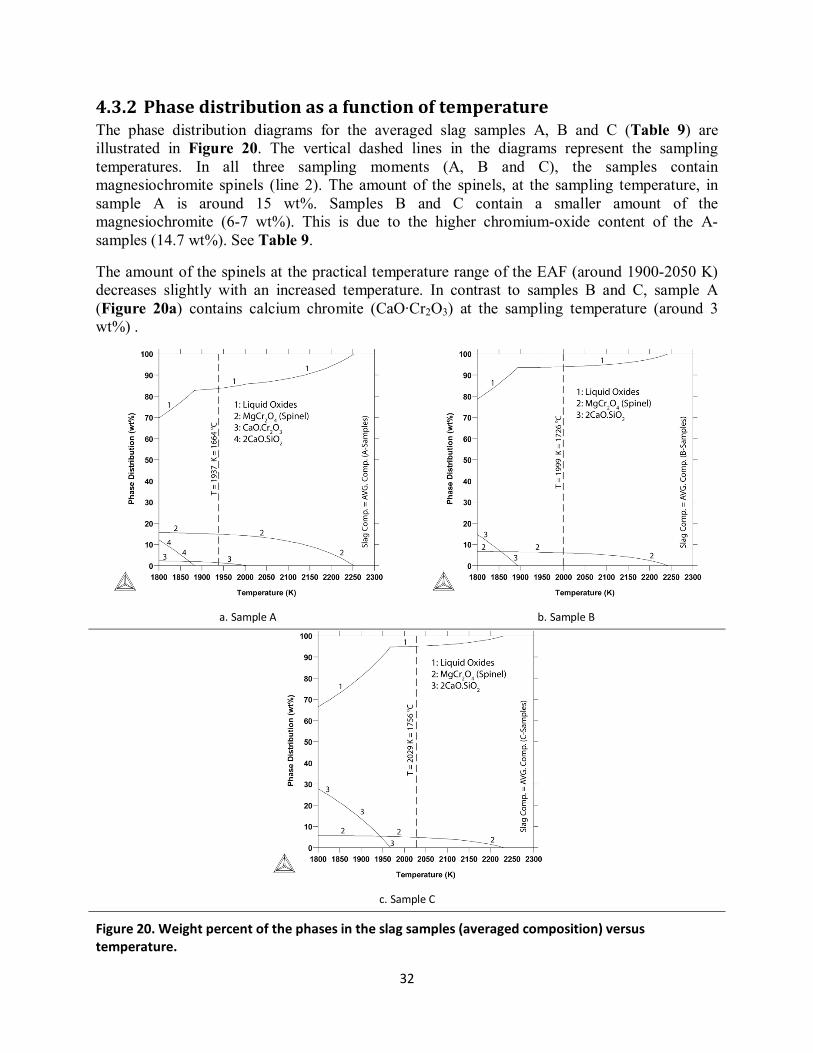
32
4.3.2 Phase distribution as a function of temperature The phase distribution diagrams for the averaged slag samples A, B and C (Table 9) are illustrated in Figure 20. The vertical dashed lines in the diagrams represent the sampling temperatures. In all three sampling moments (A, B and C), the samples contain magnesiochromite spinels (line 2). The amount of the spinels, at the sampling temperature, in sample A is around 15 wt%. Samples B and C contain a smaller amount of the magnesiochromite (6-7 wt%). This is due to the higher chromium-oxide content of the A-samples (14.7 wt%). See Table 9.
The amount of the spinels at the practical temperature range of the EAF (around 1900-2050 K) decreases slightly with an increased temperature. In contrast to samples B and C, sample A (Figure 20a) contains calcium chromite (CaO·Cr2O3) at the sampling temperature (around 3 wt%) .
a. Sample A b. Sample B
c. Sample C
Figure 20. Weight percent of the phases in the slag samples (averaged composition) versus temperature.

33
According to these diagrams, the dicalcium silicate phase (2CaO·SiO2) forms during the solidification of the slag samples. The precipitation temperatures of this phase for each sample are quite near to the sampling temperatures. Later on, it will be shown that the precipitation temperature of the dicalcium silicate phase is very dependent on the slag basicity. Here, the basicity is defined as shown in Equation 2.
In other words, dependent on the slag basicity, the dicalcium silicate phase can exist in the slag even at the time of sampling. As mentioned before, it should be taken into account that these diagrams (Figure 20) are plotted for an averaged slag sample composition (Table 9). Line 1 in the diagrams (Figure 20) represents the liquid (molten) part of the slag. Obviously, the volume of the molten part changes contrary to the amount of solid phases within the slag. Generally, it can be concluded that the results from the thermodynamic calculations, done by Thermo-Calc [15] are in a quite acceptable agreement with the petrographical observations (Supplement 2) summarized in Table 13. As can be seen, the existence of the magnesiochromite, calcium chromite and dicalcium silicate phase are predicted by the computational calculations. The phase distribution diagrams (Figure 20) do not predict the existence of the perovskite (CaO·TiO2) phase in the samples. However, the thermodynamic calculations showed that this phase can be formed in the samples during the solidification and at lower temperatures. For sample A, the precipitation temperature of the perovskite is around 1650 K. This is in agreement with what was observed during the petrographical studies. However, the uneven distribution of the perovskite particles in the samples implied that the phase is in solid state at the sampling temperature.
4.3.3 Phase diagram as a function of the MgO- and Cr2O3 content Figure 21 shows the isothermal phase diagrams for the system Al2O3-Cr2O3-CaO-MgO-SiO2-TiO2. The diagrams illustrate the phases, which the samples are composed of, in a two-dimensional space of the MgO content versus the Cr2O3 content. The slag samples compositions are the averaged composition of the samples taken at each different sampling moment (Table 9). The basicities are kept constant. In addition, the shaded areas illustrate the compositional range of the industrial slag samples. The bold dots represent the exact composition of the slag samples. The arrows in Figure 21c indicate the evolution of the slag during the refining stage in the EAF. Generally, as the refining stage proceeds (from A-samples to C-samples) the scattering of the slag composition (bold dots) decreases. As can been seen in Figure 21a, the chromium-oxide contents of the A-samples are very scattered (from 11 to 23 wt%). In addition, the B-samples (Figure 21b) show slightly more deviation with respect to the MgO content than the A-samples. This can be due to the different dissolution- and/or wearing rate of the refractory of the furnace [28]. The least-scattered slag compositions can be seen in the C-samples (Figure 21c). These samples represent the slag composition prior to the tapping.

34
a. Sample A b. Sample B
c. Sample C
Figure 21. Phase diagrams calculated by Thermo-Calc. ① Liquid oxides + MgCr2O4 + CaO·Cr2O3 + Cr2O3 ② Liquid oxides + MgCr2O4+ CaO·Cr2O3 ③ Liquid oxides + MgCr2O4 ④ Liquid oxides + MgCr2O4+ 2CaO·SiO2 ⑤ Liquid oxides + MgCr2O4+ MgO
The circled letter in the diagrams represents the different phase combinations within the slag samples. Dependent on the chromium- and magnesium-oxide content, the A-samples lie on area ② or ③. This indicates that, dependent on the chromium-oxide content, some of the samples taken before FeSi-injection (A-samples) can contain calcium chromite CaO·Cr2O3. On the other hand, all B- and C-samples are placed within area ③. These samples contain only MgCr2O4 spinels as solid particles at the process temperature. Once again, it should be considered that these diagrams are calculated for the averaged sample compositions (Table 9). By displaying the particular slag composition of the samples (bold dots), the author try to give a general

35
understanding of the slag phase assemblage. These diagrams also visualize the slag composition evolution. It is possible that some of the visualized slag samples have a slightly different solid phase assemblage. As mentioned before, dependent on the basicity and temperature, some samples may contain 2CaO·SiO2.
4.3.4 Effect of the Cr2O3 content on the precipitation of the chromium-containing phases
Figure 22 illustrates the amount of the chromium-containing phases versus the chromium-oxide content of the slag. The diagram is calculated for the averaged composition of the A-samples (Table 9). The basicity and the temperature are kept constant. The shaded area represents the range of the chromium-oxide content (wt%) of the industrial slag samples. As the Cr2O3 level is increased, the very first chromite phase that forms is MgCr2O4 spinel. As can be seen, the precipitation of this spinel can occur at very low amounts of Cr2O3 (>1 wt%). In other words, under these conditions, the maximum solubility of the chromium oxide in the slag is less than 1 wt%. The second phase (CaO·Cr2O3) precipitates when the chromium-oxide content is about 14 wt%. Finally, when the Cr2O3 content of the slag reaches a quite high level (around 29 wt%), the eskolaite phase (solid Cr2O3) begins to separate from the liquid part of the slag.
Figure 22. Chromites precipitations versus Cr2O3 content of the slag.
This diagram (Figure 22) indicates the importance of the Cr2O3 content of the slag as a tool to control the amount of the solid particles within the slag. Moreover, the minimum Cr2O3 content of the slag for the formations of calcium chromite (CaO·Cr2O3) and eskolaite (solid Cr2O3) is illustrated.
4.3.5 Influence of the basicity and the temperature on the amount of dicalcium silicate
As discussed before, dicalcium silicate (2CaO·SiO2) can exist within the slag at the process temperatures. The influence of the temperature and the basicity on the precipitation of this phase is illustrated in Figure 23. In this diagram, the weight percent of the precipitated dicalcium silicate is presented versus the slag temperature. The curves in the diagram represent different

36
slag basicities. In this case, the slag composition is the same as the averaged composition of the B-samples (Table 9).
Figure 23. Precipitation of the dicalcium silicate (2CaO·SiO2) versus temperature at different slag basicity.
The diagram indicates that the slag basicity has a considerable effect on the formation temperature of the solid dicalcium silicate. More specifically, by raising the basicity from 1.3 (line 1) to 1.7 (line 5), the precipitation temperature is increased by about 260 K (from around 1815 to 2075 K). In other words, an increase in the basicity of the slag increases the amount of the solid dicalcium silicate particles within the slag. For instance, at 1950 K, reducing the basicity from 1.7 (line 5) to 1.5 (line 3) corresponds to a large decrease in the amount of the dicalcium silicate phase (from more than 30 wt% to less than 10 wt%). In addition, the temperature also has a large influence on the amount of the dicalcium silicate particles. As can be seen in Figure 23, an increased temperature considerably raises the solubility limit of the dicalcium silicate in the slag.
4.3.6 Influence of the CaO content on the phase distribution In Figure 24, the amount of the precipitated phases at different CaO (and different basicities) contents is illustrated. The diagram is calculated for an average composition of the A-samples (Table 9). The lower Y-axis shows weight fraction of CaO and the upper one presents the respective slag basicity values. As can be seen, the CaO content has almost no effect on the precipitation of the magnesiochromite spinels (MgCr2O4). For lower weight fractions of CaO (around 0.4 and under it), the eskolaite phase (Cr2O3) is stable. When the weight fraction of the calcium oxide exceeds 0.4, the calcium chromite (CaO·Cr2O3) phase begins to form. Furthermore, very soon the eskolaite phase (Cr2O3) disappears from the phase assemblage. The precipitation of the dicalcium silicate (2CaO·SiO2) is initialized as the weight fraction of the CaO exceeds 0.43. As showed in the previous section (Figure 23) and can be seen in the present diagram (Figure 24), the amount of the precipitated dicalcium silicate (2CaO·SiO2) drastically rises with an increased CaO content/slag basicity.

37
Figure 24. Amount of solid precipitates versus CaO content of the slag.
4.4 Influence of slag properties on the amount of solid precipitates in EAF high-chromium steelmaking (Supplement 4)
As discussed and referenced in the introduction section, the total amount of precipitated phases within the slag has a large effect on the slags physical properties such as the viscosity. The viscosity, in its turn, has a considerable effect on the foamability of the slag [7]. In this context, the influences of some of the different process parameters on the total volume of the precipitations were investigated using computational thermodynamics. More specifically, the effects of the chromium- and calcium-oxide content are studied. Moreover, the impacts of the slag basicity and temperature on the precipitation amount are researched. The results are presented and discussed in the following subsections. Here, Thermo-Calc [15] ver. TCCS equipped with database TCMSI1 [19] was used.
4.4.1 Total amount of solid particles vs. Cr2O3 content In Figure 25, the lower Y-axis shows the weight fraction (mass content in %, wt%) of the chromium-oxide content of the slag. The corresponding CaO content is presented on the upper Y-axis. The diagram is plotted for the averaged composition presented in Table 14.

38
Figure 25. Amount of precipitated phases and total amount of solid particles versus Cr2O3- and CaO weight fraction. The basicity of the slag is assumed to be equal to 1.6. This assumption is based on the fact that at this basicity the sample also contains solid dicalcium silicate. In calculating the diagram, it is assumed that the composition (except for CaO, SiO2 and Cr2O3) and the basicity of the slag are constants. Thus, it is obvious that an increase in the Cr2O3 content corresponds to a decrease (non-linear) in the CaO content. One should consider that it also can be the case in practice. This is due to the limited ranges of the appreciate basicities and slag compositions for production conditions.
Table 14. Averaged chemical composition of the slag samples (in wt%), average temperature (in oC) and the basicity (CaO/SiO2)
SiO2 Cr2O3 Al2O3 CaO MgO TiO2 MnO FeO Basicity (Average) Temperature* (Average) 29.8 14.7 1.9 42.5 3.4 1.1 3.8 2.5 1.44 1664
*: It was assumed that the slag temperature is 50 oC higher than the measured steel temperatures.
Figure 25 indicates that as the weight fraction of Cr2O3 rises from zero to higher values, the precipitation of the MgCr2O4 spinels is increased gradually (line 2). Simultaneously, the CaO content of the slag is reduced. This leads to a slight decrease in the amount of the precipitated dicalcium silicates (2CaO·SiO2) (line 1). On the whole, the total amount of precipitated phases (line 4) continuously increases in this period. The precipitation of the calcium chromite (CaO·Cr2O3) phase initializes when the weight fraction of Cr2O3 becomes higher than about 0.14 (line 3). As the volume of the precipitated calcium chromites (line 3) is increased, the amount of the solid dicalcium silicate considerably drops (line 1). This is simultaneous with a decrease in the formation rate of the magnesiochromite spinels (line 2). These changes lead to a fall in the total solid particles amount (line 4) within the slag. This happens at about 0.14 and 0.44 of the weight fraction of Cr2O3 and CaO, respectively. In other words, the total solid particles curve (line 4) has a local maximum at these values. As the weight fraction of the Cr2O3 exceeds 0.19, the dicalcium silicate phase (line 1) totally dissolves in the slag. Thereafter, solid particles within

39
the slag only consist of calcium chromite particles (line 3) and magnesiochromite spinels (line 2). At this stage, the total solid particles amount begins to rise yet again. This results in a local minimum on the total solid particles curve at about a Cr2O3 content of 0.19 and a CaO content of 0.415 (weight fraction). Afterwards, the overall amount of the solid precipitates (line 4) rises continuously with a further increase of the weight fraction of Cr2O3 and a decrease of the CaO content. One should take into account that the drawn diagram represents the changes in the total amount of solid particles for a specific case of slag composition, temperature and basicities. Depending on these factors, this diagram can look different for other cases. In following sections, the influences of the basicity and temperature on the remarkable trend of changes in overall solid particles amount are discussed.
4.4.2 Influence of the temperature on the total amounts of solid particles Figure 26 illustrates the amount of the total solid precipitates versus chromium-oxide content of the slag. The slag composition is an averaged composition of the samples (Table 14) and the basicity of the slag has the fixed value of 1.44 (Table 14). The diagram is plotted for four different slag temperatures (lines 1-4). Line 3 (T=1937K) represents an average of the real temperature of the samples (Table 14).
Figure 26. Total solid particles amount versus weight fraction of Cr2O3 at different slag temperatures.
The maximum and minimum points which discussed in the previous section (total solid particles vs. Cr2O3 content) can only be seen on line 1 and line 2. At higher temperatures (line 3 and line 4), the total amount of precipitated phases continuously rises as the Cr2O3 content is increased. This is due to the fact that the solubility of the dicalcium silicate in the slag is raised with an increased slag temperature. In other words, dicalcium silicate does not form at higher temperatures (line 3 and line 4). This is in agreement with the data reported in Supplement 3.
4.4.3 Influence of the basicity on the total amount of the solid particles Figure 27 shows a diagram illustrating the amount of the total solid precipitates versus the chromium-oxide content of the slag at different slag basicities, namely, 1.44, 1.60 and 1.70. The slag temperature is assumed to be constant and equal to 1937 K. In addition, the slag composition corresponds to an averaged composition illustrated in Table 14. As can be seen

40
(Figure 27), the total amount of solid particles shows no extremum (minimum or maximum) point when the slag basicity equals to 1.44 (line 1). In contrast, the curves show maximum and minimum points at higher basicities (line 2 and line 3). This is due to the precipitation of dicalcium silicate at these basicities (1.60 and 1.70). Considering line 3 reveals that at the chromium oxide weight fraction of about 0.14, the slag may contain more than 25 wt% solid phases. On the contrary, at the same chromium-oxide content (0.14), the slag with a lower basicity (1.44) contains not more than 10 wt% of solid particles (line 1). The diagram (Figure 27) also indicates that when the chromium-oxide content exceeds about 0.20 (weight fraction), line 1 and line 2 almost coincide. Moreover, at higher weight fractions of Cr2O3 (around 0.25) all three curves coincide with each other. As discussed in the previous section (total solid particles vs. Cr2O3 content), an increased Cr2O3 content corresponds to a decreased CaO content. This is due to the constancy of slag basicity and slag composition (except for CaO, SiO2 and Cr2O3) in the calculations. In addition, it was shown (in Supplement 3) that, dependent on the slag temperature, a lower CaO content leads to less or even no dicalcium silicate precipitation. Thus, in this condition, the solid part of the slag only consists of chromite phases. On the other hand, it was shown (in Supplement 1) that, in the operating range of Cr2O3 content, the slag basicity has almost no influence on the volume of magnesiochromite spinels in the slag. This could be an explanation for the observed coincidence (Figure 27).
Figure 27. Total solid particles amount versus weight fraction of Cr2O3 at different slag basicities.

41
4.5 Evaluation and prediction of the foamability of the EAF high-chromium steelmaking slags (Supplement 5)
4.5.1 Determination of the slag’s physical properties
4.5.1.1 Determination of the of total amount of the solid phases within the slag By using computational thermodynamics (Thermo-Calc [15]), the total amounts of the solid precipitates within the industrial slag samples were quantified. In addition, the amount of solid particles for the Kerr and Fruehan’s [7] slag at Cr2O3 content of 5 and 13 wt% and T=1823K were also determined (Table 15). Moreover, the volume fractions of the phases were calculated by using the respective densities at high temperatures. This was performed in order to compare the total solid fraction of the slag in both the experimental and industrial samples.
Table 15 also presents the weight percents and volume fractions of the slag phases for the averaged compositions of the A-, B- and C-samples in the present study. A comparison between the total volume fraction of the solid particles in the averaged-A-samples against Kerr and Fruehan’s slag (at a Cr2O3 content of 13 wt%) reveals that the values are very close to each other (0.12 and 0.13 respectively). According to Kerr and Fruehan [7], this indicates that before FeSi-injection the amount of the solid particles in the EAF duplex steelmaking slag are in a suitable range for a successful foaming-slag practice. In contrast, after the refining stage the foaming index of this slag is decreased. This is due to the fact that after FeSi-injection (B- and C-samples) the volume fractions of the total solid particles are of much lower values, 0.04 and 0.03, respectively. This is also the case for Kerr and Fruehan’s experimental slag at a Cr2O3 content of 5. However, other parameters such as viscosity should also be considered in order to evaluate the foamability of the slag.
Table 15. Weight percents and volume fractions of the phases within the slags. Temperature and global basicity are also presented.
Slag: Avg. A-samples Avg. B-samples Avg. C-samples K&F* (Cr2O3 = 13 wt%) K&F* (Cr2O3 = 5 wt%) Liquid part (wt%)** 83.35 93.93 95.13 83.70 93.82 MgCr2O4 (wt%) 15.00 6.07 4.87 16.30 6.18 CaO·Cr2O3 (wt%) 1.65 0.00 0.00 0.00 0.00 2CaO·SiO2 (wt%) 0.00 0.00 0.00 0.00 0.00 Liquid part (v.f.) † 0.88 0.96 0.97 0.88 0.96 MgCr2O4 (v.f.) 0.11 0.04 0.03 0.12 0.04 CaO·Cr2O3 (v.f.) 0.01 0.00 0.00 0.00 0.00 2CaO·SiO2 (v.f.) 0.00 0.00 0.00 0.00 0.00 Total solid part. (v.f.) 0.13 0.04 0.03 0.12 0.04 Temperature (K) 1919 1999 2027 1823 1823 Global Basicity 1.44 1.40 1.48 1.00 1.00 * Kerr and Fruehan’s slag [7] ** wt%: Weight percent † v.f.: Volume fraction
4.5.1.2 Determination of the apparent viscosity of the slag at the process temperature According to Equation 7 [37], viscosity is another parameter that influences the foamability of the slag. Zhang et al. [37] correlated the foaming index (∑) to the physical properties of the slag

42
and the average size of the gas bubbles (D) in the foam, by a dimensional analysis. In Equation 7, µ is the viscosity, 𝛾 is the surface tension and 𝜌 is the density of the slag.
∑ = 115 µ1.2
𝛾.2𝜌𝐷.9 (7)
Considering that the EAF slag contains solid particles, the apparent (bulk) viscosity of the slag should be taken into account in order to quantify its foamability [7]. The viscosity of the liquid part of the slag (without considering the solid particles) was determined using the software package ThermoSlag (ver. 1.5) [16]. ThermoSlag has, among other functions, the ability to calculate the viscosities of multicomponent oxide slags. The software is linked to a viscosity database and uses the KTH viscosity model [38] to determine the viscosity. The model enables the determination of the viscosity of an Al2O3-CaO- MgO-MnO-SiO2 slag system based on the slag composition and temperature [16].
In order to calculate the viscosity of the liquid part of the slag, the composition of the liquid slag should initially be determined. This was performed using the Thermo-Calc software package [15]. The compositions are illustrated in Table 16.
Due to the lack of the Cr2O3 in the slag database (Al2O3-CaO-MgO-MnO-SiO2), which ThermoSlag (ver. 1.5) is equipped with [16], the effect of this component on the viscosity of the liquid part of the slag could not be taken into account. However, calculations done by Thermo-Calc [15] shows that the main part of the Cr2O3 content exists in the solid particles and that the amount of Cr2O3 in the liquid part of the slags (Table 16) is quite low (0.12 – 2.34 wt%). Similarly, as shown in Table 16, the FeO (0 – 3.24 wt%) and TiO2 (0 – 1.37 wt%) contents are also low and can be neglected.
Table 16. The composition of the liquid part of the slag in wt% (calculated by Thermo-Calc [15]). Normalized to 100% Not included in normalization
Sample SiO2 CaO Al2O3 MgO MnO Cr2O3 FeO TiO2 Avg. A-samples 37.19 54.12 2.57 0.33 5.79 2.34 3.24 1.37 Avg. B-samples 37.39 53.23 2.31 4.43 2.64 0.64 1.51 1.08 Avg. C-samples 35.98 54.72 2.38 4.86 2.06 0.81 1.18 1.07
K&F* (Cr2O3 = 13 wt%) 42.68 42.68 6.24 8.40 0.00 0.14 0.00 0.00 K&F* (Cr2O3 = 5 wt%) 41.50 41.50 6.09 10.81 0.00 0.12 0.00 0.00
* Kerr and Fruehan’s slag [7]
The effect of the suspended solid particles on the viscosity values of the slag samples was determined using Equation 8 [39].
µ = µ0 ∗ (1 + 5.5 ∗ 𝑉𝑓) (8)
Where; µ is the bulk viscosity, µ0 is the viscosity of the liquid part of the slag and 𝑉𝑓 is the volume fraction of the solid particles.
Table 17 presents the viscosity of the liquid part and the calculated apparent viscosity of the slag for the Kerr and Fruehan’s [7] slag samples at Cr2O3=5 and 13 wt% and T=1823K. Table 17 also shows the same quantities for the average compositions of the A-, B- and C-samples.

43
Table 17. Calculated viscosity and apparent viscosity of the slag samples at process temperatures. Slag: Avg. A-samples Avg. B-samples Avg. C-samples
K&F* (Cr2O3 = 13 wt%)
K&F* (Cr2O3 = 5 wt%)
Determined viscosity of the liquid part of the slag (poise) 1.30 0.73 0.67 2.38 2.19 Calculated apparent viscosity of the slag (poise) 2.19 0.90 0.80 3.92 2.72 * Kerr and Fruehan’s slag [7]
As can be seen in Table 17, the apparent viscosity of Kerr and Fruehan’s slag at both Cr2O3 contents (5 and 13 wt%) (2.19 and 3.92 poise, respectively) is higher than that for EAF duplex steelmaking slags, at all sampling moments. The nearest value to that belongs to an average value of the A-samples (2.19 poise). However, this is still 44% lower than the viscosity of the Kerr and Fruehan’s slag (3.92 poise) at its maximum foaming index (Cr2O3 = 13 wt%). For the B- and C-samples cases the viscosities are respectively 67% and 70% lower than Kerr and Fruehan’s experimental slag even at a Cr2O3 content of 5 wt%.
4.5.1.3 Estimation of the surface tension of the slags In order to estimate the surface tension of the slags the Mills and Keene’s surface tension estimating model [17] is used. The method based on the addition of the partial molar contributions of the individual constituents (Al2O3, CaO, FeO, MgO, MnO, SiO2), as shown in Equation 9:
𝛾 = 𝑥1�̅�1 + 𝑥2�̅�2 + 𝑥3�̅�3 + … (9)
Where; the subscripts 1, 2, 3, etc., denote the various slag constituents. Values of �̅�𝑖 are often considered to be the surface tension of the pure component (𝛾𝑖0). Furthermore, for surface-active slag components (in this case Cr2O3), the model takes their partial molar contribution into account.
The calculated surface tension values are presented in Table 18. The results indicate that the surface tension values for these slags are quite close to each other. More specifically, the surface tension of the Kerr and Fruehan’s experimental slag is 1-5% lower than the industrial slags. In other words, these slags are almost similar from a surface tension point-of-view.
Table 18. Estimated surface tensions of the slag samples at process temperatures, by using Mills and Keene’s model [17].
Slag: Avg. A-samples Avg. B-samples Avg. C-samples K&F* (Cr2O3 =
13 wt%) K&F* (Cr2O3 =
5 wt%) Estimated surface tension (mN/m) 490.2 497.6 501.7 477.7 483.6 * Kerr and Fruehan’s slag [7]
The influence of the temperature on the surface tension is not considered in the Mills and Keene’s surface tension estimating model. However, Mills et al. [17] reported that the influence of the temperature on the slag surface tension is not considerably high.
4.5.1.4 Estimating the density of the slags Mills et al. [17] reported on a study considering the changes in the density of a multicomponent slag system by the progressive replacement of SiO2 by Cr2O3. The initial slag composition was 3% Fe2O3- 10% Al2O3 – 35% CaO – 2.5% Cr2O3 – 10% MgO – 39.5% SiO2. The density values were obtained between 1330 – 1450 oC. It could be shown that the density increased almost linearly with an increased Cr2O3 content.
44
In this study, it was assumed that, for a similar Cr2O3 content, the density of the above slag system is equal to the density of the slag systems in the present study. The influence of the temperature on the density of the slag was neglected, as the temperature-density curves generally indicate a small temperature coefficient [17]. Table 19 presents the interpolated and extrapolated slag density values.
Table 19. Estimated densities of the slag samples at process temperatures. Slag: Avg. A-samples Avg. B-samples Avg. C-samples
K&F* (Cr2O3 = 13 wt%)
K&F* (Cr2O3 = 5 wt%)
Estimated Density (Kg/m3) 3410 3180 3150 3470 3165 * Kerr and Fruehan’s slag [7]
4.5.1.5 Bubble size and foaming index estimation The size of CO bubbles generated by nucleation at the slag/metal interface is considered to be strongly dependent on the interfacial tension and the contact angle between the liquid slag and molten metal [37]. The size of a CO bubble leaving the slag/metal interface after nucleation and growth is expected to be a function of the balance between the buoyancy force and the surface tension force. Zhang [40] demonstrated that the maximum bubble size generated at the slag/metal interface rises with an increased contact angle. The contact angle, in turn, is a function of the chemical composition. Surface active components in the slag (such as Cr2O3) increase the contact angle, resulting in larger bubble sizes [8]. According to Equation 7, larger bubble sizes, in turn, result in a lower foamability [37]. Other parameters, such as temperature difference and chemical reactions, can also influence the size of the bubbles detaching from the slag/metal interface. These complexities make it difficult to predict the size of the gas bubbles produced by chemical reactions [37, 41].
Only a very limited level of research has been done on predicting or measuring the size of the gas bubbles evolving from chemical reactions. Equation 10 represents the CO-formation reaction which is essential for foaming in steelmaking [8, 42].
FeO + C (s) = Fe (l) + CO (g) (10)
Kitamura et al. [42] investigated the slag foaming behavior caused by the reaction between a FeO containing slag and hot metal. According to them [42], the bubble size in the foaming slag was about 0.1 to 0.5 mm. However, the investigated slag system was totally different from the EAF stainless steelmaking slag, since it contained P2O5 and CaF2 but no Cr2O3.
Kapilashrami et al. [8] studied synthetically produced slags with compositions relevant to tool and stainless steel production. They showed that the CO-gas bubble size is increased by an increased Cr2O3 content. More specifically, by increasing the Cr2O3 content from 5 to 15 wt%, the bubble size rises from less and 2 to 8 mm. However, the investigated slag contained 5 wt% Fe2O3. This is not the case in the EAF stainless steelmaking.
Due to the above mentioned limitations and uncertainties, the determination of the diameter of the bubbles is based on the experimentally measured foaming indexes reported by Kerr et al. [7]. As shown in Figure 28 [7], at a Cr2O3 content of 13 wt% (near to the average Cr2O3 content of A-samples, Table 9) the foaming index of the Kerr and Fruehan’s experimental slag is around 2.6 s.

45
Figure 28. Measured relationship between foaming index and Cr2O3 content [7].
The viscosity, surface tension and density of this slag (at Cr2O3 = 13 wt%) was calculated in previous sections. Here, by putting the foaming index equal to 2.60 s and applying Equation 7, the average bubble diameter is calculated to be about 12 mm. By assuming that the average CO bubble size in A-samples (containing 14.7 wt% Cr2O3 on average) are equal to that in Kerr and Fruehan’s experiment (containing around 13 wt% Cr2O3) [7], the foaming index of this industrial slag can be estimated based on the calculated viscosities (Table 17), surface tensions (Table 18) and densities (Table 19) and using Equation 7. The result is illustrated in Table 20.
Table 20. Calculated foaming index of the slag samples at process temperatures. Slag: Avg. A-samples Avg. B-samples Avg. C-samples
K&F* (Cr2O3 = 13 wt%)
K&F* (Cr2O3 = 5 wt%)
Foaming index (s) 1.31 0.45 0.39 2.60** 1.70** * Kerr and Fruehan’s slag [7] ** Read off diagram in Figure 28
Similarly, the foaming indexes of the B- and C-samples (containing 5.4 and 4.6 wt% Cr2O3, respectively) are estimated. It is assumed that the average bubble size in these slags are equal to that in Kerr and Fruehan’s experiment at a Cr2O3 content of 5 wt% . In this condition, Kerr et al. showed that the foaming index of the slag is around 1.70 s (Figure 28). Here, the calculation (Equation 7) shows that the gas-bubble size is around 13 mm. The estimated foaming indexes for the B- and C-samples are also presented in Table 20. It was expected that the bubble size in the B and C samples would be smaller than that in the A samples, since those samples contain lower amounts of Cr2O3 [8]. However, it is seen that this is not the case. More specifically, the gas bubbles in B and C samples have, on average, a diameter of 13 mm while in A the average diameter is around 12 mm. However, the estimated bubble size are in the same order of magnitude as those reported by Jiang et al. [43] concerning that the diameter of the bubbles in a foam produced by injecting inert gas into slag is in the range of 5 – 20 mm. Furthermore, Ito et al. [44] estimated the average bubble diameter to be about 12mm.
Before discussing the estimated foaming indexes, it should be considered that the above mentioned assumption involves two main simplifications. As discussed before, the chemical composition of the slag influences the CO bubble diameters. However, the author believes that this is the composition of liquid part of the slag that should be taken into account in order to evaluate the bubble size diameters. Table 16 shows that the compositions of the liquid part of these industrial slags are fairly similar to each other.
Another simplification concerns to the fact that, in the Kerr and Fruehan’s experiment, the bubbles are generated by injecting argon gas into the slag, while in reality the bubble are

46
produced from chemical reaction (Equation 10). Some researchers [42, 45] reported that the gas-bubble sizes produced by chemical reactions are smaller in comparison to those evolved by gas injection. However, as mentioned before, Kapilashrami et al. [8] showed that the CO-gas bubbles generated through a chemical reaction in a slag with a composition relevant to stainless steel were in the range of 2-8 mm.
As Table 20 shows, the calculated foaming indexes of the industrial slags, especially in the case of B- and C-samples are considerably lower in comparison to the foaming index of Kerr and Fruehan’s experimental slag. More specifically, while the maximum foaming index of the Kerr and Fruehan’s experimental slag was measured to be equal to 2.60, the foaming index of the EAF high-chromium steelmaking slags changes between (0.39 – 1.31 s). As Figure 28 shows, the foaming index of that experimental slag, despite from the Cr2O3 content (for the values less than 15 wt%), is more than 1.50 s. At the same time the foaming index of the investigated industrial EAF slags does not exceed 1.31 s.
This can indicate that the foamability of the studied EAF high-chromium steelmaking slags is not as high as Kerr et al. [7] expected. This may imply that the foaming index of the EAF high-chromium steelmaking slags can be improved to higher values.
The achieved values for the slags viscosities (Table 17), surface tensions (Table 18), and densities (Table 19) are visualized in the chart shown as Figure 29. A comparison between these parameters indicates that the viscosity is the most important parameter that directly influences the foaming index. This is in agreement with the results reported by other researchers [37, 41].
Figure 29. A comparison between estimated viscosity, surface tension, density and foaming index of the experimental and industrial slags. *: Kerr and Fruehan’s slag [7] at Cr2O3 = 5 wt% **: Kerr and Fruehan’s slag [7] at Cr2O3 = 15 wt%
The foaming indexes of the slags are also illustrated in Figure 29. For example, a comparison between the viscosity of the Kerr and Fruehan’s slag at Cr2O3 = 5 wt% and the viscosity of the averaged B-samples (Table 17) shows that the viscosity of the experimental slag (2.7 poise) is
Viscosity (Poise) Surface Tension (mN/m)
Density (Kg/m3) Foaming Index (s)
A
B
C
K&F 1*
K&F 2**
2.2
0.9
0.8
3.9
2.7
490
498
502
478
484 34
7031
8031
50 3410
3165
1.31
0.45
0.39
2.60
1.70

47
about three times higher than the industrial slag (0.9 poise). As the chromium-oxide content of these slags are close to each other (5.0 and 5.4 wt%) respectively, the volume fraction of the solid particles (Table 15) within these slag is almost the same (0.04). In both cases the only precipitated phase is magnesiochromite (Table 15). This indicates that the difference in the viscosity of these slags has roots in the thermophysical properties of the liquid part of these slags.
4.5.2 Viscosity as function of basicity One of the main differences between the Kerr and Fruehan’s experimental slag samples and the industrial EAF slag samples is the basicity. While the experimental sample has a basicity of unity, the basicities of the industrial samples lie between 1.40 – 1.48 (Table 9).
The diagram in Figure 30 illustrates the calculated apparent viscosity values for an averaged composition of B-samples at different slag basicities. As explained in the previous sections, the apparent viscosity of the slag is determined based on the viscosity of the liquid part of the slag and the volume fraction of the solid particles. The viscosity of the liquid part of the slag is also presented in the diagram.
Figure 30. Viscosity of the liquid part and overall (apparent) viscosity of the slag versus basicity. The diagram is drawn for an averaged composition of B-samples (at 1726 oC).
Figure 30 demonstrates that the viscosity is at its lowest level at a basicity between 1.3 – 1.4. If the basicity is decreased to lower values (0.9 – 1.1) the slag viscosity is increased. This is due to the fact that by adding a basic oxide such as CaO, the network structure of the silicate slags is partially broken down. This, in turn, leads to a decreased viscosity [46] and a decreased foaming index (Equation 7). However, a lowering of the slag basicity in an EAF gives rise to the corrosion of the furnace refractory (MgO-C). This is owing to the high rate of dissolution of the MgO in acidic slags [1, 47]. It should be mentioned that the basicity of the Kerr and Fruehan’s [7] experimental slag lies in the mentioned range (Figure 30). This means that this slag is probably not compatible with MgO-C refractories.
0.60
0.80
1.00
1.20
1.40
1.60
1.80
0.9 1.0 1.1 1.2 1.3 1.4 1.5 1.6 1.7 1.8
Vis
cosi
ty (
Pois
e)
Basicity
Liquid part of slag Overall (Apparent viscosity)
Expe
rim
enta
lSam
ples
Industrial Samples

48
According to Figure 30, an increased slag basicity to higher values (>1.5) results in a precipitation of dicalcium silicate (2CaO·SiO2). This is the reason for an increased apparent viscosity at higher basicities. It can be seen that an increase of the basicity to values higher than 1.5 results in a dramatic rise in the rate of the viscosity increase. This, in turn, can result in a larger foaming index of the slag. However, as the basicity exceeds 1.7 the slag tends to be too stiff. This gives rise to some problems, such as sticking of the slag to the furnace wall, during the tapping stage. This argument is based on the personal communications with engineers at the meltshop. In summary, the above discussion implies that a basicity value of around 1.5 – 1.6 can enhance the foaming index of the slag during the refining period in EAF high-chromium stainless steelmaking. In this condition, the slag is not completely liquid (“watery”), but it is saturated with respect to CaO (2CaO·SiO2) and Cr2O3 (MgO·Cr2O3). This is in agreement with what was suggested by Pretorius et al. [5] as a slag with good foaming properties. It is important to mention that, according to the thermodynamic calculations performed by Thermo-Calc, in these specific conditions, the volume fraction of the total solids in the slag is very near to the volume fraction of the solids in the Kerr and Fruehan’s [7] slag at a Cr2O3 content of 13 wt% (Table 15). This is the point that corresponds to a maximum foaming index shown in Figure 28.
The predicted pattern for the effect of the basicity on the slag’s foamability, illustrated in Figure 30, is in a fairly good agreement with the experimental data reported by Ito et al. [48]. However, Ito et al. measured the foaming index for a CaO-SiO2-FeO slag system.
4.5.3 Viscosity as function of temperature Kerr and Fruehan’s [7] foaming experiment was performed at 1550 oC. However, the slag temperature measurements indicate that, during the refining period of the EAF high-chromium stainless steelmaking, the average temperature is around 1726 oC (1670 – 1790 oC).
The diagram in Figure 31 presents the calculated apparent viscosity values for an averaged composition of B-samples at different temperatures. The viscosity of the liquid part of the slag is also illustrated in the diagram.
It can clearly be seen (Figure 31) that the viscosity of the liquid part of the slag is decreased by an increased temperature. This is also the case for the overall (apparent) viscosity of the slag. In addition, the diagram shows that the difference between the viscosity of the liquid slag and the apparent viscosity is also reduced by an increased temperature. This is owing to the dissolution of the solid phases into the slag. The diagram shows that the lower temperature of the experimental slag [7], relative to industrial cases, leads to a higher viscosity and thereby to a higher foaming index. This is in agreement with the experimental data reported by Ozturk et al. [49] for a CaO-SiO2-Al2O3-FeO slag system. This can imply that a temperature range of 1500-1600 oC can enhance the foaming index of the slag. However, to be sure that the large pieces of the charged ferrochromium are completely molten, the temperature in the EAF high-chromium steelmaking process should generally be higher than that for the low-chromium steelmaking.

49
Figure 31. Viscosity of the liquid part and overall (apparent) viscosity of the slag versus temperature. The diagram is drawn for an averaged composition of B-samples (the basicity is constant and equal to 1.39).
It should be considered that the slag temperature can influence the size of the foaming-gas bubbles and thereby the foaming index of the slag. Thus, in order to study and relate the slag temperature to the foaming index, this issue should also be taken into account.
0.0
0.5
1.0
1.5
2.0
2.5
3.0
3.5
4.0
4.5
1500 1550 1600 1650 1700 1750 1800
Vis
cosi
ty (
Pois
e)
Temperature (Celcius)
Liquid part of slag Overall (Apparent viscosity)
Exp.
sam
ples
Industrial samples

50
5 CONCLUDING DISCUSSION
Here, initially, a table (Table 21) illustrating a summary of the most important achieved results in the supplements is presented. Thereafter, the major concluding remarks, based on the obtained results, are discussed. The objectives, methods and used tools in different supplements are also summarized.
Table 21. An overview on the topics, objectives, methods, used tools and the results obtained in the supplements.
Supplement 1 2 3 4 5
Topic
Characterization of slag – 304L steelmaking
Petrographical study of the microstructural
evolution of slag – Duplex steelmaking
Thermodynamic study of the microstructural
evolution of slag – Duplex steelmaking
Investigation on the amount of the solid
particles – High-chromium steelmaking slags
Evaluation of the foamability – High-
chromium steelmaking slags
Objectives
• Identify the phases at process temperature
• Calculating the amount of the phases
• Investigating the influence of the process parameters on the amount of the phases
• Identify the phases • Determine the
microstructural evolution of the slag
• Calculating the amount of phases in different process stages
• Illustrating the microstructural evolution of the slag
• Investigating the influence of the other process parameters on the amount of phases
• Parameter study on the total amount of the solid particles
• Investigating the influence/interaction of the process parameters on the total amount of the phases
• Prediction of the foaming index of the industrial slag
• Investigating the influence of the process parameters on the foaming index
• Optimizing the foaming index
Methods
• Industrial Sampling • Petrography • Computational
thermodynamics • Parameter study
• Industrial Multi-sampling
• Petrography • Parameter study
• Computational thermodynamics
• Parameter study
• Computational thermodynamics
• Parameter study
• Computational thermodynamics
• Computational thermophysics
• Parameter study
Tools • LOM* • SEM-EDS** • Thermo-Calc [15]
• LOM • SEM-EDS • XRD†
• Thermo-Calc • Thermo-Calc • Thermo-Calc • ThermoSlag [16]
Major Results
• At the process temperature, slag consists of liquid oxides, spinels and metallic droplets.
• Cr2O3 is the only critical parameter influencing the amount of the spinles.
• Before FeSi-addition, calcium chromite can also form within the slag.
• At the refining stage, stainless and duplex steelmaking slags have fairly similar character
• Microstructural evolution of the slag as well as the amount of different phases could be determined.
• Dependent on the basicity and temperature, the slag may contain solid dicalcium silicate.
• The total amount of solid particles is mainly influenced by the chromium-oxide content, basicity and slag temperature.
• Diagrams representing total amount of particles based on different process parameters were calculated.
• The foaming index of the slag were quantified and evaluated.
• Apparent viscosity is the most important parameter influencing the foaming index.
• A basicity around 1.5 – 1.6 may enhance the foaming.
*: Light optical microscopy **: Scanning electron microscopy equipped with energy dispersive X-ray spectroscopy †: X-ray diffraction

51
5.1 Global slag composition The compositional evolution of the slag during the EAF duplex steelmaking is illustrated in Table 9. The contents of the Cr2O3 (10-21 wt%), FeO (2-6 wt%) and MnO (2-6 wt%) are on their highest levels during the oxygen injection and prior to the FeSi-addition. As discussed in Supplement 2, this is evidently due to the over-oxidation of the metallic elements during the oxygen blowing. However, these contents drop to considerably lower levels after FeSi-injection. More specifically; Cr2O3 (3-9 wt%), FeO (1-3 wt%) and MnO (2-3 wt%). The great affinity of the silicon for oxygen is the driving force for the reduction of these metallic oxides [27].
Equation 3 shows the reduction reaction of the Cr2O3. This is the reason that SiO2 levels rise continuously in the slag (Table 9). In contrast to Cr2O3, FeO and MnO levels, the MgO content increases as the process proceeds. This is probably due to the dissolution of the MgO from the refractory of the furnace into the slag (Supplement 2). The rate and the mechanisms of the dissolution of the MgO in to the slag have previously been studied [28]. However, the addition of dolomitic lime can reduce the chemical gradient between the slag and the refractory. This, in turn, can lead to a decreased refractory wear [36, 50].
As seen in Table 9, the samples taken just before tapping (samples C) have even lower Cr2O3 (2-7 wt%), FeO (1-2 wt%) and MnO (1-3 wt%) contents than the samples taken just after the FeSi-addition (samples B) have. This difference is probably due to the injection of nitrogen into the steel melt. The nitrogen flow enhances the kinetics of metal recovery by locally mixing the steel and slag. This is also the case for 304L stainless steel slag samples. As seen in Table 2, in almost all cases, the samples taken before tapping (samples marked with B) from each heat have lower Cr2O3 contents than the samples taken some minutes earlier (samples marked with A) from the same heat.
Regarding to Table 9, the compositions of the slag samples taken before and after FeSi are very different from each other. On the other hand, the composition of the slag samples collected after FeSi-injection and the samples collected just before tapping are much more similar. In other words, the EAF slag composition is drastically changed by FeSi-injection.
Comparing Table 2 and Table 9 indicates that, during the refining period and after FeSi-injection, the composition and the basicity of the slag in the EAF duplex steelmaking and EAF stainless steelmaking are fairly similar (Supplements 1 & 2). This probably implies that, during the refining period, the basic condition for the utilization of an EAF foaming-slag practice, in both austenitic and duplex stainless steel cases, is almost the same.
Regarding to Table 3 and Table 9, the slag temperature is increasing continuously during the melting process. Moreover, the slag temperature is at its highest level prior to tapping (Supplements 1 & 2).
5.2 Petrographical study (LOM, SEM-EDS and XRD) The petrographic investigations in Supplements 1 & 2 showed that, during the refining period, in both austenitic and duplex stainless cases, the main constituent of the EAF slag is a melt consisting of liquid oxides. However, the slag samples also contain solid spinel particles. Qualitatively expressed, the observations indicate that the amount of the spinel phase is raised by an increased Cr2O3 content in slag. Metallic droplets were also observed in all the slag samples.

52
Except from magnesiochromite spinels and metallic droplets, calcium silicate phases were also detected by SEM-EDS analyses in all the duplex stainless steel slag samples (Supplement 2). The composition of the observed phases was most consistent to dicalcium silicate (2CaO·SiO2). As discussed before, it is most likely that they are formed after sampling. Although, in a few cases, clustered and unevenly distributed dicalcium silicate crystals were also observed. They may correspond to primary-precipitated dicalcium silicate crystals.
The results of the petrographical analyses and observations of the duplex stainless steel slag are summarized in Table 13. This table illustrates the microstructural evolution of the duplex stainless steel slag during the refining stage of the EAF process.
Regarding to Table 13, during the initial melting stage of the EAF process, solid chromium oxide complexes (MgO·Cr2O3 and CaO·Cr2O3) are precipitated. This is due to the exceeding of the solubility of the Cr2O3 in the slag. These solid particles increase the effective viscosity and thereby the foaming index of the slag. However, when the amount and the size of these particles exceed a particular limit, the foamability of the slag contrarily decreases [7]. Although no 304L steel slag sample was taken before FeSi-injection (Supplement 1), it is probable that this slag also contains CaO·Cr2O3 crystals before chromium recovery. This is despite the fact that duplex stainless steel slag samples (Supplement 2) generally had a higher Cr2O3 content than the analogous 304L steel slag samples (compare Table 2 and Table 9). However, after the FeSi-injection, no calcium chromite was observed either in duplex stainless steel slag samples or 304L steel slag samples. As discussed before, this is due to a decreased Cr2O3 content. In addition, a decreased Cr2O3 content also leads to a decreased amount of magnesiochromite spinels. As mentioned before, a reasonable amount of solid particles leads to a better basic condition for slag-foaming practice.
As shown in Supplement 2, CaO·TiO2 was observed in the duplex stainless steel slag sample with a higher basicity (>1.55) but not in 304 steel slag samples (Supplement 1). The observed phase was very fine and present in a low amount compared to the magnesiochromite spinels. Overall, the TiO2 content of the duplex steel slag samples (0.6 - 1.5 wt%) taken from different EAF process stages was a little bit higher than the TiO2 content of the 304L steel slag samples (0.6 – 1.2 wt%). The reason of the lack of existence of the CaO·TiO2 phase in 304L EAF steel slag could be of interest to investigate in the future.
Except from the above mentioned phases, spherical metallic particles were found in all the investigated slag samples. In other words, during the steel melting process, EAF slag contains a large amount of metallic droplets. According to the performed petrography, these droplets are of different sizes. As discussed in Supplement 1, the diameter of the droplets is generally in the size range of a few tenths of a micron to a few microns. However, some droplets with larger diameters (up to 75 µm) were found. More specifically, the observed droplets consisted of two main populations: larger droplets (D>20 µm) and the smaller ones (D<5 µm). Although no droplets with the exact main 304L stainless steel chemical composition (Ni=8-12, Cr=18-20 wt%) were found, it is most likely that these droplets were splashed from the steel bath into the slag, during the EAF melting process [24]. The chemical compositions of the droplets, even in the same size class, were found to vary considerably from each other (Supplement 1). This implies that the chemical composition of the droplets in the slag samples is also dependent on the length of the period of time that they have been in contact with liquid slag, prior to the sample collection. A future investigation of these metallic droplets can be useful to determine if the

53
splashing from melt bath is the only source of them. It is possible that some of the smaller metallic droplets are formed in the slag by the reaction between metallic oxides and CO-gas bubbles [2]. Equation 11 illustrates a typical probable reaction between metallic oxide (MeOx) and CO bubbles in the slag.
MeOx, (l, slag) + x CO (g) = Me (l) + x CO2, (g) (11)
As shown in Supplements 1 & 2, the used method for a semi-quantitative petrographical characterization of the slag sample was found to be a promising and reliable approach to determine the microstructural evolution of EAF slag. However, parts of it can certainly be improved. As discussed before, phases such as secondary-precipitated dicalcium silicate and merwinite have been formed during the solidification of the slag sample. These observations indicate that for freezing of the high-temperature microstructure of the slag samples, a more rapid cooling-procedure is needed. For instance, the slag samples can be more rapidly solidified by pouring them onto a water-cooled copper plate [51]. In addition, collecting slag samples also at other EAF process stages could be very useful for a more thorough and detailed investigation of the EAF slag microstructure evolution. However, during the sample collection for the duplex slag study (Supplement 2), it was experienced that taking slag samples at more process stages involves practical difficulties.
5.3 Computational thermodynamics
5.3.1 Thermo-Calc as a tool to study equilibria The software package Thermo-Calc [15], equipped with database TCMSI1 [19] was used to determine the equilibrium phases in the EAF high-chromium steelmaking slag at the process temperatures (Supplements 1 & 3). In addition, Thermo-Calc was used in order to perform parameter study on the factors influencing the equilibria (Supplements 1, 3, 4 & 5). Moreover, the software was used to calculate phase diagrams in a two-dimensional space of MgO and Cr2O3 contents of the slag samples.
The calculations were based on the Gibbs Energy Minimization (GEM) to find the most stable phase assemblage in equilibrium. The calculations include some limitations. Most importantly; it was assumed that all phases were in their stoichiometric compositions (no solid solution).
5.3.2 Verification of petrographical observations It could generally be concluded that results from the computational thermodynamics calculations are in quite acceptable agreement with the petrographical observations. As discussed in Supplement 1 and Supplement 3, the existence of the magnesiochromite, calcium chromite and dicalcium silicate phases could be verified and predicted by the computational calculations.
Moreover, based upon these calculations, it is also possible to predict the phases in the slag samples that are formed during solidification, such as merwinite (Supplement 1). This is useful in order to distinguish between primary- and secondary-precipitated phases.
5.3.3 Phase distribution As discussed in Supplement 1 and Supplement 3, at process temperatures, EAF high-chromium steelmaking slag always contains a liquid phase and a solid magnesiochromite phase. It was also

54
showed that depending on the composition and temperature, other solid phases can also be formed within the slag. In summary, at higher chromium-oxide content (>0.14) the solid calcium chromite phase is also stable. In addition, higher basicities combined with lower temperatures leads to the formation of a dicalcium silicate phase.
According to Figure 20a, even before FeSi-addition, more than 80 wt% of the slag is in liquid state at process temperature. However, Figure 20c demonstrates that, before tapping the EAF, just around 5 wt% of the slag is solid. This means that, within the “normal” constraints of the EAF operation in Outokumpu (Avesta) and especially after the FeSi-addition, the consistency of the slag is far from “crusty”. This is in agreement with visual observations during the industrial trials. Here, normal operation constraints can be defined as an averaged slag basicity which is between 1.40 and 1.50 as well as a steel temperature around 1650 oC (Table 9).
5.3.4 Microstructural evolution of the solid part of the slag The evolution of the solid phase within the slag is illustrated in phase diagrams shown in Figures 21a-21c (Supplement 3). According to these diagrams, the slag initially consists of a liquid part and chromium oxide-containing complexes. However, after the FeSi-addition the slag only contains solid magnesiochromite spinels. As can be seen in Figures 21a-21c, under the normal operational condition slag contains no solid dicalcium phase. As mentioned before, existence of the dicalcium silicate particles is dependent on the basicity and temperature of the slag. For instance, a consideration of Figure 23 reveals that a slag basicity equal to 1.5 can lead to the formation of a solid dicalcium silicate phase at a temperature of 1726 oC (which is the case in Figure 21b).
In addition, the arrows in Figure 21c demonstrates that, as the refining stage proceeds (from A-samples to C-samples), the scattering of the slag composition decreases. Expectedly, the least composition scattering can be seen between C-samples (Figure 21c), which represent the slag composition prior to the tapping.
5.3.5 Influence of the process parameters on the formation and the amount of solid phases
It was verified that the amount of these spinels in the EAF slag increases with an increased Cr2O3 content (Supplements 1 & 2). In Supplement 1, the influence of different parameters; MgO content, Cr2O3 content, slag temperature and basicity on the amount magnesiochromite spinels was investigated (Figures 13a-13d). It was shown that the effect of the slag temperature on the amount of spinels is not an important issue. Similarly, it was concluded that, in the operating range of Cr2O3 content, the slag basicity and MgO content has almost no effect on the quantity of the spinel phase in EAF slag. On the other hand, it was shown that with an increased the Cr2O3 content in the slag from 1.8 to 10 wt%, the amount of the spinels (Figure 13d) will increase by about five times. Considering the dependency of the foaming index on the volume of the solid part of the slag, it can be concluded that the Cr2O3 content in the EAF slag is one of the main controlling tools to optimize the slag foamability.
In Supplement 3 it was shown that, in contrast to the magnesiochromite phase, dicalcium silicate precipitation is highly influenced by the slag temperature and basicity. More specifically, an increased basicity and a decreased temperature considerably enhance the formation of the dicalcium silicate particles. This is illustrated in the diagram shown Figure 23.
55
As discussed in Supplement 4, the total amount of solid particles is generally a function of the chromium-oxide content, basicity and slag temperature. An increased chromium-oxide content gives rise to a precipitation of solid chromium-containing complexes. In addition, the amount of dicalcium silicate precipitates is a function of the slag basicity and temperature. However, one should consider that the process parameters can be dependent on each other and can sometimes interact with each other. As shown and discussed in Supplement 4, changing the chromium-oxide content of the slag at a constant basicity leads to a change in calcium-oxide content. This interaction was also taken into account in the parameter-studies performed in Supplement 4.
5.4 Evaluation and quantification of the foamability In Supplement 5, the slag’s physical properties influencing its foaming index were determined. This was done in order to evaluate and quantify the foamability of the slag in EAF high-chromium stainless steelmaking slags.
This quantification which was done with respect to the effect of the solid particles on properties, such as the bulk viscosity, represents a novel approach. Determinations were performed both for industrial slag samples and Kerr and Fruehan’s [7] experimental slag samples.
More specifically, computational thermodynamics (Thermo-Calc software package [15]) was used as a tool to calculate the weight fractions of the solid phases within the slag in different EAF process stages. The volume fractions of these phases were determined based on the weight fractions. In addition, the ThermoSlag software [16] was used to estimate the viscosity of the liquid part of the slag samples at the process temperatures. Thereafter, the apparent viscosity of the samples was calculated taking the volume fractions of these solid phases into account. By estimating the density and the foaming-gas bubble size, the foaming index of the slag samples were quantified.
As discussed in Supplement 5, a comparison between calculated foaming indexes showed that the foaming index of the EAF high-chromium stainless steelmaking slags is much lower than that measured by Kerr et al. [7]. More specifically, while the foaming index of the Kerr and Fruehan’s experimental slag had been measured to be in the range of 1.70 – 2.60 s, the calculated foaming index of the EAF high-chromium steelmaking slags, containing similar amounts of chromium oxide, changes between (0.39 – 1.31 s). The foaming index of the industrial slag during the refining process stage lies in a range of 0.39 – 0.45 s. It may be concluded that lower temperature of the experimental slag [7], relative to industrial cases, results into a higher viscosity and thereby into a higher foaming index.
In Supplement 5, it was quantitatively (Figure 29) shown that the apparent viscosity is the most important parameter influencing the foaming index of the slag. According to Figure 30 apparent viscosity of the slag is considerably affected by the basicity. As shown in Figure 30, at a slag basicity around 1.3 – 1.4, the apparent viscosity curve has a minimum. A lower basicity value (0.9 – 1.1) may give rise to the viscosity of the liquid part of the slag and thereby the apparent (total) viscosity. Considering the high rate of dissolution of the MgO from the furnace refractory into the acidic slags [1, 47], lower basicities than 1.3 does not seem suitable for the process.
On the other hand, a basicity higher than 1.5 gives also rise to the apparent viscosity. Here, the reason is the precipitation of the solid dicalcium silicate particles (Supplement 5). Theoretically; the higher the slag basicity is, the higher viscosity and foaming index can be achieved. However,

56
a considerable high amount of precipitation leads to the formation of oversized solid particles as well as an unreasonable high viscosity [7]. Consequently, Equation 7 becomes void.
In summary, a slag basicity value of around 1.5 – 1.6 can improve the foaming index of the slag during the refining period in EAF high-chromium stainless steelmaking. This “optimum” slag is saturated with respect to CaO (2CaO·SiO2) and Cr2O3 (MgO·Cr2O3). In other words, the slag has not a “watery” consistency as well as it is not “too stiff”.
It is absolutely important to consider that the above calculations and suggestions only take the consistency of an “optimum” EAF slag into account. However, in order to foam a slag, generation of the CO-gas bubbles within the slag is also a decisive parameter. In the present study, the effect of the slag basicity, viscosity and temperature on the CO-generating reactions is beyond the scope of the evaluation. However, it could be the case of a study in order to quantify the influence of the mentioned parameters on foaming-gas generation rate with respect to an optimized foaming index.
As mentioned in the introduction part, the low iron-oxide content of the slag is generally the main reason for the poor foaming-gas generation in the EAF stainless steelmaking. Today, foaming methods, based on the injection (or addition) of the iron-oxide-containing additives, are researched and developed. For instance, waste oxide briquettes (WOB) containing carbon and iron-oxide could be used as “foaming agent” [52, 53]. It should be noticed that the addition of the foaming agents into slag leads to a locally increased amount of solid particles. This, in its turn, changes the predicted foaming index of the slag. In the present foaming evaluation study, the influence of the external (added) solid particles on the foamability of the slag is not taken into account.

57
6 CONCLUSIONS
A study of the typical characteristics of EAF slags in the production of the high-chromium stainless steel was carried out. In addition, compositional and microstructural evolution of the slag during the different EAF process stages was investigated. Computational thermodynamics was used not only to verify the petrographical results but also to determine and quantify the amount of different phases within the slag under the evolution of the slag during and at the end of the refining period. Moreover, the influences of the process conditions on the amount of each individual phase as well as on the total amount of solid particles were studied.
Finally, the foamability of the slags in EAF high-chromium stainless steelmaking was evaluated and quantified, taking the effect of the solid precipitates into account. In this regard, the slag’s physical properties influencing its foaming index were determined.
In the industrial trials, slag samples were collected from 14 heats of AISI 304L steel (two samples per heat) and 7 heats of duplex steel (three samples per heat). Simultaneously with each sampling, the temperature of the slag was measured.
The selected slag samples were petrographically studied both using SEM-EDS and LOM. In some cases (Supplement 2), XRD analyses were also performed on fine-powdered samples.
The conclusions of the petrographical investigations may be summarized as follows:
• It was observed that, at the process temperatures and at all process stages, the EAF high-chromium stainless steelmaking slag contains liquid oxides, magnesiochromite spinel particles and metallic droplets (Supplements 1 & 2).
• Before FeSi-addition, the slag also contains solid stoichiometric calcium chromite, where the chromium-oxide content is high (10-21 wt%) and the MgO content on its lowest level (3-4 wt%) (Supplement 2).
• After FeSi-injection into the EAF and during the refining period, the composition and the basicity of the slag in the EAF duplex steelmaking and EAF stainless steelmaking are fairly similar. This probably indicate that, during the refining period, the basic condition for the utilization of an EAF foaming-slag practice, in both austenitic and duplex stainless steel cases, is almost the same (Supplements 1 & 2).
• Depending on the slag basicity, the slag may contain solid dicalcium silicate at the process temperatures. (Supplement 2).

58
• The used method for a semi-quantitative petrographical characterization of the slag samples was found to be a promising and reliable approach to study the microstructural evolution of EAF slag.
Thermodynamic calculations on the slag sample compositions were performed using the software package Thermo-Calc equipped with the database TSMSI1. Some of the main conclusions can be summarized as follows:
• The thermodynamic calculations were showed to be in a quite good agreement with the microscopic observations and compositional analysis. In addition, this kind of calculation can be used as powerful tool to predict and determine the slag phases at high temperatures (Supplements 1 & 3).
• Under normal operation and at the final stages of the EAF process, the slag contains 2-6 wt% magnesiochromite spinel crystals (Supplement 1).
• It was found that, within the compositional range of the slag samples, the only critical parameter affecting the amount of solid spinel particles in the slag is the chromium-oxide content. More specifically, the amount of the spinel particles in the slag increases with an increase in the chromium-oxide content of the slag (Supplement 1).
• The existence of the solid dicalcium silicate phase is highly dependent on the temperature and the basicity of the slag. More specifically, during the refining stage of the EAF, a slag basicity higher than 1.50 can lead to the formation of the dicalcium silicate crystals (Supplement 3).
• Principally, the total amount of the precipitates is a function of the chromium-oxide content, basicity and the slag temperature (Supplement 4).
In Supplement 5, a novel attempt to determine the foaming index of the industrial slags at process temperatures was made. Determination was done with respect to the influence of the solid precipitates on the apparent viscosity of the slag. The most important conclusions from this supplement may be summarized as follows:
• Computational thermodynamics (Thermo-Calc software) can be used as a reliable tool to calculate the amount of the phases within the slag. Furthermore, the compositions of the solid phases as well as the liquid part of the slag can also be determined. Based on the thermodynamic calculations, the viscosity of the liquid part of the slag and the overall (apparent) viscosity of slag can be determined using computational thermophysics (ThermoSlag software). In addition, the density and the surface tension of the slags can be estimated using the existing models presented in the literature. Based on the determined physical properties of the slag, the foaming index of the slag can be quantified and evaluated.
• The study showed that the apparent viscosity of the slag is the most important parameter which influences the foaming index.

59
• The viscosity (and thereby the foaming index) of the EAF high-chromium stainless steelmaking slag is on its minimum as the slag’s basicity takes a value in the range of 1.3 – 1.4. However, lower slag basicities (> 1.3) may be not compatible with the refractory materials (MgO-C) used in the furnace. A basicity value of around 1.5 – 1.6 can enhance the foaming index of the slag during the refining period (as the Cr2O3 content of the slag is around 5 wt%) in EAF high-chromium stainless steelmaking. At higher basicities than 1.7, the amount of the solid particles considerably increases which makes the slag “too stiff”.
• Lower process temperatures enhance the viscosity and thereby the foamability of the slag.

60

61
7 FUTURE WORK
From the experience of the current study, it was concluded that for a more thorough and detailed investigation of the microstructural and compositional evolution of slag in the EAF, it is absolutely useful to take slag samples also at other EAF process stages. For instance, by taking a sample from the slag, at the end of the carbon-injection stage, the influence of the carbon addition on the solid phases could be studied. However, within the sampling period for this study, taking slag samples at more process stages involved practical difficulties.
Existence of secondary-precipitated phases, for instance merwinite, in slag samples clearly points out that, for freezing a high-temperature slag microstructure, a more rapid cooling procedure should be developed. For example, the slag samples can be more rapidly solidified by pouring them onto a water-cooled copper plate.
It was found that the chemical compositions of the metallic droplets, even in the same size class, vary considerably from each other. An explanation can be that the chemical composition of the droplets in the slag samples is dependent on the length of the period of time that they have been in contact with liquid slag, prior to the sample collection. A future investigation of these metallic droplets can be of interest to verify if the splashing from melt bath is the only source of them. In addition, a study of the elemental gradient in the metallic droplets can be helpful to determine the oxidation rate of different metallic elements and carbon within a droplet that is surrounded by liquid slag.
The approach used in Supplement 5 represents a first attempt to calculate, predict and evaluate the foaming index of a slag, based on its global composition with respect to its apparent viscosity. However, in the future it can also be applied on a larger number of plant data with different slag-foaming characteristics.
It could be of much interest to combine the gained knowledge of foaming characteristics of the EAF high-chromium steelmaking slag with the practical methods for applying foamy-slag praxis in the furnace. This could possibly lead to the modification and development of the existing foaming methods such as the addition of waste oxide briquettes (WOB). WOB can improve the foamy-slag practice by enhancing the gas-generation rate within the slag.

62

63
8 REFERENCES
[1] E. B. Pretorius, R. C. Nunnington: Ironmaking and Steelmaking, 2002, 29, (2), 133-139.
[2] D. Durinck, P. T. Jones, M. Guo, F. Verhaeghe, G. Heylen, R. Hendrickx, R. Baeten, B. Blanpain, P. Wollants: Steel Research Int., 2007, 78, (2), 125-135.
[3] D. J. Oosthuizen, I.K. Craig, P.C. Pistorius: Control Engineering Practice, 2004, 12, (3), 253-265.
[4] R. J. Fruehan: ‘The Making, Shaping and Treating of Steel, 11th edn, Steelmaking and Refining Volume, 640; 1998, Pittsburgh, Pa, The AISE Steel Foundation.
[5] E. B. Pretorius, R. C. Carlisle: Iron and Steelmaker, 1999, 26, (10), 79-88.
[6] P. Masucci, D. Capodilupo, G. Brascugli: Proc. 51st Electric Furnace Conf., Washington DC, USA, 1993, 289-294.
[7] J. J. Kerr, R. J. Fruehan: Iron & Steelmaker, 2002, 29, (4), 45–52.
[8] A. Kapilashrami, M. Görnerup, A. K. Lahiri, S. Seetharaman: Metallurgical and Materials Transactions B, 2006, 37, (1), 109-117.
[9] B. Vidacak, I. Arvanitidis, P.G. Jönsson, P. Sjöberg: Scandinavian Journal of Metallurgy, 2002, 31, (5), 321-327.
[10] M. Tossavainen, F. Engstrom, Q. Yang, N. Menad, M. Lidstrom Larsson, B. Bjorkman: Waste management, 2007, 27, (10), 1335-1344.
[11] J. Charles: Proc. 7th Duplex Int. Conf., Grado, Italy, 2007.
[12] E. Owczarek, T. Zakroczymski: Acta materialia, 2000, 48, (12), 3059-3070.
[13] Internet: http://www.imoa.info/, International Molybdenum Association, 2009-11.
[14] O. Smuk, M. Selleby, B. Bergman: Zeitschrift für Metallkunde, 2005, 96, (8), 918-923.
[15] J. O. Andersson, T. Helander, L. Höglund, P. F. Shi, B. Sundman: CALPHAD, 2002, 26, (2), 372-312.
[16] S. Seetharaman, D. Sichen, J. Y. Zhang: Journal of the Minerals, Metals and Materials Society (JOM), 1999, 51, (8), 38-40.
[17] K. C. Mills, B. J. Keene: International Materials Review, 1987, 32, 1-120.

64
[18] Internet: http://www.outokumpu.com/, 2010-10.
[19] Database provided by Thermo-Calc Software AB, Stockholm, Sweden, 2009.
[20] Internet: http://www.thermocalc.se, 2011-03.
[21] R. Dekkers, C. F. Woensdregt, P. Wollants: Journal of Non-Crystalline Solids, 2001, 282, (1), 49-60.
[22] K. E. Sickafus, J. M. Wills, N. W. Grimes: J. Am. Ceram. Soc., 1999, 82, (12), 3279-3292.
[23] Verein Deutscher Eisenhuttenleute: ‘Slag Atlas’, 2nd edn, 109, 1995, Düsseldorf, Verlag Stahleisen GmbH.
[24] J. Ekengård, M. Andersson and P. Jönsson: Ironmaking and Steelmaking, 2008, 35, (8), 575-588.
[25] D. Huang, C.H. Drummond, J. W. Russell and D. Blume: J. Am. Ceram. Soc., 2004, 87, 2047-2052.
[26] K. Morita, M. Mori, M. GUO, T. Ikagawa, N. Sano: Steel Research Int., 1999, 70, (8-9), 319-324.
[27] S. B. Lee, H. Song, H. Y. Hwang, P. C. H. Rhee, O. S. Klevan: Scandinavian Journal of Metallurgy, 2003, 32, (5), 247-255.
[28] R. J. Fruehan, Y. Li, L. Brabie: Proc. ISSTech Conf., USA, 2003, 799-812.
[29] G. Caffery, D. Warnica, N. Molloy, M. Lee: Int. Conf. On ‘CFD in Mineral and Metal Processing and Power Generation’, CSIRO, 1997.
[30] A. Toppani, G. Libourel: Geochimica et Cosmochimica Acta, 2003, 67, (23), 4621-4638.
[31] J. H. Park, I. H. Jung, S. B. Lee: Metals and Materials International, 2009, 15, (4), 677-681.
[32] E. García-Ramos, A. Romero-Serrano, B. Zeifert, P. Flores-Sánchez, M. Hallen-López, E. G. Palacios: Steel Research Int., 2008, 79, (5), 332-339.
[33] L. Zhang, L. Zhang, M. Wang, G. Li, Z. Sui: ISIJ International, 2006, 46, (3), 458–465.
[34] Z. Z. Gho, T.P. Lou, L. Zhang, L.N. Zhang, Z. T. Sui: Acta Metall. Sin. (Engl. Lett.), 2007, 20, (1), 9-14.
[35] J. W. Kim, S. K Kim, D. S. Kim, Y. D. Lee, P. K. Yang: ISIJ International, 1996, 36, (Supplement), S140-S143.
[36] J. Eriksson, B. Björkman: 7th Conf. on ‘Molten Slags, Fluxes and Salts’, Cape Town, South Africa, 2004, The South African Institute of Mining and Metallurgy.
[37] Y. Zhang, R. J. Fruehan: Metallurgical and Materials Transactions B, 1995, 26, (4), 803-812.

65
[38] D. Sichen, J. Bygdén, S. Seetharaman: Metallurgical and Materials Transactions B, 1994, 25, (4), 519-525.
[39] J. Happel: Journal of Applied Physics, 1957, 28, (11), 1288-1292.
[40] Y. Zhang: Dissertation Abstracts International (USA), 1993, 53, (10).
[41] Y. E. Lee, M. Gornerup, O. S. Klevan: Slag Foaming in Electric Furnace Stainless Steel Melting, 57th Electric Furnace Conf. Proc., 1999, Pittsburgh, PA, USA, 413-424.
[42] S. Kitamura, K. Okohira: ISIJ International, 1992, 32, (6), 741-746.
[43] R. Jiang, R. J. Fruehan: Metallurgical and Materials Transactions B, 1991, 22, (4), 481-489.
[44] K. Ito, R. J. Fruehan: Metallurgical and Materials Transactions B, 1989, 20, (4), 509-514.
[45] S.S. Ghag, P.C. Hayes, H.G. Lee: ISIJ International, 1998, 38, (11), 1201-1207.
[46] M. Nakamoto, J. Lee, T. Tanaka: ISIJ International, 2005, 45, (5), 651-656.
[47] S. Zhang, W. E. Lee: Journal of the European Ceramic Society, 2001, 21, (13), 2393-2405.
[48] K. Ito, R. J. Fruehan: Iron & Steelmaker, 1989, 16, (8), 55-60.
[49] B. Ozturk, R. J. Fruehan: Metallurgical and Materials Transactions B, 1995, 26, (5), 1086-1088.
[50] P. Williams, M. Sunderland, G. Briggs: Ironmaking and Steelmaking, 1982, 9, (4), 150-162.
[51] Q. Yang, N. Holmberg, B. Björkman: 3rd Int. Conf. on ‘Process Development in Iron and Steelmaking’, Luleå, Sweden, June 2008, SCANMET III, 561-570.
[52] J. J. Kerr, R. J. Fruehan: Metallurgical and Materials Transactions B, 2004, 35, (4), 643-650.
[53] J. Reichel, L. Rose, J. Kempken, M. A. Damazio, R. G. Carvalho, H. B. R. Loss, E. M. Pinto, J. R. Dutra, M. Karbowniczek: Archives of metallurgy and materials, 2008, 53, (2).

66