a study of aging effect on rubber bearings after · pdf file · 2014-06-10an...
TRANSCRIPT
11th World Conference on Seismic Isolation, Energy Dissipation and Active Vibration Control of Structures, Guangzhou, China, Nov. 17-21, 2009
A STUDY OF AGING EFFECT ON RUBBER BEARINGS AFTER ABOUT TWENTY YEARS IN USE
Hiroki Hamaguchi1, Yusuke Samejima2, Nagahide Kani3 1 Takenaka Corporation, Japan
2 Bridgestone Corporation, Japan 3 The Japan Society of Seismic Isolation, Japan
ABSTRACT
The authors conducted a study of aging effect on natural rubber bearings actually used in a seismically isolated building for almost ten and twenty years. First, compressive creep and mechanical characteristics such as vertical stiffness and horizontal stiffness were measured. Various characteristics of the rubber material such as hardness, strength and adhesion to steel plates were investigated after the bearing was cut into pieces. Test results of the rubber bearings showed that the creep fitted with a suggested predicting equation and that vertical stiffness of the bearing increased less than twenty percent to the initial value, while horizontal stiffness increased about ten percent. Also the test results of the rubber material showed no obvious change in mechanical characteristics and adhesion to the steel plates. This study led to a conclusion that the natural rubber bearings after about twenty years in use had considerable durability under a severe environmental condition.
1. INTRODUCTION
Most building owners ask how long the lifetime of isolation devices are, when they consider applying seismic isolation to their buildings. They are not sure if they need to replace isolation devices, especially rubber bearings, during their buildings are still in use. It is natural for them to doubt the durability of rubber bearings because most rubber materials around them such as tires, seals and rubber bands are easily damaged in daily use. Average lifetime of buildings with reinforced concrete or steel frames is assumed to be several decades in Japan. Thus rubber bearings are expected to have enough durability for at least several decades to 100 years.
Laminated rubber bearing was developed in late 1970’s. The first seismically isolated building in Japan was completed in 1983. It is only about a quarter of a century since rubber bearings have been applied to buildings. Thus the quality of aged rubber bearings has not been proved enough to convince building owners.
There are two ways to estimate the aging effect of rubber bearings, which are accelerated aging test and sampling test of actually used rubber bearings.
Accelerated aging test is based on the theory of chemical kinetics. Arrhenius discovered
an experimental law for rubber material that chemical degradation became exponentially faster in higher temperature. Applying the law, aging effect of a rubber bearing can be estimated by heating the device for designated period. Most test results show that horizontal stiffness increases not more than 20 % in 60 to 80 years. These results come to a conclusion that rubber bearings have enough durability not to need to replace before a building ends its lifetime. However, it is the fact that accelerated aging test is a simplified technique, which has lots of suppositions. It must be recognized that the test results have a rather large degree of variation. Thus, comparisons of the two results between accelerated aging tests and sampling tests of rubber bearings used for a long time in natural environment are necessary.
There are some reports about aging effect of rubber bearings actually used for bridges. A survey of a single rubber pad for a Melbourne railway viaduct completed in 1889 showed that oxidation occurred only within about 5 mm from the rubber surface after almost 100 years in use (Stevenson, 1985). Also a sampling test of rubber bearings of Pelham Bridge, Lincoln, U.K. showed that major changes in mechanical characteristics of rubber material were limited in the depth of 40 to 50 mm from the surface (Watanabe, 1996). These results encourage an expectation that rubber bearings have high durability. However, these rubber materials differ widely from ones used for seismic isolation of buildings in characteristics such as hardness and chemical compound. Therefore, accumulating test results of aging effect on rubber bearings used for actual buildings have been strongly expected.
In 2008, the authors conducted a study of aging effect on a natural rubber bearing taken out from a seismically isolated building after 22 years in use. Almost same study had been undertaken for another bearing by the authors’ senior researchers in 1996 (Higashino, 1997). This paper summarizes the series of these two test results and gives a quantitative evaluation for aging effect on natural rubber bearings actually used for a seismically isolated building.
2. OUTLINE OF THE STUDY
2.1. Outline of the Building
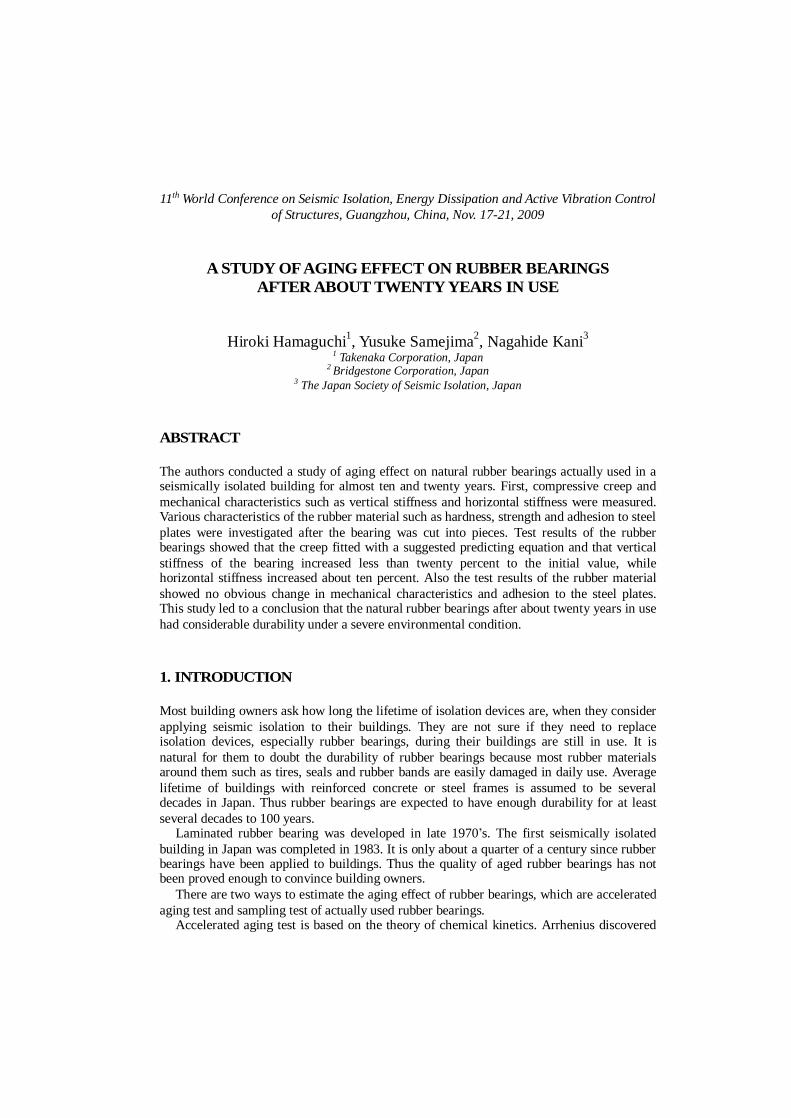
The building is a three-story dormitory for employees of Takenaka Corporation located about 25 km east of the center of Tokyo, which was completed in 1987. The structure is composed of RC moment frames and shear walls. Exterior views of the building are shown in Figure 1.
Figure 1 Appearance of the building NRB
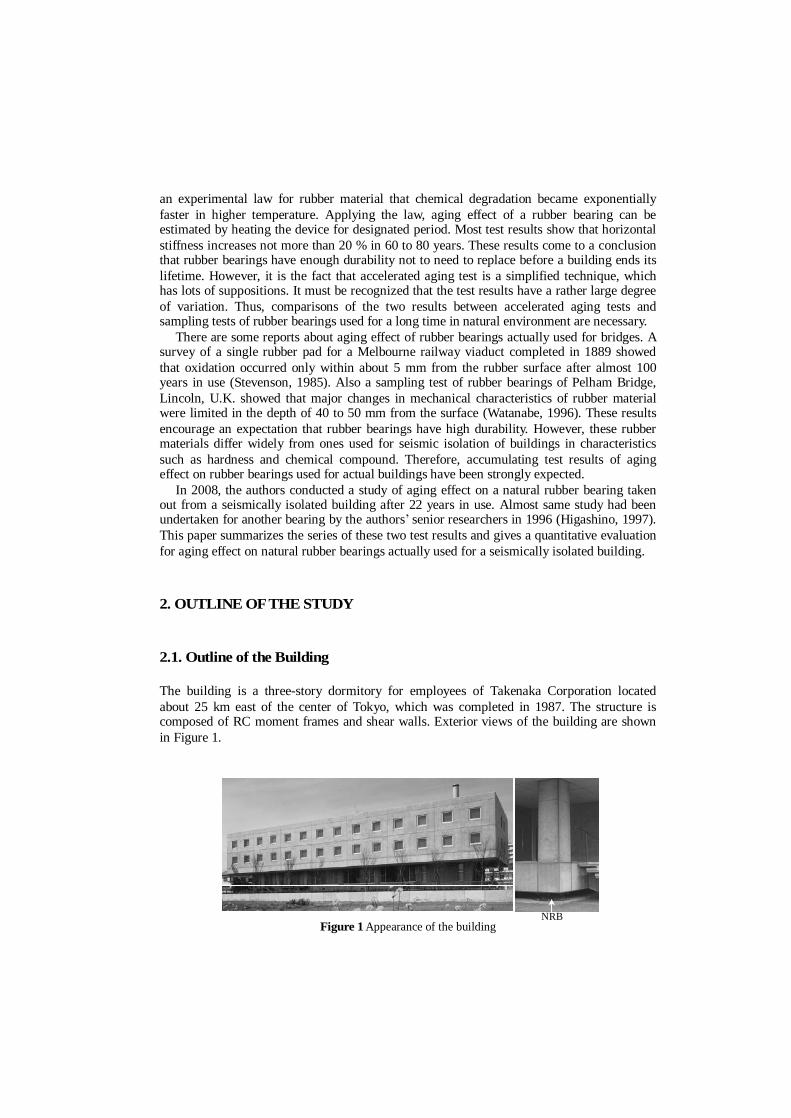
Figure 2 shows that 14 natural rubber bearings and eight viscous dampers are applied in the building. Since the rubber bearings are placed above the ground level as seen in Figure 1 and Figure 2, these bearings are exposed to damaging factors such as direct sunlight, oxygen and rainwater. Such a severe environmental condition will affect the mechanical and chemical characteristics of the bearings more than those of general bearings. Therefore, the results of this study provide a critical evaluation for aging effect of rubber bearings.
Fluctuation in temperature and humidity near the building site for the year of 2007 is shown in Figure 3. Changes in temperature and humidity are supposed to have been calm these 22 years because the building has been sited in a quiet residential area.
Figure 2 Arrangement of isolation devices
Figure 3 Fluctuation in temperature and humidity near the site (2007)
9,0
00
3,6
00
3,60
0 16
,200
44,400 3,600 3,600 6,200 6,200 6,200 6,200 6,200 6,200
② ③ ④ ⑤ ⑥ ⑦ ⑧ ⑨ ①
A
B
C
D
200ton 積層ゴム 150ton 積層ゴム 粘性体ダンパー
Taken out after 10 years (1996) Creep was measured here
Plan
Section
GL
Taken out after 22 years (2008)
NRB (for 150tonf) NRB (for 200tonf) Viscous damper
Isolation level
0
10
20
30
40
Year 2007
Temperature ( °C )
Daily average temperatureMonthly average humidity
90
80
70
60
50
Hum
idity
( %
)
Jan. Dec.Nov.Oct.Sep.Aug.Jul.Jun.MayApr.Mar.Feb.
Data source:Japan Meteological Agency

2.2. Outline of the Rubber Bearing
The rubber bearings were manufactured by Bridgestone Corporation in Aug. 1986. As shown in Figure 2, one bearing was taken out from the building and replaced with a new one in May 1996 and another one was done in May 2008, respectively. Figure 4 shows a view of replacing a rubber bearing in 2008. The superstructure was partly pushed up by nine oil jacks with capacity of 1,000 kN. The size of the rubber bearing is shown in Figure 5, while the design specifications are shown in Table 1.
Figure 4 The view of replacing a rubber bearing (2008)
Figure 5 Size of the rubber bearing
Table 1 Design specifications of the rubber bearing
Item Design specifications
Natural rubber G=0.58 N/mm2
Φ670 × t6mm × 23layers = 138mm
Tensile strength>19.6N/mm2
Break elongation>500%
Inner steel plate Φ670 × t2.2mm × 22layers = 48.4mm
Covering rubber Ethylene Propylene Diene Terpolymer (EPDM), t8mm
Vertical stiffness 2019 kN/mm
Horizontal stiffness 1.46 kN/mm
Inner rubber
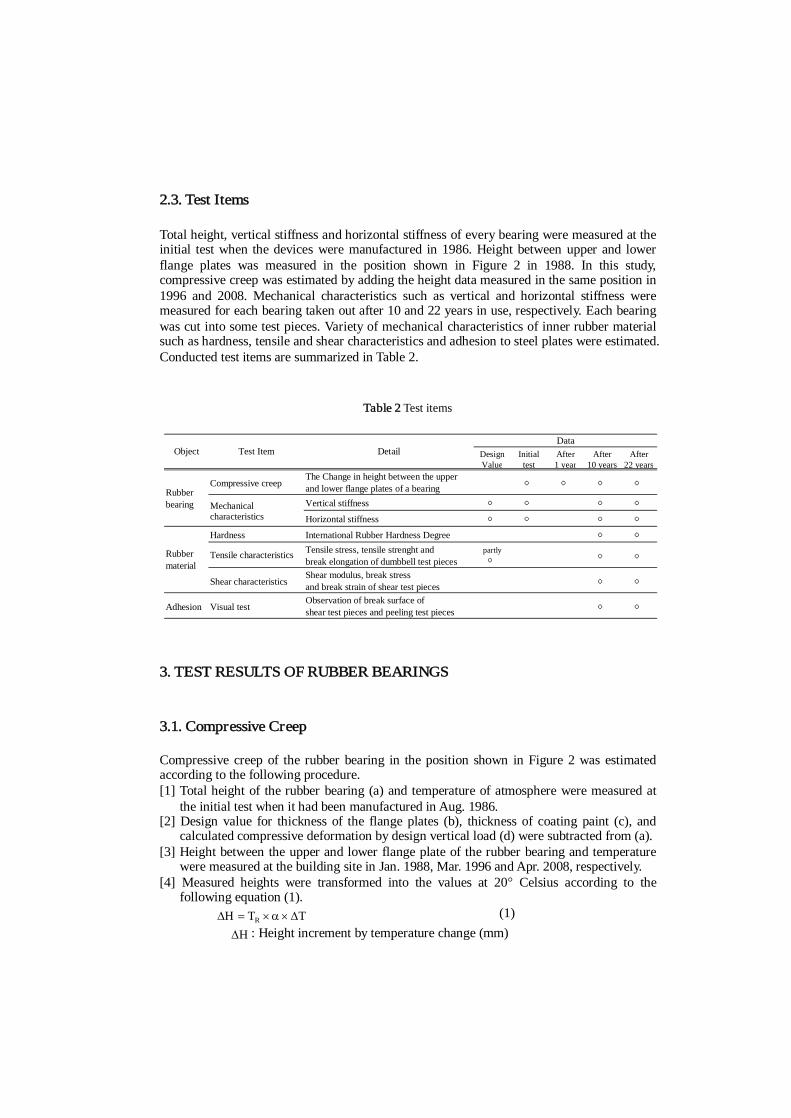
2.3. Test Items Total height, vertical stiffness and horizontal stiffness of every bearing were measured at the initial test when the devices were manufactured in 1986. Height between upper and lower flange plates was measured in the position shown in Figure 2 in 1988. In this study, compressive creep was estimated by adding the height data measured in the same position in 1996 and 2008. Mechanical characteristics such as vertical and horizontal stiffness were measured for each bearing taken out after 10 and 22 years in use, respectively. Each bearing was cut into some test pieces. Variety of mechanical characteristics of inner rubber material such as hardness, tensile and shear characteristics and adhesion to steel plates were estimated. Conducted test items are summarized in Table 2.
Table 2 Test items
3. TEST RESULTS OF RUBBER BEARINGS
3.1. Compressive Creep
Compressive creep of the rubber bearing in the position shown in Figure 2 was estimated according to the following procedure. [1] Total height of the rubber bearing (a) and temperature of atmosphere were measured at
the initial test when it had been manufactured in Aug. 1986. [2] Design value for thickness of the flange plates (b), thickness of coating paint (c), and
calculated compressive deformation by design vertical load (d) were subtracted from (a). [3] Height between the upper and lower flange plate of the rubber bearing and temperature
were measured at the building site in Jan. 1988, Mar. 1996 and Apr. 2008, respectively. [4] Measured heights were transformed into the values at 20° Celsius according to the
following equation (1). TTH R (1)
H : Height increment by temperature change (mm)
DesignValue
Initialtest
After1 year
After10 years
After22 years
Compressive creepThe Change in height between the upperand lower flange plates of a bearing ○ ○ ○ ○
Vertical stiffness ○ ○ ○ ○
Horizontal stiffness ○ ○ ○ ○
Hardness International Rubber Hardness Degree ○ ○
Tensile characteristics Tensile stress, tensile strenght andbreak elongation of dumbbell test pieces
partly○ ○ ○
Shear characteristicsShear modulus, break stressand break strain of shear test pieces ○ ○
Adhesion Visual testObservation of break surface ofshear test pieces and peeling test pieces ○ ○
DetailTest ItemObject
Rubbermaterial
Data
Mechanicalcharacteristics
Rubberbearing
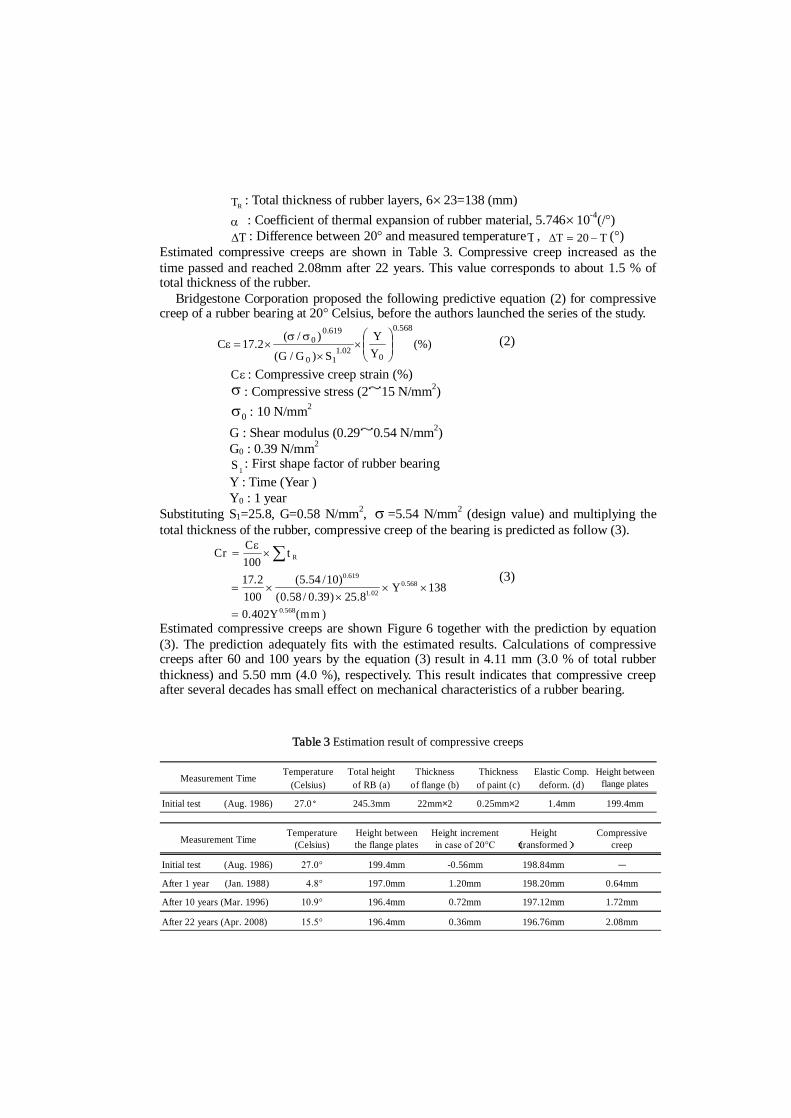
RT : Total thickness of rubber layers, 623=138 (mm)
: Coefficient of thermal expansion of rubber material, 5.74610-4(/°) T : Difference between 20° and measured temperatureT , TT 20 (°)
Estimated compressive creeps are shown in Table 3. Compressive creep increased as the time passed and reached 2.08mm after 22 years. This value corresponds to about 1.5 % of total thickness of the rubber.
Bridgestone Corporation proposed the following predictive equation (2) for compressive creep of a rubber bearing at 20° Celsius, before the authors launched the series of the study.
(%)YY
S)G/G(
)/(2.17C
568.0
002.1
10
619.00
(2)
C : Compressive creep strain (%) : Compressive stress (2~15 N/mm2)
0 : 10 N/mm2
G : Shear modulus (0.29~0.54 N/mm2) G0 : 0.39 N/mm2
1S : First shape factor of rubber bearing Y : Time (Year ) Y0 : 1 year
Substituting S1=25.8, G=0.58 N/mm2, =5.54 N/mm2 (design value) and multiplying the total thickness of the rubber, compressive creep of the bearing is predicted as follow (3).
)mm(Y.
Y.)./.(
)/.(.
tC
Cr
.
..
.
R
5680
5680021
6190
4020
138825390580
10545100
217100
(3)
Estimated compressive creeps are shown Figure 6 together with the prediction by equation (3). The prediction adequately fits with the estimated results. Calculations of compressive creeps after 60 and 100 years by the equation (3) result in 4.11 mm (3.0 % of total rubber thickness) and 5.50 mm (4.0 %), respectively. This result indicates that compressive creep after several decades has small effect on mechanical characteristics of a rubber bearing.
Table 3 Estimation result of compressive creeps
Measurement TimeTemperature
(Celsius)Total height
of RB (a)Thickness
of flange (b)Thicknessof paint (c)
Elastic Comp.deform. (d)
Height betweenflange plates
Initial test (Aug. 1986) 27.0° 245.3mm 22mm×2 0.25mm×2 1.4mm 199.4mm
Measurement TimeTemperature
(Celsius)Height betweenthe flange plates
Height incrementin case of 20°C
Height(transformed)
Compressivecreep
Initial test (Aug. 1986) 27.0°199.4mm -0.56mm 198.84mm -
After 1 year (Jan. 1988) 4.8°197.0mm 1.20mm 198.20mm 0.64mm
After 10 years (Mar. 1996) 10.9°196.4mm 0.72mm 197.12mm 1.72mm
After 22 years (Apr. 2008) 15.5°196.4mm 0.36mm 196.76mm 2.08mm

Figure 6 Increment in compressive creeps
3.2. Vertical Stiffness Vertical stiffness of every rubber bearing was measured at the initial test by monotonous slow loading in Aug. 1986. The maximum compressive pressure of 7.6 N/mm2 was loaded three times and hysteresis was outputted using a pen plotter. Vertical stiffness was calculated from the secant line between two points at pressures of 3.0 N/mm2 and 5.5 N/mm2.
Slow loading of 4.2 N/mm24.2 N/mm2three cycles was undertaken for the rubber bearings after 10 and 22 years in use. After measuring horizontal stiffness mentioned in the next section, the same loading was conducted again. Hysteresis loops were recorded in digital data. Using the third increasing hysteresis, vertical stiffness was calculated from the secant line between two points at pressures of 3.0 N/mm2 and 5.5 N/mm2.
Values of vertical stiffness are summarized in Table 4, while the design value is 2019 kN/mm. Hysteresis loops from the initial test and from the test after 22 years in use are shown in Figure 7. Figure 8 shows the change of ratio in vertical stiffness to the initial values. Vertical stiffness after 10 and 22 years in use increased about 16 to 19 % and 13 to 15 % compared to the initial values, respectively. One of the reasons why the change in 10 years is larger than the change in 22 years should be a variation in the initial values between the two rubber bearings. A certain accelerated aging test reports that vertical stiffness increases 7 to 17 % in 40 years (The Society of Rubber Industry of Japan, 2000). Approximately, the test result in this study has a similar tendency to the accelerated aging test.
Table 4 Measurement of vertical stiffness
Measurement Time Condition Rubber bearingused for 10 years
Rubber bearingused for 22 years
Initial test (1986) 1960 kN/mm ( 0%) 2051kN/mm ( 0%)
Before horizontal loadings 2340 kN/mm (+19.4%)
After horizontal loadings 2265 kN/mm (+15.6%)
Before horizontal loadings 2361 kN/mm (+15.1%)
After horizontal loadings 2320 kN/mm (+13.1%)
After 10 years (1996)
After 22 years (2008)
0.1
1.0
10.0
1.E+02 1.E+03 1.E+04 1.E+05Passed time (days)
Com
pres
sive
cree
p (m
m)
Estimated valuesPrediction
1year 10 years 22 years 60 years 100 years

Figure 7 Comparison of vertical hysteresis loops
Figure 8 Changes in vertical stiffness
3.3. Horizontal Stiffness
Horizontal stiffness of every rubber bearing was measured at the initial test by monotonous slow loading in Aug. 1986. One directional pushing with the maximum horizontal deformation of +300 mm (the maximum shear strain of 217 %) was undertaken three times under a constant compressive pressure of 4.2 N/mm2. Three kinds of horizontal stiffness were calculated from the secant line between two points at shear strains of +10 and +50 %, +10 and +100 % and +10 and +200 % using the plotted hysteresis from the third loading.
Slow loading with the maximum deformation of 300 mmthree cycles under a constant pressure of 4.2 N/mm2 were undertaken for the rubber bearings after 10 and 22 years in use. Hysteresis loops were digitally recorded. Horizontal stiffness were calculated from the secant line between two points at shear strains of +10 and +50 %, +10 and +100 % and +10 and +200 % of the third loading, respectively.
Hysteresis loops of the third loading at the initial test and the test after 22 years in use are shown in Figure 9. In the hysteresis after 22 years in use, hardening property appeared more clearly at around shear strain of 200 %.
Values of horizontal stiffness are summarized in Table 5, while the design value is 1.46
Initial test (1986) After 22 years in use (2008)
0
1000
2000
3000
0.0 1.0 2.0 3.0
Vertical deformation (mm)
Ver
tical
load
(kN
)
Test resultDesign value
0
1000
2000
3000
0.0 1.0 2.0 3.0
Vertical deformation (mm)
Ver
tical
load
(kN
)
Test resultDesign value
0.9
1.0
1.1
1.2
1.3
Rat
io
1986 1996 2008
After horizontal loadings
Year
Before horizontal loadingsBefore horizontal loadings
After horizontal loadings
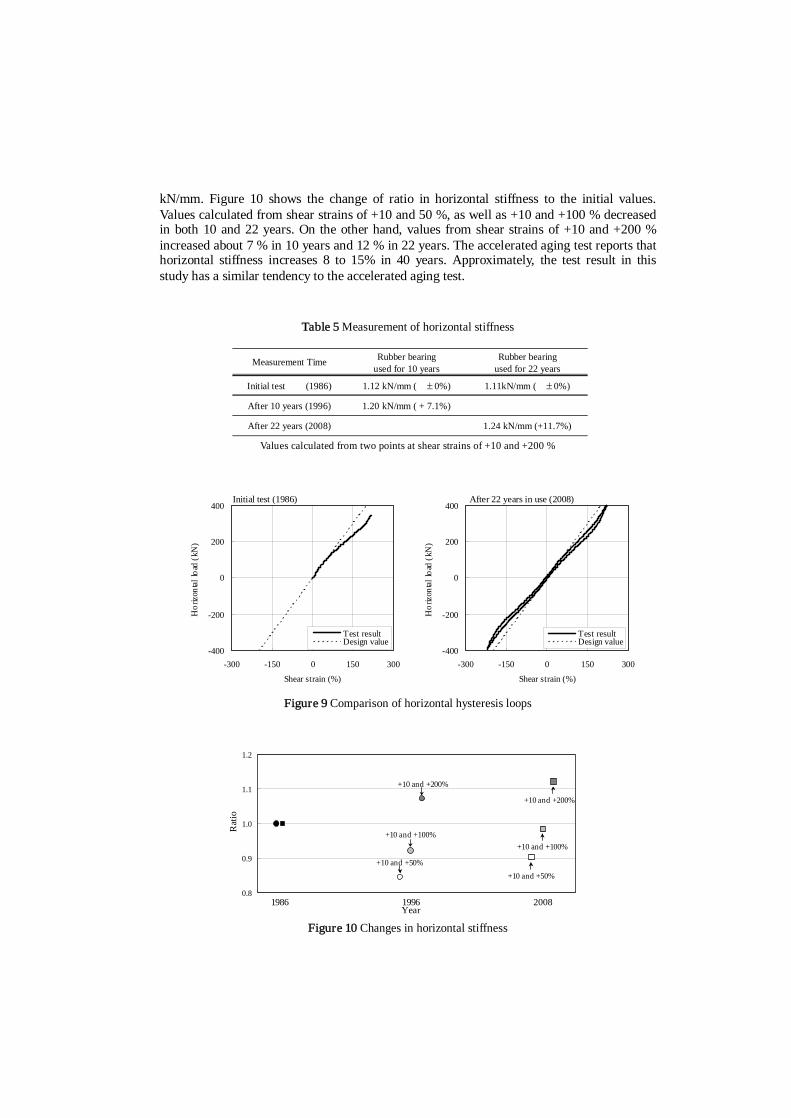
kN/mm. Figure 10 shows the change of ratio in horizontal stiffness to the initial values. Values calculated from shear strains of +10 and 50 %, as well as +10 and +100 % decreased in both 10 and 22 years. On the other hand, values from shear strains of +10 and +200 % increased about 7 % in 10 years and 12 % in 22 years. The accelerated aging test reports that horizontal stiffness increases 8 to 15% in 40 years. Approximately, the test result in this study has a similar tendency to the accelerated aging test.
Table 5 Measurement of horizontal stiffness
Values calculated from two points at shear strains of +10 and +200 %
Figure 9 Comparison of horizontal hysteresis loops
Figure 10 Changes in horizontal stiffness
Initial test (1986) After 22 years in use (2008)
0.8
0.9
1.0
1.1
1.2
Rat
io
1986 1996 2008
+10 and +50%
+10 and +100%
+10 and +200%
+10 and +200%
+10 and +50%
+10 and +100%
Year
-400
-200
0
200
400
-300 -150 0 150 300
Shear strain (%)
Hor
izont
al lo
ad (k
N)
Test resultDesign value
-400
-200
0
200
400
-300 -150 0 150 300
Shear strain (%)
Hor
izont
al lo
ad (k
N)
Test resultDesign value
Measurement Time Rubber bearingused for 10 years
Rubber bearingused for 22 years
Initial test (1986) 1.12 kN/mm ( 0%) 1.11kN/mm ( 0%)
After 10 years (1996) 1.20 kN/mm ( + 7.1%)
After 22 years (2008) 1.24 kN/mm (+11.7%)

4. TEST RESULTS OF RUBBER MATERIAL
4.1. Hardness
Each rubber bearing was cut into test pieces to measure the International Rubber Hardness Degree (IRHD), as shown in Figure 11. Each bearing was cut at 60 mm and 100 mm off-center lines along north and south direction. Second, 10th and 22nd rubber sheets from the top of the bearing were cut out from steel plates and processed into rectangular rubber sheet with 4 mm in thickness. IRHD was measured at 1 mm to 10 mm pitches.
Since no clear difference among the results of three layers was observed, IRHD for the tenth layer is representatively shown in Figure 12. Except for the covering EPDM, having larger hardness, Figure 12 shows that hardness distribution is almost uniform both after 10 and 22 years in use. Also the Figure indicates that there is no apparent difference in hardness between the rubber after 10 and 22 years in use. In general, rubber becomes harder by being oxidized for years. Oxygen in the air attacks the surface rubber first and it penetrates inside gradually. This causes an apparent change in hardness distribution such as the rubber of Pelham Bridge shown in Figure 13. These test results draw an inference that a rubber bearing is hardly damaged by oxygen in the air, when being covered by synthetic rubber.
Figure 11 Making of IRHD test pieces
Figure 12 Hardness of rubber material after 10 and 22 years
2nd,10th and 22nd layers
were cut out
40 South
North
120
20
30
40
50
60
70
0 80 160 240 320 400 480 560 640Distance from the southern edge (mm)
Har
dnes
s (IR
HD
)
After 10 yearsAfter 22 years
10th layer

Quoted from Watanabe Y. et al (1996) Aging Effects of Forty Years Old Laminated Rubber Bearings. Proceedings of
the 1st Colloquium for Seismic Isolation and Response Control, The Japan Society of Civil Engineers
Figure 13 Hardness of the rubber of Pelham Bridge after about 40 years
4.2. Tensile Characteristics
Each rubber bearing was cut into dumbbell test pieces to measure tensile stress M100, tensile strength TB and break elongation EB, as shown in Figure 14. Each bearing was cut at the center with the width of 120 mm along north and south direction. Second, 10th and 22nd rubber sheets from the top of the bearing were cut out from steel plates. 40 dumbbell test pieces with 2 mm in thickness were sliced from those rubber sheets, respectively.
Since no apparent difference was observed among the results of the three layers, tensile stress, tensile strength and break elongation of the 10th layer are representatively shown in Figure 15.
Tensile strength and break elongation after 22 years in use indicate larger variations compared to the results after 10 years in use. However, no physical or chemical reason can be found to explain the peculiar plots in the Figure, since the distributions have unreasonable irregularities and any noticeable correlation cannot be seen. The authors assume following cause for these test results.
It must be included that the effect from the precision variation among dumbbell test pieces caused by difficulties in cutting out the pieces from steel plates. The rubber sheets cut out from steel plates were not straight-shaped any longer because of long time compression. Slicing dumbbell test pieces from bended rubber sheets was not an easy task. Just a slight scratch would cause a considerable decrease in measurement of tensile characteristics. Also, a slicing machine took the place of skilled craftsmen between the two measurement times of 1996 and 2008. Therefore, larger variations in the results after 22 years in use than the results after 10 years in use should be caused by inferior proficiency of a slicing machine to craftsmen.
From this consideration, the authors infer that the changes in tensile characteristics of the rubber material are small. However, it is necessary to see the results to be measured after a few more decades.
Distance from the southern edge (mm)
Har
dnes
s

Figure 14 Making of dumbbell test pieces
Figure 15 Tensile characteristics of rubber material after 10 and 22 years
120
15
120
100
6 2.2
South
North
21 19 20 19 21
R40 5 5 5
40
2nd,10th and 22nd layers
were cut out
0.6
0.8
1
1.2
1.4
1.6
0 80 160 240 320 400 480 560 640Distance from the South edge (mm)
Tens
ile s
tress
M 10
0 (N
/mm
2 ) After 22 years
After 10 years
0
10
20
30
40
50
0 80 160 240 320 400 480 560 640Distance from the South edge (mm)
Ten
sile
stren
gth
T B
(N/m
m2 ) After 22 years
After 10 years
400
500
600
700
800
900
0 80 160 240 320 400 480 560 640Distance from the South edge (mm)
Bre
ak el
onga
tion
E B
(%)
After 22 years
After 10 years
10th layer
The lower design limit
10th layer
10th layer
The lower design limit

4.3. Shear Characteristics
Shear test pieces were cut out from each bearing, as shown in Figure 16. Each bearing was cut at the center with the width of 120 mm along north and south direction. 24 test pieces with steel plates on both upper and lower sides were cut out from the 12th sheet from the top of the bearing.
Slow loading with the maximum shear strain of 100 %three cycles was conducted for six of 24 test pieces. Shear modulus were calculated from the secant line between the maximum and the minimum points of the third hysteresis loop. Dynamic loading with the frequency of 0.3 Hz and the maximum shear strain of 100 %three cycles was also conducted for all test pieces after 22 years in use and shear modulus was calculated. All test pieces were finally broken by monotonous slow loading. Both break stress and break strain were measured.
Shear moduli of the rubber material after 22 years in use are shown in Figure 17. There is no apparent difference in the value between the distances from the edge. This test result also draws the inference that a natural rubber bearing is hardly damaged by oxygen in the air, when the bearing is covered by synthetic rubber such as EPDM. Comparisons between the test results of the two rubber materials after 10 and 22 years in use are shown in Table 6. Values in the table give averages of all test results. Noticeable aging effect cannot be found from these test results.
Figure 16 Making of shear test pieces
Figure 17 Shear modulus of rubber material after 22 years
120
25
South
North
12th layer was cut out
120
25
6 2.2
12th layer 2.2
0.3
0.4
0.5
0.6
0.7
0.8
0 80 160 240 320 400 480 560 640Distance from the southern edge (mm)
Shea
r mod
ulus
( N
/mm2
)
Slow loadingDynamic loading

Table 6 Average shear moduli of rubber materials after 10 and 22 years
4.4. Adhesion of Rubber to Steel Plates
Two kinds of tests were undertaken to check adhesive condition between rubber and steel plates. One is the observation of break surfaces of shear test pieces described in previous section. The other is the peeling test of following test pieces.
Peeling test pieces were cut out by the same way as shown in Figure 11. First and 23rd rubber sheets from the top of the bearing, whose rubber adhered to the upper and the lower flange plates, were used. The edge part of the rubber was cut from the flange plate to make a tab. Gripping the tab with pliers, the rubber was peeled from the flange plate.
In both tests, break surface were classified according to a criterion shown in Table 7. For instance, a break surface comprised of 70% of break of rubber and 30 % of break between rubber and cement will be classified into ‘70R 30RC’. If an exposure of a steel surface would be found on a break surface, it can be assumed that adhesive strength was weaker than the strength of rubber itself.
Figure 18 shows some examples of break surfaces of adhesion between rubber and steel plates after 22 years in use. All break surfaces were classified into ‘100R’. This means that entirely no exposure of a steel surface was observed on every test piece. With these test results, the authors estimate that adhesion of the rubber to the steel plates have kept a good condition since the manufacture of the bearings.
5. CONCLUSIONS
With this study of actually used rubber bearings, the authors come to following conclusions. Compressive creep measurement fitted with the given predictive equation reasonably. Stiffness of the rubber bearings increased in general. Changes in stiffness agreed with
expectation from accelerated aging test results. Distributions of mechanical characteristics of the rubber kept uniform inside the bearing.
It is assumed that covering synthetic rubber is effective in protecting inner rubber from environmental damaging factors.
As an overall assessment, it is concluded that the changes in mechanical characteristics approximately fitted with some predictions and existing research results. The authors infer that a rubber bearing has a considerable durability. However, 22 years is only about a half to one fifth of expected lifetime of isolation devices. The authors are aiming to conduct a periodic study in the future.
Afte 10 years After 22 years
Slow loading 0.495 N/mm2 0.467 N/mm2
Dynamic loading - 0.504 N/mm2
5.54 N/mm2 4.74 N/mm2
480% 550%
Test Item
Shearmodulus
Break stress
Break strain
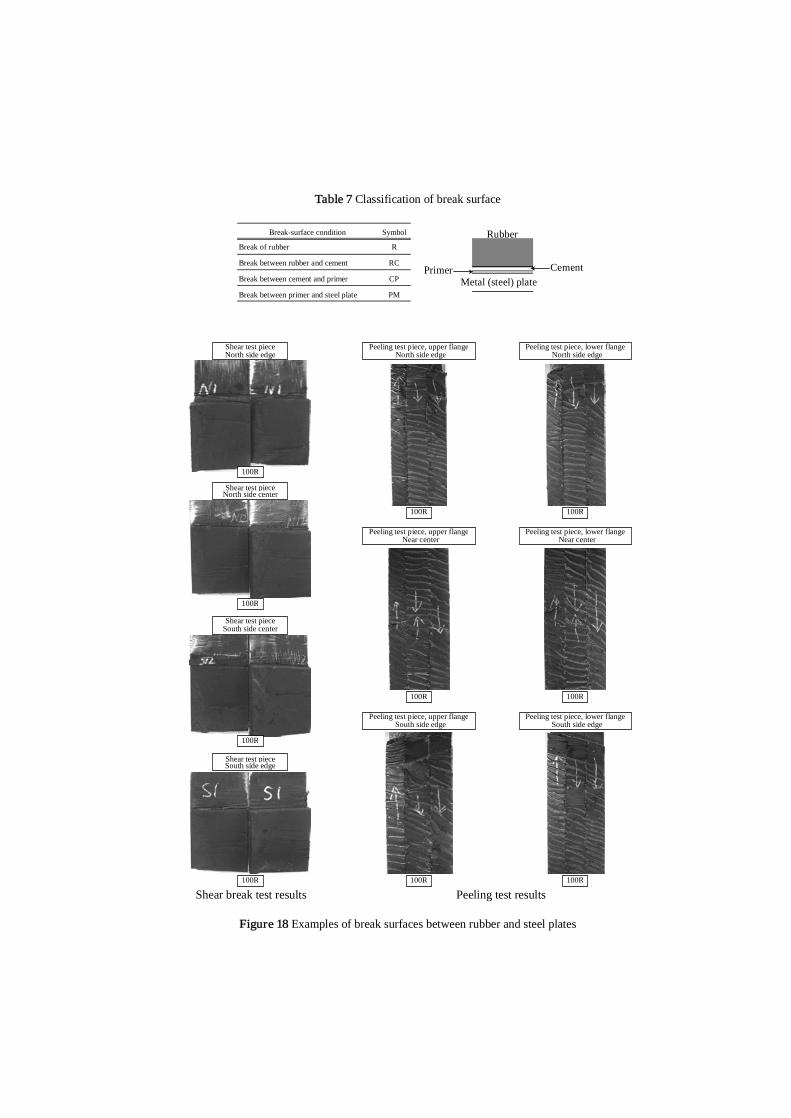
Table 7 Classification of break surface
Shear break test results Peeling test results
Figure 18 Examples of break surfaces between rubber and steel plates
Shear test piece North side edge Peeling test piece, upper flange
North side edge
Shear test piece North side center
Shear test piece South side center
Shear test piece South side edge
Peeling test piece, lower flange North side edge
Peeling test piece, upper flange Near center
Peeling test piece, lower flange Near center
Peeling test piece, upper flange South side edge
Peeling test piece, lower flange South side edge
Break-surface condition Symbol
Break of rubber R
Break between rubber and cement RC
Break between cement and primer CP
Break between primer and steel plate PM
Cement Primer Metal (steel) plate
Rubber
100R
100R
100R
100R
100R 100R
100R 100R
100R 100R
ACKNOWLEDGEMENTS
This study was accomplished by the full cooperation of Bridgestone and Takenaka Corporation. The authors acknowledge that the contributions by Mr. T. Yoshizawa, Dr. S. Suzuki and Mr. T. Kikuchi from Bridgestone, and Mr. S. Aizawa, Mr. G. Yoneda and Mr. M. Higashino from Takenaka Corporation were essential and are greatly appreciated.
REFERENCES
Higashino M. et al (1997) A Study of Aging Effect on A Rubber Bearing after 10 Years in Use. Proceedings of the Architectural Institute of Japan Annual Meeting, B2:567-568.
Ichikawa K. et al (1997) Experimental Study on Exchanging and Long-term Durability of Rubber Bearings Part.2 Long-term Durability of Rubber Bearings. Proceedings of Annual Meeting of the Architectural Institute of Japan, B2:575-576.
Mochimaru M. et al (1998) Survey of Aging for LRB of a Base-isolated Building. Proceedings of the Architectural Institute of Japan Annual Meeting, B2:697-698.
Nakauchi N. et al (1992) Characterization of a 100 Years Used Rubber Bearing by Micro-Analytical Methods. Journal of Applied Polymer Science, Applied Polymer Symposium, 50:369-375
The Society of Rubber Industry of Japan (2000) Handbook of Rubber Bearings for Seismic Isolation. The Society of Rubber Industry of Japan (2006) Technical Report of the Committee of Rubber
Bearings for Seismic Isolation. Stevenson A. (1985) Longetivity of Natural Rubber in Structural Bearing. Plastics and Rubber
Processing and Applications, Vol.5, No.3. Sudoh C. et al (2003) An Evaluation of Aging Effect and Distribution of Mechanical Characteristics of
A Rubber Bearing after 10 Years in Use. Proceedings of Annual Conference of the Japan Society of Civil Engineers, 763-764.
Suzuki T et al (1998) Study on the Maintenance for Base-isolated Building Part.3 Stiffness variation of Laminated Natural Rubber Bearings of Base-isolated Building. Proceedings of the Architectural Institute of Japan Annual Meeting, B2:695-696.
Watanabe Y. et al (1996) Aging Effects of Forty Years Old Laminated Rubber Bearings. Proceedings of the 1st Colloquium for Seismic Isolation and Response Control, The Japan Society of Civil Engineers, 439-446.