a spatial database model for mobility management · 2019-06-06 · this study aims to design a...
TRANSCRIPT

A SPATIAL DATABASE MODEL FOR MOBILITY MANAGEMENT
A. Ajmar 1, E. Arco 2, P. Boccardo 2*
1 ITHACA, Via Pier Carlo Boggio 6, 10138 Torino, Italy - [email protected] 2 Politecnico di Torino – DIST, Torino, Italy – (emere.arco, piero.boccardo)@polito.it
KEY WORDS: Road Network, Mobility Management, Standards, Spatial Data Model, Traffic Measures
ABSTRACT:
In urban and metropolitan context, Traffic Operations Centres (TOCs) use technologies as Geographic Information Systems (GIS)
and Intelligent Transport Systems (ITS) to tackling urban mobility issue. Usually in TOCs, various isolated systems are maintained
in parallel (stored in different databases), and data comes from different sources: a challenge in transport management is to transfer
disparate data into a unified data management system that preserves access to legacy data, allowing multi-thematic analysis. This
need of integration between systems is important for a wise policy decision.
This study aims to design a comprehensive and general spatial data model that could allow the integration and visualization of traffic
components and measures. The activity is focused on the case study of 5T Agency in Turin, a TOC that manages traffic regulation,
public transit fleets and information to users, in the metropolitan area of Turin and Piedmont Region.
The idea is not to replace the existing implemented and efficient system, but to built-up on these systems a GIS that overpass the
different software and DBMS platforms and that can demonstrate how a spatial and horizontal vision in tackling urban mobility
issues may be useful for policy and strategies decisions. The modelling activity take reference from a review of transport standards
and results in database general schema, which can be reused by other TOCs in their activities, helping the integration and
coordination between different TOCs. The final output of the research is an ArcGIS geodatabase, which enable the customised
representation of private traffic elements and measures.
1. INTRODUCTION
1.1 General context
Mobility management in metropolitan areas mainly concerns the
application of strategies and policies to reduce travel demand or
to redistribute demand in space and time. This activity has a
large impact on the socio-economic growth and in general in the
quality of life of citizens. In particular, high quality mobility
stimulates territorial cohesion, trades and job creation,
increasing the general economy, while low quality mobility
generates high levels of congestion, air pollution and noise,
increases the risk of accidents and may generates social
exclusion.
Between strategies and actions to improve mobility efficiency, a
key role is played by Intelligent Transport Systems (ITS), a set
of technologies devoted to automatically collect, process and
spread traffic trends, providing informative services to users as
to Traffic Operations Centres (TOCs) in near real-time. On the
other side, GIS provides the framework for integrating road
networks and traffic information (Thompson et al., 2019).
European and National policies today stress the role of ITS and
GIS in mobility management. In the European context, the need
of a core network of strategic European infrastructures emerges,
to be achieved through the deployment of large-scale intelligent
and interoperable technologies, in order to optimise the capacity
and the use of infrastructures (European Commission, 2011).
On the other side, the Italian Minister for Infrastructures and
Transport, has promoted the Smart Road Initiative (Ministero
delle Infrastrutture e dei Trasporti, 2018), which aims to create
a technological environment for the interoperability and
communication between infrastructures and vehicles, enabling a
new mobility user experience and mobility services. In
particular, in a positional paper ((Ministero delle Infrastrutture e
dei Trasporti, 2018) linked to the initiative, various
implementations aspects are described, focusing also on the
predisposition of a reference road network (certified by
experts), with three level of detail, over which reference static
and dynamic characteristics, as data and information about
traffic (raw and forecasted).
Both documents underline the need of transport data integration
both in terms of information about physical infrastructures and
information on the status of the infrastructure (level of service,
traffic flow, timetables…), in particular between administrative
levels.
The creation of an integrated and efficient mobility system
represents indeed the solution for organizing and monitoring
transport across different modes, in order to increase the
sustainable mobility through the creation of new opportunities
for collective mobility, enhancing TOCs supervision capacity
and management efficiency, and users’ accessibility to mobility.
1.2 Structure of the study
This study starts from the case study of 5T Agency in Turin, a
TOC that manages traffic regulation, public transit fleets and
information to users, in the metropolitan area of Turin and
Piedmont Region.
In particular, the agency has set up during years a wide system
of Intelligent Transport Systems (ITS) technologies that
acquires continuously measures and traffic information, which
are used to deploy information services to citizens and public
administrations. However, the spatial nature of these data is not
fully considered in the daily operational activity, with the result
of difficulties in information integration. Indeed, the agency
lacks a complete GIS solution that includes all the management
information in an organized spatial and “horizontal” vision.
The main research question concerns the integration of different
kind of data in a unique GIS spatial data model. Spatial data
interoperability is critical and particularly challenging in the
transport field because geographic data definition in legacy
database can vary widely: different data format and standards,
The International Archives of the Photogrammetry, Remote Sensing and Spatial Information Sciences, Volume XLII-2/W13, 2019 ISPRS Geospatial Week 2019, 10–14 June 2019, Enschede, The Netherlands
This contribution has been peer-reviewed. https://doi.org/10.5194/isprs-archives-XLII-2-W13-1495-2019 | © Authors 2019. CC BY 4.0 License.
1495

data inconsistencies, different spatial and temporal granularities,
different methods and enforcing rules that relates measures,
events with physical infrastructures.
A review of existing standards in transportation field, focused
on the spatial data aspects, allowed to build a common reference
over which building a new proposal. Standards are analysed and
compared, looking at their main purpose, at their topological
and geometrical aspects, at the completeness of features
definition, and at the strategies adopted for temporal
management.
The first output is a logical level spatial data schema which can
enable the fulfilment of multiple tasks over a single network
reference data. The solution is applied to the real context of 5T
Torino agency, where the physical model is implemented
through an ArcGIS geodatabase, tailored on the specific agency
needs.
The logical schema is also proposed as possible solution to set
up an homogeneous road network in the context of the
URBAN-GEO BIG DATA (URBAN GEOmatics for Bulk
Information Generation, Data Assessment and Technology
Awareness), a Project of National Interest funded by the Italian
Ministry of Education that aims at contributing to the
exploitation of heterogeneous geodata sources such as VGI,
geo-crowdsourcing, earth observation, etc. for a better
understanding of urban dynamics.
2. MODELLING ACTIVITY
2.1 Road network abstraction
The modelling activity concern the definition of a network
model, which are the most prominent models used in transport
field, thanks to their simplicity, elegant form and functionality,
which allow to represent the flows of passengers, cars, freight
moving through the network’s lanes (Thill, 2000). A network is
a type of mathematical digraph that captures relationships
between objects using connectivity. The connectivity may or
may not be based on spatial proximity and is usually guaranteed
by the application of topology rules. The network model
contains logical information such as connectivity relationships
among nodes and links, directions (or navigability) of links, and
costs (or impedances) of nodes and links. This information is
critical in routing applications and spatial analysis, as they
reflect the real-world characteristics of transport networks such
as one-way streets.
However, as streets in reality are areas, there are multiple ways
to model a street. A common abstraction uses logical centreline
or physical centreline. Logical centreline represents the
approximate midpoint of the street across its width, in order to
show the general location and shape of the facility at a relatively
small scale. Physical centreline usually represents the
approximate midpoint of carriageway across its width and are
most used at bigger scale. Similarly, intersections also can have
different levels of abstraction and their representation is
dependent from centreline abstraction used.
Choosing an appropriate level of abstraction that cope with the
application purpose and manageable complexity is never a
trivial task. The simplest approach to making a transport dataset
is to create independent segments representing linear portions of
the total system (Butler, 2008; Rodrigue, 2017). A typical way
to do this is to segment longer facilities at intersections. Each
segment gets the same set of attributes so that values extending
across a road are duplicated for all segments to which the value
applies. Some database designers may argue that this simple
design is inefficient, but it is indeed the most used in transport
databases (Butler, 2008).
The described approach allows to model the static information
of a road network; however, transport data comprises also a
series of dynamic data: mean flows and speeds of vehicles
traversing segments, accidents and roads works which can limit
the navigability of an edge, between many others. Between
approaches for modelling dynamic transport data, the use of
linear referencing systems is one of the most used. A linear
referencing system (LRS) can be defined as “a system of
determining the position of an entity relative to other entities to
some external frame of reference” (Goodwin et al., 1998). A
linear referencing method (LRM) is the set of technical
processes used to determine, specify, and recover a location
within an LRS. It includes rules for managing the measurement
process, as how to define the origin, the unit of measure, the
precision and scale for measured distances (Figure 1).
Figure 1. Linear Referencing and Dynamic segmentation.
Dynamic segmentation is the software-based process of
transforming linearly referenced data stored in a table into a
virtual (on-the-fly) feature that can be displayed on a map
(Cadkin, 2002 a, b).
The use of LRM within a defined LRS, in combination with
dynamic segmentation allows to significantly reduce the amount
of disk space needed to store data, which is particularly critical
for this type of information which can have high rates of
updates. On the other side, as different LRS exists,
interoperability between systems is usually problematic (Butler,
2008, Goodwin et al., 1998).
2.2 Requisites of the database
Starting from 5T Agency needs, a series of requirements for the
spatial database have been defined.
In particular, the agency is responsible of many tasks
comprising info mobility services (both for public and private
transport) as well as traffic management policies (re-routing,
traffic light management and priorities). This framework has led
to a complex situation on the data management side, were
multiple databases, specialised in different tasks, cannot be
spatially integrated without a huge effort.
Within this complex framework, the first requisite was to build
a spatial database able to integrate different components
devoted to different task.
At the static information level (road network, public transport
stops and routes, ancillary traffic objects as cameras, traffic
lights, gates, informative panels…) the goal was to allow the
visualisation of the positions over a common network reference.
Dynamic information related to static elements is also
considered: using the common reference road network set up,
the database structure had to enable the visualisation of
different traffic measures (flows, speeds, travel times…),
referred to single point of measures as well to stretch of roads.
From a temporal point view, the database must allow to
The International Archives of the Photogrammetry, Remote Sensing and Spatial Information Sciences, Volume XLII-2/W13, 2019 ISPRS Geospatial Week 2019, 10–14 June 2019, Enschede, The Netherlands
This contribution has been peer-reviewed. https://doi.org/10.5194/isprs-archives-XLII-2-W13-1495-2019 | © Authors 2019. CC BY 4.0 License.
1496
visualise single instants as well time range and time series.
These measures will be then used within network analysis
algorithm in order to produce accessibility analysis, services
areas, routing solution using real data coming from sensors as
impedances for the model.
2.3 Overview of existing transport standards
Standardization is a process that aims to help in technological
development and to share good ideas and solutions, through
documenting practical information, best practices and agreed
solutions on global problem (ISO, 2017). Thanks to
standardization initiatives promoted from 1995 in the contest of
spatial data handling, significant technological development has
made. In the context of this research, standards represent the
main source of reference, documenting the state of art of the
spatial data modelling activity.
As a first step, relevant standards in the field of GIS and
transport are deepened and compared. Between existing
standards, the ones considered in this research are presented in
Table 1, subdivided between their main purposes.
Road Network
Representation
Public Transport
Network
Representation
Dynamic data
Representation
INSPIRE Road
Network Model X
O&M INSPIRE
implementation X
FGDC -
Transportation
Data model
X X X
CityGML X
TRANSMODEL X X
GTFS X X
TMC X
DATEX II X
S.I.MO.NE X
Table 1. Overview of standards considered for the research,
categorised by their main purpose.
Data models have been compared from the point of view of the
segmentation model (the choice of how to represents roads and
their connection, and the related physical structures), deepening
geometrical and topological aspects, from the semantic point of
view (the meaning of the different terms used to describe
physical object), from the point of view of temporal aspects, in
order to take into account ways to represents dynamic aspects as
measures and events.
Looking at the aspects of road spatial visualisation and thematic
representation, the INSPIRE Road Network Model (INSPIRE,
2013), the FGDC Model (Federal Geographic Data Committee,
2008) and the CityGML are the most complete: their definition
allows a detailed geometrical representation and the richness of
attributes enables a variety of thematic representations (road
hierarchy, speed limits, lanes, …). On the other hand, Traffic
Message Channel (TMC) standards is defined only at logical
level (points and relation between points), without a precise
geometrical representation of the roads and with a good support
for road naming only (Arco et al., 2017). TRANSMODEL
(TRANSMODEL, 2015) and GTFS, also allow a precise
geometrical representation of the public transport routes (even if
in GTFS the geometrical definition of a linear element is
optional).
The connectivity rules, which enable routing over the network,
are well defined in the INSPIRE and FGDC model, where a
robust definition of the relationships between points, lines and
groups of elements exists. In particular, a strength of FGDC
model is the solid integration between public transport network
and the infrastructure over which they insist, defined by specific
topological relationships. The CityGML has a definition for
areal routing but is poorly supported by real cases. In addition,
the support for LRM is present in the FGDC model, where
events are well defined and integrated in the schema. LRM
support is less developed for the INSPIRE model, where indeed
there is a lack in events definition. LRM are obviously well
supported by info-mobility standards: both DATEX and
S.I.MO.NE (Arneodo et al., 2009) models comprise references
for TMC linear referencing, as well OpenLR system and
WGS84 coordinates.
GTFS TRANSMODEL FGDC
Agency Operator/Autority TransitStop [Owner]
Stop Scheduled Stop Point,
stop place, tariff zone
TransitStop,
TransferCluster and
Facility
Route Line TransitRoute
Trip Vehicle journey Trip (temporal aspect),
Pattern (spatial aspect)
Stop Times
Passing times, stop point
in journey pattern,
distance in route link
Time Point
Calendar Day type, period and day
of week -
Calendar dates Operating day -
Fares attributes Fare element price Fare, FareType code list
Fare rules Fare element, distance
matrix
FarePolicyType code
list, FareType code list
Shape Route, LinkProjection TransitPath
Frequency (frequency) -
Transfer
Connection (link), service
journey interchange,
service journey pattern
interchange, default
interchange
ConnectionSeg
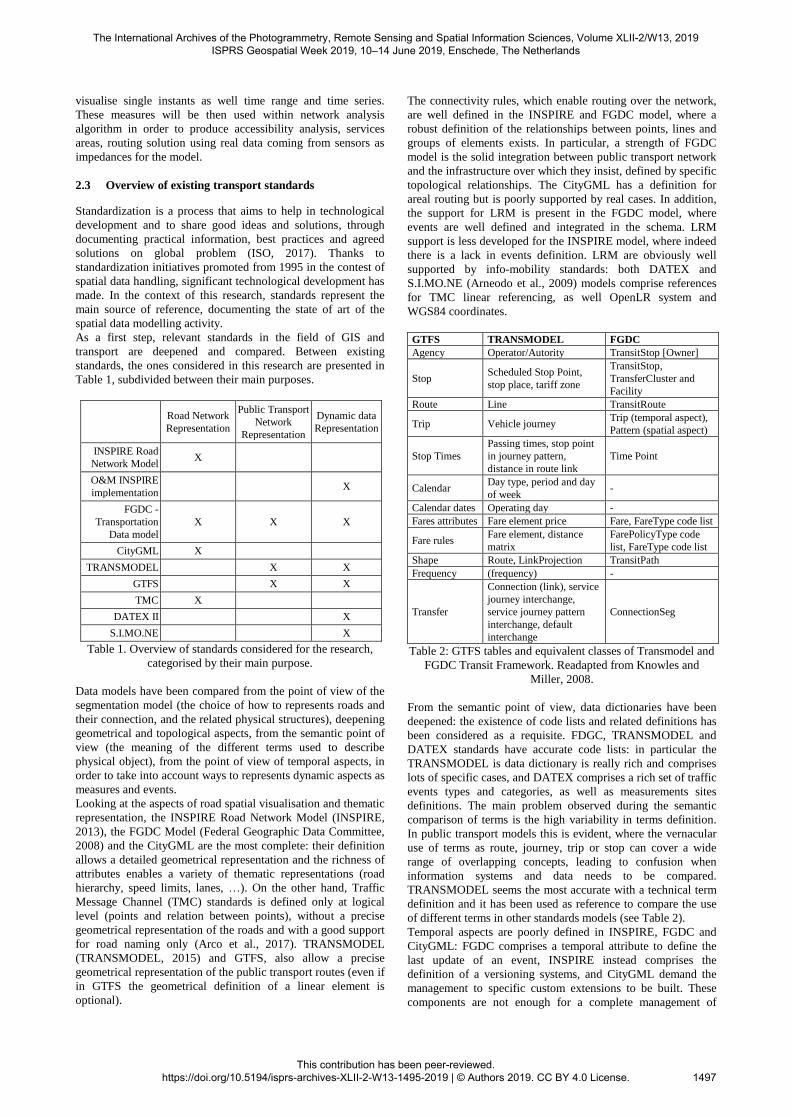
Table 2: GTFS tables and equivalent classes of Transmodel and
FGDC Transit Framework. Readapted from Knowles and
Miller, 2008.
From the semantic point of view, data dictionaries have been
deepened: the existence of code lists and related definitions has
been considered as a requisite. FDGC, TRANSMODEL and
DATEX standards have accurate code lists: in particular the
TRANSMODEL is data dictionary is really rich and comprises
lots of specific cases, and DATEX comprises a rich set of traffic
events types and categories, as well as measurements sites
definitions. The main problem observed during the semantic
comparison of terms is the high variability in terms definition.
In public transport models this is evident, where the vernacular
use of terms as route, journey, trip or stop can cover a wide
range of overlapping concepts, leading to confusion when
information systems and data needs to be compared.
TRANSMODEL seems the most accurate with a technical term
definition and it has been used as reference to compare the use
of different terms in other standards models (see Table 2).
Temporal aspects are poorly defined in INSPIRE, FGDC and
CityGML: FGDC comprises a temporal attribute to define the
last update of an event, INSPIRE instead comprises the
definition of a versioning systems, and CityGML demand the
management to specific custom extensions to be built. These
components are not enough for a complete management of
The International Archives of the Photogrammetry, Remote Sensing and Spatial Information Sciences, Volume XLII-2/W13, 2019 ISPRS Geospatial Week 2019, 10–14 June 2019, Enschede, The Netherlands
This contribution has been peer-reviewed. https://doi.org/10.5194/isprs-archives-XLII-2-W13-1495-2019 | © Authors 2019. CC BY 4.0 License.
1497

timing component. The Observations and Measurements model,
implemented within INSPIRE, may cover the lack of a system
for temporal management: it allows to link data with temporal
attributes as instants, ranges and time series, which allow a
complete definition for temporal management. The weakness of
the model is mainly due to the lack of practical implementation
for traffic management. Temporal aspects are indeed deepened
in the TRANSMODEL as well in info-mobility standards.
These models usually relate spatial elements to a temporal
definition (a point object to instants and linear objects to
ranges), highlighting the strong integration between spatial and
temporal data.
2.4 The conceptual framework
First activity to develop a conceptual data model regards the
clear and unambiguous definition of general elements and
relationships that compose the model.
An overview of the conceptual data model is given in Figure 2.
The conceptual model considers several aspects: a basic
geometry definition and rules for topology definition from the
segmentation point of view, and a basic semantic level, which
comprises also ancillary traffic elements, usually not considered
in other standards. In addition, it tries to integrate the general
road network with elements of the public transport network,
and, through the event modelling, temporal measures related to
private traffic as public transport monitoring.
The model is based on four abstract classes (red in Figure 2),
which can be used as template for more specific ones.
A LINK is a linear and oriented object, which describe the
connection between two points. A LINK can be view both as a
spatial object with its own geometry, representing a physical
element as a carriageway, and as a conceptual object like public
transport path or a linear traffic event, with or without a
geometry associated.
A POINT is an object used both for the spatial description of
the network, and for the description of elements located the
network. Therefore, it can be used to represent physical
infrastructure objects like intersections, ancillary traffic
elements as traffic lights, or more abstract concepts as point
traffic events.
A TRANSPORT PROPERTY is used to define a set of
characteristics that describe a transport object. These
characteristics can change over time; however, the update time
is usually low. TRANSPORT PROPERTY is directly related to
LINK and POINT classes to which they belong.
An EVENT represents a data directly referred to a LINK or a
POINT object. In this class, objects change rapidly over time,
differently from TRANSPORT PROPERTY class. It is used
mainly to represent raw and estimated traffic measures and
traffic events.
From these general elements, aggregations (as sequences and
sets, in blue in Figure 2) and specializations (from a functional
point of view, in yellow in Figure 3) associations defines more
specifics objects, and between them specific relationships are
defined.
Point abstract class is specialised in NetworkNode, a point
spatial object used for describing connectivity between links,
and in PointOnLink, used for the representation of network
ancillary elements as traffic lights, traffic monitoring devices
and traffic information devices, or other objects that can be
located along a link as access points or public transport stops.
The association between the NetworkLink and PointOnLink
classes exploits the concept of linear referencing: a
NetworkLink object can pass through zero, one or multiple
PointOnLink object, and reciprocally and a PointOnLink object
must be located on a NetworkLink object, at a certain distance
from its start point. It has to be noted that this latter relationship
is a composite aggregation: if a NetworkLink object is deleted,
PointOnLink objects located along it are also deleted.
Figure 2. The conceptual data model
Between elements defined, a LinkSequence and a
PointSequence represent an ordered list of objects (links or
points) and it is used to define specific classes as:
MonitoringArc (a group of links mainly used for traffic
monitoring purposes), PTRoute (the linear path covered by a
public transport vehicle in a specific direction of travel),
PTScheduledJourney (ordered stop lists of a vehicle in a route,
characterised by passing time). LinkSet and PointSet represent
groups of elements without ordering rules. PointSet represent
objects as group of access to the same public transport stop or
point of interest, group of stops related to different services
(bus, metro and train stops), group of traffic detectors managing
a complex intersection. LinkSet are specialised in PTLine,
which groups two PTRoute objects (composite relationship) in
the opposite direction, known to the public by a common name
or number.
The TRANSPORT PROPERTY abstract class is specialised in
LinearProperty and PointProperty child classes. Those two
classes are related with a composition association to their
relevant spatial classes.
Finally, the EVENT abstract class is specialised in LinearEvent
and PointEvent classes and related to their pertinent spatial
object with a composition association, which can be single
objects as NetworkNode, PointOnLink and NetworkLink, or
grouping objects as LinkSequence and PointSequence. In
addition, the LinearMeasure relationship with spatial element
uses linear referencing method, which allows specifying a valid
measure also along a partial stretch of the linear element.
The International Archives of the Photogrammetry, Remote Sensing and Spatial Information Sciences, Volume XLII-2/W13, 2019 ISPRS Geospatial Week 2019, 10–14 June 2019, Enschede, The Netherlands
This contribution has been peer-reviewed. https://doi.org/10.5194/isprs-archives-XLII-2-W13-1495-2019 | © Authors 2019. CC BY 4.0 License.
1498

2.5 The logical model
The logical data model deepens the details of the conceptual
data model in an application independent way, defining
attributes and specifying relationships. Attention has been given
to the definition of enumeration and code lists in order to build
a robust semantic.
Figure 3. Diagram of road network elements.
As a first step, a common set of attributes that characterises all
elements of the model have been defined. In particular, the field
“InspireID” is global unique identifier, useful both for external
publication purposes, and for version management; fields
“validFrom”, “validTo”, and “VersionID” complete the set of
fields to be used for version management. Even if most of
classes have been defined as “FeatureType”, a geometry field is
explicitly added only for the class that represent linear road
network, as all other elements can be referenced to it, and may
optional have a spatial representation.
Figure 4: Diagram of ancillary traffic elements.
A diagram of classes involved in road segmentation model is
shown in Figure 3. The NetworkLink class represents the linear
road network and contains a set of attributes with associated
enumeration values, which are mainly derived from INSPIRE
Transport Network standard. Arc and Path also are a child of
LineFeature class, representing an example of the
LinkSequence/MonitoredArc class defined in the conceptual
model. Arc is characterised by a set of properties defined by the
external table ArcProperties (related through the field “ArcID”).
The feature type Path groups together a series of Arc objects
and is used mainly for traffic measures representation. In order
to concretize the relationship between NetworkLink objects and
LinkSequence, relationship tables have been defined: the
ArcToLink table allows relating NetworkLink objects with Arc
ones through the reference to identifiers, and, in the same way,
the PathToArc table explicates the relationship between Arc and
Path objects.
Looking at PointFeature child classes, the Node class represents
elements used for line network definition. In particular, the field
“Zlevel” describes the relative vertical position of the Node
respect to the ground level, allowing to identify tunnels and
bridges, and the field “Type” is used discriminate between
intersections, internal and end nodes. The Node class is related
to the NetworkLink class using the fields “fromNode” and
“toNode” as foreign keys; additionally, Node class contains also
the foreign key “LinkID”, which identifies the reference link.
This is enough to assure connectivity and define the direction of
travel of the link.
Figure 5: Diagram of events and relationships with network
elements.
PointOnLink is the other child class of PointFeature and
represents an object located along the linear network. Two
linear location systems have been implemented: through the
reference to the foreign key “LinkID” and the use of
“LinkMeasure” and “Distance” fields is possible to locate the
point along the link (as instance using ArcGIS linear
referencing Toolbox). In addition, fields representing the TMC
linear location systems can be used, implementing a custom
linear referencing script. Both implementations have been
considered as the TMC referencing is the most used for traffic
events information spreading (e.g. through DATEX protocol),
whereas other types of referencing allow to locate objects and
events also on the lower hierarchy road network.
The PointOnLink class is further specialised in several classes,
which represents the set of ancillary traffic elements that must
be considered for traffic management (Figure 4).
The International Archives of the Photogrammetry, Remote Sensing and Spatial Information Sciences, Volume XLII-2/W13, 2019 ISPRS Geospatial Week 2019, 10–14 June 2019, Enschede, The Netherlands
This contribution has been peer-reviewed. https://doi.org/10.5194/isprs-archives-XLII-2-W13-1495-2019 | © Authors 2019. CC BY 4.0 License.
1499

Finally, a set of elements derived from the Event abstract class
is used for specifying traffic measures and events. A diagram
showing classes and their relationships is shown in Figure 5.
The general Events class contains attributes useful to link data
to spatial element (“FeatureID”) and to define its temporal
extent. In contrast with the previous classes, Events is always a
table and needs to be linked to a spatial element or located
through linear referencing in order to be visualised.
The child class TrafficMeasure has a set of attributes that allow
to describe and characterise the type of measure. The other child
class TrafficEvent is further specialised in order to define a
point or linear event. In this case, in addition to the “FeatureID”
attribute, also fields useful for TMC referencing method are
defined. Indeed, a TrafficMeasure can be represented both as
line or point, but it is usually referred to a defined PointOnLink,
NetworkLink or groups of them. This is not true for traffic
events, which can involves stretch of roads or located along a
link (or link sequences): the TMC referencing enables this kind
of visualisation. The associated enumeration
TypeOfTrafficEvent allows distinguishing between several
events and is based on the DATEX dictionary used in 5T. The
“Description” field can be used to further describe the traffic
event.
3. RESULTS
3.1 Database implementation
The physical implementation of the model is tailored on 5T
exigences and set up with ArcGIS Geodatabase technology
(Figure 6).
Figure 6: A view from ArcCatalog of the geodatabase
Compared to logical data model, enumerations have been
converted in ArcGIS domains and associated to relevant fields.
A series of subtypes manages the specialisation of ancillary
traffic elements, and relationship classes manages aggregation
relationship and connectivity rules. The geodatabase is
composed by one feature dataset called RoadNetwork, which
contains the polyline feature class Street, a customisation of the
NAVSTREETS Streets Data, and the relationships for which it
has a source role; all other elements are tables and so, located
outside of the feature dataset.
In order to correctly load data into the data model, a broad
activity of data transformation has been applied. Firstly, data
relative to road network have been modified in order to find the
matching between the different sources available in 5T
(conflation activity between commercial datasets as
NAVSTREETS Streets Data of 2014 and 2016 and 5T defined
arcs and paths). Secondly, attributes have been mapped into
new fields of the data model. Finally, a linear referencing
activity has been performed in order to reduce the processing
load when the geodatabase is used. Only after these steps, data
have been loaded into the new geodatabase.
Last activity performed was the creation of custom scripts to
extract and group measures and traffic events. The scripts for
measures extraction perform basic queries (essentially a
GROUP BY), giving as input the measure type, the start and
end date time of interest, and optionally a predefined temporal
range over which aggregate data, with a statistical function
associated. This approach has been considered more efficient
than storing predefined set of data that may overload the
geodatabase. In this way, the computing power of the server is
used for group by operation and fields transformation, whereas
the machine has only to create the customised object class and
the relationship class and load data into. Several scripts have
been created in order to fulfil a set of possibility.
3.2 Spatial and temporal applications
As a first result, the geodatabase enables 5T opeartors to
visualise the set of sensors and other traffic management
element with the possibility to query and display only the
needed subset with a customised symbology (Figure 7).
Figure 7. Position of other ancillary traffic elements.
This was previously quite complex in the past as the knowledge
of data source location (separated in several servers) and the
skills to extract data were not so accessible. In order to visualise
point element position from the available tables, data need to be
loaded in ArcMap and then using the “Display Route Events”
interface data are visualised on the fly. Data can be exported as
feature class or used as it with a customised symbolisation.
Visualising Arcs and Path instead needs a further step: starting
from the Street feature class, the “Join” interface must be used,
selecting the option “Join data based on a pre-defined
relationship class”. In this way, fields of the related table are
reported in the Street feature class and can be used for thematic
visualisation.
The geodatabase schema defined allows the extraction of single
measure on demand. As for the Arc and Path representation,
The International Archives of the Photogrammetry, Remote Sensing and Spatial Information Sciences, Volume XLII-2/W13, 2019 ISPRS Geospatial Week 2019, 10–14 June 2019, Enschede, The Netherlands
This contribution has been peer-reviewed. https://doi.org/10.5194/isprs-archives-XLII-2-W13-1495-2019 | © Authors 2019. CC BY 4.0 License.
1500

once the feature table is load in ArcMap and data are visualised
as Route Event, a join with the option “Join data based on a
pre-defined relationship class” must be applied, linking data
with measures. In Figure 8, a comparison of a set of measures
detected by the UTC loops is given: first row represents the
situation at a peak hour (h. 8:30), the second row represents the
situation at a non-peak hour (h. 5:35). In this case, the measure
is given as it is from sensors: no aggregation has been applied in
data extraction procedure.
Figure 8: Traffic measures detected by UTC loops (flow, speed,
queues), comparison of a single bin detection.
In a similar way, also measures relatives to Arc and Path can be
visualised: in Figure 9, is shown the mean travel time measure
(normalised on the free flow travel time measure), estimated by
the SVM, and reported over Path features. As Arc (and
consequently Path) can be referred to the same bidirectional
link, the output visualisation shows Path elements overlay, with
different measures referred to it. More appropriate rules of
representation can be applied in order to not allow the overlay
between measures, but in this case is quite effective to show the
differences in traffic flow in opposite flow direction.
Figure 9. Travel time, normalised on free flow travel time,
estimated by Metropolitan Supervisor (SVM).
Also, short time series can be represented though graphs. An
example is given in Figure 10. In this case, in order to obtain
the series, multiple extraction of the same measure has been
done in sequential time ranges. Tables created are then joined
together in order to obtain a single table to link with the relative
spatial object. Then an appropriate symbolisation has been set.
Finally, measures can also be integrated in a Network Dataset
and used as real impedances. In Figure 11, the network dataset
has been built on an export of Arc features, over which a table
of measures has been previously joined. The figure shows the
differences in routing choices made by the ArcGIS routing
engine, setting different arc measures as impedance.
Figure 10. Variation of the availability of free lots in parking
area, normalised on the capacity, in a time window (h. 7– 12)
Figure 11. Differences in Route Analysis outputs using different
measures of Arc as impedances.
4. CONCLUSION
The geodatabase proposed allows to easy extract, analyse and
visualise the main physical infrastructure and their related
objects, measures and properties, simplifying the production of
reports on historical data as the finding of spatial and temporal
correlation between traffic events. For the agency point of view,
a strength of this result is the possibility to reuse data and
measure for customized tasks, without the need to deeply know
the entire ITS environment system which prop up the measures
acquisition.
The International Archives of the Photogrammetry, Remote Sensing and Spatial Information Sciences, Volume XLII-2/W13, 2019 ISPRS Geospatial Week 2019, 10–14 June 2019, Enschede, The Netherlands
This contribution has been peer-reviewed. https://doi.org/10.5194/isprs-archives-XLII-2-W13-1495-2019 | © Authors 2019. CC BY 4.0 License.
1501

This research has made evident some considerations: first of all,
the difficult of use ITS data in GIS desktop solution in a
straightforward way. The proposed solution tries to overcome
the peculiarity of ITS platforms and concentrates on data
available and mechanism to reuse ITS data in a GIS
environment. From a spatial point of view, standard solution
exists to manage data, but are sometimes too general, or related
to a specific field of action. From the standard analysis has also
emerged the difficult in creating a common dictionary of the
terms involving the mobility: lot of terms are used for referring
to the same concepts leading confusion when data integration is
needed between TOCs. The analysed standards do not consider
the representation of ancillary traffic elements as sensors, group
of sensors, cameras, velox and traffic lights: the proposed data
model indeed consider the representation of those elements and
define their spatial relationships with the road network. In
addition, it tries to develop general code lists (in the logical data
model), implementing a first vocabulary activity which can be
reused by other TOCs.
Looking at the logical data model proposed, as the solutions is
not technology dependent, it can be used also by other TOCs,
implementing it as whole or only partially and using the DBMS
technology preferred. The proposed model indeed can be used
also in an open source environment as PostgreSQL/PostGIS.
Further developments will concern the set-up of the model for
the whole Italy, within the context of the Smart Road Initiative,
starting from the five cities (Turin, Milan, Padua, Rome,
Naples) involved in the PRIN 2015 project URBAN-GEO BIG
DATA.
ACKNOWLEDGEMENTS
URBAN-GEO BIG DATA (URBAN GEOmatics for Bulk
Information Generation, Data Assessment and Technology
Awareness) is a Project of National Interest (PRIN) funded by
the Italian Ministry of Education, University and Research
(MIUR) – id. 20159CNLW8.
REFERENCES
Arco E., Ajmar A., Arneodo F., Boccardo P., 2017. An
operational framework to integrate traffic message channel
(TMC) in emergency mapping services (EMS). In: European
Journal of Remote Sensing, vol. 50-1, pp. 478-495. ISSN 2279-
7254. DOI: 10.1080/22797254.2017.1361306.
Arneodo, F., Foti, G., Cocozza, M., 2009. S.I.MO.NE.
Innovative system for metropolitan area mobility management.
In: Proceedings of the 16th ITS World Congress, 21-25
September 2009, Stockholm, Sweden.
Butler, J.A., 2008. Designing geodatabase for transportation.
Environmental Systems Research Institute, Inc., Redlands, CA,
USA.
Cadkin, J., 2002 a. Dynamic Segmentation in ArcGIS. ArcUser,
v.7, pp. 52 – 54. Available from:
http://www.esri.com/news/arcuser/0702/files/dynseg.pdf (20
September 2018).
Cadkin, J., 2002 b. Understanding Dynamic Segmentation
Working With Events in ArcGIS 8.2. ArcUser, v.10, pp. 40 –
43. Available from:
http://www.esri.com/news/ArcUser/1002/files/dynseg_2.pdf (20
September 2018).
European Commission, 2011. WHITE PAPER Roadmap to a
Single European Transport Area – Towards a competitive and
resource efficient transport system. Available from: http://eur-
lex.europa.eu/legalcontent/EN/ALL/?uri=CELEX:52011DC014
4 (20 September 2018).
Federal Geographic Data Committee, 2008. Geographic
Information Framework Data Content Standard. Federal
Geographic Data Committee Secretariat, U.S. Geological
Survey, Virginia, USA.
Goodwin, C., Latham, F. E., Siegel, D., Gordon, S., 1998.
Intelligent Transportation Systems Datum Public Sector
Requirements. Workshop Report in Spatial Data
Interoperability Protocol for ITS Project, Oak Ridge National
Laboratory, Oak Ridge, Tennessee.
INSPIRE, 2013. D2.10.1 INSPIRE Data Specifications – Base
Models – Generic Network Model. Drafting Team “Data
Specifications”.
ISO, 2017. ISO in brief. Great Things Happen when the world
agrees. Available from:
https://www.iso.org/files/live/sites/isoorg/files/archive/pdf/en/is
oinbrief_2015.pdf (20 September 2018)
Knowles, N., Miller, P., 2008. A Transmodel based XML
schema for the Google Transit Feed Specification – With a
GTFS / Transmodel comparison. Kizoom Ltd 109-123 Clifton
Street, London. [online] Available from:
http://naptan.dft.gov.uk/transmodel/schema/doc/GoogleTransit/
TransmodelForGoogle-09.pdf (20 September 2018)
Ministero delle Infrastrutture e dei Trasporti, 2018. Modalità
attuative e strumenti operativi della sperimentazione su strada
delle soluzioni di Smart Road e di guida connessa e automatica.
Gazzetta Ufficiale della Repubblica Italiana, Serie generale,
n.90. Available from:
https://www.gazzettaufficiale.it/eli/id/2018/04/18/18A02619/sg
(30 March 2019).
Rodrigue, J.P., 2017. The Geography of Transport Systems.
Hofstra University, Dept. of Global Studies & Geography, New
York, USA. Available from: http://people.hofstra.edu/geotrans.
(20 September 2018).
Thill, J.C., 2000. Geographic information systems for
transportation in perspective. Transportation Research Part C -
Emerging Technologies, v.8, pp. 3 – 12.
Thompson, R., Wang, Y., Bishop, I., 2019. Integrating GIS with
intelligent transport system and stochastic programming for
improved vehicle scheduling. Available from:
https://www.researchgate.net/publication/265410821 (30 March
2019).
TRANSMODEL, 2015. Data model in Enterprise Architect
format. Available from: http://www.transmodel-
cen.eu/wpcontent/uploads/sites/2/Trm6-Part-1-2-3-
Sept2015.eap_.zip (20 September 2018)
Revised April 2019
The International Archives of the Photogrammetry, Remote Sensing and Spatial Information Sciences, Volume XLII-2/W13, 2019 ISPRS Geospatial Week 2019, 10–14 June 2019, Enschede, The Netherlands
This contribution has been peer-reviewed. https://doi.org/10.5194/isprs-archives-XLII-2-W13-1495-2019 | © Authors 2019. CC BY 4.0 License.
1502