a small system solution for manganese removal · four treatment processes selected for ... koch...
TRANSCRIPT
A Small SystemSolution for Manganese Removal
Ryan J. Trahan, P.E. John TetreaultAssociate Partner Water SuperintendentAmory Engineers, P.C. Town of Avon, MADuxbury, MA

Presentation Outline Avon Background & Historic Water Quality
Pilot Study
WTP Design & Construction
Results & Operational Procedures
Conclusion

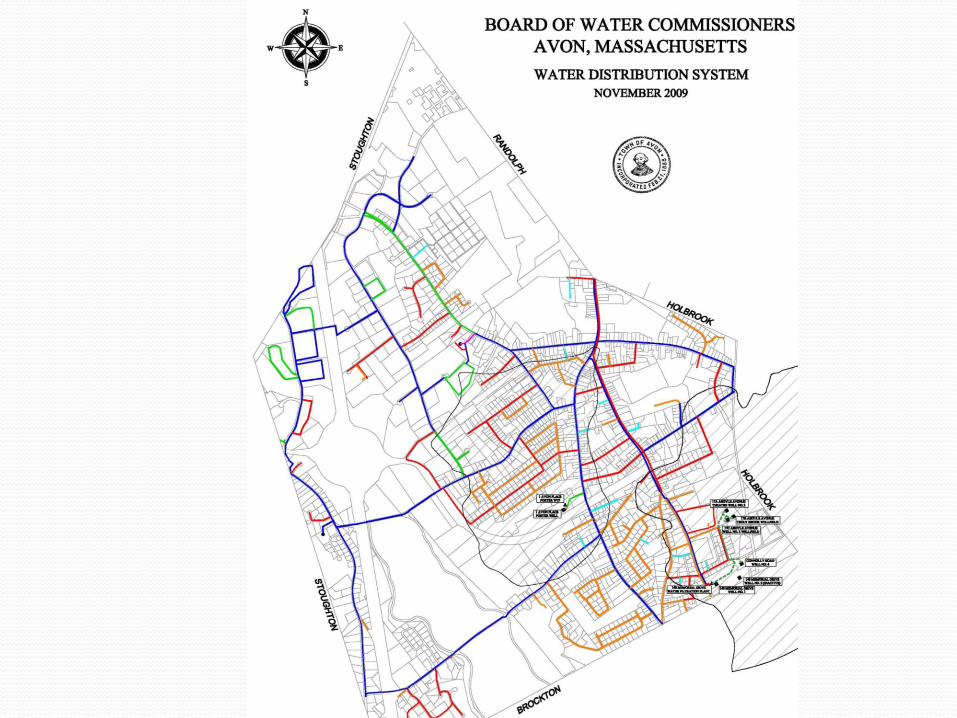
Background Location North of Brockton and East of Stoughton
Distribution System Population Served – 4,400
Active Well Supplies – 6 (All Groundwater)
Water Storage Facilities – 2 (Total of 2.5 MG)
43 Miles of Distribution Watermains
All well supplies in Taunton River Basin
Avg. Day Demand – 0.43 MGD
Max Day Demand – 0.61 MGD
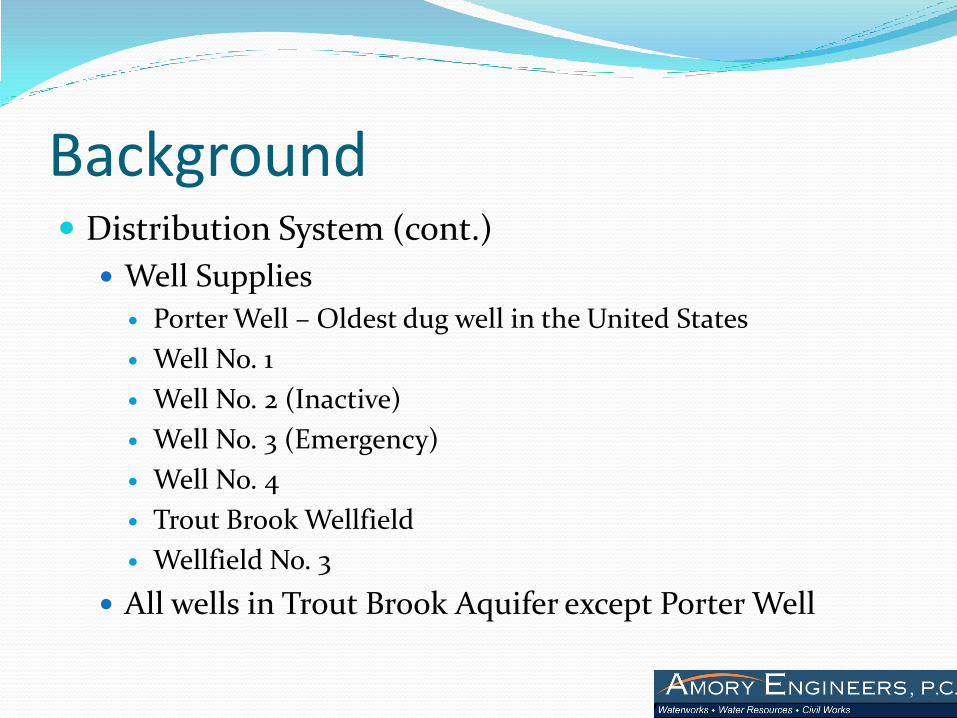
Background Distribution System (cont.)
Well Supplies
Porter Well – Oldest dug well in the United States
Well No. 1
Well No. 2 (Inactive)
Well No. 3 (Emergency)
Well No. 4
Trout Brook Wellfield
Wellfield No. 3
All wells in Trout Brook Aquifer except Porter Well
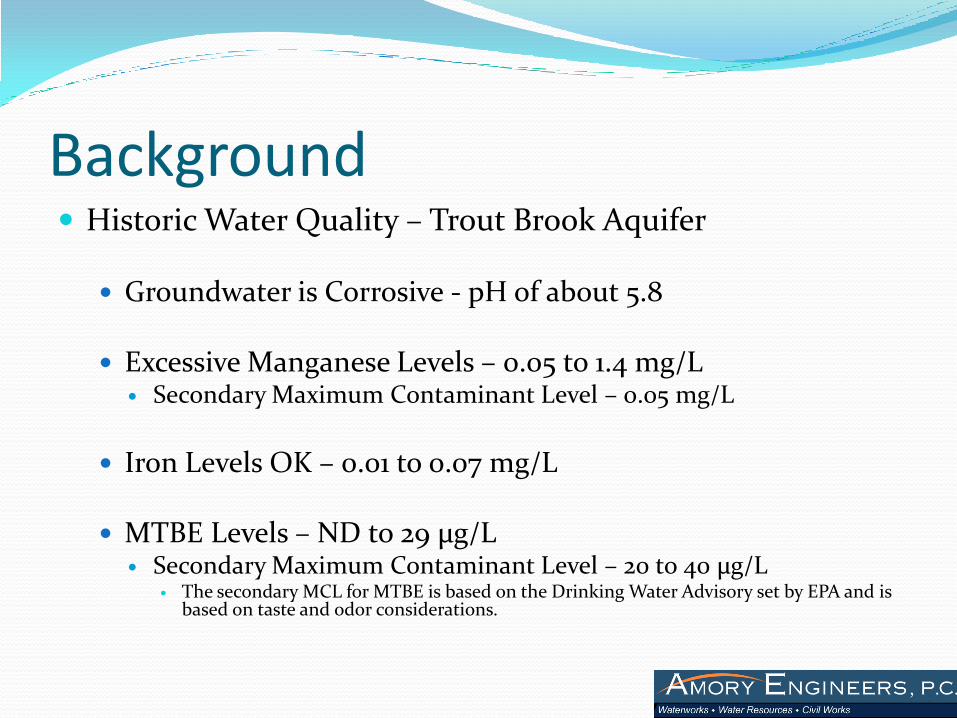
Background Historic Water Quality – Trout Brook Aquifer
Groundwater is Corrosive - pH of about 5.8
Excessive Manganese Levels – 0.05 to 1.4 mg/L Secondary Maximum Contaminant Level – 0.05 mg/L
Iron Levels OK – 0.01 to 0.07 mg/L
MTBE Levels – ND to 29 µg/L Secondary Maximum Contaminant Level – 20 to 40 µg/L
The secondary MCL for MTBE is based on the Drinking Water Advisory set by EPA and is based on taste and odor considerations.

Background Historic Water Quality – Trout Brook Aquifer (cont.)
Poorest Water Quality – Well 1 Mn Levels 0.21 to 0.81 mg/L
pH 5.9
MTBE Levels ND - 29 µg/L
Adjacent to gasoline contamination in Brockton
Decision to Proceed with Pilot Testing Loss of public confidence in drinking water
Reduction of frequent flushing
Appropriation of funds in 2006
Pilot Study Conducted in Spring/Summer 2006
Four treatment processes selected for Mn removal
Membrane Filtration Koch Membrane Systems
Zenon Environmental (now GE)
Pressure Filtration
Hungerford & Terry
Layne Christensen

Pilot Study MTBE removal piloted concurrently
Selected process - GAC
GAC filter furnished by Norit Americas
Hungerford & Terry ran the process concurrent with their pilot
Well No. 1 raw water utilized for all piloted processes
Raw water quality throughout testing
Mn Concentrations – 0.3 mg/L
MTBE Concentrations – 7 µg/L
Pilot Study Goals
Reduce Mn concentration to ≤0.03 mg/L
Reduce MTBE concentration to non-detect
Optimize production and chemical dosage
Minimize capital cost of full-scale treatment

Pilot Study Koch Membrane Systems
Ultrafiltration hollow-fiber membranes
Raw water pH raised to 7.7
Potassium Permanganate utilized as oxidant
Dosage rate about 0.96 mg/L
“Inside-out” – Clean water forced across membranes to outside under slight positive pressure to inside of fibers
Oxidized manganese discharged to waste
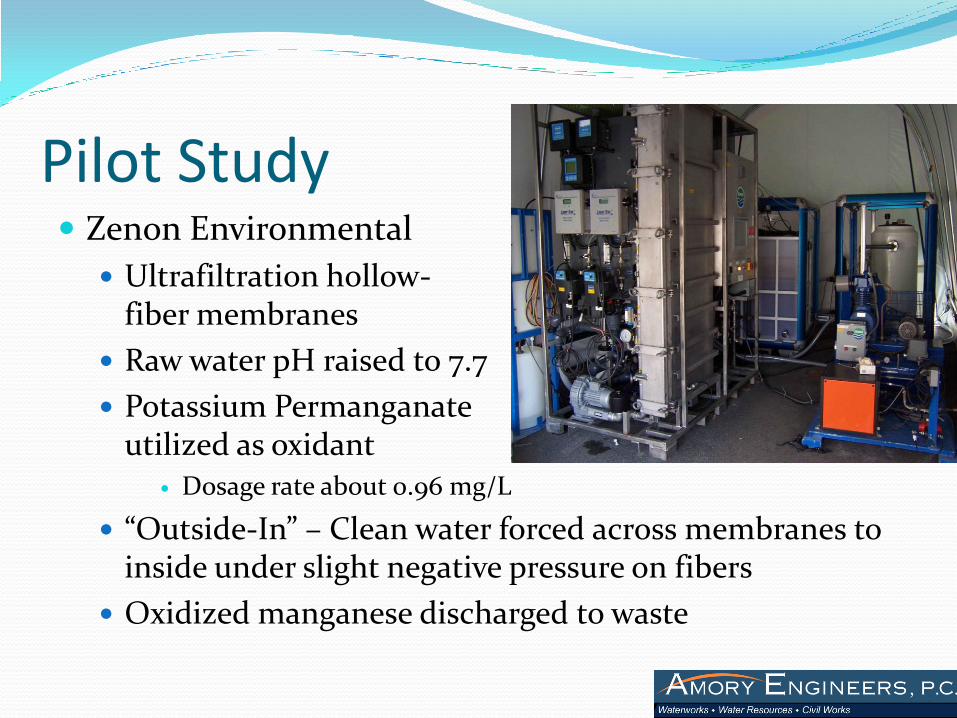
Pilot Study Zenon Environmental
Ultrafiltration hollow-fiber membranes
Raw water pH raised to 7.7
Potassium Permanganate utilized as oxidant
Dosage rate about 0.96 mg/L
“Outside-In” – Clean water forced across membranes to inside under slight negative pressure on fibers
Oxidized manganese discharged to waste
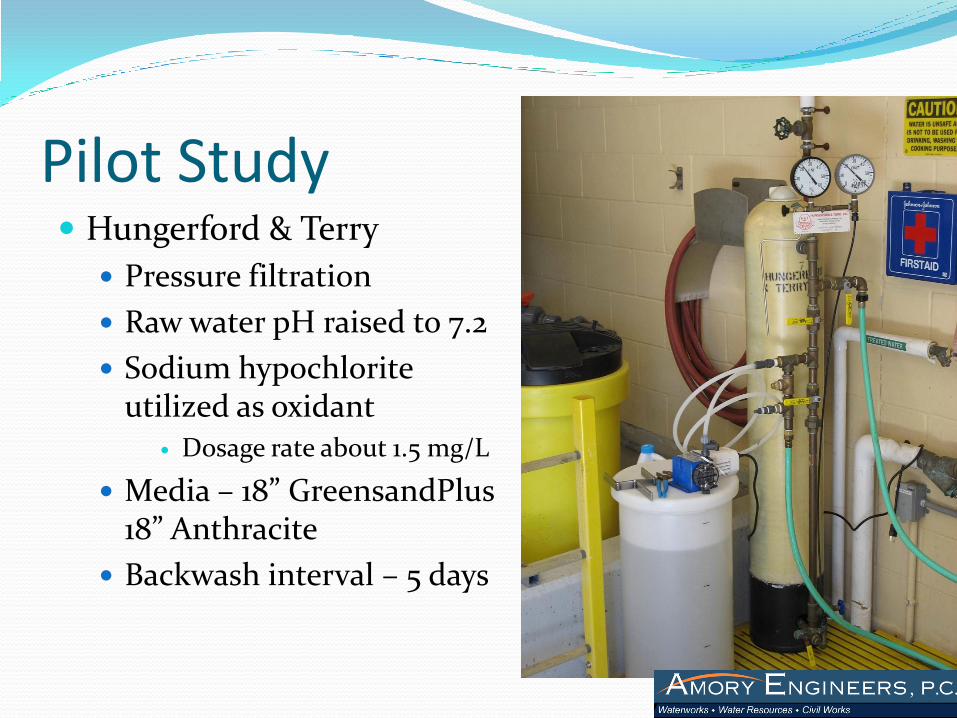
Pilot Study Hungerford & Terry
Pressure filtration
Raw water pH raised to 7.2
Sodium hypochlorite utilized as oxidant
Dosage rate about 1.5 mg/L
Media – 18” GreensandPlus18” Anthracite
Backwash interval – 5 days

Pilot Study Layne Christensen
Pressure filtration
Raw water pH raised to 7.2
Sodium hypochlorite utilized as oxidant
Dosage rate about 1.0 mg/L
Media – 48” of LayneOx
Backwash interval – 5 days
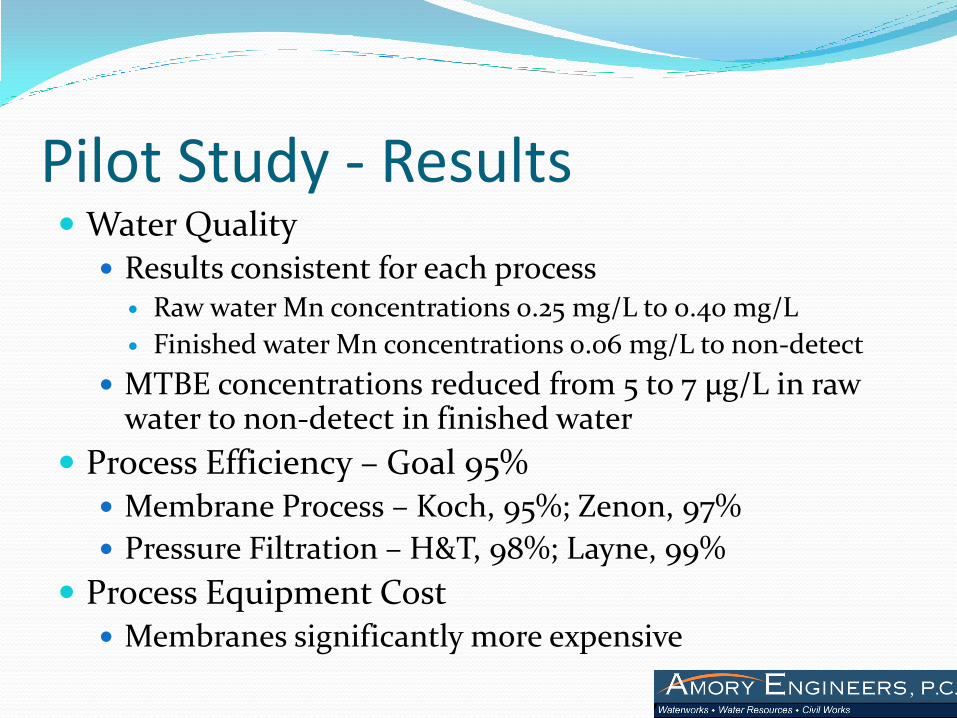
Pilot Study - Results Water Quality Results consistent for each process Raw water Mn concentrations 0.25 mg/L to 0.40 mg/L
Finished water Mn concentrations 0.06 mg/L to non-detect
MTBE concentrations reduced from 5 to 7 µg/L in raw water to non-detect in finished water
Process Efficiency – Goal 95% Membrane Process – Koch, 95%; Zenon, 97%
Pressure Filtration – H&T, 98%; Layne, 99%
Process Equipment Cost Membranes significantly more expensive

WTP Design Selection of Treatment Processes
Pressure filtration for Mn removal
GAC for MTBE removal
Procurement of Process Equipment Equipment footprints vary by manufacturer
Building design and process piping dependent on selected manufacturer
Selection of Manufacturer H&T selected for Mn removal
Calgon Carbon for MTBE removal
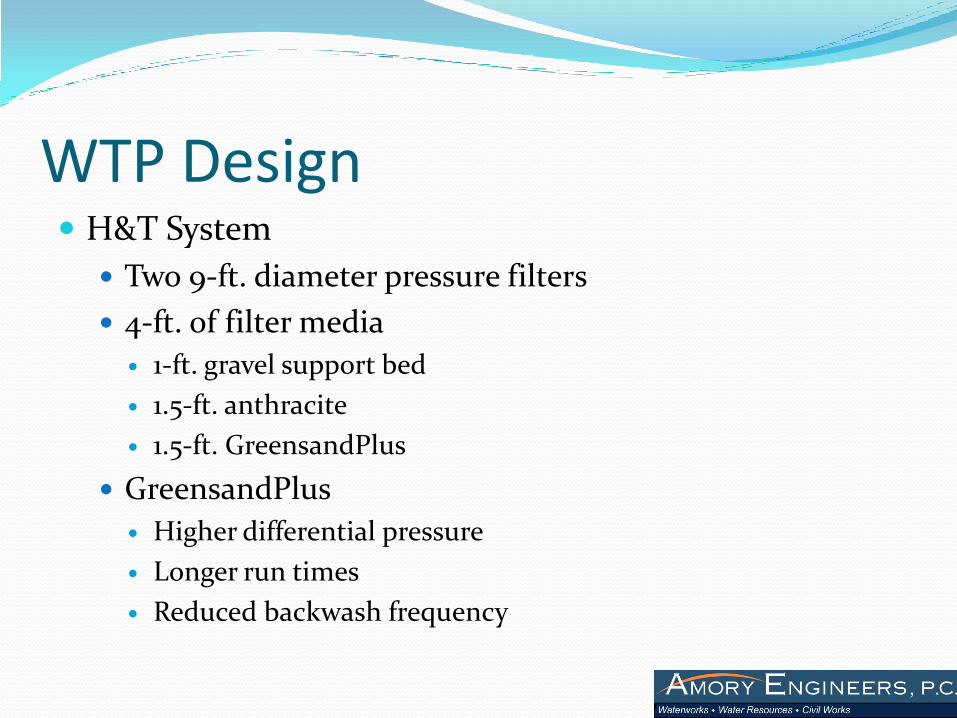
WTP Design H&T System
Two 9-ft. diameter pressure filters
4-ft. of filter media
1-ft. gravel support bed
1.5-ft. anthracite
1.5-ft. GreensandPlus
GreensandPlus
Higher differential pressure
Longer run times
Reduced backwash frequency
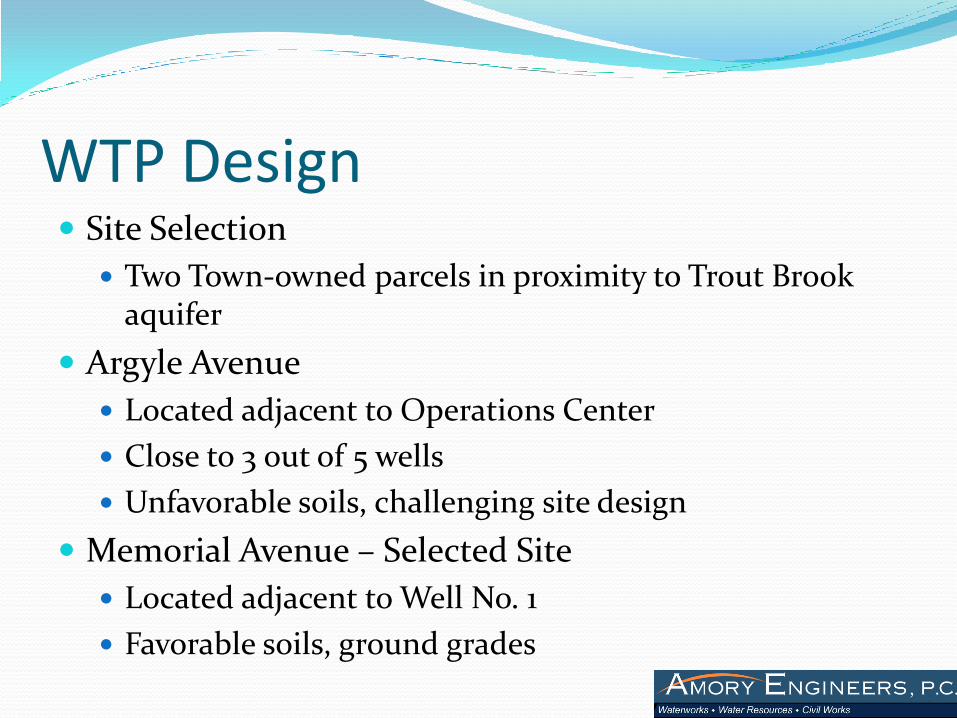
WTP Design Site Selection
Two Town-owned parcels in proximity to Trout Brook aquifer
Argyle Avenue
Located adjacent to Operations Center
Close to 3 out of 5 wells
Unfavorable soils, challenging site design
Memorial Avenue – Selected Site
Located adjacent to Well No. 1
Favorable soils, ground grades
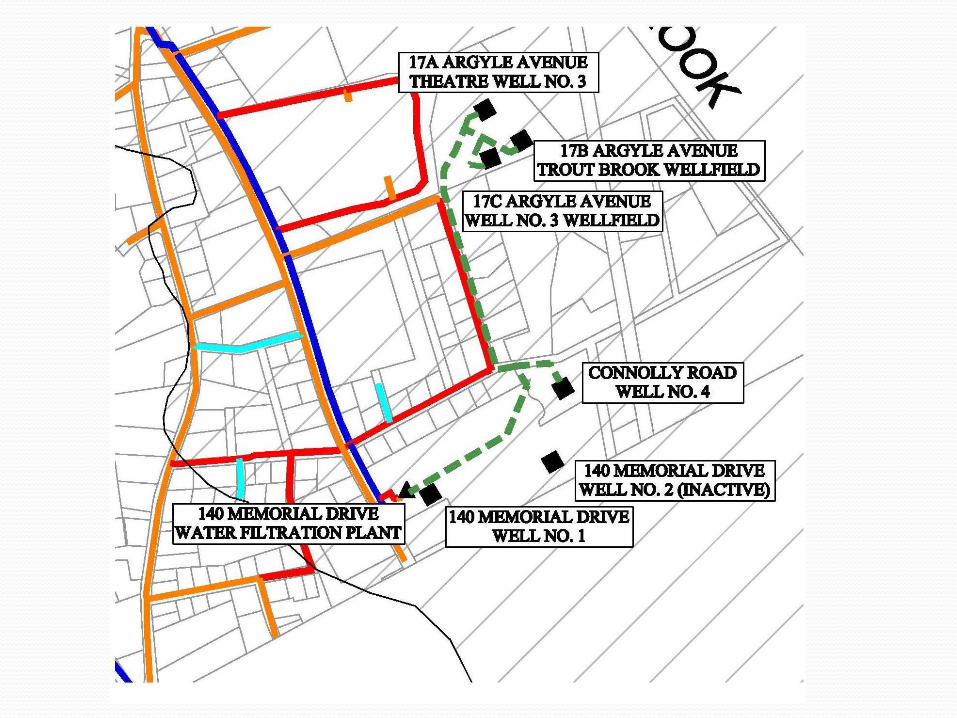
WTP Design Transmission Main
Conveys water from Wells 3 & 4 and Trout Brook and Well 3 wellfields
Partially directionally drilled through wetlands
Corrosion Control Facilities
Utilized existing facilities to continue to raise pH and add sodium hypochlorite as an oxidant
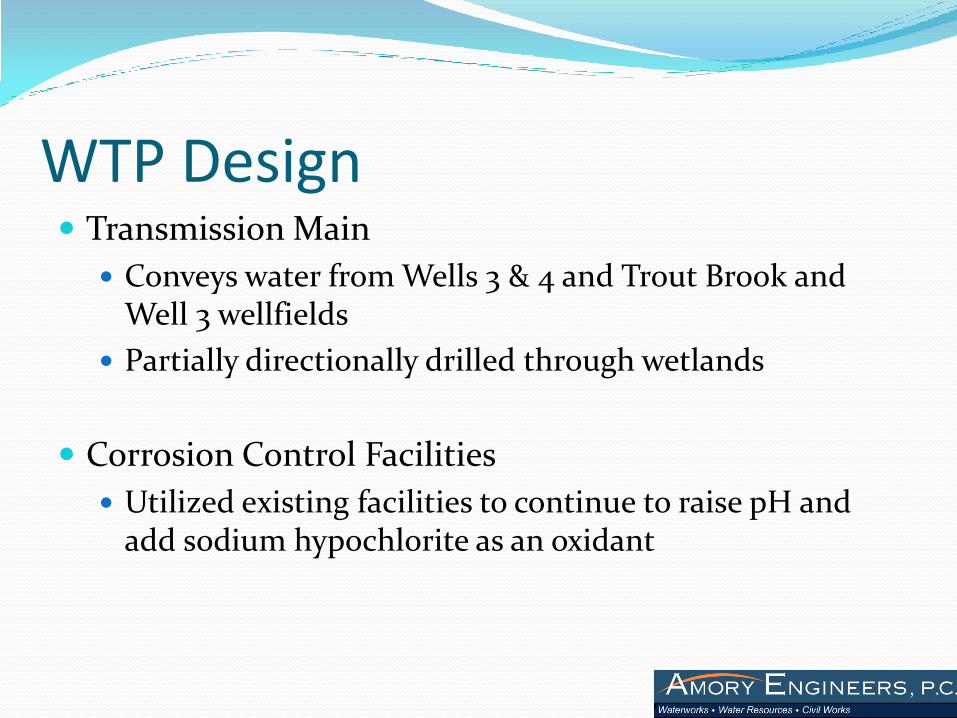
WTP Design
Building
52-ft. x 70-ft. pre-engineered metal building
Office/Control Room
Chemical Feed System
Sodium hypochlorite fed in plant discharge
Clearwell
13,000 gallon capacity
2 High-lift pumps
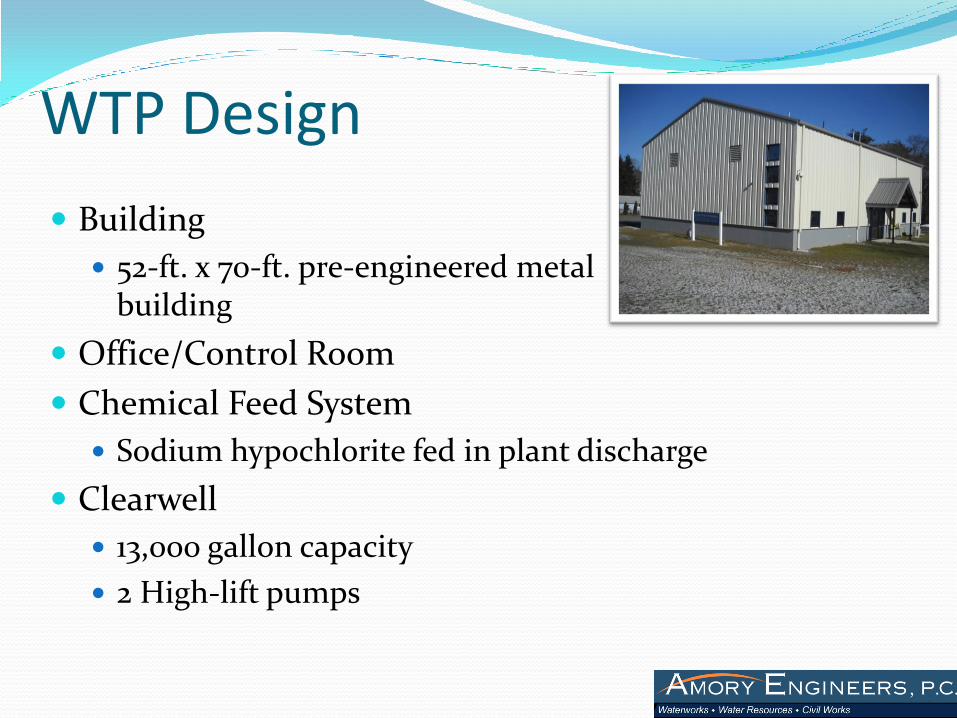
WTP Design
Calgon Carbon – MTBE removal System can be bypassed
Two-Tiered Lagoon System
Standby Power – Natural Gas Generator
Instrumentation System
Security System

WTP Process Flow Diagram

H&T Pressure Filters

H&T Effluent
“Intermediate Water”
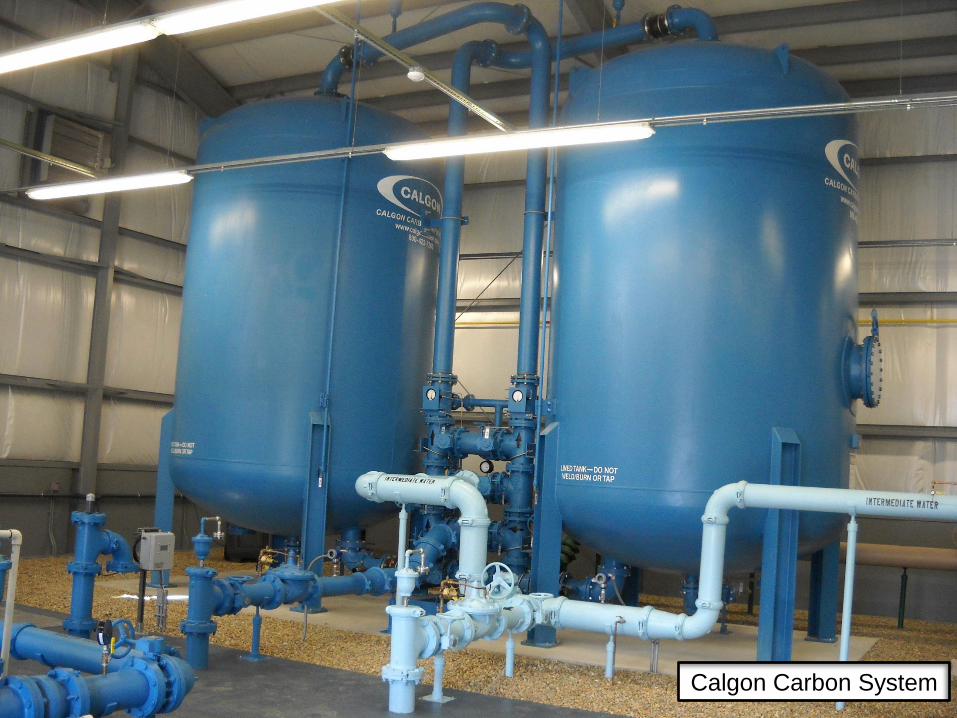
Calgon Carbon System

Clearwell
High-Lift Pumps
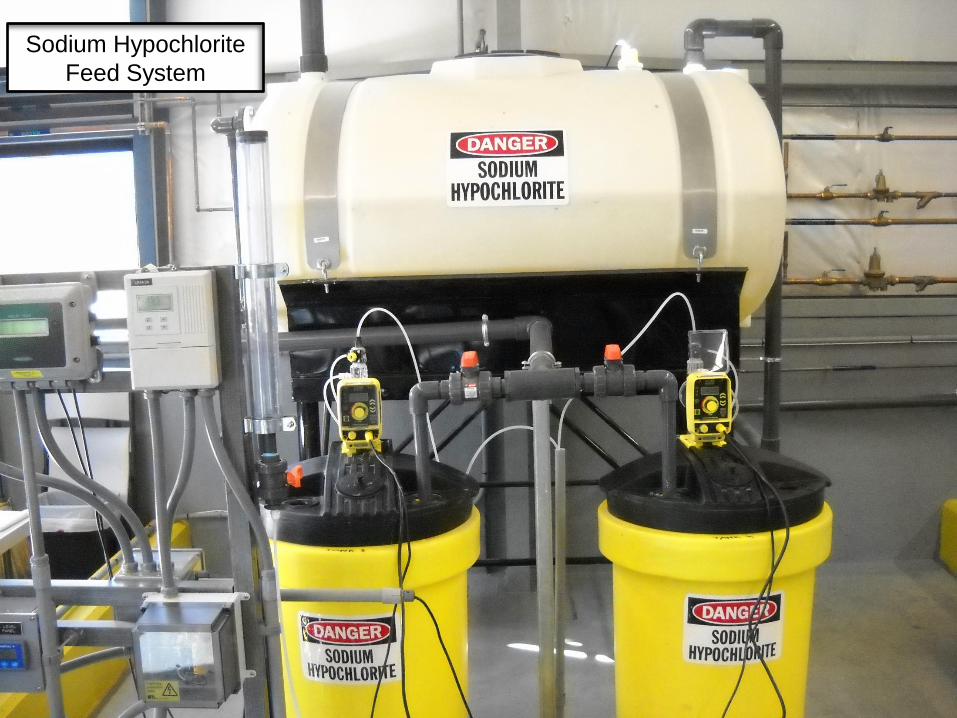
Sodium Hypochlorite
Feed System
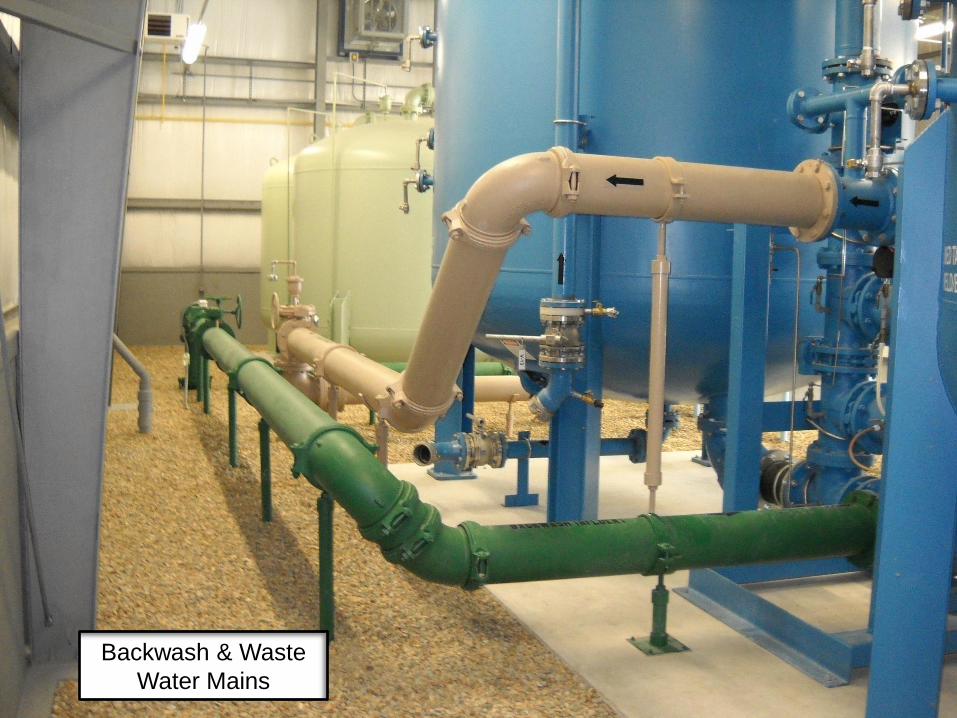
Backwash & Waste
Water Mains
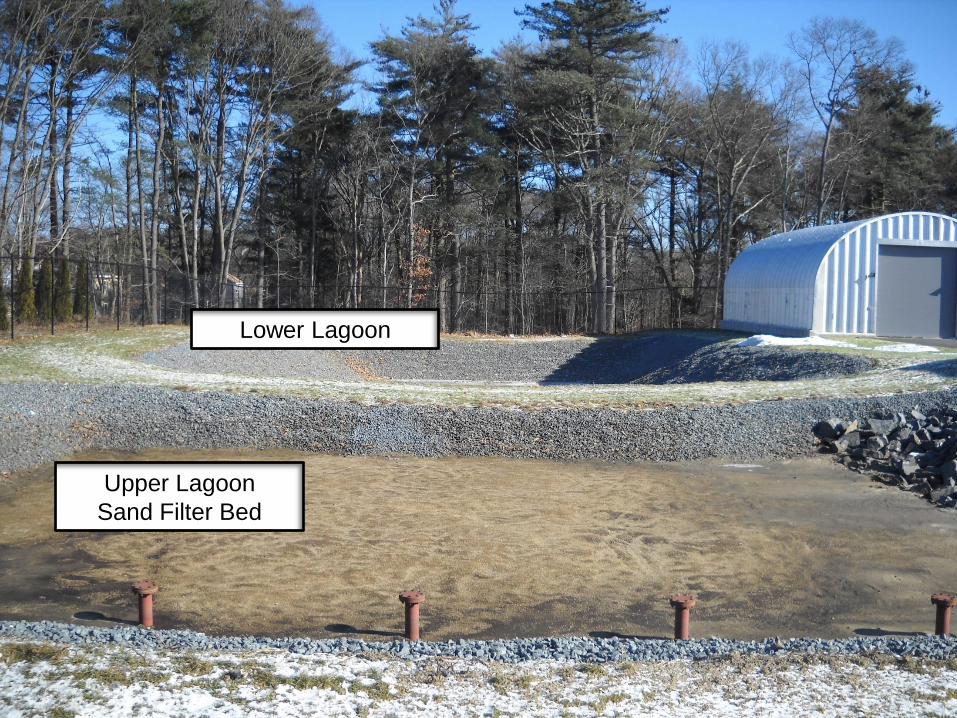
Upper Lagoon
Sand Filter Bed
Lower Lagoon
Results & Operational Procedures WTP Online October 30, 2009
Instrumentation/Security System
Water Quality Testing
Reduction of distribution system entry points
Blending of Water
Reduction of influent Mn concentrations
Prolonged backwash cycles
Results & Operational Procedures Backwash Frequency
Default setting - differential pressure of 10 psi
Town reset to 5 psi
Backwash once every 3 days
Backwash also initiated by runtime
Fully automated
Calgon Carbon System
Manual backwash system
Backwash once per year
Results & Operational Procedures Monitoring
Influent and effluent Mn concentrations
Differential pressures for both H&T and Calgon systems
Raw and finished water pH
Raw and finished water chlorine concentration
Intermediate water chlorine concentration
Conclusions Manganese Concentrations
Goal ≤0.03 mg/L
Finished water often non-detect
Plant Efficiency
Goal 95%
Currently 97.4%
Total Cost: $2.3 million
Meeting water quality expectations!
Questions? Contact Information
John Tetreault, Water SuperintendentTown of Avon, MAP: 508-588-0414Email: [email protected]
Ryan Trahan, P.E., Associate PartnerAmory Engineers, P.C.Duxbury, MAP: 781-934-0178Email: [email protected]