process analysis of asymmetric hollow fiber permeators
TRANSCRIPT

Process Analysis of Asymmetric Hollow Fiber Permeators,
Unsteady State Permeation and Membrane-Amine Hybrid
Systems for Gas Separations
by
Prodip Kundu
A thesis
presented to the University of Waterloo
in fulfillment of the
thesis requirement for the degree of
Doctor of Philosophy
in
Chemical Engineering
Waterloo, Ontario, Canada, 2013
© Prodip Kundu 2013

Author’s Declaration
ii
I hereby declare that I am the sole author of this thesis. This is a true copy of the
thesis, including any required final revisions, as accepted by my examiners.
I understand that my thesis may be made electronically available to the public.

Abstract
iii
The global market for membrane separation technologies is forecast to reach $16
billion by the year 2017 due to wide adoption of the membrane technology across various
end-use markets. With the growth in demand for high quality products, stringent
regulations, environmental concerns, and exhausting natural resources, membrane
separation technologies are forecast to witness significant growth over the long term
(Global Industry Analysts Inc., 2011). The future of membrane technology promises to be
equally exciting as new membrane materials, processes and innovations make their way to
the marketplace. The current trend in membrane gas separation industry is, however, to
develop robust membranes, which exhibit superior separation performance, and are reliable
and durable for particular applications. Process simulation allows the investigation of
operating and design variables in the process, and in new process configurations. An
optimal operating condition and/or process configuration could possibly yield a better
separation performance as well as cost savings. Moreover, with the development of new
process concepts, new membrane applications will emerge.
The thesis addresses developing models that can be used to help in the design and
operation of CO2 capture processes. A mathematical model for the dynamic performance of
gas separation with high flux, asymmetric hollow fiber membranes was developed
considering the permeate pressure build-up inside the fiber bore and cross flow pattern with
respect to the membrane skin. The solution technique is advantageous since it requires
minimal computational effort and provides improved solution stability. The model
predictions and the robustness of the numerical technique were validated with experimental
data for several membrane systems with different flow configurations. The model and
solution technique were applied to investigate the performance of several membrane
module configurations for air separation and methane recovery from biogas (landfill gas or
digester gas). Recycle ratio plays a crucial role, and optimum recycle ratios vital for the
retentate recycle to permeate and permeate recycle to feed operation were found. From the
concept of two recycle operations, complexities involved in the design and operation of
continuous membrane column were simplified. Membrane permselectivity required for a
targeted separation to produce pipeline quality natural gas by methane-selective or
nitrogen-selective membranes was calculated. The study demonstrates that the new
Abstract
iv
solution technique can conveniently handle the high-flux hollow fiber membrane problems
with different module configurations.
A section of the study was aimed at rectifying some commonly believed
perceptions about pressure build-up in hollow fiber membranes. It is a general intuition that
operating at higher pressures permeates more gases, and therefore sometimes the
membrane module is tested or characterized at lower pressures to save gas consumption. It
is also perceived that higher pressure build-up occurs at higher feed pressures, and
membrane performance deteriorates at higher feed pressures. The apparent and intrinsic
permeances of H2 and N2 for asymmetric cellulose acetate-based hollow fiber membranes
were evaluated from pure gas permeation experiments and numerical analysis, respectively.
It was shown that though the pressure build-up increases as feed pressure increases, the
effect of pressure build-up on membrane performance is actually minimized at higher feed
pressures. Membrane performs close to its actual separation properties if it is operated at
high feed pressures, under which conditions the effect of pressure build-up on the
membrane performance is minimized. The pressure build-up effect was further investigated
by calculating the average loss and percentage loss in the driving force due to pressure
build-up, and it was found that percentage loss in driving force is less at high feed
pressures than that at low feed pressures.
It is true that unsteady state cyclic permeation process can potentially compete with
the most selective polymers available to date, both in terms selectivity and productivity. A
novel process mode of gas separation by means of cyclic pressure-vacuum swings for feed
pressurization and permeate evacuation using a single pump was evaluated for CO2
separation from flue gas. Unlike transient permeation processes reported in the literature
which were based on the differences in sorption uptake rates or desorption falloff rates, this
process was based on the selective permeability of the membrane for separations. The
process was analyzed to elucidate the working principle, and a parametric study was
carried out to evaluate the effects of design and operating parameters on the separation
performance. It was shown that improved separation efficiency (i.e., product purity and
Abstract
v
throughput) better than that of conventional steady-state permeation could be obtained by
means of pressure-vacuum swing permeation.
The effectiveness of membrane processes and feasibility of hybrid processes
combining membrane permeation and conventional amine absorption process were
investigated for post-combustion CO2 capture. Traditional MEA process uses a substantial
amount of energy at the stripper reboiler when CO2 concentration increases. Several single
stage and multi-stage membrane process configurations were simulated for a target design
specification aiming at possible application in enhanced oil recovery. It was shown that
membrane processes offer the lowest energy penalty for post-combustion CO2 capture and
likely to expand as more and more CO2 selective membranes are developed. Membrane
processes can save up to 20~45% energy compared to the stand-alone MEA capture
processes. A comparison of energy perspective for the CO2 capture processes studied was
drawn, and it was shown that the energy requirements of the hybrid processes are less than
conventional MEA processes. The total energy penalty of the hybrid processes decreases as
more and more CO2 is removed by the membranes.
Acknowledgements
vi
I would like to begin by sincerely thanking my advisors Dr. Xianshe Feng and Dr.
Amit Chakma for their constant support, guidance and mentorship over the last four years.
I had always pestered Dr. Feng with tons of silly questions and doubts, and it was very kind
of him to have answered all my questions patiently. Whenever I was bereft of ideas, my
discussions with him and his insights always helped me to get back on the right track. I am
grateful to him and will ever remain. Special thanks to Dr. Chakma, whose success stories
are inspiration to the thousands of my fellow people and I am very proud to have him as
my advisor. I would also like to thank my thesis committee members Dr. Ali Elkamel, Dr.
Zhongwei Chen and Dr. Sigrid Peldszus for being my mentors and for their valuable
suggestions.
I would like to take this opportunity to thank all my colleagues and friends for their
encouragement and friendship.
Lastly, I am thankful to my parents, my sister and my wife Keya for their unceasing
love, understanding and encouragements.
Financial support as the Ontario Graduate Scholarship (OGS) and Research support
from Natural Sciences and Engineering Research Council of Canada (NSERC) is gratefully
acknowledged.

Dedication
vii
To
My Parents
Table of Contents
viii
Author's Declaration ........................................................................................................ ii
Abstract............................................................................................................................. iii
Acknowledgements .......................................................................................................... vi
Dedication ........................................................................................................................ vii
Table of Contents ........................................................................................................... viii
List of Figures................................................................................................................. xiii
List of Tables ....................................................................................................................xx
List of Abbreviations .................................................................................................... xxii
List of Symbols ............................................................................................................. xxiii
Chapter 1: Introduction................................................................................................1
1.1 Background..................................................................................................1
1.2 Motivation....................................................................................................2
1.3 Research objectives......................................................................................4
1.4 Outline of the thesis .....................................................................................5
Chapter 2: Features of hollow fiber membranes, unsteady state permeation
and membrane hybrid systems for gas separations................................7
2.1 Introduction..................................................................................................7
2.2 Membrane-based gas separation: A brief history ........................................8
2.3 Gas transport mechanism.............................................................................9
2.4 Membrane materials ..................................................................................13
2.4.1 Polymeric membranes....................................................................14
2.5 Types of membrane modules: Hollow fibers.............................................16
Table of Contents
ix
2.6 Modeling of hollow fiber permeators ........................................................17
2.6.1 High flux asymmetric membranes.................................................21
2.6.2 Feed compression, vacuum pumping and sweep gas
operation ........................................................................................23
2.6.3 Pressure build-up in hollow fiber membranes ...............................23
2.6.4 Apparent and intrinsic permeances................................................25
2.6.5 Numerical techniques and solution scheme...................................27
2.7 Membrane process modules and cascade configurations ..........................28
2.7.1 Recycle and multiple stage permeators .........................................29
2.7.2 Unsteady state and cyclic operations .............................................30
2.7.3 Membrane hybrid systems .............................................................32
2.8 Industrial applications of membrane gas separation..................................34
2.8.1 CO2 removal and capture...............................................................34
2.8.2 Nitrogen- and oxygen-enriched air production..............................37
2.9 MEA-based CO2 capture technology.........................................................38
2.10 Conclusions................................................................................................40
Chapter 3: Simulation of binary gas separation with asymmetric hollow
fiber membranes and case studies of air separation.............................42
3.1 Introduction................................................................................................42
3.2 Mathematical modeling .............................................................................46
3.3 Solution technique of model equations......................................................50
3.4 Validation of the model and solution technique ........................................52
3.5 Membranes air separation: Case studies....................................................58
3.5.1 Performance in single-stage without recycle .................................61
3.5.2 Single-stage with permeate recycle to feed stream........................65
3.5.3 Single-stage with retentate recycle to feed stream.........................67
3.5.4 Single-stage with permeate blending with a portion of feed .........69
3.5.5 Two permeators in series ...............................................................71
3.6 Conclusions.................................................................................................73
Table of Contents
x
Chapter 4: Modeling of multicomponent gas separation with asymmetric
hollow fiber membranes – methane enrichment from biogas .............75
4.1 Introduction................................................................................................75
4.2 Mathematical modeling for simulation of asymmetric hollow fiber
membranes .................................................................................................78
4.3 Numerical technique of the proposed model .............................................81
4.4 Validation of the proposed model and simulation scheme ........................81
4.5 Characteristics of biogas and challenges in separation of methane
from biogas ................................................................................................83
4.6 Dynamic membrane module configurations for methane enrichment.......85
4.6.1 Single-stage without recycle..........................................................86
4.6.2 Single-stage with retentate recycle to the permeate side ...............87
4.6.3 Single-stage with permeate recycle to the feed side ......................89
4.6.4 Continuous membrane column ......................................................92
4.6.5 Two-stage cascade with reflux and two stages in
parallel/series .................................................................................94
4.6.6 Nitrogen removal with methane-selective membranes..................96
4.7 Conclusions.................................................................................................98
Chapter 5: Effect of permeate pressure build-up on intrinsic separation
performance of asymmetric hollow fiber membranes .......................100
5.1 Introduction..............................................................................................100
5.2 Materials and methods .............................................................................102
5.2.1 Gas permeation experiment .........................................................102
5.2.2 Numerical analysis.......................................................................104
5.3 Results and discussion .............................................................................105
5.4 Conclusions..............................................................................................118
Chapter 6: Application of unsteady state cyclic pressure-vacuum swing
permeation for CO2 separation from flue gas .....................................120
Table of Contents
xi
6.1 Introduction..............................................................................................120
6.2 Operating cycle of pressure-vacuum swing permeation assisted with
a single pump...........................................................................................123
6.3 Analysis of the permeation behavior .......................................................126
6.3.1 Step 1: Feed pressurization ..........................................................126
6.3.2 Step 2: Feed admission/permeation .............................................127
6.3.3 Step 3: Pump function switch from compression to
evacuation ....................................................................................129
6.3.4 Step 4: Permeation and permeate evacuation ..............................129
6.3.5 Step 5: Residue venting ...............................................................130
6.4 Application of pressure-vacuum swing permeation to flue gas
separation .................................................................................................130
6.5 Performance of pressure-vacuum swing permeation and comparison
with conventional membrane process......................................................141
6.6 Conclusions..............................................................................................144
Chapter 7: Effectiveness of membrane processes and feasibility of
membrane-amine hybrid systems for post-combustion CO2
capture ....................................................................................................146
7.1 Introduction..............................................................................................146
7.2 Design basis and process description.......................................................148
7.2.1 Membrane processes....................................................................148
7.2.2 Amine absorption processes ........................................................150
7.2.3 Hybrid membrane processes........................................................153
7.3 Results and discussion .............................................................................154
7.4 Conclusions..............................................................................................167
Chapter 8: Conclusions and future recommendations ..........................................169
8.1 General conclusions and contributions ....................................................169
8.1.1 Modeling and simulation of hollow fiber membranes.................169
Table of Contents
xii
8.1.2 Membrane process configurations ...............................................169
8.1.3 Effect of permeate pressure build-up on intrinsic permeances....170
8.1.4 Novel process of pressure-vacuum swing permeation ................170
8.1.5 Membrane-amine hybrid systems for post-combustion CO2
capture..........................................................................................171
8.2 Future recommendations..........................................................................171
8.2.1 Gas permeation membrane networks...........................................171
8.2.2 Experimental investigation of pressure-vacuum swing
permeation process ......................................................................172
8.2.3 Economic evaluation of membrane-amine hybrid systems .........172
Copyright Permissions ..................................................................................................173
References: .................................................................................................................175
Appendix A: Extent of separation at permeate vacuum operation................................190
Appendix B: Methane production from Canadian municipal solid wastes...................191
Appendix C: Sample computer programs .....................................................................194
Appendix D: Aspen Plus® input/output data for hybrid membrane systems ...............204

List of Figures
xiii
Fig. 1.1 Schematic of research objectives and scope. 4
Fig. 2.1 Schematic of main mechanisms for gas permeation through membranes (Baker, 2004). 10
Fig. 2.2 Schematic of solution-diffusion model. 11
Fig. 2.3 Twin-orifice spinneret design used in solution-spinning of hollow fiber membranes (Baker, 2004). 16
Fig. 2.4 Membrane model with (a) completely mixed flow, and (b) cross flow pattern (Zakaria, 2006). 18
Fig. 2.5 Countercurrent and cocurrent flow patterns in hollow fiber permeator. 19
Fig. 2.6 Schematic of cross-flow pattern permeation in asymmetric membrane (Sengupta and Sirkar, 1995). 21
Fig. 2.7 Permeate pressure build-up or feed pressure drop in hollow fiber permeator (Zakaria, 2006). 24
Fig. 2.8 Schematic of MEA process. 39
Fig. 3.1 Schematic of (a) countercurrent flow shell-side feed; (b) cocurrent flow shell-side feed; (c) countercurrent flow bore-side feed and (d) cocurrent flow bore-side feed pattern in a hollow fibre permeator. 47
Fig. 3.2 Comparison of model predictions with experimental data (Feng et al., 1999) for air separation with shell-side feed/countercurrent flow. 52
Fig. 3.3 Variations of bulk permeate (y) and local permeate (y′) mole fraction along fibre length at different stage cuts (θ) under shell-side feed/countercurrent flow conditions for (a) air separation (Feng et al., 1999) with an active fibre length of 1.25 m, and (b) H2 separation (Zakaria, 2006). 54
Fig. 3.4 (a) Oxygen productivity versus oxygen purity in permeate for air separation with shell-side feed/countercurrent flow configuration with/without considering permeate pressure build-up. The membrane performance is overestimated if the permeate pressure build up is not considered. (b) Percentage of productivity overestimation with oxygen purity in permeate while pressure build-up was neglected. 55
List of Figures
xiv
Fig. 3.5 Comparison of model predictions with experimental data (Zakaria, 2006) for hydrogen recovery to illustrate the validity of the model for various configurations: (a) shell-side feed/countercurrent flow, (b) shell-side feed/cocurrent flow, (c) bore-side feed/countercurrent flow and (d) bore-side feed/cocurrent flow. 56
Fig. 3.6 Different configurations analysed in this study: (a) single-stage, (b) single-stage with permeate recycle, (c) single-stage with retentate recycle, (d) single-stage permeate blending with air bleed, (e) two stages in series. 60
Fig 3.7 Concentrations of oxygen (a–c) and nitrogen (d–f) in permeate and residue, respectively, as a function of stage cut at different feed pressures (single-stage). Membrane configuration: shell side feed and counter-current flow. 62
Fig. 3.8 The trade-off relationship between recovery and concentration for air separation at different feed pressures (single-stage) to produce oxygen-enriched air (a–c) and nitrogen-enriched air (d–f). Membrane configuration: shell side feed and counter-current flow. 64
Fig. 3.9 Productivity versus product concentration for air separation (single-stage) to produce oxygen-enriched air (a–c) and nitrogen-enriched air (d–f). Membrane configuration: shell side feed and counter-current flow. 65
Fig. 3.10 Oxygen concentration (a and b) and productivity (c and d) versus recovery for single-stage operation with permeate recycle using polysulfone membrane at different pressures (690 and 1035 kPa). For comparison, single stage without permeate recycle is also shown (solid line). Membrane configuration: shell side feed and counter-current flow. 67
Fig. 3.11 Nitrogen recovery and productivity versus purity for single-stage operation with retentate recycle using polysulfone membrane at different pressures (a and c) 690 kPa (b and d) 1035 kPa. Membrane configuration: shell side feed and counter-current flow. 68
Fig. 3.12 Productivity of oxygen as a function of permeate oxygen concentration at different pressures using polysulfone membrane with and without air blending. Membrane configuration: shell side feed and counter-current flow. 70
List of Figures
xv
Fig. 3.13 A comparison of two modules in series with a single stage operation in terms of productivity (a) and recovery (b) for nitrogen production as a function of nitrogen purity. Membrane configuration: shell side feed and counter-current flow. 72
Fig. 3.14 Percentage increases in productivity and recovery for nitrogen production using the two modules in series operation as compared to the single stage operation. Feed pressure 1035 kPa. 73
Fig. 4.1 Schematic of (a) single-stage shell-side feed permeator with countercurrent flow configuration, (b) single-stage membrane permeator with retentate recycle to permeate side, and (c) single-stage permeator with permeate recycle to the feed side. 79
Fig. 4.2 Comparison of model calculations with experimental data (Sada et al., 1992) for CO2 separation by asymmetric cellulose triacetate hollow fibers with shell-side feed countercurrent flow (feed composition: CO2 50%, O2 10.5%, and N2 39.5%). 82
Fig. 4.3 Comparison of model calculation with experimental data (Kaldis et al., 2000) for hydrogen recovery from refinery gas by polyimide hollow fibers with shell-side feed countercurrent flow (feed composition: H2 67.5%, CH4 16.7%, CO2 11.5%, and C2H6 4.3%). 83
Fig. 4.4 Performance of single-stage permeation at different feed pressures, (a) retentate CH4 concentration. (b) CH4 recovery, and (c) CH4 productivity. 86
Fig. 4.5 Effects of retentate recycle on the performance of single-stage permeation at different feed pressures. (a) Retentate CH4 concentration, (b) CH4 recovery, and (c) CH4 productivity. 88
Fig. 4.6 Extent of separation achievable from single-stage permeation with retentate recycle at different feed pressures. 89
Fig. 4.7 Performance of single-stage permeation with permeate recycle to the feed, (a) Permeate CO2 concentration, and (b) CO2 productivity. Feed pressure600 kPa. 90
Fig. 4.8 Performance of single-stage permeation with permeate recycle to feed. (a) Retentate CH4 concentration, and (b) CH4 productivity. Feed pressure 600 kPa. 91
Fig. 4.9 Schematic of retentate recycle and permeate recycle in a
List of Figures
xvi
continuous membrane column. 92
Fig. 4.10 Performance of continuous membrane column. (a) Retentate CH4 and permeate CO2 concentrations, (b) CH4 and CO2 recoveries, and (c) CH4 and CO2 productivities. 93
Fig. 4.11 Relationship between retentate recycle ratio Rb and permeate recycle ratio Rp in the membrane column. 94
Fig. 4.12 Two-stage cascade with reflux. 95
Fig. 4.13 Two modules in parallel. 95
Fig. 4.14 Two modules in series. 95
Fig. 4.15 Case studies of nitrogen removal from CH4/CO2 mixtures with methane-selective membranes to produce a 50% CH4/50% N2 retentate stream and a 96% CH4/4% N2 product gas stream. (a) Feed composition 90% CH4/10% N2, membrane selectivity 8.0, (b) Feed composition 94% CH4/6% N2, membrane selectivity 4.5, and (c) Membrane selectivity 3, feed CH4 concentration required 95.4%. 97
Fig. 5.1 (a) Schematic of assembled hollow fiber membranes, and (b) active and potted section. 103
Fig. 5.2 Apparatus of gas permeation experiment. 103
Fig. 5.3 Permeate pressure profile along the fiber bore for short module including potted section. 106
Fig. 5.4 Permeate pressure profile along the fiber bore for long module including potted section. 106
Fig. 5.5 Comparison of apparent and intrinsic permeances of short and long modules at different feed pressures for, (a) pure H2, and (b) pure N2. 107
Fig. 5.6 Comparison of apparent and intrinsic selectivity of H2/N2 at different feed pressures. 109
Fig. 5.7 Percentage increase of CO2 permeance with pressure differences for cellulose triacetate based flat homogeneous and hollow fiber membrane (Sada et al., 1992). 112
List of Figures
xvii
Fig. 5.8 (a) The average loss in driving force, and (b) percentage loss in driving force with the feed pressures at different active length. 114
Fig. 5.9 (a) The average loss in driving force, and (b) percentage loss in driving force with the feed pressures at different fiber inside diameter. 115
Fig. 5.10 (a) The average loss in driving force, and (b) percentage loss in driving force with the feed pressures at different permeances. 116
Fig. 5.11 Percentage change of H2 permeance with percentage change in inside diameter at different feed pressures. 117
Fig. 5.12 A comparison of H2 permeance from pure gas experiments, mixed gas experiments and approximation methods as a function of stage cut. 118
Fig. 6.1 Pressure-vacuum swing permeation assisted by a single pump, V1~5 switching valves, P pressure on feed side, p pressure on the permeate side. 123
Fig. 6.2 Pressure profile illustrating the pressure variations during various steps of the process. 124
Fig. 6.3 (a) Permeation system with constant feed pressure and varying permeate pressure, (b) Permeation system during permeate evacuation step. 127
Fig. 6.4 Permeate pressure, permeate CO2 concentration and residue CO2 concentration at different pressures P1 as a function of time for Step 2 of the pressure-vacuum swing permeation process. Other conditions pV = 1.33 kPa, (VF/VM) = 1.0, and (A/V) = 5000 m2/m3. 132
Fig. 6.5 Permeate pressure, permeate CO2 concentration and residue CO2 concentration at different (A/V) values as a function of time for Step 2 of the pressure-vacuum swing permeation process. Other conditions P1 = 810.6 kPa, pV = 1.33 kPa, and (VF/VM) = 1.0. 134
Fig. 6.6 Permeate pressure, permeate CO2 concentration and residue CO2 concentration at different pV values as a function of time for Step 2 of the pressure-vacuum swing permeation process. Other conditions P1 = 810.6 kPa, (VF/VM) = 1.0, and (A/V) = 5000 m2/m3. 135

List of Figures
xviii
Fig. 6.7 Permeate pressure, permeate CO2 concentration and residue CO2 concentration at different (VF/VM) values as a function of time for Step 2 of the pressure-vacuum swing permeation process. Other conditions P1 = 810.6 kPa, pV = 1.33 kPa, and (A/V) = 5000 m2/m3. 136
Fig. 6.8 Quantities of CO2 and nitrogen in permeate at different (VF/VM) values vs. time during Step 2. P1 = 810.6 kPa, pV = 1.33 kPa, and (A/V) = 5000 m2/m3
. 138
Fig. 6.9 Effects of (VF/VM) on residue CO2 concentration, permeate CO2 concentration and feed pressure during Step 4. P1 = 810.6 kPa, pV = 1.33 kPa, and (A/V) = 5000 m2/m3
. 139
Fig. 6.10 Quantities of CO2 and nitrogen in permeate at different (VF/VM) values vs. time during Step 4. P1 = 810.6 kPa, pV = 1.33 kPa, and (A/V) = 5000 m2/m3
. 140
Fig. 6.11 Performance comparison of steady-state permeation and pressure-vacuum swing permeation for flue gas separation application, (a) Recovery vs. permeate CO2 purity, and (b) Mean product flow rate vs. permeate CO2 purity. 143
Fig. 7.1 Aspen Plus® process flow sheet for MEA process (cement plant). 151
Fig. 7.2 Permeate CO2 purity versus recovery at different CO2/N2 selectivities with a single stage membrane unit, (a) 10% CO2 in the feed, (b) 20% CO2 in the feed, and (c) 30% CO2 in the feed. 154
Fig. 7.3 Three-stage configurations investigated for post-combustion CO2 capture. 156
Fig. 7.4 Two-stage configurations investigated for post-combustion CO2 capture. 157
Fig. 7.5 LEAN-ABS or/and RICH-ABS flow rate for different lean loadings (mol CO2/mol MEA or DEA) in case of cement plant. 161
Fig. 7.6 Reboiler duty required for the targeted CO2 recovery and purity when lean loading varies from 0.05 to 0.30 (mol CO2/mol MEA) for the cement plant data. 162
Fig. 7.7 Reboiler duties at different CO2 concentrations with different lean loading. 164

List of Figures
xix
Fig. 7.8 A hybrid of membranes and amine processes to treat flue gas of cement plant. 165
Fig. 7.9 Energy consumption for the membrane fraction, amine fraction and their combined total for the cement plant application. 166
Fig. A.1 (a) permeate O2 purity vs. stage cut, and (b) O2 productivity vs. stage cut, for feed compression operation. 188
Fig. A.2 (a) permeate O2 purity vs. absolute pressure, and (b) O2 productivity vs. absolute pressure, for permeate vacuum operation. 188
List of Tables
xx
Table 2.1 Glassy and rubbery polymers used in industrial membrane gas separation (Bernardo et al., 2009). 14
Table 2.2 Main industrial applications of membrane gas separation (Bernardo et al., 2009). 35
Table 3.1 Module design and operating conditions of membrane systems used for model validation. 57
Table 3.2 Permeabilities and selectivities of polymers of interest in air separation. 59
Table 4.1 Compositions of biogas through landfills and anaerobic digestion (Tchobanoglous and Kreith, 2002; Rasi et al., 2011; Demirbas et al., 2011). 85
Table 5.1 Measured pure gas permeances in different membrane modules. 110
Table 5.2 Comparison of H2 permeance at different methods. 118
Table 6.1 Performance of pressure-vacuum swing permeation for CO2 separation from flue gas. 142
Table 6.2 Performance of steady-state permeation for CO2 separation from flue gas. 142
Table 7.1 Flue gas characteristics (after treatment, and before entering the membrane unit). 149
Table 7.2 Multi-stage configurations investigated for post-combustion CO2 capture (Coal-fired power plant). 158
Table 7.3 Multi-stage configurations investigated for post-combustion CO2 capture (Cement plant). 158
Table 7.4 Block input data for Aspen Plus® process flowsheet (cement plant). 159
Table 7.5 Mean rich loadings (αRich) and standard deviation for a variation of lean loadings (αLean) both for MEA and DEA. 162
Table 7.6 A comparison of energy penalty of CO2 capture by membranes, amines and their hybrid processes. 167
List of Tables
xxi
Table B.1 Estimated methane generation from anaerobic digestion and landfills in Canada (2005). 190
Table D.1 Reboiler duties at different CO2 concentrations with different lean loading. 202
Table D.2 Operating data for membrane amine hybrid systems for post-combustion CO2 capture (cement plant). 202
Table D.3 Aspen Plus® flow sheet data for MEA process (cement plant). 203
List of Abbreviations
xxii
BDF Backward Differential Formula
BTU British Thermal Unit
BVP Boundary Value Problem
CCS Carbon Capture and Sequestration
CMC Continuous Membrane Column
DEA Diethanolamine
ECBM Enhanced Coal Bed Methane
EOR Enhanced Oil Recovery
GHG Green House Gas
GPU Gas Permeation Unit
IMSL International Mathematical and Statistical Library
ISP Internally Staged Permeator
IVP Initial Value Problem
LFG Landfill Gas
MEA Monoethanolamine
MSW Municipal Solid Waste
MW Megawatt
ODE Ordinary Differential Equation
PSA Pressure Swing Adsorption
PSP Pressure Swing Permeation
VOC Volatile Organic Compound
List of Symbols
xxiii
Chapter 2
Chapter 3
A [m2] Effective membrane area
CP [J/mol.K] Heat capacity at constant pressure
CV [J/mol.K] Heat capacity at constant volume
Di [m] Inside diameter of hollow fibers
Do [m] Outer diameter of hollow fibers
J [mol/s] Permeation rate of gas component
K1, K2, K1M [-] Dimensionless constant
lE [m] Module length
NT [-] Number of fibers in module
PF [kPa] Feed pressure at any membrane location
PP [kPa] Permeate pressure at any membrane location
PPO [kPa] Permeate outlet pressure
PFi [kPa] Feed inlet pressure
Q [mol/Pa.m2.s] Permeance of gas component
C [mol/m3] Concentration of a species
D [m2/s] Diffusion coefficient
F [m3/(m2.s)]] Flux of a gas across the membrane
p [Pa] Partial pressure
P [mol.m/(m2.s.Pa)] Permeability
S [mol/(m3.Pa)] Sorption coefficient
Tg [K] Glass transition temperature
Greek symbols
α [-] Selectivity

List of Symbols
xxiv
R [J/mol.K] Ideal gas constant
T [K] Temperature
U [mol/s] Molar flow rate at feed side at any membrane location
U* [-] Normalized flow rate (dimensionless)
V [mol/s] Molar flow rate at permeate side at any membrane
location
V* [-] Normalized permeate flow rate (dimensionless)
x [mol frac] Feed mole fraction
y [mol frac] Mole fraction on permeate side
y' [mol frac] Local permeate mole fraction
z [m] Axial coordinate
z* [-] Dimensionless axial coordinate
Greek symbols
α [-] Selectivity
β [-] Feed side pressure to inlet feed pressure ratio
θ [-] Stage cut
γ [-] Permeate to inlet feed pressure ratio
γo [-] Permeate outlet to inlet feed pressure
μ [Pa.s] Viscosity of gas
Subscripts
A Faster permeating component
B Slower permeating component
F Feed side
R Residue end

List of Symbols
xxv
Chapter 4
A [m2] Membrane area
Di [m] Inside diameter of hollow fibers
Do [m] Outer diameter of hollow fibers
Ji [mol/m2.s.Pa] Permeance of component i
JRef [mol/m2.s.Pa] Permeance of reference component
K1, K2 [-] Dimensionless constant
L [m] Length of hollow fiber membrane
N [-] Number of hollow fibers in module
PF [Pa] Gas pressure on retentate side
PFi [Pa] Feed inlet pressure
PP [Pa] Gas pressure on permeate side
PPO [Pa] Permeate outlet pressure
R [J/mol.K] Ideal gas constant
Rb [-] Retentate recycle ratio
Rp [-] Permeate recycle ratio
T [K] Temperature
U [mol/s] Gas flow rate on retentate side
UF [mol/s] Gas flow rate on feed inlet
U* [-] Normalized gas flow rate on retentate side (U/UF)
V [mol/s] Gas flow rate on permeate side
V* [-] Normalized gas flow rate on permeate side (V/UF)
List of Symbols
xxvi
xi [-] Mole fraction of component i on retentate side
yi [-] Mole fraction of component i on permeate side
iy [-] Local permeate concentration of component i
substrate
z [m] Axial coordinate
z* [-] Dimensionless axial coordinate (z/L)
Greek symbols
α [-] Selectivity (Ji/JRef)
γ [-] Permeate to inlet feed pressure ratio (PP/PF)
γo [-] Permeate outlet to inlet feed pressure (PPO/PF)
μ [Pa.s] Viscosity of gas
Subscripts
i Component i
F Feed
P Permeate
PR Permeate recycle
R Retentate
RR Retentate recycle
Ref Reference component
List of Symbols
xxvii
Chapter 5
A [m2] Effective membrane area
Di [m] Inner diameter
Do [m] Outer diameter
l [m] Membrane thickness
la [m] Active fiber length
lp [m] Potted length
N [-] Number of fibers in module
PF [Pa] Feed pressure
PP [Pa] Permeate pressure
p [Pa] Pressure difference across the membrane
J [mol/m2.Pa.s] Gas permeance
R [J/mol.K] Ideal gas constant
T [K] Temperature
Q [mol/s] Permeate flow rate
z [m] Axial coordinate
Greek symbol
[Pa. s] Viscosity of gas
List of Symbols
xxviii
Chapter 6
A [m2] Membrane area
D [m2/s] Diffusivity coefficient
J [mol/m2.s.Pa] Permeance
L [m] Membrane thickness
p [kPa] Permeate side pressure
pV [kPa] Permeate pressure when the permeate side is
evacuated
P [kPa] Feed side pressure
Q [mol] Quantity of permeate
QP [mol] Quantity of permeate withdrawn and collected
R [J/mol.K] Ideal gas constant
t [s] Permeation time
T [K] Temperature
VF [m3] Volume occupied by feed
VM [m3] Volume occupied by permeate
X [-] Mole fraction of the most permeable component in
retentate
YP [-] Local permeate mole fraction
YM [-] Bulk permeate mole fraction
Greek symbols
List of Symbols
xxix
θ [s] Time lag
Subscripts
1~5 Different Steps
A Component A
B Component B
F Feed side
O Initial condition
Chapter 1
1
Introduction
1.1 Background
Membrane technology has become very lucrative these days and has been widely
accepted by industries due to its vast potential in resolving a critical problem. Gas
separation via membranes is one of the most exciting and significant new unit processes
that have appeared in recent years. Membrane-based gas separation technology mainly
expanded during the last few decades and has led to significant innovations in both
processes and products. Though the first commercially significant gas separation
membrane was introduced only in late 1979, this technology found its way into a wide
range of industries and applications within a span of ten years. In the US, the combined
market for membranes used in all applications was estimated to be worth $5 billion in 2005.
The market was rising at an average annual growth rate of 6.6%, and expected to reach
$6.9 billion in 2009 according to a report by Business Communications Co. (Membrane
Technology, 2005). The US market for membrane modules used in liquid and gas
separation was worth an estimated $2.1 billion in 2008, and is forecast to increase to $3.3
billion by 2013 (with a compound annual growth rate of 7.8%) according to a technical
market research report (Membrane Technology, 2009). Global Industry Analysts Inc.
reports that due to wide adoption of the membrane technology across various end-use
markets, the global market for membrane separation technologies is forecast to reach $16
billion by the year 2017. With the growth in demand for high quality products, stringent
regulations, environmental concerns, and exhausting natural resources, membrane
separation technologies are forecast to witness significant growth over the long term
(Global Industry Analysts Inc., 2011).
Membrane gas separation is based on preferential permeation of one or more
components of a gas mixture through a membrane. Mechanical or chemical processes are
absent in this technology, which makes the membrane process relatively simple and easy to
operate/scale-up. Membrane processes generally consume less energy than conventional

Chapter 1
2
separation processes and can be easily combined with other separation processes. The
process is environmentally friendly due to the absence of harmful chemical additives
during the separation. Membrane based gas separation is well consolidated today and can
often outperform conventional processes in terms of economics, safety, and environmental
and technical aspects. The future of membrane technology promises to be equally exciting
as new membrane materials, processes and innovations make their way to the marketplace.
Over the years, a great variety of membranes have been developed and reported.
The current trend in membrane gas separation industry is, however, to develop robust
membranes with superior separation performance that are reliable and durable for
particular applications. The economic viability of gas membrane systems can be
significantly affected by the process design. In most applications, mathematical models are
required to predict the performance of gas separation modules for process design and
optimization. Process simulation allows the investigation of operating and design variables
in the process, and in new process configurations. An optimized operating condition and/or
process configuration will likely yield a better separation performance as well as cost
savings. Moreover, with the development of new process concepts, new membrane
applications will emerge.
1.2 Motivation
Since membrane technology has radiant prospect, more applications in chemical
industry are expected to come in the near future. However, there exists substantial
confusions and sometimes debates about the preferential use of membranes over alternative
processes. Since membrane technology is one of the newest additions, the confusion is
sometimes aggravated by the fact that the technology is not well understood by many of the
potential benefactors (i.e., industry and personnel). The study here is a contribution to the
exploration of new and existing technologies where membranes offer significant potential
and where there still remain considerable obstacles. The study focuses on better
understanding of membrane processes to facilitate reasoning on the preferential use of
membranes over alternative technology. The study also rectifies some general intuitions
Chapter 1
3
and perceptions, which are prevalent in case of pressure build-up in hollow fiber
membranes.
Though membrane gas separations already have widely penetrated in the markets,
there are still many opportunities to extend new markets. Even though a great deal of new
and improved materials has been developed lately in this field, the current trend in
membrane gas separation industry is to develop robust membranes that exhibit both higher
selectivity and permeability. Nevertheless, in some cases, membrane configurations and
process designs are inadequate to fully exploit the membrane potential. Through the
analysis of new process concepts, new membrane applications may also emerge. Therefore,
process analysis such as modeling, simulation and optimization (operating/design stages)
are deemed essential to membrane professionals for decision making. Moreover, successful
membrane modeling and simulation can provide valuable information for the design,
optimization and economics of the overall separation process with minimal costs and
efforts.
Membrane gas separations under transient state conditions are rather unexplored
compared to steady-state operations. Transient and, in particular, steady cyclic operation of
the membrane can be used to alter the separation performance. Since very little is known
about unsteady-state permeation, an investigation of the extent of separation achievable for
gas separation of industrial importance through transient permeation could potentially
infiltrate new process concepts.
Amine absorption has been regarded as one of the most promising methods to
capture CO2 from flue gas. However, it uses a substantial amount of energy at the stripper
reboiler as the CO2 concentration increases. Membranes, on the other hand, appear to be
most effective at high CO2 concentrations. Questions are sometimes raised if the
membranes can compete with amine absorption for post-combustion CO2 capture.
Although both processes have their own advantages, can a hybrid process for post-
combustion CO2 capture be yielded combining membranes and amine absorption with
cost/performance advantages that neither process could achieve individually? The potential
Chapter 1
4
of hybrid separation processes for flue gas separation on industrial scale is not fully
exploited because of the lack of general design methodologies and detailed process know-
how.
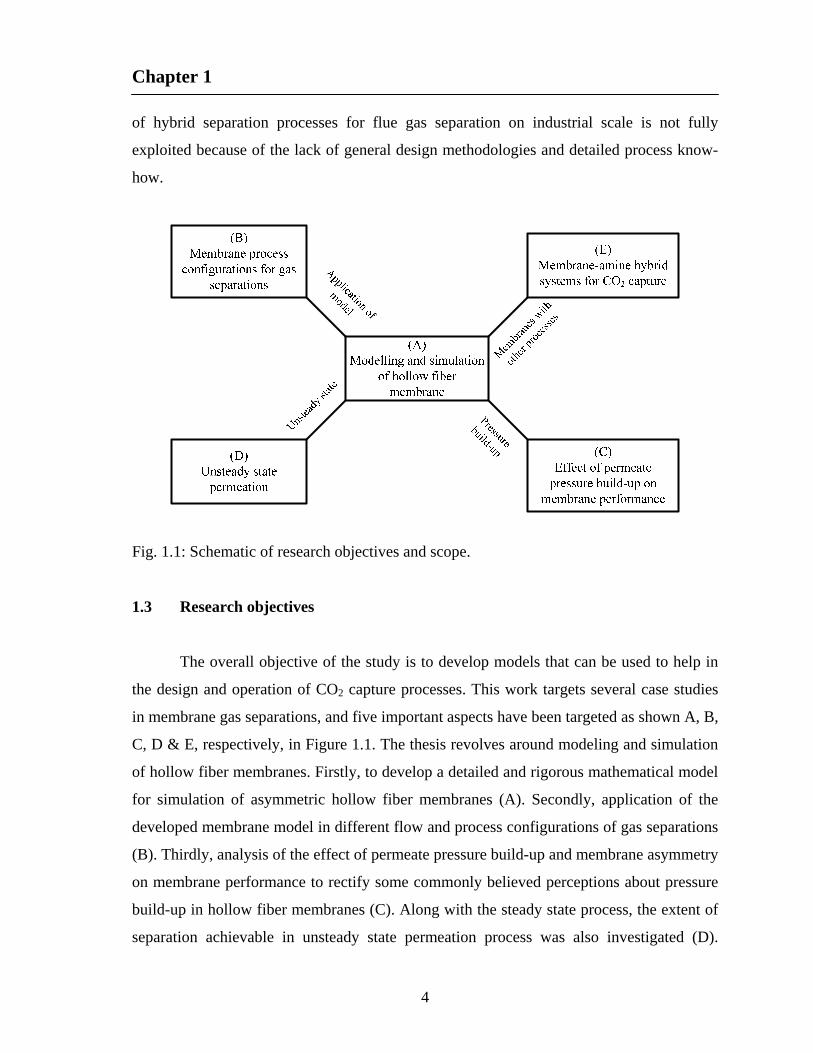
Fig. 1.1: Schematic of research objectives and scope.
1.3 Research objectives
The overall objective of the study is to develop models that can be used to help in
the design and operation of CO2 capture processes. This work targets several case studies
in membrane gas separations, and five important aspects have been targeted as shown A, B,
C, D & E, respectively, in Figure 1.1. The thesis revolves around modeling and simulation
of hollow fiber membranes. Firstly, to develop a detailed and rigorous mathematical model
for simulation of asymmetric hollow fiber membranes (A). Secondly, application of the
developed membrane model in different flow and process configurations of gas separations
(B). Thirdly, analysis of the effect of permeate pressure build-up and membrane asymmetry
on membrane performance to rectify some commonly believed perceptions about pressure
build-up in hollow fiber membranes (C). Along with the steady state process, the extent of
separation achievable in unsteady state permeation process was also investigated (D).
Chapter 1
5
Finally, the effectiveness of membrane processes for post combustion CO2 capture and
feasibility of building a hybrid of membrane process with amine absorption process for
carbon capture (E).
The following specific objectives have been derived in consideration of the above:
Develop mathematical model for simulation of binary/multicomponent gas
separation in asymmetric hollow fiber membranes considering the asymmetric
structure of the membrane, and develop a robust and reliable numerical
technique for solving the associated equations.
Apply the developed numerical model and solution technique to investigate the
performance of several membrane process configurations for nitrogen- and
oxygen-enriched air production, and methane recovery from biogas (landfill gas
or digester gas) using representative membranes.
Rectify some common perceptions of pressure build-up in hollow fiber
membranes. Clarify the effect of permeate pressure build-up on the intrinsic
separation performance of hollow fiber membranes.
Analyze a pressure-vacuum swing permeation process and study the effects of
design and operating parameters on the performance for CO2 separation from
flue gas.
Effectiveness of membrane processes for CO2 capture from flue gas to meet the
selected design specifications. Simulate conventional MEA process for the
aforementioned design specifications. Explore the feasibility of membrane-
amine hybrid systems for post-combustion CO2 capture.
1.4 Outline of the thesis
The thesis consists of eight chapters as follows:
Chapter 1 presents the background, motivations and specific objectives.
Chapter 1
6
Chapter 2 presents an overview of membrane gas separations. The chapter
addresses a brief history of membrane based gas separation, mechanism of
transport through membranes, and a review of different polymeric membranes
used for gas separation. The chapter provides a discussion on basic features of
hollow fiber membranes, hollow fiber permeator modeling, membrane process
and cascade configurations, unsteady-state permeation and hybrid membrane
systems. The chapter also briefly discusses industrial applications of membrane
gas separations.
Chapter 3 presents the modeling and simulation of binary gas separation in
asymmetric hollow fiber membranes, and application of the developed model
for a case study in air separation to produce nitrogen- and oxygen-enriched air
using representative membranes with different configurations.
Chapter 4 provides a modeling and simulation study of multicomponent gas
separation in asymmetric hollow fiber membranes, and application of the
membrane technology for methane enrichment from biogases. Current scenario
of Canadian landfills and potential renewable methane generation from
municipal solid wastes in Canada is presented in Chapter 4.
Chapter 5 discusses the effect of permeate pressure build-up on the intrinsic
separation performance of hollow fiber membranes. Common perceptions about
pressure build-up in hollow fiber membrane are rectified in this Chapter through
experimental and theoretical analysis.
Chapter 6 presents CO2 separation from flue gas using pressure-vacuum swing
permeation, and the feasibility and effectiveness of the process is evaluated.
Chapter 7 presents effectiveness of membrane processes for post combustion
CO2 capture, and a comparison with conventional MEA process in terms of
energy perspective. The Chapter also presents feasibility of building a
membrane-amine hybrid systems for post combustion CO2 capture from flue
gases. The study targets CO2 capture for potential application in enhance oil
recovery (EOR).
Chapter 8 summarizes the general conclusions, contributions to research and
knowledge, and recommendations for future work.

Chapter 2
7
Features of hollow fiber membranes, unsteady state permeation and
membrane hybrid systems for gas separations
2.1 Introduction
Membrane technology is an effective tool to implement the process intensification,
thereby reducing production costs, equipment size, energy utilization, and waste generation
(Dautzenberg and Mukherjee, 2001). An ideal membrane has the ability to selectively
allow a certain component of a gas mixture to pass through it while rejecting others in a
continuous manner, which makes the process extremely appealing. Membrane process is an
attractive alternative to conventional technologies for gas separations due to its simplicity
in operation, low maintenance and reliable performance. Unlike conventional separation
unit operations (e.g., cryogenic distillation and adsorption processes), membrane gas
separation does not involve a phase change. Moreover, the absence of moving parts makes
membrane systems particularly suited for uses where operator attendance is critical. In
addition, the small footprint makes the process very attractive for remote applications such
as offshore gas processing (Bernardo et al., 2009). It is also environmentally sustainable, as
no harmful chemical additives are required during the separation. However, despite its
apparent advantages, numerous factors must be considered for successful application and
commercialization of membrane technology. The optimum process design and operating
conditions play an important role in successful and economic application of membranes for
gas separations.
Membrane gas separation is a pressure-driven process with numerous industrial
applications, but these applications represent only a small fraction of the potential ground
in refineries and chemical industries though prospect could be endless. The use of
membranes in separation processes is growing at a steady rate (Baker, 2002). It is estimated
that the market of membrane gas separation technology in year 2020 would be five times of
that of year 2000 (Baker, 2002). It is expected that membrane gas separation will play an
increasingly important role in reducing the environmental impact and costs of industrial
Chapter 2
8
processes, particularly in the present scenario when energy cost is volatile and the global
hydrocarbon reservoirs are destined to reduce dramatically during this century (Koros,
2007). Opportunities to extend the markets for membrane gas separation are limitless.
However, in some cases, the membrane materials, membrane configuration, process
designs are inadequate to meet all industrial needs. A broad range of materials was
investigated and many improvements were achieved lately in this field. Today, much of the
research work is being addressed to the investigation of new materials and to the
development of new membrane structures that exhibit both a high selectivity and
permeability to specific gases (Bernardo et al., 2009). However, modeling and simulation
of the membrane process is a viable means to provide valuable information to the design,
operating and economics of the separation process with minimal cost.
This chapter briefly addresses the history of membrane based gas separation, the
mechanism of transport through membranes and the different polymeric membranes used
for gas separation. The chapter also intends to provide a discussion on basic features of
hollow fiber membranes, flow patterns, hollow fiber permeator modeling and numerical
solution techniques. Advantages of membrane modular configurations, performance
improvement through recycle/purge/multi-stage operations, enhancing separation
efficiency beyond transient permeation through novel designs of unsteady state and cyclic
operations will be also discussed. Hybrid processes combining membrane gas separation
with other traditional gas separation processes (i.e., amine, cryogenic, PSA) and their
cost/performance advantages will be presented. A brief review of industrial applications of
membrane gas separation will be presented too.
2.2 Membrane-based gas separation: A brief history
It was Graham who in 1829 initiated and pioneered the foundation of membrane
gas separation by performing permeation tests for some of the known gases that time
(Graham, 1866; Kesting and Fritzsche, 1993). Graham introduced the concept of solution-
diffusion mechanism for the first time to explain the selective permeation of gases (Baker,
2004). Graham’s theory has contributed considerably to the knowledge of gas diffusion

Chapter 2
9
phenomena together with Fick’s law, which quantitatively defines concentration gradient
driven mass transport. However, it was Loeb and Sourirajan who in 1961 invented an
integrally asymmetric high-flux reverse osmosis membrane for desalination, and
transformed membrane from concept to industrial application (Baker, 2004). With the
introduction of a large surface area in compact modules through hollow fiber membranes in
the 1970’s, the industry further boosted and gained considerable interest. Monsanto
company further refined the membranes for gas separation applications and launched its
first composite polysulfone Prism® membrane in the 1980’s for hydrogen separation
application (Koros and Fleming, 1993). Briefly after that, many giants in gas separation
industry extended the application of membrane processes for carbon dioxide removal from
natural gas (e.g., Cynara, Saparex, and Grace). The progress was further accelerated in the
1980’s with the innovation and development of highly selective synthetic polymeric
materials. Specifically, the improved selectivity of oxygen/nitrogen in polymeric
membranes has expanded its application to air separation to produce nitrogen- and oxygen-
enriched air. Among many commercial plants producing nitrogen- and oxygen-enriched
air, Praxair is one of the largest, and one of Praxair’s plants in Belgium (began operation in
1996) has a nitrogen production capacity of nearly 24 ton/hr (Maier, 1998). Applications in
other industries gradually advanced and widely penetrated the market.
2.3 Gas transport mechanism
Gas transport in the membrane is a function of membrane properties (physical and
chemical structure), the nature of the permeant species (size, shape and polarity), and the
interaction between the membrane and the permeant. The mechanism of gas transport
across membranes varies with the types of membranes involved. Convective flow,
Knudsen diffusion, and molecular sieving are the three accepted mechanisms for porous
membranes. The most widely accepted mechanism for gas transport in dense membranes is
the solution-diffusion mechanism. Figure 2.1 provides a schematic of gas transport
mechanisms for porous and dense membranes. The transport mechanism in porous
membranes is governed by the relative pore sizes of the membranes and the mean free path
of the gas molecules. If the pores are relatively large (from 0.1 to 10 μm), gases permeate

Chapter 2
10
through the membrane pores by convective (vicous) flow described by the Poiseuille’s law,
and no separation occurs. If the pore size is similar to or smaller than the mean free path of
the gas molecules, gas permeation is governed by the Knudsen diffusion. The gas
molecules in Knudsen diffusion collide more frequently with the pore walls than colliding
with other gas molecules on the go, which make them to move independent of each other
(Pandey and Chauhan, 2001). The transport rate of a gas across the membrane by Knudsen
diffusion is inversely proportional to the square root of its molecular weight. When the
membrane pores are extremely small (of the order of 5-20 Å), e.g., in between the size of
smaller and larger molecules, the gases are separated by molecular sieving. Transport
through this type of membrane is complex and includes both diffusion in the gas phase and
diffusion of adsorbed species on the surface of the pores (surface diffusion). This types of
membranes has not been used on a large scale. However, ceramic and ultra-microporous
glassy membranes with extraordinary high selectivities for similar molecules have been
prepared in the laboratory (Baker, 2004). Details of the transport models related with
porous membranes can be found elsewhere (Matsuura, 1994; Mulder, 1996).
Porous Membrane Dense Membrane
Convective flow
Knudsen diffusion
Molecular Sieving(Surface diffusion)
Solution-diffusion
Fig. 2.1: Schematic of main mechanisms for gas permeation through membranes (Baker, 2004).

Chapter 2
11
Although microporous membranes are topics of considerable research interest, all
current membranes for commercial separations are based on dense polymer membranes.
Separation through dense polymer films occurs by a solution-diffusion mechanism, which
was initially proposed by Graham. The gas transport through dense polymer films occur
fundamentally in three steps according to Graham, as shown schematically in Figure 2.2. In
this model it is assumed that the gas at the high pressure side of the membrane dissolves in
the polymer, diffuses down to the low pressure side, and finally desorbs and releases at the
low pressure end. It is further assumed that the sorption and desorption at the interfaces are
fast compared to the diffusion rate in the polymer. The gas phases on both sides of the
membrane are in equilibrium with the polymer interfaces. The permeants are separated
from each other due to the difference in their solubility and diffusivity in the polymer
matrix (Wijmans and Baker, 1995).
Diffusion is the process by which matter is transported from one part of a system to
another by a concentration gradient. The gas transport flux across the membrane can be
described by the Fick’s law:
dx
dCDF (2.1)
Fig. 2.2: Schematic of solution-diffusion model.

Chapter 2
12
The concentration of a component at the feed interface of the membrane can be written by
the Henry’s law:
SpC (2.2)
Combining Eqs. (2.1) and (2.2) and integration lead to the expression of gas transport flux
across the membrane:
t
pSDF
(2.3)
The product SD can be written as P, which is called the membrane permeability. It is a
measure of the ability of the membrane to permeate gases. Rewriting Eq. (2.3):
t
pPF
(2.4)
The measure of the ability of a membrane to separate a pair of gases i and j is the ratio of
their permeabilities ij , called the membrane selectivity:
j
i
j
i
j
iij S
S
D
D
P
P (2.5)
The ratio of diffusion coefficients (Di/Dj) can be viewed as the mobility selectivity,
reflecting the different sizes of the permeating molecules, while the ratio of the sorption
coefficients (Si/Sj) can be viewed as the solubility selectivity, reflecting the relative
condensabilities of the two gases. In general, the diffusivity coefficient decreases with
increasing molecular size. However, the magnitude of diffusivity selectivity often depends
on whether the membrane is at a glassy or rubbery state. Glassy polymers refer to
polymeric materials below their glass transition temperatures, while a rubbery polymer
results when the polymer is at a temperature above the glass transition temperature. The
polymer chains are rigid below the glass transition temperature. On the other hand, the
polymer gains sufficient thermal energy above the glass transition temperature and allows
some rotation around the chain backbone, which causes the polymer to become rubbery.
The mobility selectivity of gases is relatively higher in glassy polymers than that of the
rubbery polymers (Baker, 2004; Zakaria, 2006). The solubility selectivity generally
increases with molecular sizes of the permeant. In glassy polymers, the mobility term is
usually more dominant, which causes small molecules to permeate faster. Contrarily, in
Chapter 2
13
rubbery polymers, the solubility term often predominates, and larger molecules permeate
preferentially through the membrane (Baker, 2004). Reviews on the relationships between
polymer structure and transport properties of gases can be found in Baker (2004) and
Freeman (1999).
2.4 Membrane materials
The selection of a membrane material for gas separation applications is based on
specific physical and chemical properties. Membrane materials need to be tailored in an
advanced way to separate particular gas mixtures. Moreover, robust (i.e., long term and
stable) materials are required to find potential applications in membrane gas separation
processes. The separation performance of membranes depends upon:
membrane material (permeability, selectivity),
membrane structure and thickness (permeance),
membrane configurations (e.g., flat, hollow fiber) and
module and system designs
Membrane permeability and selectivity determine the economics of membrane gas
separation processes. A large number of polymeric materials have been developed for gas
separation applications. However, polymers cannot withstand very high temperatures and
aggressive chemical environments. Moreover, in petrochemical plants, refineries and
natural gas treatment, the presence of heavy hydrocarbons in the feed streams can pose a
serious problem. Many polymers can be plasticized or swollen when exposed to
hydrocarbons or CO2 at high pressures. Their separation capabilities can be dramatically
reduced or the membranes can be irreparably damaged. Therefore, gas pre-treatment and
condensate handling are critical for proper operation of gas separation modules. The
development of inorganic membranes (e.g., silica, zeolites etc.) and carbon based
molecular sieves is particularly interesting because they can withstand aggressive
chemicals as well as high temperatures. However, these materials have drawbacks,
including high cost, modest reproducibility, brittleness, low membrane area to module
Chapter 2
14
volume ratio, low permeability in the case of highly selective dense membranes (e.g., metal
oxides at temperatures below 400°C) and difficult sealing at high temperatures (greater
than 600°C) (Bernardo et al., 2009).
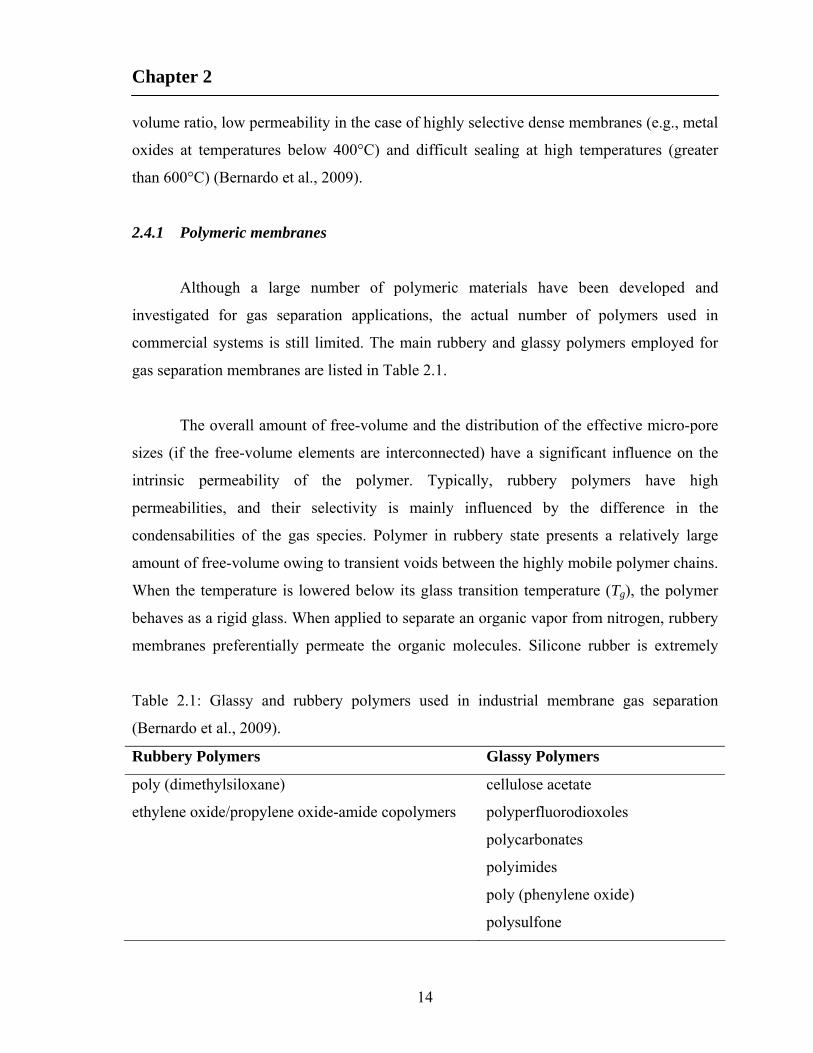
2.4.1 Polymeric membranes
Although a large number of polymeric materials have been developed and
investigated for gas separation applications, the actual number of polymers used in
commercial systems is still limited. The main rubbery and glassy polymers employed for
gas separation membranes are listed in Table 2.1.
The overall amount of free-volume and the distribution of the effective micro-pore
sizes (if the free-volume elements are interconnected) have a significant influence on the
intrinsic permeability of the polymer. Typically, rubbery polymers have high
permeabilities, and their selectivity is mainly influenced by the difference in the
condensabilities of the gas species. Polymer in rubbery state presents a relatively large
amount of free-volume owing to transient voids between the highly mobile polymer chains.
When the temperature is lowered below its glass transition temperature (Tg), the polymer
behaves as a rigid glass. When applied to separate an organic vapor from nitrogen, rubbery
membranes preferentially permeate the organic molecules. Silicone rubber is extremely
Table 2.1: Glassy and rubbery polymers used in industrial membrane gas separation
(Bernardo et al., 2009).
Rubbery Polymers Glassy Polymers
poly (dimethylsiloxane) cellulose acetate
ethylene oxide/propylene oxide-amide copolymers polyperfluorodioxoles
polycarbonates
polyimides
poly (phenylene oxide)
polysulfone
Chapter 2
15
permeable and has adequate vapor/inert gas selectivities for most applications; composite
membranes of silicone rubber are used in almost all of the commercial vapor separation
systems (Baker, 2004; Bernardo et al., 2009).
Due to high gas selectivity and good mechanical properties, majority of the
industrial membrane gas separation processes utilize glassy polymers. For glassy polymers,
usually the more permeable species are those with small molecular sizes, and the
membrane selectivity is due to differences in molecular dimension. The glassy state is
characterized by a relatively small fraction of free volume. Medium to high free-volume
glassy polymers (e.g., polyimide, polyphenyleneoxide, etc.) are used to produce
membranes since the micro-voids aid the transport of gas or liquid through the material
(Bernardo et al., 2009).
Although almost all industrial gas separation processes use polymeric membranes,
however, interest in metal membranes continues, mostly for the high-temperature
membrane reactor applications. The study of gas permeation through metals began with the
observation of hydrogen permeation through palladium. Pure palladium absorbs 600 times
its volume of hydrogen at room temperature and is measurably permeable to the gas.
Hydrogen permeates through a number of other metals including tantalum, niobium,
vanadium, nickel, iron, copper, cobalt and platinum (Alefeld and Voelkl, 1978). In most
cases, the metal membrane must be operated at high temperatures (> 300oC) to obtain
useful permeation rates and to prevent embrittlement and cracking of the metal by sorbed
hydrogen. Although most work on gas permeation through metal membranes has focused
on hydrogen, oxygen-permeable metal membranes are also known. However, the oxygen
permeabilities are low. The high cost of metal membranes and the need to operate at high
temperatures to obtain useful fluxes make the process uncompetitive with other hydrogen
recovery technologies (Baker, 2004). Several other membranes/materials (i.e., ceramic,
zeolite, mixted-matrix) are also being developed for gas separation applications.

Chapter 2
16
2.5 Types of membrane modules: Hollow fibers
The unit into which the membrane is packed is called a module. Technology
development to produce low-cost membrane modules was one of the breakthroughs that led
to commercial membrane processes in the 1960’s and 1970’s (Baker, 2004). Large surface
areas can be packed in membrane modules through the compact design of membrane
modules. Among the compact designs, hollow fiber membranes are advantageous over flat
membranes as a large membrane area density can be packed in hollow fiber modules.
These membranes offer the highest membrane area per unit volume, which can be as high
as 4000 ft2/ft3, while spiral wound and plate and frame modules with flat membranes offer
200-250 and 100-150 ft2/ft3, respectively (Koros and Fleming, 1993). Polymeric hollow
fibers are formed by extruding a polymer solution (commonly called polymer dope)
through the annulus of a spinneret. A liquid or a gas is coextruded in the core of the
annulus to form the hollow region. Figure 2.3 represents a cross section of a spinneret
initially designed by Dow (Baker, 2004). The thickness of hollow fiber membranes is
Fig. 2.3: Twin-orifice spinneret design used in solution-spinning of hollow fiber membranes (Baker, 2004).
Chapter 2
17
usually greater than their flat sheet equivalent since the fibers must withstand the applied
pressure without collapsing. The diameter of hollow fibers varies over a wide range, from
50 to 3000 μm. Fibers of 50 to 200 μm diameter are usually called hollow fine fibers. Such
fibers can withstand very high hydrostatic pressures applied from the outside, so they are
used in reverse osmosis or high-pressure gas separation applications. For low pressure gas
applications, larger diameter fibers can be used (Baker, 2004).
2.6 Modeling of hollow fiber permeators
For the current study as well as for many theoretical studies in the literature, hollow
fiber membrane modules are the focus of the modeling efforts due to their high packing
densities and widespread industrial uses for gas separations. Theoretical analysis is
essential for the knowledge of variation in process (design and operating) parameters
affecting permeator performance. Process design, scale up from pilot plant to large-scale
units, existing process improvement, new process development, optimization and
economics of the overall separation process can be investigated using mathematical
models. The mathematical models for hollow fiber permeator should include:
governing transport equations across the membrane,
pressure drop relations, and
boundary conditions reflecting permeator configurations
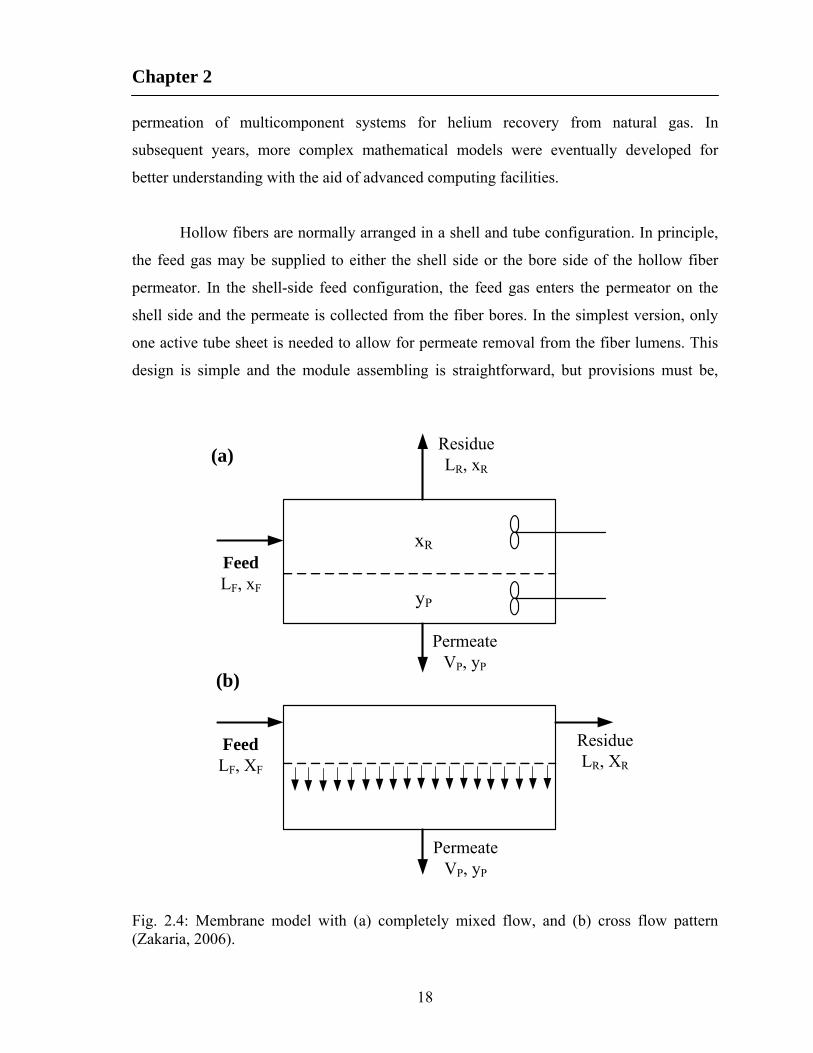
Weller and Steiner (1950) pioneered the modeling of gas permeation, and their
analysis was based on binary gas mixtures. Two specific cases were investigated, i)
complete mixing of both the residue and permeate streams (as shown in Figure 2.4a), and
ii) cross-flow permeation where permeate is withdrawn perpendicular to the feed flow (as
shown in Figure 2.4b). Naylor and Backer (1955) analyzed the cross flow permeation for
binary gas separation. Though the models did not address cocurrent or countercurrent flows
and cell geometry, they provided the much needed foundation for subsequent development
of sophisticated models. Brubarker and Kammermeyer (1954) accommodated ternary and
quaternary gas mixtures to the complete mixing model of Weller and Steiner (1950). Stern
et al. (1965) extended the model of Weller and Steiner (1950) for cross flow (case ii)
Chapter 2
18
permeation of multicomponent systems for helium recovery from natural gas. In
subsequent years, more complex mathematical models were eventually developed for
better understanding with the aid of advanced computing facilities.
Hollow fibers are normally arranged in a shell and tube configuration. In principle,
the feed gas may be supplied to either the shell side or the bore side of the hollow fiber
permeator. In the shell-side feed configuration, the feed gas enters the permeator on the
shell side and the permeate is collected from the fiber bores. In the simplest version, only
one active tube sheet is needed to allow for permeate removal from the fiber lumens. This
design is simple and the module assembling is straightforward, but provisions must be,
FeedLF, xF
ResidueLR, xR
PermeateVP, yP
xR
yP
FeedLF, XF
ResidueLR, XR
PermeateVP, yP
(a)
(b)
Fig. 2.4: Membrane model with (a) completely mixed flow, and (b) cross flow pattern (Zakaria, 2006).

Chapter 2
19
made to pack the fibers uniformly in order to achieve a uniform flow distribution. In the
bore-side feed configuration, on the other hand, the feed gas enters the fiber bores at one
end of the hollow fibers, and the residue exits from the fiber lumens at the other end
whereas the permeate is removed from the shell side of the device. This requires two active
tube sheets, one at each end of the hollow fibers. In the latter configuration, a more even
flow distribution of feed on the membrane surface is achieved, which is beneficial to an
efficient operation. Also, only the fiber wall and the end caps of the membrane device are
pressurized, and the pressure at the shell side is substantially low. Therefore, the
mechanical strength requirement to the shell casing of the permeator is minimized.
However, when the pressurized gas stream moves to or from the fiber bores, both tube
sheets are under significant compressive and sheer stresses. Consequently, the bore-side
feed permeator design is more complicated than the shell-side feed design because of the
problems associated with supporting the tube sheets (Feng et al., 1999).
Flow patterns inside a hollow fiber permeator can be configured in various ways.
The most common practical configurations are shown in Figure 2.5. Different flow patterns
expected to result in different patterns of driving force in the module (Zakaria, 2006).
Walawender and Stern (1972), and Blaisdell and Kammermeyer (1973) initially proposed
incorporation of the effect of cocurrent and countercurrent flow patterns in the
Fig. 2.5: Countercurrent and cocurrent flow patterns in hollow fiber permeator.

Chapter 2
20
mathematical models. Blaisdell and Kammermeyer (1973) investigated the performance of
different flow patterns for binary gas separation. Their model prediction agreed well with
the experimental results, and it was concluded that countercurrent flow pattern was the best
option for commercial gas separation application. Pan and Habgood (1974) extended the
model of Walawender and Stern (1972) to the case with a non-permeable component in the
system, and investigated the effect of permeability ratio and the sweep gas on the separator
performance. Pan and Habgood (1974) also confirmed theoretically that the countercurrent
flow pattern is the best possible arrangement.
Li et al. (1990) developed mathematical models for separation of gas mixtures
involving three or more permeable components without consideration of pressure drop.
Theoretical analysis of CO2 separation from multi-component gas mixtures was performed
using five different flow patterns of the permeated and unpermeated stream. The solution
from the different flow models was compared, and a parametric analysis was performed to
investigate the effect of flow pattern, pressure ratio, and stage cut on the separation
performance. Rautenbach and Dham (1985) also provided derivations of equations for
multi-component gas separation for four different flow patterns. Their results were
compared with those of a short-cut method based on pseudo-binary gas mixtures, and it
was demonstrated that pseudo-binary components can only be used for component with
similar permeabilities. Thundyil and Koros (1997) presented a new approach to solve the
mass transfer problem posed by the permeation process in a hollow fiber permeator for
radial crossflow, countercurrent and cocurrent flows. More recently, Marriott et al. (2001),
and Marriott and Sorenson (2003) developed a more rigorous model based on mass, energy
and momentum balances to describe a generic membrane separation in contrast to a process
specific model. The model was compared with Pan’s (1986) experimental data, and an
excellent agreement was found. However, the main drawback of their model is that
knowledge of molecular diffusivity and solubility is necessary rather than permeability or
permeance, which are difficult to determine and not handy. This is especially the case when
asymmetric composite membranes are used.
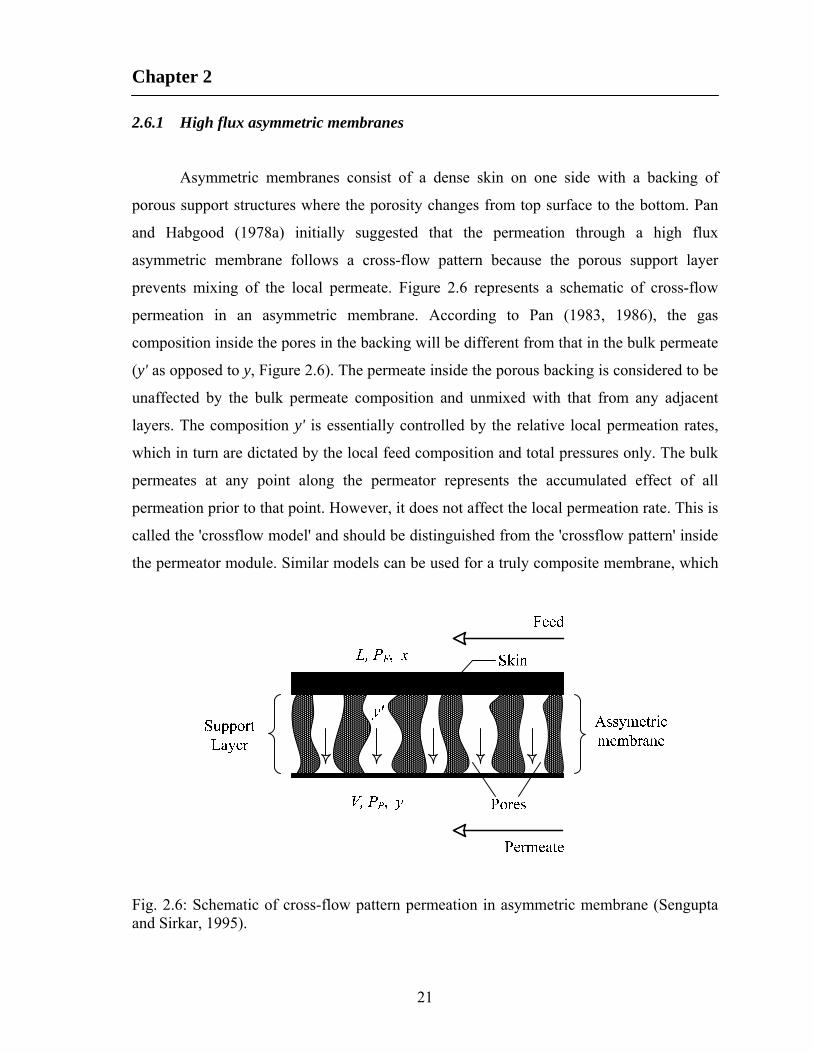
Chapter 2
21
2.6.1 High flux asymmetric membranes
Asymmetric membranes consist of a dense skin on one side with a backing of
porous support structures where the porosity changes from top surface to the bottom. Pan
and Habgood (1978a) initially suggested that the permeation through a high flux
asymmetric membrane follows a cross-flow pattern because the porous support layer
prevents mixing of the local permeate. Figure 2.6 represents a schematic of cross-flow
permeation in an asymmetric membrane. According to Pan (1983, 1986), the gas
composition inside the pores in the backing will be different from that in the bulk permeate
(y' as opposed to y, Figure 2.6). The permeate inside the porous backing is considered to be
unaffected by the bulk permeate composition and unmixed with that from any adjacent
layers. The composition y' is essentially controlled by the relative local permeation rates,
which in turn are dictated by the local feed composition and total pressures only. The bulk
permeates at any point along the permeator represents the accumulated effect of all
permeation prior to that point. However, it does not affect the local permeation rate. This is
called the 'crossflow model' and should be distinguished from the 'crossflow pattern' inside
the permeator module. Similar models can be used for a truly composite membrane, which
Fig. 2.6: Schematic of cross-flow pattern permeation in asymmetric membrane (Sengupta and Sirkar, 1995).
Chapter 2
22
has a thin, distinct selective layer backed by a porous support. However, it is to be noted
that the above model for asymmetric or composite membranes is insufficient for describing
the permeation if the flux is very high or the membrane is extremely thin because the
permeation resistance of the porous backing starts to become important under these
situations (Baker, 2004). However, in a homogenous symmetric model, the bulk permeate
concentration, y, is assumed to be the same as y' due to radial mixing of permeate (Zakaria,
2006).
A calculation method for multi-component separation based on the cross flow
model was presented by Pan (1978a), and a parametric analysis on cascade operation was
provided. The cross flow model for asymmetric membrane was extended to include the
effect of pressure build-up for binary and multi-component gas mixtures (Pan, 1983, 1986).
It was found that the countercurrent flow pattern is not necessarily the best flow pattern for
asymmetric membranes, and the effect of the flow pattern is not significant for most
practical operating parameters. A model to describe the transport across asymmetric
membranes using a two-layer concept was presented by Sirkar (1977). It was suggested
that the gas species are transported through the dense skin layer by Fickian diffusion, while
Knudsen diffusion is assumed to control the transport across the microporous backing. The
overall flux equation is derived from the combination of both transports in series.
Experiments for the separation of O2/N2 and helium/N2 using proprietary composite
hollow fiber membranes were conducted by Giglia et al. (1991), and experimental results
were compared with cocurrent and countercurrent homogenous models and a cross flow
asymmetric model. It was concluded that the experimental observations closely resemble
with the homogenous cocurrent and countercurrent models than that of the cross flow
model. Sidhoum et al. (1988) investigated separation of CO2/N2 and O2/N2 and also
confirmed the findings by Giglia et al. (1991). Feng et al. (1999) showed experimentally
that the permeation of O2/N2 through asymmetric hollow fiber membrane does not give rise
to cross-flow permeation and that tube side feed countercurrent flow yields the best
separation performance. Narinsky (1991) also advocated that permeation in asymmetric
membrane follows the homogenous cocurrent or countercurrent model.
Chapter 2
23
2.6.2 Feed compression, vacuum pumping and sweep gas operation
Separation effect can be achieved in membrane permeation only at the expense of a
specific driving force exerted on each component of the feed mixture in terms of chemical
potential gradient. Basically, two distinct options can be taken in order to achieve that
purpose. The first is to increase the chemical potential on the feed side. This can be best
induced by a compression step exerted on the feed mixture. Such an option is classically
applied in gas permeation and reverse osmosis. The other is to decrease the chemical
potential on the downstream side. Vacuum pumping is interesting since it minimizes the
overall permeate flow rate, but it necessitates a compression step which is energy
consuming. Conversely, gas sweep is appealing due to the possibility it offers to work
under higher total downstream pressure conditions (lower compression cost), but it
generates an increased permeate flow rate and requires an additional component (i.e., an
inert gas such as nitrogen or air), which can be costly. From an industrial point of view, gas
sweep will generally offer the lowest raw energy consumption (pump work), unless a low
vacuum level can be practically achievable. Vacuum operation is however systematically
preferable when the integral work of separation (i.e., the work needed to recover pure
component) is taken into account (Vallieres and Favre, 2004). Vacuum sweep has been
reported beneficial for several applications (Skoulidas and Sholl, 2005; Vallieres and
Favre, 2004; Xie et al., 2009; Xu et al., 2006). However, vacuum pumping does not save
much power but uses lots of membrane (Lin et al., 2007).
2.6.3 Pressure build-up in hollow fiber membranes
Pressure drop generally occurs in the bulk flow directions as gas flows through the
membrane module. A significant pressure drop can occur in a hollow fiber permeator in
case of small lumen sizes (inside diameter 50-100 m). The permeate pressure increases
from the open end to the close end if the permeate is in the tube side of the hollow fibers.
The feed pressure reduces from the feed inlet to outlet if the feed is in the tube side, as
shown in Figure 2.7. Both situations will cause a reduction in the local pressure difference
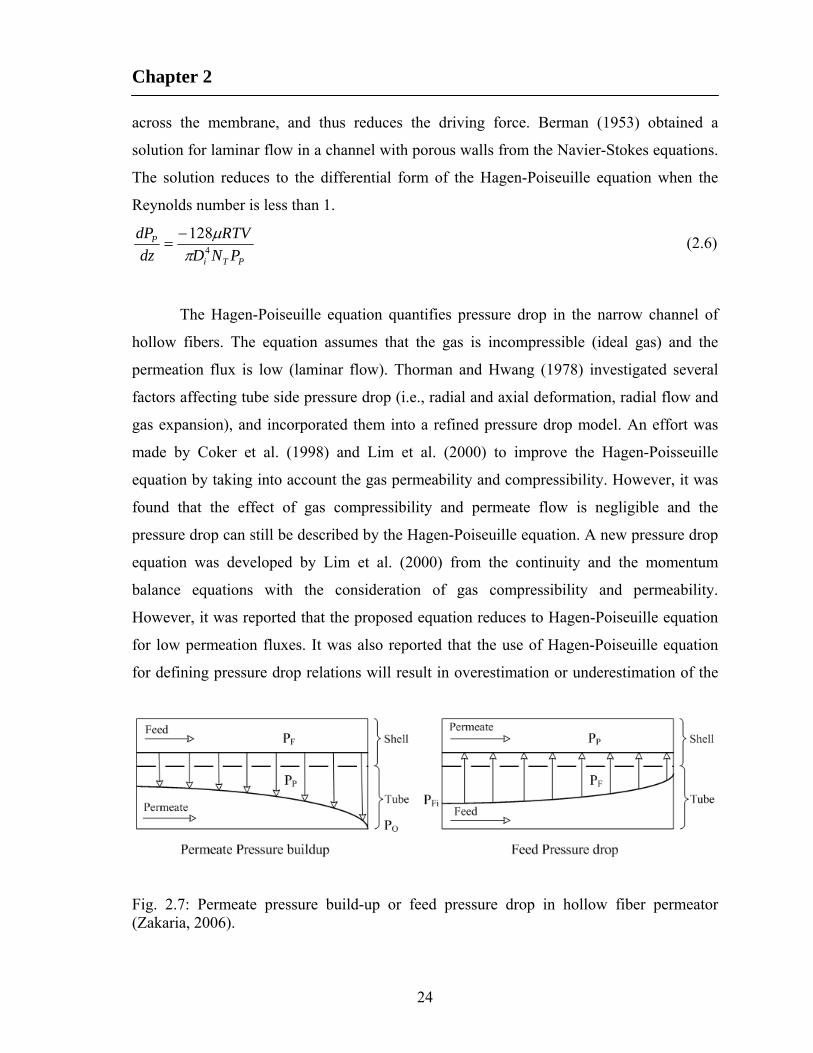
Chapter 2
24
across the membrane, and thus reduces the driving force. Berman (1953) obtained a
solution for laminar flow in a channel with porous walls from the Navier-Stokes equations.
The solution reduces to the differential form of the Hagen-Poiseuille equation when the
Reynolds number is less than 1.
PTi
P
PND
RTV
dz
dP4
128
(2.6)
The Hagen-Poiseuille equation quantifies pressure drop in the narrow channel of
hollow fibers. The equation assumes that the gas is incompressible (ideal gas) and the
permeation flux is low (laminar flow). Thorman and Hwang (1978) investigated several
factors affecting tube side pressure drop (i.e., radial and axial deformation, radial flow and
gas expansion), and incorporated them into a refined pressure drop model. An effort was
made by Coker et al. (1998) and Lim et al. (2000) to improve the Hagen-Poisseuille
equation by taking into account the gas permeability and compressibility. However, it was
found that the effect of gas compressibility and permeate flow is negligible and the
pressure drop can still be described by the Hagen-Poiseuille equation. A new pressure drop
equation was developed by Lim et al. (2000) from the continuity and the momentum
balance equations with the consideration of gas compressibility and permeability.
However, it was reported that the proposed equation reduces to Hagen-Poiseuille equation
for low permeation fluxes. It was also reported that the use of Hagen-Poiseuille equation
for defining pressure drop relations will result in overestimation or underestimation of the
Fig. 2.7: Permeate pressure build-up or feed pressure drop in hollow fiber permeator (Zakaria, 2006).
Chapter 2
25
membrane area required at the stipulated stage cut depending on the feed mode operation.
Several permeator models incorporated the Hagen-Poiseuille equation to account
for the effect of pressure build-up in the separation (Chern et al., 1985; Pan and Habgood,
1978b; Pan, 1983, 1986). A comparison of the permeator performance achieved with and
without taking into account the pressure build-up was portrayed by Pan (1978b). Chern et
al. (1985) developed a model for simulating the performance of an isothermal hollow fiber
permeator for binary gas mixtures. The model considered permeate pressure build-up and
concentration dependence of the permeabilities by using the dual-mode sorption and
transport models. The effects on separator performance caused by changes in fiber
dimensions, feed pressure, membrane area and feed composition were investigated. Shao
and Huang (2006) made and effort to provide an analytical approach to analyze the extent
of pressure build-up. A dimensionless parameter that contains all the dominant factors
responsible for generating the pressure build-up was proposed to serve as an indicator on
the extent of pressure build-up in hollow fibers. However, a big pressure build-up in hollow
fibers should be avoided since it represents a sacrifice of the driving force for gas
permeation. Shao and Huang (2006) estimated the optimum length of the fiber as 12 cm,
corresponding to the permeance of the fiber of 9.0 GPU, which otherwise will significantly
inhibit gas permeation due to pressure build-up in fibers. It suggests that attention should
be given to the fiber length while evaluating the fiber’s gas permeance. It was also pointed
out that influences of permeance and inner diameter are equivalent to that of the fiber
length, so fiber length should be handled with caution particularly when the inner diameter
of the fiber is small, and/or the intrinsic permeance of the fiber for the permeating gas is
high (Shao and Huang, 2006).
2.6.4 Apparent and intrinsic permeances
The permeance of gases through hollow fiber membranes is essentially independent
of feed pressure, which is normally the case for permeation of permanent gases in glassy
polymers and may be attributed to the constant diffusivity at different pressures. Other
studies also reported that the intrinsic permeability of non-condensable gases in glassy

Chapter 2
26
polymers is constant or slightly decreasing with pressure (Haraya et al., 1989; Haraya and
Hwang, 1992).
Gas permeance is measured normally with pure gases, and the ratio of pure gas
permeance gives the ideal membrane selectivity, which is an intrinsic property of the
membrane material. The magnitude of selectivity depends sensitively on the gas pair under
consideration. In case of air separation, the selectivity varies from approximately 2 to 15 in
polymers, in contrast with 5 to 1000 or more for H2/CH4 separation (Robeson, 1991).
However, practical gas separation processes are performed with gas mixtures. If the gases
in a mixture do not interact strongly with the membrane material, the intrinsic selectivity
based on pure gas permeability and the mixed gas selectivity will be equal. This is usually
the case for mixtures of oxygen and nitrogen, for example. In many other cases, such as a
carbon dioxide and methane mixture, one of the components (carbon dioxide) is
sufficiently sorbed by the membrane to affect the permeability of the other component
(methane). Neglecting the difference between these two values, however, has led to a
serious overestimate of the ability of a membrane to separate a target gas mixture (Baker,
2004; Lee et al., 1988). The hollow fiber membranes used in gas separation are often very
fine. However, the pressure build-up on the lumen side of the membrane for these fine
fibers can become enough to seriously affect membrane performance. Permeance
determined from pure gas permeation experiments (apparent permeance) does not
necessarily represent the true permeance of the membrane due to pressure build-up in the
fiber lumen. In the production of nitrogen enriched air, the pressure-normalized fluxes are
relatively low, from 1 to 2 GPU, and the pressure drops are not a significant problem.
However, in the separation of hydrogen from nitrogen or methane, or carbon dioxide from
natural gas, the pressure-normalized fluxes are higher, and excessive permeate pressure
drops can develop in hollow fine fibers (Baker, 2004). Pressure build-up increases for
longer fibers, fine fibers and for high pressure applications. For identical feed pressure and
membrane area, permeate flow is less in the long fiber than that of shorter one, which can
be attributed to the reduced driving force resulting from the permeate pressure build-up. In
an industrial scale, the membrane length is usually more than 1 m and a considerable
pressure build-up in the lumen can occur, resulting in discrepancy in the predicted

Chapter 2
27
membrane performance if this effect is neglected. It is also important to ensure that all of
the fibers have identical fiber diameters. Even a variation as small as ±10% from the
average fiber diameter can lead to large variations in module performance (Crowder and
Cussler, 1997; Lemanski and Lipscomb, 2000). Moreover, the length of potted section in
the tube sheet contributes some pressure drop, and exclusion of the potted length section in
theoretical analysis could possibly exacerbate prediction of module performance.
Wang et al. (2002) employed binary simulation models as an analytical tool to
calculate the true permeation characteristics of hollow fiber membranes for a gas mixture
of CO2 and CH4. Lababidi et al. (1996) employed an approximation method to estimate the
permeance of each gas component in the gas mixture. Permeances measured from mixed
gas permeation experiments do not represent the true intrinsic property of the membrane.
Determination of mixed gas permeance through simulations are not straightforward and
require consideration of competitive sorption, plasticization, concentration polarization,
non-ideal behaviour of gases, and knowledge of thermodynamic properties (Chenar et al.,
2006; Wang et al., 2002). However, pure gas permeances and selectivities are much more
commonly reported in the literature than gas mixture data because they are easier to
determine.
2.6.5 Numerical techniques and solution scheme
The numerical solution techniques for hollow fiber permeators involve solving a set
of nonlinear ordinary differential equations (ODEs), which generally constitute boundary
value type problems. Several solution techniques have been reported in the open literature
including trial and error shooting techniques (Pan and Habgood, 1978b), finite difference
with iteration approach (Coker et al., 1998), finite element (Thundyil and Koros, 1997),
finite volume method (Cruz et al., 2005), and orthogonal collocation (Kaldis et al., 1998;
Kaldis et al., 2000; Marriott and Sørensen, 2003).
Numerical solution to the set of ODEs can result in substantial computational time
and effort. Instead of solving the complex set of ODEs, approximate solutions to the model

Chapter 2
28
equations have been developed by several workers (Boucif et al., 1984; Boucif et al., 1986;
Krovvidi et al., 1992; Pettersen and Lien, 1994a) in order to reduce computational
difficulties, time and to provide quick solution especially for initial design purposes. A
linear approximation model to solve the multicomponent countercurrent gas permeator
transport equations considering pressure variation inside the fiber was presented by
Kovvali et al. (1994). A linear relationship between the permeate and feed stream
compositions was assumed, which reduced the computational efforts and also yielded
analytical expressions for flow rates, permeate pressure, and compositions along the length
of the permeator. A robust algebraic model for multi-component separation based on
analogy with countercurrent heat exchangers was developed by Peterson and Lien (1994a).
The algebraic nature of their model would make it easier to optimize membrane system and
operating conditions. For a multi-component system, the solution using trial and error
techniques is much more complicated than the binary case due to the need to converge an
increased number of boundary conditions. A systematic method to find multi-component
solution vectors using direct search maximizing routine adopted from box complex method
was presented by McCandless (1990). More recently, a new numerical approach to solve
the ODEs using Adams-Moulton’s or Gear’s backward differentiation formulas was
developed by Chowdhury et al. (2005). This method allows the model equation to be
solved as an initial value problem without initial estimates of the pressure, flow and
concentration profiles.
2.7 Membrane process modules and cascade configurations
Since the membrane selectivity and pressure ratio achievable in a commercial
membrane system are limited, single stage membrane system may not provide the
separation desired. If the desired separation cannot be accomplished in a single stage or if a
higher purity or recovery is needed, stream recycles or multi-stage operations could be a
solution to improve the overall separation performance (Zakaria, 2006). A number of
possible module configurations have been proposed by researchers and industries,
including single permeation stage, recycle/reflux, and cascade configurations of multi
stages. With the current generation of membranes, single-stage permeation, simple to
Chapter 2
29
operate and control, is often capable of meeting a wide range of separation requirements.
For many applications, a simple single-stage configuration is sufficient and offers the
lowest capital investment (Bhide and Stern, 1991a). Multistage/multistep combinations can
be designed but are seldom used in commercial systems in the first instance due to their
complexity and being uncompetitive with alternative separation technologies (Baker,
2004). However, more complex designs are economically justified as the size of the
processes expands and the costs of the separated components increase. More commonly,
some form of recycle designs are used commercially and preferred over
Multistage/multistep combinations. The enrichment of the more permeable component can
be improved by recycling a part of the permeate stream to the feed stream. Pettersen and
Lien (1994b), from their mathematical analysis of two cell configurations with a recycle of
reject or permeate streams, reported that the reject recycle improves species recovery and
product purity. On the other hand, the permeate recycle reduces the compressor duty which
in turn improves the process economics.
2.7.1 Recycle and multiple stage permeators
A well known method for increasing the product purity is by cascade operation in
which the permeate from a first permeator is recompressed and fed to a second permeator
while the unpermeated stream from the second permeator is returned to the first permeator
(Stern et al., 1984). A potentially more efficient way is to recycle a fraction of the
concentrated permeate back to the feed stream. A parametric analysis of the permeate
recycle to feed stream was conducted by Stern et al. (1984) for oxygen enrichment of air,
while Majumdar et al. (1987) performed both experimental and theoretical analysis of the
same system. An increase in the recycle ratio was found to increase the product purity but
the membrane area requirement and compression power also increased rapidly with
increased recycle ratio.
Multiple stage process designs usually involved tradeoffs between higher product
recovery and increased equipment and operating costs. Several studies have been carried
out to compare the performance of various multistage permeator designs (McCandless,
Chapter 2
30
1985; Schulz, 1985; Spillman, 1989). An economic study by Spillman (1989) shows
multiple stage designs have the same or lower process cost than a single stage process for
some particular applications. An economic study of H2 and N2 separation from coal
gasification was conducted by Gottschlich et al. (1989), and the performance of a single
stage design was compared with several multistage designs. It was concluded that the
single stage operation is the most economical for easy separations (when the feed and
product compositions are not greatly different), while multiple stages are more economical
for medium to difficult separations. An alternative method to choose optimal
configurations for gas separation was proposed by Laguntsov et al. (1992), and it was
shown that the use of high selectivity membranes in a conventional permeator does not
always give better economics, however, the use of low selectivity membranes in a recycle
system sometimes would.
Instead of an independent second permeator at the downstream of a first permeator,
an internal second stage can be provided in the same permeator, which is referred to as an
internally staged permeator (ISP) (Sidhoum et al., 1989). In an ISP, as the feed gas in the
first tube set (first permeator) permeates to the shell side, a fraction of the permeate passes
to the second tube set (internal second stage) which is maintained at a lower pressure than
the shell side. Therefore, at every axial location of the permeator, permeate from the first
membrane is fed to the second membrane. For air separation producing high purity
nitrogen, it was shown by Sidhoum (1989) that ISP gives a slightly better separation than a
two-stage cascade. However, the physical manufacturing of an ISP is more difficult than
the conventional hollow fiber modules. A great deal of recycle and multiple stage
permeators used commercially can be found elsewhere (Baker, 2002; Baker, 2004; Baker
and Lokhandwala, 2008; Basu et al., 2004; Bernardo et al., 2009; Lokhandwala et al.,
2010).
2.7.2 Unsteady state and cyclic operations
The advantages with steady-state operation include easy start-up and shout-down,
simplicity of pressure and flow controls, large throughput of permeation, and low

Chapter 2
31
maintenance requirements. However, several gas pairs of industrial interest cannot be
separated effectively by current polymeric membranes due to limited permselectivity.
These characteristics prompt researchers to consider the potential advantages of improved
permselectivity in transient state conditions (Wang et al., 2011). Membrane gas separations
under transient state conditions are rather unexplored compared to steady-state operations.
However, unsteady state permeation is shown to be sometimes more beneficial to enhance
the separation efficiency (Beckman et al., 1991; Higuchi and Nakagawa, 1989; Paul, 1971).
The solution-diffusion mechanism states that the permeability coefficient can be considered
equal to the product of solubility coefficient and diffusion coefficient (Nunes and
Peinemann, 2006). Unfortunately, for most membrane materials, a trade-off relationship
between permeability and selectivity often exists, and there appears to be an upper bound
in permeability vs. selectivity plot above which virtually no data exist (Robeson, 1991).
Once the membrane material is fixed, the intrinsic selectivity is essentially fixed as long as
steady-state operation is used. However, transient and, in particular, steady cyclic operation
of the membrane can be used to alter the selectivity characteristics.
To the best of our knowledge, the first theoretical study dedicated to a membrane
separation process operating in a cyclic transient fashion was performed by Paul (1971) in
1971. Paul’s design theoretically improved the separation when the membrane’s mobility
selectivity is significantly greater than permselectivity. If the feed is admitted intermittently
at appropriate time intervals, the difference in the desorption fallout rates (due to the
difference in the permeant diffusivity) can be exploited to effect the separation. Two cuts
of permeate can be taken periodically in a time sequence in phase with the upstream
pressure variations, and they are enriched in the component with the higher and lower
diffusion coefficients, respectively. Corriou et al. (2008) optimized Paul’s (1971) mode of
operation and reported that synchronous operation offers the best performances. Corriou et
al. (2008) also reported that based on current membrane material, the cyclic operation
could potentially compete with the most selective polymers available to date, both in terms
of selectivity and productivity.

Chapter 2
32
Kao et al. (1991) reported a pressure swing scheme similar to pressure swing
adsorption to carry out the transient permeation where the opposite solubility and
diffusivity selectivity can operate synergistically. By periodically pressurizing the feed gas
on one side of the membrane, a product enriched in the less soluble species can be
collected during the high pressure cycle. A variant of the process is also described by
LaPack and Dupuis (1994) to exploit the differences in the rates of either attainment of
steady-state permeation or fall-off from steady-state permeation. Ueda et al. (1990)
described air separation by a cyclic process comprising of the steps of feed pressurization
and permeates evacuation using a compressor and a vacuum pump separately or using a
single pump suitable for both pressurization and suction. Bowser (2004) and Nemser
(2005) extended the application of cyclic process for controlling environmental emissions
of volatile organic compounds (VOC) for vapour recovery in storage and reported
reduction in overall VOC emissions. Feng et al. (2000) reported an unsteady state
permeation process called pressure swing permeation for gas separation. The relatively low
permeate pressure was elevated by periodically "pushing" the permeate by the high
pressure feed gas, producing a permeate stream at a pressure as high as the feed pressure,
which is impossible to achieve with conventional steady-state permeation. Transient and, in
particular, steady cyclic operations can achieve a selectivity beyond the conventional
processes; however, it has been overlooked despite its potentials.
2.7.3 Membrane hybrid systems
Hybrid processes are integrated processes in which a membrane system operates in
combination with another unit operation, or processes in which the basic functioning of the
membrane is joined with another physical or chemical process in a single unit operation. A
properly designed hybrid process will balance the drawbacks of the specific process and
favorably combine their advantages. The result will be a better separation that neither
process could achieve individually, contributing to a sustainable process improvement by
allowing the reduction of investment and operational costs (Bernardo et al., 2009).

Chapter 2
33
Typically, membranes offer bulk removal properties with a relatively small area i.e.,
moderately pure product at low cost, that may be economically upgraded by a subsequent
process. Davis et al. (1993) reported a pilot BP distillation/membrane hybrid process for
propane/propylene separation, where a part of the vapor mixture from the cryogenic
distillation column is sent to the membrane system which extracts the propylene using an
aqueous solution of silver nitrate. The integration of membranes with such other separation
processes as PSA (Bernardo et al., 2009; Doshi et al., 1989; Feng et al., 1998a) is well-
established in the chemical and petrochemical industries. Membrane permeation can be
effective to aid the pressurization and high-pressure adsorption steps of a typical PSA
process. The pressure difference available from the PSA can be used for operating the
membrane incorporated into the blow down step of the PSA cycle (Esteves and Mota,
2007; Bernardo et al., 2009). Usually, a combination of membranes with PSA is considered
in H2 separation, while hybrid membranes with amine absorption are applied to the CO2
separation. Belaissaoui et al. (2012) studied a hybrid membrane cryogenic process for post-
combustion CO2 capture and reported that the energy requirement of the hybrid process is
lower than that of the energy required for an independent cryogenic process, and the
overall energy requirement of the hybrid process could possibly be significantly decreased.
A case study of hybrid process combining oxygen enriched air combustion and membrane
separation for post-combustion CO2 capture was investigated from an energy requirement
perspective (Favre et al., 2009a) and the hybrid process could lead to a 35% decrease in the
energy requirement compared to oxycombustion. A comparison of the separation cost for
the membrane process with diethanolamine (DEA) absorption showed that the membrane
process is more economical for CO2 concentrations in the feed in the range 5-40 mol %
(Bhide et al., 1998). If the feed contains H2S, the cost for reducing CO2 and H2S
concentrations to pipeline specifications increases with increasing H2S concentration
(1000-10000 ppm). If membrane processes are not economically competitive because of
the high H2S concentration in the feed, the separation cost could be significantly lowered
by using hybrid membrane processes. In such processes, the bulk of CO2 and H2S are
separated from sour natural gas with membranes and the final purification is performed by
means of suitable gas-absorption processes (Bhide et al., 1998). A hybrid system (Cynara
membranes with amine absorption) has been operating since 1994 in Mallet (Texas,
Chapter 2
34
U.S.A.) to perform the bulk removal of CO2 from associated gas (90% CO2 and heavy
hydrocarbons), before downstream treating. The membrane system offered a 30%
reduction in operating cost when compared with a methyl diethanolamine (MDEA) system
and significantly reduced the size of the subsequent operations (Blizzard et al., 2005).
Several EOR projects in Texas integrate membranes and amine technologies to produce
pipeline quality natural gas and at the same time to recover CO2 (Chowdhury, 2012; Echt,
2002). The economic viability of membrane-amine hybrid processes for the removal of
acid gases (i.e., CO2 & H2S) from crude natural gas could be found elsewhere (Bhide et al.,
1998; Echt, 2002; McKee et al., 1991).
2.8 Industrial applications of membrane gas separation
The membrane gas separation industry is still growing and changing. Most of the
large industrial gas companies now have membrane affiliates: Air Products (Permea), MG
(Generon), Air Liquide (Medal) and Praxair (IMS). The affiliates focus mainly on
producing membrane systems to separate nitrogen from air, but also produce some
hydrogen separation systems. Another group of companies including UOP (Separex),
Natco (Cynara), Kvaerner (GMS) and ABB Lummus Global produce membrane systems
for natural gas separations. A third group of smaller independents are focusing on the new
applications including vapor separation, air dehydration and oxygen enrichment. The main
industrial applications of membrane gas separation are summarized in Table 2.2.
Overviews on the main gas separation applications can be found in Koros and Fleming
(1993); Baker (2002); and Bernardo et al. (2009).
2.8.1 CO2 removal and capture
The recovery of carbon dioxide from large emission sources is a formidable
technological and scientific challenge which has received considerable attention for several
years (Favre, 2007). Polymeric membranes are well developed today and commercially
available for CO2 capture. Recovery of carbon dioxide from flue gas streams is particularly

Chapter 2
35
Table 2.2: Main industrial applications of membrane gas separation (Bernardo et al., 2009).
Separation Process
H2/N2 Ammonia purge gas
H2/CO Syngas ratio adjustment
H2/hydrocarbons Hydrogen recovery in refineries
O2/N2 Nitrogen generation, oxygen-enriched air production
CO2/hydrocarbons (CH4) Natural gas sweetening, landfill gas upgrading
CO2/N2/O2 Carbon dioxide removal from flue gas or
Enhanced coal bed methane application
H2O/hydrocarbons (CH4) Natural gas dehydration
H2S/hydrocarbons Sour gas treating
He/hydrocarbons Helium separation
He/N2 Helium recovery
hydrocarbons/air Hydrocarbons recovery, pollution control
H2O/air Air dehumidification
Volatile organic species
(e.g., ethylene or propylene)/light
gases (e.g., nitrogen)
Polyolefin purge gas purification
interesting both for the product value of CO2 (e.g., enhanced oil recovery) and for
environmental reasons (reducing the greenhouse effect). The key issue for CO2 capture is
minimizing the energy required in the overall process (capture and sequestration).
Post-combustion capture involves the separation of CO2 from the flue gas produced
from the combustion of fossil fuels (e.g., from a standard gas turbine combined cycle, a
coal-fired steam power plant). This technology involves CO2 separation at a relatively low
temperature, from a gaseous stream at atmospheric pressure and with a low CO2
concentration (5-15 vol % if air is used during combustion). Suitable methods for CO2
capture may include absorption, adsorption, and membrane processes. Amine absorption is
today’s best technology for post-combustion capture, with an energy cost in the range of 4-
Chapter 2
36
6 GJ/ton CO2 recovered (mainly due to significant energy consumption in the solvent
regeneration step). However, the amine process requires large-scale equipment for the CO2
removal and chemicals handling. In post-combustion capture, CO2 must be separated from
the flue gases (where N2 is the main component). Due to the low CO2 concentration and
pressure in this gas, the commercial membranes used to separate CO2 from natural gas at
high pressures are not particularly suited. Their use will result in a large membrane area
and in high compression costs (Bernardo et al., 2009). Bounaceur et al. (2006) presented a
simulation study on the separation performance and energy cost of a single-stage
membrane module for post-combustion applications considering binary dry CO2/N2 feed
mixtures with a wide range of compositions and membrane CO2/N2 selectivities. It was
shown that most membranes currently available (CO2/N2 selectivity less than 50) are not
adequately capable of producing the recovery and permeate compositions (specified by the
government regulations), but membranes with selectivity above 100 are required. However,
for flue streams containing 20% or more CO2, reasonable recoveries and permeate
compositions (that do not exceed 80%) can be attained with currently available membranes
and the related cost will be only about 0.5-1 GJ/ton CO2 recovered, which is lower than the
amine absorption.
Carbon dioxide removal from natural gas (i.e., natural gas sweetening) is needed to
meet the pipeline specifications (e.g., down to 2% vol. in U.S.A.), since CO2 reduces the
heating value of natural gas, renders corrosion, and freezes at a relatively high temperature,
forming blocks of dry ice that can clog pipelines and damage pumps. Membrane
technology is attractive for CO2 removal from natural gas since it offers a high recovery of
the acid gases without significant loss of pressure in the pipeline product gases, and the
treatment can be accomplished using the high wellhead gas pressure as the driving force for
the separation. A high natural gas recovery (> 95%) can be achieved in multistage systems.
Membrane systems are typically installed for small size applications (less than 6000
Nm3/h) and in remote locations since amine processes are too complicated for small
productions. Membrane and amine systems become competitive for a size of 6000-50000
Nm3/h, while bigger plants are installed for offshore platforms or for enhanced oil
recovery. Membrane gas separation presents significant advantages for the offshore

Chapter 2
37
industry; moreover, it is an environmentally friendly alternative to traditional amine
absorption (Bernardo et al., 2009).
Methane is the second largest contributor to global warming, after carbon dioxide.
Landfills and sewage treatment digesters produce methane-rich biogas that contains
approximately 50% carbon dioxide. Although biogas is expensive to upgrade, the gas is
essentially free and its collection will satisfy certain environmental interests. Also, such gas
is usually located near industrialized areas where energy values are high. Several landfills
currently use membranes to upgrade to a high-quality gas. In this application, membranes
compete directly with water-scrubbing, amine treatment and PSA. It also competes with the
use of the untreated gas as a low BTU fuel. The competitiveness of membranes for biogas
applications is strongly dependent on the pressure requirements of the product gas. Low
pressures penalize membrane economics. If a high-pressure gas is required, then
membranes offer clear advantages (Noble and Stern, 1995). Membrane Technology and
Research (MTR) along with United States Environmental Protection Agency (USEPA) has
been developing simple and low cost membrane process to convert landfill gas and other
dilute methane waste gas streams into useful fuel. Such streams, containing 10-40%
methane, are often vented without capturing the fuel value (estimated at $US200-300
million per year), and contribute up to 1 Tg (= 1 million tons) of methane to U.S.
greenhouse gas emissions (Membrane Technology and Research, 2012). Several other gas
companies (Pall Corporation, Monarflex, Evonik Industries, Air Products, Sioen Industries)
have been developing membranes to capture the fuel value of biogases worldwide.
2.8.2 Nitrogen- and oxygen-enriched air production
Air separation to produce nitrogen and oxygen (or oxygen-enriched air) by selective
permeation through membranes is widely investigated. Membrane air separation is now
accepted as an economic process to produce moderate purity streams containing up to
99.5% nitrogen or 30~50% oxygen (Feng et al., 1999). It is estimated that air separation by
membranes represents about 60% of the overall membrane gas separation business.
According to the forecast made in 2002 (Baker, 2002), the total market of membrane gas
Chapter 2
38
separation in 2010 would be 350 million USD. However, its actual growth rate was faster
than expected, and it amounted to about 500 million USD in 2010, mainly because of the
expansion of the processes of air membrane separation (Yampolskii, 2012). For the present
generation of membranes, the permeation selectivity to oxygen and nitrogen is relatively
low (the permeability ratio or permselectivity is generally between 2 and 7). Consequently,
the production of relatively pure oxygen would require multistage operations, each stage
requiring recompression of the oxygen-enriched permeate stream from the previous stage.
Currently, there are no membrane systems that produce high purity oxygen by membrane
alone, while the membrane processes for the production of moderate purity nitrogen is
practically viable. When high purity nitrogen is desired, hybrid separation processes that
incorporate membranes with other ‘‘finishing’’ technologies such as PSA, liquefaction, and
deoxo process have been developed to eliminate the purity limitations of the membrane
process while taking advantage of its efficient bulk separation characteristics.
2.9 MEA-based CO2 capture technology
Monoethanolamine (MEA) used in MEA-based chemical absorption process was
developed over 70 years ago as a general solvent to remove acid gases (i.e., CO2 and H2S)
from natural gas streams. The idea of separating CO2 from flue gas streams started in the
1970’s, not with concern about the greenhouse gas effect, but as a potential economic
source of CO2 for different applications such as enhanced oil recovery (EOR). Fluor Daniel
Inc., Dow Chemical Co., ABB Lummus Crest Inc., and Kerr-McGee Chemical Corp. were
few of the initial developers of MEA-based technologies for CO2 capture (Chowdhury,
2012; Hassan, 2005; Rao and Rubin, 2002). MEA-based technology can capture more than
95% of the CO2 from flue gases to yield a fairly pure (> 99%) CO2 product stream. Most
commercial CO2 capture plants use processes based on chemical absorption with MEA
solvent until to date.
Flue gas from power plant is first treated to reduce the levels of particulates and
other impurities present, pressurized to overcome the pressure losses in the downstream
processing section, and cooled before sending to an absorption tower (absorber). The amine
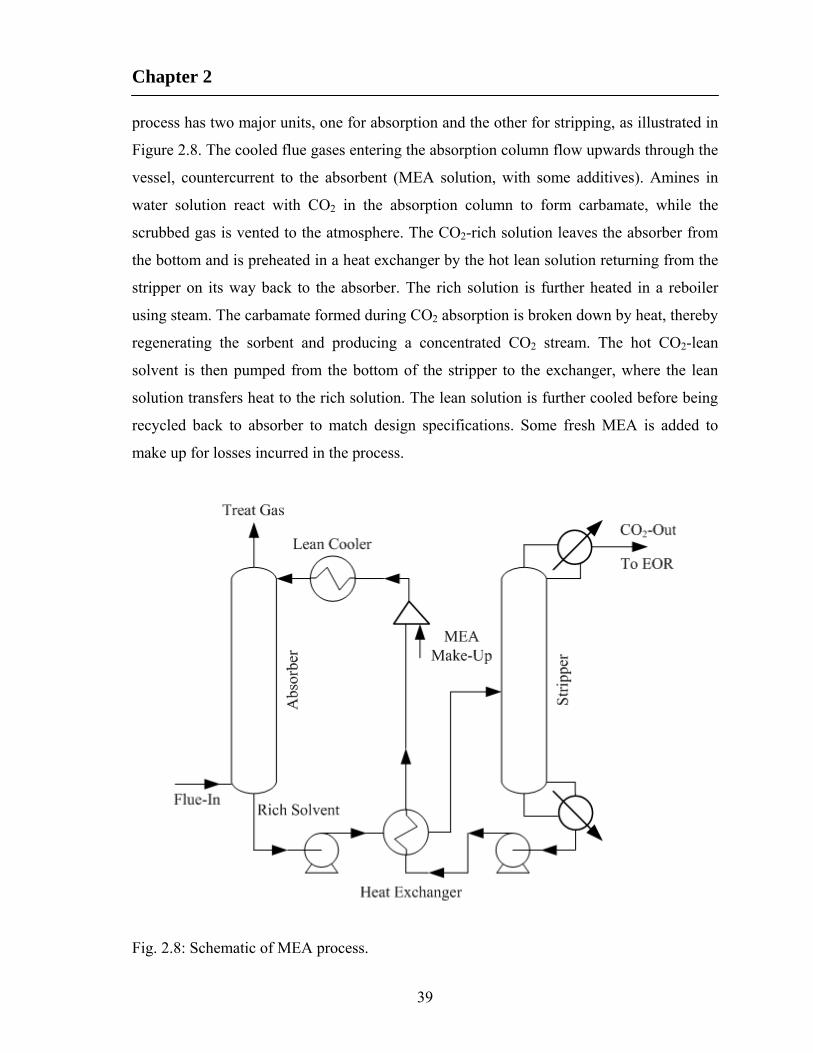
Chapter 2
39
process has two major units, one for absorption and the other for stripping, as illustrated in
Figure 2.8. The cooled flue gases entering the absorption column flow upwards through the
vessel, countercurrent to the absorbent (MEA solution, with some additives). Amines in
water solution react with CO2 in the absorption column to form carbamate, while the
scrubbed gas is vented to the atmosphere. The CO2-rich solution leaves the absorber from
the bottom and is preheated in a heat exchanger by the hot lean solution returning from the
stripper on its way back to the absorber. The rich solution is further heated in a reboiler
using steam. The carbamate formed during CO2 absorption is broken down by heat, thereby
regenerating the sorbent and producing a concentrated CO2 stream. The hot CO2-lean
solvent is then pumped from the bottom of the stripper to the exchanger, where the lean
solution transfers heat to the rich solution. The lean solution is further cooled before being
recycled back to absorber to match design specifications. Some fresh MEA is added to
make up for losses incurred in the process.
Fig. 2.8: Schematic of MEA process.

Chapter 2
40
The CO2 product is separated from the sorbent in a flash separator, and then taken
to the drying and compression unit. In order to be an effective climate change mitigating
solution, the captured CO2 must be stored safely and securely or it should be utilized. The
captured CO2 may be compressed to high pressures so that it is liquefied and can be
transported to long distances to the designated storage or disposal facility or it may utilized
for different applications (Chowdhury, 2012).
Since the carbamate formed during absorption is quite stable, it takes substantial
heat energy to break the bonds and to regenerate the sorbent. Although MEA-based
absorption process is a very most suitable technology available for capturing CO2
commercially from power plant flue gases and is considered a state-of-the-art technology
for acid gas removal, it has its own limitations. As mentioned above, one of the major
drawbacks is excessive energy penalty due to regeneration of the solvent for reuse.
Moreover, amine units use more energy when the CO2 concentration increases. The other
two factors are corrosion and loss of solvent. Corrosion control is very important in amine
systems for processing of oxygen-containing flue gases. Excessive corrosion has a great
impact on the plant’s economy as it can result in unplanned downtime, production losses,
reduction in life of machineries and limiting operational ranges of process parameters. In
order to reduce the corrosion rates, corrosion inhibitors, lower concentrations of MEA,
appropriate materials of construction and mild operating conditions are required (Barchas
and Davis, 1992). Some of the sorbent is lost during the process because of a variety of
reasons including mechanical, entrainment, vaporization and degradation. Not all the
sorbent entering the stripper are regenerated. Flue gas impurities, especially oxygen, sulfur
oxides and nitrogen dioxide react with MEA to form heat-stable salts, thus reducing the
CO2-absorption capacity of the sorbent (Rao and Rubin, 2002).
2.10 Conclusions
Though membrane gas separation is comparatively a new process, a great deal of
research has been carried out to date. It is beyond our scope to discuss everything in details.
Salient features of polymeric membranes, hollow fiber permeators, unsteady state
Chapter 2
41
permeation, and membrane hybrid systems have been discussed. Membrane based gas
separations are well established today and can outperform conventional techniques in many
aspects. The current trend in membrane gas separation industry is to develop robust
membranes with superior separation performance, in order to meet the key criteria of
reliability and durability for industrial applications. In accordance with that, process
analysis such as modeling, simulation, optimization and sorting optimal operating
conditions/modular configuration/economics are deemed necessary for better
understanding of the membrane separation technology. With the development of new
process concepts, new membrane applications will emerge. An optimal operating condition
and/or module configuration could possibly yield a better separation performance as well
as cost savings. Moreover, the potential of hybrid separation processes in industrial scale is
not fully exploited because of the lack of general design methodologies and detailed
process know-how. It is our understanding that although significant positive outcomes have
been found through research in membrane gas separation, the possibilities are endless.

Chapter 3
42
Simulation of binary gas separation with asymmetric hollow fiber
membranes and case studies of air separation†
3.1 Introduction
Membrane process is an attractive alternative to conventional technologies for gas
separations due to its simplicity in operation, moderately low capital cost, small size, low
energy consumption, low maintenance and reliable performance. Polymer membranes have
found applications in variety of industrial processes such as air dehumidification, nitrogen
production, oxygen enrichment of air, hydrogen recovery from refinery and ammonia
synthesis purge gases, landfill gas upgrading, sweetening of natural gas, recovery of carbon
dioxide for enhanced oil recovery, helium recovery, syngas ratio adjustment, and volatile
organic compound recovery. Remarkable efforts have been put forward on developing
membrane materials to offer high permselectivities. However, the overall process design
and operating conditions also play an important role in successful and economic
application of membranes for gas separations. The prediction of the separation performance
and the evaluation of the membrane process are essential to process engineers. Identifying
optimal operation and design conditions is difficult without a valid model of the system and
justified solution technique. Modeling and simulation of the membrane process is a viable
means to provide valuable information to the design, operating and economics of the
separation process with minimum cost.
Various aspects in membrane gas separation (e.g., permeation analysis, permeator
simulation, module design and economic evaluation) have been addressed using a variety
of structures and forms. Since the earlier work of Weller and Steiner (1950), who were
among the first to address mathematical modeling of membrane gas separators, a number
of mathematical models and calculation techniques with different flow patterns and module
configurations for symmetric and high flux asymmetric membranes have been investigated.
A great deal of modeling studies has been accomplished on symmetric membranes, but not
† Part of Chapter 3 has been published in Can. J. Chem. Eng. 90, 1253-1268; cited as Kundu et al. (2012a).
Chapter 3
43
much work was done on modeling of asymmetric membranes where the porous substrate
layer prevents back mixing of local permeate. Most of the models refer to binary systems
(Boucif et al., 1986; Feng et al., 1999; Kaldis et al., 1998; Pan and Habgood, 1978a, b; Pan,
1983; Sidhoum et al., 1988; Weller and Steiner, 1950) and only a few of them deal with
ternary or multicomponent systems (Coker et al., 1998; Kaldis et al., 2000; Chowdhury et
al., 2005; Sada et al., 1992; Sengupta and Sirkar, 1987; Weller and Steiner, 1950). For
hollow fiber membranes, the permeate pressure build-up in the fiber lumen has been
considered in a limited number of studies. The mathematical model developed by Pan
(1983) is widely accepted for calculating the performance of hollow fiber permeators with
high-flux asymmetric membranes. It takes into account the pressure build up inside the
fiber lumen and is applicable to the basic operating modes (i.e., countercurrent, cocurrent
and crossflow). However, the solution technique for the boundary value problem was very
complicated and demanded significant computational efforts. Moreover, prior initial
estimates of the pressure and concentration profiles along the fiber length were required.
Since commercial membrane modules have a predetermined length of fibers, this solution
technique leads to considerable numerical difficulties in such cases because of the trial-
and-errors involved. To overcome the computational complexities in solving the boundary
value problems, several modifications and alternative approaches to solving the model
equations have been proposed (Coker et al., 1998; Kaldis et al., 2000; Kovvali et al., 1994;
Marriott et al., 2001; Marriott and Sørensen, 2003). These models aim at simplifying the
governing equations and introducing additional assumptions that lead to approximate
solutions with less computational effort and time. Basaran and Auvil (1988) solved the
governing equations for the case of binary gas mixtures in a crossflow mode by asymptotic
solutions based on Navier-Stokes equations. However, these solutions do not really
alleviate the computational problems but rather the solutions appear to be inadequate at low
permselectivities. Singh et al. (1995) investigated the gas diffusion resistance inside the
porous supporting layer, which Pan (1983) considered negligible as compared to the mass
transfer resistance of the membrane skin layer. It was shown that gas diffusion within the
substrate pores is very fast compared to bulk transport in the fiber bore under certain
operating conditions, which leads to a simplifying assumption that the gas phase
composition at the porous layer interface is identical to that in the bore. This simplifies the

Chapter 3
44
governing equations, and the requirements for non-linear equations to describe local
permeate concentrations are bypassed. However, cases where gas diffusion is relatively
slow have not been discussed. Following the assumption of Singh et al. (1995), Giglia et al.
(1991) analyzed the concentration profiles along the fiber. The boundary conditions at fiber
entrance and exit were considered fixed to initial and final values, which is actually not
true, especially at the closed end of the fiber or at the residue exit. The solution technique
requires guessing of certain operating variables (e.g., the residue concentration at exit).
Sidhoum et al. (1988) studied binary gas separation with asymmetric hollow fiber
membranes by considering cocurrent or crossflow configuration, but the pressure build up
inside the fiber lumen was not taken into consideration. The problem was reduced to an
initial value problem and the obtained dependent variable profiles (with initial estimates
being supplied for the actual boundary value problem) were solved using the Runge-Kutta
method. Kaldis et al. (1998) developed a model based on Pan’s (1986) initial theoretical
formulation, and the orthogonal collocation technique was adopted to solve the basic
differential equations. This strategy conduces to a system of non-linear equations in which
the convergence is dependent on the estimated composition profile. Solution techniques for
the model equations differ depending on simplifications and specific applications.
Significant contributions have been provided by Agrawal and Xu (1996), Agrawal
(1997), Bhide and Stern (1991a, b), Ettouney et al. (1998), Feng et al. (1998a, b; 2000),
Pan (1986), and Sengupta and Sirkar (1983; 1987; 1988) to address some of the important
aspects in producing acceptable product purity with membranes. A number of possible
module configurations have been proposed, including single permeation stage, recycle, and
multi-stage cascades. With current generation of membranes, single-stage permeation,
which is simple to operate and control, is often capable of meeting a wide range of
separation requirements. For many applications, a simple single-stage configuration is
sufficient and requires the lowest capital investment (Bhide and Stern, 1991a). However,
more complex designs are economically justified as the size of the processes expands and
the costs of the separated components increase. The enrichment of the more permeable
component can be improved by recycling a part of the permeate stream to the feed stream.
Pettersen and Lien (1994b), from their mathematical analysis of two-cell configurations

Chapter 3
45
with recycle of reject or permeate streams, reported that reject recycle improves species
recovery and product purity. On the other hand, permeate recycle reduces the compressor
duty which in turn improves the process economics.
In this study, a mathematical model for high-flux asymmetric hollow fiber
membrane was developed on the basis of Pan’s (1986) original model. The basic model
was simplified in a way different from Pan’s (1986) original simplification. In simplifying
the governing equations, the approach taken by Sengupta and Sirkar (1995) was followed.
The model takes into account Pan’s (1983) approach of crossflow pattern with respect to
the membrane skin, irrespective of the flow direction of the bulk permeate stream outside
of the porous substrate layer. The permeate pressure build-up inside the fiber bore was
taken into account in the model. Finally, a set of coupled first order ordinary differential
equations for flow rate, composition and pressure profile were derived. A new solution
technique was developed to solve the model equations, which constitute a boundary value
problem. A set of ordinary differential equations (ODE’s) was solved as an initial value
problem (IVP) in two successive steps using Gear’s backward differentiation formulae
(BDF) method (DIVPAG subroutine in the IMSL library). An iterative approach was
employed since all quantities at any specific end are not known. The solution technique
was applied to different flow and module configurations (i.e., cocurrent and countercurrent,
shell-side feed, and bore-side feed). The model predictions were validated with
experimental results, and its robustness was demonstrated. The model as well as the
solution technique can be implemented for a variety of membrane gas separations.
Using the model, the separation characteristics of air by representative hollow fiber
membranes were investigated. In membrane air separation, air is fed to one side of the
membrane, and nitrogen is obtained in the residue side at a pressure equal to the feed, while
the permeate stream is enriched with oxygen at a substantially lower pressure. The primary
target is usually to have either nitrogen or oxygen enriched air as the product due to purity
and recovery considerations. In addition to membrane permselectivity and operating
pressures, the flow patterns (i.e., countercurrent, cocurrent, or crossflow) also influence the
separation performance of a membrane permeator. The feed gas can be supplied to either

Chapter 3
46
the shell-side or the bore-side of the hollow fibers. Both modes of feeding are being used
commercially for nitrogen production, and the choice is often determined by the cost of
module manufacturing and the separation performance. The configurations studied here
included single-cell, single-cell with permeate recycle, single-cell with retentate recycle, air
bleeding, and two cells in series. The results were presented in terms of species recovery,
productivity, stream enrichment and energy requirement. There is a complex interplay
between the process parameters. An optimization study or rigorous parametric study is
required for better understanding of the different module configurations and associated
economics.
3.2 Mathematical modeling
According to Pan (1983; 1986), the composition of the permeate leaving the
membrane skin surface differs from that of the bulk permeate outside the porous supporting
layer (y' as opposed to y, see Figure 3.1). It was considered that the permeate inside the
porous support is not affected by the bulk permeate composition, and the bulk permeate
composition at any point along the permeator length represents the accrued effect of all
permeation prior to that point. The composition y' is restrained by the relative local
permeation rates, which in turn are dictated by the local feed composition and local
pressures. The permeation rate of component A can be described as:
yPxPdAQdJ PFAA (3.1)
where
)( BAA dJdJdJy (3.2)
The assumptions employed in the analysis are:
1) The porous support layer has negligible resistance to the gas flow, and back diffusion
along the pore path is insignificant due to high permeate flux.
2) No mixing of different permeate compositions occurs inside the porous support layer.
3) The deformation of the hollow fiber under pressure is negligible.
4) The permeance of each species is constant at a given temperature.
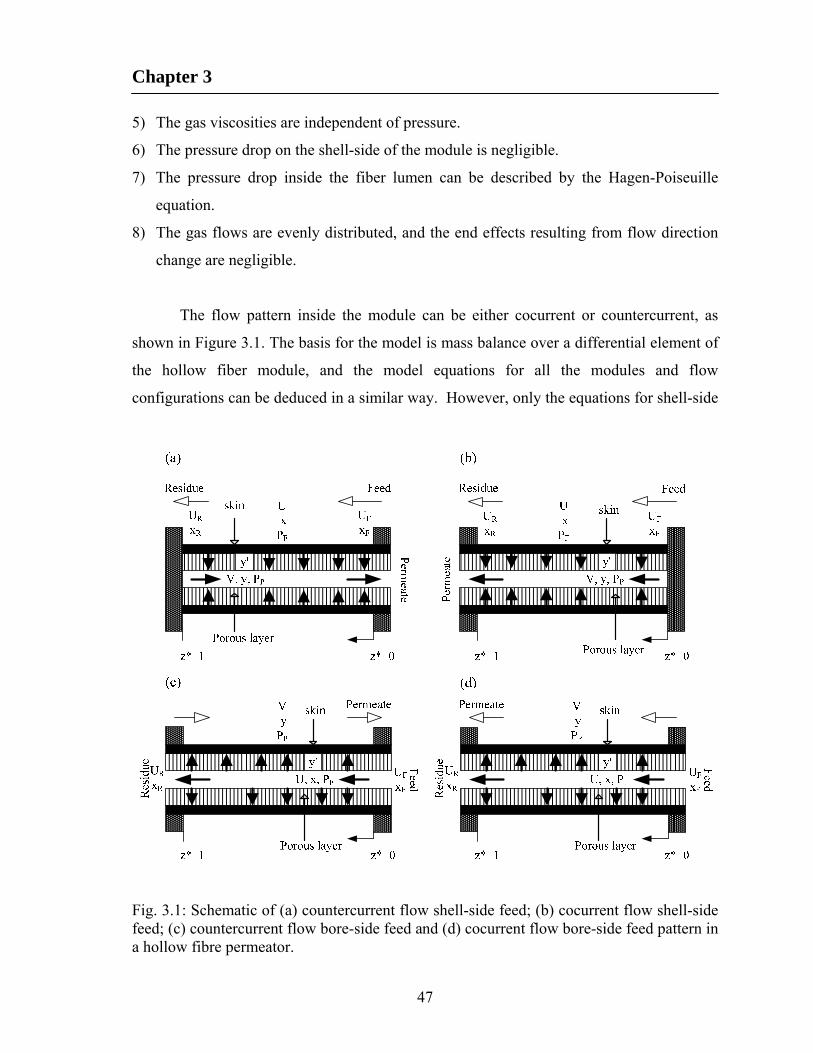
Chapter 3
47
5) The gas viscosities are independent of pressure.
6) The pressure drop on the shell-side of the module is negligible.
7) The pressure drop inside the fiber lumen can be described by the Hagen-Poiseuille
equation.
8) The gas flows are evenly distributed, and the end effects resulting from flow direction
change are negligible.
The flow pattern inside the module can be either cocurrent or countercurrent, as
shown in Figure 3.1. The basis for the model is mass balance over a differential element of
the hollow fiber module, and the model equations for all the modules and flow
configurations can be deduced in a similar way. However, only the equations for shell-side
Fig. 3.1: Schematic of (a) countercurrent flow shell-side feed; (b) cocurrent flow shell-side feed; (c) countercurrent flow bore-side feed and (d) cocurrent flow bore-side feed pattern in a hollow fibre permeator.
Chapter 3
48
feed countercurrent flow conditions are described here in details for brevity. Consider the
separation of binary gases with a hollow fiber membrane. Referring to Figure 3.1a, the
mass balance for the faster and slower permeating components over the differential
permeator length dz can be written as Eqs. (3.3) and (3.4), respectively:
dz
VydyPxPNDQ
dz
UxdPFToA (3.3)
dz
yVdyPxPNDQ
dz
xUdPFToB
111
1 (3.4)
Combining Eqs. (3.3) and (3.4) yields an expression for the total molar flow rate over the
differential permeator length dz:
dz
dVyPxPQyPxPQND
dz
dUPFBPFATo 11 (3.5)
The local relative rate of permeation can be described by
y
dU
Uxd (3.6)
The pressure variation in the fiber lumen can be represented by the Hagen-Poiseuille
equation,
PTi
P
PND
RTV
dz
dP4
128
(3.7)
The overall material balance and component balance yield
VUU R (3.8)
VyxUUx RR (3.9)
The local mole fraction of the permeate in the porous substrate y upon permeate leaving
the membrane skin layer is obtained from Eq. (3.6) with the help of Eqs. (3.3) and (3.5):
)1(21411115.02 xxxy (3.10)
For convenience, the following dimensionless quantities are defined:
B
A
Q
Q ,
F
P
P
P ,
El
zz ,
FU
UU ,
FU
VV ,
F
FBTEo
U
PQNlDK
1 ,
242
128
FTi
FE
PND
URTlK
Chapter 3
49
The differential equations for the molar flow rates at the residue and permeate sides are
obtained from Eq. (3.5) with the aid of the dimensionless quantities,
yxyxKdzdU 111 (3.11)
yxyxKdzdV 111 (3.12)
The differential equation for the variation of residue side mole fraction along the permeator
length is obtained from Eqs. (3.3) and (3.5):
UyxxyxxKdzdx 1111 (3.13)
The differential equation for the permeate side pressure build up along the fiber length is
obtained from Eq. (3.7),
VKdzd 2 (3.14)
The four simultaneous differential Eqs. (3.11-3.14), together with Eq. (3.10), describe the
molar flow rates of residue and permeate sides, the residue mole fraction, the permeate
pressure build up and the local permeate mole fraction along the dimensionless fiber
length. The solution is expected to give the molar flow rate and composition of the residue
stream from which the bulk composition of the permeate stream exiting the permeator can
be evaluated from the overall material balance (Eqs. 3.8-3.9).
The boundary conditions depend on the mode of operation. For countercurrent
operation, the boundary conditions are as follows:
At FiPooF PPUxxz and; 1 ; : )0(exit fiber (3.15a)
At 0 :)1( end closedfiber Vz (3.15b)
Alternatively, the bulk permeate concentration profile along the fiber length can be
obtained from Eq. (3.16),
VyxyyxyKdzdy 1111 (3.16)
A similar procedure can be applied for deriving the governing equations for shell-
side feed cocurrent flow configuration (Figure 3.1b), with slight modifications as follows:
1) The overall material balance for cocurrent flow
VUU F (3.17)
Chapter 3
50
2) Eqs. (3.11-3.14) and (3.16), together with Eq. (3.10), can describe the molar flow rates
of residue and permeate, residue composition, permeate pressure build up in the fiber
lumen and bulk permeate composition, respectively, with the signs for and ,* yV
being reversed:
and ; ;0 ; 1 : 0 fiber, theof end closedAt yyxx VUz F* (3.18a)
FiPoo PPz : 1 exit,fiber At (3.18b)
For bore-side feed flow (Figure 3.1c and d), the feed pressure PF decrease along its
direction of flow inside the hollow fibers, while the permeate pressure PP can be taken as
constant. Therefore, the dimensionless quantities and other variables can be defined using
the feed inlet pressure PFi, instead of PF:
FiPo PP , FFiBTEo UPQNlDK 1 , 242 128 FiTiFE PNDURTlK (3.19)
The variation in the feed pressure inside the fiber lumen can be described using a new
dimensionless variable β defined as
FiF PP (3.20)
The governing equations will now incorporate the change of β with fiber length and will
replace γ in the pressure drop equation used in the shell-side feed configuration. The final
governing equations for the bore-side feed configuration can be formulated similarly as for
the shell-side feed configuration.
3.3 Solution technique of model equations
For the permeator performance study, the known variables are: input feed
conditions (i.e., feed flow rate, composition, temperature and feed pressure), permeate
pressure at fiber exit, membrane permselectivity (i.e., permeance and permeance ratio) and
the membrane module information (i.e., fiber inside and outside diameters, length and
number of fibers). The variables to be observed are: stage cut (i.e., permeate to feed flow
rate ratio), and the concentrations of the permeate and residue streams. Though the model
equations appear to be of boundary value problem (BVP) nature, they can be solved
numerically as an initial value problem (IVP) for both shell-side feed and bore-side feed
Chapter 3
51
with countercurrent or cocurrent flow pattern. Unlike Pan’s approach, the present technique
does not require initial estimates of the pressure, flow or concentration profiles inside the
hollow fiber. The system of ordinary differential equations was solved using the Gear’s BDF
method based on the DIVPAG subroutine in the IMSL library. The BDF method is particularly
useful for stiff differential equations and differential algebraic equations. It is to be noted
that for binary gas separation, the local permeate concentration equation is an explicit
algebraic equation. However, for the separation of multicomponent gas mixtures, the
corresponding equations will be implicit non-linear equations. Details of multicomponent
gas separation have been addressed in a separate study (Kundu et al., 2012b).
The steps followed for shell-side feed countercurrent flow configuration are as
follows:
1) Algebraic Eq. (3.10), differential Eqs. (3.11-3.14) together with boundary
conditions (Eq. (3.15a and 3.15b)) define the operation of shell-side feed
countercurrent flow configuration.
2) Since the initial condition (at 0* z ) for *V is not explicitly known, an iterative approach
was adopted in order to solve the equations. The initial value of *V at 0z was
guessed at first instance. The local permeate mole fraction ( y ) at 0z was estimated
using Eq. (3.10) and the initial conditions.
3) Using the initial conditions of and , , ** xVU at 0z as well as y from step (2),
Eqs. (3.11-3.14) were integrated from 0z by calling DIVPAG subroutine from the
IMSL library to calculate and , , ** xVU for the next plate. After the integration step,
the value of y was updated.
4) Based on the values of yxVU and , , , ** from the first plate, new values of
yxVU and , , , ** were calculated for the next plate according to step (3). The
procedure was repeated till the Nth discrete point/plate or 1* z .
5) If the calculated value of *V at the other boundary 1 i.e., z did not match the
specified value (i.e., 0* V ) with a preset tolerance limit, steps (2-4) were repeated with
different guesses until the value was matched.
Chapter 3
52
6) After satisfying step (5), bulk permeate mole fraction at the fiber exit and bulk permeate
concentration profile along the fiber length were calculated from mass balance.
Alternatively, the values of yy xV and , , ,* at 0z were used as initial values to
initiate integration of Eq. (3.16) only, by calling DIVPAG subroutine from the IMSL
library to calculate bulk permeate concentration profile.
For the shell-side feed cocurrent flow configuration, five differential Eqs. (3.11-3.14,
and 3.16) together with algebraic Eq. (3.10) were simultaneously solved by assuming a γ at
0* z (instead of *V ). The solution procedure for bore-side feed countercurrent flow
configuration is essentially the same as the procedure for the shell-side feed countercurrent flow.
It may be mentioned that the bore-side feed cocurrent flow configuration is the easiest to execute
and does not require any trial and error since all the boundary conditions are explicitly specified
at 0z .
It may be mentioned that in Chowdhury et al. (2005), who used a set of implicit non-
linear algebraic equations for local permeate concentrations, the bulk permeate concentration at
the fibre exit was obtained by applying the L’Hospital’s rule. The present study uses explicit
linear algebraic equations, and the bulk permeate concentration profile was evaluated with a
differential equation. The numerical technique of Chowdhury et al. (2005) was a combination of
modified Powell hybrid algorithm, the Gear's BDF method, the L’Hospital’s rule and secant
method. With the present technique, the equations have been simplified such that the Gear’s BDF
method alone is adequate for solving the equations.
3.4 Validation of the model and solution technique
In order to validate the mathematical models and the solution technique, the model
predictions have been applied to simulate and compare the experimental data of air
separation using cellulose acetate-based asymmetric hollow fiber membranes (Feng et al.,
1999). Figure 3.2 represents the experimental and calculated oxygen and nitrogen
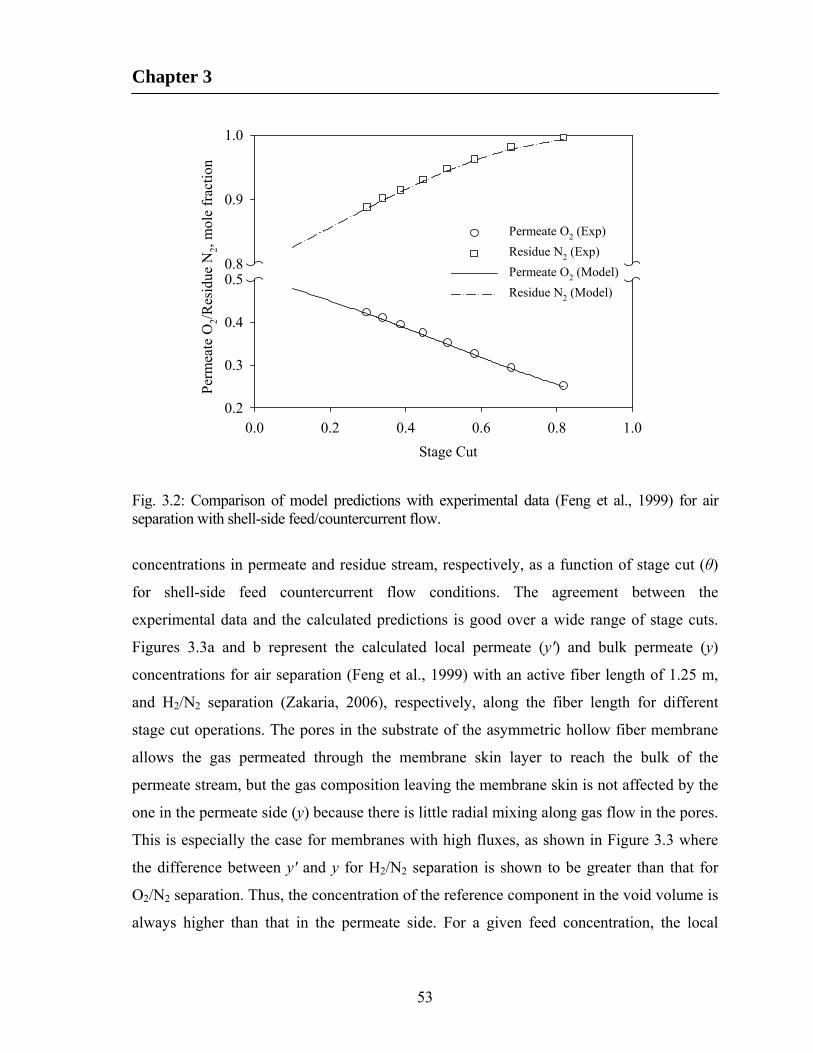
Chapter 3
53
Stage Cut
0.0 0.2 0.4 0.6 0.8 1.0
Per
mea
te O
2/R
esid
ue N
2, m
ole
frac
tion
0.2
0.3
0.4
0.50.8
0.9
1.0
Permeate O2 (Exp)
Residue N2 (Exp)
Permeate O2 (Model)
Residue N2 (Model)
Fig. 3.2: Comparison of model predictions with experimental data (Feng et al., 1999) for air separation with shell-side feed/countercurrent flow.
concentrations in permeate and residue stream, respectively, as a function of stage cut (θ)
for shell-side feed countercurrent flow conditions. The agreement between the
experimental data and the calculated predictions is good over a wide range of stage cuts.
Figures 3.3a and b represent the calculated local permeate (y') and bulk permeate (y)
concentrations for air separation (Feng et al., 1999) with an active fiber length of 1.25 m,
and H2/N2 separation (Zakaria, 2006), respectively, along the fiber length for different
stage cut operations. The pores in the substrate of the asymmetric hollow fiber membrane
allows the gas permeated through the membrane skin layer to reach the bulk of the
permeate stream, but the gas composition leaving the membrane skin is not affected by the
one in the permeate side (y) because there is little radial mixing along gas flow in the pores.
This is especially the case for membranes with high fluxes, as shown in Figure 3.3 where
the difference between y' and y for H2/N2 separation is shown to be greater than that for
O2/N2 separation. Thus, the concentration of the reference component in the void volume is
always higher than that in the permeate side. For a given feed concentration, the local
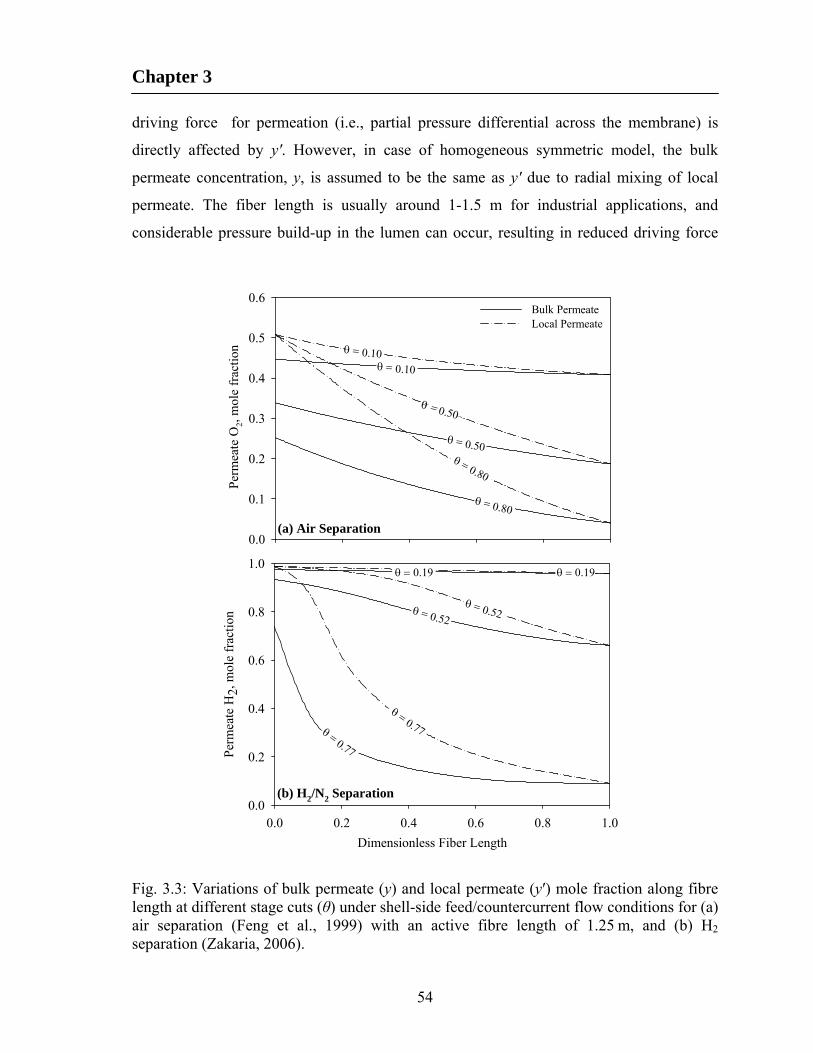
Chapter 3
54
driving force for permeation (i.e., partial pressure differential across the membrane) is
directly affected by y'. However, in case of homogeneous symmetric model, the bulk
permeate concentration, y, is assumed to be the same as y' due to radial mixing of local
permeate. The fiber length is usually around 1-1.5 m for industrial applications, and
considerable pressure build-up in the lumen can occur, resulting in reduced driving force
0.10
0.10
Per
mea
te O
2, m
ole
frac
tion
0.0
0.1
0.2
0.3
0.4
0.5
0.6Bulk Permeate Local Permeate
Dimensionless Fiber Length
0.0 0.2 0.4 0.6 0.8 1.0
Per
mea
te H
2, m
ole
frac
tion
0.0
0.2
0.4
0.6
0.8
1.0
(b) H2/N2 Separation
(a) Air Separation
0.10
0.50
0.50
0.10
0.80
0.80
0.190.19
0.520.52
0.770.77
Fig. 3.3: Variations of bulk permeate (y) and local permeate (y′) mole fraction along fibre length at different stage cuts (θ) under shell-side feed/countercurrent flow conditions for (a) air separation (Feng et al., 1999) with an active fibre length of 1.25 m, and (b) H2 separation (Zakaria, 2006).
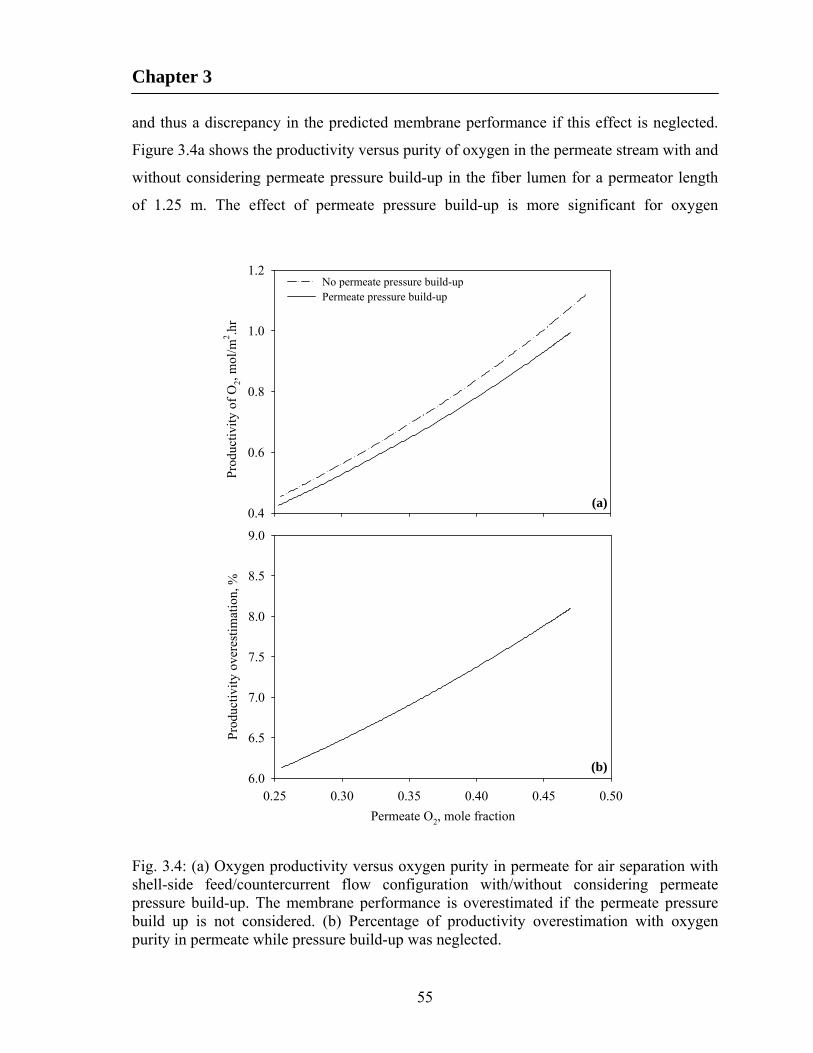
Chapter 3
55
and thus a discrepancy in the predicted membrane performance if this effect is neglected.
Figure 3.4a shows the productivity versus purity of oxygen in the permeate stream with and
without considering permeate pressure build-up in the fiber lumen for a permeator length
of 1.25 m. The effect of permeate pressure build-up is more significant for oxygen
P
rodu
ctiv
ity
of O
2, m
ol/m
2 .hr
0.4
0.6
0.8
1.0
1.2No permeate pressure build-upPermeate pressure build-up
Permeate O2, mole fraction
0.25 0.30 0.35 0.40 0.45 0.50
Pro
duct
ivit
y ov
eres
tim
atio
n, %
6.0
6.5
7.0
7.5
8.0
8.5
9.0
(a)
(b)
Fig. 3.4: (a) Oxygen productivity versus oxygen purity in permeate for air separation with shell-side feed/countercurrent flow configuration with/without considering permeate pressure build-up. The membrane performance is overestimated if the permeate pressure build up is not considered. (b) Percentage of productivity overestimation with oxygen purity in permeate while pressure build-up was neglected.
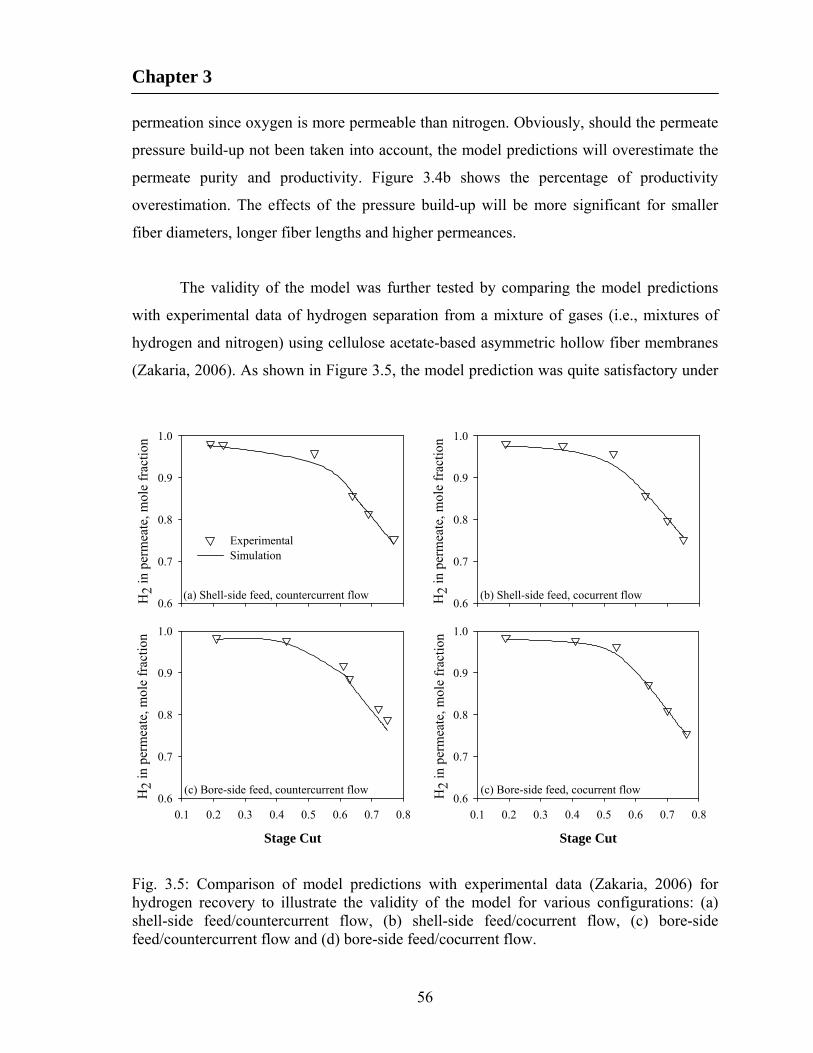
Chapter 3
56
permeation since oxygen is more permeable than nitrogen. Obviously, should the permeate
pressure build-up not been taken into account, the model predictions will overestimate the
permeate purity and productivity. Figure 3.4b shows the percentage of productivity
overestimation. The effects of the pressure build-up will be more significant for smaller
fiber diameters, longer fiber lengths and higher permeances.
The validity of the model was further tested by comparing the model predictions
with experimental data of hydrogen separation from a mixture of gases (i.e., mixtures of
hydrogen and nitrogen) using cellulose acetate-based asymmetric hollow fiber membranes
(Zakaria, 2006). As shown in Figure 3.5, the model prediction was quite satisfactory under
H2
in p
erm
eate
, mol
e fr
acti
on
0.6
0.7
0.8
0.9
1.0
ExperimentalSimulation
(a) Shell-side feed, countercurrent flow
Stage Cut
0.1 0.2 0.3 0.4 0.5 0.6 0.7 0.8
H2
in p
erm
eate
, mol
e fr
acti
on
0.6
0.7
0.8
0.9
1.0
H2
in p
erm
eate
, mol
e fr
acti
on
0.6
0.7
0.8
0.9
1.0
(b) Shell-side feed, cocurrent flow
(c) Bore-side feed, countercurrent flow
Stage Cut
0.1 0.2 0.3 0.4 0.5 0.6 0.7 0.8
H2
in p
erm
eate
, mol
e fr
acti
on
0.6
0.7
0.8
0.9
1.0
(c) Bore-side feed, cocurrent flow
Fig. 3.5: Comparison of model predictions with experimental data (Zakaria, 2006) for hydrogen recovery to illustrate the validity of the model for various configurations: (a) shell-side feed/countercurrent flow, (b) shell-side feed/cocurrent flow, (c) bore-side feed/countercurrent flow and (d) bore-side feed/cocurrent flow.
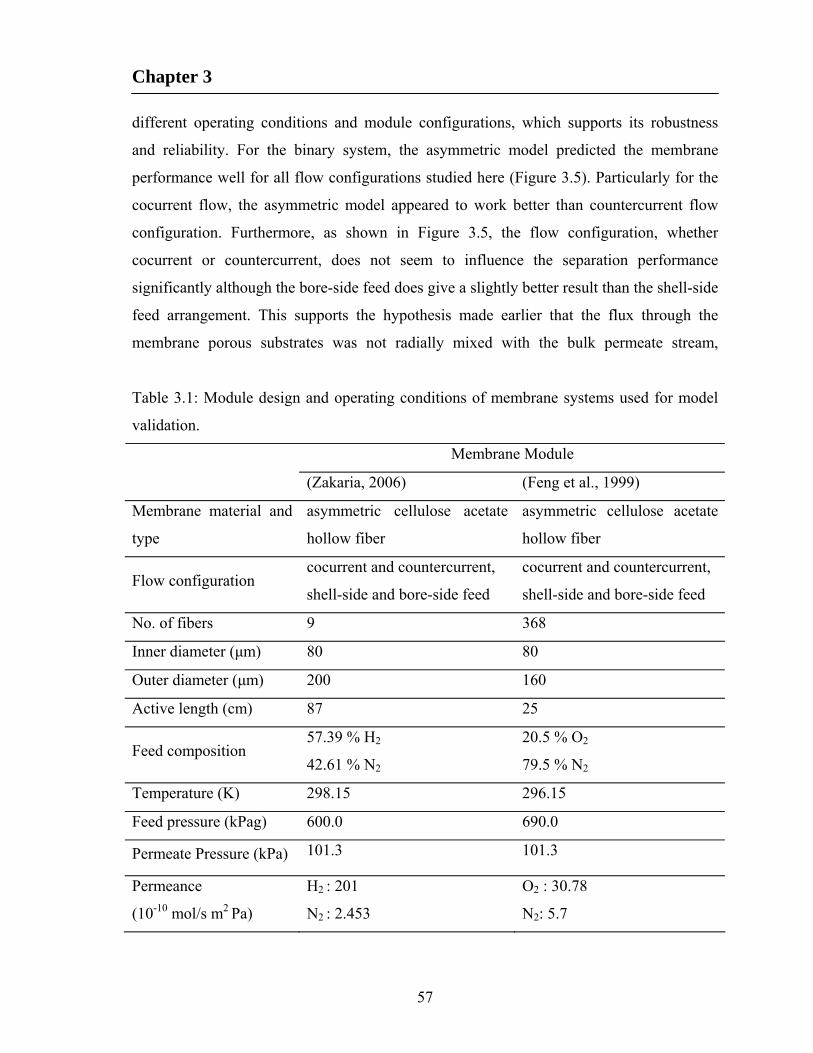
Chapter 3
57
different operating conditions and module configurations, which supports its robustness
and reliability. For the binary system, the asymmetric model predicted the membrane
performance well for all flow configurations studied here (Figure 3.5). Particularly for the
cocurrent flow, the asymmetric model appeared to work better than countercurrent flow
configuration. Furthermore, as shown in Figure 3.5, the flow configuration, whether
cocurrent or countercurrent, does not seem to influence the separation performance
significantly although the bore-side feed does give a slightly better result than the shell-side
feed arrangement. This supports the hypothesis made earlier that the flux through the
membrane porous substrates was not radially mixed with the bulk permeate stream,
Table 3.1: Module design and operating conditions of membrane systems used for model
validation.
Membrane Module
(Zakaria, 2006) (Feng et al., 1999)
Membrane material and
type
asymmetric cellulose acetate
hollow fiber
asymmetric cellulose acetate
hollow fiber
Flow configuration cocurrent and countercurrent,
shell-side and bore-side feed
cocurrent and countercurrent,
shell-side and bore-side feed
No. of fibers 9 368
Inner diameter (μm) 80 80
Outer diameter (μm) 200 160
Active length (cm) 87 25
Feed composition 57.39 % H2
42.61 % N2
20.5 % O2
79.5 % N2
Temperature (K) 298.15 296.15
Feed pressure (kPag) 600.0 690.0
Permeate Pressure (kPa) 101.3 101.3
Permeance
(10-10 mol/s m2 Pa)
H2 : 201
N2 : 2.453
O2 : 30.78
N2: 5.7
Chapter 3
58
resulting in a crossflow type of permeation behaviour. The module design and operating
parameters studied for the validation and comparison of the membrane systems are
summarized in Table 3.1.
3.5 Membranes air separation: Case studies
Table 3.2 lists the permeabilities and selectivities of some membrane materials as
well as the permeance of representative membranes used for air separation. High
oxygen/nitrogen selectivity is required for an economical nitrogen production process. The
effect of improved membrane selectivities on the efficiency of nitrogen production from air
has been assessed (Baker, 2004), and it was shown that even membranes with an
oxygen/nitrogen selectivity as low as 2 can still produce better than 99% nitrogen though at
very low recoveries. Currently, membrane nitrogen production is competitive with
alternative technologies, but it is much more difficult to produce high purity oxygen. Even
at the extremes of zero stage-cut and infinite pressure ratio, the best available membrane
(with an oxygen/nitrogen selectivity of 8) can only produce 68% oxygen. These constraints
limit membrane systems to the production of oxygen-enriched air in the 30 -50% oxygen
range.
As a case study, four representative hollow fiber membranes i.e.,
polydimethylsiloxane (PDMS, silicone rubber), cellulose acetate, polysulfone and
poly(ether block amide) (PEBA) were investigated here. The membranes were assumed to
have an asymmetric structure with an outer dense skin layer supported on a porous
substrate. The active fiber length for all types of membranes is 25 cm. The effective
membrane area for permeation is 1300 cm2 based on a nominal outside diameter of 450 μm
for all the membranes except cellulose acetate, which has membrane area of 462 cm2 based
on a 160 μm nominal outside diameter. Air is considered to contain 20.5 mol% O2 (balance
nitrogen). Other trace components (e.g., argon, neon, helium) in air were ignored for
simplification. The separation performance was investigated for three different feed
pressures: 345, 690 and 1035 kPa. Unless specified otherwise, the permeate stream exited
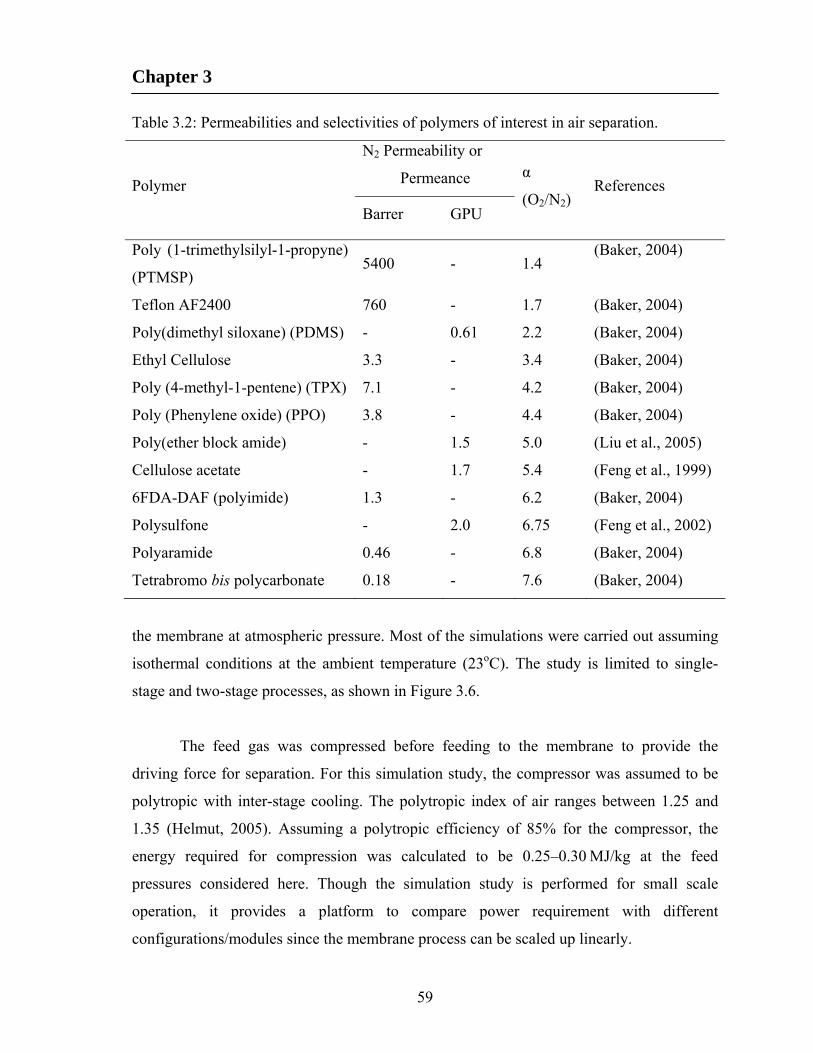
Chapter 3
59
Table 3.2: Permeabilities and selectivities of polymers of interest in air separation.
N2 Permeability or
Permeance Polymer
Barrer GPU
α
(O2/N2) References
Poly (1-trimethylsilyl-1-propyne)
(PTMSP) 5400 - 1.4
(Baker, 2004)
Teflon AF2400 760 - 1.7 (Baker, 2004)
Poly(dimethyl siloxane) (PDMS) - 0.61 2.2 (Baker, 2004)
Ethyl Cellulose 3.3 - 3.4 (Baker, 2004)
Poly (4-methyl-1-pentene) (TPX) 7.1 - 4.2 (Baker, 2004)
Poly (Phenylene oxide) (PPO) 3.8 - 4.4 (Baker, 2004)
Poly(ether block amide) - 1.5 5.0 (Liu et al., 2005)
Cellulose acetate - 1.7 5.4 (Feng et al., 1999)
6FDA-DAF (polyimide) 1.3 - 6.2 (Baker, 2004)
Polysulfone - 2.0 6.75 (Feng et al., 2002)
Polyaramide 0.46 - 6.8 (Baker, 2004)
Tetrabromo bis polycarbonate 0.18 - 7.6 (Baker, 2004)
the membrane at atmospheric pressure. Most of the simulations were carried out assuming
isothermal conditions at the ambient temperature (23oC). The study is limited to single-
stage and two-stage processes, as shown in Figure 3.6.
The feed gas was compressed before feeding to the membrane to provide the
driving force for separation. For this simulation study, the compressor was assumed to be
polytropic with inter-stage cooling. The polytropic index of air ranges between 1.25 and
1.35 (Helmut, 2005). Assuming a polytropic efficiency of 85% for the compressor, the
energy required for compression was calculated to be 0.25–0.30 MJ/kg at the feed
pressures considered here. Though the simulation study is performed for small scale
operation, it provides a platform to compare power requirement with different
configurations/modules since the membrane process can be scaled up linearly.
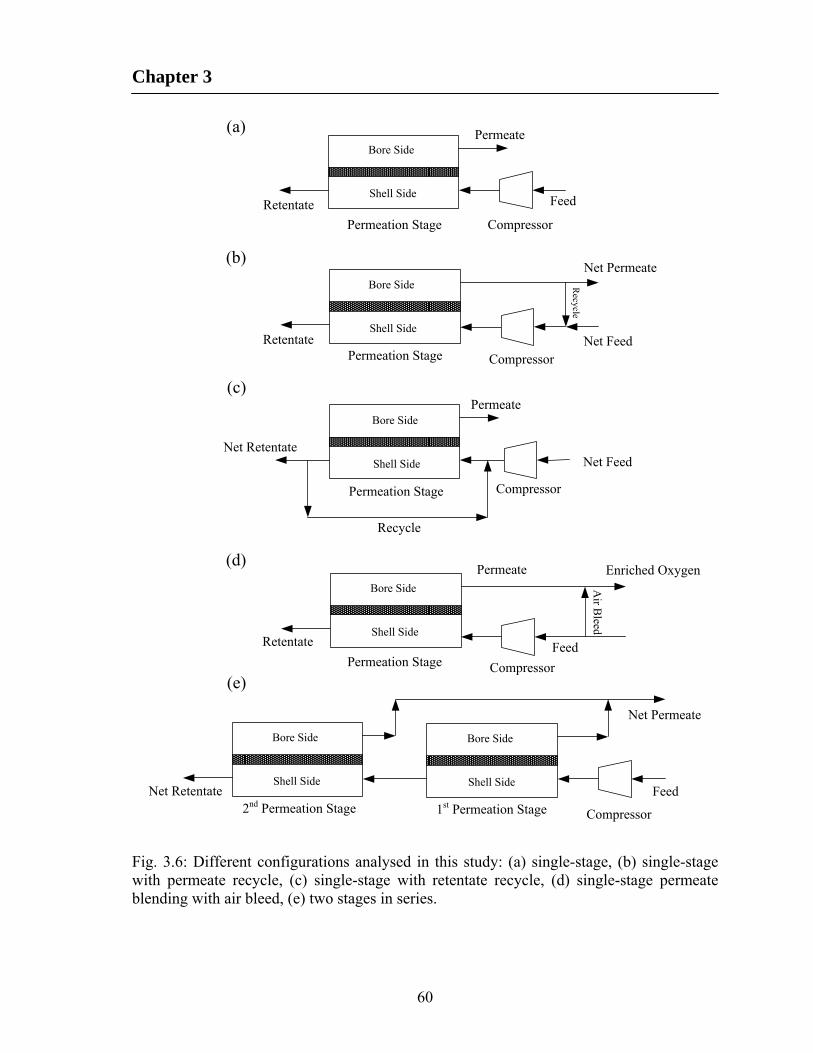
Chapter 3
60
Net Feed
Permeate
Net Retentate
Permeation Stage Compressor
Recycle
Shell Side
Bore Side
(c)
(d)
(e)
Permeation Stage Compressor
Shell Side
Bore Side
Feed
Permeate
Retentate
(a)
Net Feed
Net Permeate
RetentatePermeation Stage Compressor
Recycle
Shell Side
Bore Side
(b)
Permeation Stage Compressor
Shell Side
Bore Side
Feed
Permeate
Retentate
Enriched Oxygen
Air B
leed
1st Permeation Stage Compressor
Shell Side
Bore Side
Feed2nd Permeation Stage
Shell Side
Bore Side
Net Retentate
Net Permeate
Fig. 3.6: Different configurations analysed in this study: (a) single-stage, (b) single-stage with permeate recycle, (c) single-stage with retentate recycle, (d) single-stage permeate blending with air bleed, (e) two stages in series.

Chapter 3
61
3.5.1 Performance in single-stage without recycle
The pressure range used in the simulation study is 345-1035 kPa. Feng et al. (1999)
showed that the permeability of pure nitrogen remains constant over a pressure range of
100-1,000 kPa irrespective of shell-side feed or bore-side feed, while the oxygen
permeability in the bore-side feed mode has been found only slightly higher (< 3%) than in
the shell-side feed. Hence, the pure gas permeability and the permeability of the gas
component in a mixture are assumed to be the same.
In assessing the performance of a permeator, three issues are particularly important:
product purity, recovery and productivity. Here the product recovery is defined as the
fraction of nitrogen or oxygen in air recovered as product, and the productivity is defined
as the quantity of product in terms of equivalent pure nitrogen or oxygen generated per unit
membrane area per unit time. Figures 3.7a, b and c represent oxygen concentration in the
permeate stream as a function of stage cut for different feed pressures. Figures 3.7d, e and f
represent nitrogen concentration in the residue stream as a function of stage cut for
different feed pressures. Among the four membranes studied here, silicone rubber has the
least and polysulfone has the most oxygen to nitrogen selectivity. It is possible to produce a
permeate stream containing 50.2% oxygen at a stage cut of 0.2 from polysulfone permeator
at a feed pressure of 1035 kPa. Also, at the same stage cut, it is possible to produce a
permeate containing 47.5% oxygen at 690 kPa. An increase in feed pressure increases the
driving force for permeation and causes passage of a larger amount of gas through the
membrane. For a fixed feed pressure, a higher feed flow rate results in a reduction in stage
cut. It is apparent that the silicone rubber membrane shows the least improvement in
oxygen purity when the pressure is increased. At a stage cut of 0.2, increasing the feed
pressure from 690 to 1035 kPa will increase the oxygen concentration in the permeate from
31.2% to 32.1%. This is because silicone rubber has a considerably higher permeability
than others but is less selective. At higher stage cuts, a larger amount of gas is removed as
permeate, with a major portion being O2. As a result, the reject becomes highly enriched in
N2. In spite of this favourable behaviour for N2 enrichment, the N2 recovery in the reject
stream is generally low. At high stage cuts, it is possible to produce better than 99%

Chapter 3
62
nitrogen at considerably low feed pressures using cellulose acetate, polysulfone and poly
(ether block amide) membranes. At a stage cut of 0.9, the polysulfone membrane can
produce 99.2% and 99.9% nitrogen at 345 kPa and 690 kPa feed pressure, respectively,
Per
mea
te O
2, m
ole
frac
tion
0.2
0.3
0.4
0.5
0.6Cellulose AcetatePolysulfonePolyether Block AmideSillicone Rubber
Per
mea
te O
2, m
ole
frac
tion
0.2
0.3
0.4
0.5
0.6
Stage Cut0.0 0.2 0.4 0.6 0.8 1.0
Per
mea
te O
2, m
ole
frac
tion
0.2
0.3
0.4
0.5
0.6
Res
idue
N2,
mol
e fr
acti
on0.80
0.85
0.90
0.95
1.00
Res
idue
N2,
mol
e fr
acti
on
0.80
0.85
0.90
0.95
1.00
Stage Cut0.0 0.2 0.4 0.6 0.8 1.0
Res
idue
N2,
mol
e fr
acti
on
0.80
0.85
0.90
0.95
1.00
(a)
(b)
(c)
(d)
(e)
(f)
1035 kPa 1035 kPa
690 kPa 690 kPa
345 kPa 345 kPa
Fig 3.7: Concentrations of oxygen (a–c) and nitrogen (d–f) in permeate and residue, respectively, as a function of stage cut at different feed pressures (single-stage). Membrane configuration: shell side feed and counter-current flow.
Chapter 3
63
but, the rate of recovery for nitrogen is fairly low in these cases. At a moderately high
pressure, it is possible to produce 99.9% nitrogen with reasonably good recoveries (i.e., at
moderate stage cut), but the enhanced purity comes with additional cost for compression.
The trade-off relationship between recovery and concentration for oxygen
enrichment of air at different feed pressures is illustrated in Figures 3.8a, b and c. Similar
results are shown in Figures 3.8d, e and f for the trade-off relationship for nitrogen
production. For both oxygen enrichment and nitrogen production, increasing the product
purity always reduces the product recovery, and the reduction in the recovery becomes
more profound at higher product purities. Figure 3.9 represents the productivity of oxygen
in permeate and the productivity of nitrogen in residue, respectively, as a function of the
product concentration. It is obvious that while the productivity of nitrogen decreases with
an increase in its purity, the opposite appears to be true for oxygen enrichment, which
asserts again the trade-off relationship between product recovery and purity. A high
recovery or a high purity can be obtained in the membrane processes, but not at the same
time. For a required purity, a higher recovery rate accounts for lower specific energy
consumption, which is often the major operating cost. Therefore, it is essential to optimize
the operating conditions of a given membrane system in order for the separation potential
of the membrane to be maximized. It is apparent from Figures 3.8 and 3.9 that for a given
product purity, increasing the feed pressure increases the product recovery and
productivity.
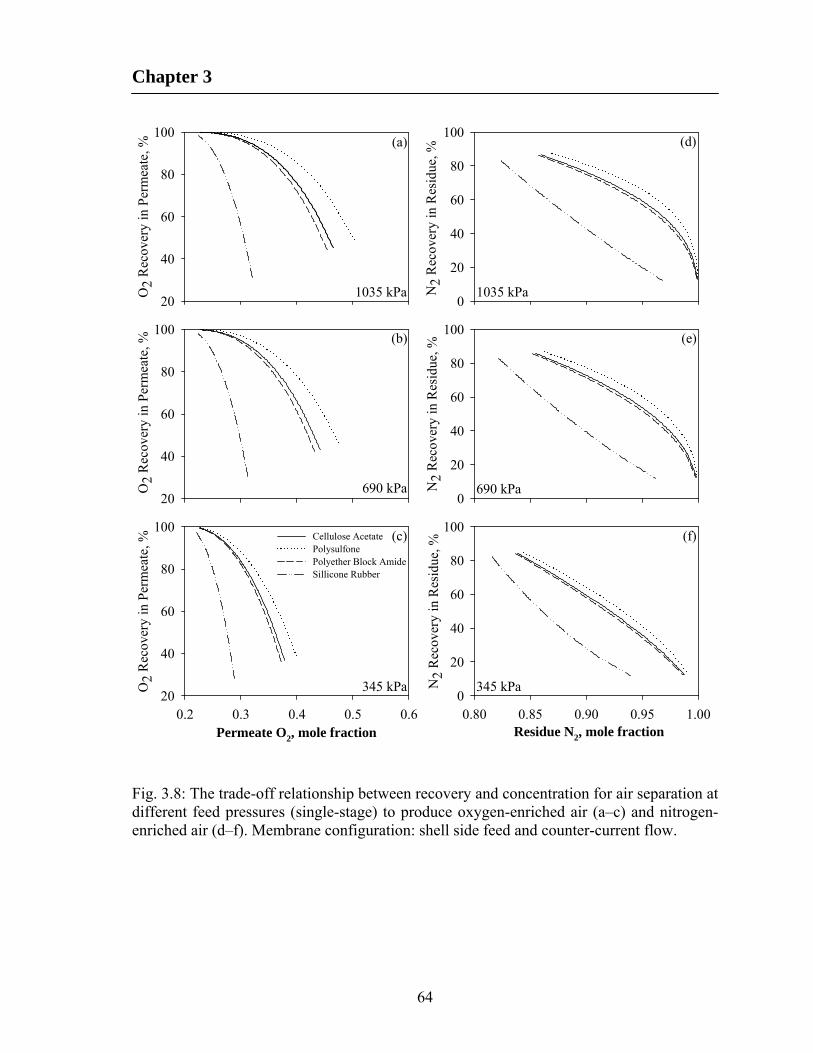
Chapter 3
64
Residue N2, mole fraction0.80 0.85 0.90 0.95 1.00
N2
Rec
over
y in
Res
idue
, %
0
20
40
60
80
100
Permeate O2, mole fraction0.2 0.3 0.4 0.5 0.6
O2
Rec
over
y in
Per
mea
te, %
20
40
60
80
100Cellulose AcetatePolysulfonePolyether Block AmideSillicone Rubber
2D Graph 2
O2
Rec
over
y in
Per
mea
te, %
20
40
60
80
100
O2
Rec
over
y in
Per
mea
te, %
20
40
60
80
100
N2
Rec
over
y in
Res
idue
, %
0
20
40
60
80
100
N2
Rec
over
y in
Res
idue
, %
0
20
40
60
80
100
(a)
(b)
(c)
(d)
(e)
(f)
1035 kPa 1035 kPa
690 kPa 690 kPa
345 kPa 345 kPa
Fig. 3.8: The trade-off relationship between recovery and concentration for air separation at different feed pressures (single-stage) to produce oxygen-enriched air (a–c) and nitrogen-enriched air (d–f). Membrane configuration: shell side feed and counter-current flow.

Chapter 3
65
O2
Pro
duct
ivit
y, m
ol/m
2 .hr
0.0
0.5
1.0
1.5
2.0
2.5O
2 P
rodu
ctiv
ity,
mol
/m2 .h
r
0.0
0.5
1.0
1.5
Permeate O2, mole fraction0.2 0.3 0.4 0.5 0.6
O2
Pro
duct
ivit
y, m
ol/m
2 .hr
0.0
0.1
0.2
0.3
0.4
0.5
Cellulose AcetatePolysulfonePolyether Block AmideSillicone Rubber
N2
Pro
duct
ivit
y, m
ol/m
2 .hr
0
3
6
9
12
15
N2
Pro
duct
ivit
y, m
ol/m
2 .hr
0
2
4
6
8
10
Residue N2, mole fraction0.80 0.85 0.90 0.95 1.00
N2
Pro
duct
ivit
y, m
ol/m
2 .hr
0
1
2
3
4
(a)
(b)
(c)
(d)
(e)
(f)
1035 kPa 1035 kPa
690 kPa 690 kPa
345 kPa 345 kPa
Fig. 3.9: Productivity versus product concentration for air separation (single-stage) to produce oxygen-enriched air (a–c) and nitrogen-enriched air (d–f). Membrane configuration: shell side feed and counter-current flow.
3.5.2 Single-stage with permeate recycle to feed stream
Membrane processes are currently considered to be economical and convenient
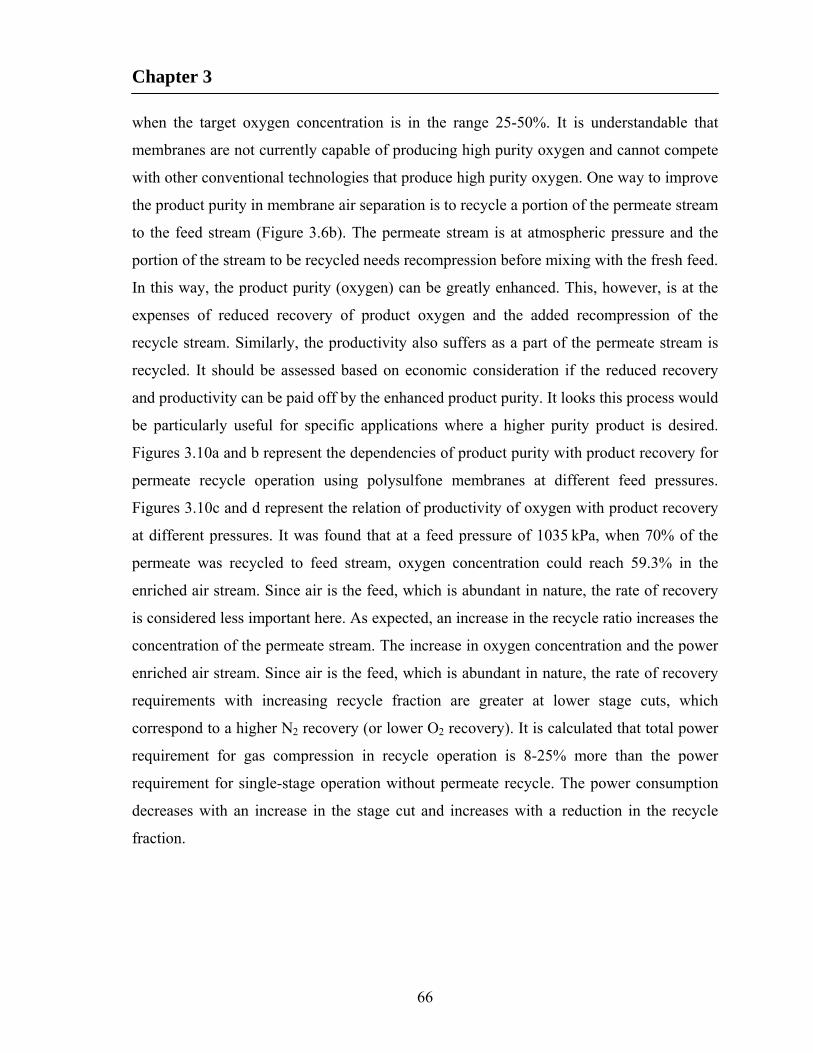
Chapter 3
66
when the target oxygen concentration is in the range 25-50%. It is understandable that
membranes are not currently capable of producing high purity oxygen and cannot compete
with other conventional technologies that produce high purity oxygen. One way to improve
the product purity in membrane air separation is to recycle a portion of the permeate stream
to the feed stream (Figure 3.6b). The permeate stream is at atmospheric pressure and the
portion of the stream to be recycled needs recompression before mixing with the fresh feed.
In this way, the product purity (oxygen) can be greatly enhanced. This, however, is at the
expenses of reduced recovery of product oxygen and the added recompression of the
recycle stream. Similarly, the productivity also suffers as a part of the permeate stream is
recycled. It should be assessed based on economic consideration if the reduced recovery
and productivity can be paid off by the enhanced product purity. It looks this process would
be particularly useful for specific applications where a higher purity product is desired.
Figures 3.10a and b represent the dependencies of product purity with product recovery for
permeate recycle operation using polysulfone membranes at different feed pressures.
Figures 3.10c and d represent the relation of productivity of oxygen with product recovery
at different pressures. It was found that at a feed pressure of 1035 kPa, when 70% of the
permeate was recycled to feed stream, oxygen concentration could reach 59.3% in the
enriched air stream. Since air is the feed, which is abundant in nature, the rate of recovery
is considered less important here. As expected, an increase in the recycle ratio increases the
concentration of the permeate stream. The increase in oxygen concentration and the power
enriched air stream. Since air is the feed, which is abundant in nature, the rate of recovery
requirements with increasing recycle fraction are greater at lower stage cuts, which
correspond to a higher N2 recovery (or lower O2 recovery). It is calculated that total power
requirement for gas compression in recycle operation is 8-25% more than the power
requirement for single-stage operation without permeate recycle. The power consumption
decreases with an increase in the stage cut and increases with a reduction in the recycle
fraction.
Chapter 3
67
Per
mea
te O
2, m
ole
frac
tion
0.2
0.3
0.4
0.5
0.6
Single Stage30% Permeate Recycle50% Permeate Recycle70% Permeate Recycle
O2 Recovery, %10 20 30 40 50 60 70 80 90 100
Per
mea
te O
2, m
ole
frac
tion
0.2
0.3
0.4
0.5
0.6
Pro
duct
ivit
y of
O2,
mol
/m2 .h
r
0.5
1.0
1.5
2.0
O2 Recovery, %10 20 30 40 50 60 70 80 90 100
Pro
duct
ivit
y of
O2,
mol
/m2 .h
r
0.2
0.4
0.6
0.8
1.0
1.2
(a)
(b)
(c)
(d)
1035 kPa 1035 kPa
690 kPa 690 kPa
Fig. 3.10: Oxygen concentration (a and b) and productivity (c and d) versus recovery for single-stage operation with permeate recycle using polysulfone membrane at different pressures (690 and 1035 kPa). For comparison, single stage without permeate recycle is also shown (solid line). Membrane configuration: shell side feed and counter-current flow.
3.5.3 Single-stage with retentate recycle to feed stream
Retentate recycle (Figure 3.6c) is sometimes useful if the residue stream is the
desired product. The retentate recycle will be especially effective for the system in which
the feed gas is relatively cheap and the product (the retentate) is relatively valuable. It
should be noted that the retentate recycle stream does not require significant recompression
as the retentate pressure is essentially the same as feed pressure, which is advantageous
over the aforementioned permeate recycle that involves additional capital and energy costs
due to recompression. It may be conceived that when the feed is blended with a portion of
the retentate stream which is enriched with the low permeable component, both the purity

Chapter 3
68
and recovery of the low permeable component in the retentate stream will be enhanced. As
in the case of He/N2 or H2/N2 separation systems where the membrane selectivity is
relatively large, the retentate recycle may be effective for enrichment of the less permeable
component in the retentate stream. However, in case of air separation where the membrane
selectivity is rather low, the retentate recycle does not lead to a considerable improvement
in the separation performance, as shown in Figure 3.11. It is apparent from Figure 3.11a
and b that only a slight improvement in the recovery is obtained at a low stage cut with a
low fraction of retentate recycle. At a feed pressure of 1035 kPa, the recovery of N2
increases from 87.4% to 88.4% when 2% of the retentate stream is recycled to the feed
stream, but there is little improvement in the nitrogen purity in the retentate. A marginal
N2
Rec
over
y in
Res
idue
, %
0
20
40
60
80
100
No Recycle2% Retentate Recycle10% Retentate Recycle
Residue N2, mole fraction
0.85 0.90 0.95 1.00
N2
Rec
over
y in
Res
idue
, %
0
20
40
60
80
100
N2
Pro
duct
ivit
y, (
mol
/m2 .h
r)
0
4
8
12
16
Residue N2, mole fraction
0.85 0.90 0.95 1.00
N2
Pro
duct
ivit
y, (
mol
/m2 .h
r)
0
4
8
12
16
690 kPa 690 kPa
1035 kPa 1035 kPa
(a)
(b) (d)
(c)
Fig. 3.11: Nitrogen recovery and productivity versus purity for single-stage operation with retentate recycle using polysulfone membrane at different pressures (a and c) 690 kPa (b and d) 1035 kPa. Membrane configuration: shell side feed and counter-current flow.
Chapter 3
69
improvement in nitrogen recovery can be obtained by recycling 10% of the retentate to the
feed, but no improvement is noticeable above 10% of the retentate recycling. This is due to
the fact that a higher recycle ratio will eventually lower the concentration of the more
permeable component on the feed side of the membrane, making it slower to permeate
through the membrane. The concentration of nitrogen in the retentate decreases with the
retentate recycle because the processing capacity of the module is increased. As a result,
the separation does not improve especially when a high purity retentate is the target
product. It was also observed that the retentate recycle requires a higher feed flow rate than
the feed flow rate without recycle in order to produce the same amount of product, which
eventually increases the total compressor load. As shown in Figure 3.11c and d, the turn
results in low stage cuts. The productivity of N2 decreases as the recycle ratio increases.
Hence, there is in principle an optimum recycle ratio with respect to the productivity of N2
increases at low recycle ratios due to higher feed flow rates which in turn results in low
stage cuts. The productivity of N2 decreases as the recycle ratio increases. Hence, there is
in principle an optimum recycle ratio with respect to the concentration of nitrogen in the
retentate, but since this configuration offers no significant practical benefits for air
separation to produce nitrogen, the retentate recycle to feed stream has rarely been
discussed in the literature.
3.5.4 Single-stage with permeate blending with a portion of feed
In some applications where the permeate stream is the desired product and a
moderate product purity is required, the membrane area requirement may be reduced
through the use of feed gas bypass (Kimura and Browall, 1986). It is equivalent to mixing a
portion of the feed with the permeate whose concentration is higher than the target product
concentration. Figure 3.6d illustrates such a design. Consider production of a 30% oxygen
enriched air by mixing air with the permeate containing ~40% oxygen. Figure 3.12
represents the productivity of oxygen as a function of permeate oxygen concentration at
different feed pressures using the polysulfone membrane with and without air bleed. It is
clear that the productivity rises if a 40% oxygen permeate is blended with air (20.5%

Chapter 3
70
0
1
2
3
4
0.25 0.30 0.35 0.40 0.45 0.50 0.55
Permeate O2 mole fraction from single stage
Pro
du
ctiv
ity
of O
2, (
mol
/m2 .h
r)345 kPa690 kPa1035 kPa345 kPa (Air Bleed) 690 kPa (Air Bleed)1035 kPa (Air Bleed)
Fig. 3.12: Productivity of oxygen as a function of permeate oxygen concentration at different pressures using polysulfone membrane with and without air blending. Membrane configuration: shell side feed and counter-current flow.
oxygen) to get 30% oxygen enriched air. This means less membrane area is required for a
target purity, which represents savings in the capital costs. Furthermore, the energy
requirement is less since a portion of the final product comes directly from the feed air. It,
however, should be mentioned that although permeate blending is simple in operation, but
it may not be advantageous unless a considerably low purity of the product is required.
Rice (2007) disclosed a similar process design based on blending the permeate with a
portion of the feed to reduce membrane area requirement.
The use of membranes to produce moderate oxygen enriched air is a potential
approach for industries using oxygen enriched air (e.g., combustion, personal oxygen
generation bars). As the cost of fuel, particularly natural gas, increases, the use of oxygen-
enriched air for combustion as a means of reducing fuel consumption in certain industrial
combustion applications becomes increasingly attractive. It has been reported that the fuel
consumption for furnaces can be reduced by 13% if oxygen enriched air containing 30%
Chapter 3
71
oxygen is used (Kimura and Browall, 1986). The use of oxygen enriched air results in
higher flame temperatures and reduces the volume of parasite nitrogen that will be heated
with the latent heat being lost in the vent.
3.5.5 Two permeators in series
When a single-stage operation is unsatisfactory in terms of product purity or
recovery, multistaging (as illustrated in Figure 3.6e) is an attractive approach. In fact, many
industrial processes use multi-stage operations. Since the residue from the first stage is
already at a high pressure, recompression of this stream prior to feeding to the second stage
is not required. Moreover, splitting a long module into two stages can reduce the pressure
build-up in the fibre bores as the permeate is removed from both stages. In the two
modules-in series design, the stage cuts for both stages can be varied to obtain the intended
purity of the product stream. Figure 3.13 illustrates the productivity and recovery of
nitrogen from the two modules in series design as a function of product nitrogen
concentration using a polysulfone membrane; for the purpose of comparison, the single
stage performance with the same total membrane area is also presented in Figure 3.13. It is
apparent from the data in Figure 3.13 that the overall performance of the two modules-in-
series operation is much better than the single stage operation in terms of productivity and
recovery of the nitrogen product at a given nitrogen purity. At a feed pressure of 1035 kPa,
the productivity of the two modules-in-series operation is 18% more than the productivity
of the single stage operation for the production of 95% nitrogen purity. The improvements
in both the productivity and recovery become more significant when a higher purity of
nitrogen in the residue stream is needed, as shown more clearly in Figure 3.14 which shows
the percentage increases in productivity and recovery at a given nitrogen purity as
compared to a single-stage operation. It becomes clear that the two modules-in-series
operation is especially advantageous when a high purity of nitrogen is required. In addition,
by using the two-stage operation, one may also take advantage of the differences in the
permeate oxygen compositions coming from each stage because the permeate stream from
the first stage will be more enriched in oxygen as compared to the oxygen concentration
that would be produced in a single stage operation. A comparison of feed compression and

Chapter 3
72
permeate vacuum operation has been provided in Appendix A for reference.
N2
Pro
duct
ivit
y, m
ol/m
2 .hr
0
2
4
6
8
10Single stageTwo stages in series
N2 Purity, mol fraction
0.88 0.90 0.92 0.94 0.96 0.98 1.00
N2
Rec
over
y, %
10
20
30
40
50
60
70
80
90
(a)
(b)
690 kPa
1035 kPa
690 kPa
1035 kPa
Fig. 3.13: A comparison of two modules in series with a single stage operation in terms of productivity (a) and recovery (b) for nitrogen production as a function of nitrogen purity. Membrane configuration: shell side feed and counter-current flow.
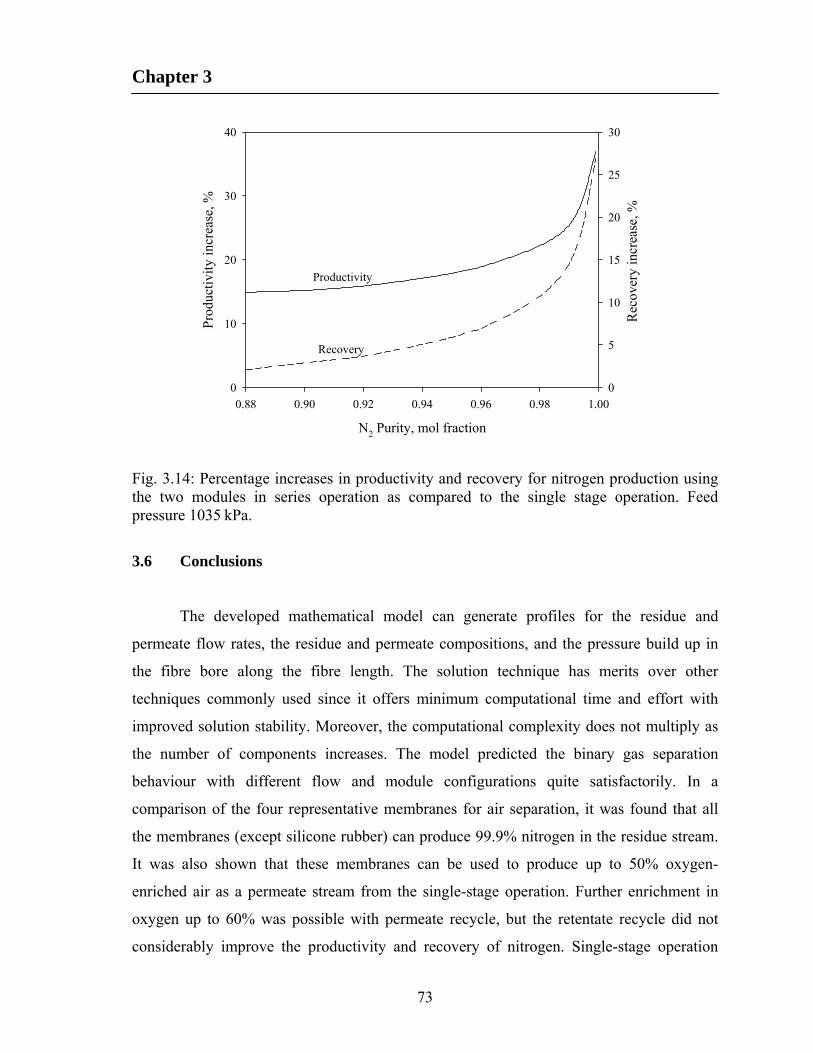
Chapter 3
73
N2 Purity, mol fraction
0.88 0.90 0.92 0.94 0.96 0.98 1.00
Rec
over
y in
crea
se, %
0
5
10
15
20
25
30
Pro
duct
ivit
y in
crea
se, %
0
10
20
30
40
Productivity
Recovery
Fig. 3.14: Percentage increases in productivity and recovery for nitrogen production using the two modules in series operation as compared to the single stage operation. Feed pressure 1035 kPa.
3.6 Conclusions
The developed mathematical model can generate profiles for the residue and
permeate flow rates, the residue and permeate compositions, and the pressure build up in
the fibre bore along the fibre length. The solution technique has merits over other
techniques commonly used since it offers minimum computational time and effort with
improved solution stability. Moreover, the computational complexity does not multiply as
the number of components increases. The model predicted the binary gas separation
behaviour with different flow and module configurations quite satisfactorily. In a
comparison of the four representative membranes for air separation, it was found that all
the membranes (except silicone rubber) can produce 99.9% nitrogen in the residue stream.
It was also shown that these membranes can be used to produce up to 50% oxygen-
enriched air as a permeate stream from the single-stage operation. Further enrichment in
oxygen up to 60% was possible with permeate recycle, but the retentate recycle did not
considerably improve the productivity and recovery of nitrogen. Single-stage operation

Chapter 3
74
with permeate blending with air can be used to increase productivity of oxygen-enriched
air for applications requiring only moderate enrichment (e.g. 30% concentration). Two
modules in series can be used to enhance the overall performance for nitrogen production,
especially when a high concentration of the nitrogen is needed.

Chapter 4
75
Modeling of multicomponent gas separation with asymmetric hollow
fiber membranes - methane enrichment from biogas†
4.1 Introduction
Membrane separation is favourable over other separation technologies due to its
simplicity in operation, small size, ease in maintenance, energy efficiency, and reliable
performance. These endearing characteristics make membrane technology very competent
to penetrate a wide variety of applications. Although most membrane separation studies
deal with binary gas mixtures, many applications of industrial importance involve
multicomponent gas mixtures (i.e., recovery of helium from natural gas or deep sea diving
gas, separation of H2 from a reformed natural gas or other producer gases containing
substantial amounts of CO2 and N2, recovery of H2 from ammonia synthesis purge stream,
and CO2 removal from flue gas). Membranes are a key component in membrane gas
separation; and the overall membrane module design and finding optimal operating
conditions also play a significant role in successful application of the membrane processes.
The prediction of the separation performance and the evaluation of the membrane
processes are deemed important for new process designs and modification of existing
designs.
Gas permeation model developed by Pan (1986) is the most practical representation
of multicomponent gas separation in high-flux asymmetric hollow fiber membranes. Using
the residue concentration as an independent variable, the permeate concentration, pressure
and the fiber length required can be calculated. However, most commercial membrane
modules have a pre-determined length of fibers, and in such cases the solution technique
has considerable numerical difficulties since the fiber length is a computed variable.
Moreover, the calculation procedure of iterative shooting method involves significant
computational time and effort. To overcome mathematical complexities involved, different
modifications and approaches of solving the model equations have been proposed (Coker et
† Part of Chapter 4 has been published in Can. J. Chem. Eng.; cited as Kundu et al. (2012b)

Chapter 4
76
al., 1998; Jiang and Kumar, 2008; Kaldis et al., 2000; Kovvali et al., 1994; Makaruk and
Harasek, 2009; Marriott et al., 2001; Marriott and Sørensen, 2003; Peer et al., 2008).
Kovvali et al. (1994) used a linear approximation to represent the feed and permeate
compositions at certain intervals along the fiber length, and the solution accuracy thus
entirely depends on the number of intervals along the fiber. Coker et al. (1998) proposed a
stage-wise approach (100-1000 stages) to convert the differential equations to a set of
coupled, non-linear ordinary differential equations. This method requires initial guess of
the component flow rates on each stage, and the solution is approximated using the first
order finite difference method with an iteration of derived tri-diagonal matrices. Sidhoum
et al. (1988) developed a model where initial estimates of dependent variables were
generated based on cocurrent or crossflow while neglecting pressure build up in the fiber
bore. It turns out that the model fit symmetric membranes better than high-flux asymmetric
membranes. Kaldis et al. (2000) developed a model based on Pan’s (1986) original
formulation. To minimize solution complexity, the concentration of the permeate leaving
the membrane surface was assumed to be identical to that of the bulk permeate stream.
Such a treatment does not appear to be suitable to high-flux asymmetric membranes where
the microporous substrate prevents local permeate mixing. The model developed by
Sengupta and Sirkar (1987) was limited to only three-component mixtures and its extension
to a higher number of components would require considerable calculation effort and time.
Marriott et al. (2001), and Marriott and Sørensen (2003) developed a mathematical model
for multicomponent gas separation, which requires prior knowledge of diffusion and
dispersion coefficients in the fluid phase, and mass transfer coefficient in the porous
substrate. These parameters are unfortunately not readily available and the structure of
asymmetric membranes can hardly be described accurately. Chowdhury et al. (2005)
developed a mathematical model based on Pan’s (1986) formulation and the numerical
solution was formulated as an initial value problem. However, the overall material balance
for cocurrent flow was used as an approximation for that of countercurrent flow for easy
incorporation into AspenPlus. Cruz et al. (2005) developed a numerical algorithm for the
solution of permeation problems using different discretization techniques, in the context of
finite volume formulation. Makaruk and Harasek (2009) developed a model for

Chapter 4
77
multicomponent permeation based on the finite difference Gauß-Seidel method, and the
solution was stabilised by adapting a relaxation factor in case of difficulties with
convergence. Katoh et al. (2011) utilized a tanks-in-series model to take into account non-
ideal mixing flows, and applied relaxation method as a stable computational technique to
solve the governing differential equations.
In this study, a mathematical model for high-flux, asymmetric hollow fiber
membrane was developed, which is based on Pan’s (1986) original formulation but the
governing equations were simplified following the approach of Sengupta and Sirkar
(1995). The model takes into account of “cross flow” of local permeate with respect to the
membrane skin, irrespective of the flow direction of the bulk permeate stream outside the
porous substrate. The permeate pressure build up inside the fiber bore was taken into
account in the model as well. The solution technique was applied to different flow and
module configurations (i.e., cocurrent and countercurrent, shell-side feed and bore-side
feed), and found very efficient for the solution of multicomponent systems. The model
predictions were validated with experimental results, and its robustness was demonstrated.
The model and solution technique were applied to investigate dynamic performance of
several membrane module configurations for methane recovery and enrichment from
biogas, considering biogas as a mixture of CO2, N2 and CH4. Several recycle operations
including continuous membrane column and optimum recycle ratio vital for these
operations were studied. Methane recovery from biogas represents not only an opportunity
for greenhouse gas emission reduction; the methane recovered is also an energy source.
Meanwhile, when methane is recovered, CO2 is concentrated in the remaining gas stream,
which also helps facilitate subsequent carbon capture for greenhouse gas reduction. A great
deal of work can be found in open literature about methane separation from biogas using
different technologies (Cavenati et al., 2005; Favre et al., 2009b; Knaebel and Reinhold,
2003; Rautenbach and Welsch, 1993; Tsuru and Hwang, 1994). Most of the studies
considered biogas as a binary mixture of CO2 and CH4, which would appear to be an easy
separation. However, the difficulties to separate methane from nitrogen by either
membranes or pressure swing adsorption are an important technical issue for practical

Chapter 4
78
applications. Therefore, the limitations that N2 poses on the separation of CH4 from biogas
using membrane technology were also investigated in this study.
4.2 Mathematical modeling for simulation of asymmetric hollow fiber membranes
Consider the separation of multicomponent mixture containing n species using an
asymmetric membrane, where mass balances for individual components have to be
addressed. Unlike a binary system where a single selectivity term is needed (Kundu et al.,
2012a), a reference component needs to be specified with respect to which the selectivities
of the other components in the multicomponent system can be defined. The choice of the
reference component depends on the system, and it may be the slowest permeating
component in the mixture so that the selectivity values for other components will be greater
than 1. For the mathematical formulation, the following main assumptions are made:
The porous sub layer has negligible resistance to gas flow, and diffusion along the pore
path is insignificant due to high permeation flux.
There is no local mixing of permeate inside the porous sub layer of the membrane.
The local concentration of the permeate leaving the membrane surface is determined by
the relative permeation rates of the component at that point.
The deformation of the hollow fiber under pressure is negligible.
Permeance of each species is independent of gas pressure and concentration.
Pressure drop on the shell-side of the module is negligible. Pressure drop inside the
fiber lumen can be described by the Hagen-Poiseuille equation, i.e., the flow is laminar.
The simplification of the model equations for all the module configurations was
made in a similar way, but only the shell-side feed countercurrent flow configuration
(Figure 4.1a) is described here for brevity. The basis for the model is mass balance over a
differential element of the hollow fiber length. For permeation of a mixture comprising n
components (one of which is designated as the reference component), the material balance
for the ith component gives
nidzyVdyxKdzxUd iiiii ,...... 3 , 2 , 1for , 1 (4.1)
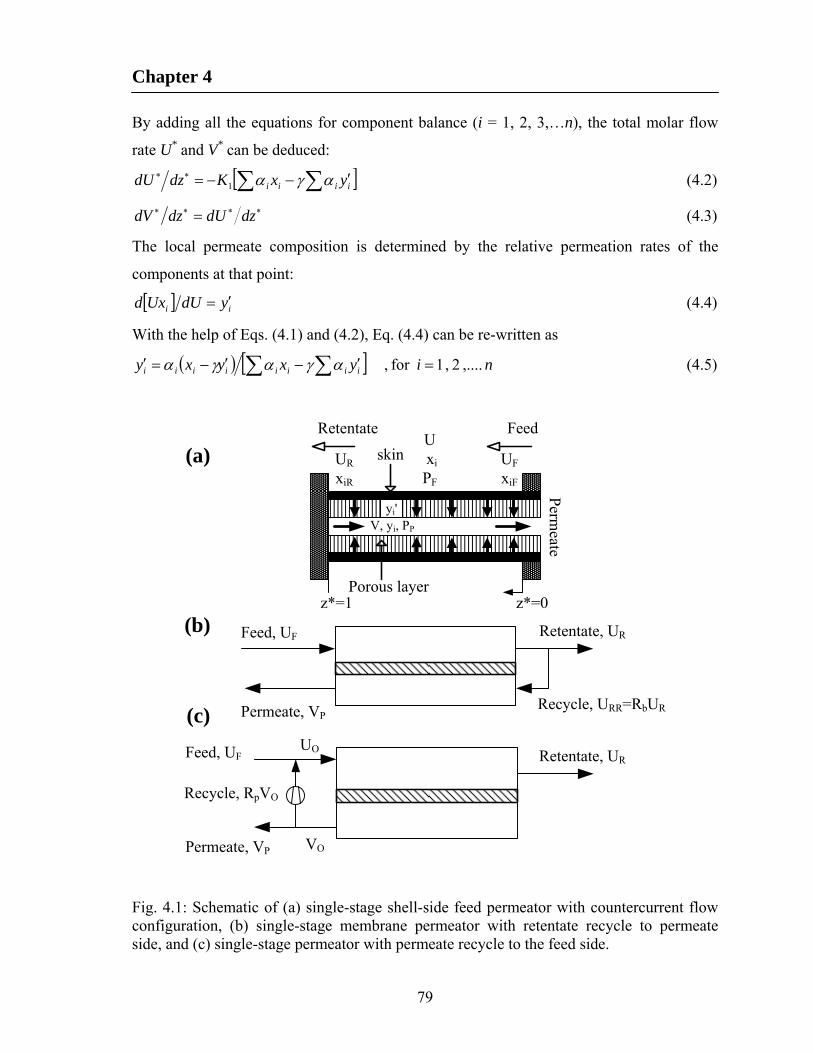
Chapter 4
79
By adding all the equations for component balance (i = 1, 2, 3,…n), the total molar flow
rate U* and V* can be deduced:
iiii yxKdzdU 1 (4.2)
dzdUdzdV (4.3)
The local permeate composition is determined by the relative permeation rates of the
components at that point:
ii ydUUxd (4.4)
With the help of Eqs. (4.1) and (4.2), Eq. (4.4) can be re-written as
niyxyxy iiiiiiii ,.... 2 , 1for , (4.5)
Retentate, URFeed, UF
Permeate, VPRecycle, URR=RbUR
(b)
Feed, UF Retentate, UR
Permeate, VP
Recycle, RpVO
VO
UO
(c)
Perm
eate
FeedRetentate
z*=0z*=1
Uxi
PF
yi'V, yi, PP
UF
xiF
UR
xiR
skin
Porous layer
(a)
Fig. 4.1: Schematic of (a) single-stage shell-side feed permeator with countercurrent flow configuration, (b) single-stage membrane permeator with retentate recycle to permeate side, and (c) single-stage permeator with permeate recycle to the feed side.
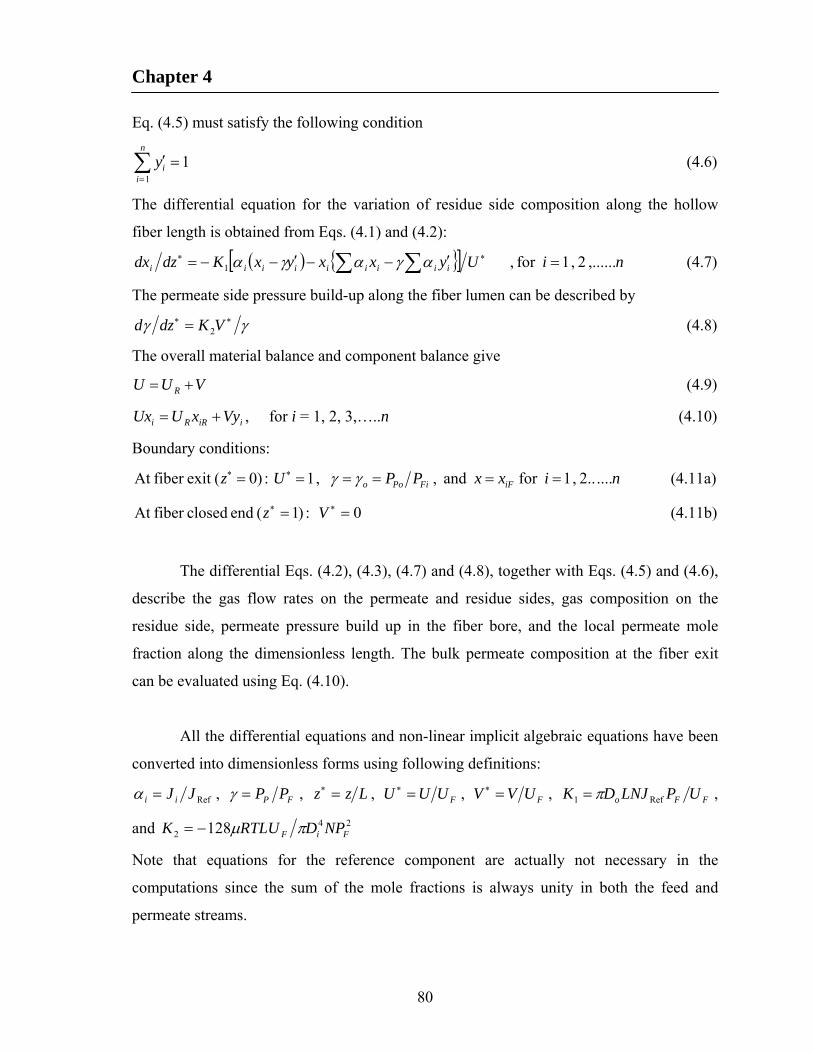
Chapter 4
80
Eq. (4.5) must satisfy the following condition
11
n
iiy (4.6)
The differential equation for the variation of residue side composition along the hollow
fiber length is obtained from Eqs. (4.1) and (4.2):
niUyxxyxKdzdx iiiiiiiii ,...... 2 , 1for , 1 (4.7)
The permeate side pressure build-up along the fiber lumen can be described by
VKdzd 2 (4.8)
The overall material balance and component balance give
VUU R (4.9)
iiRRi VyxUUx , for i = 1, 2, 3,…..n (4.10)
Boundary conditions:
.... ..2 , 1for and , , 1 : )0(exit fiber At nixxPPUz iFFiPoo (4.11a)
0 : )1( end closedfiber At Vz (4.11b)
The differential Eqs. (4.2), (4.3), (4.7) and (4.8), together with Eqs. (4.5) and (4.6),
describe the gas flow rates on the permeate and residue sides, gas composition on the
residue side, permeate pressure build up in the fiber bore, and the local permeate mole
fraction along the dimensionless length. The bulk permeate composition at the fiber exit
can be evaluated using Eq. (4.10).
All the differential equations and non-linear implicit algebraic equations have been
converted into dimensionless forms using following definitions:
RefJJii , FP PP , Lzz , FUUU , FUVV , FFo UPLNJDK Ref1 ,
and 242 128 FiF NPDRTLUK
Note that equations for the reference component are actually not necessary in the
computations since the sum of the mole fractions is always unity in both the feed and
permeate streams.
Chapter 4
81
4.3 Numerical technique of the proposed model
The numerical technique presented here does not require initial estimates of the
pressure, flow or concentration profiles inside the hollow fiber as does in the original Pan’s
approach. The system of ODE (Eqs. 4.2, 4.3, 4.7-4.8) was solved using Gear’s method
(DIVPAG subroutine in the IMSL library). The set of non-linear algebraic equations (Eq. 4.5)
was solved simultaneously until Eq. (4.6) is satisfied. The system of non-linear implicit algebraic
equations for local permeate concentrations were solved using the modified Powell hybrid
algorithm and a finite difference approximation of the jacobian (DNEQNF subroutine in
the IMSL library), which is a variation of Newton’s method. Newton’s method is more
sophisticated and elegant numerical techniques and can establish an inherently more stable
solution methodology (Coker et al., 1999). Through this procedure, the computation was
formulated as an IVP inspite of the boundary value nature of the problem. The system of
ODE could also be solved by MATLAB bvp4c solver as a BVP, which was found to be
especially effective for retentate recycle in continuous membrane columns. The advantage of the
present technique is that bvp4c is not a shooting method, rather it is based on collocation
technique. It is well known that a significant difficulty with the shooting method is that the
solution of a BVP can be insensitive to changes in the boundary values, even for a perfectly
nice BVP, while the solutions to IVPs of shooting are sensitive to changes in the initial
values (Shampine et al., 2003). The numerical technique presented here permits easy
evaluation of membrane performance with minimum computational time and effort.
4.4 Validation of the proposed model and simulation scheme
Experimental data reported in the literature was used to validate the model and
solution technique. Sada et al. (1992) reported a multicomponent gas separation (separation
of CO2 from mixtures of CO2, N2 and O2) by an asymmetric cellulose-triacetate based
hollow fiber membrane. The experimental data was compared with the model calculations,
and it was found that the model prediction is quite satisfactory, as shown in Figure 4.2. The
calculated results for permeate composition as a function of stage cut agree well with the
experimental data over a wide range of stage cuts and feed pressures. As mentioned earlier,
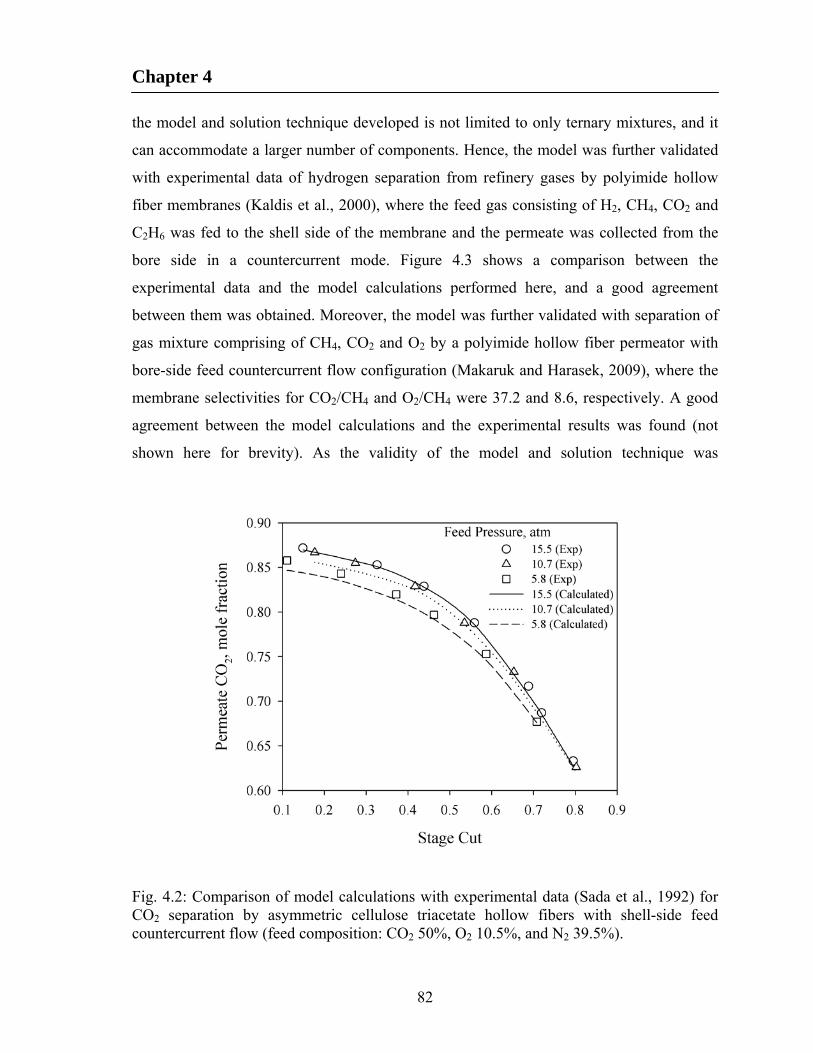
Chapter 4
82
the model and solution technique developed is not limited to only ternary mixtures, and it
can accommodate a larger number of components. Hence, the model was further validated
with experimental data of hydrogen separation from refinery gases by polyimide hollow
fiber membranes (Kaldis et al., 2000), where the feed gas consisting of H2, CH4, CO2 and
C2H6 was fed to the shell side of the membrane and the permeate was collected from the
bore side in a countercurrent mode. Figure 4.3 shows a comparison between the
experimental data and the model calculations performed here, and a good agreement
between them was obtained. Moreover, the model was further validated with separation of
gas mixture comprising of CH4, CO2 and O2 by a polyimide hollow fiber permeator with
bore-side feed countercurrent flow configuration (Makaruk and Harasek, 2009), where the
membrane selectivities for CO2/CH4 and O2/CH4 were 37.2 and 8.6, respectively. A good
agreement between the model calculations and the experimental results was found (not
shown here for brevity). As the validity of the model and solution technique was
Fig. 4.2: Comparison of model calculations with experimental data (Sada et al., 1992) for CO2 separation by asymmetric cellulose triacetate hollow fibers with shell-side feed countercurrent flow (feed composition: CO2 50%, O2 10.5%, and N2 39.5%).
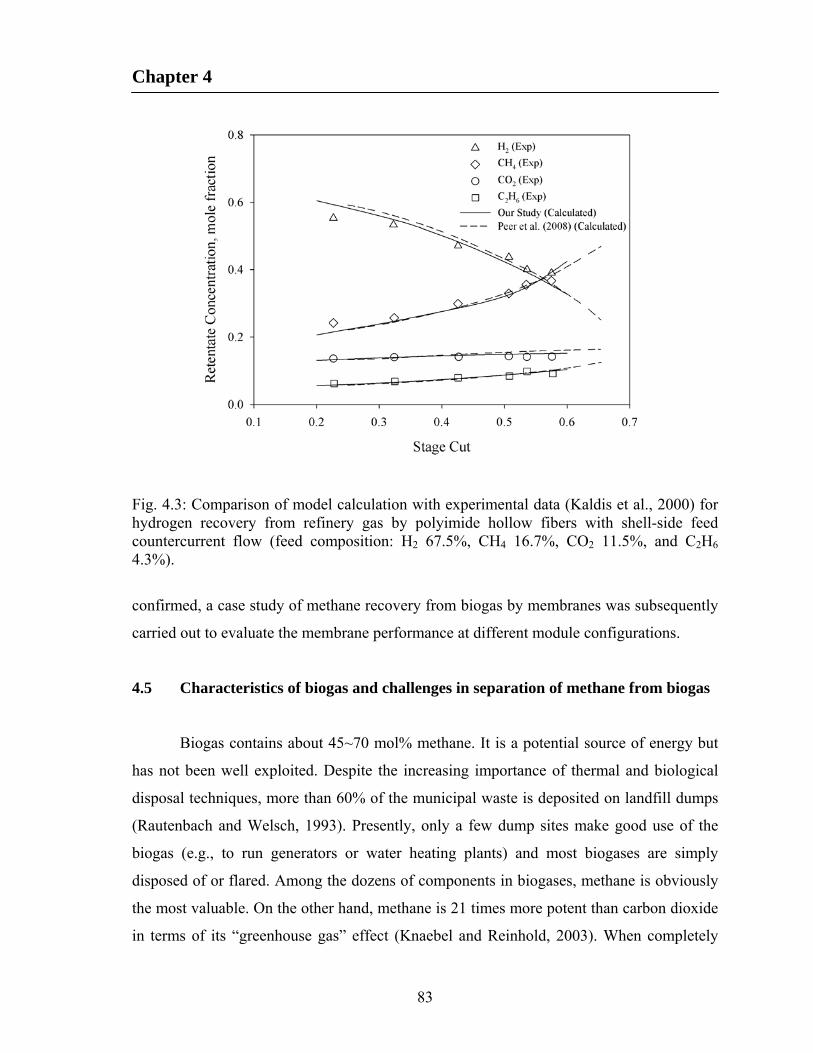
Chapter 4
83
Fig. 4.3: Comparison of model calculation with experimental data (Kaldis et al., 2000) for hydrogen recovery from refinery gas by polyimide hollow fibers with shell-side feed countercurrent flow (feed composition: H2 67.5%, CH4 16.7%, CO2 11.5%, and C2H6 4.3%).
confirmed, a case study of methane recovery from biogas by membranes was subsequently
carried out to evaluate the membrane performance at different module configurations.
4.5 Characteristics of biogas and challenges in separation of methane from biogas
Biogas contains about 45~70 mol% methane. It is a potential source of energy but
has not been well exploited. Despite the increasing importance of thermal and biological
disposal techniques, more than 60% of the municipal waste is deposited on landfill dumps
(Rautenbach and Welsch, 1993). Presently, only a few dump sites make good use of the
biogas (e.g., to run generators or water heating plants) and most biogases are simply
disposed of or flared. Among the dozens of components in biogases, methane is obviously
the most valuable. On the other hand, methane is 21 times more potent than carbon dioxide
in terms of its “greenhouse gas” effect (Knaebel and Reinhold, 2003). When completely

Chapter 4
84
combusted, methane is converted to an equal stoichiometric amount of CO2. Thus, flaring
biogas will reduce the potential greenhouse gas effect of CH4 in the biogas, but the energy
recovery is not effective because of the low BTU values. On the other hand, biogas can be
upgraded to produce a high quality fuel if most of the CO2, moisture and N2 can be
removed. The captured methane can be used in internal combustion engine (most
commonly used), gas turbine for power generation, fuel cells, boilers, industrial heaters,
manufacturing of chemicals, or can be delivered to an existing gas distribution network
(Demirbas et al., 2011; Khan and Islam, 2012).
In principle, adsorption, absorption, membranes and cryogenic distillation can be
used for biogas upgrading to improve its heating value. Cryogenic distillation would only
be feasible in very large applications, probably beyond the capacity of most landfills at
present (Knaebel and Reinhold, 2003), and pressure swing adsorption and liquid scrubbing
are still at the early stage of development. Membranes have shown to be efficient for bulk
separations. They could be used to remove moisture and the bulk of the CO2, depending on
the type of the membrane used. However, till to date, there are no known membranes that
exhibit a good selectivity between N2 and CH4. Therefore, membranes are not expected to
produce high purities of CH4 from biogases. As a landfill emits gases at different
compositions during different phases of its life, for the purpose of simplicity to demonstrate
multicomponent separation performance of membranes, CH4, CO2 and N2 were taken as
the key components of biogas in this study. During the methane fermentation phase and the
maturation phase, which are the longest period of a landfill’s life expectancy, CH4, CO2
and N2 are the major compounds (Gowing, 2001; Tchobanoglous and Kreith, 2002). The
above mentioned gases are the major compounds in digester gas too. Table 4.1 shows the
typical composition of a landfill gas (from landfills) and digester gas (from anaerobic
digestion). Among the many kinds of polymer membranes, cellulose acetate-based
membranes are well known for CO2/CH4 separation in natural gas processing. They
typically have a gas permeance of 40-50 GPU for CO2 and 1-3 GPU for N2 and CH4, with a
CO2/CH4 and CO2/N2 selectivity in the range of 15-35 under normal operating conditions
(Baker, 2002; Baker, 2004; Pan, 1986). It has been reported that the permeances of a

Chapter 4
85
Table 4.1: Compositions of biogas through landfills and anaerobic digestion
(Tchobanoglous and Kreith, 2002; Rasi et al., 2011; Demirbas et al., 2011).
Gas composition, % Component
Landfills Anaerobic Digestion Property
Methane 45-60 55-70 Energetic potential
Carbon dioxide 40-60 30-45 Greenhouse effect
Nitrogen 2-5 0-2 Reduction of heating value
Oxygen 0.1-1 0-2 Danger of explosion
Ammonia 5 ppm < 100 ppm Smell, toxic
Hydrogen 0-0.2 0-1 Potential of detonations and
fires
Sulfides 0-1 50-5000 ppm Smell, corrosion
cellulose triacetate membrane are 60, 3.6 and 2.9 GPU for CO2, N2 and CH4, respectively
(Coker et al., 1998). These values were used in this study (including all the case studies) to
evaluate the possibility of CH4 enrichment for biogas upgrading with membranes.
4.6 Dynamic membrane module configurations for methane enrichment
In biogas separation, in view of the purity-recovery trade off, a moderate purity of
CH4 with a high recovery is desired otherwise it will be difficult for the process to be
economically attractive. For the purpose of evaluating the potential use of membranes for
biogas upgrading, the permselectivity of the aforementioned cellulose triacetate membrane
was used in the parametric studies. The permeability of the membrane was assumed to be
constant over a pressure range of 400-600 kPa, irrespective of shell side feed or bore side
feed. Unless otherwise noted, every single unit has an active fiber length of 1 m. A nominal
fiber outside diameter of 300 μm, and inside diameter of 150 μm were used in the
calculation. For all the simulations performed, countercurrent shell-side feed was
employed, unless explicitly noted otherwise. The feed gas was assumed to be at landfill
outlet temperature (43.3oC). In the studies, the feed flow rate was normalized by membrane

Chapter 4
86
area, which represents the processing capacity of the membrane unit, and similarly product
flow rate was normalized by the membrane area to represent the productivity of the
membrane unit. The permeate stream was taken at the atmospheric pressure while the feed
pressure was varied between 400 and 600 kPa. To assess the performance of a membrane,
the product (methane is collected as retentate) purity and methane recovery are the key
parameters.
4.6.1 Single-stage without recycle
The single pass configuration (Figure 4.1a) is simple to operate and control, and is
generally capable of meeting a wide range of separation requirements. Figure 4.4
represents the performance of single-stage permeation for separating the landfill gas at feed
pressures of 400 and 600 kPa. It is found that at 0.8 stage cut, a moderately pure residue
stream containing 93.85% methane is possible (Figure 4.4a), though the methane recovery
is only 40% (Figure 4.4b). The retentate stream is almost free from carbon dioxide.
However, it contains a small amount of nitrogen since methane and nitrogen are difficult to
separate by membranes. A higher purity of methane at the retentate can be obtained but
there will be a severe methane loss in the permeate stream. As a result, the productivity of
methane in the retentate will go down (Figure 4.4c). Similar trends were observed for a
Fig. 4.4: Performance of single-stage permeation at different feed pressures, (a) retentate CH4 concentration. (b) CH4 recovery, and (c) CH4 productivity.
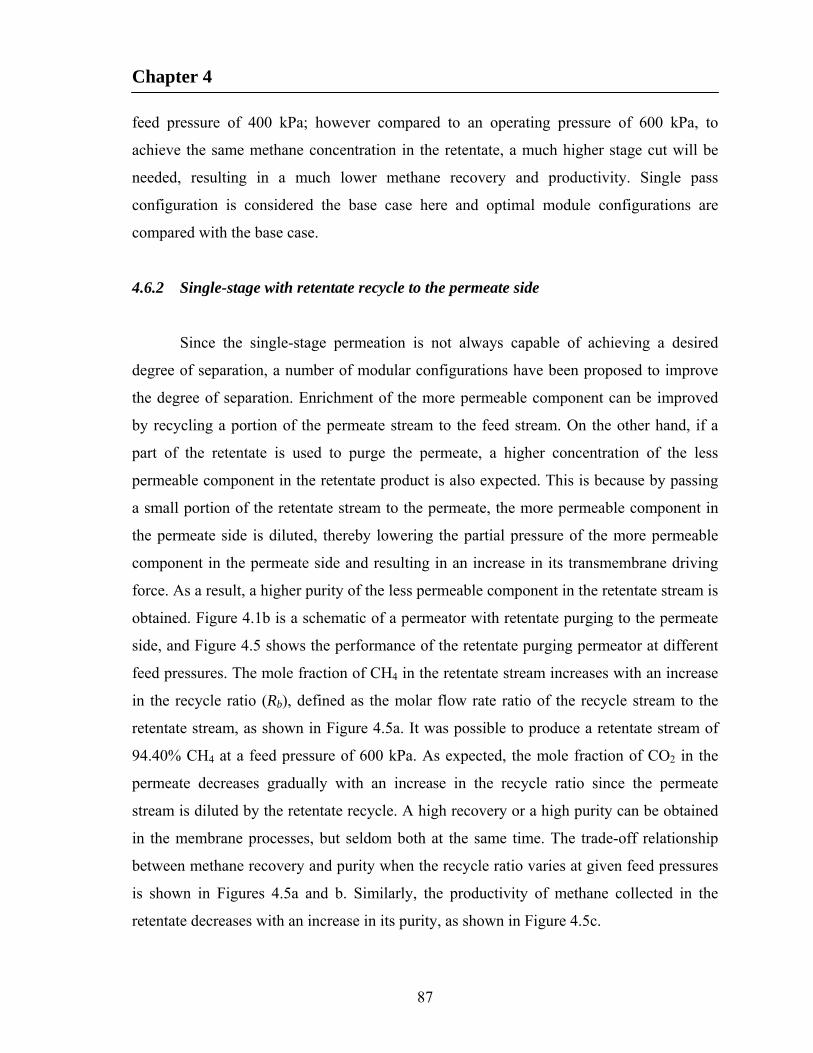
Chapter 4
87
feed pressure of 400 kPa; however compared to an operating pressure of 600 kPa, to
achieve the same methane concentration in the retentate, a much higher stage cut will be
needed, resulting in a much lower methane recovery and productivity. Single pass
configuration is considered the base case here and optimal module configurations are
compared with the base case.
4.6.2 Single-stage with retentate recycle to the permeate side
Since the single-stage permeation is not always capable of achieving a desired
degree of separation, a number of modular configurations have been proposed to improve
the degree of separation. Enrichment of the more permeable component can be improved
by recycling a portion of the permeate stream to the feed stream. On the other hand, if a
part of the retentate is used to purge the permeate, a higher concentration of the less
permeable component in the retentate product is also expected. This is because by passing
a small portion of the retentate stream to the permeate, the more permeable component in
the permeate side is diluted, thereby lowering the partial pressure of the more permeable
component in the permeate side and resulting in an increase in its transmembrane driving
force. As a result, a higher purity of the less permeable component in the retentate stream is
obtained. Figure 4.1b is a schematic of a permeator with retentate purging to the permeate
side, and Figure 4.5 shows the performance of the retentate purging permeator at different
feed pressures. The mole fraction of CH4 in the retentate stream increases with an increase
in the recycle ratio (Rb), defined as the molar flow rate ratio of the recycle stream to the
retentate stream, as shown in Figure 4.5a. It was possible to produce a retentate stream of
94.40% CH4 at a feed pressure of 600 kPa. As expected, the mole fraction of CO2 in the
permeate decreases gradually with an increase in the recycle ratio since the permeate
stream is diluted by the retentate recycle. A high recovery or a high purity can be obtained
in the membrane processes, but seldom both at the same time. The trade-off relationship
between methane recovery and purity when the recycle ratio varies at given feed pressures
is shown in Figures 4.5a and b. Similarly, the productivity of methane collected in the
retentate decreases with an increase in its purity, as shown in Figure 4.5c.
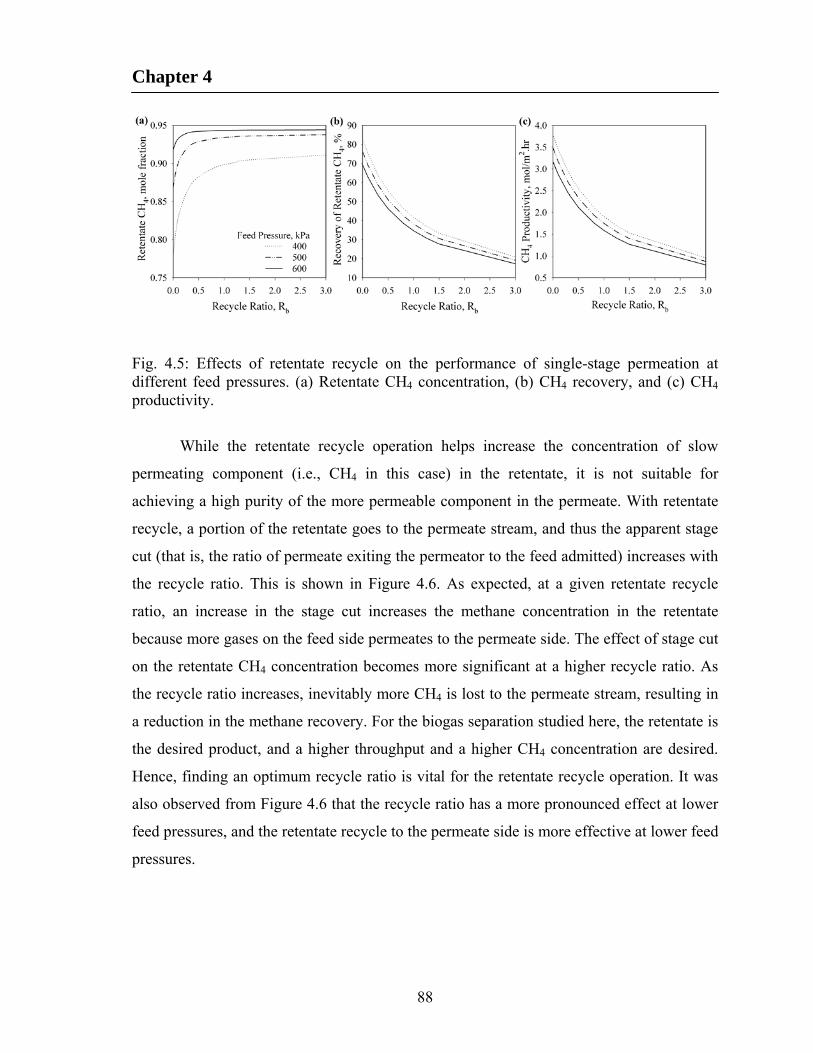
Chapter 4
88
Fig. 4.5: Effects of retentate recycle on the performance of single-stage permeation at different feed pressures. (a) Retentate CH4 concentration, (b) CH4 recovery, and (c) CH4 productivity.
While the retentate recycle operation helps increase the concentration of slow
permeating component (i.e., CH4 in this case) in the retentate, it is not suitable for
achieving a high purity of the more permeable component in the permeate. With retentate
recycle, a portion of the retentate goes to the permeate stream, and thus the apparent stage
cut (that is, the ratio of permeate exiting the permeator to the feed admitted) increases with
the recycle ratio. This is shown in Figure 4.6. As expected, at a given retentate recycle
ratio, an increase in the stage cut increases the methane concentration in the retentate
because more gases on the feed side permeates to the permeate side. The effect of stage cut
on the retentate CH4 concentration becomes more significant at a higher recycle ratio. As
the recycle ratio increases, inevitably more CH4 is lost to the permeate stream, resulting in
a reduction in the methane recovery. For the biogas separation studied here, the retentate is
the desired product, and a higher throughput and a higher CH4 concentration are desired.
Hence, finding an optimum recycle ratio is vital for the retentate recycle operation. It was
also observed from Figure 4.6 that the recycle ratio has a more pronounced effect at lower
feed pressures, and the retentate recycle to the permeate side is more effective at lower feed
pressures.
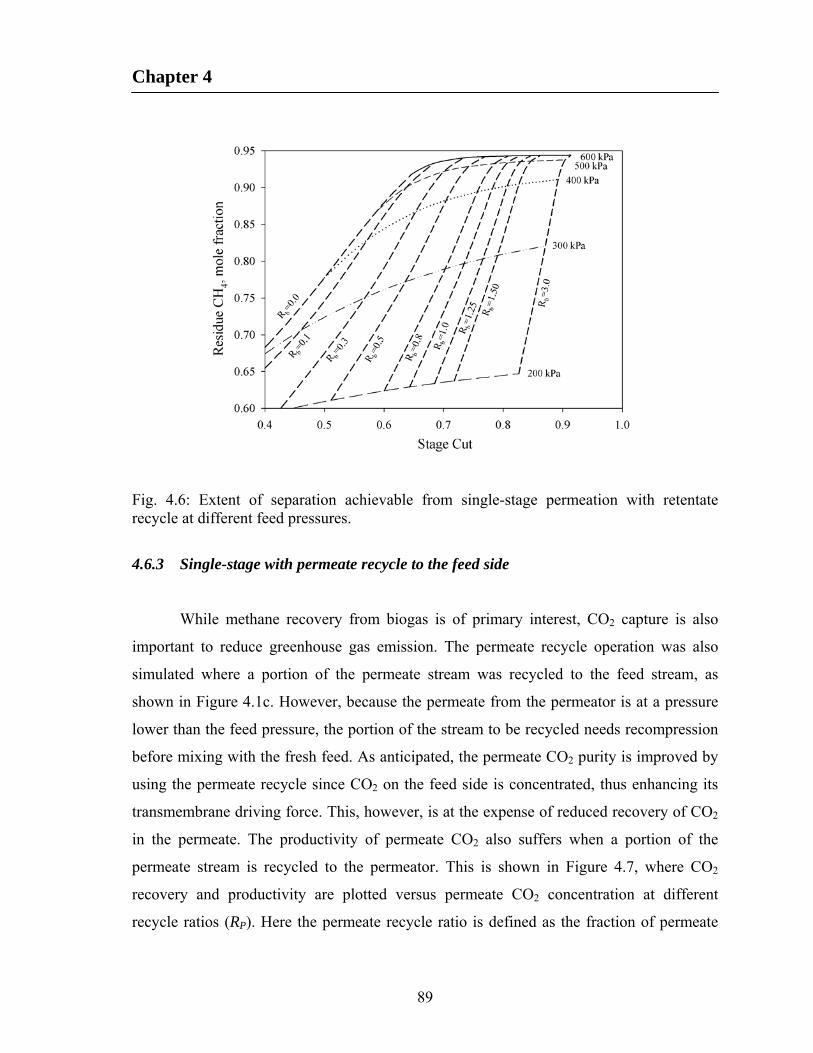
Chapter 4
89
Fig. 4.6: Extent of separation achievable from single-stage permeation with retentate recycle at different feed pressures.
4.6.3 Single-stage with permeate recycle to the feed side
While methane recovery from biogas is of primary interest, CO2 capture is also
important to reduce greenhouse gas emission. The permeate recycle operation was also
simulated where a portion of the permeate stream was recycled to the feed stream, as
shown in Figure 4.1c. However, because the permeate from the permeator is at a pressure
lower than the feed pressure, the portion of the stream to be recycled needs recompression
before mixing with the fresh feed. As anticipated, the permeate CO2 purity is improved by
using the permeate recycle since CO2 on the feed side is concentrated, thus enhancing its
transmembrane driving force. This, however, is at the expense of reduced recovery of CO2
in the permeate. The productivity of permeate CO2 also suffers when a portion of the
permeate stream is recycled to the permeator. This is shown in Figure 4.7, where CO2
recovery and productivity are plotted versus permeate CO2 concentration at different
recycle ratios (RP). Here the permeate recycle ratio is defined as the fraction of permeate

Chapter 4
90
from the permeator sent back to the feed stream. At a given recycle ratio, there exists a
limit in the maximum CO2 concentration that can be achieved. The permeate CO2
concentration approaches maximum when there is no depletion in CO2 concentration on the
feed side, and this corresponds to a limit of zero stage cut (and thus a zero recovery).
Fig. 4.7: Performance of single-stage permeation with permeate recycle to the feed. (a) Permeate CO2 concentration, and (b) CO2 productivity. Feed pressure600 kPa.
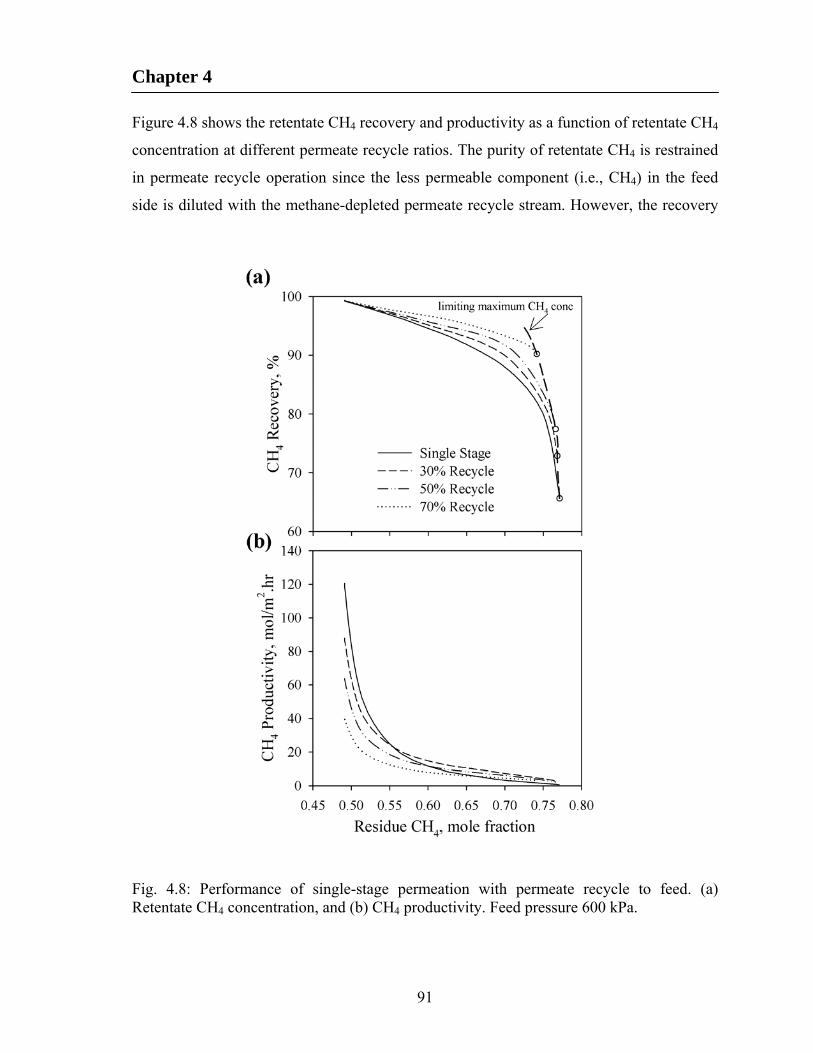
Chapter 4
91
Figure 4.8 shows the retentate CH4 recovery and productivity as a function of retentate CH4
concentration at different permeate recycle ratios. The purity of retentate CH4 is restrained
in permeate recycle operation since the less permeable component (i.e., CH4) in the feed
side is diluted with the methane-depleted permeate recycle stream. However, the recovery
Fig. 4.8: Performance of single-stage permeation with permeate recycle to feed. (a) Retentate CH4 concentration, and (b) CH4 productivity. Feed pressure 600 kPa.
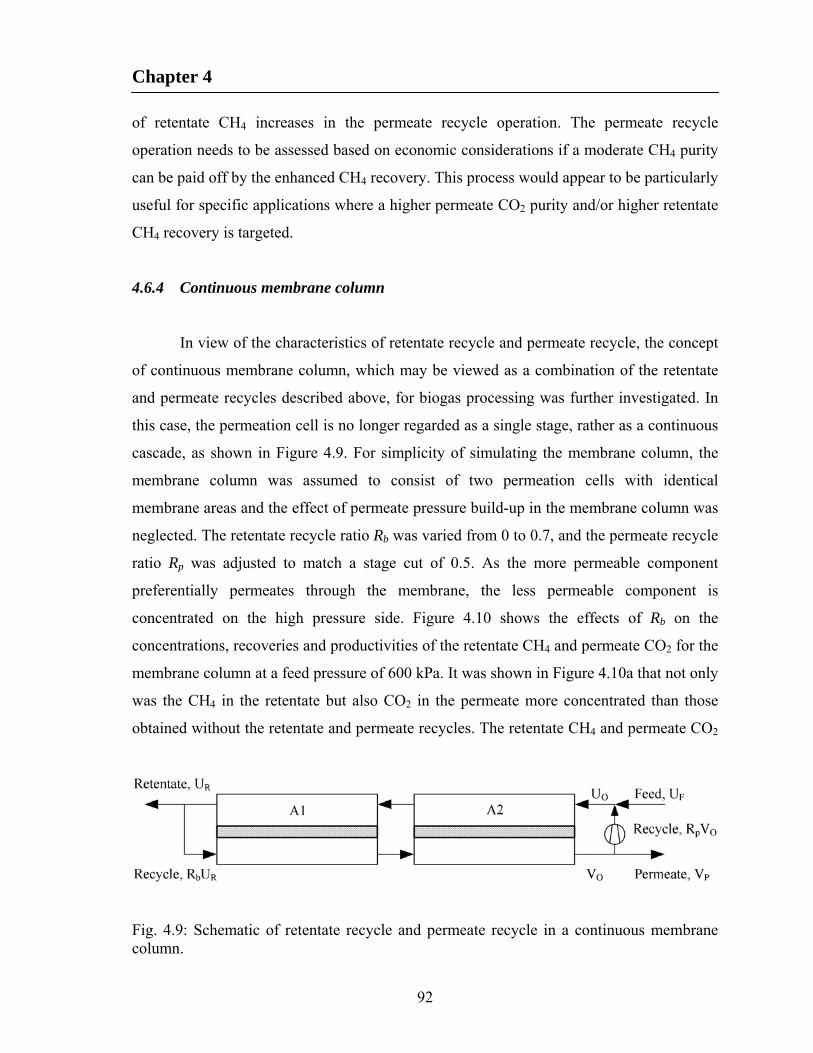
Chapter 4
92
of retentate CH4 increases in the permeate recycle operation. The permeate recycle
operation needs to be assessed based on economic considerations if a moderate CH4 purity
can be paid off by the enhanced CH4 recovery. This process would appear to be particularly
useful for specific applications where a higher permeate CO2 purity and/or higher retentate
CH4 recovery is targeted.
4.6.4 Continuous membrane column
In view of the characteristics of retentate recycle and permeate recycle, the concept
of continuous membrane column, which may be viewed as a combination of the retentate
and permeate recycles described above, for biogas processing was further investigated. In
this case, the permeation cell is no longer regarded as a single stage, rather as a continuous
cascade, as shown in Figure 4.9. For simplicity of simulating the membrane column, the
membrane column was assumed to consist of two permeation cells with identical
membrane areas and the effect of permeate pressure build-up in the membrane column was
neglected. The retentate recycle ratio Rb was varied from 0 to 0.7, and the permeate recycle
ratio Rp was adjusted to match a stage cut of 0.5. As the more permeable component
preferentially permeates through the membrane, the less permeable component is
concentrated on the high pressure side. Figure 4.10 shows the effects of Rb on the
concentrations, recoveries and productivities of the retentate CH4 and permeate CO2 for the
membrane column at a feed pressure of 600 kPa. It was shown in Figure 4.10a that not only
was the CH4 in the retentate but also CO2 in the permeate more concentrated than those
obtained without the retentate and permeate recycles. The retentate CH4 and permeate CO2
Fig. 4.9: Schematic of retentate recycle and permeate recycle in a continuous membrane column.
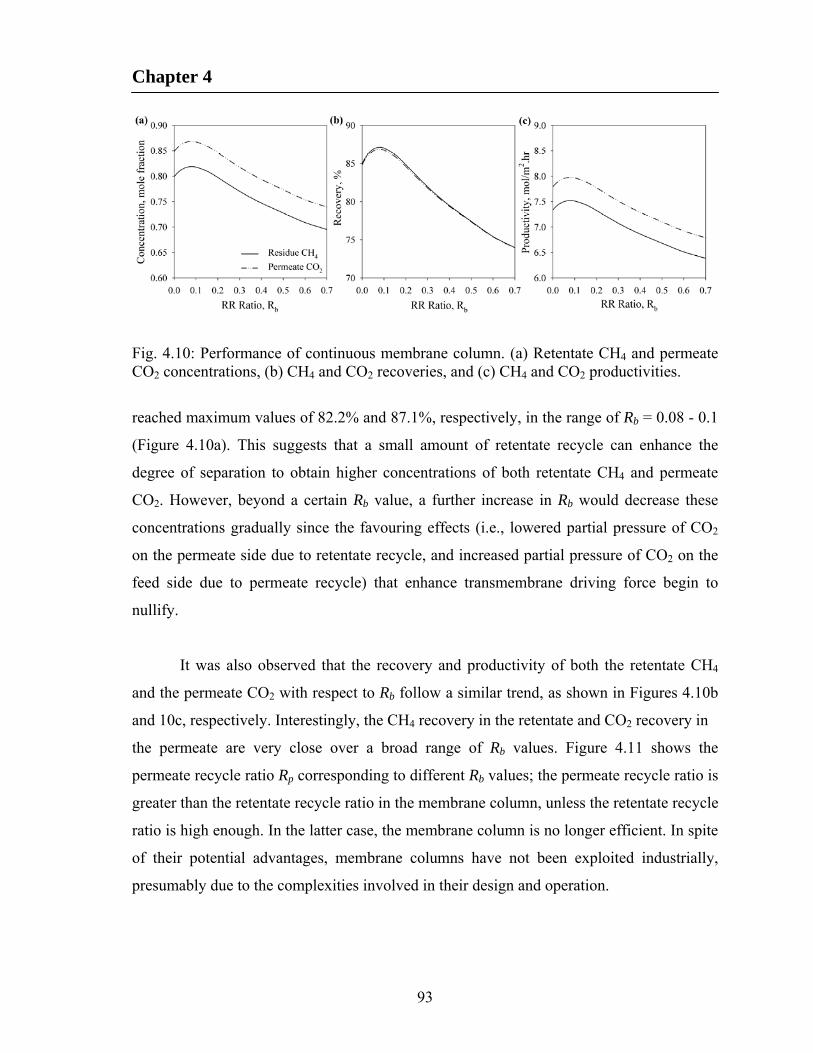
Chapter 4
93
Fig. 4.10: Performance of continuous membrane column. (a) Retentate CH4 and permeate CO2 concentrations, (b) CH4 and CO2 recoveries, and (c) CH4 and CO2 productivities.
reached maximum values of 82.2% and 87.1%, respectively, in the range of Rb = 0.08 - 0.1
(Figure 4.10a). This suggests that a small amount of retentate recycle can enhance the
degree of separation to obtain higher concentrations of both retentate CH4 and permeate
CO2. However, beyond a certain Rb value, a further increase in Rb would decrease these
concentrations gradually since the favouring effects (i.e., lowered partial pressure of CO2
on the permeate side due to retentate recycle, and increased partial pressure of CO2 on the
feed side due to permeate recycle) that enhance transmembrane driving force begin to
nullify.
It was also observed that the recovery and productivity of both the retentate CH4
and the permeate CO2 with respect to Rb follow a similar trend, as shown in Figures 4.10b
and 10c, respectively. Interestingly, the CH4 recovery in the retentate and CO2 recovery in
the permeate are very close over a broad range of Rb values. Figure 4.11 shows the
permeate recycle ratio Rp corresponding to different Rb values; the permeate recycle ratio is
greater than the retentate recycle ratio in the membrane column, unless the retentate recycle
ratio is high enough. In the latter case, the membrane column is no longer efficient. In spite
of their potential advantages, membrane columns have not been exploited industrially,
presumably due to the complexities involved in their design and operation.

Chapter 4
94
Fig. 4.11: Relationship between retentate recycle ratio Rb and permeate recycle ratio Rp in the membrane column.
4.6.5 Two-stage cascade with reflux and two stages in parallel/series
When a single-stage design is unsatisfactory in terms of product purity or recovery,
multistaging or cascading is sometimes an attractive approach. One of the configurations is
a two-stage cascade with reflux, where retentate from the first stage serves as the feed to
the second stage and the permeate from the second stage is fed to the first stage, as shown
in Figure 4.12. This configuration was simulated by varying the stage cut of the second
stage until the permeate composition from the second stage matched the feed composition,
assuming the same membrane area for both stages. It was possible to produce a retentate
stream with 90.0% CH4 at a CH4 recovery rate of 84.2%. As a comparison, to produce a
comparable methane purity in the retentate, the simple two stages in parallel (Figure 4.13)
and two stages in series (Figure 4.14) would yield a recovery of 73.4% and 71.7%,
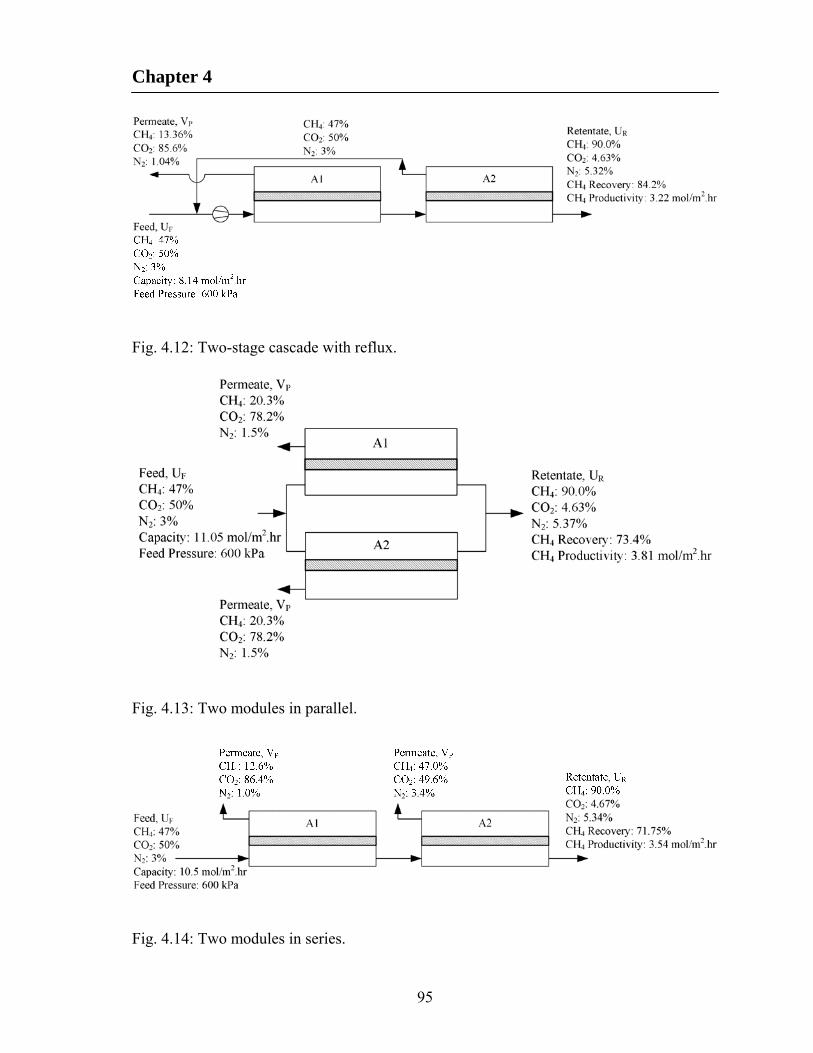
Chapter 4
95
Fig. 4.12: Two-stage cascade with reflux.
Fig. 4.13: Two modules in parallel.
Fig. 4.14: Two modules in series.

Chapter 4
96
respectively. Clearly, the configuration shown in Figure 4.12 performs better in terms of
product purity and recovery, though its CH4 productivity is about 10-18% lower.
4.6.6 Nitrogen removal with methane-selective membranes
The extent of separation is limited by membrane selectivity, process configuration
and operating conditions. The above results show that it was possible to obtain as high as
94.4% of CH4 in the retentate with recycle operations, but it is difficult to meet the pipeline
specifications due to presence of nitrogen. The purified gas has a heating value (979
BTU/cf or 36.5 MJ/m3) (Lyons, 1996) close to pipeline standard natural gas (1032 BTU/cf
or 38.4 MJ/m3) (Perry and Green, 1997), which is much higher than that of the heating
value of biogas (403-564 BTU/cf or 15-21 MJ/m3, depending on the composition of
methane) (Williams, 2005). The purified gas has fuel values and can be used in many
applications. However, in order to deliver the purified gas to pipeline grids, the N2 content
needs to be lowered below 4%. Unfortunately, there are no efficient technologies available
at the present time to separate nitrogen from methane, and membranes with an adequate
N2/CH4 selectivity are still lacking. Typical rubbery membranes (e.g.,
polydimethylsiloxane) for N2/CH4 separation have a selectivity of only 2-3 at ambient
temperatures. It was thus decided to carry out a parametric study for N2/CH4 separation
using methane-selective membranes that could bring the aforementioned methane-enriched
retentate to a methane concentration of 96%. For calculation purposes, the permeator was
assumed to have the same membrane area as described above, and the permeance of
nitrogen was assumed to be 3.6 GPU. Simulation was performed to determine the
membrane selectivity required for a targeted separation to produce a pipeline quality
permeate stream ( 4% N2 content) and a retentate stream with 50% N2 in a single-stage
operation. It was found that for a feed gas containing 90% CH4, a methane-permeable
membrane with a methane/nitrogen selectivity of 8 can achieve the target separation
(Figure 4.15a) at a methane recovery and productivity of 92.7% and 12.4 mol/(m2.h),
respectively. If the feed gas contains 94% CH4, a membrane selectivity of 4.5 would be

Chapter 4
97
Figure 4.15. Case studies of nitrogen removal from CH4/CO2 mixtures with methane-selective membranes to produce a 50% CH4/50% N2 retentate stream and a 96% CH4/4% N2 product gas stream. (a) Feed composition 90% CH4/10% N2, membrane selectivity 8.0, (b) Feed composition 94% CH4/6% N2, membrane selectivity 4.5, and (c) Membrane selectivity 3, feed CH4 concentration required 95.4%.
required (Figure 4.15b), and the methane recovery and productivity were 97.7% and 8.0
mol/(m2.h), respectively. Current rubbery polymeric membranes exhibit a

Chapter 4
98
methane/nitrogen selectivity of 3-4 at low temperatures (Baker and Lokhandwala, 2008;
Lokhandwala et al., 2010). As Figure 4.15c shows, with a methane/nitrogen selectivity of
3, a feed methane concentration of 95.4% was required in order to produce a permeate
methane concentration of 96%. This means the intended separation is difficult to achieve
using current membranes but it does not look like an elusive target to reach in near future
as more permselective membranes are developed. It can be estimated that if a nitrogen-
selective membrane is to be used, the membrane must have a much higher
nitrogen/methane selectivity than the best nitrogen-selective membrane currently available
(nitrogen/methane selectivity of 2.5) to achieve the same separation (Baker and
Lokhandwala, 2008). In this case, the purified methane is obtained in the residue stream at
a pressure close to the feed pressure, which favours subsequent delivery in terms of
recompression costs. It is to be noted that single-stage membrane units would rarely be
used in practice for the separations; however, they do provide a basis for comparison.
The renewable methane from Canadian municipal solid wastes has not been
properly exploited yet, and there exists enormous opportunities for methane recovery from
biogas in order to harness energy production and to mitigate its greenhouse gas effect. The
current scenario of Canadian landfills and potential renewable methane generation from
municipal solid wastes has been discussed in Appendix B. Based on the current scenario of
Canadian landfills and potential renewable methane generation from municipal solid
wastes, there appears to be an enormous potential to capture methane for biogas from both
an energy recovery and environmental perspectives.
4.7 Conclusions
A simple approach was taken to formulate and solve the multicomponent gas
permeation problems with asymmetric hollow fiber membranes. The solution technique
offers minimum computational time and effort, with improved solution stability. Moreover,
the computational complexity does not multiply as the number of components increases.
The model and solution technique were applied to investigate dynamic performance of
several membrane module configurations for methane recovery and enrichment from
Chapter 4
99
biogas. It was found that a moderately pure residue stream with 93.85% CH4 could be
produced from single-stage permeation at a methane recovery of 40%. The retentate-to-
permeate recycle and permeate-to-feed recycle operation for enhanced separation were
explored, and the optimum recycle ratio vital for these operations were found. A higher
purity of retentate stream up to 94.4% CH4 was possible with the retentate-to-permeate
recycle mode of operation. The recovery of retentate CH4 also increased with the permeate-
to-feed recycle mode. Complexities involved in the design and operation of continuous
membrane column, which involve essentially both modes of recycles, was further
investigated; and both concentrations of CH4 in retentate and CO2 in permeate were
enhanced. It was also observed that methane loss in permeate stream could be lowered
using a membrane column. In addition, two-stage cascade with reflux was shown to
improve both the product purity and recovery. However, with current CO2-selective
membranes, it is difficult for the methane-enriched retentate stream to reach a pipeline
quality natural gas primarily due to the presence of a small amount of nitrogen, and an
additional separation step to remove nitrogen is needed. Rubbery polymer membranes may
be used for the denitrogenation step, but the methane/nitrogen selectivity currently
available is relatively low and more permselective membranes need to be developed.
Chapter 5
100
Effect of permeate pressure build-up on intrinsic separation performance
of asymmetric hollow fiber membranes†
5.1 Introduction
An important advantage of hollow fiber membrane modules is their ability to pack a
very large membrane area into a single module. Hollow fibers enable substantially higher
membrane packing than are possible with either of the flat-sheet or spiral-wound designs.
For high-pressure gas separation applications, hollow fine fibers have a major segment of
the market, and can withstand high-pressures of 1000 psig or more in shell-side feed
modules (Baker, 2004). Operating at a higher pressure consumes more gas, and therefore
sometimes membrane module is tested or characterized at lower pressure to save gas
consumption. The pressure build-up in the lumen side increases for high pressure
applications and can become enough to seriously affect the membrane performance. It is
also considered that there is little or negligible pressure build-up for shorter fibers, though
the pressure build-up increases for longer fibers. It is thus perceived that the effect of the
pressure build-up is significant only for long fibers, especially at high feed pressures. This,
however requires rectification and interpretation, and these perceptions are sometimes
misleading.
The permeance of gases through a membrane is normally independent of feed
pressure, which is normally the case for permeation of permanent gases in glassy polymers
and may be attributed to the constant diffusivity and solubility at different pressures. The
hollow fiber membranes used in gas separation are often very fine. Pressure build-up on the
lumen side of these fine fibers reduces the driving force across the fiber wall available for
permeation, and this loss can become enough to seriously affect membrane performance.
Because of the pressure build-up in the fiber lumen, the permeances calculated from pure
gas permeation experiments (apparent permeances) do not necessarily represent the true
permeances (intrinsic property) of the hollow fiber membrane unless the pressure build-up
† Part of Chapter 5 will be submitted shortly for publication

Chapter 5
101
in the fiber lumen is taken into account. A number of examples can be cited from open
literature where permeance was found independent of pressure difference for flat
homogeneous membrane but a dependent function for hollow fibers, though the pressure
dependence is not caused by membrane material. The permeate pressure build-up is
significant for long fibers, fine fibers and for high pressure applications. To minimize gas
consumption, lab tests are often performed at low pressures on miniature fiber modules of
short fibers (Pan, 1986). However, the percentage loss in the driving force at low pressures
can still be enough to deteriorate the actual permeation performance than that at high
pressures. On the contrary, the reduction in the driving force at high pressures is in fact less
critical as the membrane permeance will be close to its actual permeance. On the other
hand, the pressure build-up is not always negligible for short fibers. In an industrial scale,
the hollow fiber length is usually more than 1 m and a considerable pressure build-up in the
lumen can occur, resulting in discrepancy in the measured membrane performance if this
effect is neglected. For the separation of hydrogen from nitrogen or methane, or carbon
dioxide from natural gas, pressure-normalized fluxes are considerably high, and hollow
fiber modules can develop excessive permeate-side pressure drops. On the other hand, for
the production of nitrogen from air, the membrane pressure-normalized fluxes are
relatively low, from 1 to 2 GPU, and parasitic pressure drops are not likely a problem
(Baker, 2004). However, depending on the module geometry, the effect of permeate
pressure build-up could be significant for slow permeating gases as well. Moreover, the
potted section of the hollow fibers does not take part in permeation but contributes
additional pressure drop, and this section adds up driving force loss which can influence
the apparent permeance calculated from the permeate flow.
In our study, the apparent permeances of H2 and N2 were evaluated from pure gas
permeation experiments with short and long module. The true separation performance of
the hollow fiber membranes was calculated by taking into account the effect of permeate
pressure build-up in the fiber lumen (including the potted section). A correlation between
the apparent membrane permeance and pressure difference was observed. The observations
were explained theoretically and compared with some of the pure gas permeation
experiments reported in literature. The pressure build-up effect was further investigated by
Chapter 5
102
calculating the average loss and percentage loss in the driving force due to pressure build-
up inside the fiber lumen for pure gas permeation of H2 at different pressures. The nominal
internal diameter of the fibers was accurately estimated through theoretical analysis, which
was otherwise difficult to image due to inconsistent shape of the fiber. The mixed gas
permeances were also measured from mixed gas experiments, and were compared with
permeances measured from pure gas experiments and approximation method. The study
will rectify some general perceptions, which are usually believed in case of pressure build-
up with high flux asymmetric hollow fiber membranes. The analysis may also provide an
insight into the characteristics of gas permeation through hollow fiber membranes.
5.2 Materials and methods
5.2.1 Gas permeation experiment
Details of the gas permeation experiments can be found in Zakaria (2006). A short
membrane module was prepared by inserting a bundle of 23 asymmetric cellulose acetate-
based hollow fibers in a ¼-in copper tubing of about 4 cm in length, and potted with epoxy
resin to form a gas-tight tube sheet as shown in Figure 5.1. The tube sheet was carefully cut
to make the fibers fully open for gas flow. The effective length of the fiber was 23.5 cm,
and the inner and outer diameter of the fiber was 80 and 200 m, respectively. Pure gas
permeation of H2 and N2 was conducted (Figure 5.2). The feed gas at a specific pressure
was admitted to the membrane module to contact with the selective layer of the membrane,
and the permeate stream exited the module from the lumen side at atmospheric pressure.
The residue end was completely closed. The permeation rate was determined
volumetrically using a bubble flow meter. The gas permeance through the membrane can
be calculated by:
pAQJ Δ (5.1)
where J is the apparent membrane permeance, which is customarily expressed in units of
GPU (1 GPU = 10-6 cm3 (STP)/cm2. s. cm Hg = 3.35×10⁻¹⁰ mol/m2. s. Pa), A the effective
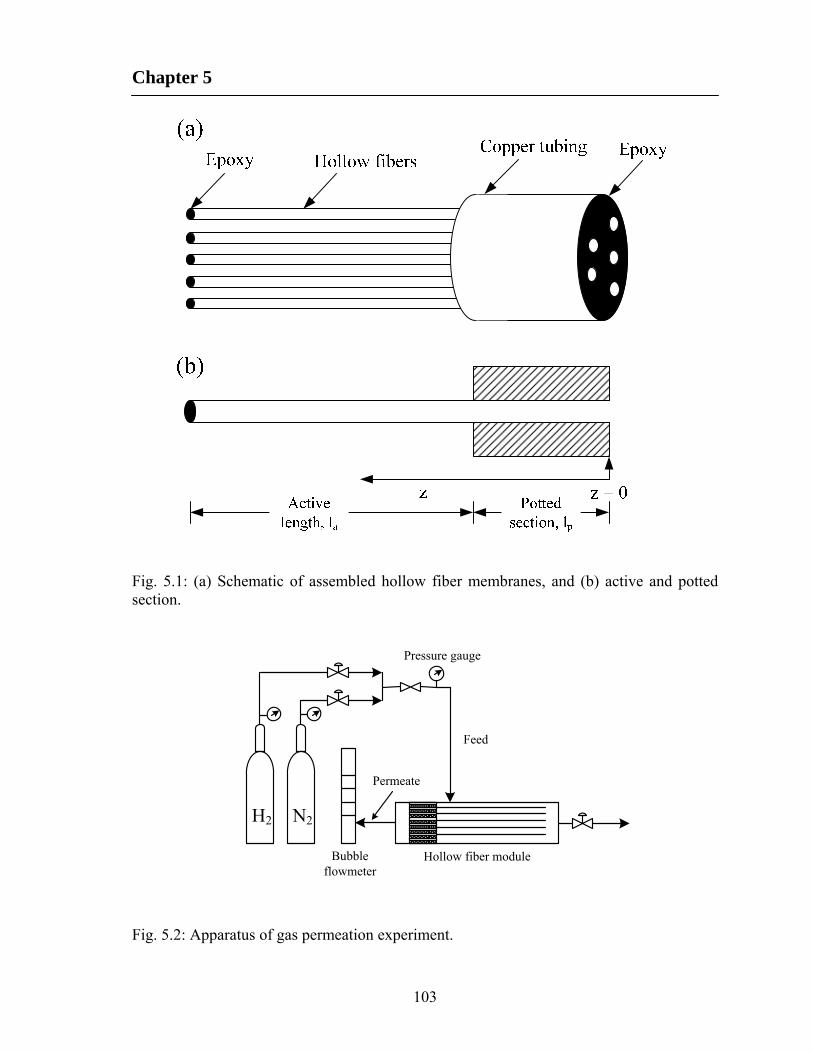
Chapter 5
103
Fig. 5.1: (a) Schematic of assembled hollow fiber membranes, and (b) active and potted section.
Hollow fiber module
Permeate
Feed
Pressure gauge
H2 N2
Bubble flowmeter
Fig. 5.2: Apparatus of gas permeation experiment.
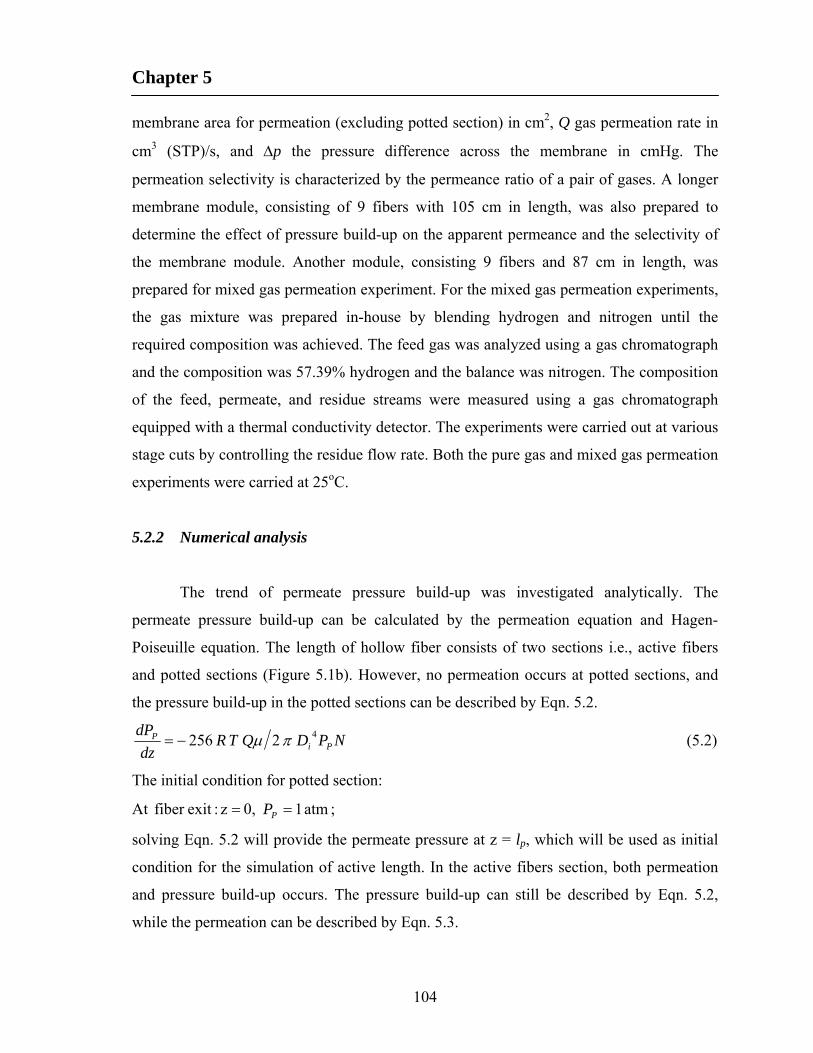
Chapter 5
104
membrane area for permeation (excluding potted section) in cm2, Q gas permeation rate in
cm3 (STP)/s, and p the pressure difference across the membrane in cmHg. The
permeation selectivity is characterized by the permeance ratio of a pair of gases. A longer
membrane module, consisting of 9 fibers with 105 cm in length, was also prepared to
determine the effect of pressure build-up on the apparent permeance and the selectivity of
the membrane module. Another module, consisting 9 fibers and 87 cm in length, was
prepared for mixed gas permeation experiment. For the mixed gas permeation experiments,
the gas mixture was prepared in-house by blending hydrogen and nitrogen until the
required composition was achieved. The feed gas was analyzed using a gas chromatograph
and the composition was 57.39% hydrogen and the balance was nitrogen. The composition
of the feed, permeate, and residue streams were measured using a gas chromatograph
equipped with a thermal conductivity detector. The experiments were carried out at various
stage cuts by controlling the residue flow rate. Both the pure gas and mixed gas permeation
experiments were carried at 25oC.
5.2.2 Numerical analysis
The trend of permeate pressure build-up was investigated analytically. The
permeate pressure build-up can be calculated by the permeation equation and Hagen-
Poiseuille equation. The length of hollow fiber consists of two sections i.e., active fibers
and potted sections (Figure 5.1b). However, no permeation occurs at potted sections, and
the pressure build-up in the potted sections can be described by Eqn. 5.2.
NPDQTRdz
dPPi
P 4 2 256 (5.2)
The initial condition for potted section:
At ; atm 1 0, z :exit fiber PP
solving Eqn. 5.2 will provide the permeate pressure at z = lp, which will be used as initial
condition for the simulation of active length. In the active fibers section, both permeation
and pressure build-up occurs. The pressure build-up can still be described by Eqn. 5.2,
while the permeation can be described by Eqn. 5.3.

Chapter 5
105
NPPJDdz
dQPFo )( (5.3)
For active fibers sections, Eqns. 5.2 and 5.3 form a two point boundary value problem. At
the end of potted section (z = lp or beginning of active action), PP and Q are known from
simulation of the potted section and from the gas permeation experiment, respectively. At
the fiber’s closed end (z = la), Q = 0. The intrinsic permeance J was kept as an unknown
parameter in the problem. The two point boundary value problem with unknown
parameters can be solved by the collocation technique. The solutions will provide the value
of intrinsic permeance for the pure gas and the permeate pressure profile along the fiber
length. Again, mixed gas permeances of hollow fiber membranes in a binary mixed-gas
membrane permeator were also calculated as unknown parameters from the mathematical
model of binary gas separation with the aid of mixed gas separation experimental results.
Several mathematical models of binary gas separation in hollow fiber membranes available
in open literature (Kaldis et al., 2000; Kundu et al., 2012a; Murad Chowdhury et al., 2005;
Wang et al., 2002) can be used for mixed gas permeance calculation. The model can also
be used to predict the performance of a permeator if the permeances of the gas pair are
known.
5.3 Results and discussion
In the membrane module, the epoxy-filled tube sheet is not included in the effective
length since there is no permeation in this section (Figure 5.1). However, this section still
incurs some pressure drop. Figures 5.3 and 5.4 represent the pressure profile along the fiber
bore for the short and long module, respectively. It suggests that the pressure build-up in
the potted section is not negligible and excessive pressure build-up can affect the actual
performance if that effect is neglected. The tube sheet comprises about 17% and 4% of the
effective fiber length for the short (potted length 4 cm and active length 23.5 cm) and long
module (potted length 4 cm and active length 105 cm), respectively. The uncertainties in
the measured fiber length due to the epoxy potting will result in greater inaccuracy for a
short hollow fiber compared to a long hollow fiber.
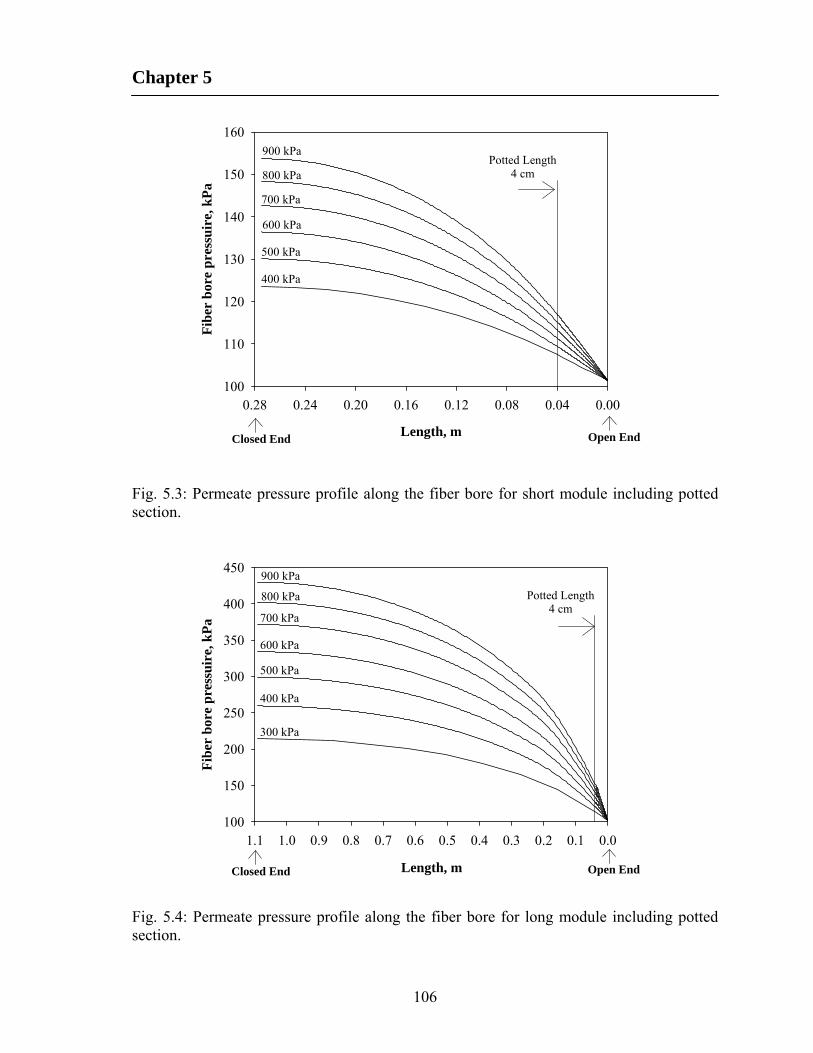
Chapter 5
106
Length, m
0.000.040.080.120.160.200.240.28
Fib
er b
ore
pre
ssu
ire,
kP
a
100
110
120
130
140
150
160
Potted Length4 cm
900 kPa
400 kPa
500 kPa
600 kPa
700 kPa
800 kPa
Open EndClosed End
Fig. 5.3: Permeate pressure profile along the fiber bore for short module including potted section.
Length, m
0.00.10.20.30.40.50.60.70.80.91.01.1
Fib
er b
ore
pre
ssu
ire,
kP
a
100
150
200
250
300
350
400
450
Potted Length4 cm
300 kPa
900 kPa
400 kPa
500 kPa
600 kPa
700 kPa
800 kPa
Open EndClosed End
Fig. 5.4: Permeate pressure profile along the fiber bore for long module including potted section.

Chapter 5
107
The apparent permeances of pure H2 and N2 in both the short and long modules
were calculated using Eqn. 5.1, and they are presented in Figure 5.5. The calculated
apparent permeances do not take into account the permeate pressure build-up. It was
observed that the apparent permeances of H2 and N2 obtained with the long module were
always less than the apparent permeances obtained with the short module (Figure 5.5). This
H2
Per
mea
nce,
GP
U
20
30
40
50
60
70
Long Fiber-IntrinsicLong Fiber-ApparentShort Fiber-ApparentShort Fiber-Intrinsic
Feed Pressure, kPa (Abs.)
200 400 600 800 1000
N2
Per
mea
nce,
GP
U
0.60
0.65
0.70
0.75
0.80
(a)
(b)
Fig. 5.5: Comparison of apparent and intrinsic permeances of short and long modules at different feed pressures for, (a) pure H2, and (b) pure N2.
Chapter 5
108
clearly shows that at a given feed pressure, less permeate flow is generated from the long
fiber than from the short fiber for a given membrane area, which can be attributed to the
reduced driving force resulting from the permeate pressure build-up. The effect of
permeate pressure build-up is more significant for H2 since H2 is much more permeable
(~60X) than N2.
The intrinsic or true permeances were calculated at different feed pressures from the
permeation rate data by solving Eqns. 5.2 and 5.3, which incorporates the effect of
permeate pressure build-up. The pressure build-up in the potted section of the tube sheet
was calculated first from permeate flow rate data, and was used as boundary condition
along with the permeate flow rate data to calculate the intrinsic permeance. As expected,
the intrinsic permeance obtained for the long module is essentially the same as that
obtained using the short module and that the permeance is independent of feed pressure
(Figure 5.5). For instance, the intrinsic permeance of H2 was calculated to be 60.4 GPU
(Figure 5.5a), while the intrinsic permeance of N2 was found to be 0.75 GPU (Figures
5.5b). It is apparent from Figure 5.5 that pressure build-up occurs in short fiber too.
Since the permeation rate of H2 is high, the permeate pressure build-up reduces the
permeation of H2 more than N2, resulting in a substantial underestimation of H2 permeance.
For the long module, the deviation between the intrinsic and apparent permeance of H2 was
found larger at lower feed pressures than at higher feed pressures. It infers that though the
permeate pressure build-up in the lumen increases with feed pressures, the effect of
pressure build-up on membrane performance is in fact more significant at low feed
pressures than at high feed pressures. It was observed that the apparent permeance of H2 for
long module tends to approach that of the intrinsic permeance at high feed pressures
(Figure 5.5a). This suggests that the membrane performs close to its full potential as
dictated by the intrinsic property of the membrane if it is operated at a high feed pressure,
and in spite of greater pressure build-ups, the effect of pressure build-up on the membrane
performance is actually minimized. The apparent selectivity of H2/N2 for longer fiber was
found less than the selectivity of the membrane measured from that of the short fiber
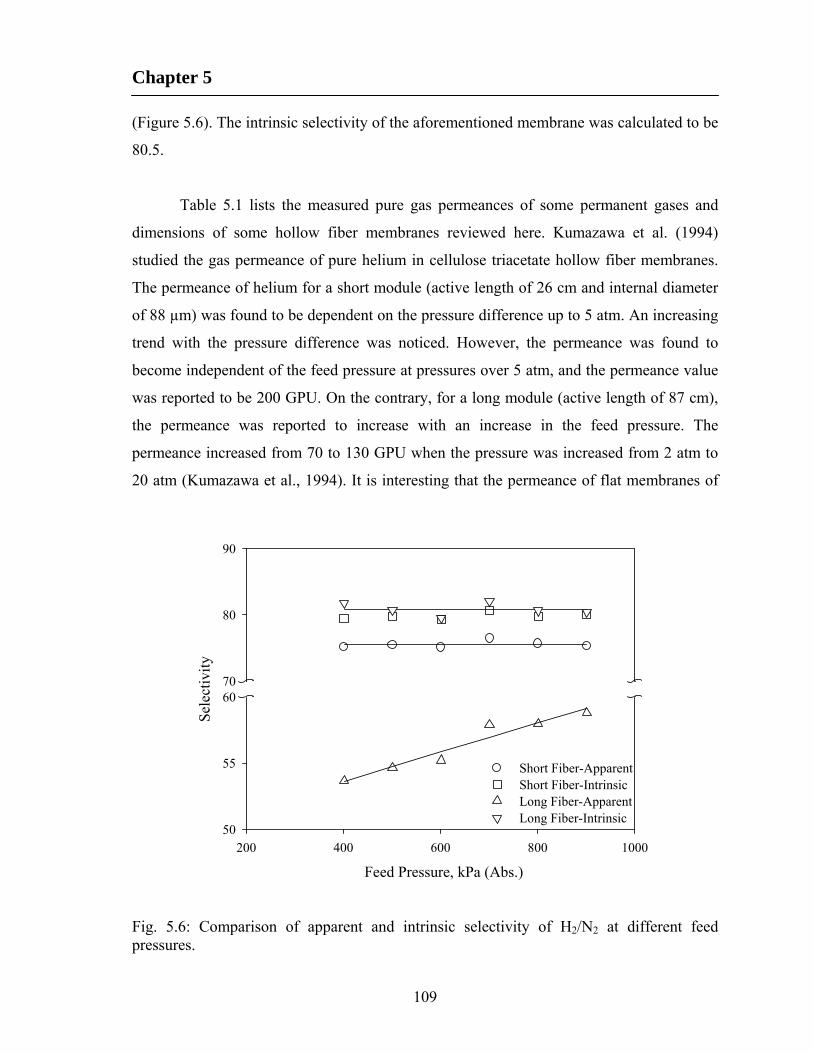
Chapter 5
109
(Figure 5.6). The intrinsic selectivity of the aforementioned membrane was calculated to be
80.5.
Table 5.1 lists the measured pure gas permeances of some permanent gases and
dimensions of some hollow fiber membranes reviewed here. Kumazawa et al. (1994)
studied the gas permeance of pure helium in cellulose triacetate hollow fiber membranes.
The permeance of helium for a short module (active length of 26 cm and internal diameter
of 88 µm) was found to be dependent on the pressure difference up to 5 atm. An increasing
trend with the pressure difference was noticed. However, the permeance was found to
become independent of the feed pressure at pressures over 5 atm, and the permeance value
was reported to be 200 GPU. On the contrary, for a long module (active length of 87 cm),
the permeance was reported to increase with an increase in the feed pressure. The
permeance increased from 70 to 130 GPU when the pressure was increased from 2 atm to
20 atm (Kumazawa et al., 1994). It is interesting that the permeance of flat membranes of
Feed Pressure, kPa (Abs.)
200 400 600 800 1000
Sel
ecti
vity
50
55
6070
80
90
Short Fiber-ApparentShort Fiber-IntrinsicLong Fiber-ApparentLong Fiber-Intrinsic
Fig. 5.6: Comparison of apparent and intrinsic selectivity of H2/N2 at different feed pressures.
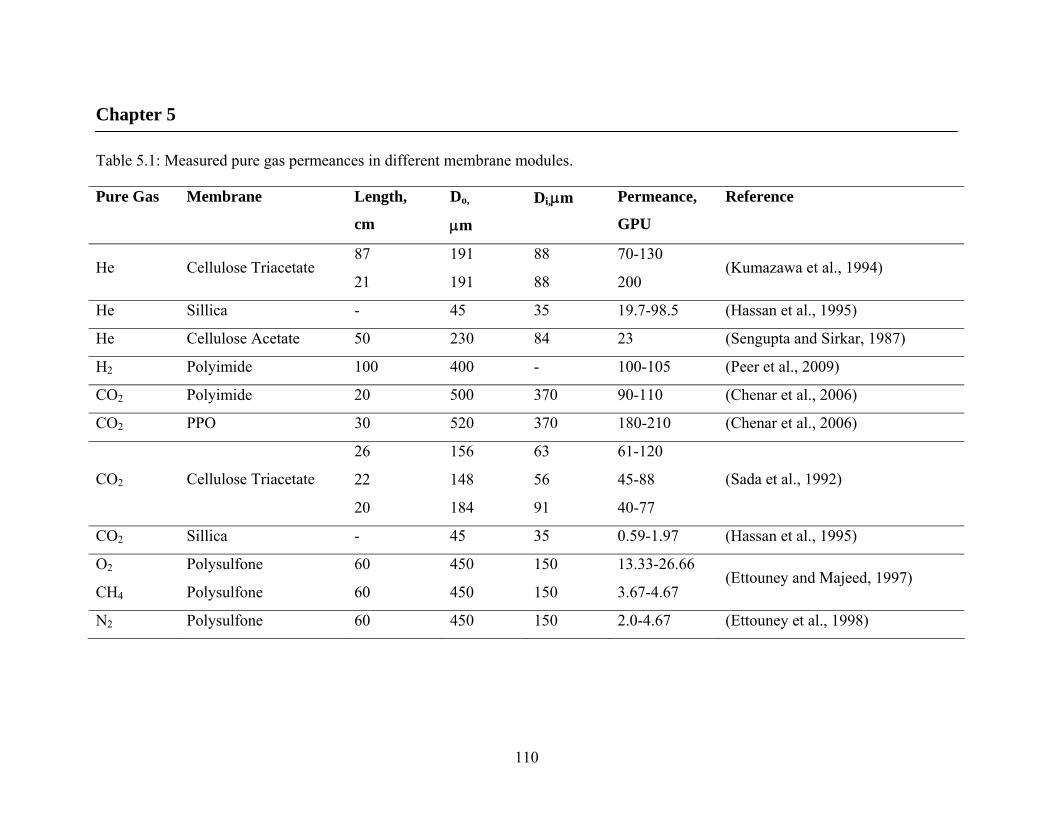
Chapter 5
110
Table 5.1: Measured pure gas permeances in different membrane modules.
Pure Gas Membrane Length,
cm
Do,
m
Di,m Permeance,
GPU
Reference
87 191 88 70-130 He Cellulose Triacetate
21 191 88 200 (Kumazawa et al., 1994)
He Sillica - 45 35 19.7-98.5 (Hassan et al., 1995)
He Cellulose Acetate 50 230 84 23 (Sengupta and Sirkar, 1987)
H2 Polyimide 100 400 - 100-105 (Peer et al., 2009)
CO2 Polyimide 20 500 370 90-110 (Chenar et al., 2006)
CO2 PPO 30 520 370 180-210 (Chenar et al., 2006)
26 156 63 61-120
22 148 56 45-88 CO2 Cellulose Triacetate
20 184 91 40-77
(Sada et al., 1992)
CO2 Sillica - 45 35 0.59-1.97 (Hassan et al., 1995)
O2 Polysulfone 60 450 150 13.33-26.66
CH4 Polysulfone 60 450 150 3.67-4.67 (Ettouney and Majeed, 1997)
N2 Polysulfone 60 450 150 2.0-4.67 (Ettouney et al., 1998)

Chapter 5
111
cellulose triacetate was found to be independent of the pressure, which suggests the
pressure dependence of permeance for helium is not caused by the membrane material. It is
certain that the reduction in the driving force is more at lower pressures, and the membrane
performs close to its intrinsic performance if operated at higher pressures. The pressure
dependence of permeance for faster permeating gases such as helium and hydrogen in
hollow fiber membrane modules were also reported by Wang et al. (1995), Hassan et al.
(1995) and Peer et al. (2009). A 400% increase in Helium permeance was reported by
Hassan et al. (1995) for fine hollow fibers at high pressures.
It has been reported that pure gas permeance of CO2 increases with the feed
pressure and the increasing trend of CO2 permeance with pressure is due to plasticization
effect (Chenar et al., 2006; Omole et al., 2010; Visser et al., 2005). Sada et al. (1992)
observed permeance of CO2 increases with increasing pressure difference for cellulose
triacetate based asymmetric hollow fiber membranes. The dimension of the membrane
modules has been provided in Table 5.1. In order to find out whether the above-mentioned
pressure dependence is caused by the membrane material (cellulose triacetate) or just by
module geometry, permeability coefficient for CO2 through a flat homogeneous membrane
of cellulose triacetate (thickness 50 µm) was measured, and the permeability coefficient of
CO2 was found to increase with an increase in the pressure difference. This result conforms
to the permeation results of the hollow fiber membrane module. However, we calculated
the percentage increases in CO2 permeance for both module geometries and they are
plotted in Figure 5.7. It is found that percentage increase in CO2 permeance for flat
homogeneous membrane is comparable with that of the hollow fiber geometry at low
pressures. It was expected that percentage increase in CO2 permeance with pressure for
both module geometry would be comparable. However, the percentage increase in CO2
permeance in hollow fibers was higher than the flat homogeneous membrane at high
pressures. The discrepancy may be due to reduced effect of pressure build-up on the
apparent permeance for hollow fibers at high pressures.

Chapter 5
112
Pressure difference, atm
0 5 10 15 20 25
Per
c. in
crea
se o
f C
O2
per
mea
nce
, %
0
20
40
60
80
100
Flat homogenousHollow fiber
Fig. 5.7: Percentage increase of CO2 permeance with pressure differences for cellulose triacetate based flat homogeneous and hollow fiber membrane (Sada et al., 1992).
It has been reported that pure gas permeances for moderate to slow permeating
gases (O2, CH4 and N2) remain constant over a certain feed pressure range for both hollow
fibers and flat homogeneous membranes of some glassy polymers (Du et al., 2007; Haraya
et al., 1989; Hughes and Jiang, 1995; Lee et al., 2000; Peer et al., 2009). However,
Ettouney and Majeed (1997) observed that pure gas permeance of O2 and CH4 slightly
increases with feed pressure for polysulfone hollow fibers. Ettouney et al. (1998) also
observed that the permeance of pure N2 slightly increases as feed pressure increases for
polysulfone hollow fibers. However, the permeances of these gases were found essentially
constant in case of flat homogeneous membrane (Haraya and Hwang, 1992; Ilconich et al.,
2003; Lee et al., 2000; Pfromm et al., 1993). This suggests that effect of permeate pressure
build-up could be significant for slower permeating gases too and the membrane will

Chapter 5
113
perform close to its intrinsic properties at high pressures due to minimization of pressure
build-up effect.
To further investigate the pressure build-up effect, we analytically calculated the
average loss in driving force due to pressure build-up inside the fiber lumen for pure gas
permeation of H2 at different pressures. The percentage loss in the driving force at different
pressures was also calculated using Eqn. 5.4.
100% pressureexit permeate - pressureinlet feed
d)(integrate drop pressure total force driving in the loss Perc. (5.4)
The active length of the fiber, inside diameter and permeance were varied independently
for this parametric analysis. It was observed that average loss in the driving force due to
pressure build-up is higher with a longer fiber (Figure 5.8a), with a smaller fiber diameter
(Figure 5.9a) and higher permeability (Figure 5.10a). However, it was also observed that
the percentage loss in driving force is higher at low pressures and the percentage loss of
driving force reduces at higher pressures (Figures 5.8b, 5.9b and 5.10b). It infers that
though pressure build-up increases at higher pressures, the effect of pressure build-up on
membrane performance reduces at higher pressures. Since the percentage loss in driving
force is high at lower pressures, the deviation of apparent permeance of H2 from intrinsic
permeance was found larger at low feed pressures.
It is difficult to measure the internal diameter precisely since the fibers are not
perfectly circular at the open end, and the diameter varies to some extent from one fiber to
another. Since the internal diameter appears as power of four in Hagen-Poiseuille equation,
even a small variation in the internal diameter will affect the calculated permeances greatly.
The calculation was carried out using various internal diameters for all feed pressures and
the value of internal diameter that gives constant permeance with respect to the feed
pressure can be considered the accurate fiber diameter. It was found that when an internal
diameter of 80 µm was used, the permeance was constant with respect to feed pressure
(Figure 5.11). The permeance thus measured was considered the intrinsic permeance, since
the permeance is an intrinsic property of membrane and is not a function of feed pressures.

Chapter 5
114
Feed Pressure, kPa (Abs.)
0 1000 2000 3000 4000 5000 6000 7000 8000
Per
c. lo
ss in
dri
ving
for
ce, %
0
5
10
15
20
25
30
35
40
45
Avg
. los
s in
dri
ving
for
ce, k
Pa
0
300
600
900
1200
1500
0.200.500.801.00
Active Length, m (a)
(b)
Fig. 5.8: (a) The average loss in driving force, and (b) percentage loss in driving force with the feed pressures at different active length.
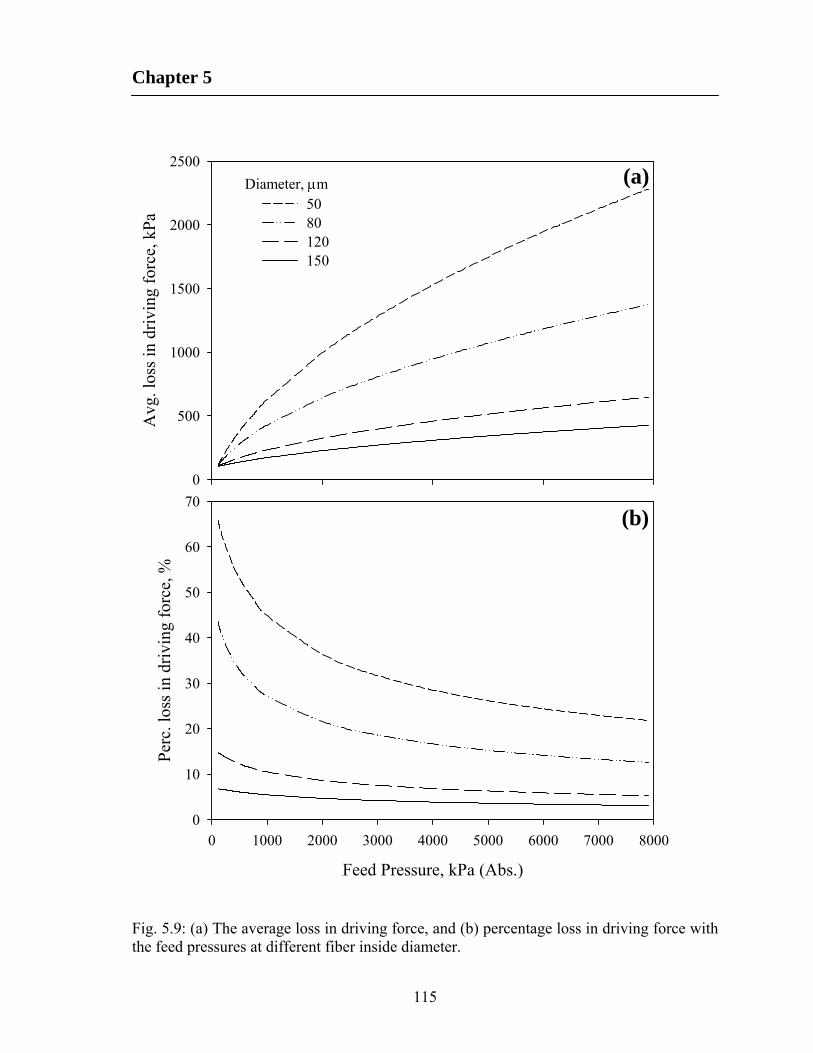
Chapter 5
115
Feed Pressure, kPa (Abs.)
0 1000 2000 3000 4000 5000 6000 7000 8000
Per
c. lo
ss in
dri
ving
for
ce, %
0
10
20
30
40
50
60
70
Avg
. los
s in
dri
ving
for
ce, k
Pa
0
500
1000
1500
2000
2500
5080120150
Diameter, m (a)
(b)
Fig. 5.9: (a) The average loss in driving force, and (b) percentage loss in driving force with the feed pressures at different fiber inside diameter.
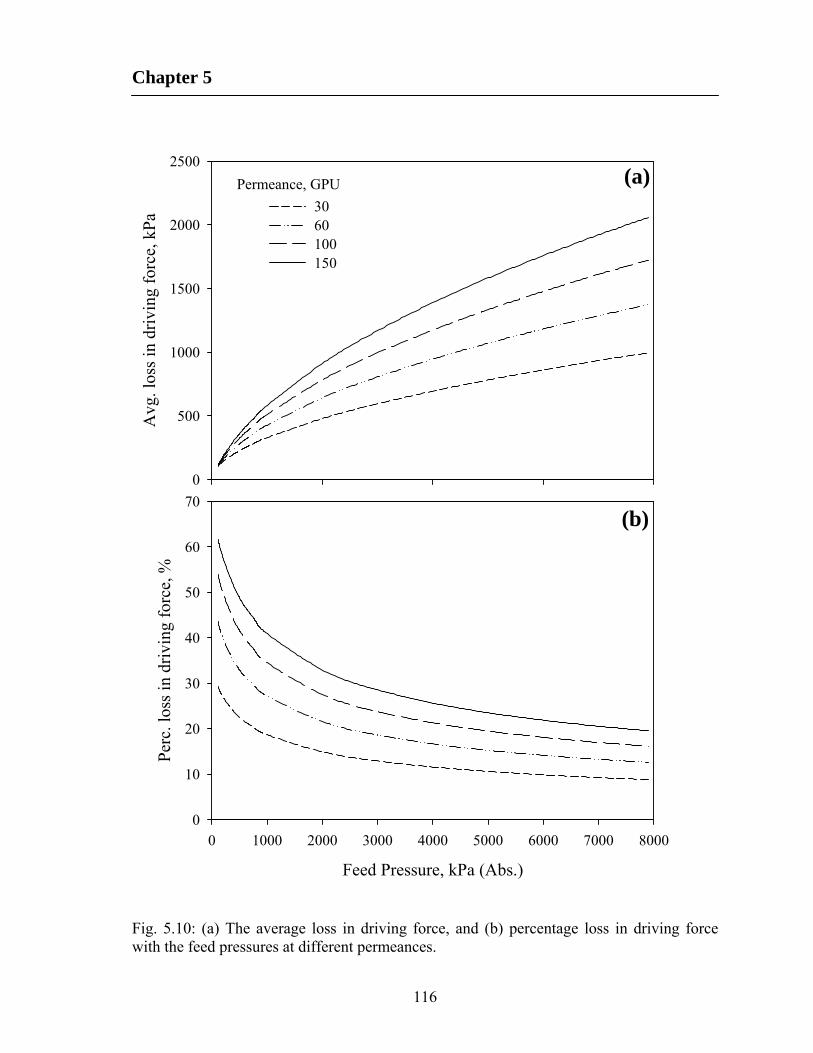
Chapter 5
116
Feed Pressure, kPa (Abs.)
0 1000 2000 3000 4000 5000 6000 7000 8000
Per
c. lo
ss in
dri
ving
for
ce, %
0
10
20
30
40
50
60
70
Avg
. los
s in
dri
ving
for
ce, k
Pa
0
500
1000
1500
2000
2500
3060100150
Permeance, GPU (a)
(b)
Fig. 5.10: (a) The average loss in driving force, and (b) percentage loss in driving force with the feed pressures at different permeances.
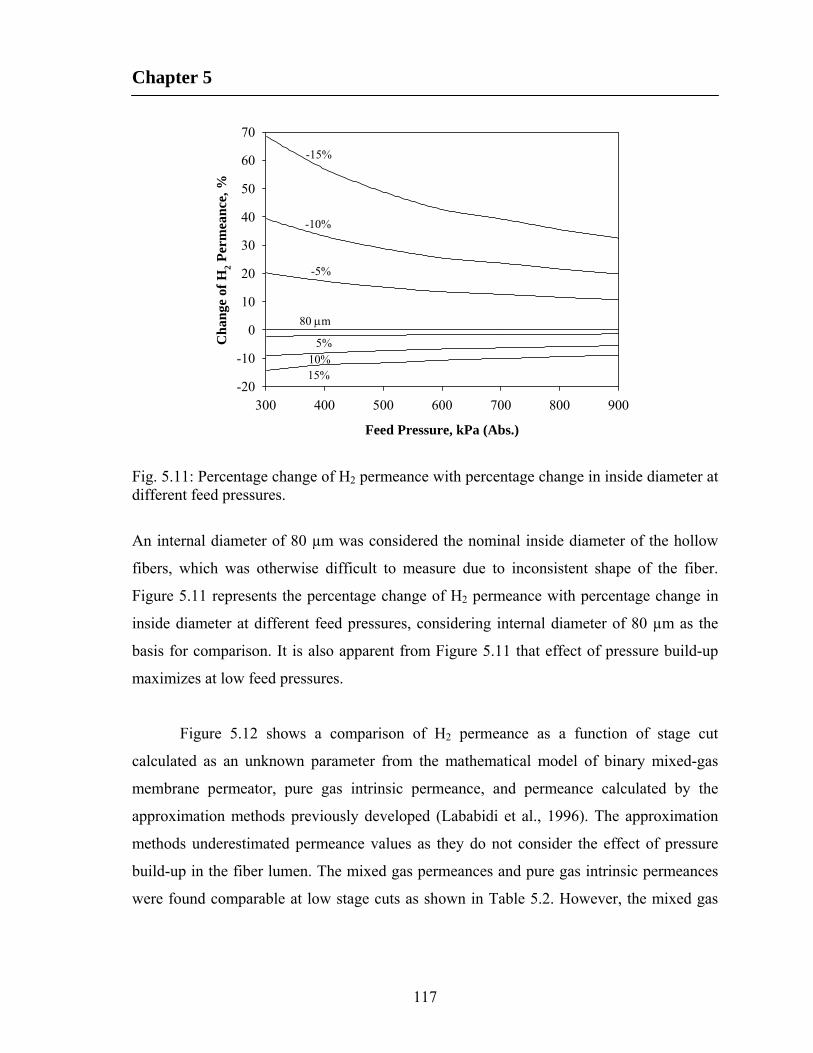
Chapter 5
117
Feed Pressure, kPa (Abs.)
300 400 500 600 700 800 900
Ch
ange
of
H2
Per
mea
nce
, %
-20
-10
0
10
20
30
40
50
60
70
5%10%15%
-5%
-10%
-15%
80 m
Fig. 5.11: Percentage change of H2 permeance with percentage change in inside diameter at different feed pressures.
An internal diameter of 80 µm was considered the nominal inside diameter of the hollow
fibers, which was otherwise difficult to measure due to inconsistent shape of the fiber.
Figure 5.11 represents the percentage change of H2 permeance with percentage change in
inside diameter at different feed pressures, considering internal diameter of 80 µm as the
basis for comparison. It is also apparent from Figure 5.11 that effect of pressure build-up
maximizes at low feed pressures.
Figure 5.12 shows a comparison of H2 permeance as a function of stage cut
calculated as an unknown parameter from the mathematical model of binary mixed-gas
membrane permeator, pure gas intrinsic permeance, and permeance calculated by the
approximation methods previously developed (Lababidi et al., 1996). The approximation
methods underestimated permeance values as they do not consider the effect of pressure
build-up in the fiber lumen. The mixed gas permeances and pure gas intrinsic permeances
were found comparable at low stage cuts as shown in Table 5.2. However, the mixed gas
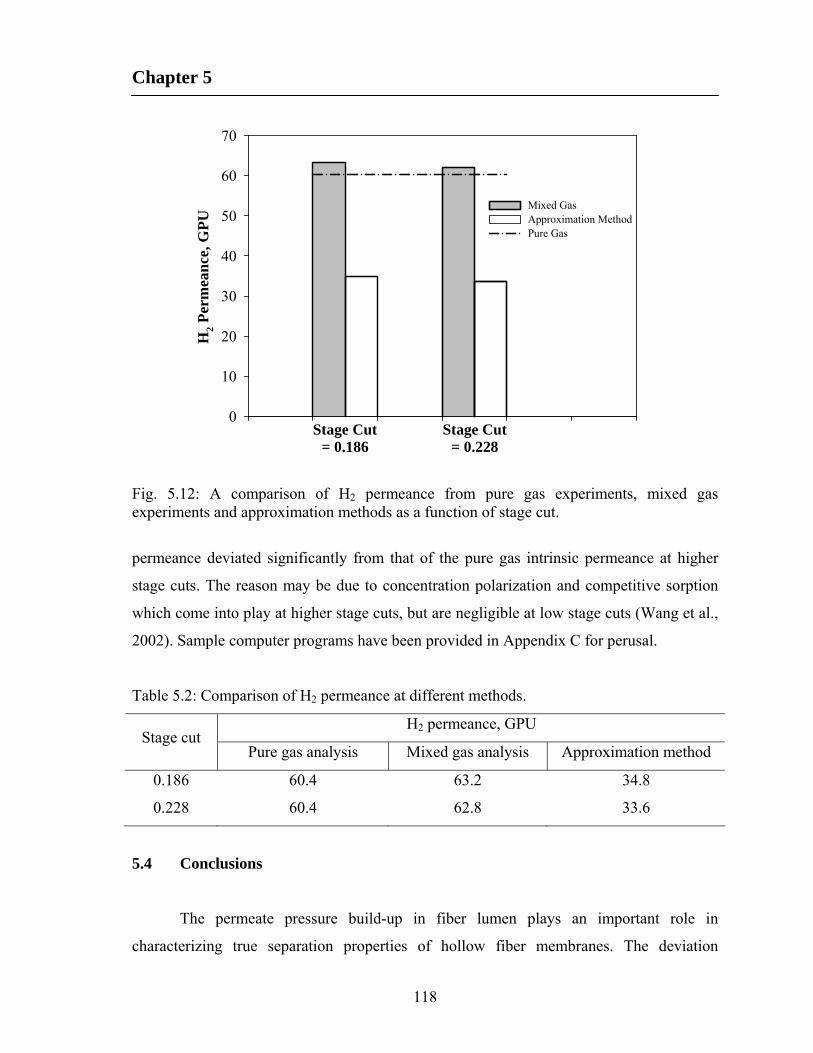
Chapter 5
118
H2
Per
mea
nce
, GP
U
0
10
20
30
40
50
60
70
Mixed GasApproximation MethodPure Gas
Stage Cut= 0.186
Stage Cut= 0.228
Fig. 5.12: A comparison of H2 permeance from pure gas experiments, mixed gas experiments and approximation methods as a function of stage cut.
permeance deviated significantly from that of the pure gas intrinsic permeance at higher
stage cuts. The reason may be due to concentration polarization and competitive sorption
which come into play at higher stage cuts, but are negligible at low stage cuts (Wang et al.,
2002). Sample computer programs have been provided in Appendix C for perusal.
Table 5.2: Comparison of H2 permeance at different methods.
H2 permeance, GPU Stage cut
Pure gas analysis Mixed gas analysis Approximation method
0.186 60.4 63.2 34.8
0.228 60.4 62.8 33.6
5.4 Conclusions
The permeate pressure build-up in fiber lumen plays an important role in
characterizing true separation properties of hollow fiber membranes. The deviation
Chapter 5
119
between intrinsic and apparent permeances of H2 for the long module was found larger at
low feed pressures than at high feed pressures, which infers that the effect of pressure
build-up maximizes at low feed pressures. On the other hand, the effect of pressure build-
up minimizes at high feed pressures as the apparent permeance of H2 for long fiber tends to
approach that of the intrinsic permeance at high feed pressures. It implies that membrane
performs close to its intrinsic separation properties if operated at high feed pressures. The
observations were also supported by some of the pure gas permeation experiments reported
in literature, which were inadvertently overlooked. The average loss and percentage loss in
the driving force due to pressure build-up were estimated to support our reasoning. It was
found that the percentage loss in the driving force decays at high pressures. Although the
average loss in driving force is more at higher pressures, the effect of pressure build-up or
equivocally the percentage loss in driving force minimizes at higher pressures. The inside
diameter in the Hagen-Poiseuille equation was carefully adjusted to determine the nominal
fiber inside diameter, which was otherwise difficult to determine due to inconsistent shape
of the fiber. It was also found that intrinsic permeance evaluated here represents true
separation performance compared to approximation methods.
Chapter 6
120
Application of unsteady state cyclic pressure-vacuum swing permeation
for CO2 separation from flue gas†
6.1 Introduction
Conventional membrane gas separation is operated in a steady-state fashion where
both the feed pressure and the permeate pressure are maintained at constant levels, and the
permeation rate and permeate concentration do not change with time, except at the initial
start-up stage (Wang et al., 2011). The advantages with steady-state operation include easy
start-up and shout-down, simplicity of pressure and flow controls, large throughput of
permeation, and low maintenance requirements. Since transmembrane pressure difference
is the driving force for permeation, the most efficient way to enhance permeation is to
increase the pressure difference across the membrane. The pressure differential across the
membrane can be enhanced by feed pressurization or permeate evacuation. Further
enhancement is possible if both feed pressurization and permeate evacuation are employed
together. However, simultaneous use of a compressor and a vacuum pump to increase the
transmembrane pressure difference is normally not considered rewarding, especially with
“deep” vacuum on the permeate side to suck the permeate.
Membrane gas separations under transient state conditions are rather unexplored.
Enhanced separation as compared to steady-state operation was reported using unsteady
state permeation (Beckman et al., 1991; Higuchi and Nakagawa, 1989; Paul, 1971). The
solution-diffusion mechanism states that the permeability coefficient can be considered to
be equal to the product of solubility coefficient and diffusion coefficient (Baker 2004,
Nunes and Peinemann, 2006). Unfortunately, a trade-off relationship between the
permeability and selectivity often exists for most membrane materials. An upper bound
appears in permeability vs. selectivity plot above which virtually no data exist (Robeson,
1991). This suggests that once the membrane material is fixed, the selectivity
characteristics are essentially fixed if a steady-state operation is used. However, transient
† Part of Chapter 6 will be submitted shortly for publication

Chapter 6
121
and, in particular, steady cyclic operation of the membrane can be used to alter the
selectivity characteristics. The first theoretical study dedicated to a membrane separation
process operating in a cyclic transient fashion was performed by Paul in 1971 to improve
the separation when the mobility selectivity is significantly greater than permselectivity
(Paul, 1971). Transient permeation occurs due to diffusion upon admission of a feed gas to
the membrane, and the permeation rate responds to diffusivity and solubility somewhat
more independently. The feed is admitted intermittently at appropriate time intervals such
that the difference in the desorption fallout rates due to the difference in the permeant
diffusivity can be exploited to effect the separation. Corriou et al. (2008) reported that
cyclic operation could potentially compete with the most selective polymers available to
date, both in terms of selectivity and productivity.
Higuchi and Nakagawa (1989) theoretically studied transient permeation with pulse
upstream pressure as suggested by Paul (Paul, 1971) for air separation to illustrate the
improvement in selectivity over steady-state operation. Beckman et al. (1991, 1993) carried
out a dynamic process with intermittent feed admission on a continuous basis to exemplify
the pulse feeding process for He/CO2 separation. The permeate and residue were removed
periodically and they were synchronized with the feed admission sequence. It was reported
that since the permeate product is collected for a fraction of the time interval, a significant
reduction in the membrane throughput occurs when compared to steady-state permeation. It
was estimated that the time interval for the upstream pressure pulse to operate in a transient
permeation scheme with the current generation of polymeric membranes (gas diffusivities
of the order of 10-8 cm2/s) would be of the order of 10-5 to 10-3 s, which is clearly not
acceptable as the cycle frequency is too fast to be handled by switching valves for any
practical applications (Beckman et al., 1991; Higuchi and Nakagawa, 1989; Koros and
Chern, 1987; Koros and Fleming, 1993). However, Corriou et al. (2008) optimized Paul’s
(Paul, 1971) mode of operation and claimed that synchronous operation would offer the
best performances.
Kao et al. (1991) reported a pressure swing scheme similar to pressure swing
adsorption to carry out transient permeation where the opposite solubility and diffusivity

Chapter 6
122
selectivities were exploited synergistically. LaPack and Dupuis (1994) modified the
process to exploit the differences in the rates of either attainment of steady-state
permeation or fall-off from steady-state permeation. Ueda et al. (1990) reported a cyclic
process comprising of the steps of feed pressurization and permeates evacuation using a
compressor and a vacuum pump separately or using a single pump suitable for both
pressurization and suction. It was reported that due to limited adsorptive capacity of current
polymeric membranes, the transient permeation processes based on solubility or diffusivity
difference for gas separation are unlikely to be practical unless suitable membranes with
sufficient adsorption capacities comparable to the adsorbent used in pressure swing
adsorption are available. Bowser (2004) and Nemser (2005) extended the application of the
cyclic process for controlling emissions of volatile organic compounds (VOC) from solvent
storage.
Feng et al. (2000) reported a novel process for gas separation called pressure swing
permeation, and a bench-scale unit was tested for H2/N2 separation to demonstrate the
effectiveness of the process. The relatively low permeate pressure was elevated by
periodically "pushing" the permeate with the high pressure feed gas, producing a permeate
stream at a pressure as high as the feed pressure, which is otherwise impossible to achieve
with conventional steady-state permeation. Feng and Lawless (2012) recently filed a patent
of unsteady state pressure-vacuum swing process to accomplish feed pressurization and
permeate evacuation with a single pump, thereby enhancing the transmembrane driving
force for permeation. The pressures of the feed and the permeate stream were elevated and
lowered, respectively, using the same pump in a dynamic fashion without the need of
operating a compressor and a vacuum pump simultaneously. The separation is still based
on selective permeability of the membrane; however, the enhanced separation is due to the
increase in the transmembrane pressure differential for permeation and the feed to permeate
pressure ratio. In this study, the theoretical aspects of that novel dynamic process (Feng and
Lawless, 2012) were considered, and a parametric analysis was conducted to elucidate the
working principle. The simulation strategy and solution scheme of such dynamic process
were explained too. CO2 separation for greenhouse gas emission control was used as a
model application to exemplify the feasibility and effectiveness of this process.

Chapter 6
123
6.2 Operating cycle of pressure-vacuum swing permeation assisted with a single
pump
As illustrated in Figure 6.1, the pressure-vacuum swing permeation undergoes
sequential steps of feed pressurization, permeate evacuation, and residue venting. A cycle
Fig. 6.1: Pressure-vacuum swing permeation assisted by a single pump, V1~5 switching valves, P pressure on feed side, p pressure on the permeate side.

Chapter 6
124
can be divided into 5 operating steps, and the schematic of pressure variations (on the feed
and permeate sides) with time are shown in Figure 6.2. Step 1 (time t0 to t1) is referred to as
the “feed pressurization” step. The feed side (volume VF) is quickly charged with a
pressurized gas by using a pump (which functions as a compressor) to reach a pressure of
P1 = Ph, and permeation begins to occur under the transmembrane pressure difference. In
Step 2 (time t1 to t2), the feed is supplied continuously to maintain a constant pressure Ph on
the feed side. The pressure on the permeate side gradually increases as soon as the
permeation occurs due to accumulation of the permeate. During this step, referred to as the
“feed admission/permeation” step (Step 2), the driving force for permeation decreases with
time. Step 2 is terminated when the permeate pressure reaches a certain level (preferably 1
atm) at time t2. Feed admission is stopped as the permeate pressure reaches the prior set
level. Step 3 (time t2 to t3) is mainly to switch the pump from compression to evacuation,
Fee
d si
deP
erm
eate
sid
e
Pre
ssur
e
P P
Fig. 6.2: Pressure profile illustrating the pressure variations during various steps of the process.
Chapter 6
125
and to provide a boost to the transmembrane pressure difference. At this time, the pump is
switched to function as a vacuum pump to suck the accumulated permeate for withdrawal
and collection, and thus the permeate pressure quickly drops to a lower level pv. It occurs
rapidly such that the feed side pressures at the end of Step 2 and at the beginning of Step 3
are comparable i.e., P3 ≈ P2. During Step 4 (time t3 to t4), which is called the
“permeation/permeate evacuation” step, the permeate evacuation continues while
maintaining a low pressure pv, and the permeate is continuously withdrawn and collected.
At this step, the pressure on the feed side begins to decrease because of the permeation.
Thus at time t4 when the pressure on the feed side is sufficiently low that the permeation is
no longer effective for gas separation or when the concentration of the residue has reached
its target value required for the residue product, the residue is vented off and collected at
pressure P0. This step, from time t4 to t5, is called “residue venting” (Step 5). These
sequential operating steps, which represent one cycle of the pressure-vacuum swing
permeation, are repeated to accomplish gas separation continuously but in a cyclic fashion.
Clearly, Steps 2 and 4 (especially Step 4) are primarily responsible for separation. Steps 1,
3 and 5 are assumed to complete very quickly, and for the sake of simplicity the times
taken in these steps are neglected in the formulation of mathematical equations and in
subsequent parametric studies.
A relatively high transmembrane pressure difference (P - p) can be achieved by
exploiting the advantage of feed pressurization and permeate evacuation during the
process. The enhanced transmembrane pressure difference, i.e., the relatively high driving
force for permeation, leads to an increased productivity. Moreover, the degree of
enrichment is also a function of the feed (P) to permeate pressure (p) ratio, and a high (P/p)
pressure ratio obtained by using both the permeate evacuation and feed pressurization
(which can be accomplished by using a single pump) enhances gas separation. It may be
pointed out that in the pressure-vacuum swing permeation assisted with a single pump,
diaphragm pumps or other commonly used positive displacement pumps are well equipped
to handle both compression and evacuation. The swing permeation process appears to be
particularly suitable for low pressure niche applications, i.e., applications that operate

Chapter 6
126
preferably at low to moderate feed pressures as air separation for oxygen enrichment or
flue gas separation for CO2 capture.
6.3 Analysis of the permeation behaviour
The assumptions to formulate the mathematical equations are as follows:
Ideal gas behaviour.
Isothermal operation.
The time lag of permeation due to transient transmission of gas molecules through
the membrane is negligible. The permeate is thus assumed to be received on the
permeate side as soon as permeation takes place.
The permselectivity of the membrane is independent of gas composition and
pressure.
The membrane permeability during the cyclic operation is the same as that at
steady-state.
The gas on the feed side is perfectly mixed, that is, the concentration on the
membrane surface is the same as the bulk concentration of the teed.
On the permeate side, there is no back diffusion from the bulk permeate to the
membrane surface.
6.3.1 Step 1: Feed pressurization
The feed pressurization step is usually very short, and the permeation can be
considered negligible in this step. The feed gas with a known concentration XF (mole
fraction of faster permeating component, i.e., CO2 in flue gas separation) is quickly
admitted to the feed side of the membrane system (with a volume of VF) to reach a total
pressure of P1. The feed side initially contains a portion of the residue gas (at a pressure of
P0 and with a concentration of X0) left from the previous cycle of operation. The
concentration of the gas mixture on the feed side at time t1 is calculated from material
balance:

Chapter 6
127
)( 101
01 XX
P
PXX F (6.1)
Where, X0 = X4. For flue gas separation, the residue venting occurs conveniently at
atmospheric pressure. For flue gas applications, P0 = 101.3 kPa was used in our study.
6.3.2 Step 2: Feed admission/permeation
Consider a permeation system shown in Figure 6.3a that is relevant to this step
(from time t1 to t2) of the cyclic pressure-vacuum swing process. The feed gas is
continuously supplied to maintain a constant pressure of P1 = Ph without removing any
retentate on the feed side. Permeation takes place in a fashion similar to the “dead end”
permeation, and the permeate is accumulated at the permeate side. For the separation of a
binary gas mixture, the permeation rate at a given instant can be written as
)( pYPXAJdt
dQA
A (6.2)
)]1()1([ YpXPAJdt
dQB
B (6.3)
where Q is the quantity of the permeate, J is the gas permeance of the membrane, and A is
the membrane area for permeation. The subscripts A and B represent the fast and slow
Feed volumeP, X, VF
Permeate volumep, YM, VM
Membrane
Feed
PF, XF
Feed volumeP, X, VF
Permeate volumep, YP, VM
Membrane
Permeate
QP, p, YM
(a) (b)
Fig. 6.3: (a) Permeation system with constant feed pressure and varying permeate pressure, (b) Permeation system during permeate evacuation step.
Chapter 6
128
permeating components of a binary gas mixture, respectively. X is the gas concentration on
the feed side feed, and Y is the concentration of permeate on the membrane surface; both
quantities are expressed in terms of mole fractions of the fast permeating component. The
local concentration of permeate leaving the membrane surface is determined by the relative
permeation rates of the two permeating components. This is especially the case for
asymmetric membranes where the microporous substrate prevents local mixing. Thus, Y
can be calculated by
dt
dQ
dt
dQ
dt
dQY BAA (6.4)
Since a constant pressure is maintained on the feed side and no residue is withdrawn during
permeation, the molar flow rate of gas fed to the feed side of the permeator is equal to the
molar permeation rate. On the basis of materials balance, the gas concentration on the feed
side X at a given instant is related to X1 and XF by
)(
)()( 1
RTPV
QXQQXRTPVX
F
AFBAF (6.5)
The bulk concentration of the permeate, YM, is determined by the overall quantity of the
gases accumulated and is given by
)(
)( 1
RTVPQQ
RTYVPQY
MVBA
MMVAM
(6.6)
Where VM is the volume on the permeate side, PV is the permeate pressure when the
permeate side is evacuated, and YM1 is the concentration of the residual permeate retained
from previous step (YM1 = YM0 =YM4). When the vacuum level is sufficiently high, the
amount of the residual permeate left from the previous step is negligible and YM, can thus
be simplified as
BA
AM QQ
QY
(6.7)
The pressure change with time on the permeate side is related to the permeation rate by
M
BA
V
RT
dt
dQ
dt
dQ
dt
dp
(6.8)

Chapter 6
129
Equations (6.2) to (6.8) constitute an initial value problem. The quantities p, X, Y, QA, QB
and YM at any instant can be determined by solving these equations for a given set of initial
conditions.
6.3.3 Step 3: Pump function switch from compression to evacuation
The pump mode is switched from feed compression to permeate evacuation so that
the pressure on the permeate side drops to pv rapidly. The time for this step is very short
and the permeation is neglected during this period.
6.3.4 Step 4: Permeation and permeate evacuation
During this step (from time t3 to t4) the feed admission is stopped, and the permeate
is continuously evacuated. As a result, the pressure on the residue side gradually decreases
due to gas permeation through the membrane, while the permeate side retains a constant
pressure of pv, considering a permeation system shown in Figure 6.3b, the pressure change
on the feed side is related to the permeation rate by
F
BA
V
RT
dt
dQ
dt
dQ
dt
dp
(6.9)
where the permeation rates dQA/dt and dQB/dt can be described by Eqns (6.2) and (6.3),
respectively. Since no residue is withdrawn and no fresh feed is supplied during
permeation, the quantity of an individual gas component on the feed side decreases at the
same rate at which it permeates through the membrane. In addition, the removal rate of the
permeate from the permeator is the same as the overall permeation rate. Based on materials
balance, the following equations can be obtained
)(
)(
3
33
RTVP
QXRTVPX
F
AF (6.10)
dt
dQ
dt
dQ
dt
dQ BAP (6.11)
BA
PA
P
PAP QQ
Q
Q
QY
(6.12)
Chapter 6
130
MPPA Y
dt
dQ
dt
dQ (6.13)
)(
)( 3
RTVp
QRTYVpQY
MV
PAMMVAM
(6.14)
where QP represents the quantity of permeate withdrawn and collected during this step. The
values of X3 and YM3 are assumed to be equal to X2 and YM2, respectively, which have been
calculated in Step 2.
6.3.5 Step 5: Residue venting
In this step, the gas on the residue side, which is enriched with slower permeating
component, is vented for release, and its pressure quickly decreases.
6.4 Application of pressure-vacuum swing permeation to flue gas separation
The following properties with respect to asymmetric cellulose acetate hollow fiber
membranes and operating conditions were chosen for parametric analysis:
CO2 permeance: JA = 63.6×10⁻¹⁰ mol/(m2. s. Pa), or 19.0 GPU
CO2/N2 selectivity: (JA/JB) = 20.9
Membrane area: A = 100 m2
Permeator volume occupied by permeate: VM = 0.01, 0.02, and 0.05 m3
Target value of CO2 concentration in permeate: YM4 = 0.60
Temperature: T = 298 K
The above numerical values of the membrane area and permeate volume were chosen
based on the typical membrane areas packing densities of hollow fiber modules. With
typical fiber dimensions, the membrane area per module volume is in the range of 6,000-
13,000 m2/m3. Moreover, the shell side void volume is close to the tube side void volume
for standard operation (Feng et al., 2000), that is VF = VM. However, when hollow fiber
modules are used, an additional external vessel may be used on either the feed or permeate
side for gas storage in order to slow down depletion of faster permeating component on the
Chapter 6
131
feed side or to slow down the pressure build-up on the permeate side. An equal volume of
VF and VM are used in the calculations unless otherwise specified.
Figures 6.4-6.7 show the sensitivity analysis of all the associated variables of
pressure-vacuum swing permeation process for CO2 removal from flue gas. A base case
configuration (shown as solid lines in the figures 6.4-6.7) has been considered where feed
pressure P1 = 810.6 kPa, membrane area per module volume (A/V) = 5000 m2/m3, permeate
pressure when the permeate side is evacuated pv = 1.33 kPa, and feed to permeate volume
ratio (VF/VM) = 1.0. Figures 6.4a, b and c show the instantaneous permeate pressure,
permeate composition and residue composition at different feed pressures (P1) as a function
of time for Step 2. As expected, as permeation proceeds with time, the residue is gradually
depleted in CO2, and the permeate pressure increases. Interestingly, the concentration of
CO2 in the permeate initially increases and then decreases. This is because the space for
receiving the permeate is initially filled with residual permeate left from the previous step
at a lower concentration. The accumulation of the “freshly” produced permeate, which is at
a higher CO2 concentration, will lead to an increase in the overall permeate CO2
concentration However, as permeation continues, the transmembrane pressure difference
gradually decreases due to build-up of permeate pressure, and the reduction in the driving
force for CO2 permeation will be more significant than the reduction in the driving force
for nitrogen permeation. As a result, the concentration of CO2 in the permeate leaving the
membrane surface gradually decreases with time, causing a reduction in the bulk
concentration of CO2 in the permeate. Figures 6.4a, b and c also show that an increase in
feed pressure P1 tends to increase the CO2 concentration in the permeate, indicating that a
higher feed pressure favours CO2 permeation. Since a fixed feed pressure is maintained, the
molar permeation rate equals the feeding rate during the course of permeation. As a result,
for a given amount of CO2-enriched flue gas going to the permeate, an equal number of
moles of flue gas is supplied at the feed side. As such, a higher feed pressure, which causes
faster permeation, will result in a higher CO2 concentration in the residue (as shown in
Figure 6.4c). In the subsequent studies where the feed pressure is not a controlled variable,
feed pressure P1 = 810.6 kPa is used.

Chapter 6
132
YM
0.55
0.60
0.65
0.70
0.75
Time, s
0 3 6 9 12 15 18
X
0.06
0.08
0.10
0.12
0.14
0.16
p, k
Pa
0
50
100
150
200
506.6810.61114.6
P1, kPa (a)
(b)
(c)
Fig. 6.4: Permeate pressure, permeate CO2 concentration and residue CO2 concentration at different pressures P1 as a function of time for Step 2 of the pressure-vacuum swing permeation process. Other conditions pV = 1.33 kPa, (VF/VM) = 1.0, and (A/V) = 5000 m2/m3.
Chapter 6
133
Figures 6.5a, b and c illustrate the influence of the quantity (A/V) on the separation
performance as a function of time for Step 2, where A is the membrane area and V is the
volume of the permeator for feed or permeate “storage” (assuming VF and VM are the same
and equal to V). Parameters A and V are independent, and they do not affect the separation
behaviour as long as their ratio (A/V) is kept constant. The (A/V) ratio is thus used here as a
single variable to show their combined effects on the separation performance. When other
operating conditions remain unchanged, an increase in the (A/V) ratio will yield a higher
permeate pressure (Figure 6.5a) and lower CO2 concentration if the permeation time is
sufficiently long (Figure 6.5b). However, the permeate concentration initially increases
with an increase in (A/V), which is consistent with the earlier observation on the effects of
feed pressure P1. An increase in (A/V) means an increase in the membrane area packing
density, which increases the overall permeation rate. It appears that as permeation
proceeds, the higher the value of (A/V) is, the sooner the permeate CO2 concentration
reaches its maximum value. Unfortunately, the maximum permeate CO2 concentration is
attained within only a couple of seconds. It will be inappropriate to terminate this step
when the maximum permeate concentration is reached; otherwise the cycle frequency of
the pressure-vacuum swing process will be too fast for practical application. However, for
a given membrane module, when the (A/V) ratio is too high based on the internal space of
the permeator, an external gas tank may be used in order to attain a proper (A/V) value.
Figures 6.6a, b and c show that pv, which is the permeate pressure when the
permeate side is evacuated, has little effects on the separation performance during this
process step (Step 2) if the permeation is allowed to last for more than 15 s. It suggests that
the commonly used diaphragm vacuum/pressure pumps will be adequate for the pressure-
vacuum swing permeation process because a moderate vacuum level will be adequate.
Figures 6.7a, b and c show the calculated results for Step 2 with different (VF/VM)
values as a function of time for permeation over a period of 60 s. The ratio (VF/VM)
represents the relative volumes occupied by the feed and permeate. During this step, the
permeate pressure is set to an upper limit of atmospheric pressure (101.3 kPa), as the
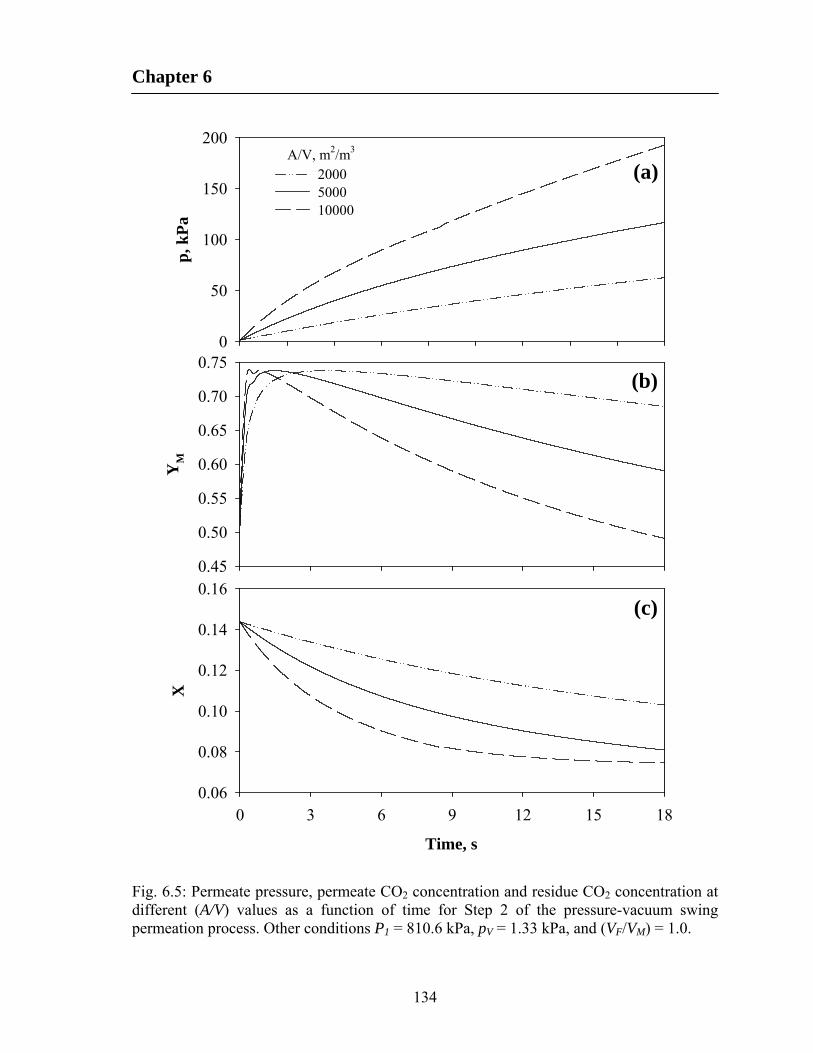
Chapter 6
134
YM
0.45
0.50
0.55
0.60
0.65
0.70
0.75
Time, s
0 3 6 9 12 15 18
X
0.06
0.08
0.10
0.12
0.14
0.16
p, k
Pa
0
50
100
150
200
2000500010000
A/V, m2/m3
(a)
(b)
(c)
Fig. 6.5: Permeate pressure, permeate CO2 concentration and residue CO2 concentration at different (A/V) values as a function of time for Step 2 of the pressure-vacuum swing permeation process. Other conditions P1 = 810.6 kPa, pV = 1.33 kPa, and (VF/VM) = 1.0.

Chapter 6
135
YM
0.4
0.5
0.6
0.7
0.8
Time, s
0 3 6 9 12 15 18
X
0.08
0.10
0.12
0.14
0.16
p, k
Pa
0
40
80
120
160
0.001.336.6640.0
pV, kPa
(a)
(b)
(c)
Fig. 6.6: Permeate pressure, permeate CO2 concentration and residue CO2 concentration at different pV values as a function of time for Step 2 of the pressure-vacuum swing permeation process. Other conditions P1 = 810.6 kPa, (VF/VM) = 1.0, and (A/V) = 5000 m2/m3.

Chapter 6
136
p, k
Pa
0
40
80
120
1/2148
YM
0.3
0.4
0.5
0.6
0.7
0.8
Time, s
0 10 20 30 40 50 60
X
0.00
0.04
0.08
0.12
0.16
VF/VM
(a)
(b)
(c)
Fig. 6.7: Permeate pressure, permeate CO2 concentration and residue CO2 concentration at different (VF/VM) values as a function of time for Step 2 of the pressure-vacuum swing permeation process. Other conditions P1 = 810.6 kPa, pV = 1.33 kPa, and (A/V) = 5000 m2/m3.
Chapter 6
137
permeate at such a pressure can be released readily by venting via a check valve. This will
maximize the transmembrane pressure difference. As expected, at a given time, an increase
in (VF/VM) will increase the concentrations of CO2 in both the residue and permeate. A
relatively large VF means a large reservoir for the storage of feed gas, and thus the gas
composition on the feed side will change less significantly because of the large amount of
feed gas relative to the amount of gas permeated through the membrane. Therefore, a
relatively high driving force for permeation can be sustained for a longer period of time,
which favours the CO2 concentration in the permeate. The permeate pressure, on the other
hand, increases very marginally with an increase in (VF/VM), which is also favourable for
CO2 permeation. This can further be demonstrated by Figures 6.8a and b, which show the
quantities of CO2 and N2 in the permeate as a function of time. With an increase in (VF/VM),
the quantity of CO2 increases, whereas the quantity of N2 decreases.
It may be mentioned that in the calculation the initial values of X1 and YM1 are
supposed to be calculated based on materials balance taking into account of the gases
remaining in the permeator from the previous step. The calculation will involve iterations
over all the process steps. It was found that the calculated gas compositions on both the
residue and permeate sides at the completion of this step (i.e., X2 and YM2) varied very little
for a wide range of final product concentrations under the operating conditions
investigated. It can be inferred from the analysis that the amount of gas left from the
previous step is insignificant. Thus, the initial values could be estimated based on the
product concentrations without performing the cumbersome iterative calculations.
For the sake of calculation, a time interval of 18 s was chosen for Step 2. The
calculated results showed that the general trends for the effects of parameters P1, (A/V), and
pv on the separation performance were very similar to those shown in Step 2 since these
two steps are fundamentally same. It should, however, be emphasized that because a higher
pressure differential across the membrane may be achieved in Step 4, the relative volume
(VF/VM) affects separation performance more significantly. As shown in Figures 6.9a, b and
c, a high concentration of CO2 can be obtained at pv for a long time when a large VF is
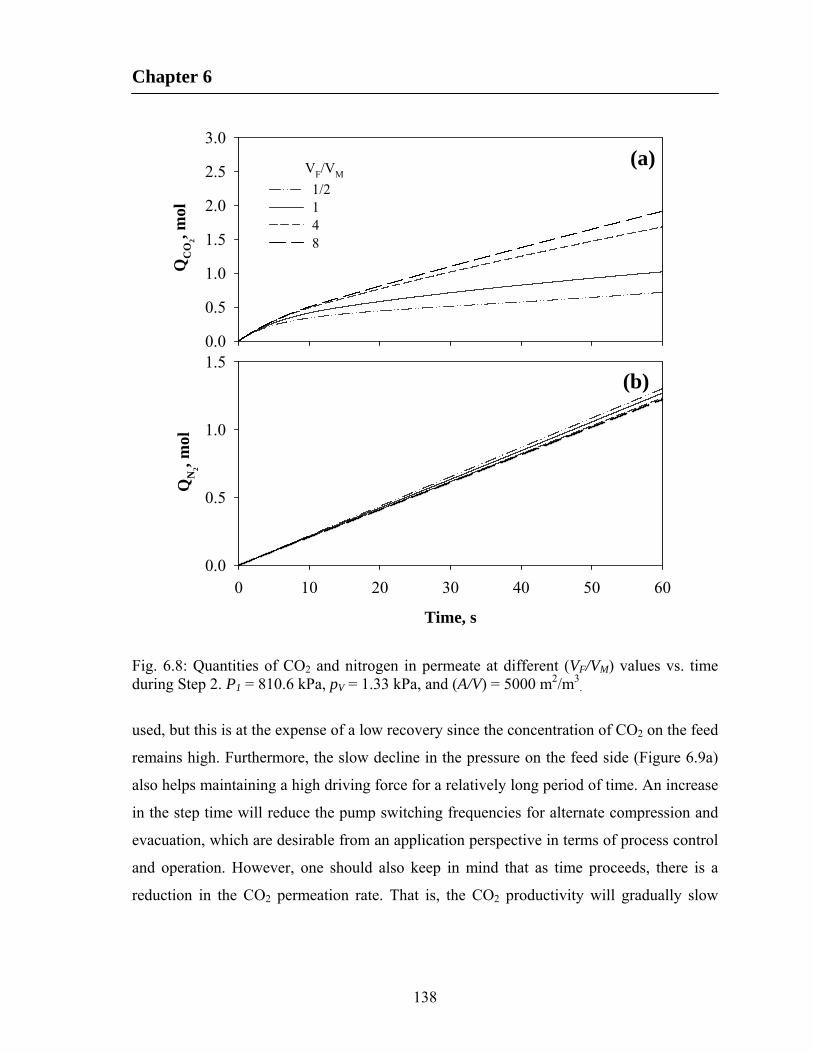
Chapter 6
138
QC
O2, m
ol
0.0
0.5
1.0
1.5
2.0
2.5
3.0
1/2148
Time, s
0 10 20 30 40 50 60
QN
2, mol
0.0
0.5
1.0
1.5
VF/VM(a)
(b)
Fig. 6.8: Quantities of CO2 and nitrogen in permeate at different (VF/VM) values vs. time during Step 2. P1 = 810.6 kPa, pV = 1.33 kPa, and (A/V) = 5000 m2/m3
.
used, but this is at the expense of a low recovery since the concentration of CO2 on the feed
remains high. Furthermore, the slow decline in the pressure on the feed side (Figure 6.9a)
also helps maintaining a high driving force for a relatively long period of time. An increase
in the step time will reduce the pump switching frequencies for alternate compression and
evacuation, which are desirable from an application perspective in terms of process control
and operation. However, one should also keep in mind that as time proceeds, there is a
reduction in the CO2 permeation rate. That is, the CO2 productivity will gradually slow
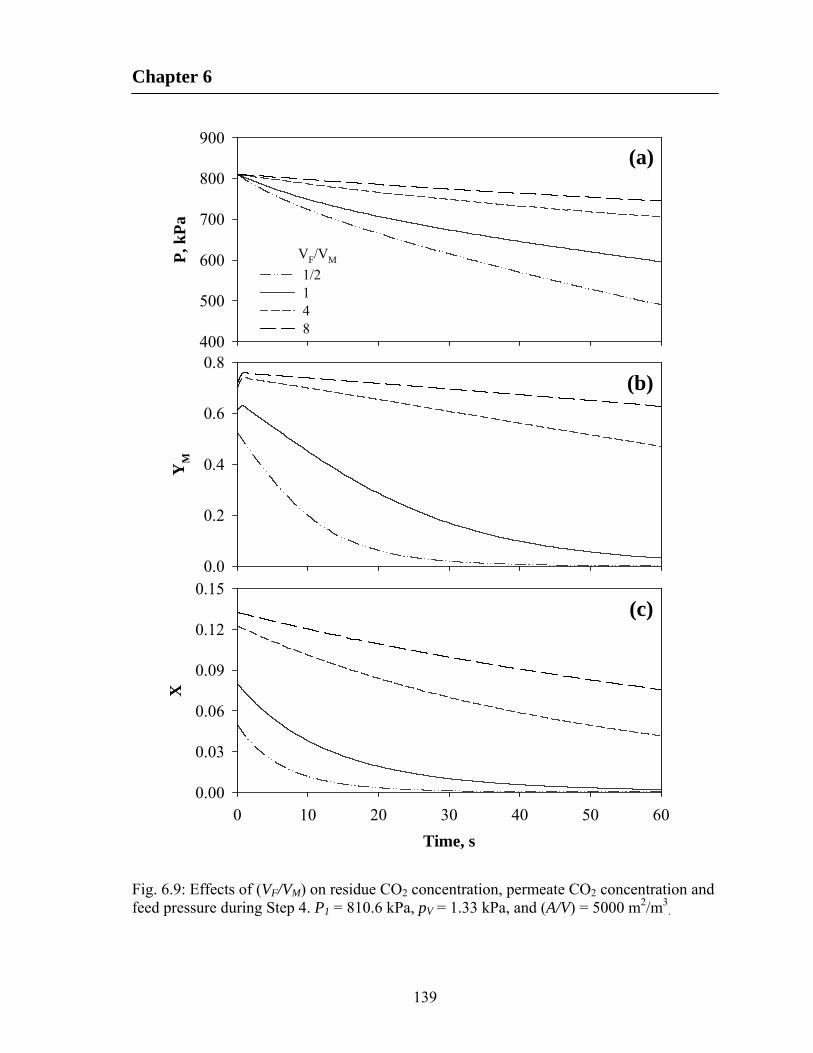
Chapter 6
139
P, k
Pa
400
500
600
700
800
900
1/2148
YM
0.0
0.2
0.4
0.6
0.8
Time, s
0 10 20 30 40 50 60
X
0.00
0.03
0.06
0.09
0.12
0.15
VF/VM
(a)
(b)
(c)
Fig. 6.9: Effects of (VF/VM) on residue CO2 concentration, permeate CO2 concentration and feed pressure during Step 4. P1 = 810.6 kPa, pV = 1.33 kPa, and (A/V) = 5000 m2/m3
.
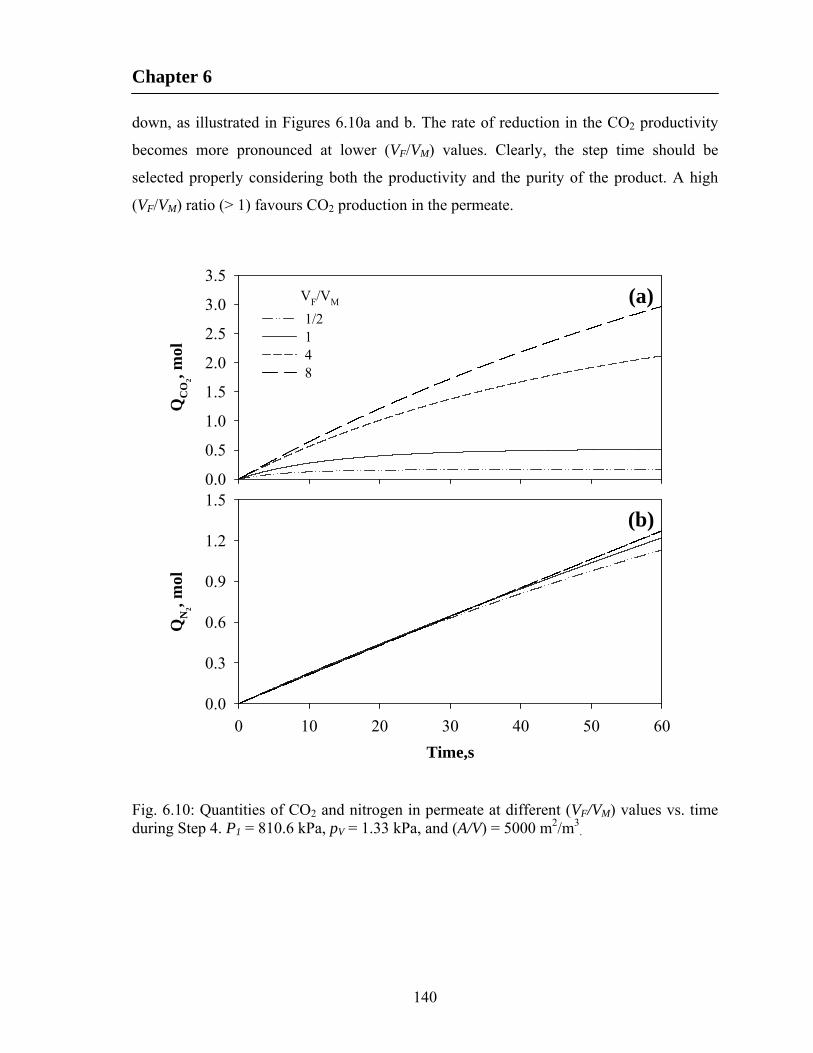
Chapter 6
140
down, as illustrated in Figures 6.10a and b. The rate of reduction in the CO2 productivity
becomes more pronounced at lower (VF/VM) values. Clearly, the step time should be
selected properly considering both the productivity and the purity of the product. A high
(VF/VM) ratio (> 1) favours CO2 production in the permeate.
QC
O2, m
ol
0.0
0.5
1.0
1.5
2.0
2.5
3.0
3.5
1/2148
Time,s
0 10 20 30 40 50 60
QN
2, mol
0.0
0.3
0.6
0.9
1.2
1.5
VF/VM (a)
(b)
Fig. 6.10: Quantities of CO2 and nitrogen in permeate at different (VF/VM) values vs. time during Step 4. P1 = 810.6 kPa, pV = 1.33 kPa, and (A/V) = 5000 m2/m3
.
Chapter 6
141
6.5 Performance of pressure-vacuum swing permeation and comparison with
conventional membrane process
The parametric analysis indicates that the pressure-vacuum swing permeation is
feasible at least for the aforementioned applications, where the membrane permselectivity
is generally low and that an increase in the transmembrane pressure will have a significant
impact on the separation performance. As a case study, the overall separation performance
of the pressure-vacuum swing permeation was evaluated for separation of CO2 from flue
gas at 50 and 60 mol% CO2 using the membrane properties and operating conditions
mentioned as the base case for flue gas application (also shown in Table 6.1). Other
membrane and operating parameters were selected based on the above calculations for
Steps 2 and 4, which are the two primary steps of the cyclic process. The results are
summarized in Table 6.1. In the calculation, the time for Step 2 was determined so that at
the end of this step the permeate pressure would reach atmospheric pressure, and the time
for Step 4 was determined such that the overall concentration of CO2 in the accumulated
permeate product would reach the desired target purity. Unlike the transient permeation
processes based on differences in sorption uptake rates or desorption fall off rates, the
present process is based on permselectivity of the membrane and a much longer cycle lime
can be used. It is obvious that the cycle time can be increased further by prolonging the
time of Step 2; however, a substantially extended period will render the permeation similar
to the conventional steady-state permeation where the feed and permeate pressures are Ph
and P0, respectively, thereby losing the advantage of using the swing process to enhance
the driving force for permeation.
The data in Table 6.1 show that to attain a given CO2 concentration in the permeate
product, an increase in (VF/VM) will increase the CO2 recovery, while the productivity (that
is, the mean flow rate of the CO2 enriched product per membrane area) also increases. In
conventional membrane gas separation, a high recovery is often accompanied with a lower
productivity for a given product purity (Liu et al., 2005). However, in pressure-vacuum
swing mode of permeation, a high (VF/VM) ratio favours both the CO2 recovery and

Chapter 6
142
Table 6.1: Performance of pressure-vacuum swing permeation for CO2 separation from flue gas.
Purpose of separation CO2 separation
Volume Ratio (VF/VM) 8/1 4/1 1/1 1/2
Desired CO2 concentration (mol %) 50 60 50 60 50 60 50 60
Cycle time (s) 129.6 86.4 68.2 46.6 23.0 18.0 18.3 -
Mean flow rate of product (mol/m2.h) 2.32 2.49 2.16 2.40 1.97 2.02 1.66 -
Recovery of target component (%) 95.23 85.73 81.20 77.46 63.9 59.26 57.54 -
A = 100 m2; VM = 0.02 m3; Ph = 810.6 kPa; pv = 1.33 kPa
Table 6.2: Performance of steady-state permeation for CO2 separation from flue gas.
Purpose of separation Case 1 Case 2
Feed and permeate pressures Feed 810.6 kPa, permeate 101.3 kPa Feed 101.3 kPa, permeate 1.33 kPa
Desired CO2 concentration (mol %) 50 60 50 60
Flow rate of product (mol/m2.h) 1.49 1.82 0.21 0.26
Recovery of target component (%) 65.04 25.90 96.48 86.21
A = 100 m2

Chapter 6
143
productivity in the permeate (Figure 6.11). It is interesting to note that using a larger value
of (VF/VM) allows a longer cycle time to be used for the pressure-vacuum swing
permeation, which is desired from an operating standpoint as less frequent valve switching
will be favourable for process control and operation. On the other hand, for a given (VF/VM)
value, the pressure-vacuum swing process will have a higher productivity for a higher
product concentration, but the recovery will be lowered. It should be pointed out that
because (VF/VM) determines the instantaneous CO2 concentration on the feed side, there
exists a lower limit in (VF/VM) below which a target CO2 concentration in the product
cannot be achieved. Improved recovery and productivity in pressure-vacuum swing
permeation relative to conventional steady-state permeation can be seen from Figure 6.11.
However, when a very small cycle time is used to increase the product purity, the recovery
and productivity drastically falls. Permeation does not work well for short cycle times and
the pressure-vacuum swing permeation may become unstable. There exists a purity limit
for a given (VF/VM) and given feed CO2 beyond which the mean product flow rate falls due
to insufficient permeation.
Permeate CO2, mol fraction
0.2 0.3 0.4 0.5 0.6 0.7 0.8
Rec
over
y, %
0
20
40
60
80
100
120
Steady statePressure-vacuum swing
Permeate CO2, mol fraction
0.2 0.3 0.4 0.5 0.6 0.7 0.8
Pro
duct
flo
w r
ate,
mol
/m2 .h
r
1.0
1.5
2.0
2.5
3.0(a) (b)
Fig. 6.11: Performance comparison of steady-state permeation and pressure-vacuum swing permeation for flue gas separation application, (a) Recovery vs. permeate CO2 purity, and (b) Mean product flow rate vs. permeate CO2 purity.
Chapter 6
144
The advantages of using pressure-vacuum swing permeation can be illustrated by
comparing with the separation performance that would be obtained with conventional
steady-state operations. Table 6.2 shows the productivity and recovery for the same CO2
concentration (i.e., 50 and 60% CO2) at steady-state permeation with a counter-current
feed/permeate flow configuration using (1) a single compressor to deliver a constant feed
pressure of 810.6 kPa while the permeate is withdrawn at atmospheric pressure, or (2) a
single vacuum pump to maintain a constant permeate pressure of 1.33 kPa while the feed
flue gas is at atmospheric pressure. The calculation was performed using the same
permeability and selectivity while neglecting the permeate pressure build-up on the
permeate side. It is shown that for a given product concentration, the productivity in case
(2) is much lower than that in case (1), whereas case (2) tends to have a higher recovery.
The separation performance in both cases (1) and (2) are inferior to the separation achieved
using the pressure-vacuum swing permeation process. To produce 50% CO2 in the
permeate using the pressure-vacuum swing permeation, a high VF/VM (VF/VM > 1) favours
both the recovery (81.2 - 95.2%) and productivity (2.16-2.32 mol/m2.h) as compared with
case (1) in Table 6.2 (recovery 65%, and productivity 1.49 mol/m2.h). Recovery in case (1)
is still comparable with that of low VF/VM (VF/VM 1), however, productivity (1.66-1.97
mol/m2.h) in pressure-vacuum swing permeation process is much more that of the
conventional process. The scope for pressure-vacuum swing process appears to be more
promising as more and more permselective membranes become available (Hosseini et al.,
2007; Li et al., 2008).
6.6 Conclusions
A parametric analysis of operating parameters associated with pressure-vacuum
swing permeation for CO2 separation from flue gas was presented. The novel and
innovative unsteady state process mode was carried out in a cyclic fashion by alternately
pressurizing the feed and evacuating the permeate with a single pump capable of both
pressurization and suction. The cyclic pressure-vacuum swing permeation increases the
transmembrane pressure difference and the feed to permeate pressure ratio, resulting in

Chapter 6
145
enhanced separation that is superior to the conventional steady-state operation. The relative
volume of the feed and permeate sides of the membrane unit was shown to be an important
parameter in the process design. Identifying optimal volume ratio is essential for efficient
separation depending on whether the permeate or the retentate is the desired product. The
feasibility and effectiveness of such a dynamic process was exemplified using CO2
separation from flue gas as model application. The pressure-vacuum swing permeation
improved CO2 recovery and productivity by 25% and 45%, respectively, compared to the
conventional membrane gas separation processes.

Chapter 7
146
Effectiveness of membrane processes and feasibility of membrane-amine
hybrid systems for post-combustion CO2 capture†
7.1. Introduction
Amine absorption is regarded as a promising method to capture CO2 from flue
gases because of dealing with low concentration, low pressure, and large flow of exhaust
gases. However, amine units use more energy when the CO2 concentration increases.
Major R&D efforts are currently going on worldwide to improve this technology. A
substantial part of the energy requirement consists of heat duty to regenerate the used
solvent at the reboiler. Membranes, on the other hand, use partial pressure as the driving
force for separation and are most effective for feed gas at high concentrations of CO2.
Membranes can easily be combined with amine absorption to yield hybrid processes with
cost/performance advantages that neither process could achieve individually. The hybrid
systems take the advantage of bulk CO2 removal properties of membranes while the amine
is used for the final cleanup to achieve the required specification.
Several membrane amine hybrid systems are currently operating around the world
for processing natural gas. Some of the noteworthy EOR projects in Texas employ a
combination of membranes and amine technologies to produce pipeline quality natural gas
and at the same time recover CO2 (Chowdhury, 2012; Echt, 2002). The economic viability
of membrane-amine hybrid processes for the removal of acid gases (i.e., CO2, and H2S)
from crude natural gas has been investigated (Bhide et al., 1998; Echt, 2002; McKee et al.,
1991). A high CO2 content in the feed gas generally is a good indicator for the preferential
use of membranes and/or hybrid systems. The CO2 content in EOR plants is as high as 70%
or more (Echt, 2002). McKee et al. (1991) reported that hybrid systems can be economical
at lower CO2 concentrations than is normally found in EOR applications using a feed
stream of moderate flow rate and no H2S. Bhide et al. (1998) also conducted a process
design and economic assessment study for a hybrid process for sweetening crude natural
† Part of Chapter 7 will be submitted shortly for publication
Chapter 7
147
gas. In a two-in-series arrangement, membrane separation was used first for the bulk
removal of the acid gases followed by gas absorption/stripping process using
diethanolamine (DEA) for final purification to meet pipeline specifications. It was reported
that gas absorption process alone is not competitive with either the hybrid process or the
membrane process alone under most of the conditions. Echt (2002) conducted a techno-
economic analysis of hybrid systems and reported substantial cost benefits for processing
large volume of natural gas.
The potential of using a membrane-amine hybrid process for post-combustion CO2
capture has not been well addressed in the open literature, except in quite few cases
(Chowdhury, 2012). Recently, Chowdhury (2012) reported that membrane-amine hybrid
systems might not be a good choice for the post-combustion CO2 capture based on his
study for post-combustion CO2 capture using the two different unit operations arranged in
parallel and in series. A varying portion of the feed stream was introduced to the individual
unit operations rather than taking advantages of the bulk separation properties of membrane
processes. Belaissaoui et al. (2012) studied hybrid membrane-cryogenic processes for post-
combustion CO2 capture and reported that the energy requirement of the hybrid process is
lower than the energy required for a standalone cryogenic process, and the overall energy
requirement of the hybrid process could possibly be significantly decreased if a less
stringent capture constraint is taken. A case study of hybrid process combining oxygen
enriched air combustion and membrane separation for post-combustion CO2 capture was
investigated from an energy requirement perspective (Favre et al., 2009a). It was reported
that the hybrid process can lead to a 35% decrease in the energy requirement compared to
oxycombustion within certain operating conditions and limitations. In this study, a
technical analysis of post-combustion CO2 capture from flue gases with competing
technologies such as membranes, amine absorption and their hybrid processes was
conducted. Several cascade configurations of hollow fiber membranes, and amine
absorption with MEA and DEA as solvents were studied independently for a target
recovery and purity, both for the product value of CO2 (e.g., enhanced oil/coal bed methane
recovery) and for environmental reasons (reducing the greenhouse effect). A membrane-
amine hybrid process was studied thereafter for the design specifications. The study was
Chapter 7
148
conducted to find the extent of optimal conditions for which the aforementioned
technologies are best suited.
7.2. Design basis and process description
7.2.1 Membrane processes
The design of membrane gas separation processes involves the determination of
appropriate permeator arrangements/configurations as well as specification of process unit
(i.e., module) sizes and operating conditions. A single stage arrangement with feed
compression and/or permeate vacuum or both (without any recycle stream) is the most
common and simplest design consideration. However, a high purity and recovery of the
desired product sometimes may require the use of stream recycle and multi-stage
configurations (Koros and Chern, 1987). The modeling and simulation strategy described
in Chapters 3 and 4 were used in this Chapter to simulate single stage and multi-stage
configurations. The model described earlier could be implemented in Aspen Plus® as a
membrane unit (custom unit operation model for hollow fiber membrane module, which is
not available in the standard version of Aspen Plus®) to design, simulation and
optimization of the overall membrane and hybrid processes. The procedures and
modifications required are reported by Chowdhury (2012). However, a multi-stage
permeator design involves a complex set of differential and algebraic equations, and the
computation complexity increases when some of the streams are recycled. Moreover, since
the convergence of the process flowsheet in amine scrubbing is a nontrivial exercise due to
the highly nonlinear nature of the process and the large recycle stream involved, we opted
not to study the hybrid process in Aspen Plus® for simplicity.
It is generally agreed that the membrane area and energy consumption are the key
factors determining the cost of membrane processes. Flue gas from coal-fired power plants
and cement plants were taken as the basis to investigate effectiveness of membrane
processes. Details of the flue gas characteristics of a 500 MW coal-fired power plant and
St. Marys cement Inc. can be found in Chowdhury (2012) and Hassan (2005), respectively.
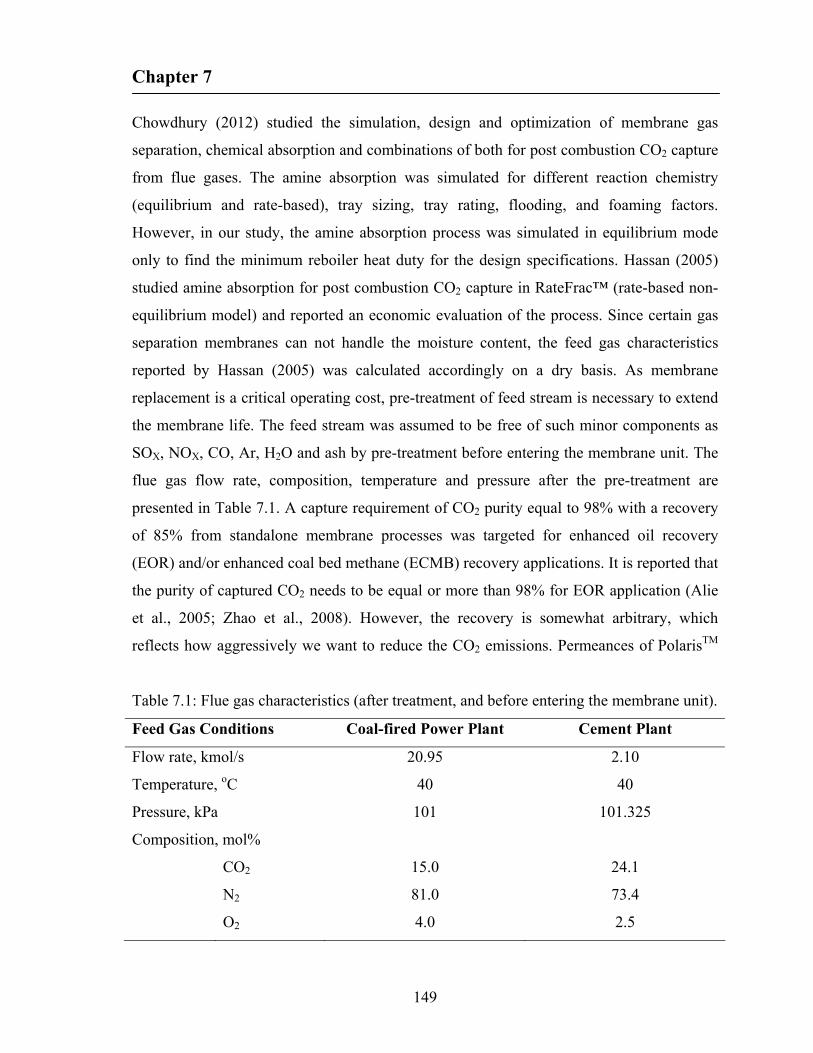
Chapter 7
149
Chowdhury (2012) studied the simulation, design and optimization of membrane gas
separation, chemical absorption and combinations of both for post combustion CO2 capture
from flue gases. The amine absorption was simulated for different reaction chemistry
(equilibrium and rate-based), tray sizing, tray rating, flooding, and foaming factors.
However, in our study, the amine absorption process was simulated in equilibrium mode
only to find the minimum reboiler heat duty for the design specifications. Hassan (2005)
studied amine absorption for post combustion CO2 capture in RateFrac™ (rate-based non-
equilibrium model) and reported an economic evaluation of the process. Since certain gas
separation membranes can not handle the moisture content, the feed gas characteristics
reported by Hassan (2005) was calculated accordingly on a dry basis. As membrane
replacement is a critical operating cost, pre-treatment of feed stream is necessary to extend
the membrane life. The feed stream was assumed to be free of such minor components as
SOX, NOX, CO, Ar, H2O and ash by pre-treatment before entering the membrane unit. The
flue gas flow rate, composition, temperature and pressure after the pre-treatment are
presented in Table 7.1. A capture requirement of CO2 purity equal to 98% with a recovery
of 85% from standalone membrane processes was targeted for enhanced oil recovery
(EOR) and/or enhanced coal bed methane (ECMB) recovery applications. It is reported that
the purity of captured CO2 needs to be equal or more than 98% for EOR application (Alie
et al., 2005; Zhao et al., 2008). However, the recovery is somewhat arbitrary, which
reflects how aggressively we want to reduce the CO2 emissions. Permeances of PolarisTM
Table 7.1: Flue gas characteristics (after treatment, and before entering the membrane unit).
Feed Gas Conditions Coal-fired Power Plant Cement Plant
Flow rate, kmol/s 20.95 2.10
Temperature, oC 40 40
Pressure, kPa 101 101.325
Composition, mol%
CO2 15.0 24.1
N2 81.0 73.4
O2 4.0 2.5

Chapter 7
150
membrane developed by MTR (Membrane Technology and Research, Inc.) were taken in
the calculations for the study. The permeances of PolarisTM membrane are 1000, 50 and 20
GPU for CO2, O2 and N2, respectively, with CO2/N2 selectivity of 50 (Lin et al., 2007).
These values will be used throughout the study if not stated otherwise. The extent of
separation that can be achieved by a single stage membrane process with current and future
generation membranes was also evaluated.
7.2.2 Amine absorption processes
The amine absorption process was modeled in Aspen Plus® and targeted to capture
85% of the CO2 with a purity requirement of 98% for a comparison with standalone
membrane processes. The case study includes simulating the amine process for two
solvents, i.e., monoethanolamine (MEA) and diethanolamine (DEA) for acid gas removal
from flue gas. A comparison of popular solvents in chemical solvent based separations and
strategies to reduce energy consumption through engineered and formulated solvents could
be found elsewhere (Chakma, 1997; Chakma, 1999; Mofarahi et al., 2008). The
conventional MEA process flowsheet is shown in Figure 7.1. The flue gas containing CO2
enters the absorber and contacts the aqueous solution of MEA flowing countercurrently to
the flue gas stream. CO2, a weak base, reacts exothermically with MEA, a weak acid, to
form a water soluble salt. The ‘rich’ MEA stream exits the absorber at the bottom of the
column. It is then preheated in a heat exchanger by the lean MEA stream leaving from the
bottom of the stripper and enters the stripper where, with further addition of heat, the
reaction is reversed. The CO2, having been stripped off from the MEA, leaves through the
top of the stripper column. The ‘lean’ MEA is then recycled back to the absorber. A
detailed description of conventional amine processes could be found elsewhere (Abu-Zahra
et al., 2007; Alie et al., 2005; Aroonwilas and Veawab, 2009; Chowdhury, 2012; Desideri
and Paolucci, 1999; Geuzebroek et al., 2004; Hassan, 2005; Hassan et al., 2007; Lee et al.,
2009; Mofarahi et al., 2008; Romeo et al., 2008; Singh et al., 2003).
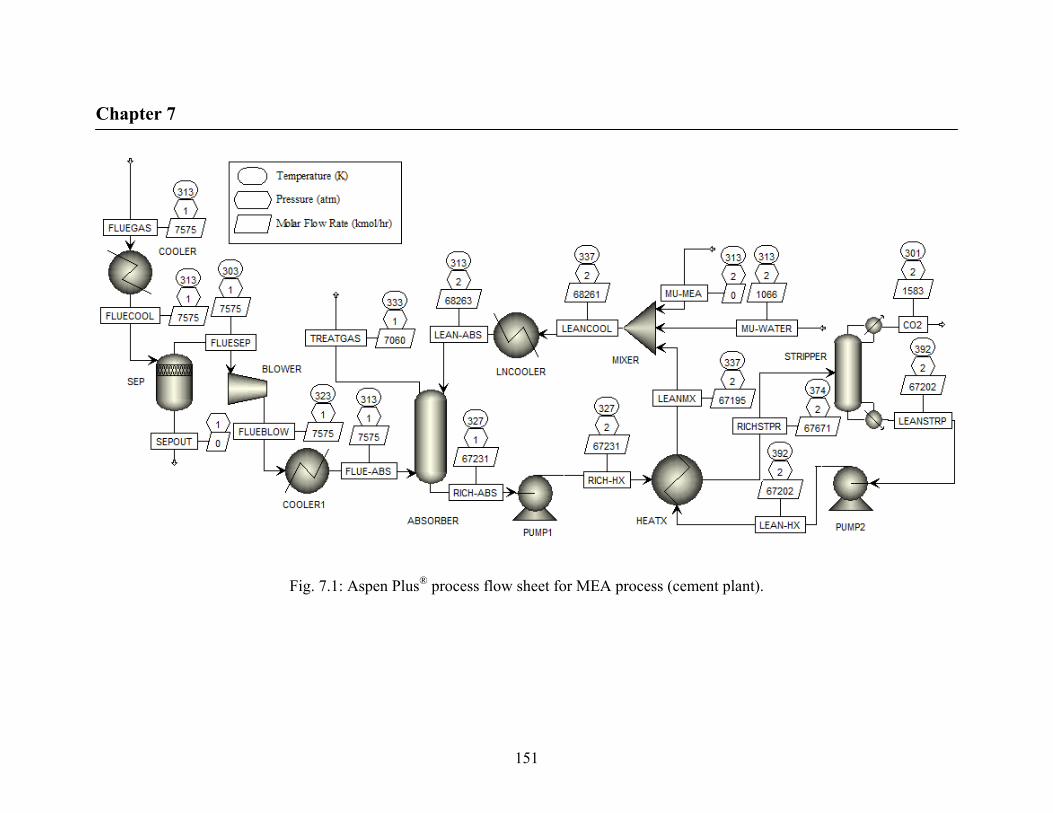
Chapter 7
151
Fig. 7.1: Aspen Plus® process flow sheet for MEA process (cement plant).
Chapter 7
152
There are several electrolyte-based physical property models in Aspen Plus® such
as emea, kemea, mea and kmea that specify the property method and solution chemistry for
processes containing CO2, H2O and MEA. These property package inserts use the
electrolyte-NRTL method to calculate the fluid transport and thermodynamic properties.
Electrolyte-NRTL is an activity coefficient model-based property method that uses the
electrolyte-NRTL model for the liquid phase and Redlich-Kwong equation of state for the
vapour phase (Harun, 2012). In this work, emea property insert was selected in modeling
the MEA absorption process in Aspen Plus®. The emea package was inserted in the Aspen
Plus® property set prior to the development of the entire flowsheet. It is applicable for the
systems containing CO2-H2S-H2O-MEA with a temperature up to 120oC and a MEA
concentration up to 50%. Since N2 and O2 are not included in the emea insert package, they
were added as individual components. CO2, N2 and O2 were defined in the system to obey
Henry’s law. The emea property package assumes that the reaction is at equilibrium. For
simulations involving DEA, the property package edea was selected. The edea property
insert is applicable for the systems containing CO2-H2S-H2O-DEA at temperatures up to
140oC and DEA concentrations up to 30%. The accepted range of process conditions and
parameters for each amine (i.e., amine degradation temperature, lean loadings) were
cautiously monitored during the simulation.
An Aspen Plus® design specification was imposed which adjusted the lean solvent
(i.e., MEA) flow rate in a standalone absorber to achieve a CO2 recovery of 85% (i.e., 15%
CO2 in the treated gas). Inside the stripper, there were two design specifications. The first
one was to achieve a desired mass flow of CO2 in the distillate (commonly 85% of the CO2
in the flue gas, calculated from the absorber design specification) by varying the bottom to
feed ratio at the bottom of the stripper. The other specification was to achieve a carbon
dioxide purity (typically 98% CO2) in the product stream by varying the molar reflux ratio
at the top of the stripper. These specifications, once met, would render the desired loading
in Lean MEA (LEANSTRP or LEAN-ABS) stream. Calculator blocks were added where
necessary to check the loadings. In particular, the energy required by the stripper reboiler
overshadows the annualized capital costs of the capture plant (Alie et al., 2005; Desideri
and Paolucci, 1999; Singh et al., 2003). Therefore, minimizing the reboiler heat duty is
Chapter 7
153
important in this process. The number of stages, lean loadings and reboiler temperature
were varied to find the minimum reboiler heat duty.
Several factors contribute to the simulation difficulties in a MEA process. Firstly,
we used the Aspen Radfrac model in equilibrium mode for the absorber and the stripper.
Though Radfrac assumes equilibrium stages in equilibrium mode, it is a rigorous model
that behaves in a nonlinear fashion. Thus, the absorber and stripper models are sensitive to
changes in their respective input streams. Moreover, because of the recycle structure of the
flowsheet, it is extremely difficult to converge the MEA flowsheet with a closed recycle
stream. Since most of the MEA solution entering the stripper is being recycled, a large
number of iterations is necessary to converge the large tear streams. A very good initial
estimate of the lean MEA flow and composition is desired since an excess of solvent in the
absorber can cause divergence. It is difficult to obtain an initial estimate to initialize the
stripper, and reasonable ranges for the design specifications in the stripper are also required
for ease of convergence. To overcome the difficulties in converging the flowsheet, the
flowsheet decomposition method by Alie et al. (2005) was adopted. Initially, the
standalone absorber model was simulated, followed by absorber and stripper integrated
model. Finally, the recycle stream was connected to the absorber and stripper integrated
model. This approach determines a very good first initial guess for each step, and the
results from the previous step become the initial guesses for the subsequent steps.
Decomposing the flowsheet simplifies the modelling effort, provides a good insight into
the process and also provides a good starting point for coupling the process.
7.2.3 Hybrid membrane processes
The hybrid process was also targeted to capture 85% of the CO2 with a purity of
98% for a comparison with the standalone membrane processes and MEA processes. A
fraction of the fed CO2 was recovered from the membrane processes and the residual CO2
was captured through the MEA processes to count on an overall 85% recovery. The design
specifications for the MEA processes were modified accordingly. The total energy required
for the hybrid processes was calculated.
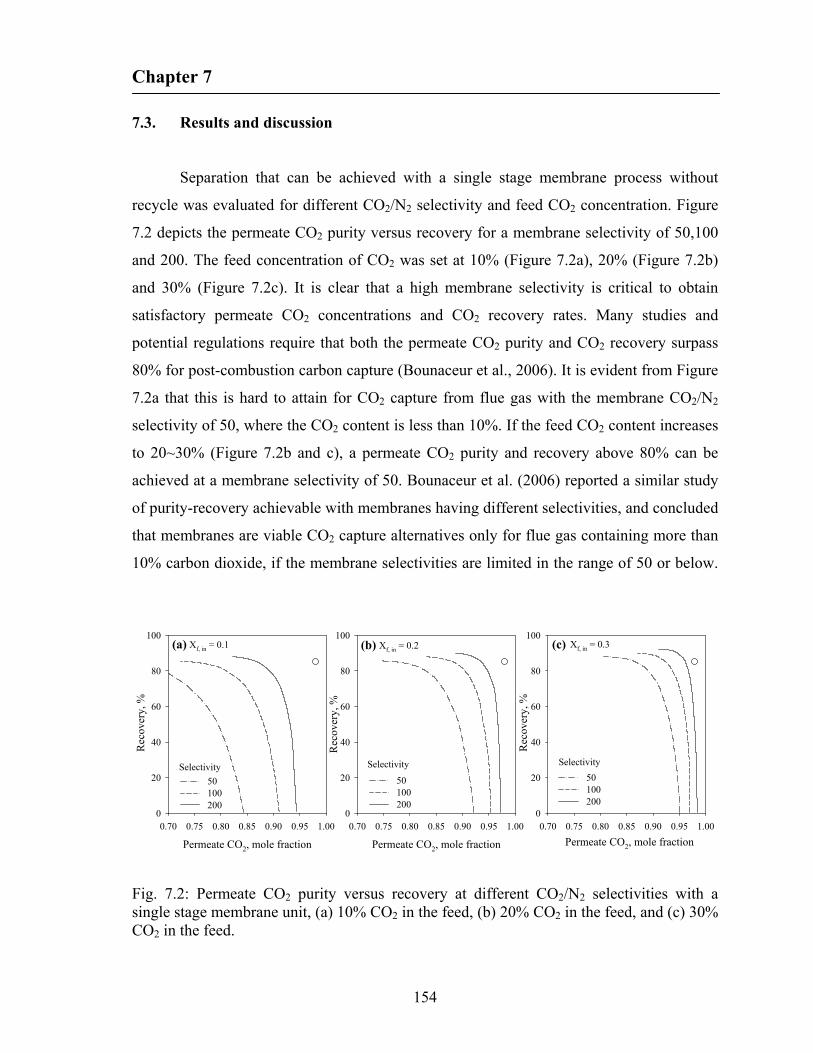
Chapter 7
154
7.3. Results and discussion
Separation that can be achieved with a single stage membrane process without
recycle was evaluated for different CO2/N2 selectivity and feed CO2 concentration. Figure
7.2 depicts the permeate CO2 purity versus recovery for a membrane selectivity of 50,100
and 200. The feed concentration of CO2 was set at 10% (Figure 7.2a), 20% (Figure 7.2b)
and 30% (Figure 7.2c). It is clear that a high membrane selectivity is critical to obtain
satisfactory permeate CO2 concentrations and CO2 recovery rates. Many studies and
potential regulations require that both the permeate CO2 purity and CO2 recovery surpass
80% for post-combustion carbon capture (Bounaceur et al., 2006). It is evident from Figure
7.2a that this is hard to attain for CO2 capture from flue gas with the membrane CO2/N2
selectivity of 50, where the CO2 content is less than 10%. If the feed CO2 content increases
to 20~30% (Figure 7.2b and c), a permeate CO2 purity and recovery above 80% can be
achieved at a membrane selectivity of 50. Bounaceur et al. (2006) reported a similar study
of purity-recovery achievable with membranes having different selectivities, and concluded
that membranes are viable CO2 capture alternatives only for flue gas containing more than
10% carbon dioxide, if the membrane selectivities are limited in the range of 50 or below.
Permeate CO2, mole fraction
0.70 0.75 0.80 0.85 0.90 0.95 1.00
Rec
over
y, %
0
20
40
60
80
100
50100200
Permeate CO2, mole fraction
0.70 0.75 0.80 0.85 0.90 0.95 1.00
Rec
over
y, %
0
20
40
60
80
100
50100200
Permeate CO2, mole fraction
0.70 0.75 0.80 0.85 0.90 0.95 1.00
Rec
over
y, %
0
20
40
60
80
100
50100200
Selectivity Selectivity Selectivity
(a) (b) (c)Xf, in = 0.1 Xf, in = 0.2 Xf, in = 0.3
Fig. 7.2: Permeate CO2 purity versus recovery at different CO2/N2 selectivities with a single stage membrane unit, (a) 10% CO2 in the feed, (b) 20% CO2 in the feed, and (c) 30% CO2 in the feed.
Chapter 7
155
However, our study was targeted to recover 85% of the CO2 with a purity of 98% CO2
(denoted by the open circle in Figure 7.2). It was found that the target specifications are
unattainable with a single stage permeator even with a membrane selectivity of 200.
However, when a single-stage design is unsatisfactory in terms of product purity or
recovery, multi-staging or cascading is sometimes an attractive approach. It is also to be
noted that single-stage membrane units are rarely used in practice for the separations. It is
obvious from Figure 7.2 that the success of membranes depends heavily on the membrane
selectivity or at least in multi-staging.
Detailed parametric studies of gas separation membrane processes for post-
combustion carbon capture are available elsewhere (Bounaceur et al., 2006; Brunetti et al.,
2010; Favre, 2007; Ho et al., 2008; Zhao et al., 2008). These studies included a parametric
analysis of the effects of CO2 permeability, CO2/N2 selectivity, membrane area, pressure
ratio, feed CO2 concentration on the membrane performance. Chowdhury (2012) studied
fifteen single and multi-stage membrane process configurations with and without recycle
streams through simulation for an industrial scale post-combustion CO2 capture. Among
the various configurations studied, only two of them (Figures 7.3a and b) were capable to
satisfy the design specifications. The configuration shown in Figure 7.3a was developed by
Lin et al. (2007) to recover 90% CO2 with a permeate purity of 88.3% for a CO2
concentration of 13% in the feed. The configuration shown in Figure 7.3b, which is a
modified configuration shown in Figure 7.3a, eliminates a compressor. In our study, these
two three-stage configurations were simulated for the aforementioned capture requirements
at the operating conditions reported by Chowdhury (2012). Several two-stage
configurations were investigated too. However, the two stage configurations were not
capable of meeting the CO2 capture requirements for coal-fired power plants where the
feed CO2 concentration is 15%. They are capable of meeting the capture requirements in
case of cement plants with a CO2 concentration of 24.1% in the feed. As the feed CO2
concentration increases, the membrane processes offer significant advantages. The two-
stage configurations were very simple in design and no vacuum pumps were used. Vacuum
operation does not save much power and uses lots more membrane area.

Chapter 7
156
V C
Flue gas-Out
CO2-Rich gas
Flue gas-In
V
Flue gas-Out
C
V C
V
Flue gas-Out
CO2-Rich gas
Flue gas-In
(a)
(b)
S-1
S-3
S-2
S-1
S-3
S-2
S = Membrane StageV = VacuumC = Compressor
Fig. 7.3: Three-stage configurations investigated for post-combustion CO2 capture.
The performance of all the process configurations is compared on the basis of
membrane area and power requirements. The three-stage configuration shown in Figure
7.3b requires the lowest energy penalty for coal-fired power plant applications, however, it
requires larger membrane area (Table 7.2). Configuration in Figure 7.3b consumes 31%
less energy but requires 237% more membrane area than the configuration in Figure 7.3a.
On the other hand, the energy penalties for the two-stage configurations (Figures 7.4a and
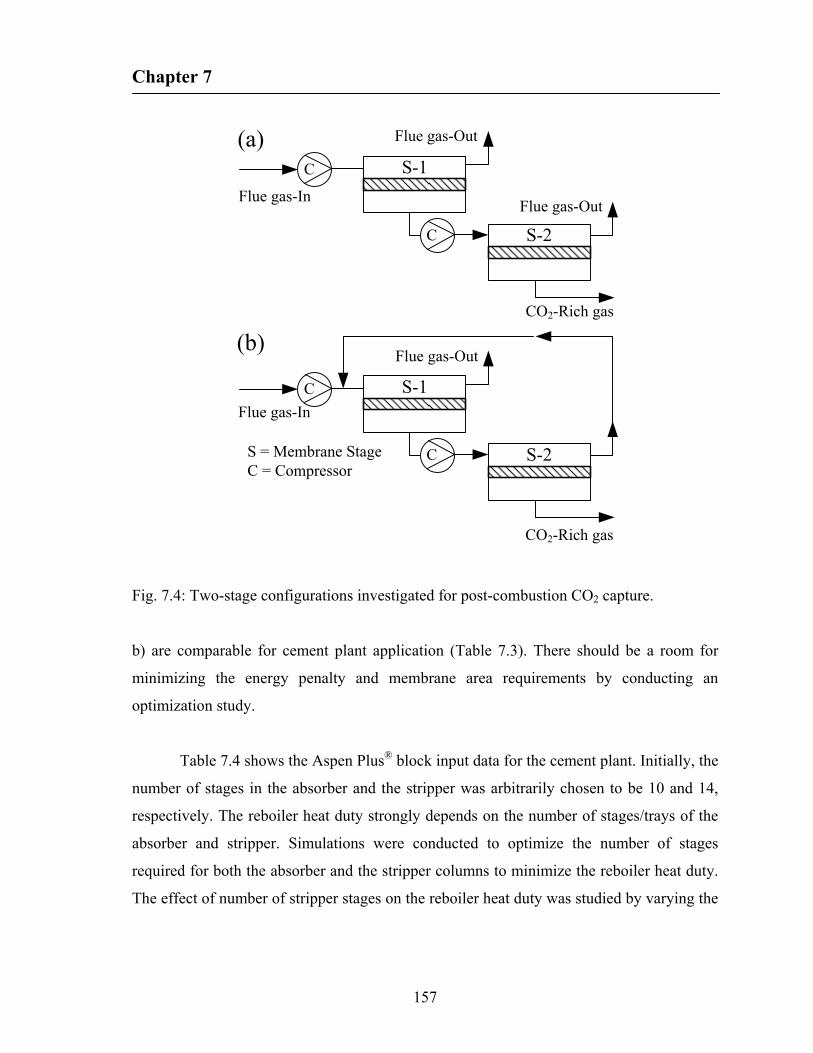
Chapter 7
157
CO2-Rich gas
Flue gas-In
Flue gas-Out
S-1
S-2
C
C
Flue gas-Out
(a)
CO2-Rich gas
Flue gas-In
Flue gas-Out
S-1
S-2
C
C
(b)
S = Membrane StageC = Compressor
Fig. 7.4: Two-stage configurations investigated for post-combustion CO2 capture.
b) are comparable for cement plant application (Table 7.3). There should be a room for
minimizing the energy penalty and membrane area requirements by conducting an
optimization study.
Table 7.4 shows the Aspen Plus® block input data for the cement plant. Initially, the
number of stages in the absorber and the stripper was arbitrarily chosen to be 10 and 14,
respectively. The reboiler heat duty strongly depends on the number of stages/trays of the
absorber and stripper. Simulations were conducted to optimize the number of stages
required for both the absorber and the stripper columns to minimize the reboiler heat duty.
The effect of number of stripper stages on the reboiler heat duty was studied by varying the
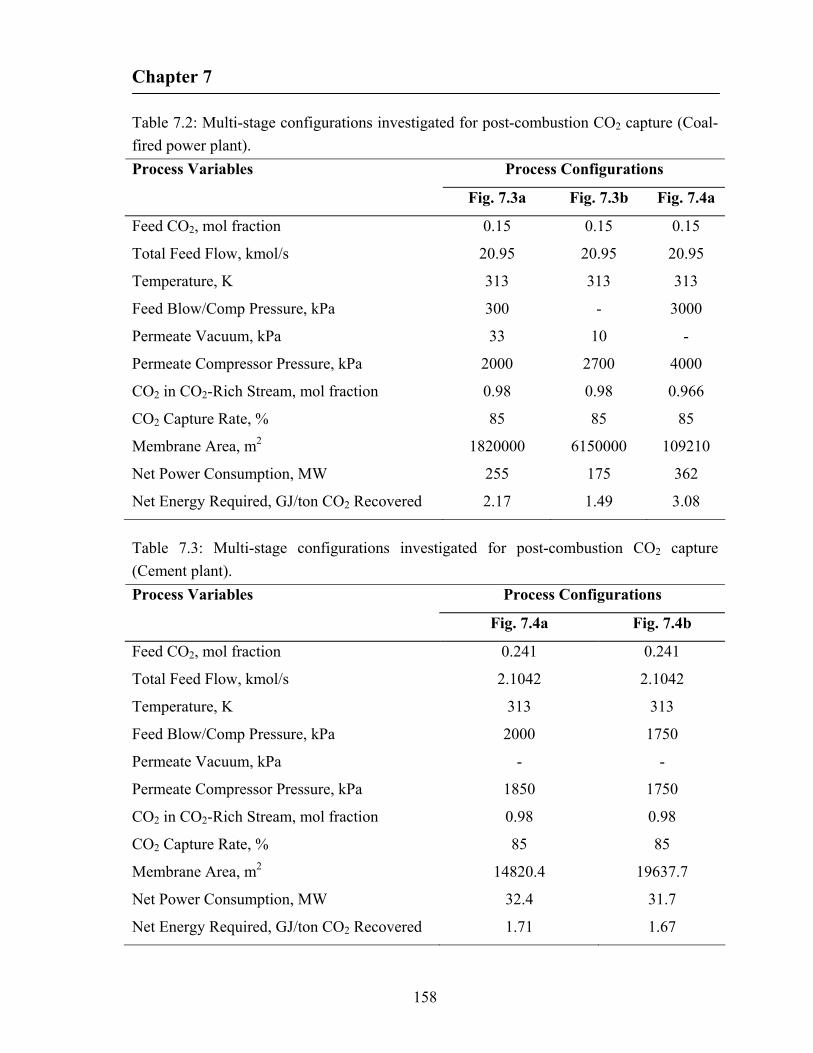
Chapter 7
158
Table 7.2: Multi-stage configurations investigated for post-combustion CO2 capture (Coal-
fired power plant).
Process Configurations Process Variables
Fig. 7.3a Fig. 7.3b Fig. 7.4a
Feed CO2, mol fraction 0.15 0.15 0.15
Total Feed Flow, kmol/s 20.95 20.95 20.95
Temperature, K 313 313 313
Feed Blow/Comp Pressure, kPa 300 - 3000
Permeate Vacuum, kPa 33 10 -
Permeate Compressor Pressure, kPa 2000 2700 4000
CO2 in CO2-Rich Stream, mol fraction 0.98 0.98 0.966
CO2 Capture Rate, % 85 85 85
Membrane Area, m2 1820000 6150000 109210
Net Power Consumption, MW 255 175 362
Net Energy Required, GJ/ton CO2 Recovered 2.17 1.49 3.08
Table 7.3: Multi-stage configurations investigated for post-combustion CO2 capture
(Cement plant).
Process Configurations Process Variables
Fig. 7.4a Fig. 7.4b
Feed CO2, mol fraction 0.241 0.241
Total Feed Flow, kmol/s 2.1042 2.1042
Temperature, K 313 313
Feed Blow/Comp Pressure, kPa 2000 1750
Permeate Vacuum, kPa - -
Permeate Compressor Pressure, kPa 1850 1750
CO2 in CO2-Rich Stream, mol fraction 0.98 0.98
CO2 Capture Rate, % 85 85
Membrane Area, m2 14820.4 19637.7
Net Power Consumption, MW 32.4 31.7
Net Energy Required, GJ/ton CO2 Recovered 1.71 1.67

Chapter 7
159
Table 7.4: Block input data for Aspen Plus® process flowsheet (cement plant).
Block Name Unit Operation
Model
Block Specifications Type/Value
Temperature, oC 40 COOLER HEATER
Pressure, bar 1.013
Temperature, oC 30 SEP FLASH2
Pressure, bar 1.013
BLOWER COMPR Pressure, bar 1.2
Temperature, oC 40 COOLER1 HEATER
Pressure, bar 1.2
Condenser/Reboiler None/None
Temperature, oC 40
No. of Stages 7
Top Stage Pressure, bar 1.2
Column Pressure Drop, bar 0
Flue-Abs Feed Location Above Stage 1
ABSORBER RADFRAC
Lean-Abs Feed Location Above Stage 8
PUMP1/PUMP2 PUMP Discharge Pressure, bar 2.1
Cold Stream Outlet
Temperature, oC
101.5 HEATX HEATX
Pressure, bar 2.1
Condenser/Reboiler Partial vapour /Kettle
Temperature, oC 40
No. of Stages 10
Top Stage Pressure, bar 1.9
Column Pressure Drop, bar 0
STRIPPER RADFRAC
Feed Tray Location Above Stage 6
Temperature, oC 40 LNCOOLER HEATER
Pressure, bar 2.1
Chapter 7
160
stripper stages from 4 to 14 while keeping the absorber stages fixed. It was observed that
the reboiler heat duty can be reduced by increasing the stripper number of stages. However,
after a certain number of stages, a further increase in the number of stages in the stripper
increases the reboiler heat duty only marginally. An increase in the number of trays in the
stripper requires a lower reflux ratio for a given carbon dioxide recovery thereby helping in
the reduction of the reboiler heat duty (Hassan, 2005). Similarly, an increase in the number
of stages in the absorber also reduces the reboiler heat duty. The reduction in reboiler heat
duty is due to the fact that a greater number of stages in the absorber allows a lower solvent
circulation rate in the absorber, and thus reduces the heat required by the reboiler to
regenerate the solvent. It was also observed that the required lean solvent flow rate
decreases as the number of stages in the absorber increases. However, as the lean solvent
flow rate increases, the diameter of the column increases subsequently, thereby increasing
the capital cost of the capture process (Hassan, 2005). The number of stages in the absorber
and the stripper was finally chosen to be 7 and 10, respectively.
Figure 7.5 represents the LEAN-ABS and RICH-ABS flow rate, respectively, for
different lean loadings (mol CO2/mol MEA). As can be seen from Figure 7.5, the required
LEAN-ABS flow rate increased from 680,122 to 1,660,781 Kg/hr for the cement plant
when the lean loading was increased from 0.05 to 0.30 mol CO2/mol MEA. Higher CO2
loadings require higher flow rate of lean MEA to achieve the target CO2 recovery.
However, the required LEAN-ABS flow rate was much higher when DEA was used as the
solvent. The required DEA flow rate was 40-70% more than that of MEA, as shown in
Figure 7.5. This is because MEA provides the highest overall forward rate constant for
CO2-amine reactions (7600 mol/L/s), while rate constant of DEA (1500 mol/L/s) is
somewhat intermediate among the amines (Chakma, 1997).
Hassan (2005) reported that the rich loading increases with increasing lean loading,
but the rich loading increase is not much compared to the value of lean loading increase.
The rich loading increase is due to a significant increase in carbon dioxide recirculation
through the columns as the lean loading increases. On the contrary, Alie et al. (2005)
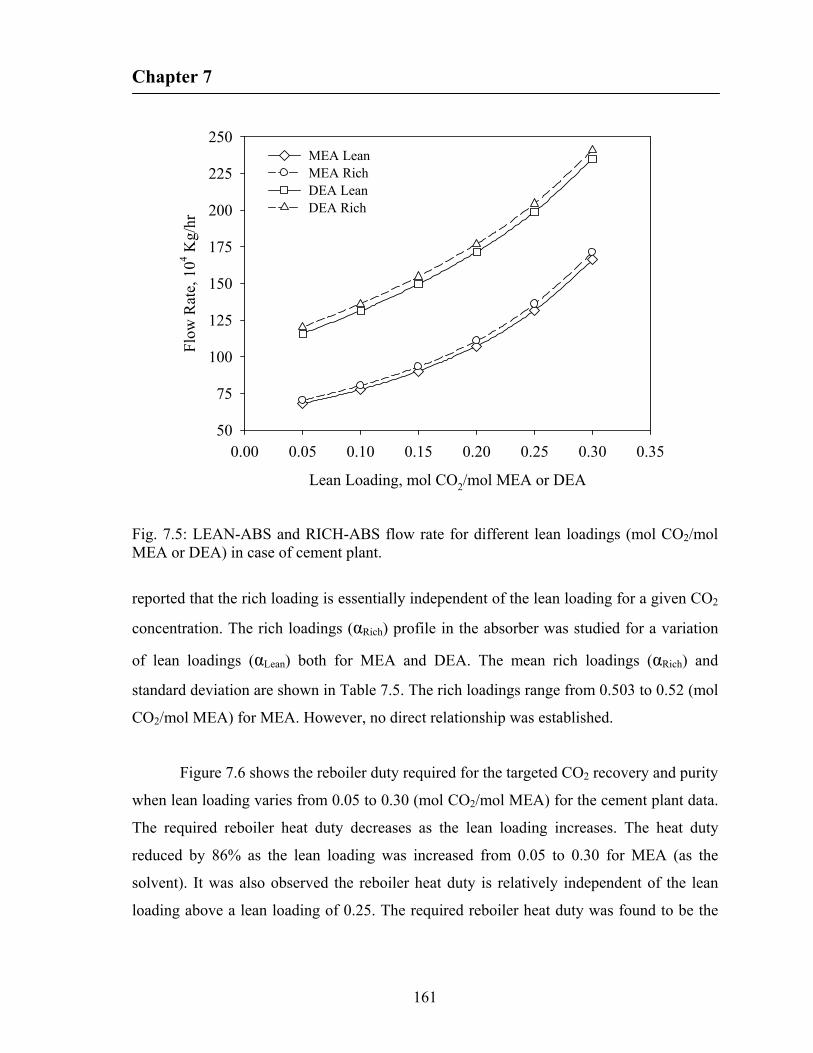
Chapter 7
161
Lean Loading, mol CO2/mol MEA or DEA
0.00 0.05 0.10 0.15 0.20 0.25 0.30 0.35
Flo
w R
ate,
104 K
g/hr
50
75
100
125
150
175
200
225
250MEA LeanMEA RichDEA Lean DEA Rich
Fig. 7.5: LEAN-ABS and RICH-ABS flow rate for different lean loadings (mol CO2/mol MEA or DEA) in case of cement plant.
reported that the rich loading is essentially independent of the lean loading for a given CO2
concentration. The rich loadings (αRich) profile in the absorber was studied for a variation
of lean loadings (αLean) both for MEA and DEA. The mean rich loadings (αRich) and
standard deviation are shown in Table 7.5. The rich loadings range from 0.503 to 0.52 (mol
CO2/mol MEA) for MEA. However, no direct relationship was established.
Figure 7.6 shows the reboiler duty required for the targeted CO2 recovery and purity
when lean loading varies from 0.05 to 0.30 (mol CO2/mol MEA) for the cement plant data.
The required reboiler heat duty decreases as the lean loading increases. The heat duty
reduced by 86% as the lean loading was increased from 0.05 to 0.30 for MEA (as the
solvent). It was also observed the reboiler heat duty is relatively independent of the lean
loading above a lean loading of 0.25. The required reboiler heat duty was found to be the
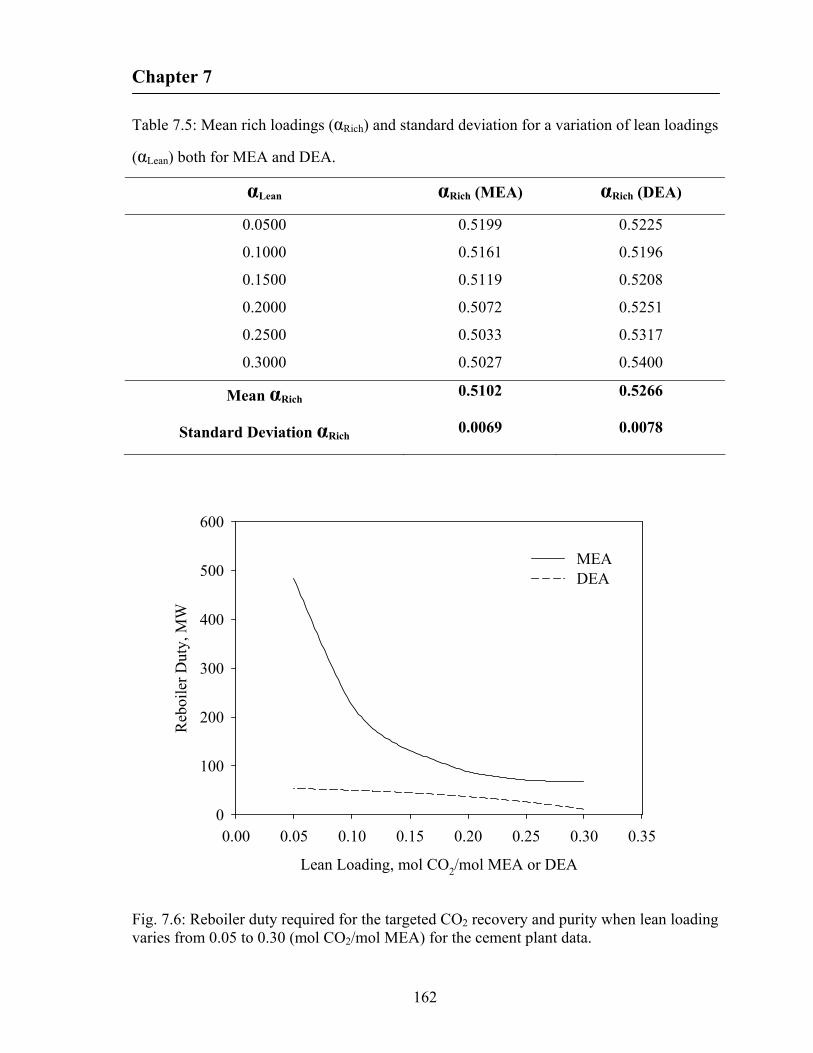
Chapter 7
162
Table 7.5: Mean rich loadings (αRich) and standard deviation for a variation of lean loadings
(αLean) both for MEA and DEA.
αLean αRich (MEA) αRich (DEA)
0.0500 0.5199 0.5225
0.1000 0.5161 0.5196
0.1500 0.5119 0.5208
0.2000 0.5072 0.5251
0.2500 0.5033 0.5317
0.3000 0.5027 0.5400
Mean αRich 0.5102 0.5266
Standard Deviation αRich 0.0069 0.0078
Lean Loading, mol CO2/mol MEA or DEA
0.00 0.05 0.10 0.15 0.20 0.25 0.30 0.35
Reb
oile
r D
uty,
MW
0
100
200
300
400
500
600
MEADEA
Fig. 7.6: Reboiler duty required for the targeted CO2 recovery and purity when lean loading varies from 0.05 to 0.30 (mol CO2/mol MEA) for the cement plant data.

Chapter 7
163
least when the lean loading was 0.30 for MEA. These observations are also true for DEA.
The circulation rate of the solvent and the value of the lean loading of the stream leaving
the stripper (and subsequently recycled back to the absorber) are two important factors
affecting the reboiler heat duty. At a lean loading of 0.05 (mol CO2/mol MEA), a large
amount of heat is required at the reboiler to separate the desired carbon dioxide. Albeit the
solvent circulation rate is low, the reboiler would consume a lot of energy to separate the
carbon dioxide until the lean solvent reaches that CO2 loading. That suggests at a low lean
CO2 loading, a significant amount of additional energy is required during the regeneration
process. As the lean loading specification is increased, the reboiler duty decreases until it
reaches a plateau above a lean loading of 0.25. The amine solution with a higher CO2
loading can be regenerated more easily and with lower reboiler duty than that of with a
lower CO2 loading. The CO2 loading of the lean solution needs to be adjusted to a proper
level where the energy consumption at the regeneration unit is reduced, while maintaining
a satisfactory capture performance. This may result in a reduction in the overall cost of the
capture process. However, it is to be noted that due to lower heats of reaction and latent
heats of vaporization, DEA offers better energy savings than MEA (Chakma, 1997;
Chakma, 1999).
The reboiler duty required to treat the flue gas to the aforementioned design
specifications was investigated for other flue gas compositions i.e., CO2 concentrations of
5%, 15% and 25%. In each case, the flow rate of flue gas was kept constant at that of the
cement plant (Table 7.1) and MEA was used as the solvent. Figure 7.7 represents the
reboiler duty at the studied concentrations plotted against the lean loading. The reboiler
duty decreases and reaches a plateau for a lean loading equal to 0.30. It is also apparent that
the MEA process is advantageous when CO2 content in the flue gas is lower.
Absorption processes use more energy when the CO2 concentration increases.
Membranes, on the other hand, use partial pressure as the driving force for separation and
are most effective at high concentrations of CO2. Hybrid processes can be developed to
take the cost/performance advantages that neither process could achieve individually.

Chapter 7
164
Lean Loading, mol CO2/mol MEA
0.00 0.05 0.10 0.15 0.20 0.25 0.30 0.35
Reb
oile
r D
uty,
MW
0
100
200
300
400
500
600
25 %15 % 5 %
Feed CO2 Conc
Fig. 7.7: Reboiler heat duties at different CO2 concentrations with different lean loading.
Chowdhury (2012) studied hybrid membrane processes for post-combustion CO2 capture
as two different unit operations arranged in parallel or in series. In the parallel arrangement,
a portion of the flue gas was split and fed to the amine unit while the remaining flue gas
enters the membrane unit. In the series arrangement, the flue gas was first concentrated in
CO2 with the membranes, and then the CO2 concentrated stream was fed to amine unit. It
was concluded that the hybrid process combining of membrane and MEA might not be a
good choice for the post-combustion CO2 capture. Chowdhury (2012) also reported that the
standalone membrane process utilizes the lowest energy, and neither hybrid process was
competitive, the worse being the two-in-series hybrid arrangement. It is comprehensible
from Figure 7.7 that as CO2 concentration increases, so does the required reboiler heat
duty. This also implies that the two-in-series arrangement might not be effective from the
energy perspectives. Moreover, the parallel arrangement fails to take the advantage of the
membrane process which is effective for bulk CO2 removal.
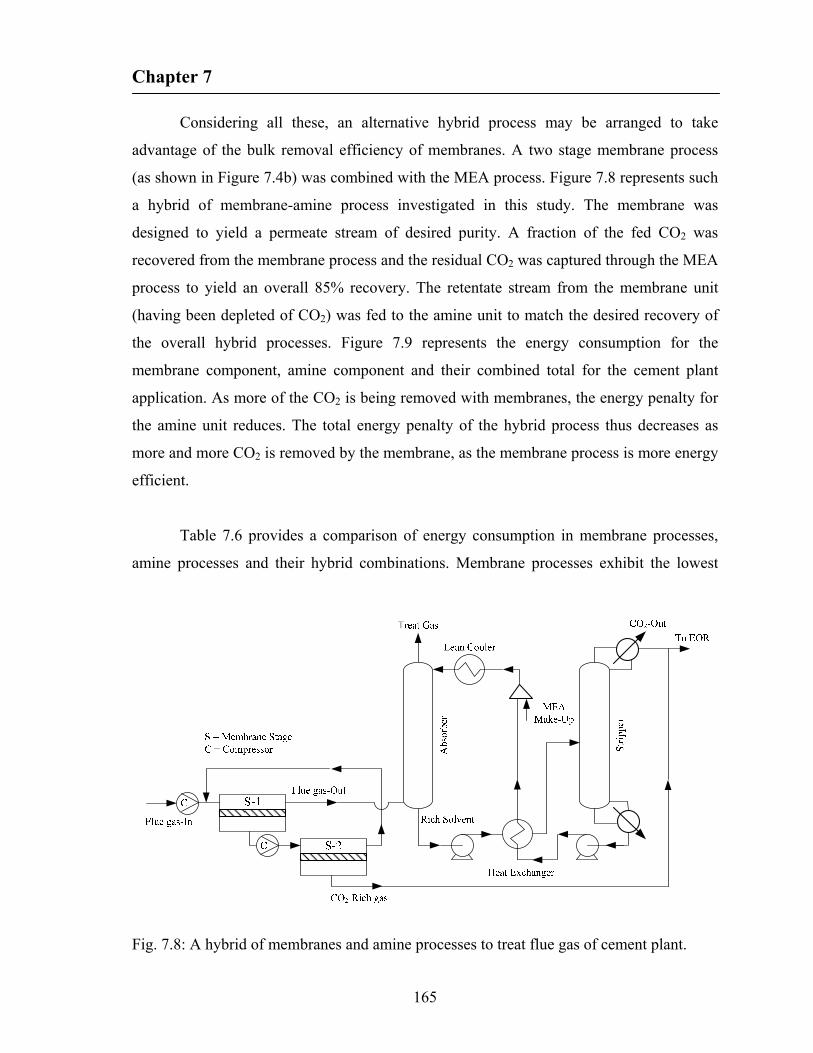
Chapter 7
165
Considering all these, an alternative hybrid process may be arranged to take
advantage of the bulk removal efficiency of membranes. A two stage membrane process
(as shown in Figure 7.4b) was combined with the MEA process. Figure 7.8 represents such
a hybrid of membrane-amine process investigated in this study. The membrane was
designed to yield a permeate stream of desired purity. A fraction of the fed CO2 was
recovered from the membrane process and the residual CO2 was captured through the MEA
process to yield an overall 85% recovery. The retentate stream from the membrane unit
(having been depleted of CO2) was fed to the amine unit to match the desired recovery of
the overall hybrid processes. Figure 7.9 represents the energy consumption for the
membrane component, amine component and their combined total for the cement plant
application. As more of the CO2 is being removed with membranes, the energy penalty for
the amine unit reduces. The total energy penalty of the hybrid process thus decreases as
more and more CO2 is removed by the membrane, as the membrane process is more energy
efficient.
Table 7.6 provides a comparison of energy consumption in membrane processes,
amine processes and their hybrid combinations. Membrane processes exhibit the lowest
Fig. 7.8: A hybrid of membranes and amine processes to treat flue gas of cement plant.
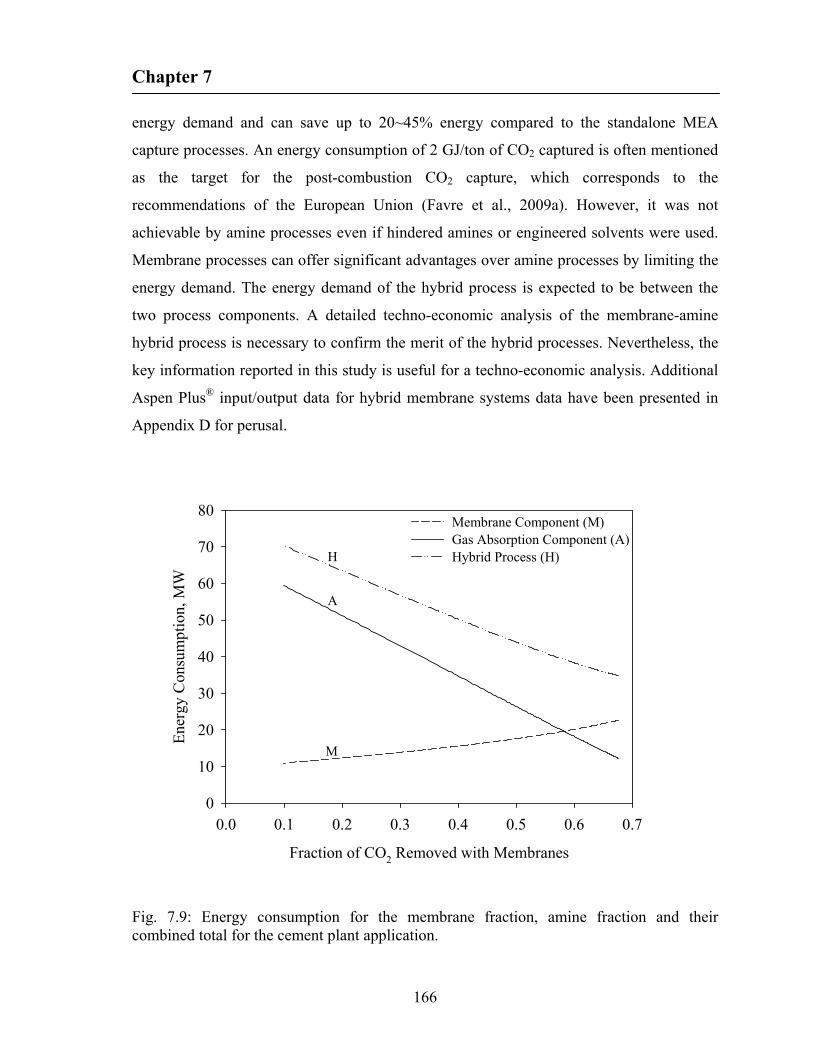
Chapter 7
166
energy demand and can save up to 20~45% energy compared to the standalone MEA
capture processes. An energy consumption of 2 GJ/ton of CO2 captured is often mentioned
as the target for the post-combustion CO2 capture, which corresponds to the
recommendations of the European Union (Favre et al., 2009a). However, it was not
achievable by amine processes even if hindered amines or engineered solvents were used.
Membrane processes can offer significant advantages over amine processes by limiting the
energy demand. The energy demand of the hybrid process is expected to be between the
two process components. A detailed techno-economic analysis of the membrane-amine
hybrid process is necessary to confirm the merit of the hybrid processes. Nevertheless, the
key information reported in this study is useful for a techno-economic analysis. Additional
Aspen Plus® input/output data for hybrid membrane systems data have been presented in
Appendix D for perusal.
Fraction of CO2 Removed with Membranes
0.0 0.1 0.2 0.3 0.4 0.5 0.6 0.7
Ene
rgy
Con
sum
ptio
n, M
W
0
10
20
30
40
50
60
70
80Membrane Component (M)Gas Absorption Component (A)Hybrid Process (H)
M
A
H
Fig. 7.9: Energy consumption for the membrane fraction, amine fraction and their combined total for the cement plant application.
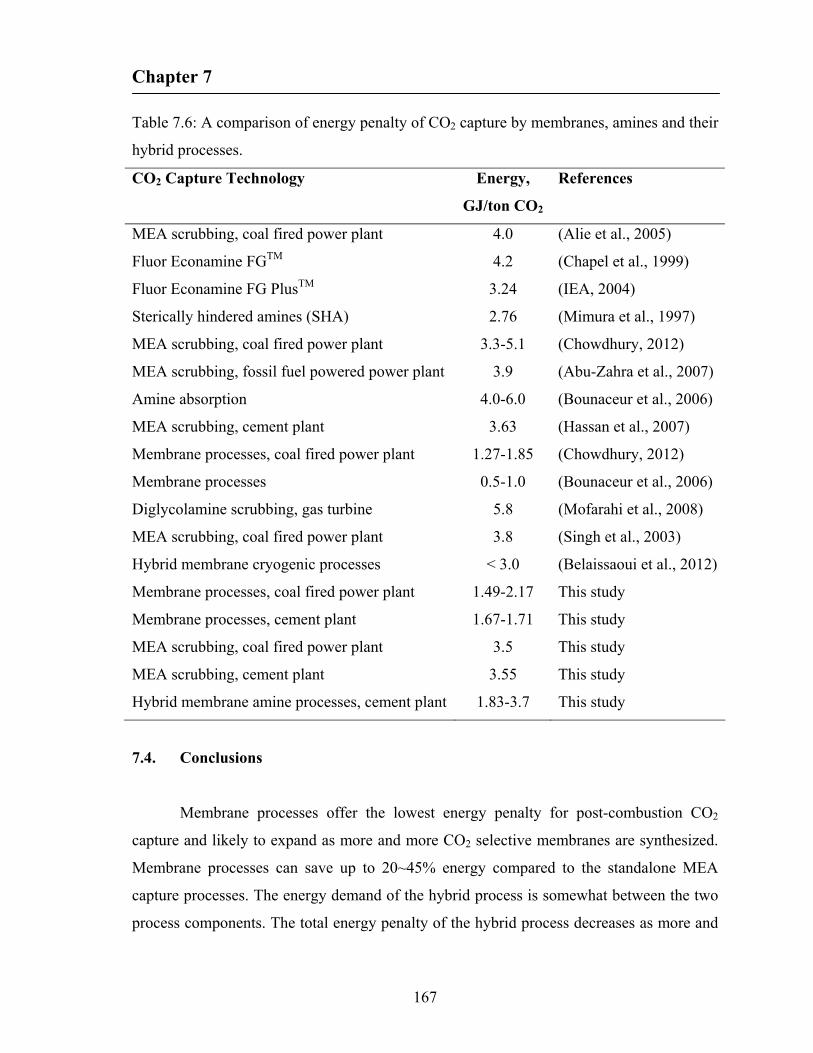
Chapter 7
167
Table 7.6: A comparison of energy penalty of CO2 capture by membranes, amines and their
hybrid processes.
CO2 Capture Technology Energy,
GJ/ton CO2
References
MEA scrubbing, coal fired power plant 4.0 (Alie et al., 2005)
Fluor Econamine FGTM 4.2 (Chapel et al., 1999)
Fluor Econamine FG PlusTM 3.24 (IEA, 2004)
Sterically hindered amines (SHA) 2.76 (Mimura et al., 1997)
MEA scrubbing, coal fired power plant 3.3-5.1 (Chowdhury, 2012)
MEA scrubbing, fossil fuel powered power plant 3.9 (Abu-Zahra et al., 2007)
Amine absorption 4.0-6.0 (Bounaceur et al., 2006)
MEA scrubbing, cement plant 3.63 (Hassan et al., 2007)
Membrane processes, coal fired power plant 1.27-1.85 (Chowdhury, 2012)
Membrane processes 0.5-1.0 (Bounaceur et al., 2006)
Diglycolamine scrubbing, gas turbine 5.8 (Mofarahi et al., 2008)
MEA scrubbing, coal fired power plant 3.8 (Singh et al., 2003)
Hybrid membrane cryogenic processes < 3.0 (Belaissaoui et al., 2012)
Membrane processes, coal fired power plant 1.49-2.17 This study
Membrane processes, cement plant 1.67-1.71 This study
MEA scrubbing, coal fired power plant 3.5 This study
MEA scrubbing, cement plant 3.55 This study
Hybrid membrane amine processes, cement plant 1.83-3.7 This study
7.4. Conclusions
Membrane processes offer the lowest energy penalty for post-combustion CO2
capture and likely to expand as more and more CO2 selective membranes are synthesized.
Membrane processes can save up to 20~45% energy compared to the standalone MEA
capture processes. The energy demand of the hybrid process is somewhat between the two
process components. The total energy penalty of the hybrid process decreases as more and
Chapter 7
168
more CO2 is removed by the membranes. The overall energy requirement of the hybrid
process needs to be investigated in case a less stringent capture rate constraint is taken. A
detailed economic evaluation of the membrane-amine hybrid process is essential to confirm
its techno-economic advantage for post-combustion CO2 capture.
Chapter 8
169
Conclusions and future recommendations
8.1 General conclusions and contributions
The overall objective of the study is to develop models that can be used to help in
the design and operation of CO2 capture processes. Although the objective of this research
is multi-fold, the study provides a process analysis perspective for hollow fiber permeators,
pressure-vacuum swing permeation, and membrane-amine hybrid systems for gas
separations. From the work completed in this study, a number of important conclusions can
be drawn with respect to the design viability and performance of membrane gas separations.
Moreover, the unprecedented process concepts discussed here could potentially emerge a
new application of membrane gas separation.
8.1.1 Modeling and simulation of hollow fiber membranes
The developed model and solution technique for high flux asymmetric hollow fiber
membranes provides reliable examination of pressure and concentration profiles along the
permeator length (both residue/permeate streams). The solution technique has merits over
other techniques commonly used since it requires minimal computational effort and
provides improved solution stability. Moreover, the computational complexity does not
multiply as the number of components increases. The solution technique was found very
efficient for the solution of binary/multicomponent systems.
8.1.2 Membrane process configurations
The study demonstrates that the new solution technique can conveniently handle the
high-flux hollow fibre membrane problems with different flow and process configurations.
Membrane area requirement may be reduced through the use of feed gas bypass for
applications where oxygen-enriched air with moderate product purity is required. It was
shown that two modules in series operation can be used to enhance the overall performance

Chapter 8
170
for nitrogen production, especially when a high concentration of the nitrogen is needed.
Recycle ratio plays a crucial role, and optimum recycle ratio vital for the retentate recycle
to permeate and permeate recycle to feed operation for methane enrichment from biogas
was found. From the concept of two recycle operations, complexities involved in the
design and operation of continuous membrane column was simplified. It was shown that
with current CO2-selective membranes, it is difficult for the methane-enriched retentate
stream to reach a pipeline quality natural gas primarily due to the presence of a small
amount of nitrogen, and an additional separation step to remove nitrogen is needed.
Membrane permselectivity required for a targeted separation to produce pipeline quality
natural gas by methane-selective or nitrogen-selective membranes was calculated.
8.1.3 Effect of permeate pressure build-up on intrinsic permeances
It was observed that considerable pressure build-up in the fiber lumen can occur,
resulting in discrepancy in the predicted membrane performance if this effect is neglected.
It was shown that membrane performs close to its intrinsic separation properties if operated
at high feed pressures, and at the same time the effect of pressure build-up on the
membrane performance is minimized. It was also shown that the average loss in driving
force due to pressure build-up increases as feed pressure increases, however, percentage
loss in driving force is actually minimized at higher feed pressures.
8.1.4 Novel process of pressure-vacuum swing permeation
A relatively higher transmembrane driving force compare to conventional steady
state membrane process can be achieved in unsteady state pressure-vacuum swing
permeation process using a single pump, which can also be sustained over a longer period
of time. Moreover, a higher feed to permeate pressure ratio can be achieved, which
enhances gas separations. The relative volume of the feed and permeate sides of the
membrane unit was shown to be an important parameter in the process design. It was
shown that the pressure-vacuum swing process using a single pump improves CO2
Chapter 8
171
recovery and productivity by 25% and 45% (for CO2 separation from flue gas),
respectively, compared to the conventional steady state permeation process.
8.1.5 Membrane-amine hybrid systems for post-combustion CO2 capture
It was found that the target specifications (i.e., 85% recovery with 98% CO2 purity)
for application in EOR were unattainable with current generation membranes in single
stage permeator even with a CO2/N2 selectivity of 200. However, multi-stage
configurations can satisfy the design specifications. It was shown that membrane processes
offer the lowest energy penalty for post-combustion CO2 capture and likely to expand as
more and more CO2 selective membranes are synthesized. It was estimated that membrane
processes can save up to 20~45% energy compared to the stand-alone MEA capture
processes. It was also shown that the total energy penalty of the hybrid process decreases as
more and more CO2 is removed by the membranes.
8.2 Future recommendations
Membrane-based gas separation is one of the most exciting and significant new unit
processes that have appeared in recent years. A substantial amount of research works have
been conducted in membrane gas separation industry, which helped the membrane
technology to widely penetrate across various end-use markets. The future of membrane
technology promises to be equally exciting as new membrane materials, processes and
innovations make their way to the marketplace. The opportunities to extend the technology
to new applications (and/or, cost/energy saving improvement of existing membrane
processes) are limitless. The research works based on the thesis context can be extended to
cope with the following recommendations:
8.2.1 Gas permeation membrane networks
The gas permeation model can be extended to develop a comprehensive gas
permeation membrane network representation in the form of superstructures that capture all

Chapter 8
172
possible conventional and novel combinations of cocurrent, countercurrent, and crossflow
gas permeation membrane units. The superstructures can be optimized thereafter to extract
those designs that exhibit the best economic performances. The approach might help
membrane professionals to systematically and quickly determine the most economical
membrane network structures for a specific design.
8.2.2 Experimental investigation of pressure-vacuum swing permeation process
An experimental investigation of pressure-vacuum swing permeation process is
required at this stage to materialize the concept to proof of concept.
8.2.3 Economic evaluation of membrane-amine hybrid systems
The energy demand of the hybrid process is somewhat intermediate of membrane
processes being the lowest and amine processes being the highest. The decisive factor of
hybrid processes over amine processes lying in analyzing if the amine processes (in hybrid
configurations) can actually be downsized. Moreover, the membrane area savings (if any)
should be taken into consideration. A detailed techno-economic analysis of the hybrid
membrane amine processes is deemed necessary at this point to confirm the merit of the
hybrid processes. Nevertheless, it is hoped that the key data reported in this study can aid
the possibility to undertake techno-economic analysis. However, apple to apple
comparisons are required between competitive capture technologies to make the economic
evaluation more credible.
Copyright Permissions
173
JOHN WILEY AND SONS LICENSE
This is a License Agreement between Prodip K Kundu ("You") and John Wiley and Sons
("John Wiley and Sons") provided by Copyright Clearance Center ("CCC"). The license
consists of your order details, the terms and conditions provided by John Wiley and Sons,
and the payment terms and conditions.
License Details:
TERMS AND CONDITIONS
This copyrighted material is owned by or exclusively licensed to John Wiley & Sons, Inc.
or one of its group companies (each a "Wiley Company") or a society for whom a Wiley
Company has exclusive publishing rights in relation to a particular journal (collectively
"WILEY"). By clicking "accept" in connection with completing this licensing transaction,
you agree that the following terms and conditions apply to this transaction (along with the
billing and payment terms and conditions established by the Copyright Clearance Center
Inc., ("CCC's Billing and Payment terms and conditions"), at the time that you opened your
RightsLink account (these are available at any time at http://myaccount.copyright.com).

Copyright Permissions
174
JOHN WILEY AND SONS LICENSE
This is a License Agreement between Prodip K Kundu ("You") and John Wiley and Sons
("John Wiley and Sons") provided by Copyright Clearance Center ("CCC"). The license
consists of your order details, the terms and conditions provided by John Wiley and Sons,
and the payment terms and conditions.
License Details:
TERMS AND CONDITIONS
This copyrighted material is owned by or exclusively licensed to John Wiley & Sons, Inc.
or one of its group companies (each a "Wiley Company") or a society for whom a Wiley
Company has exclusive publishing rights in relation to a particular journal (collectively
"WILEY"). By clicking "accept" in connection with completing this licensing transaction,
you agree that the following terms and conditions apply to this transaction (along with the
billing and payment terms and conditions established by the Copyright Clearance Center
Inc., ("CCC's Billing and Payment terms and conditions"), at the time that you opened your
RightsLink account (these are available at any time at http://myaccount.copyright.com).

References
175
Abboud, S., Aschim, K., Bagdan, B., Sarkar, P., Yuan, H., Scorfield, B., Felske, C., Rahbar, S. and Marmen, L., "Potential for producing renewable natural gas from Canadian wastes," Report prepared jointly by Alberta Research Council and Canadian Gas Association (2010).
Abu-Zahra, M.R.M., Schneiders, L.H.J., Niederer, J.P.M., Feron, P.H.M. and Versteeg, G.F., "CO2 capture from power plants. Part I. A parametric study of the technical performance based on monoethanolamine," Int. J. Greenhouse Gas Control 1, 37-46 (2007).
Agrawal, R. and Xu, J., "Gas separation membrane cascades II. Two-compressor cascades," J. Membr. Sci. 112, 129-146 (1996).
Agrawal, R., "Simplified method for the synthesis of gas separation membrane cascades with limited numbers of compressors," Chem. Eng. Sci. 52, 1029-1044 (1997).
Alefeld, G. and Voelkl, J., "Hydrogen in metals I: basic properties," Springer-Verlag, Berlin (1978).
Alie, C., Backham, L., Croiset, E. and Douglas, P.L., "Simulation of CO2 capture using MEA scrubbing: a flowsheet decomposition method," Energy Convers. Manage. 46, 475-487 (2005).
Aroonwilas, A. and Veawab, A., "Integration of CO2 capture unit using blended MEA–AMP solution into coal-fired power plants," Energy Procedia 1, 4315-4321 (2009).
Baker, R.W., "Future directions of membrane gas separation technology," Ind. Eng. Chem. Res. 41, 1393-1411 (2002).
Baker, R.W., "Membrane technology and applications," 2nd ed., John Wiley & Sons., Chichester, England (2004).
Baker, R.W. and Lokhandwala, K., "Natural gas processing with membranes: an overview," Ind. Eng. Chem. Res. 47, 2109-2121 (2008).
Barchas, R. and Davis, R., "The Kerr-McGee/ABB Lummus Crest technology for the recovery of CO2 from stack gases," Energy Convers. Manage. 33, 333-340 (1992).
Basaran, O.A. and Auvil, S.R., "Asymptotic analysis of gas separation by a membrane module," AICHE J. 34, 1726-1731 (1988).
Basu, A., Akhtar, J., Rahman, M.H. and Islam, M.R., "A review of separation of gases using membrane systems," Pet. Sci. Technol. 22, 1343-1368 (2004).

References
176
Beckman, I.N., Shelekhin, A.B. and Teplyakov, V.V., "Separation of gas mixtures in unsteady-state conditions," J. Membr. Sci. 55, 283-297 (1991).
Beckman, I.N., Bessarabov, D.G. and Teplyakov, V.V., "Selective membrane valve for ternary gas mixture separation: model of mass transfer and experimental test," Ind. Eng. Chem. Res. 32, 2017-2022 (1993).
Belaissaoui, B., Le Moullec, Y., Willson, D. and Favre, E., "Hybrid membrane cryogenic process for post-combustion CO2 capture," J. Membr. Sci. 415–416, 424-434 (2012).
Berman, A.S., "Laminar flow in channels with porous walls," J. Appl. Phys. 24, 1232-1235 (1953).
Bernardo, P., Drioli, E. and Golemme, G., "Membrane gas separation: A review/state of the art," Ind. Eng. Chem. Res. 48, 4638-4663 (2009).
Bhide, B.D. and Stern, S.A., "A new evaluation of membrane processes for the oxygen-enrichment of air. I. Identification of optimum operating conditions and process configuration," J. Membr. Sci. 62, 13-35 (1991a).
Bhide, B.D. and Stern, S.A., "A new evaluation of membrane processes for the oxygen-enrichment of air. II. Effects of economic parameters and membrane properties," J. Membr. Sci. 62, 37-58 (1991b).
Bhide, B.D., Voskericyan, A. and Stern, S.A., "Hybrid processes for the removal of acid gases from natural gas," J. Membr. Sci. 140, 27-49 (1998).
Blaisdell, C.T. and Kammermeyer, K., "Counter-current and co-current gas separation," Chem. Eng. Sci. 28, 1249-1255 (1973).
Blizzard, G., Parro, D. and Hornback, K., "Mallet gas processing facility uses membranes to efficiently separate CO2," Oil Gas J. 103, 48-53 (2005).
Boucif, N., Majumdar, S. and Sirkar, K.K., "Series solutions for a gas permeator with countercurrent and cocurrent flow," Ind. Eng. Chem. Fundam. 23, 470-480 (1984).
Boucif, N., Sengupta, A. and Sirkar, K.K., "Hollow fiber gas permeator with countercurrent or cocurrent flow: series solutions," Ind. Eng. Chem. Fundam. 25, 217-228 (1986).
Bounaceur, R., Lape, N., Roizard, D., Vallieres, C. and Favre, E., "Membrane processes for post-combustion carbon dioxide capture: A parametric study," Energy. 31, 2220-2234 (2006).
Bowser, J., "Cyclic membrane separation process," US Patent 6,719,824 (2004).

References
177
Brubaker, D.W. and Kammermeyer, K., "Separation of gases by plastic membranes- Permeation rates and extent of separation," Ind. Eng. Chem. Res. 46, 733-739 (1954).
Brunetti, A., Scura, F., Barbieri, G. and Drioli, E., "Membrane technologies for CO2 separation," J. Membr. Sci. 359, 115-125 (2010).
Cavenati, S., Grande, C.A. and Rodrigues, A.E., "Upgrade of methane from landfill gas by pressure swing adsorption," Energy Fuels 19, 2545-2555 (2005).
Chakma, A., "CO2 capture processes — Opportunities for improved energy efficiencies," Energy Convers. Manage. 38, S51-S56 (1997).
Chakma, A., "Formulated solvents: New opportunities for energy efficient separation of acid gases," Energy Sources 21, 51-62 (1999).
Chapel, D.G., Mariz, C.L. and Ernest, J., "Recovery of CO2 from Flue Gases: Commercial Trends," Presented at the Canadian Society of Chemical Engineers Annual Meeting, Saskatoon, Saskatchewan, Canada, October 4-6, 1999.
Chenar, M.P., Soltanieh, M., Matsuura, T., Tabe-Mohammadi, A. and Feng, C., "Gas permeation properties of commercial polyphenylene oxide and Cardo-type polyimide hollow fiber membranes," Sep. Purif. Technol. 51, 359-366 (2006).
Chern, R.T., Koros, W.J. and Fedkiw, P.S., "Simulation of a hollow-fiber gas separator: the effects of process and design variables," Ind. Eng. Chem. Process Des. Dev. 24, 1015-1022 (1985).
Chowdhury, M.H.M., Feng, X., Douglas, P. and Croiset, E., "A new numerical approach for a detailed multicomponent gas separation membrane model and AspenPlus simulation," Chem. Eng. Technol. 28, 773-782 (2005).
Chowdhury, M.H.M., "Simulation, design and optimization of membrane gas separation, chemical absorption and hybrid processes for CO2 capture," PhD Dissertation, Chemical Engineering, University of Waterloo, ON, Canada (2012).
Coker, D.T., Freeman, B.D. and Fleming, G.K., "Modeling multicomponent gas separation using hollow-fiber membrane contactors," AICHE J. 44, 1289-1302 (1998).
Coker, D.T., Allen, T., Freeman, B.D. and Fleming, G.K., "Nonisothermal model for gas separation hollow-fiber membranes," AICHE J. 45, 1451-1468 (1999).
Corriou, J., Fonteix, C. and Favre, E., "Optimization of a pulsed operation of gas separation by membrane," AICHE J. 54, 1224-1234 (2008).

References
178
Crowder, R.O. and Cussler, E.L., "Mass transfer in hollow-fiber modules with non-uniform hollow fibers," J. Membr. Sci. 134, 235-244 (1997).
Cruz, P., Santos, J.C., Magalhaes, F.D. and Mendes, A., "Simulation of separation processes using finite volume method," Comput. Chem. Eng. 30, 83-98 (2005).
Dautzenberg, F.M. and Mukherjee, M., "Process intensification using multifunctional reactors," Chem. Eng. Sci. 56, 251-267 (2001).
Davis, J.C., Valus, R.J., Eshraghi, R. and Velikoff, A.E., "Facilitated transport membrane hybrid systems for olefin purification," Sep. Sci. Technol. 28, 463-476 (1993).
Demirbas, M.F., Balat, M. and Balat, H., "Biowastes-to-biofuels," Energy Convers. Manag. 52, 1815-1828 (2011).
Desideri, U. and Paolucci, A., "Performance modelling of a carbon dioxide removal system for power plants," Energy Convers. Manage. 40, 1899-1915 (1999).
Doshi, K.J., Werner, R.G., Mitariten, M.J. and UOP, "Integrated membrane/PSA process and system," US Patent 4,863,492 (1989).
Du, R., Chakma, A. and Feng, X., "Interfacially formed poly(N,N-dimethylaminoethyl methacrylate)/polysulfone composite membranes for CO2/N2 separation," J. Membr. Sci. 290, 19-28 (2007).
Echt, W., "Hybrid systems: Combining technologies leads to more efficient gas conditioning," 52nd Laurance Reid Gas Conditioning Conference, Oklahoma, 2002.
Environment Canada, "An inventory of landfill gas recovery and utilization in Canada-2005," Report prepared by the Greenhouse Gas Division of Environment Canada with the support of the University of Manitoba, Winnipeg (2007).
Environment Canada, “National inventory report 1990–2008: Greenhouse gas sources and sinks in Canada,” Catalogue No.: En81-4/2008E-PDF (2010), <http://www.ec.gc.ca/> [accessed: April 2012].
Esteves, I.A.A.C. and Mota, J.P.B., "Gas separation by a novel hybrid membrane/pressure swing adsorption process," Ind. Eng. Chem. Res. 46, 5723-5733 (2007).
Ettouney, H.M. and Majeed, U., "Permeability functions for pure and mixture gases in silicone rubber and polysulfone membranes: Dependence on pressure and composition," J. Membr. Sci. 135, 251-261 (1997).
Ettouney, H.M., El-Dessouky, H.T. and Abou Waar, W., "Separation characteristics of air by polysulfone hollow fiber membranes in series," J. Membr. Sci. 148, 105-117 (1998).
References
179
Favre, E., "Carbon dioxide recovery from post-combustion processes: Can gas permeation membranes compete with absorption?" J. Membr. Sci. 294, 50-59 (2007).
Favre, E., Bounaceur, R. and Roizard, D., "A hybrid process combining oxygen enriched air combustion and membrane separation for post-combustion carbon dioxide capture," Sep. Purif. Technol. 68, 30-36 (2009a).
Favre, E., Bounaceur, R. and Roizard, D., "Biogas, membranes and carbon dioxide capture," J. Membr. Sci. 328, 11-14 (2009b).
Feng, X., Pan, C.Y., Ivory, J. and Ghosh, D., "Integrated membrane/adsorption process for gas separation," Chem.Eng. Sci. 53, 1689-1698 (1998a).
Feng, X., Pan, C.Y., McMinis, C.W., Ivory, J. and Ghosh, D., "Hollow-fiber-based adsorbers for gas separation by pressure-swing adsorption," AICHE J. 44, 1555-1562 (1998b).
Feng, X., Ivory, J. and Rajan, V.S.V., "Air separation by integrally asymmetric hollow-fiber membranes," AIChE J. 45, 2142-2152 (1999).
Feng, X., Pan, C.Y. and Ivory, J., "Pressure swing permeation: Novel process for gas separation by membranes," AIChE J. 46, 724-733 (2000).
Feng, X., Shao, P., Huang, R.Y.M., Jiang, G. and Xu, R., "A study of silicone rubber/polysulfone composite membranes: Correlating H2/N2 and O2/N2 permselectivities," Sep. Purif. Technol. 27, 211-223 (2002).
Feng, X. and Lawless, D. “Unsteady state gas permeation process” US Patent 13,402,425 (filed Feb 22, 2012).
Freeman, B.D., "Basis of permeability/selectivity tradeoff relations in polymeric gas separation membranes," Macromolecules 32, 375-380 (1999).
Gardner, N., Manley, B.J.W. and Pearson, J.M., "Gas emissions from landfills and their contributions to global warming," Appl. Energy. 44, 165-174 (1993).
Geuzebroek, F.H., Schneiders, L.H.J.M., Kraaijveld, G.J.C. and Feron, P.H.M., "Exergy analysis of alkanolamine-based CO2 removal unit with AspenPlus," Energy 29, 1241-1248 (2004).
Giglia, S., Bikson, B., Perrin, J.E. and Donatelli, A.A., "Mathematical and experimental analysis of gas separation by hollow fiber membranes," Ind. Eng. Chem. Res. 30, 1239-1248 (1991).

References
180
Global Industry Analysts Inc., "Membrane separation technologies: A global strategic business report," (2011), <www.prweb.com/releases/prwebmembrane_separation/ technologies/prweb8953901.htm> [accessed: September 2012].
Gottschlich, D.E., Roberts, D.L., Wijmans, J.G., Bell, C. and Baker, R.W., "Economic comparison of several membrane configurations for H2/N2 separation," Gas Sep. Purif. 3, 170-179 (1989).
Gowing, A.L., "Measuring and modelling of landfill gas emissions," PhD Dissertation, Civil Engineering, University of Waterloo, ON, Canada (2001).
Graham, T., "On the absorption and dialytic separation of gases by colloid septa," Phil. Trans. R. Soc. Lond. 32, 399-439 (1866).
Haraya, K., Obata, K., Itoh, N., Shndo, Y., Hakuta, T. and Yoshitome, H., "Gas permeation and separation by an asymmetric polyimide hollow fiber membrane," J. Membr. Sci. 41, 23-35 (1989).
Haraya, K. and Hwang, S., "Permeation of oxygen, argon and nitrogen through polymer membranes," J. Membr. Sci. 71, 13-27 (1992).
Harun, N., "Dynamic simulation of MEA absorption process for CO2 capture from power plants," PhD Dissertation, Chemical Engineering, University of Waterloo, ON, Canada (2012).
Hassan, M.H., Douglas Way, J., Thoen, P.M. and Dillon, A.C., "Single component and mixed gas transport in a silica hollow fiber membrane," J. Membr. Sci. 104, 27-42 (1995).
Hassan, S.M.N., "Techno-economic study of CO2 capture process for cement plants," MASc Dissertation, Chemical Engineering, University of Waterloo, ON, Canada (2005).
Hassan, S.M.N., Douglas, P. and Croiset, E., "Techno-economic study of CO2 capture from an existing cement plant using MEA scrubbing," Int. J. Green Energy 4, 197-220 (2007).
Helmut, B., "Liquid ring vacuum pumps, compressors and systems: Conventional and hermetic design," Wiley-VCH, Weinheim, Germany (2005), pp. 101-104.
Higuchi, A. and Nakagawa, T., "Permselectivities through artificial membranes at a non-steady state," J. Appl. Polym. Sci. 37, 2181-2190 (1989).
Ho, M.T., Allinson, G.W. and Wiley, D.E., "Reducing the cost of CO2 capture from flue gases using membrane technology," Ind. Eng. Chem. Res. 47, 1562-1568 (2008).
References
181
Hosseini, S.S., Li, Y., Chung, T. and Liu, Y., "Enhanced gas separation performance of nanocomposite membranes using MgO nanoparticles," J. Membr. Sci. 302, 207-217 (2007).
Hughes, R. and Jiang, B., "Permeabilities of carbon dioxide, nitrous oxide and oxygen and their mixtures through silicone rubber and cellulose acetate membranes," Gas Sep. Purif. 9, 27-30 (1995).
IEA Greenhouse Gas R&D Programme, "Improvement in power generation with post-combustion capture of CO2," Report No. PH4/33 (2004).
Ilconich, J.B., Xu, X., Coleman, M. and Simpson, P.J., "Impact of ion beam irradiation on microstructure and gas permeance of polysulfone asymmetric membranes," J. Membr. Sci. 214, 143-156 (2003).
Jiang, X. and Kumar, A., "Modelling and process development for gaseous separation with silicone-coated polymeric membranes," Can. J. Chem. Eng. 86, 151-159 (2008).
Kaldis, S.P., Kapantaidakis, G.C., Papadopoulos, T.I. and Sakellaropoulos, G.P., "Simulation of binary gas separation in hollow fiber asymmetric membranes by orthogonal collocation," J. Membr. Sci. 142, 43-59 (1998).
Kaldis, S.P., Kapantaidakis, G.C. and Sakellaropoulos, G.P., "Simulation of multicomponent gas separation in a hollow fiber membrane by orthogonal collocation - hydrogen recovery from refinery gases," J. Membr. Sci. 173, 61-71 (2000).
Kao, Y.K., Yan, Z., Li, L. and Fan, H., "A pressure swing membrane separation process," Gas Sep. Purif. 5, 151-160 (1991).
Katoh, T., Tokumura, M., Yoshikawa, H. and Kawase, Y., "Dynamic simulation of multicomponent gas separation by hollow-fiber membrane module: nonideal mixing flows in permeate and residue sides using the tanks-in-series model," Sep. Purif. Technol. 76, 362-372 (2011).
Kesting, R.E. and Fritzsche, A.K., "Polymeric gas separation membranes," John Wiley & Sons., New York (1993).
Khan, M.M. and Islam, M.R., "Zero waste lifestyle with inherently sustainable technologies," in: "Zero waste engineering," John Wiley & Sons, Hoboken, NJ, USA (2012), pp. 185-216.
Kimura, S.G. and Browall, W.R., "Membrane oxygen enrichment," J. Membr. Sci. 29, 69-77 (1986).
References
182
Knaebel, K.S. and Reinhold, H.E., "Landfill gas: from rubbish to resource," Adsorption. 9, 87-94 (2003).
Koros, B., "Three hundred volumes," J. Membr. Sci. 300, 1-1 (2007).
Koros, W.J. and Chern, R.T., "Separation of gaseous mixtures using polymer membranes," in: Rousseau, R.W., Eds., "Handbook of Separation Process Technology," Wiley, New York (1987), pp. 862-953.
Koros, W.J. and Fleming, G.K., "Membrane-based gas separation," J. Membr. Sci. 83, 1-80 (1993).
Kovvali, A.S., Vemury, S. and Admassu, W., "Modeling of multicomponent countercurrent gas permeators," Ind. Eng. Chem. Res. 33, 896-903 (1994).
Krovvidi, K.R., Kovvali, A.S., Vemury, S. and Khan, A.A., "Approximate solutions for gas permeators separating binary mixtures," J. Membr. Sci. 66, 103-118 (1992).
Kumazawa, H., Sada, E., Nakata, K., Kawashima, N., Kataoka, S. and Tada, K., "Enrichment of helium by asymmetric hollow-fiber membrane of cellulose triacetate," J. Appl. Polym. Sci. 53, 113-119 (1994).
Kundu, P.K., Chakma, A. and Feng, X., "Simulation of binary gas separation with asymmetric hollow fibre membranes and case studies of air separation," Can. J. Chem. Eng. 90, 1253-1268 (2012a).
Kundu, P. K., Chakma, A. and Feng, X., "Modelling of multicomponent gas separation with asymmetric hollow fibre membranes—methane enrichment from biogas," Can. J. Chem. Eng. (2012b). DOI: 10.1002/cjce.21721.
Lababidi, H., Al-Enezi, G. and Ettouney, H.M., "Optimization of module configuration in membrane gas separation," J. Membr. Sci. 112, 185-197 (1996).
Laguntsov, N.I., Gruzdev, E.B., Kosykh, E.V. and Kozhevnickov, V.Y., "The use of recycle permeator systems for gas mixture separation," J. Membr. Sci. 67, 15-28 (1992).
LaPack, M.A. and Dupuis, F., "Dynamic membrane separation process for improved selectivity," US Patent 5,354,474 (1994).
Lee, B.D., Kim, D.M., Cho, J. and Park, S.W., "A comparative study on the carbon dioxide capture power between 30 wt% 2-amino-2-methyl-1-propanol and 30 wt% methyldiethanol amine aqueous solutions," Korean J. Chem. Eng. 26, 818-823 (2009).
References
183
Lee, S.Y., Minhas, B.S. and Donohue, M.D., "Effect of gas composition and pressure on permeation through cellulose acetate membranes," in: Sirkar, K.K. and Lloyd, D.R., Eds., AIChE Symp. Ser. 261, (1988), pp. 93-101.
Lee, W., Kim, D. and Kim, J., "Preparation and gas separation properties of asymmetric polysulfone membranes by a dual bath method," Korean J. Chem. Eng. 17, 143-148 (2000).
Lemanski, J. and Lipscomb, G.G., "Effect of fiber variation on the performance of countercurrent hollow fiber gas separation modules," J. Membr. Sci. 167, 241-252 (2000).
Li, K., Acharya, D.R. and Hughes, R., "Mathematical modelling of multicomponent membrane permeators," J. Membr. Sci. 52, 205-219 (1990).
Li, Y., Chung, T. and Xiao, Y., "Superior gas separation performance of dual-layer hollow fiber membranes with an ultrathin dense-selective layer," J. Membr. Sci. 325, 23-27 (2008).
Lim, S.P., Tan, X. and Li, K., "Gas/vapour separation using membranes: Effect of pressure drop in lumen of hollow fibres," Chem. Eng. Sci. 55, 2641-2652 (2000).
Lin, H., Merkel, T. and Baker, R., "The membrane solution to global warming," 6th Annual Conference on Carbon Capture & Sequestration, Pittsburgh, Pennsylvania, May, 2007.
Liu, L., Chakma, A. and Feng, X., "CO2/N2 Separation by poly(ether block amide) thin film hollow fiber composite membranes," Ind. Eng. Chem. Res. 44, 6874-6882 (2005).
Lokhandwala, K.A., Pinnau, I., He, Z., Amo, K.D., Da Costa, A.R., Wijmans, J.G. and Baker, R.W., "Membrane separation of nitrogen from natural gas: a case study from membrane synthesis to commercial deployment," J. Membr. Sci. 346, 270-279 (2010).
Lyons, P.C., "Coalbed methane potential in the appalachian states of Pennsylvania,West Virginia, Maryland, Ohio, Virginia, Kentucky, and Tennessee-An overview," Report: 96-735 (1996), <http://pubs.usgs.gov/of/1996/of96-735/cbm_comp.htm> [accessed: April 2012].
Maier, G., "Gas separation with polymer membranes," Angew. Chem. Int. Ed. 37, 2960-2974 (1998).
Majumdar, S., Heit, L.B., Sengupta, A. and Sirkar, K.K., "Experimental investigation of oxygen enrichment in a silicone capillary permeator with permeate recycle," Ind. Eng. Chem. Res. 26, 1434-1441 (1987).
Makaruk, A. and Harasek, M., "Numerical algorithm for modelling multicomponent multipermeator systems," J. Membr. Sci. 344, 258-265 (2009).
References
184
Marriott, J.I., Sørensen, E. and Bogle, I.D.L., "Detailed mathematical modelling of membrane modules," Comput. Chem. Eng. 25, 693-700 (2001).
Marriott, J. and Sørensen, E., "A general approach to modelling membrane modules," Chem. Eng. Sci. 58, 4975-4990 (2003).
Matsuura, T., "Synthetic membranes and membrane separation processes," CRC Press Inc., Boca Raton (1994).
Matteucci, Y., Yampolskii, Y., Freeman, B.D. and Pinnau, I., "Transport of gases and vapors in glassy and rubbery polymers," in: Yampolskii, Y., Pinnau, I. and Freeman, B.D., Eds., "Materials science of membranes for gas and vapor separation," John Wiley and Sons Ltd., England (2006), pp. 1-47.
McCandless, F.P., "A comparison of some recycle permeators for gas separations," J. Membr. Sci. 24, 15-28 (1985).
McCandless, F.P., "Iterative solution of multicomponent permeator model equations," J. Membr. Sci. 48, 115-122 (1990).
McKee, R.L., Changela, M.K. and Reading, G.J., "CO2 removal: membrane plus amine," Hydrocarbon Process. 70, 63-65 (1991).
Membrane Technology, "US membrane market grows 6.6% per year," Membr. Technol. 4 (2005).
Membrane Technology, "Liquid and gas separation membranes market set for solid growth," Membr. Technol. 3-4 (2009).
Membrane Technology and Research, "New project explores membrane process to convert landfill gas into useful fuel; multiple test sites sought (January 2012)," (2012), <http://www.mtrinc.com/news.html> [accessed: September 2012].
Mimura, T., Simayoshi, H., Suda, T., Iijima, M. and Mituoka, S., "Development of energy saving technology for flue gas carbon dioxide recovery in power plant by chemical absorption method and steam system," Energy Convers. Manage. 38, S57-S62 (1997).
Mofarahi, M., Khojasteh, Y., Khaledi, H. and Farahnak, A., "Design of CO2 absorption plant for recovery of CO2 from flue gases of gas turbine," Energy 33, 1311-1319 (2008).
Mulder, M., "Basic principles of membrane technology," 2nd ed., Kluwer Academic Publishers, Dordrecht, Netherlands (1996).
Narinsky, A.G., "Applicability conditions of idealized flow models for gas separation by asymmetric membrane," J. Membr. Sci. 55, 333-347 (1991).

References
185
Naylor, R.W. and Backer, P.O., "Enrichment calculations in gaseous diffusion: large separation factor," Chem. Eng. Prog. 1, 95-99 (1955).
Nemser, S.M., "Cyclic membrane separation process," US Patent 6,887,300 (2005).
Noble, R.D. and Stern, S.A., Eds., "Membrane separations technology: Principles and applications," Elsevier Science, Amsterdam, The Netherlands (1995).
Nunes, S. and Peinemann, K., "Membrane materials and membrane preparation," in: Nunes, S. and Peinemann, K., Eds., "Membrane technology in the chemical industry," Wiley-VCH, Weinhim (2006), pp. 3-92.
Omole, I.C., Adams, R.T., Miller, S.J. and Koros, W.J., "Effects of CO2 on a high performance hollow-fiber membrane for natural gas purification," Ind. Eng. Chem. Res. 49, 4887-4896 (2010).
Ostrem, K., "Greening Waste: Anaerobic digestion for treating the organic fraction of municipal solid wastes," MSc Dissertation, Earth and Environmental Engineering, Columbia University, New York (2004).
Pan, C.Y. and Habgood, H.W., "An analysis of the single-stage gaseous permeation process," Ind. Eng. Chem. Fundam. 13, 323-331 (1974).
Pan, C.Y. and Habgood, H.W., "Gas separation by permeation I. Calculation methods and parametric analysis," Can. J. Chem. Eng. 56, 197-209 (1978a).
Pan, C.Y. and Habgood, H.W., "Gas separation by permeation. II. Effect of permeate pressure drop and choice of permeate pressure," Can. J. Chem. Eng. 56, 210-217(1978b).
Pan, C.Y., "Gas separation by permeators with high-flux asymmetric membranes," AICHE J. 29, 545-552 (1983).
Pan, C.Y., "Gas separation by high-flux, asymmetric hollow-fiber membrane," AICHE J. 32, 2020-2027 (1986).
Pandey, P. and Chauhan, R.S., "Membranes for gas separation," Prog. Polym. Sci. 26, 853-893 (2001).
Paul, D., "Membrane separation of gases using steady cyclic operation," Ind. Eng. Chem. Proc. Des. Dev. 10, 375-379 (1971).
Peer, M., Mahdyarfar, M. and Mohammadi, T., "Evaluation of a mathematical model using experimental data and artificial neural network for prediction of gas separation," J. Nat. Gas Chem. 17, 135-141 (2008).
References
186
Peer, M., Mahdeyarfar, M. and Mohammadi, T., "Investigation of syngas ratio adjustment using a polyimide membrane," Chem. Eng. Process. 48, 755-761 (2009).
Perry, R.H. and Green, D.W., "Perry's chemical engineers' handbook," 7th ed., McGraw-Hill, New York (1997).
Pettersen, T. and Lien, K.M., "A new robust design model for gas separating membrane modules, based on analogy with counter-current heat exchangers," Comput. Chem. Eng. 18, 427-439 (1994a).
Pettersen, T. and Lien, K.M., "Insights into the design of optimal separation systems using membrane permeators," Comput. Chem. Eng. 18, S319-S324 (1994b).
Pfromm, P.H., Pinnau, I. and Koros, W.J., "Gas transport through integral-asymmetric membranes: A comparison to isotropic film transport properties," J. Appl. Polym. Sci. 48, 2161-2171 (1993).
Pinnau, I. and Freeman, B.D., "Membrane formation and modification overview," in: Pinnau, I. and Freeman, B.D., Eds., ACS Symp. Ser. 744, American Chemical Society, Washington, DC (2000), pp. 1-12.
Rao, A.B. and Rubin, E.S., "A technical, economic, and environmental assessment of amine-based CO2 capture technology for power plant greenhouse gas control," Environ. Sci. Technol. 36, 4467-4475 (2002).
Rasi, S., Läntelä, J. and Rintala, J., "Trace compounds affecting biogas energy utilisation – A review," Energy Convers. Manag. 52, 3369-3375 (2011).
Rautenbach, R. and Dahm, W., "The separation of multicomponent mixtures by gas permeation," Chem. Eng. Process. 19, 211-19 (1985).
Rautenbach, R. and Welsch, K., "Treatment of landfill gas by gas permeation-pilot plant results and comparison to alternatives," Desalination 90, 193-207 (1993).
Rice, L.H., “Membrane separation processes and systems for enhanced permeant recovery,” US Patent 7,812,207 (2007).
Robeson, L.M., "Correlation of separation factor versus permeability for polymeric membranes," J. Membr. Sci. 62, 165-185 (1991).
Romeo, L.M., Bolea, I. and Escosa, J.M., "Integration of power plant and amine scrubbing to reduce CO2 capture costs," Appl. Therm. Eng. 28, 1039-1046 (2008).

References
187
Sada, E., Kumazawa, H., Wang, J. and Koizumi, M., "Separation of carbon dioxide by asymmetric hollow fiber membrane of cellulose triacetate," J. Appl. Polym. Sci. 45, 2181-2186 (1992).
Schulz, G., "Gas separation in one- or two-step membrane processes," Chem. Eng. Process. 19, 235-241 (1985).
Sengupta, A. and Sirkar, K.K., "Multicomponent gas separation by an asymmetric permeator containing two different membranes," J. Membr. Sci. 21, 73-109 (1983).
Sengupta, A. and Sirkar, K.K., "Ternary gas mixture separation in two-membrane permeators," AICHE J. 33, 529-539 (1987).
Sengupta, A. and Sirkar, K.K., "Ternary gas separation using two different membranes," J. Membr. Sci. 39, 61-77 (1988).
Sengupta, A. and Sirkar, K.K., "Analysis and design of membrane permeators for gas separation," in: Noble, R.D. and Stern, S.A., Eds., "Membrane separations technology: principles and applications," Elsevier Science, Amsterdam, The Netherlands (1995), pp. 499-552.
Singh, D., Croiset, E., Douglas, P.L. and Douglas, M.A., "Techno-economic study of CO2 capture from an existing coal-fired power plant: MEA scrubbing vs. O2/CO2 recycle combustion," Energy Convers. Manage. 44, 3073-3091 (2003).
Singh, V., Rhinehart, R.R., Narayan, R.S. and Tock, R.W., "Transport analysis of hollow fiber gas separation membranes," Ind. Eng. Chem. Res. 34, 4472-4478 (1995).
Shampine, L.F., Gladwell, I. and Thompson, S., "Solving ODEs with MATLAB," 1st ed., Cambridge University Press, Cambridge (2003).
Shao, P. and Huang, R.Y.M., "An analytical approach to the gas pressure drop in hollow fiber membranes," J. Membr. Sci. 271, 69-76 (2006).
Sidhoum, M., Sengupta, A. and Sirkar, K.K., "Asymmetric cellulose acetate hollow fibers: Studies in gas permeation," AICHE J. 34, 417-425 (1988).
Sidhoum, M., Majumdar, S. and Sirkar, K.K., "Internally staged hollow-fiber permeator for gas separation," AICHE J. 35, 764-774 (1989).
Sirkar, K.K., "Separation of gaseous mixtures with asymmetric dense polymeric membranes," Chem. Eng. Sci. 32, 1137-1145 (1977).
Skoulidas, A.I. and Sholl, D.S., "Multiscale models of sweep gas and porous support effects on zeolite membranes," AICHE J. 51, 867-877 (2005).
References
188
Spillman, R.W., "Economics of gas separation membranes," Chem. Eng. Prog. 85, 41-62 (1989).
Statistics Canada, "Human activity and the environment," Catalogue no. 16-201-XIE (2005), <http://www.statcan.gc.ca/> [accessed: April 2012].
Statistics Canada, "Waste management industry survey: Business and government sectors," Catalogue no. 16F0023X (2008), <http://www.statcan.gc.ca/> [accessed: April 2012].
Stern, S.A., Sinclair, T.F., Gareis, P.J., Vahldieck, N.P. and Mohr, P.H., "Helium recovery by permeation," Ind. Eng. Chem. Res. 57, 49-60 (1965).
Stern, S.A., Perrin, J.E. and Naimon, E.J., "Recycle and multimembrane permeators for gas separations," J. Membr. Sci. 20, 25-43 (1984).
Tchobanoglous, G. and Kreith, F., "Handbook of solid waste management," 2nd ed., McGraw-Hill, New York (2002).
Thompson, S., Sawyer, J., Boman, R. and Smith, S., "Recommendations for improving the Canadian methane generation model for landfills," Report prepared for Environment Canada on contract in association with Environment Canada and University of Manitoba, Winnipeg (2006).
Thompson, S., Sawyer, J., Bonam, R. and Valdivia, J.E., "Building a better methane generation model: Validating models with methane recovery rates from 35 Canadian landfills," Waste Manage. 29, 2085-2091 (2009).
Thorman, J.M. and Hwang, S.T., "Compressible flow in permeable capillaries under deformation," Chem. Eng. Sci. 33, 15-20 (1978).
Thundyil, M.J. and Koros, W.J., "Mathematical modeling of gas separation permeators - for radial crossflow, countercurrent, and cocurrent hollow fiber membrane modules," J. Membr. Sci. 125, 275-291 (1997).
Tsuru, T. and Hwang, S., "Evaluation of retentate recycle effect on enrichment of less permeable gas component in a membrane permeator," J. Membr. Sci. 94, 213-224 (1994).
Ueda, K., Haruna, K. and Inoue, M., "Process for separating gas," US Patent 4,955,998 (1990).
Vallieres, C. and Favre, E., "Vacuum versus sweeping gas operation for binary mixtures separation by dense membrane processes," J. Membr. Sci. 244, 17-23 (2004).
References
189
Visser, T., Koops, G.H. and Wessling, M., "On the subtle balance between competitive sorption and plasticization effects in asymmetric hollow fiber gas separation membranes," J. Membr. Sci. 252, 265-277 (2005).
Walawender, W.P. and Stern, S.A., "Analysis of membrane separation parameters. II. counter-current and cocurrent flow in a single permeation stage," Sep. Sci. Technol. 7, 553-584 (1972).
Wang, D., Li, K. and Teo, W.K., "Effects of temperature and pressure on gas permselection properties in asymmetric membranes," J. Membr. Sci. 105, 89-101 (1995).
Wang, L., Corriou, J., Castel, C. and Favre, E., "A critical review of cyclic transient membrane gas separation processes: State of the art, opportunities and limitations," J. Membr. Sci. 383, 170-188 (2011).
Wang, R., Liu, S.L., Lin, T.T. and Chung, T.S., "Characterization of hollow fiber membranes in a permeator using binary gas mixtures," Chem. Eng. Sci. 57, 967-976 (2002).
Weller, S. and Steiner, W.A., "Separation of gases by fractional permeation through membranes," J. Appl. Phys. 21, 279-283 (1950).
Wijmans, J.G. and Baker, R.W., "The solution-diffusion model: A review," J. Membr. Sci. 107, 1-21 (1995).
Williams, P.T., "Waste treatment and disposal," 2nd ed., John Wiley & Sons., Chichester, England (2005).
Xie, Z., Duong, T., Hoang, M., Nguyen, C. and Bolto, B., "Ammonia removal by sweep gas membrane distillation," Water Res. 43, 1693-1699 (2009).
Xu, J., Furuswa, M. and Ito, A., "Air-sweep vacuum membrane distillation using fine silicone, rubber, hollow-fiber membranes," Desalination 191, 223-231 (2006).
Yampolskii, Y., "Polymeric gas separation membranes," Macromolecules. 45, 3298-3311 (2012).
Zakaria, R., "Hydrogen separation using asymmetric cellulose acetate hollow fiber membranes," MASc Dissertation, University of Waterloo, Canada (2006).
Zhao, L., Riensche, E., Menzer, R., Blum, L. and Stolten, D., "A parametric study of CO2/N2 gas separation membrane processes for post-combustion capture," J. Membr. Sci. 325, 284-294 (2008).

Appendix A
190
Extent of separation at permeate vacuum operation
Figures A.1 and A.2 represent the extent of separation achieved for feed
compression and permeate vacuum operation (fibers are exposed to air), respectively.
Details of membrane properties and module dimensions are provided in Chapter 3.
Stage Cut0.0 0.2 0.4 0.6 0.8 1.0
Per
mea
te O
2, m
ole
frac
tion
0.2
0.3
0.4
0.5
0.6Cellulose AcetatePolysulfone
Stage Cut0.0 0.2 0.4 0.6 0.8 1.0
O2
Pro
duct
ivit
y, m
ol/m
2 .hr
0.5
1.0
1.5
2.0
2.5
3.0
1035 kPa1035 kPa
(a) (b)
Fig. A.1: (a) permeate O2 purity vs. stage cut, and (b) O2 productivity vs. stage cut, for feed compression operation.
Abs. Pressure, kPa
0 20 40 60 80
Per
mea
te O
2, m
ole
frac
tion
0.2
0.3
0.4
0.5
0.6
0.7Cellulose AcetatePolysulfone
Abs. Pressure, kPa0 20 40 60 80
O2
Pro
duct
ivit
y, m
ol/m
2 .hr
0.0
0.1
0.2
0.3
0.4(a) (b)
Fig. A.2: (a) permeate O2 purity vs. absolute pressure, and (b) O2 productivity vs. absolute pressure, for permeate vacuum operation.

Appendix B
191
Methane production from Canadian municipal solid wastes
In 2008, Canadians produced over 1 ton of waste per person, and about 76% of the
waste was disposed of in landfills or was incinerated (Statistics Canada, 2008). Landfills
have been the traditional repositories for solid wastes in Canada. Since Canada does not
rely much on incineration for volume reduction, 95% of the waste disposed ends up in
landfills (Statistics Canada, 2005). Table B.1 shows the amount of methane generated from
anaerobic digestion and landfills in Canada. The data also shows the amount of methane
captured and the amount emitted to the atmosphere. As expected, Ontario and Quebec,
which have the largest populations in Canada, are the largest producers of landfill methane,
followed by British Columbia and Alberta. In Ontario, 27.1% of the methane generated in
landfills is captured, and 30.7% of the methane generated is captured in Quebec. The
overall methane generation from Canadian landfills is about 1.45 Mt/yr, with only 21.3%
being captured. The total potential renewable methane production from Canadian
municipal wastes was estimated to be 3.2 Mt/yr, which represents a significant potential
addition to the natural gas supply (Abboud et. al, 2010). In 2008, the Canadian waste
sector, including municipal and industrial landfills, emitted a total of 22 Mt of carbon
dioxide equivalent. Remarkably, the national greenhouse gas emissions from the waste
sector decreased from 3.19% in 1990 to 2.59% in 2008. The decrease in the national
emission was reported to be mainly due to the introduction of landfill gas collection and
utilization (Environment Canada, 2010). There is still an enormous potential to increase
methane capture from biogases, making a good use of CH4 and CO2 for various
applications.
Abboud et al. (2010) analyzed the economic aspects of four different scenarios
involving the production of biogas in Canada: an industrial scale anaerobic biogas plant
processing feedlot manure and producing pipeline grade natural gas, the same plant
producing power only without upgrading the gas, a gasification plant processing forest
biomass to produce power and heat for an adjacent pulp mill, and a large landfill producing
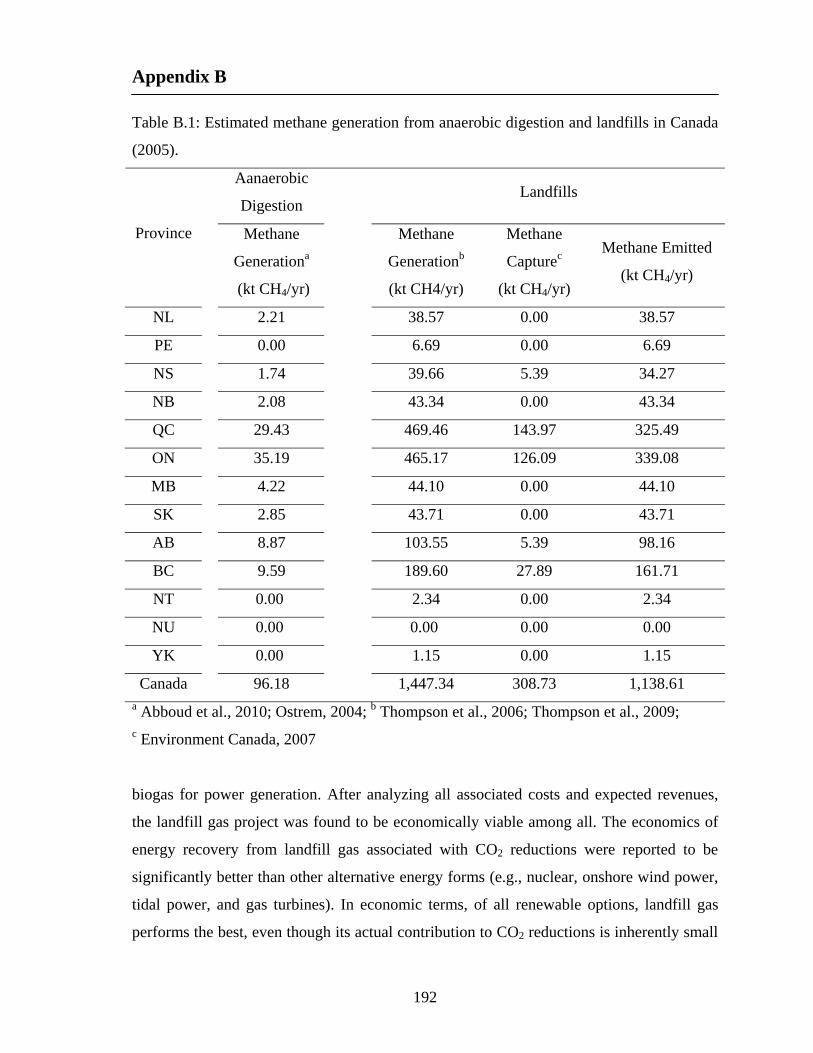
Appendix B
192
Table B.1: Estimated methane generation from anaerobic digestion and landfills in Canada
(2005).
Aanaerobic
Digestion
Landfills
Province
Methane
Generationa
(kt CH4/yr)
Methane
Generationb
(kt CH4/yr)
Methane
Capturec
(kt CH4/yr)
Methane Emitted
(kt CH4/yr)
NL 2.21 38.57 0.00 38.57
PE 0.00 6.69 0.00 6.69
NS 1.74 39.66 5.39 34.27
NB 2.08 43.34 0.00 43.34
QC 29.43 469.46 143.97 325.49
ON 35.19 465.17 126.09 339.08
MB 4.22 44.10 0.00 44.10
SK 2.85 43.71 0.00 43.71
AB 8.87 103.55 5.39 98.16
BC 9.59 189.60 27.89 161.71
NT 0.00 2.34 0.00 2.34
NU 0.00 0.00 0.00 0.00
YK 0.00 1.15 0.00 1.15
Canada 96.18 1,447.34 308.73 1,138.61 a Abboud et al., 2010; Ostrem, 2004; b Thompson et al., 2006; Thompson et al., 2009; c Environment Canada, 2007
biogas for power generation. After analyzing all associated costs and expected revenues,
the landfill gas project was found to be economically viable among all. The economics of
energy recovery from landfill gas associated with CO2 reductions were reported to be
significantly better than other alternative energy forms (e.g., nuclear, onshore wind power,
tidal power, and gas turbines). In economic terms, of all renewable options, landfill gas
performs the best, even though its actual contribution to CO2 reductions is inherently small
Appendix B
193
(Gardner et al., 1993). Harnessing biogas for energy production and/or fuel power is one of
the most promising options that encourages more efficient gas collection systems. This will
reduce global methane emissions into the atmosphere and generate additional revenues for
landfill operators via commercialization of green power and carbon credits for emission
reductions. However, separating methane from biogas for energy production is not always
perceived as an attractive option because of the lack of efficient separation techniques. It is
thus necessary to develop energy-efficient membrane technology for methane separation
from biogas from a techno-economic perspective and to motivate utilization of biogases as
an energy source.
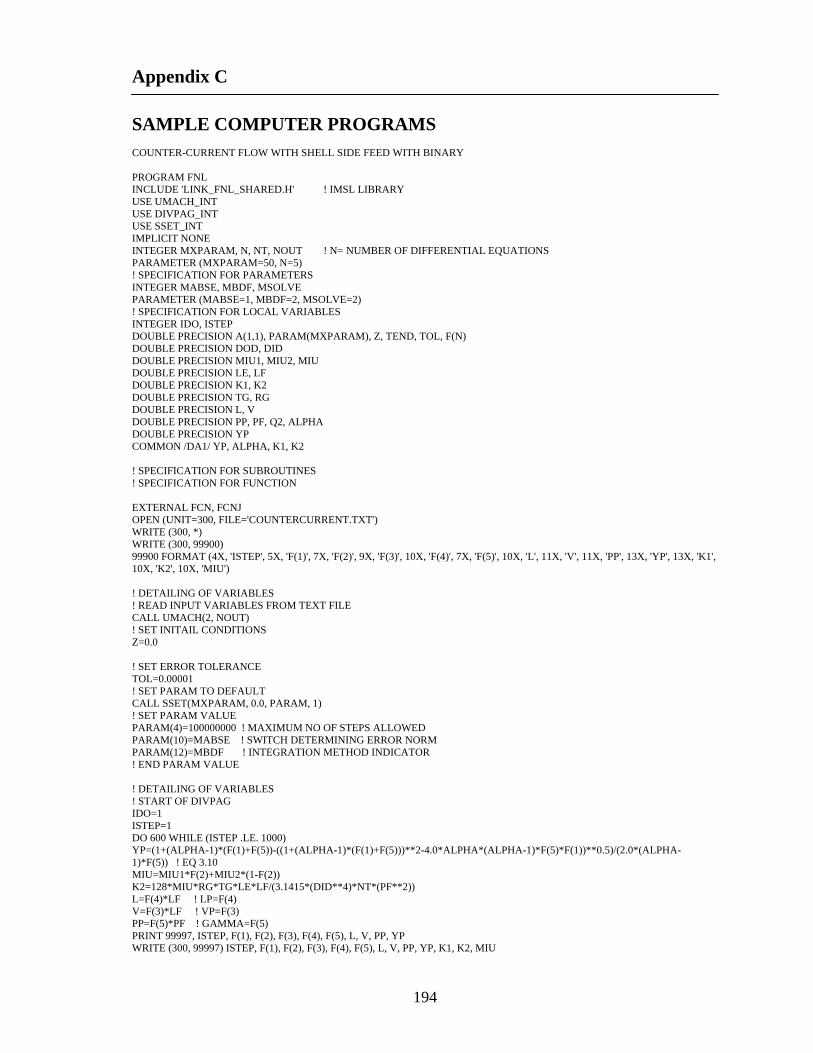
Appendix C
194
SAMPLE COMPUTER PROGRAMS COUNTER-CURRENT FLOW WITH SHELL SIDE FEED WITH BINARY PROGRAM FNL INCLUDE 'LINK_FNL_SHARED.H' ! IMSL LIBRARY USE UMACH_INT USE DIVPAG_INT USE SSET_INT IMPLICIT NONE INTEGER MXPARAM, N, NT, NOUT ! N= NUMBER OF DIFFERENTIAL EQUATIONS PARAMETER (MXPARAM=50, N=5) ! SPECIFICATION FOR PARAMETERS INTEGER MABSE, MBDF, MSOLVE PARAMETER (MABSE=1, MBDF=2, MSOLVE=2) ! SPECIFICATION FOR LOCAL VARIABLES INTEGER IDO, ISTEP DOUBLE PRECISION A(1,1), PARAM(MXPARAM), Z, TEND, TOL, F(N) DOUBLE PRECISION DOD, DID DOUBLE PRECISION MIU1, MIU2, MIU DOUBLE PRECISION LE, LF DOUBLE PRECISION K1, K2 DOUBLE PRECISION TG, RG DOUBLE PRECISION L, V DOUBLE PRECISION PP, PF, Q2, ALPHA DOUBLE PRECISION YP COMMON /DA1/ YP, ALPHA, K1, K2 ! SPECIFICATION FOR SUBROUTINES ! SPECIFICATION FOR FUNCTION EXTERNAL FCN, FCNJ OPEN (UNIT=300, FILE='COUNTERCURRENT.TXT') WRITE (300, *) WRITE (300, 99900) 99900 FORMAT (4X, 'ISTEP', 5X, 'F(1)', 7X, 'F(2)', 9X, 'F(3)', 10X, 'F(4)', 7X, 'F(5)', 10X, 'L', 11X, 'V', 11X, 'PP', 13X, 'YP', 13X, 'K1', 10X, 'K2', 10X, 'MIU') ! DETAILING OF VARIABLES ! READ INPUT VARIABLES FROM TEXT FILE CALL UMACH(2, NOUT) ! SET INITAIL CONDITIONS Z=0.0 ! SET ERROR TOLERANCE TOL=0.00001 ! SET PARAM TO DEFAULT CALL SSET(MXPARAM, 0.0, PARAM, 1) ! SET PARAM VALUE PARAM(4)=100000000 ! MAXIMUM NO OF STEPS ALLOWED PARAM(10)=MABSE ! SWITCH DETERMINING ERROR NORM PARAM(12)=MBDF ! INTEGRATION METHOD INDICATOR ! END PARAM VALUE ! DETAILING OF VARIABLES ! START OF DIVPAG IDO=1 ISTEP=1 DO 600 WHILE (ISTEP .LE. 1000) YP=(1+(ALPHA-1)*(F(1)+F(5))-((1+(ALPHA-1)*(F(1)+F(5)))**2-4.0*ALPHA*(ALPHA-1)*F(5)*F(1))**0.5)/(2.0*(ALPHA-1)*F(5)) ! EQ 3.10 MIU=MIU1*F(2)+MIU2*(1-F(2)) K2=128*MIU*RG*TG*LE*LF/(3.1415*(DID**4)*NT*(PF**2)) L=F(4)*LF ! LP=F(4) V=F(3)*LF ! VP=F(3) PP=F(5)*PF ! GAMMA=F(5) PRINT 99997, ISTEP, F(1), F(2), F(3), F(4), F(5), L, V, PP, YP WRITE (300, 99997) ISTEP, F(1), F(2), F(3), F(4), F(5), L, V, PP, YP, K1, K2, MIU

Appendix C
195
IF (ISTEP .EQ. 1000) IDO=3 ISTEP=ISTEP+1 TEND=(DOUBLE PRECISION (ISTEP)/1000) CALL DIVPAG (IDO, FCN, FCNJ, Z, TEND, F, TOL=TOL) PRINT 99997, ISTEP, F(1), F(2), F(3), F(4), F(5), L, V, PP, YP ! PRINT*, PARAM(35) 600 CONTINUE 99997 FORMAT(1X, I6, 2X, 2F11.6, 2X, F12.6, 2X, 2F11.6, 2X, 2E12.3, 2X, E12.5, 2X, F11.6, 4X, 3F12.8) ! PRINT*,YPRIME(1), YPRIME(2), YPRIME(3), YPRIME(4), YPRIME(5) ! WRITE(NOUT, 99999) PARAM(35) ! 99999 FORMAT(4X, 'NUMBER OF FCN CALLS WITH DIVPAG=', F6.0) END SUBROUTINE FCN(N, Z, F, YPRIME) ! USER SUPPLIED SUBROUTINE TO EVALUATE FUNCTIONS INTEGER N DOUBLE PRECISION Z, F(N), YPRIME(N) DOUBLE PRECISION YP, ALPHA, K1, K2 COMMON /DA1/ YP, ALPHA, K1, K2 YPRIME(4)=-K1*(ALPHA*(F(1)-F(5)*YP)+((1-F(1))-F(5)*(1-YP))) ! EQ 3.11 YPRIME(3)=-K1*(ALPHA*(F(1)-F(5)*YP)+((1-F(1))-F(5)*(1-YP))) ! EQ 3.12 YPRIME(1)=-K1*(ALPHA*(1-F(1))*(F(1)-F(5)*YP)-F(1)*((1-F(1))-F(5)*(1-YP)))/F(4) ! EQ 3.13 YPRIME(5)=K2*F(3)/F(5) ! EQ 3.14 YPRIME(2)=-K1*(ALPHA*(1-F(2))*(F(1)-F(5)*YP)-F(2)*((1-F(1))-F(5)*(1-YP)))/F(3) ! EQ 3.16 RETURN END SUBROUTINE FCNJ(N, Z, F, DYPDY) ! USER SUPPLIED SUBROUTINE TO COMPUTE THE JACOBIAN INTEGER N DOUBLE PRECISION Z, F(N), DYPDY(N,*) RETURN END CALCULATE ALL THE SOLUTION FOR SINGLE STAGE PERMEATOR ! THIS SECTION CALCULATES ALL POSSIBLE SOLUTION CALL NSGA2 (ALOW, AHIGH, LSUBSTR, FACTOR) ! THIS SUBROUTINE DEFINES THE OBJECTIVES SUBROUTINE SIMUL(NPARAM,X,SIMULOUT, PUR, SEL) IMPLICIT DOUBLE PRECISION (A-H,O-Z) PARAMETER (NDATAS=10) ! ONLY NDATA HERE INTEGER IPOPSIZE, LCHROM, MAXGEN, NCROSS, NMUTE, NPARAMM, IGEN, NOBJFN, I, J DOUBLE PRECISION X(NPARAM), SIMULOUT(NDATAS), PEN, PCROSS, PMUTE, PJUMP DOUBLE PRECISION PUR, SEL COMMON/SGAPARAM/IPOPSIZE, LCHROM, MAXGEN, NCROSS, NMUTE, NPARAMM COMMON/SGAPARAM1/PCROSS, PMUTE, PJUMP COMMON/STATIST/IGEN, AVG, AMAX, MEMSP, SUMFITNESS EXTERNAL MEMBR2 ! CALL EXTERNAL FILE FOR SIMULATION ! COUNTER-CURRENT FLOW WITH SHELL SIDE FEED WITH MULTICOMPONENT PROGRAM FNL INCLUDE 'LINK_FNL_SHARED.H' USE UMACH_INT USE NEQNF_INT USE DIVPAG_INT USE SSET_INT INTEGER MXPARAM, N, NT, NE, ITMAX, NOUT ! N= NUMBER OF DIFFERENTIAL EQUATIONS PARAMETER (MXPARAM=50, N=7, NE=2) ! SPECIFICATION FOR PARAMETERS INTEGER MABSE, MBDF, MSOLVE PARAMETER (MABSE=1, MBDF=2, MSOLVE=2) ! SPECIFICATION FOR LOCAL VARIABLES INTEGER IDO, ISTEP DOUBLE PRECISION A(1,1), PARAM(MXPARAM), Z, TEND, TOL, F(N) DOUBLE PRECISION DOD, DID DOUBLE PRECISION MIU1, MIU2, MIU3, MIU
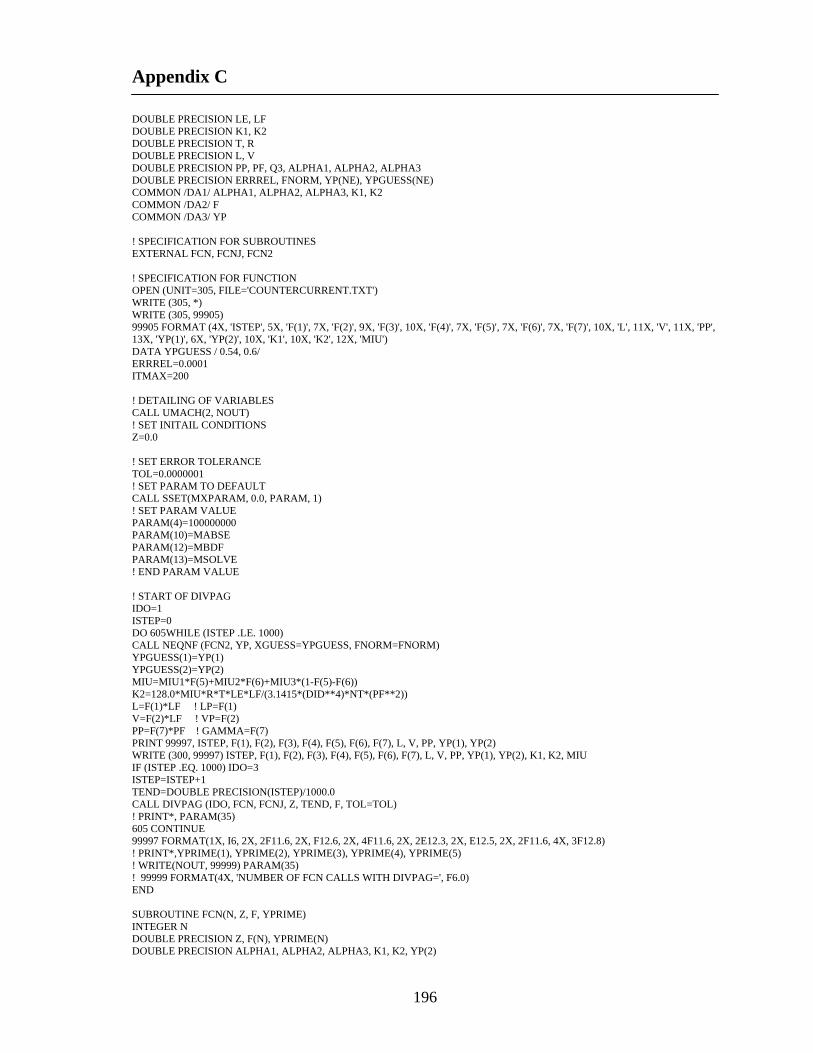
Appendix C
196
DOUBLE PRECISION LE, LF DOUBLE PRECISION K1, K2 DOUBLE PRECISION T, R DOUBLE PRECISION L, V DOUBLE PRECISION PP, PF, Q3, ALPHA1, ALPHA2, ALPHA3 DOUBLE PRECISION ERRREL, FNORM, YP(NE), YPGUESS(NE) COMMON /DA1/ ALPHA1, ALPHA2, ALPHA3, K1, K2 COMMON /DA2/ F COMMON /DA3/ YP ! SPECIFICATION FOR SUBROUTINES EXTERNAL FCN, FCNJ, FCN2 ! SPECIFICATION FOR FUNCTION OPEN (UNIT=305, FILE='COUNTERCURRENT.TXT') WRITE (305, *) WRITE (305, 99905) 99905 FORMAT (4X, 'ISTEP', 5X, 'F(1)', 7X, 'F(2)', 9X, 'F(3)', 10X, 'F(4)', 7X, 'F(5)', 7X, 'F(6)', 7X, 'F(7)', 10X, 'L', 11X, 'V', 11X, 'PP', 13X, 'YP(1)', 6X, 'YP(2)', 10X, 'K1', 10X, 'K2', 12X, 'MIU') DATA YPGUESS / 0.54, 0.6/ ERRREL=0.0001 ITMAX=200 ! DETAILING OF VARIABLES CALL UMACH(2, NOUT) ! SET INITAIL CONDITIONS Z=0.0 ! SET ERROR TOLERANCE TOL=0.0000001 ! SET PARAM TO DEFAULT CALL SSET(MXPARAM, 0.0, PARAM, 1) ! SET PARAM VALUE PARAM(4)=100000000 PARAM(10)=MABSE PARAM(12)=MBDF PARAM(13)=MSOLVE ! END PARAM VALUE ! START OF DIVPAG IDO=1 ISTEP=0 DO 605WHILE (ISTEP .LE. 1000) CALL NEQNF (FCN2, YP, XGUESS=YPGUESS, FNORM=FNORM) YPGUESS(1)=YP(1) YPGUESS(2)=YP(2) MIU=MIU1*F(5)+MIU2*F(6)+MIU3*(1-F(5)-F(6)) K2=128.0*MIU*R*T*LE*LF/(3.1415*(DID**4)*NT*(PF**2)) L=F(1)*LF ! LP=F(1) V=F(2)*LF ! VP=F(2) PP=F(7)*PF ! GAMMA=F(7) PRINT 99997, ISTEP, F(1), F(2), F(3), F(4), F(5), F(6), F(7), L, V, PP, YP(1), YP(2) WRITE (300, 99997) ISTEP, F(1), F(2), F(3), F(4), F(5), F(6), F(7), L, V, PP, YP(1), YP(2), K1, K2, MIU IF (ISTEP .EQ. 1000) IDO=3 ISTEP=ISTEP+1 TEND=DOUBLE PRECISION(ISTEP)/1000.0 CALL DIVPAG (IDO, FCN, FCNJ, Z, TEND, F, TOL=TOL) ! PRINT*, PARAM(35) 605 CONTINUE 99997 FORMAT(1X, I6, 2X, 2F11.6, 2X, F12.6, 2X, 4F11.6, 2X, 2E12.3, 2X, E12.5, 2X, 2F11.6, 4X, 3F12.8) ! PRINT*,YPRIME(1), YPRIME(2), YPRIME(3), YPRIME(4), YPRIME(5) ! WRITE(NOUT, 99999) PARAM(35) ! 99999 FORMAT(4X, 'NUMBER OF FCN CALLS WITH DIVPAG=', F6.0) END SUBROUTINE FCN(N, Z, F, YPRIME) INTEGER N DOUBLE PRECISION Z, F(N), YPRIME(N) DOUBLE PRECISION ALPHA1, ALPHA2, ALPHA3, K1, K2, YP(2)

Appendix C
197
COMMON /DA1/ ALPHA1, ALPHA2, ALPHA3, K1, K2 COMMON /DA3/ YP YPRIME(1)=-K1*((ALPHA1*F(3)+ALPHA2*F(4)+ALPHA3*(1-F(3)-F(4)))-(F(7)*(ALPHA1*YP(1)+ALPHA2*YP(2)+ALPHA3*(1-YP(1)-YP(2))))) ! EQ 4.2 YPRIME(2)=-K1*((ALPHA1*F(3)+ALPHA2*F(4)+ALPHA3*(1-F(3)-F(4)))-(F(7)*(ALPHA1*YP(1)+ALPHA2*YP(2)+ALPHA3*(1-YP(1)-YP(2))))) ! EQ 4.2 YPRIME(3)=-K1*((ALPHA1*(F(3)-F(7)*YP(1)))-F(3)*((ALPHA1*F(3)+ALPHA2*F(4)+ALPHA3*(1-F(3)-F(4))) F(7)*(ALPHA1*YP(1)+ALPHA2*YP(2)+ALPHA3*(1-YP(1)-YP(2)))))/F(1) ! EQ 4.7 YPRIME(4)=-K1*((ALPHA2*(F(4)-F(7)*YP(2)))-F(4)*((ALPHA1*F(3)+ALPHA2*F(4)+ALPHA3*(1-F(3)-F(4)))-F(7)*(ALPHA1*YP(1)+ALPHA2*YP(2)+ALPHA3*(1-YP(1)-YP(2)))))/F(1) ! EQ 4.7 %YPRIME(5)=-K1*((ALPHA1*(F(3)-F(7)*YP(1)))-F(5)*((ALPHA1*F(3)+ALPHA2*F(4)+ALPHA3*(1-F(3)-F(4)))-F(7)*(ALPHA1*YP(1)+ALPHA2*YP(2)+ALPHA3*(1-YP(1)-YP(2)))))/F(2) %YPRIME(6)=-K1*((ALPHA2*(F(4)-F(7)*YP(2)))-F(6)*((ALPHA1*F(3)+ALPHA2*F(4)+ALPHA3*(1-F(3)-F(4)))-F(7)*(ALPHA1*YP(1)+ALPHA2*YP(2)+ALPHA3*(1-YP(1)-YP(2)))))/F(2) YPRIME(7)=K2*F(2)/F(7) RETURN END SUBROUTINE FCNJ(N, Z, F, DYPDY) INTEGER N DOUBLE PRECISION Z, F(N), DYPDY(N,*) RETURN END SUBROUTINE FCN2(YP, R, NE) INTEGER NE DOUBLE PRECISION YP(NE), R(NE) DOUBLE PRECISION ALPHA1, ALPHA2, ALPHA3, K1, K2, F(7) COMMON /DA1/ ALPHA1, ALPHA2, ALPHA3, K1, K2 COMMON /DA2/ F R(1)=YP(1)-((ALPHA1*(F(3)-F(7)*YP(1)))/((ALPHA1*F(3)+ALPHA2*F(4)+ALPHA3*(1-F(3)-F(4)))-(F(7)*(ALPHA1*YP(1)+ALPHA2*YP(2)+ALPHA3*(1-YP(1)-YP(2)))))) ! EQ 4.5 R(2)=YP(2)-((ALPHA2*(F(4)-F(7)*YP(2)))/((ALPHA1*F(3)+ALPHA2*F(4)+ALPHA3*(1-F(3)-F(4)))-(F(7)*(ALPHA1*YP(1)+ALPHA2*YP(2)+ALPHA3*(1-YP(1)-YP(2)))))) ! EQ 4.5 RETURN END ! PRESSURE SWING PERMEATION FOR FLUE GAS (BINARY COMPONENT): STEP 2 PROGRAM FNL INCLUDE 'LINK_FNL_SHARED.H' USE UMACH_INT USE DIVPAG_INT USE SSET_INT USE LINEAR_OPERATORS IMPLICIT NONE INTEGER MXPARAM, N2, N4, NOUT PARAMETER (MXPARAM=50, N2=3, N4=5) ! INTRINSIC MOD ! SPECIFICATION FOR PARAMETERS INTEGER MABSE, MBDF, MSOLVE PARAMETER (MABSE=1, MBDF=2, MSOLVE=2) ! SPECIFICATION FOR LOCAL VARIABLES INTEGER IDO2 DOUBLE PRECISION A(1,1), PARAM(MXPARAM), TS2, TS4, TEND2, TEND4, TOL, F(N2), YPRIME(N2) DOUBLE PRECISION JA, JB DOUBLE PRECISION AR DOUBLE PRECISION T, R DOUBLE PRECISION VM, VF DOUBLE PRECISION X, Y, YM, YM1 DOUBLE PRECISION XF, XO, X1 DOUBLE PRECISION PO, P1, PV, ISTEP DOUBLE PRECISION QA, QB, QC COMMON /DA1/ JA, JB, AR, P1, PV, VF, VM, R, T COMMON /DA2/ XF, X1, XO COMMON /DA3/ X, Y, YM, YM1 COMMON /DA4/ QA, QB, QC ! SPECIFICATION FOR SUB ROUTINES ! SPECIFICATION FOR FUNCTION

Appendix C
198
EXTERNAL FCN2, FCNJ2 OPEN (UNIT=310, FILE='PRESSURE SWING PERMEATION.TXT') WRITE (310, *) WRITE (310, 99910) 99910 FORMAT (4X, 'ISTEP', 5X, 'F(1)', 7X, 'F(2)', 9X, 'F(3)', 12X, 'X2', 5X, 'Y2', 10X, 'YM2') ! DETAILING OF VARIABLES CALL UMACH(2, NOUT) ! SET INITAIL CONDITIONS FOR STEP # 2 TS2=0.0 F(1)=0.0 F(2)=0.0 F(3)=PV ! SET ERROR TOLERANCE TOL=0.000001 ! SET PARAM TO DEFAULT CALL SSET(MXPARAM, 0.0, PARAM, 1) ! SET PARAM VALUE PARAM = 0.0E0 PARAM(4)=100000000 PARAM(10)=MABSE PARAM(12)=MBDF PARAM(13)=MSOLVE ! END PARAM VALUE ! START OF EQUATIONS ! STEP # 1 X1=XF+(PO/P1)*(XO-XF) ! EQ 6.1 X=(((P1*VF)/(R*T))*X1+(F(1)+F(2))*XF-F(1))/((P1*VF)/(R*T)) ! EQ 6.5 QA=0.0 QB=0.0 ! STEP # 2 ! START OF DIVPAG IDO2=1 ISTEP=1 DO 610 WHILE (ISTEP .LE. 3000) IF (ISTEP .EQ. 3000) IDO2=3 TEND2=(DOUBLE PRECISION(ISTEP)/100) CALL DIVPAG (IDO2, FCN2, FCNJ2, TS2, TEND2, F, TOL=TOL) X=(((P1*VF)/(R*T))*X1+(F(1)+F(2))*XF-F(1))/((P1*VF)/(R*T)) ! EQ 6.5 Y=QA/(QA+QB) ! EQ 6.4 YM=(F(1)+((PV*VM*YM1)/(R*T)))/(F(1)+F(2)+((PV*VM)/(R*T))) ! EQ 6.6 ! PRINT*, PARAM(35) ! PAUSE PRINT 99997, (ISTEP/100), F(1), F(2), (F(3)*760/101325.0), X, Y, YM IF(ISTEP .EQ. 1 .OR. MOD(ISTEP,20.0) .EQ. 0) THEN WRITE (300, 99997) (ISTEP/100), F(1), F(2), (F(3)*760.0/101325.0), X, Y, YM, QA, QB, QC END IF ISTEP=ISTEP+1 610 CONTINUE 99997 FORMAT(1X, F6.2, 2X, 2F11.6, 2X, E12.6, 2X, 2F11.6, 2X, 3F12.6, 6X, F12.6) END SUBROUTINE FCN2(N2, TS2, F, YPRIME) INTEGER N2 DOUBLE PRECISION TS2, F(N2), YPRIME(N2) DOUBLE PRECISION JA, JB, AR, P1, PV, VF, VM, R, T DOUBLE PRECISION XF, X1, XO DOUBLE PRECISION X, Y, YM, YM1 COMMON /DA1/ JA, JB, AR, P1, PV, VF, VM, R, T COMMON /DA2/ XF, X1, XO COMMON /DA3/ X, Y, YM, YM1 COMMON /DA4/ QA, QB, QC ! PRINT*, JA, JB, AR, P1, PV, VF, VM, R, T ! PRINT*, XF, X1, XO

Appendix C
199
! PRINT*, X, Y, YM ! PAUSE ! PAUSE IF (F(3) .GE. 101325.0) THEN F(3)=101325.0 END IF YPRIME(1)=JA*AR*(P1*X-F(3)*Y) ! EQ 6.2 YPRIME(2)=JB*AR*(P1*(1-X)-F(3)*(1-Y)) ! EQ 6.3 YPRIME(3)=(YPRIME(1)+YPRIME(2))*(R*T/VM) ! EQ 6.8 QA=YPRIME(1) QB=YPRIME(2) QC=YPRIME(3) ! YM=F(1)/(F(1)+F(2)) ! EQ 6.7 ! YM=(F(1)+((PV*VM*YM1)/(R*T)))/(F(1)+F(2)+((PV*VM)/(R*T))) ! EQ 6.6 RETURN END SUBROUTINE FCNJ2(N2, TS2, F, DYPDY2) INTEGER N2 DOUBLE PRECISION TS2, F(N2), DYPDY2(N2,*) RETURN END ! PRESSURE SWING PERMEATION (BINARY COMPONENT): STEP 4 ! PROGRAM FNL INCLUDE 'LINK_FNL_SHARED.H' USE UMACH_INT USE DIVPAG_INT USE SSET_INT USE LINEAR_OPERATORS IMPLICIT NONE INTEGER MXPARAM, N2, N4, NOUT PARAMETER (MXPARAM=50, N4=5) ! SPECIFICATION FOR PARAMETERS INTEGER MABSE, MBDF, MSOLVE PARAMETER (MABSE=1, MBDF=2, MSOLVE=2) ! SPECIFICATION FOR LOCAL VARIABLES INTEGER IDO4 DOUBLE PRECISION A(1,1), PARAM(MXPARAM), TS4, TEND4, TOL4, FF(N4) DOUBLE PRECISION JA, JB, AR, VF, VM, R, T DOUBLE PRECISION PO, P1, P3, PV DOUBLE PRECISION X2, Y2, YM2 DOUBLE PRECISION X4, Y4, YM4 DOUBLE PRECISION X3, YM3 DOUBLE PRECISION XF DOUBLE PRECISION ISTEP4 COMMON /DA1/ JA, JB, AR, VF, VM, R, T COMMON /DA3/ X2, Y2, YM2 COMMON /DA5/ X4, Y4, YM4 COMMON /DA6/ X3, YM3 ! SPECIFICATION FOR SUB ROUTINES ! SPECIFICATION FOR FUNCTION EXTERNAL FCN4, FCNJ4 ! OPENING FILE TO SAVE DATA FOR STEP # 4 OPEN (UNIT=315, FILE='PRESSURESWINGPERMEATIONSTEP4.TXT') WRITE (315, *) WRITE (315, 44444) 44444 FORMAT (4X, 'ISTEP4', 5X, 'FF(1)', 7X, 'FF(2)', 7X, 'FF(3)', 7X, 'FF(4)',7X, 'FF(5)', 7X, 'X4', 7X, 'Y4', 7X, 'YM4') ! DETAILING OF VARIABLES CALL UMACH(2, NOUT) ! SET ERROR TOLERANCE TOL4=0.000001 ! SET PARAM TO DEFAULT
Appendix C
200
CALL SSET(MXPARAM, 0.0, PARAM, 1) ! SET PARAM VALUE PARAM(4)=100000000 PARAM(10)=MABSE PARAM(12)=MBDF PARAM(13)=MSOLVE ! END PARAM VALUE ! START OF EQUATIONS ! SET INITAIL CONDITIONS FOR STEP # 4 TS4=0.0 FF(1)=0.0 FF(2)=0.0 FF(3)=P1 FF(4)=0.0 FF(5)=0.0 P3=P1 X3=X2 YM3=YM2 ! STEP # 4 ! START OF DIVPAG IDO4=1 ISTEP4=1 DO 44 WHILE (ISTEP4 .LE. 600) IF (ISTEP4 .EQ. 600) IDO4=3 TEND4=(DOUBLE PRECISION(ISTEP4)/10) ! PRINT*, F(1), F(2), F(3), X2, Y2, YM2 ! PAUSE CALL DIVPAG (IDO4, FCN4, FCNJ4, TS4, TEND4, FF, TOL=TOL4) ! PRINT*, PARAM(35) PRINT 44447, (ISTEP4/10), FF(1), FF(2), (FF(3)*760/101325), FF(4), FF(5), X4, Y4, YM4 IF(ISTEP4 .EQ. 1 .OR. MOD(ISTEP4,1.0) .EQ. 0) THEN WRITE (400, 44447) (ISTEP4/10), FF(1), FF(2), (FF(3)*760/101325), FF(4), FF(5), X4, Y4, YM4 END IF ISTEP4=ISTEP4+1 44 CONTINUE 44447 FORMAT(1X, F6.2, 2X, 2F11.6, 2X, E12.3, 2X, 5F11.6) END SUBROUTINE FCN4(N4, TS4, FF, YYPRIME) INTEGER N4 DOUBLE PRECISION TS4, FF(N4), YYPRIME(N4) DOUBLE PRECISION JA, JB, AR, VF, VM, R, T DOUBLE PRECISION PO, P1, P3, PV DOUBLE PRECISION X4, Y4, YM4 DOUBLE PRECISION X3, YM3 COMMON /DA1/ JA, JB, AR, VF, VM, R, T COMMON /DA2/ PO, P1, P3, PV COMMON /DA5/ X4, Y4, YM4 COMMON /DA6/ X3, YM3 YYPRIME(1)=JA*AR*(FF(3)*X4-PV*Y4) ! EQ 6.2 YYPRIME(2)=JB*AR*(FF(3)*(1-X4)-PV*(1-Y4)) ! EQ 6.3 YYPRIME(3)=-(YYPRIME(1)+YYPRIME(2))*(R*T/VF) ! EQ 6.9 X4=(((P3*VF)/(R*T))*X3-FF(1))/((P3*VF)/(R*T)) ! EQ 6.10 YYPRIME(4)=YYPRIME(1)+YYPRIME(2) ! EQ 6.11 Y4=FF(5)/(FF(1)+FF(2)) ! EQ 6.12 YYPRIME(5)=YM4*YYPRIME(4) ! EQ 6.13 YM4=(FF(1)+((PV*VM*YM3)/(R*T))-FF(5))/((PV*VM)/(R*T)) ! EQ 6.14 RETURN END SUBROUTINE FCNJ4(N4, TS4, FF, DYPDY4) INTEGER N4 DOUBLE PRECISION TS4, FF(N4), DYPDY4(N4,*) RETURN END
Appendix C
201
! INTRINSIC PERMEANCE-MATLAB BVP FUNCTION EXBVPX CLEAR ALL CLC GLOBAL PF PP NT MIU1 MIU2 MIU3 DOD DID ALPHA1 ALPHA2 ALPHA3 Q3 LE LF T R; YP=NLAE1(YPO); % FSOLVE TO MATCH THE MOLE FRACTION EQUALITY %WHILE (YP(1)+YP(2)+YP(3))~=1.0; %YP=NLAE1(YP); %END FUNCTION YP=NLAE1(YP) % GLOBAL PF PP NT MIU1 MIU2 MIU3 DOD DID ALPHA1 ALPHA2 ALPHA3 Q3 LE LF T R; YP=[((ALPHA1*(F(3)-F(7)*YP(1)))/((ALPHA1*F(3)+ALPHA2*F(4)+ALPHA3*(1-F(3)-F(4)))-(F(7)*(ALPHA1*YP(1)+ALPHA2*YP(2)+ALPHA3*YP(3))))) ((ALPHA2*(F(4)-F(7)*YP(2)))/((ALPHA1*F(3)+ALPHA2*F(4)+ALPHA3*(1-F(3)-F(4)))-(F(7)*(ALPHA1*YP(1)+ALPHA2*YP(2)+ALPHA3*YP(3))))) ((ALPHA3*((1-F(3)-F(4))-F(7)*YP(3)))/((ALPHA1*F(3)+ALPHA2*F(4)+ALPHA3*(1-F(3)-F(4)))-(F(7)*(ALPHA1*YP(1)+ALPHA2*YP(2)+ALPHA3*YP(3)))))]; END [YP]; [F(1) F(2) F(3) F(4) F(5) F(6) F(7)]; SOLINIT=BVPINIT(LINSPACE(0,1,10),F); OPTIONS=BVPSET('RELTOL', 1E-5); % DEFAULT TOLERANCE IS 1E-3, TOLERANCE IS USER DEFINED HERE. SOL=BVP4C(@ODEFUNX, @BCFUNX, SOLINIT,OPTIONS); XINT = LINSPACE(0,1); SXINT = DEVAL(SOL,XINT); SUBPLOT(4,2,1) PLOT(XINT,SXINT(1,:)) SUBPLOT(4,2,2) PLOT(XINT,SXINT(2,:)) SUBPLOT(4,2,3) PLOT(XINT,SXINT(3,:)) SUBPLOT(4,2,4) PLOT(XINT,SXINT(4,:)) SUBPLOT(4,2,5) PLOT(XINT,SXINT(5,:)) SUBPLOT(4,2,6) PLOT(XINT,SXINT(6,:)) SUBPLOT(4,2,7) PLOT(XINT,SXINT(7,:)) % DETAILING OF VARIABLES FUNCTION DFDZ=ODEFUNX(Z,F) % GLOBAL PF PP NT MIU1 MIU2 MIU3 DOD DID ALPHA1 ALPHA2 ALPHA3 Q3 LE LF T R; MIU=MIU1*F(5)+MIU2*F(6)+MIU3*(1-F(5)-F(6)); K1=3.1415*DOD*LE*NT*PF*Q3/LF; K2=128.0*MIU*R*T*LE*LF/(3.1415*(DID^4)*NT*(PF^2)); [YP]; F(1) F(2) F(3) F(4) F(5) F(6) F(7)]; DFDZ=[-K1*((ALPHA1*F(3)+ALPHA2*F(4)+ALPHA3*(1-F(3)-F(4)))-(F(7)*(ALPHA1*YP(1)+ALPHA2*YP(2)+ALPHA3*YP(3)))) -K1*((ALPHA1*F(3)+ALPHA2*F(4)+ALPHA3*(1-F(3)-F(4)))-(F(7)*(ALPHA1*YP(1)+ALPHA2*YP(2)+ALPHA3*YP(3)))) -K1*((ALPHA1*(F(3)-F(7)*YP(1)))-F(3)*((ALPHA1*F(3)+ALPHA2*F(4)+ALPHA3*(1-F(3)-F(4)))-F(7)*(ALPHA1*YP(1)+ALPHA2*YP(2)+ALPHA3*YP(3))))/F(1) -K1*((ALPHA2*(F(4)-F(7)*YP(2)))-F(4)*((ALPHA1*F(3)+ALPHA2*F(4)+ALPHA3*(1-F(3)-F(4)))-F(7)*(ALPHA1*YP(1)+ALPHA2*YP(2)+ALPHA3*YP(3))))/F(1) -K1*((ALPHA1*(F(3)-F(7)*YP(1)))-F(5)*((ALPHA1*F(3)+ALPHA2*F(4)+ALPHA3*(1-F(3)-F(4)))-F(7)*(ALPHA1*YP(1)+ALPHA2*YP(2)+ALPHA3*YP(3))))/F(2) -K1*((ALPHA2*(F(4)-F(7)*YP(2)))-F(6)*((ALPHA1*F(3)+ALPHA2*F(4)+ALPHA3*(1-F(3)-F(4)))-F(7)*(ALPHA1*YP(1)+ALPHA2*YP(2)+ALPHA3*YP(3))))/F(2) K2*F(2)/F(7)]; % F(1)=L [FEED FLOW RATE]; % F(2)=V [PERMEATE FLOW RATE]; % F(3)=X1 [FEED MOLE FRACTION (1ST PERMEATING COMPONENT)]; % F(4)=X2 [FEED MOLE FRACTION (2ND PERMEATING COMPONENT)]; % F(5)=Y1 [PERMEATE OUTLET MOL FRACTION (1ST PERMEATING COMPONENT)]; % F(6)=Y2 [PERMEATE OUTLET MOL FRACTION (2ND PERMEATING COMPONENT)];
Appendix C
202
% F(7)=GAMMA [PRESSURE RATIO]; % YP=LOCAL PERMEATE] [YP]; [F(1) F(2) F(3) F(4) F(5) F(6) F(7)]; % FSOLVE TO MATCH THE MOLE FRACTION EQUALITY WHILE (YP(1)+YP(2)+YP(3))~=1.0; YP=NLAE2(YP); END FUNCTION YP=NLAE2(YP) % GLOBAL PF PP NT MIU1 MIU2 MIU3 DOD DID ALPHA1 ALPHA2 ALPHA3 Q3 LE LF T R; [YP]; [F(1) F(2) F(3) F(4) F(5) F(6) F(7)]; YP=[((ALPHA1*(F(3)-F(7)*YP(1)))/((ALPHA1*F(3)+ALPHA2*F(4)+ALPHA3*(1-F(3)-F(4)))-(F(7)*(ALPHA1*YP(1)+ALPHA2*YP(2)+ALPHA3*YP(3))))) ((ALPHA2*(F(4)-F(7)*YP(2)))/((ALPHA1*F(3)+ALPHA2*F(4)+ALPHA3*(1-F(3)-F(4)))-(F(7)*(ALPHA1*YP(1)+ALPHA2*YP(2)+ALPHA3*YP(3))))) ((ALPHA3*((1-F(3)-F(4))-F(7)*YP(3)))/((ALPHA1*F(3)+ALPHA2*F(4)+ALPHA3*(1-F(3)-F(4)))-(F(7)*(ALPHA1*YP(1)+ALPHA2*YP(2)+ALPHA3*YP(3)))))]; END [YP]; [F(1) F(2) F(3) F(4) F(5) F(6) F(7)]; END FUNCTION RES=BCFUNX(FR,FL) % GLOBAL PF PP NT MIU1 MIU2 MIU3 DOD DID ALPHA1 ALPHA2 ALPHA3 Q3 LE LF T R; YPL=BCNLAE(YP); % WHILE (YPL(1)+YPL(2)+YPL(3))~=1.0; % YPL=BCNLAE(YPL); % END FUNCTION YPL=BCNLAE(YPL) YPL=[((ALPHA1*(FL(3)-FL(7)*YPL(1)))/((ALPHA1*FL(3)+ALPHA2*FL(4)+ALPHA3*(1-FL(3)-FL(4)))-(FL(7)*(ALPHA1*YPL(1)+ALPHA2*YPL(2)+ALPHA3*YPL(3))))) ((ALPHA2*(FL(4)-FL(7)*YPL(2)))/((ALPHA1*FL(3)+ALPHA2*FL(4)+ALPHA3*(1-FL(3)-FL(4)))-(FL(7)*(ALPHA1*YPL(1)+ALPHA2*YPL(2)+ALPHA3*YPL(3))))) ((ALPHA3*((1-FL(3)-FL(4))-FL(7)*YPL(3)))/((ALPHA1*FL(3)+ALPHA2*FL(4)+ALPHA3*(1-FL(3)-FL(4)))-(FL(7)*(ALPHA1*YPL(1)+ALPHA2*YPL(2)+ALPHA3*YPL(3)))))]; END [YP]; [YPL]; RES=[FR(1)-1.0 FL(2) FR(3)-0.50 FR(4)-0.03 FL(5)-YPL(1) FL(6)-YPL(2) FR(7)-PP/PF]; [FR(1) FR(2) FR(3) FR(4) FR(5) FR(6) FR(7)] [FL(1) FL(2) FL(3) FL(4) FL(5) FL(6) FL(7)] END END FUNCTION BVP2CINTRINSICMIXED CLEAR ALL CLC ALP(1)=81.96; % ALP(1)=SELECTIVITY=PERMH2/PERMN2 ALP(2)=0.7; % ALP(2)=PERMN2 PF=(600+101.325)*1000; SOLINIT=BVPINIT(LINSPACE(0,1,10),[0.5739 1.0 0.19 (101.325*1000.00/PF)],ALP) OPTIONS=BVPSET('RELTOL', 1E-3); % DEFAULT TOLERANCE IS 1E-3, TOLERANCE IS USER DEFINED HERE. SOL=BVP4C(@ODEFUN, @BCFUN, SOLINIT,OPTIONS) XINT = LINSPACE(0,1); SXINT = DEVAL(SOL,XINT); SUBPLOT(3,2,1) PLOT(XINT,SXINT(1,:)) SUBPLOT(3,2,2) PLOT(XINT,SXINT(2,:)) SUBPLOT(3,2,3)
Appendix C
203
PLOT(XINT,SXINT(3,:)) SUBPLOT(3,2,4) PLOT(XINT,SXINT(4,:)) % DETAILING OF VARIABLES NOT SHOWN FUNCTION DFDZ=ODEFUN(Z,F,ALP) % ALP(2)=0.732; % Q1=PERM(1)*(3.348E-10); % H2 PERMEANCE (MOL/PA/M2/S) Q2=ALP(2)*(3.348E-10); % N2 PERMEANCE (MOL/PA/M2/S) % ALP(1)=81.96; % PERMH2/PERMN2; VOLP=0.394; % VOLUMETRIC FLOW RATE OF PERMEATE (ML/SEC) VOLR=1.724; % VOLUMETRIC FLOW RATE OF RESIDUE (ML/SEC) TG=24.0+273.0; RG=8.314; % LF=(((VOLP*101.325)/(RG*TG*1000))+((VOLR*101.325)/(RG*TG*1000))); % LR=((VOLR*101.325)/(RG*TG*1000)); MIU1=0.09E-4; % HYDROGEN VISCOSITY (KG/M/S) MIU2=0.18E-4; % NITROGEN VISCOSITY (KG/M/S) MIU=MIU1*F(2)+MIU2*(1-F(2)); % CALCULATED USING MOLE FRACTION BASIS K1=3.1415*DOD*LE*NT*PF*Q2/LR; K2=128*MIU*RG*TG*LE*LR/(3.1415*(DID^4)*NT*(PF^2)); YP=(1+(ALP(1)-1)*(F(1)+F(4))-((1+(ALP(1)-1)*(F(1)+F(4)))^2-4.0*ALP(1)*(ALP(1)-1)*F(4)*F(1))^0.5)/(2.0*(ALP(1)-1)*F(4)); DFDZ=[-K1*(ALP(1)*(1-F(1))*(F(1)-F(4)*YP)-F(1)*((1-F(1))-F(4)*(1-YP)))/F(2) -K1*(ALP(1)*(F(1)-F(4)*YP)+((1-F(1))-F(4)*(1-YP))) -K1*(ALP(1)*(F(1)-F(4)*YP)+((1-F(1))-F(4)*(1-YP))) K2*F(3)/F(4)]; % [F(1)=X (RESIDUE MOLE FRACTION); % F(2)=L (RESIDUE FLOW RATE); % F(3)=V (PERMEATE FLOW RATE); % F(4)=GAMMA (PRESSURE RATIO); % YP=LOCAL PERMEATE] FUNCTION RES=BCFUN(FL,FR,ALP) PF=(600+101.325)*1000; % Q2=PERMN2*(3.348E-10); % ALP=PERM(1)/PERM(2); YPL=(1+(ALP(1)-1)*(FL(1)+FL(4))-((1+(ALP(1)-1)*(FL(1)+FL(4)))^2-4.0*ALP(1)*(ALP(1)-1)*FL(4)*FL(1))^0.5)/(2.0*(ALP(1)-1)*FL(4)); RES=[FR(1)-0.5739 FL(1)-0.4885 FL(2)-1.0 FR(3)-0.19 FL(3) FR(4)-(101.325*1000.00/PF)]; [FR(1) FR(2) FR(3) FR(4) ] [FL(1) FL(2) FL(3) FL(4) ] [ALP]
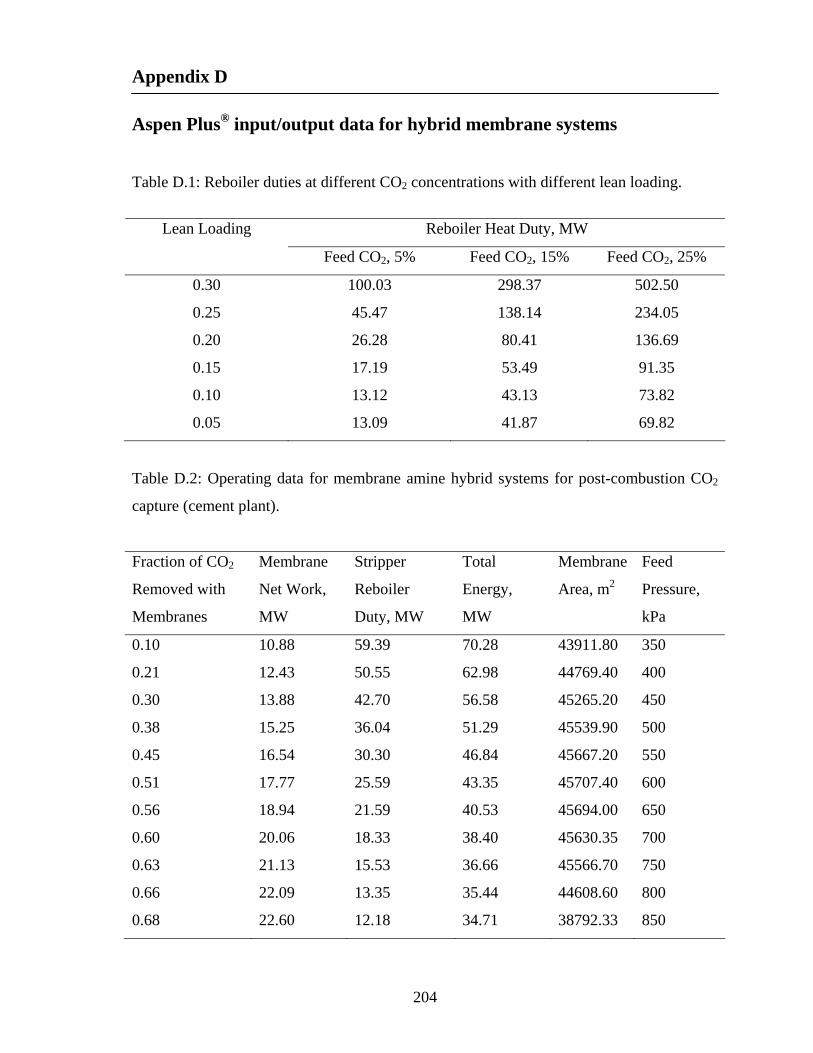
Appendix D
204
Aspen Plus® input/output data for hybrid membrane systems
Table D.1: Reboiler duties at different CO2 concentrations with different lean loading.
Reboiler Heat Duty, MW Lean Loading
Feed CO2, 5% Feed CO2, 15% Feed CO2, 25%
0.30 100.03 298.37 502.50
0.25 45.47 138.14 234.05
0.20 26.28 80.41 136.69
0.15 17.19 53.49 91.35
0.10 13.12 43.13 73.82
0.05 13.09 41.87 69.82
Table D.2: Operating data for membrane amine hybrid systems for post-combustion CO2
capture (cement plant).
Fraction of CO2
Removed with
Membranes
Membrane
Net Work,
MW
Stripper
Reboiler
Duty, MW
Total
Energy,
MW
Membrane
Area, m2
Feed
Pressure,
kPa
0.10 10.88 59.39 70.28 43911.80 350
0.21 12.43 50.55 62.98 44769.40 400
0.30 13.88 42.70 56.58 45265.20 450
0.38 15.25 36.04 51.29 45539.90 500
0.45 16.54 30.30 46.84 45667.20 550
0.51 17.77 25.59 43.35 45707.40 600
0.56 18.94 21.59 40.53 45694.00 650
0.60 20.06 18.33 38.40 45630.35 700
0.63 21.13 15.53 36.66 45566.70 750
0.66 22.09 13.35 35.44 44608.60 800
0.68 22.60 12.18 34.71 38792.33 850

Appendix D
205
Table D.3: Aspen Plus® flow sheet data for MEA process (cement plant). Substream: MIXED FLUEGAS FLUECOOL FLUESEP FLUEBLOW FLUE-ABS LEAN-ABS RICH-ABS TREATGAS Mole Flow, kmol/hr H2O 0.00 0.00 0.00 0.00 0.00 60535.41 59121.93 1036.27 MEA 0.00 0.00 0.00 0.00 0.00 3094.79 388.58 0.28 CO2 1825.60 1825.60 1825.60 1825.60 1825.60 0.01 4.23 273.84 HCO3- 0.00 0.00 0.00 0.00 0.00 32.21 421.21 0.00 MEACOO- 0.00 0.00 0.00 0.00 0.00 2229.48 3399.65 0.00 MEA+ 0.00 0.00 0.00 0.00 0.00 2334.81 3870.56 0.00 CO3-2 0.00 0.00 0.00 0.00 0.00 36.47 24.84 0.00 H3O+ 0.00 0.00 0.00 0.00 0.00 0.00 0.00 0.00 OH- 0.00 0.00 0.00 0.00 0.00 0.17 0.01 0.00 N2 5560.14 5560.14 5560.14 5560.14 5560.14 0.00 0.19 5559.95 O2 189.38 189.38 189.38 189.38 189.38 0.00 0.01 189.37 Mole Frac H2O 0.000 0.000 0.000 0.000 0.000 0.887 0.879 0.147 MEA 0.000 0.000 0.000 0.000 0.000 0.045 0.006 0.000 CO2 0.241 0.241 0.241 0.241 0.241 0.000 0.000 0.039 HCO3- 0.000 0.000 0.000 0.000 0.000 0.000 0.006 0.000 MEACOO- 0.000 0.000 0.000 0.000 0.000 0.033 0.051 0.000 MEA+ 0.000 0.000 0.000 0.000 0.000 0.034 0.058 0.000 CO3-2 0.000 0.000 0.000 0.000 0.000 0.001 0.000 0.000 H3O+ 0.000 0.000 0.000 0.000 0.000 0.000 0.000 0.000 OH- 0.000 0.000 0.000 0.000 0.000 0.000 0.000 0.000 N2 0.734 0.734 0.734 0.734 0.734 0.000 0.000 0.788 O2 0.025 0.025 0.025 0.025 0.025 0.000 0.000 0.027 Mass Flow, kg/hr H2O 0.00 0.00 0.00 0.00 0.00 1090562.40 1065098.21 18668.65 MEA 0.00 0.00 0.00 0.00 0.00 189041.01 23735.82 17.23 CO2 80344.46 80344.46 80344.46 80344.46 80344.46 0.38 186.11 12051.73 HCO3- 0.00 0.00 0.00 0.00 0.00 1965.61 25701.54 0.00 MEACOO- 0.00 0.00 0.00 0.00 0.00 232049.12 353843.61 0.00 MEA+ 0.00 0.00 0.00 0.00 0.00 144963.50 240315.23 0.00 CO3-2 0.00 0.00 0.00 0.00 0.00 2188.82 1490.73 0.00
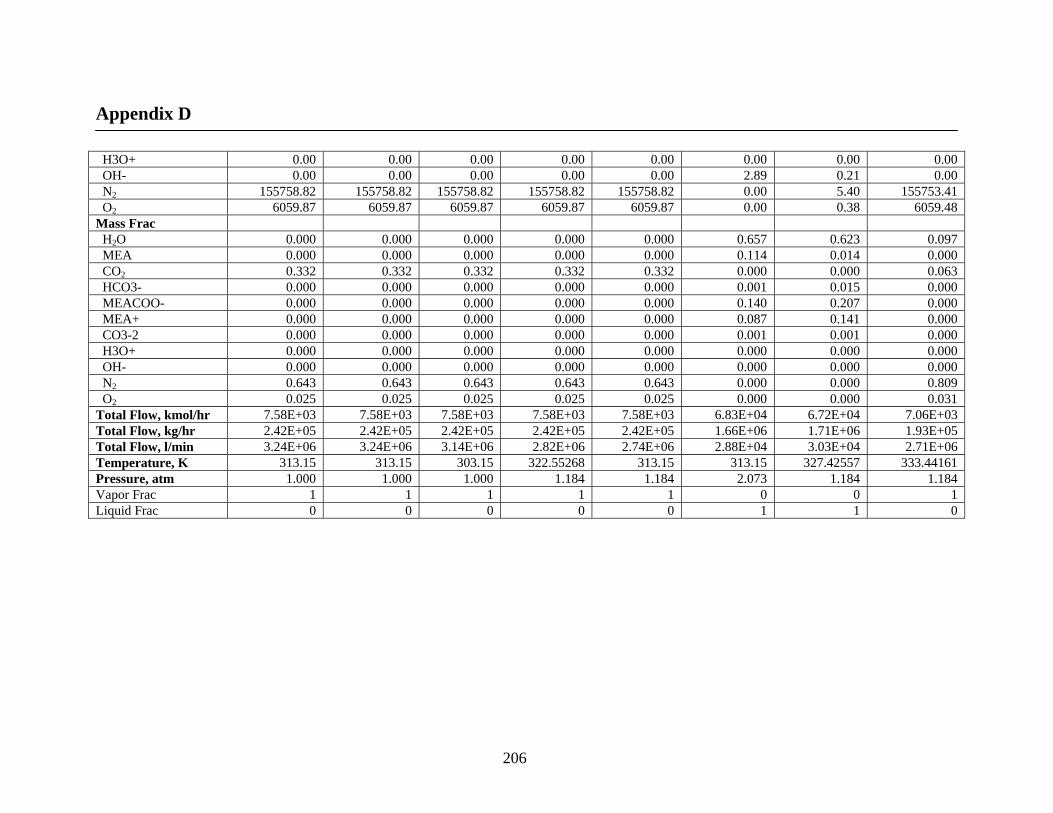
Appendix D
206
H3O+ 0.00 0.00 0.00 0.00 0.00 0.00 0.00 0.00 OH- 0.00 0.00 0.00 0.00 0.00 2.89 0.21 0.00 N2 155758.82 155758.82 155758.82 155758.82 155758.82 0.00 5.40 155753.41 O2 6059.87 6059.87 6059.87 6059.87 6059.87 0.00 0.38 6059.48 Mass Frac H2O 0.000 0.000 0.000 0.000 0.000 0.657 0.623 0.097 MEA 0.000 0.000 0.000 0.000 0.000 0.114 0.014 0.000 CO2 0.332 0.332 0.332 0.332 0.332 0.000 0.000 0.063 HCO3- 0.000 0.000 0.000 0.000 0.000 0.001 0.015 0.000 MEACOO- 0.000 0.000 0.000 0.000 0.000 0.140 0.207 0.000 MEA+ 0.000 0.000 0.000 0.000 0.000 0.087 0.141 0.000 CO3-2 0.000 0.000 0.000 0.000 0.000 0.001 0.001 0.000 H3O+ 0.000 0.000 0.000 0.000 0.000 0.000 0.000 0.000 OH- 0.000 0.000 0.000 0.000 0.000 0.000 0.000 0.000 N2 0.643 0.643 0.643 0.643 0.643 0.000 0.000 0.809 O2 0.025 0.025 0.025 0.025 0.025 0.000 0.000 0.031 Total Flow, kmol/hr 7.58E+03 7.58E+03 7.58E+03 7.58E+03 7.58E+03 6.83E+04 6.72E+04 7.06E+03 Total Flow, kg/hr 2.42E+05 2.42E+05 2.42E+05 2.42E+05 2.42E+05 1.66E+06 1.71E+06 1.93E+05 Total Flow, l/min 3.24E+06 3.24E+06 3.14E+06 2.82E+06 2.74E+06 2.88E+04 3.03E+04 2.71E+06 Temperature, K 313.15 313.15 303.15 322.55268 313.15 313.15 327.42557 333.44161 Pressure, atm 1.000 1.000 1.000 1.184 1.184 2.073 1.184 1.184 Vapor Frac 1 1 1 1 1 0 0 1 Liquid Frac 0 0 0 0 0 1 1 0
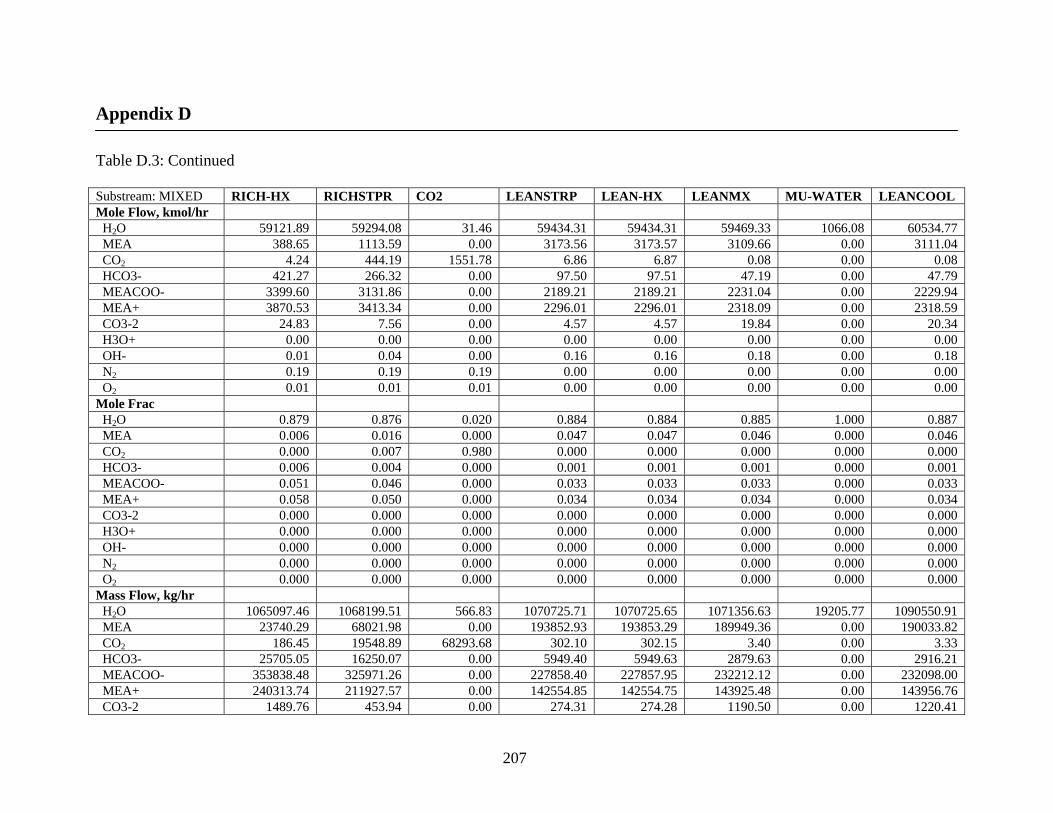
Appendix D
207
Table D.3: Continued Substream: MIXED RICH-HX RICHSTPR CO2 LEANSTRP LEAN-HX LEANMX MU-WATER LEANCOOL Mole Flow, kmol/hr H2O 59121.89 59294.08 31.46 59434.31 59434.31 59469.33 1066.08 60534.77 MEA 388.65 1113.59 0.00 3173.56 3173.57 3109.66 0.00 3111.04 CO2 4.24 444.19 1551.78 6.86 6.87 0.08 0.00 0.08 HCO3- 421.27 266.32 0.00 97.50 97.51 47.19 0.00 47.79 MEACOO- 3399.60 3131.86 0.00 2189.21 2189.21 2231.04 0.00 2229.94 MEA+ 3870.53 3413.34 0.00 2296.01 2296.01 2318.09 0.00 2318.59 CO3-2 24.83 7.56 0.00 4.57 4.57 19.84 0.00 20.34 H3O+ 0.00 0.00 0.00 0.00 0.00 0.00 0.00 0.00 OH- 0.01 0.04 0.00 0.16 0.16 0.18 0.00 0.18 N2 0.19 0.19 0.19 0.00 0.00 0.00 0.00 0.00 O2 0.01 0.01 0.01 0.00 0.00 0.00 0.00 0.00 Mole Frac H2O 0.879 0.876 0.020 0.884 0.884 0.885 1.000 0.887 MEA 0.006 0.016 0.000 0.047 0.047 0.046 0.000 0.046 CO2 0.000 0.007 0.980 0.000 0.000 0.000 0.000 0.000 HCO3- 0.006 0.004 0.000 0.001 0.001 0.001 0.000 0.001 MEACOO- 0.051 0.046 0.000 0.033 0.033 0.033 0.000 0.033 MEA+ 0.058 0.050 0.000 0.034 0.034 0.034 0.000 0.034 CO3-2 0.000 0.000 0.000 0.000 0.000 0.000 0.000 0.000 H3O+ 0.000 0.000 0.000 0.000 0.000 0.000 0.000 0.000 OH- 0.000 0.000 0.000 0.000 0.000 0.000 0.000 0.000 N2 0.000 0.000 0.000 0.000 0.000 0.000 0.000 0.000 O2 0.000 0.000 0.000 0.000 0.000 0.000 0.000 0.000 Mass Flow, kg/hr H2O 1065097.46 1068199.51 566.83 1070725.71 1070725.65 1071356.63 19205.77 1090550.91 MEA 23740.29 68021.98 0.00 193852.93 193853.29 189949.36 0.00 190033.82 CO2 186.45 19548.89 68293.68 302.10 302.15 3.40 0.00 3.33 HCO3- 25705.05 16250.07 0.00 5949.40 5949.63 2879.63 0.00 2916.21 MEACOO- 353838.48 325971.26 0.00 227858.40 227857.95 232212.12 0.00 232098.00 MEA+ 240313.74 211927.57 0.00 142554.85 142554.75 143925.48 0.00 143956.76 CO3-2 1489.76 453.94 0.00 274.31 274.28 1190.50 0.00 1220.41
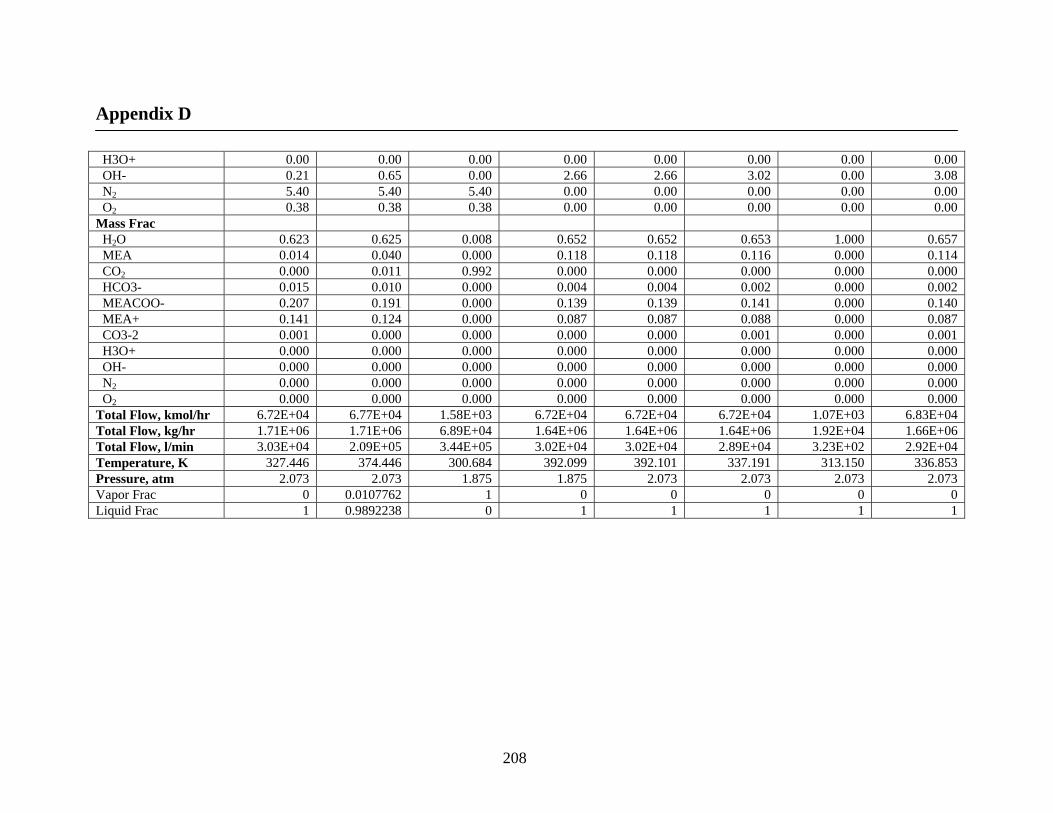
Appendix D
208
H3O+ 0.00 0.00 0.00 0.00 0.00 0.00 0.00 0.00 OH- 0.21 0.65 0.00 2.66 2.66 3.02 0.00 3.08 N2 5.40 5.40 5.40 0.00 0.00 0.00 0.00 0.00 O2 0.38 0.38 0.38 0.00 0.00 0.00 0.00 0.00 Mass Frac H2O 0.623 0.625 0.008 0.652 0.652 0.653 1.000 0.657 MEA 0.014 0.040 0.000 0.118 0.118 0.116 0.000 0.114 CO2 0.000 0.011 0.992 0.000 0.000 0.000 0.000 0.000 HCO3- 0.015 0.010 0.000 0.004 0.004 0.002 0.000 0.002 MEACOO- 0.207 0.191 0.000 0.139 0.139 0.141 0.000 0.140 MEA+ 0.141 0.124 0.000 0.087 0.087 0.088 0.000 0.087 CO3-2 0.001 0.000 0.000 0.000 0.000 0.001 0.000 0.001 H3O+ 0.000 0.000 0.000 0.000 0.000 0.000 0.000 0.000 OH- 0.000 0.000 0.000 0.000 0.000 0.000 0.000 0.000 N2 0.000 0.000 0.000 0.000 0.000 0.000 0.000 0.000 O2 0.000 0.000 0.000 0.000 0.000 0.000 0.000 0.000 Total Flow, kmol/hr 6.72E+04 6.77E+04 1.58E+03 6.72E+04 6.72E+04 6.72E+04 1.07E+03 6.83E+04 Total Flow, kg/hr 1.71E+06 1.71E+06 6.89E+04 1.64E+06 1.64E+06 1.64E+06 1.92E+04 1.66E+06 Total Flow, l/min 3.03E+04 2.09E+05 3.44E+05 3.02E+04 3.02E+04 2.89E+04 3.23E+02 2.92E+04 Temperature, K 327.446 374.446 300.684 392.099 392.101 337.191 313.150 336.853 Pressure, atm 2.073 2.073 1.875 1.875 2.073 2.073 2.073 2.073 Vapor Frac 0 0.0107762 1 0 0 0 0 0 Liquid Frac 1 0.9892238 0 1 1 1 1 1