a simulation experimental study on the utility of pay changes
TRANSCRIPT

Lingnan University Lingnan University
Digital Commons @ Lingnan University Digital Commons @ Lingnan University
Theses & Dissertations Department of Computing and Decision Sciences
8-1-2017
A simulation experimental study on the utility of pay changes A simulation experimental study on the utility of pay changes
Liu YE
Follow this and additional works at: https://commons.ln.edu.hk/cds_etd
Part of the Business Administration, Management, and Operations Commons, and the Management
Information Systems Commons
Recommended Citation Recommended Citation Ye, L. (2017). A simulation experimental study on the utility of pay changes (Master's thesis, Lingnan University, Hong Kong). Retrieved from http://commons.ln.edu.hk/cds_etd/17/
This Thesis is brought to you for free and open access by the Department of Computing and Decision Sciences at Digital Commons @ Lingnan University. It has been accepted for inclusion in Theses & Dissertations by an authorized administrator of Digital Commons @ Lingnan University.

Terms of Use The copyright of this thesis is owned by its
author. Any reproduction, adaptation,
distribution or dissemination of this thesis
without express authorization is strictly
prohibited.
All rights reserved.

A SIMULATION EXPERIMENTAL STUDY ON
THE UTILITY OF PAY CHANGES
YE LIU
MPHIL
LINGNAN UNIVERSITY
2017

A SIMULATION EXPERIMENTAL STUDY ON
THE UTILITY OF PAY CHANGES
by
YE Liu
叶柳
A thesis
submitted in partial fulfillment of the requirements for the Degree of
Master of Philosophy in Business
Lingnan University
2017
ABSTRACT
A SIMULATION EXPERIMENTAL STUDY ON
THE UTILITY OF PAY CHANGES by
YE Liu
Master of Philosophy
In this thesis, we conduct an experimental simulation of 131 students from a university in Hong Kong and investigate the relationship between pay changes and the perceived values (i.e., utility). Applying traditional psychophysical methods, we measure the utility of pay changes (i.e., pay raises and pay cuts) of different sizes by individual responses (i.e., happiness/unhappiness). Drawing on utility theory and expectancy theory, we examine the function that best fits this relationship by considering common function forms including linear, quadratic, logarithmic, and power functions. Using regression techniques, we find that a quadratic function best fits the data, and the utility function is concave in the pay change. When we examine the best form of utility functions for pay raises and pay cuts separately, we find that the utility of pay raises and that of pay cuts are best described by a quadratic function and a linear function, respectively. We further show that a single model involving all pay changes better describes the utility than two separate models for pay raises and pay cuts. In addition, our best-fit utility model reveals that a sufficiently small amount of pay increase may generate a negative value of utility, and we calculate the percentage of smallest meaningful pay increase that results in non-negative utility. We also discuss the theoretical contributions of our findings to the literature and their implications to practitioners.
Keywords: pay change, utility function, pay raise/cut, regression, experiment.

DECLARATION
I declare that this is an original work based primarily on my own research, and I warrant that all citations of previous research, published or unpublished, have been duly acknowledged.
(YE LIU) Date
i
TABLE OF CONTENTS
ACKNOWLEDGEMENT ......................................................................................... v
1 INTRODUCTION ............................................................................................... 1
1.1 Motivation and Objectives .............................................................................. 2
1.2 Structure of the Thesis .................................................................................... 4
2 LITERATURE REVIEW ................................................................................... 6
2.1 Utility Theory .................................................................................................. 6
The term of “utility” ....................................................................................... 6
The development of utility theory .................................................................. 8
The utility of money ....................................................................................... 9
Cardinal utility and ordinal utility ................................................................ 10
Prospect theory ............................................................................................. 13
The measurement of utility .......................................................................... 14
2.2 Pay and Satisfaction ...................................................................................... 17
3 PRELIMINARIES ............................................................................................ 20
3.1 Linear Utility Function .................................................................................. 20
3.2 Curvilinear Utility Function .......................................................................... 21
3.3 Reference Point ............................................................................................. 23
3.4 Smallest Meaningful Pay Increase ................................................................ 24
4 METHODOLOGY ............................................................................................ 25
4.1 Participants .................................................................................................... 25
4.2 Procedure ...................................................................................................... 26
4.3 Pilot Test ........................................................................................................ 28
4.4 Measurement ................................................................................................. 28
4.5 Data Analysis and Regression ....................................................................... 30
5 RESULTS ........................................................................................................... 34
5.1 Curve Estimation ........................................................................................... 34
5.2 Correlational Analysis ................................................................................... 35
5.3 Hierarchical Multilevel Analyses .................................................................. 36
The utility of pay raise and the disutility of pay cut .................................... 37
ii
A single model or separated models ............................................................ 39
The smallest meaningful pay increase ......................................................... 39
5.4 Summary ....................................................................................................... 42
6 DISCUSSION .................................................................................................... 46
6.1 Contributions and Implications ..................................................................... 46
6.2 Limitation and Future Work .......................................................................... 47
Base pay ....................................................................................................... 48
Performance and performance feedback ...................................................... 48
Individual differences ................................................................................... 49
6.3 Conclusion .................................................................................................... 50
REFERENCES ......................................................................................................... 51
iii
LIST OF TABLES
Table 1: Demographic Characteristics of Participants ........................................ 32
Table 2: Pay Changes for the Experiment ........................................................... 33
Table 3: Regression Results of Individual Responses to Pay Levels .................. 43
Table 4: Correlations and Descriptive Statistics ................................................. 43
Table 5: Hierarchical Multilevel Analyses for Utility of Pay Change (Involving all
Data of Pay Changes) ................................................................................... 44
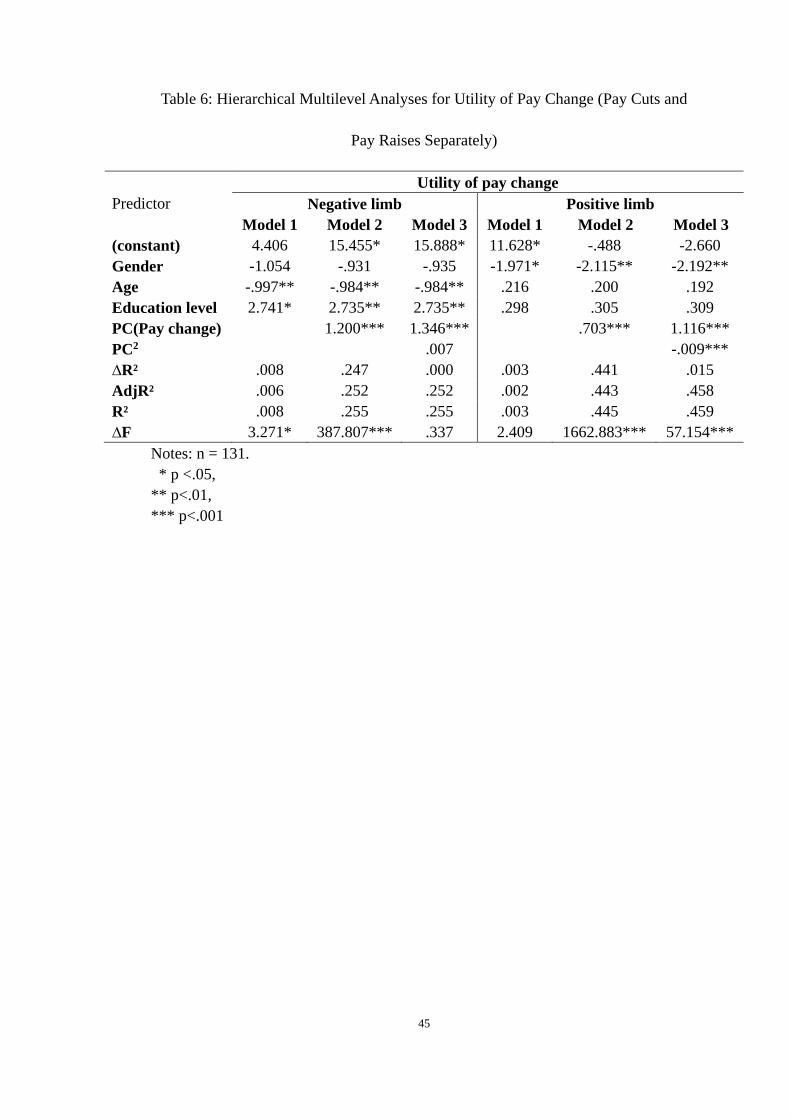
Table 6: Hierarchical Multilevel Analyses for Utility of Pay Change (Pay Cuts and
Pay Raises Separately) ................................................................................. 45

iv
LIST OF FIGURES
Figure 1: Prospect Theory ................................................................................... 14
Figure 2: Linear Relationship between Pay Raises/Cuts and Utility .................. 21
Figure 3: Curvilinear Relationship between Pay Raises/Cuts and Utility .......... 22
Figure 4: The Quadratic Utility Function of Pay Changes. ................................ 40
v
ACKNOWLEDGEMENT
This dissertation is a journey filled with both challenges and joy, guiding me to discover about the world and myself. Here I would like to take this chance to express my sincere gratitude to all the people who have made this journey worthwhile.
I dedicate my deepest appreciation first to my two wonderful supervisors, Prof. Liang Liping and Prof. Nancy Chen. Prof. Liang is an excellent scholar, and a great mentor. She has educated me in accordance of my aptitude and offered me tremendous inspiring during the development of my research ideas. She has also provided me enormous guidance throughout the production process of my thesis and my learning path. Prof. Chen has offered me tremendous inspiring and professional guidance during the procedure of my experiment. She is also a loving supervisor who always spreads her positive energy and care for others. I am really proud to have both Prof. Liang and Prof. Chen to be my supervisors.
I also feel grateful to faculty members and MPhil students in the department of Computing & Decision Sciences and the department of Management. Ms. Eva Cheung, Ms. Jenny Mak, and Ms. Jessie Wang have assisted me with the information and administrative procedures during my MPhil life. Last but not least, I express my deepest gratitude to my parents for encouraging and believing in me. Many thanks all of you!

1
1 INTRODUCTION
In the past decade, organizations have increasingly emphasized on compensation
schemes and pay satisfaction. According to the U.S. Bureau of Economic Analysis
(2003), employee compensation is one of the largest costs of doing business,
representing 57 percent of the total value of goods and services produced in the United
States in 2002. As noted by Dreher et al. (1988), there is the expectation that the
relation between compensation and work outcomes is mediated by attitudinal reactions
to pay. Thus, pay satisfaction may be regarded as a necessary but not a sufficient
condition for organizations to achieve the goals of their compensation systems, such
as employee retention and motivation.
In the fields of organizational behavior and economics, pay level and its outcomes are
important concepts. Extant publications have provided insights into the effects of pay
level, merit pay, and performance on satisfaction. Merit pay is significantly associated
with employee motivation, performance, and satisfaction (e.g., Jenkins et al. 1998,
Gerhart and Rynes 2003, Green and Heywood 2008). And there are studies indicating
that pay raises apparently have a positive impact on employee outcomes including
behavioral intentions, performance, and satisfaction (Heneman 1992, Jenkins et al.
1998, Nyberg et al. 2016).
Various utility functions have been developed to quantify the subjective value of
different pay levels. For example, Heneman et al. (1997) regarded the true utility as a
real number on a cardinal scale, and indicated that a power function explained pay
satisfaction variance treated by pay level better than a linear function. In this thesis,
2
integrating relevant theories from the fields of organizational behavior and economics,
we investigate the utility function of pay changes in the context of employment.
Pay satisfaction can be viewed as the “amount of overall positive or negative affect (or
feelings) that individuals have toward their pay” (Miceli and Lane 1990). In economics,
utility is regarded as a measure of preferences that represents the satisfaction
experienced by the consumer of a good. To some extent, the practical meaning of
“utility” in the context of employment is pay satisfaction.
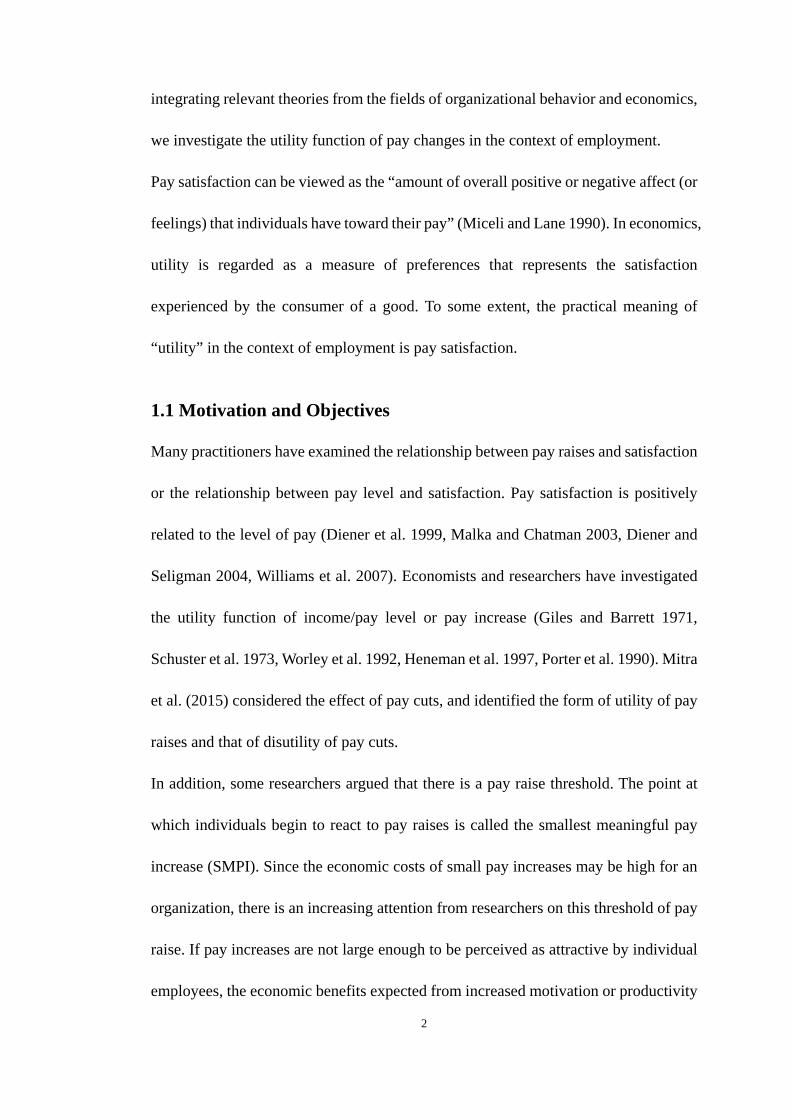
1.1 Motivation and Objectives
Many practitioners have examined the relationship between pay raises and satisfaction
or the relationship between pay level and satisfaction. Pay satisfaction is positively
related to the level of pay (Diener et al. 1999, Malka and Chatman 2003, Diener and
Seligman 2004, Williams et al. 2007). Economists and researchers have investigated
the utility function of income/pay level or pay increase (Giles and Barrett 1971,
Schuster et al. 1973, Worley et al. 1992, Heneman et al. 1997, Porter et al. 1990). Mitra
et al. (2015) considered the effect of pay cuts, and identified the form of utility of pay
raises and that of disutility of pay cuts.
In addition, some researchers argued that there is a pay raise threshold. The point at
which individuals begin to react to pay raises is called the smallest meaningful pay
increase (SMPI). Since the economic costs of small pay increases may be high for an
organization, there is an increasing attention from researchers on this threshold of pay
raise. If pay increases are not large enough to be perceived as attractive by individual
employees, the economic benefits expected from increased motivation or productivity

3
may not materialize. Then the organization will suffer from the cost of spending a lot
of money for nothing. The effect of pay increases therefore represents an important
subject for research.
In short, we can find research gaps between the practice and the literature. First, very
little research has investigated individual reactions to pay cuts. Researchers have
focused on the consequences of pay increases, not pay cuts. However, in practice, the
increasing volatility in stock option value, especially the pay cuts, can lead to
significant reduction in overall pay for managers; during the recent recession, many
companies implemented pay cuts instead of opting for lay-offs (Mitra et al. 2015).
Gerlach et al. (2006) conducted a study in North America and Germany showed that
wage-cuts were treated as fairer when the company incurs losses and is not profitable,
compared to the time when the company makes a positive profit. This reinforces the
finding from the literature that the cause of a wage-cut is important for its assessment.
Therefore, studying the reactions to pay cuts is as important as that to pay raises.
Although Mitra et al. (2015) investigated the disutility of pay cuts, they only
considered two separate utility functions for the positive limb and negative limb,
respectively, but they didn’t investigate the case of a single model. Moreover, the effect
of a very small pay increase is often ignored in the study of pay satisfaction, or
perceived value (i.e., utility) of pay changes, especially, the study of utility function.
Both theories in organizational behavior and economics have been used in previous
researches on the relationship between objective raises in pay and subjective
assessments of the influences of those raises, but have rarely been used together to
4
frame a single research study.
In this study, we attempt to fill in these research gaps by addressing three issues. We
conducted an experimental simulation to measure the utility of pay change, and
identified the suitable utility function among the linear, quadratic, logarithmic, and
power function forms. Secondly, we examined the best form of utility functions for
pay raises and pay cuts separately, and compared the relative validity of the single
function that best fits our data to those two separated utility forms. Finally, we
investigated the influence of a very small pay raise on subjects’ responses to pay
changes, and through the observation of the suitable utility function, we calculated the
size of pay raise thresholds.
Therefore, this thesis makes the following contributions. First, it adds to the study of
utility of pay changes by combining both pay cuts and pay raises and empirically
supports the use of a single function for the utility of pay changes. Secondly, the
estimated SMPI implies that in order to generate positive behavioral and affective
responses at the lowest cost, management should consider rewarding their employees
with pay increases beyond a certain level.
1.2 Structure of the Thesis
This thesis consists of six sections. Section 1 introduces the background and
motivation for this research as well as research objectives. Section 2 reviews the
relevant literature including the theoretical background for our research. Section 3
discusses the preliminaries for the development of utility function. Sections 4 and 5
describe the methodology, analytical approach, and results of this study. Finally,

5
Section 6 discusses the theoretical contributions, practical implications, and limitations
of this study as well as the directions for future research.

6
2 LITERATURE REVIEW
This study integrates the theories from economics and organizational behavior. Thus,
our literature review consists of two parts. First, we review the economics literature.
Then, we review publications that concern the relationship between pay and
satisfaction in the psychophysical perspective.
2.1 Utility Theory
In this section we review the development of utility theory to provide a theoretical
framework for addressing the research questions in this study. We then describe the
concept of utility of money, including its conceptualization and the related descriptive
theories. In addition, we present two forms of utility and empirical approaches to the
measurement of utility.
The term of “utility”
The term of “utility” was brought by Daniel Bernoulli to explain the St. Petersburg
paradox. This paradox was first proposed by Nicholas Bernoulli in 1713. In 1738,
Bernoulli argued that the paradox could be resolved if decision-makers displayed risk
aversion and argued for a logarithmic cardinal utility function. He presented the
distinction between wealth and utility in his paper: Exposition of a New Theory on the
Measurement of Risk, which serves as the basis for the economic theory of risk
aversion, risk premium, and utility. Then, at the beginning of the nineteenth century,
Jeremy Bentham provided the principle of utility. “The utility,” he stated, “is meant
that property in any object, whereby it tends to produce benefit, advantage, pleasure,
good, or happiness - (all this in the present case comes to the same thing) or (what

7
comes again to the same thing) to prevent the happening of mischief, pain, evil, or
unhappiness to the party whose interest is considered.” This means the “principle of
utility” is the principle that actions are to be judged by their usefulness in this sense:
their tendency to produce benefit, advantage, pleasure, good, or happiness. This
principle of utility, introduced by Jeremy Bentham, was to be understood much more
broadly in economics. Jevons announced that Bentham's definition of “utility”
perfectly expresses the meaning of the term in Economy (1871).
In the long history the economical meaning of “utility” shifted many times. Since the
interpretation of an author’s intentions is often debatable, it is difficult to build an
authoritative history of utility in meaning. Some but not all illustrations of “utility” are
listed. Jevons (1879) quoted Bentham's sense and thought “utility” definitely meant
usefulness. Marshall (1961) illustrated that, “the total utility of a thing to anyone (that
is, the total pleasure or other benefit it yields to him) increases with every increase of
his stock of it, but not as fast as his stock increases”. Principles of Economics was the
dominant economic textbook in England for many years at that time. The book
proposed the ideas of marginal utility. Marshall (1961) thought utility is “the
satisfaction or benefit derived by consuming a product, thus the marginal utility of a
good or service is the change in the utility from increase or decrease in the consumption
of that good or service”.
The studies of utility can make enormous contributions in both economic and social
developments. Many mathematicians, economists, and philosophers have been keen
on the study of utility (Broome 1991). The utility theory has won a place in economics.

8
The development of utility theory
Utility theory has been widely used for studying how consumers can allocate their
income among various goods and services in order to achieve the maximization of
their satisfaction (Stigler 1950). The beginning of the modern utility theory can be
traced back to the 1870’s, when Jevons first criticized the Ricardian theory and then
popularized the Bentham’s concepts of utility. Jevons thought Ricardos’ labor value
theory lacked generality. He emphasized that economic theory is a kind of computation
of pleasure and pain, and showed that a rational person should make his or her
consumption decision by considering increased pleasure of adding each item (the
marginal utility). At that time, many utilitarians believed that utility was a
psychological base, in existence, and can be directly measured, like the length and the
temperature. These utilitarians concluded the establishment of diminishing marginal
utility through their own feelings and emotions.
Then, Menger from Austria and Walras from France took fundamentally the same
position of Jevons. These three neoclassical economists are the representative of the
school of marginal utility theory. The school of marginal utility has made a great
development at the end of the nineteenth century. On one hand, the study of marginal
utility has been systematized; on the other hand, this utility theory was expanded in
subareas, achieving further generalization.
Expected utility theory is another branch of utility theory that takes account of
uncertainty. In the 1950s, Von Neumann and Morgenstem provided the analytical
framework in which a rational actor makes a decision in a condition of uncertainty.

9
Expected utility theory deals with the analysis of choices among risky projects with
multiple (possibly multidimensional) outcomes. Other concepts of utility (such as
“experienced utility” and “decision utility”) and two types of utility functions (e.g.,
cardinal and ordinal) have been suggested to analyze a person’s choice behaviors in
consuming conditions.
During the development of utility theory, the effects of contemporary economic and
social conditions can be traced; and the human behaviors in decision making, supply
and demand, maximizing the pleasure, etc., can be understood better in modern
economics.
The utility of money
One of the most common use of the concept of utility is the utility of money. In 1937,
Adam Smith indicated that the term “value” has two different meanings: “value in use”
and “value in exchange.” Sometimes “value” refers to the inherent utility of a
particular object, which is the “value in use”; the term “value” also expresses the power
of purchasing other goods in object conveys, which is the “value in exchange”. This
concept has been accepted by his immediate successors. Money doesn’t have any
inherent value (Tang 1993). As people assign value to money, these pieces of paper
derive the utility from its instrumentality in acquiring other useful objects (Black 1990,
Lawler 1971).
Utility theories, such as expected utility theory, is frequently used to explain the
rational decision making under risk. Prior researchers labeled the modern notion of
utility as “decision utility” (Kahneman et al. 1997). Within the context of employment,

10
this decision utility is more likely to an employee’s preferences of effort to reach the
performance targets. Based on the theory of utility, organizational psychologists focus
on employees’ behaviors to get the maximized monetary outcomes, individual
performance goals or successful achievement. The utility function for money has been
developed in decision making processes: in situations where outcomes of choices
influence utility through gains or losses of money. Many researchers suggested that
the utility of money reflects a concave in positive limb, and this phenomenon is called
diminishing marginal utility of money (Jevons 1879, Allen 1933, Giles and Barrett
1971).
Cardinal utility and ordinal utility
In economics, utility can be interpreted as the satisfaction that a person obtains from
the purchase and use of commodities and services (Kahneman et al. 1997). However,
there has been some controversy over the issue whether the utility can be measured or
not. Today utility functions, expressing utility as a function of the amounts of various
goods consumed, are treated as either cardinal or ordinal. These two concepts are
proposed to measure the satisfaction of individuals, by analyzing whether the
satisfaction can be interpreted as providing more information than simply the rank
order of preferences over bundles of goods.
Cardinal utility states that the satisfaction that a consumer derives by consuming goods
and services can be measured with numbers. At one time, it was assumed that the
consumer was able to say exactly how much utility he obtained from the commodity.
The economists who made this assumption belonged to the “cardinalist school” of

11
economics. In cardinal utility, it is assumed that consumers derive satisfaction through
consumption of one good at a time (Bernoulli 1954). Early theorists of utility
considered that it had physically quantifiable attributes. They thought that utility
behaved like the magnitudes of distance or time, in which the simple use of a ruler or
stopwatch resulted in a distinguishable measure. "Utils" was the name actually given
to the units in a utility scale. When cardinal utility is used, the magnitude of utility
differences is treated as an ethically or behaviorally significant quantity. For example,
suppose a cup of coffee has utility of 120 utils, a cup of tea has a utility of 80 utils, and
a cup of water has a utility of 40 utils. With cardinal utility, it can be concluded that
the cup of coffee is better than the cup of tea by exactly the same amount by which the
cup of tea is better than the cup of water.
Another important issue of cardinal utility is the location of the “zero” value of utility.
Thus in the above example of coffee, it is not a common conclusion that the cup of tea
is two thirds as good as the cup of juice, because the quantitative comparison with
multiple would depend not only on magnitudes of utility differences, but also on the
"zero" of utility. To be specific, if the "zero" of utility was located at -40, then a cup of
coffee would be 160 utils more than zero, a cup of tea 120 utils more than zero, and
the correct conclusion is that the cup of tea is three fourths as good as the cup of coffee.
The “zero” of utility is regarded as the “reference point,” which is discussed in Section
3.3.
Compared with cardinal utility as a quantitative measure, ordinal utility is a qualitative
measure. Ordinal utility states that the satisfaction that a consumer derives from the

12
consumption of goods and services cannot be measured in numbers. Rather, ordinal
utility uses a ranking system in which a ranking is provided to the satisfaction that is
derived from consumption.
In cardinal utility, economists considered that the utility had physically quantifiable
attributes. However, in ordinal utility it is assumed that a consumer may derive
satisfaction from the consumption of a combination of goods and services, which
would be ranked according to preference. The differences in utils (values taken on by
the utility function) are treated as ethically or behaviorally meaningless: the utility
index encodes a full behavioral ordering between members of a choice set, but tells
nothing about the related strength of preferences. Ordinal utility functions are unique
up to increasing monotone transformations. In the above example, it would only be
possible to say that coffee is preferred to tea to water, but no more.
Neoclassical economics has largely retreated from using cardinal utility functions as
the basis of economic behaviors. A notable exception is in the context of analyzing
choice under conditions of risk. In welfare economics, the concept of cardinal utility
is often used to aggregate utilities across persons, to create a social welfare function
(Harsanyi 1953), and the marginal utility theory is developed on the basis of cardinal
utility, which describes the utility as quantifiable (Kauder 2015). In this study, since
we measure the satisfaction that the subjects derives from the level of pay change in
number, and then calculate the size of the threshold of pay raise, the utility of pay
changes is treated as the calculable one: cardinal utility.

13
Prospect theory
Integrating the perspectives of both utilitarian and psychophysical views, prospect
theory (Kahneman and Tversky 1979, Tversky and Kahneman 1992) was proposed to
present several modifications and extensions to cardinal utility theory. In prospect
theory, the empirically derived S-shaped value function is assumed, and it is
considered that this utility theory function may be more pronounced than previous
studies (Boettcher 2004, Etchart-Vincent 2004, Schunk and Betsch 2006, Booij and
Van de Kuilen 2009).
The utility function described by prospect theory is depicted in Figure 1. Three
mechanisms of prospect theory are particularly relevant to the study of the utility of
changes in pay (Tversky and Kahneman 1992, Fennema and Van Assen 1998,
Abdellaoui 2000). First, the theory suggests the use of reference point to assess gains
(pay raises) or losses (pay cuts). Reference point, in geometry, refers to a point used to
define the location of another point. Based on prospect theory, the inflection point in
the satisfaction function corresponds to the reference point. Choice of the reference
point is a non-trivial matter because it is a central variable for theory. Second, it
indicates convex utility on the loss domain and concave utility on the gain domain,
and derives S-shaped value function, as shown in Figure 1. Moreover, it should be
steeper for losses than for gains, which means a pay cut of $100 should incur a more
negative reaction than the positive reaction incurred by a pay raise of $100. Third,
prospect theory asserts that people prefer certain outcomes over risky outcomes. This
is called loss aversion, which means people have the tendency to strongly prefer
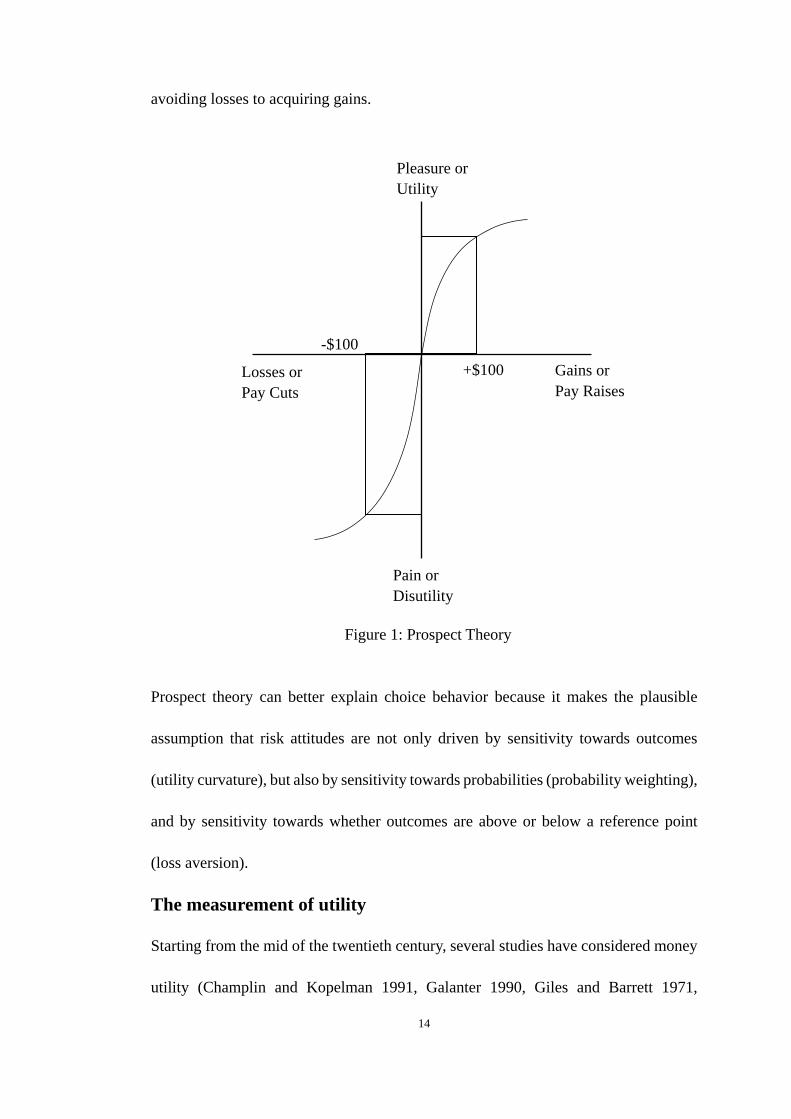
14
avoiding losses to acquiring gains.
Figure 1: Prospect Theory
Prospect theory can better explain choice behavior because it makes the plausible
assumption that risk attitudes are not only driven by sensitivity towards outcomes
(utility curvature), but also by sensitivity towards probabilities (probability weighting),
and by sensitivity towards whether outcomes are above or below a reference point
(loss aversion).
The measurement of utility
Starting from the mid of the twentieth century, several studies have considered money
utility (Champlin and Kopelman 1991, Galanter 1990, Giles and Barrett 1971,
Pleasure or Utility
Pain or Disutility
Losses or Pay Cuts
Gains or Pay Raises
-$100 +$100

15
Hamblin 1971, Hinrichs 1969, Mosteller and Nogee 1951, Rambo and Pinto 1989),
which mainly addressed the question of whether or not the marginal utility of money
will decline with each extra money unit added. Brandstatter and Brandstatter (1996)
reviewed three empirical approaches to the measurement of utility that prior
researchers used: (1) the Bernoulli approach to establishing a person's indifference
(with respect to expected utility) between pairs of lotteries differing in (objective)
probabilities and values of outcomes; (2) the attitude rating approach by which subjects
indicate the degree of satisfaction with various pay levels or pay or price rises; (3) the
psychophysical ratio scaling approach by which ratios of money amounts are equated
with ratios of intensities of emotions (joy/anger over winning/losing money).
Specially, as a traditional empirical approach, Bernoulli approach is often used in
lotteries and gambling settings. Mosteller and Nogee (1951) first applied this approach
in experiments to measure the utility of money. The experiments were conducted
among college students and provided support for a decreasing marginal utility of
money, whereas for national guardsmen increasing marginal utility of money seemed
appropriate. By establishing a person’s indifference between a sure amount of money
and a lottery differing in probabilities, the researchers showed that the utility of money
is a function. The subjects who have low income may be more likely to experience a
high utility of money, which means the subject who has low emotional stability may
be more likely to experience a high extroversion and utility (Mosteller and Nogee 1951,
Brandstatter 1987).
The attitude rating approach is regarded as a useful measuring device, consisting of a
16
number of statements to which the respondent must express his or her degree of
agreement or disagreement. Usually, the higher the score, the more favorable the
respondent's attitude. When measuring the utility of money in the empirical study, the
particular score is marked by asking the subjects’ degree of satisfaction with various
pay levels or pay raises, and the total score places the respondent on a continuum from
least favorable to most favorable. For example, Kapteyn and Wansbeek (1985)
reexamined the Individual Welfare Function (IWF) through a survey question with 9
response options (from “very bad” to “excellent”). Depending on the respondent's
endorsement of each statement, the options ‘excellent’, ‘good’, etc. were translated
into numbers between zero and one. They concluded that the utility function should be
assumed to be S-shaped. Similar to the results from Bernoulli approach, the empirical
results by this approach also support that there exists a relationship between the level
of income and the marginal utility of the same additional amount of money. In other
words, the marginal utility should be higher for poor than for rich people under the
same amount of pay raises.
With the psychophysical ratio scaling approach, a continuous dependent-response
rating line about happiness and unhappiness in different sizes of pay changes is used.
Moreover, the typical survey form has a limitation when subjects rate their perceived
utility. That is, respondents may scan the questionnaire and familiarize themselves
with the levels, and fill in the responses with the aim for being consistent when a range
of pay raises and pay cuts appear in the survey (Worley et al. 1992). Giles and Barrett
(1971) conceded the same problem in their study, noting that “in responding to a

17
questionnaire of this type, employees might attempt to order the merit increases in
ascending values and adjust their responses accordingly.” To avoid this problem, Giles
and Barrett (1971) suggested presenting each increase on a separate sheet of paper or
using a projector. This approach is psychometrically different from Likert-type pay
satisfaction measures, and is tied to specific stimulus intensities to generate ratio scales
(Galanter 1990, Worley et al. 1992). Russell and Bobko (1992) examined the
properties of continuous dependent-response rating formats and demonstrated that
they were superior to coarser Likert-type rating scales when researchers attempt to
detect moderator effects in multiple regression analysis.
In this study, in order to examine the best fitting utility function, we employ the third
approach (i.e., the psychophysical ratio scaling approach) to measure the utility of pay
changes.
2.2 Pay and Satisfaction
Management and applied psychology researchers tend to adopt a linear function in the
study of utility of pay changes, and assume that higher raises are incrementally more
valuable. Gupta (1980) showed that merit pay raises are positively related to reactions
such as pay raise happiness and pay satisfaction. Green and Heywood (2008)
investigated the impact of performance-related pay on several dimensions of
satisfaction. With the consideration of psychological factors, Schaubroeck et al. (2008)
examined the role that expected merit pay raises and pay-for-performance perceptions
play in the relationship between merit pay raises and pay satisfaction. Shaw et al. (2003)
explored the relationships among merit pay raises, trait positive affectivity (PA), and

18
reactions to merit pay increases (pay attitudes and behavioral intentions). By using
meta-analysis, researchers also estimated the population correlation between the pay
level and pay satisfaction. The results suggested that the level of pay bears a positive,
but quite modest, relationship with job and pay satisfaction (Williams et al. 2006 and
Judge et al. 2010).
Some researchers adopted a nonlinear, psychophysical approach and assumed that pay
raises below a certain threshold may go completely unnoticed. Mitra et al. (1997)
conducted an experimental simulation and found that 7% is the smallest meaningful
pay increases (SMPIs) for employees. Mitra et al. (2016) did field tests in both the
United States and Finland, and identified the smallest meaningful pay increase
thresholds (5% and 8%, respectively) across behavioral intentions and affective
reactions.
Heneman et al. (1997), based on economic theory, suggested that there is a negative
relationship between the level of income and the marginal utility of the same additional
amount of money. Back in 1728, the mathematician Cramer postulated that the value
of money might be a power function of the number of dollars (Bernoulli 1954). Giles
and Barrett (1971) determined the relationship between merit increases and
satisfaction, and the results gave the most support to the power function and least
support to the logarithmic function. However, the philosopher Bernoulli (1954)
hypothesized that the utility function is logarithmic. Mitra et al. (2015) indicated that
a quadratic function is the most descriptive to the relationship between the utility and
pay raise among four functional forms (linear, logarithmic, power, and quadratic) and

19
pay cut is linearly related to the disutility.
20
3 PRELIMINARIES
In order to find the function that best describes the utility of pay changes, in this section
we discuss the development of four common utility functions that are considered in
this study. Based on the literature of psychology and organizational behavior, we first
assume that the utility function of pay changes has a linear form. As hyperbolic
absolute risk aversion (HARA) utility is widely used in both empirical and analytical
studies in economics, finance, and decision theory, we also consider three
representative function forms of HARA utility, which are quadratic, logarithmic, and
power functions.
3.1 Linear Utility Function
Traditionally, in the fields of psychology and organizational behavior, researchers
generally assume a linear relationship between two different concepts. Thus, the
relationship between pay increase and satisfaction is considered as linear. This simple
relationship is the basic assumption in the study of other complex monetary
relationships or complicated theoretical structures. For example, Tang et al. (2005)
examined a mediating model of income and pay satisfaction. A direct path is that
income is positively related to pay satisfaction. Meanwhile, there is an indirect path in
the relationship between income and pay satisfaction: income is positively related to
the love of money, and the love of money is positively related to pay equity comparison,
then the pay equity comparison is positively related to pay satisfaction. They also
tested the model across two moderators: culture and gender. In this complex model, all
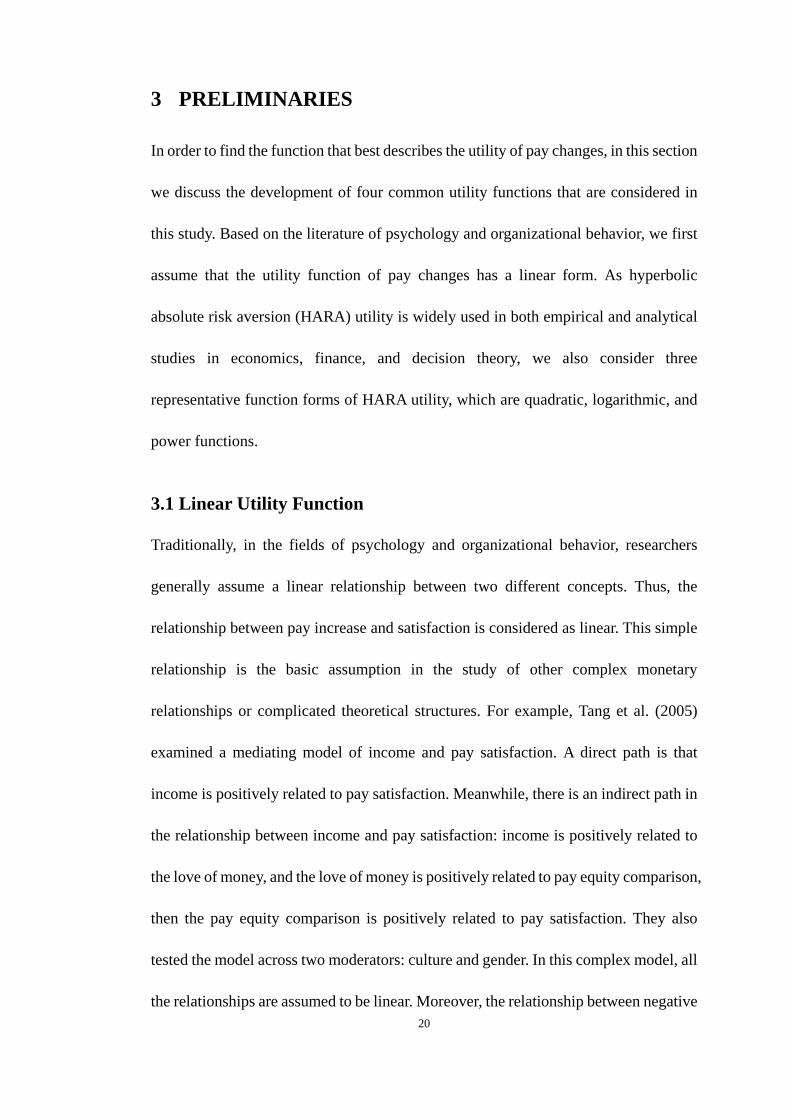
the relationships are assumed to be linear. Moreover, the relationship between negative
21
pay changes and individual affective responses is assumed linear as well. For pay cuts,
Smith (2002) tested the influential theory and found that pay cuts would make workers
less happy, and thus a linear relationship was assumed. Based on the above studies, the
relationship between pay change and individual affective reaction (utility) can be
assumed to have a linear function form, which is presented in Figure 2.
Figure 2: Linear Relationship between Pay Raises/Cuts and Utility
3.2 Curvilinear Utility Function
Based on traditional utility theory, a large number of economists have proposed that
there is a nonlinear relationship between changes in pay and the utility/disutility of
money. Some of these researchers, especially neo-economists, focus on the change in
the marginal utility with the change in the level of income. As indicated by Bernoulli
(1954), a utility function with exponential form for the value of money was postulated
by the mathematician Cramer in 1728. Moreover, not only the power function but also
Utility
Disutility
Pay Cuts Pay Raises

22
the logarithmic and quadratic function have been adopted in a series of studies to
investigate the relationship between merit increases and satisfaction. Figure 3
illustrates a nonlinear relationship between pay changes and utility.
Figure 3: Curvilinear Relationship between Pay Raises/Cuts and Utility
Hyperbolic absolute risk aversion (HARA) is the most general class of utility functions
used in practice. Constant relative risk aversion (CRRA), constant absolute risk
aversion (CARA), and quadratic utility all exhibit HARA.
Let X denote the pay levels and Y denote the utility of this pay change. In this study,
the three common function forms of nonlinear relationship that we investigate are as
follows:
1. Logarithmic: Y = 𝑏𝑏0 + 𝑏𝑏1 × log𝑋𝑋
2. Power (Nonlinear) with constant: Y = 𝑏𝑏0 + 𝑋𝑋𝑏𝑏1 (1)
Power (Nonlinear) without constant: Y = 𝑏𝑏0 × 𝑋𝑋𝑏𝑏1
Utility
Disutility
Pay Cuts Pay Raises

23
The non-linear power function without constant can be adjusted as below:
Power (Log linear) without constant log𝑌𝑌 = 𝑏𝑏0 + 𝑏𝑏1 × log𝑋𝑋
It may be noted that the nonlinear power function in Eq. (1) is known as a
constant relative risk aversion (CRRA) utility function in economics and is
widely used in the literature. Thus, we consider the power function form of
Eq. (1).
3. Quadratic Y = 𝑏𝑏0 + 𝑏𝑏1 × 𝑋𝑋 + 𝑏𝑏2 × 𝑋𝑋2
3.3 Reference Point
According to cardinal utility theory, it is important to locate the “zero” value of utility.
Here, the “zero” of utility is regarded as the “reference point”. It is discussed in Section
2 that the quantitative comparison between the utilities of two objects depends on both
the magnitude of utility difference and the location of the "zero" of utility. Kahneman
and Tversky (1979) suggested the employment of reference point is to place a value
on gains or losses. In this study, we assume that the reference point of utility of pay
change corresponds to the situation when a person has no psychological change given
zero change in the pay; that is, the reference point is the origin in Figures 2 and 3.
Moreover, a person’s base pay could play a significant role in the utility/disutility of
pay changes. According to prospect theory, the changes in utility should focus on the
stimulus level. That is, the pay change is a relative concept, which is the comparison
of the stimulus with respect to the reference point, rather than the absolute cumulative
or decrease amount of pay level (Kahneman and Tversky 1979). For instance, it is an
intuitive notion that a person with a current salary of $1,000 would obtain more joy
24
from a pay increase of $1,000 than a person with a current salary of $5,000.
3.4 Smallest Meaningful Pay Increase
As discussed previously, empirical studies in economics have investigated the
curvilinear relationship between pay changes and individual reactions. Bernoulli (1954)
supported a logarithmic utility function; Giles and Barrett (1971) supported a power
function; Worley et al. (1992) and Heneman et al. (1997) identified a quadratic or
inverted-U function. However, these studies paid little attention to the disutility of
small pay increase. Ernst Weber, a nineteenth-century German scientist, first asserted
Weber’s law (Champlin and Kopelman 1991, Gescheider 1976): “the change in
stimulus intensity (ΔΦ) that can just be discriminated is a constant fraction (k) of the
starting intensity of the stimulus (Φ)” (Gescheider 1976). Mitra et al. (1997) stated that
there is a threshold on monetary gains as well. Working settings and culture can affect
the amount of the threshold (Katkowski et al. 2002, Mitra et al. 2016). According to
Weber’s law and previous studies, we need to consider the situation that a small gain
may result in disutility.

25
4 METHODOLOGY
In this study we conduct an experimental simulation to collect data in order to
empirically study the relationship between pay change and utility. This section
provides an overview of the methodology adopted in the experiment. We first describe
the participants, procedures, and the pilot test. We then explain the measurement used
for capturing the related variables. At the end, we introduce the approach and methods
applied to the data analysis.
4.1 Participants
In our experimental simulation, the final sample consists of 131 students from diverse
background at a university in Hong Kong, and these students were recruited as part-
time research assistants. These participants include undergraduates and master
students, and they were recruited through campus posters, email announcements, and
personal networks from various sources, such as friends, classmates, and roommates.
Table 1 presents the detailed breakdown of participants’ demographic characteristics.
Due to missing data and data mismatch for some subjects, the reported data for this
study are 131 participants’ responses. Among all 131 participants, 17.55% (23)
were male and 82.45% (108) were female, the participants’ ages ranged from 18 to 26
and the average age was 21.04 (with SD = 1.79). Regarding the education level, the
majority of the participants were undergraduate, accounting for 87.79% (115) of the
sample. A total of 10.68% (14) of the participants were master students, and 1.53% (2)
participants were PhD students. In terms of birthplace, 44.27% (58) were from
Mainland China, and 55.73% (73) from Hong Kong.

26
4.2 Procedure
Gerhart and Rynes (2003) indicated that the experimental simulation study could be
appropriate for investigating the casual relationship, especially for studies of the
compensation system. Jenkins et al. (1998) also demonstrated that the effects of
financial incentives could be best demonstrated in experimental simulations. Thus, we
adopt the experimental simulation study for this research.
The participants voluntarily applied to the experimenter to perform a data-coding task.
They were not allowed to talk with each other or access the Internet in a simulated
working environment during the whole experiment process. The participants signed a
consent form before the experiment. At the end of the experimental simulation, they
were informed about the true purpose of the study (the utility of pay raises/cuts) and
all participants received a payment of HK$80.
In the first stage of the experiment, we collected the demographic characteristics of
participants. The students completed a questionnaire about their background
information, such as gender, age, education level, and birthplace.
In the second stage, each participant was required to individually complete a coding
task which took 30 minutes. At the start of the task, the written instructions were
distributed to each participant, and the experimenter gave a brief explanation to make
sure that each individual could understand the task requirements. After the task, the
experimenter collected the task books and answer sheets.
In the third stage, we collected the utility data of pay change. The participants were
required to complete another questionnaire about their individual responses to pay

27
changes. This questionnaire assumed that each participant was hired for this coding
job for six months at 20 hours per week. The starting payment was HK$80 per hour,
the average level in the industry. Participants’ payment would be adjusted after
working for three months. In this questionnaire, participants were asked about how
satisfied they were with various pay changes (including 15 pay raises, 9 pay cuts, and
one with “no” pay change), and these pay changes were randomly-ordered to avoid the
response bias. Specifically, the questionnaire contained the following instructions to
participants for completing the questions.
“Assume that we offered you the coding job for six months at 20 hours per week and
that you accepted. Assume that your starting rate is HK$80 per hour. This booklet of
questions contains 25 different pay rates, which may be more or less than the starting
rate. We want to know how you would feel about each pay rate compared to your
starting pay rate. In other words, tell us how happy you would be with each pay rate
compared to your starting pay rate. Mark your answer on each page by putting an X
on the line at the point that corresponds to your feelings.”
“This can be time-consuming, and we want you to do it quickly. There is no exact right
answer, so mark each page and move along. You should not go back over the pages.
We just want your initial reactions.”

28
4.3 Pilot Test
Before the formal experiment, the experimenters conducted two pre-tests. Three
students participated in the first pre-test to complete the questionnaires. Based on their
feedbacks, the experimenters modified the statements of questions to ensure that
students could fully understand the questions. The demographic questionnaire was also
modified for a few questions.
After a week, the second pilot test of the experimental simulation was conducted
among 7 students (3 male and 4 female). Long duration experiment may lead subjects
to feel tired and bored, which may reduce the accuracy of the utility measure.
Therefore, based on these seven students’ feedback, the experimenters redesigned
some sections of this experiment to ensure that the duration is appropriate and each
section can proceed smoothly.
After two rounds of pre-tests, all related documents, such as the consent form,
demographic questionnaire, and coding task, were made ready for data collection, and
the final version of the experiment process was confirmed.
4.4 Measurement
The participants’ individual responses (i.e., happiness/unhappiness) as a result of pay
changes were measured by using 100-mm continuous dependent-response rating line.
In order to collect data for utility of different pay changes, participants were asked to
compare their new pay level (25 pay levels from HK$60 to HK$130) with their old
pay level (HK$80 in this experiment), and record their responses with an “X” at a point
on the line to indicate their degree of happiness (from “very unhappy” to ‘‘no change’’

29
to “very happy”). As mentioned in the literature review (Section 2), the empirical
measurement approach used in this study is a traditional psychophysical method. Mitra,
et al. (1997) developed the approach in their pay raise study. The approach was also
adopted by Shaw et al. (2003) in their longitudinal study to investigate employees’
reactions to merit pay increase. The continuous dependent-response rating line was
used to assess the employees’ responses. All participants provided their affective
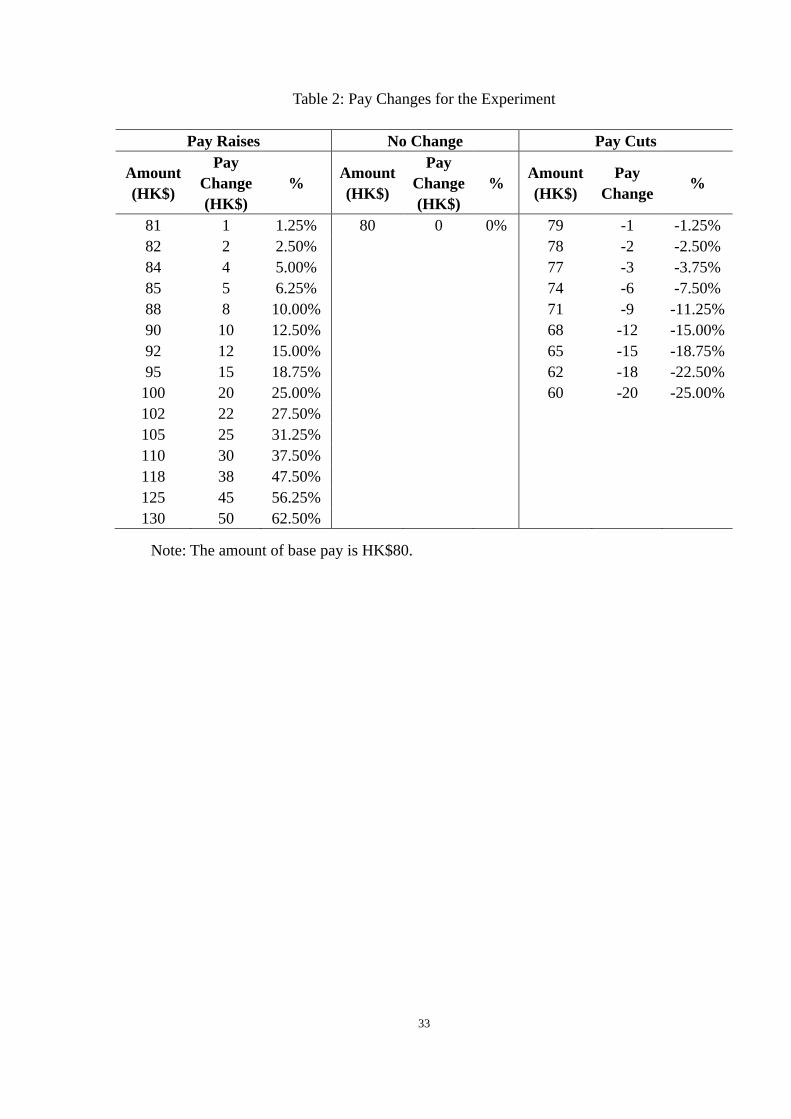
reactions to the 25 pay levels. Details of these pay levels are shown in Table 2.
The range of pay changes was chosen for two considerations. Prior studies suggest that
this range should be sufficiently large to contain the SMPI and should take reasonable
values in the context of employment. And the use of a length of line to estimate the
utility may involve two issues. One issue is related to the consistency bias. In a
common method, participants would be required to give their response to numerically
presented pay changes. When the utility is also assessed as a numerical measurement,
it is reasonable for subjects to attempt to maintain consistency between the first and
second set of numbers, i.e., the pay raise and the direct magnitude-based utility scale
(Galanter 1990, Galanter and Pliner 1974, Worley et al. 1992). Stevens (2012)
proposed that a length of line as a direct cross-modality matching technique to estimate
utility can solve the problem of consistency. Later, other researchers also confirmed it
(Cross 1982, Giles and Barrett 1971). Moreover, Galanter (1990) and Worley et al.
(1992) identified that randomly providing different pay changes on each page may
preclude cognitively consistent, but not necessarily true responses to subjects.
Another issue is that in this experiment, each participant was required to mark his or

30
her happiness for 25 pay changes, that is, for every pay change, we have the data of all
participants’ individual utilities. In summary, the continuous dependent-response
rating format with 25 randomly presented pay levels was adopted in the experiment.
4.5 Data Analysis and Regression
The data for this study were 131 subjects’ responses to 25 pay changes and their
demographic characteristics. We calculated the correlation between each of the three
demographic dimensions (gender, age, and education level) and utility.
The responses were analyzed to assess the relative validity of linear, power,
logarithmic, and quadratic utility functions through regression techniques. Since a
single function can be used to analyze both pay raises and pay cuts rather than using
two separate functions for the positive and negative limbs, a single utility model
involving all pay changes was be considered.
The positive and negative limbs (i.e., pay raises and pay cuts) can also be analyzed
separately (Galanter 1990, Giles and Barrett 1971). After we identified the best
function for the utility model, we also considered the positive and negative limbs
separately. In order to assess the relative validity of a single utility model and separated
utility model, the data were analyzed using hierarchical regressions method (Cohen et
al. 2013).
Hierarchical regression analysis is commonly used to assess statistical superiority of
different theoretical models that involve incremental addition of independent variables
and interactive terms (Cohen et al. 2013). The process comprises of testing statistical
significance of unique variance associated with incremental addition of a block of
31
variables and, typically, the block of variables that a researcher wishes to control are
added first. This ensures that the unique variance associated with the variable of
interest can be clearly identified (Cohen et al. 2013). Thus, as a first step of the
hierarchical regression we added three demographic variables as the independent
variables. Gender was regarded as a dummy variable in the model, while age and
education level were considered as continuous variables. Accordingly, the pay level
(i.e., the pay change) was added in the second step to examine its effect on the utility.
Finally, the square of pay change was added to the equation. F-statistic was then used
to identify the additional variance explained in each step. We used statistical program
SPSS for our analysis, which uses the change in R2 instead of the change in adjusted
R2 to report F-statistic for additional variance explained in each step, a practice well
accepted in the statistical literature (Cohen et al. 2013). Thus, using hierarchical OLS
regression, it is possible to statistically test the superiority of a quadratic functional
form compared to a linear functional form. After we identified the best-fit single utility
model, we used the model to smallest meaningful pay increase.

32
Table 1: Demographic Characteristics of Participants
Dimension Category Code No. of Participants
Percentage Mean SD
Gender Male 0 23 17.55% .82 .38
Female 1 108 82.45%
Age - - - - 21.04 1.79
Education Level
Undergraduate 0 115 87.79%
.21 .55 Master in
Science 1 7 5.34%
Master in philosophy
2 7 5.34%
Doctor 3 2 1.53%
Birthplace Mainland China
0 58 44.27% 0.56 0.55
Hong Kong 1 73 55.73%
Note: n=131.
33
Table 2: Pay Changes for the Experiment
Pay Raises No Change Pay Cuts
Amount(HK$)
Pay Change(HK$)
% Amount(HK$)
Pay Change(HK$)
% Amount(HK$)
Pay Change %
81 1 1.25% 80 0 0% 79 -1 -1.25% 82 2 2.50% 78 -2 -2.50% 84 4 5.00% 77 -3 -3.75% 85 5 6.25% 74 -6 -7.50% 88 8 10.00% 71 -9 -11.25% 90 10 12.50% 68 -12 -15.00% 92 12 15.00% 65 -15 -18.75% 95 15 18.75% 62 -18 -22.50% 100 20 25.00% 60 -20 -25.00% 102 22 27.50%
105 25 31.25%
110 30 37.50%
118 38 47.50%
125 45 56.25%
130 50 62.50%
Note: The amount of base pay is HK$80.

34
5 RESULTS
This section presents the findings for a series of analyses conducted in the experiment.
First, we tested four functional forms for the utility data. Secondly, we calculated the
correlation between each demographical variable and the utility. Thirdly, we assessed
the relative validity of the single utility model involving all pay changes, and compared
it with the separate models for pay raises and pay cuts. Finally, the best-fitting utility
model that we identified reveals that a sufficiently small amount of pay increase may
generate a negative value of utility, and we calculated the percentage of the smallest
meaningful pay increase resulting in non-negative utility.
5.1 Curve Estimation
Table 3 shows the results of the curve estimation using regression analyses for subjects’
affective reactions. To use logarithmic and power functions, we made a transformation
on the data first by using the pay level (pay level = pay change + base pay level HK$80)
as the independent variable. Thus the independent variable takes the values between
60 (HK$) to 130 (HK$). The dependent variable is the utility, shown by each subject’s
marked length in 100-mm continuous dependent-response rating line, from 0 (mm) to
100 (mm).
Through the statistical program SPSS, R2, F-statistic, p value, the constant and the
estimated unstandardized parameters are reported for each functional form. We found
that the quadratic function has the highest R2 value (.663) and is thus superior to the
other three functional forms. Our results also suggest that the linear function (R2=.628)
is superior to the power function (R2=.638). In addition, the logarithmic model

35
(R2=.653) is a better fit than the linear function and power function. Therefore, the
results of curve estimation by SPSS for the four functional forms supports the
quadratic functional form for describing the utility of pay changes for our data.
5.2 Correlational Analysis
A correlation analysis was conducted to examine the impact of social desirability bias
on the data set and obtain an initial understanding of the relationships among variables.
In this step, the variable of pay change is the amount of change in pay, from -20 (HK$)
to 50 (HK$), and the utility is the individual perceived value, from -50 (mm) to 50
(mm). The calculation results show that the correlation coefficients of the social
desirability scales to utility range from -.025 to .017. Since the coefficients were all
below the threshold of .30 as recommended in previous studies (e.g., Mitchell and
Ambrose 2007), we can conclude that social desirability bias does not cause a
significant threat to the data.
Table 4 presents the mean, standard deviation, and correlation calculated for the
variables. Results of the correlation analysis demonstrated that gender has an
insignificant negative relationship with the utility of pay change (r = -.025, p > .05).
Nevertheless, previous research has shown that gender differences could play an
important role in individual’s attitudes towards money. Women tend to value the social
needs (e.g. work with people and being helpful to others) more important than men,
while men tend to consider pay more important than women (Lawler 1971). That is,
men are more likely to response a higher level of utility than women. Men and
achievement-oriented employees tend to favor merit pay (Heneman 1992). In our data,

36
the number of females is more than four times of males, which could be a reason for
the insignificant relationship between gender and utility. On the other hand, Table 4
indicates that both age and education level have an insignificant correlation with the
utility of pay change. Therefore, there is no obvious correlation between the
demographical variables and utility.
In addition, there is a significant positive relationship between pay change and utility
(r = .792, p < .001). This relationship is the main focus of the study. Accordingly,
hierarchical multilevel analysis was used to examine the relationship.
5.3 Hierarchical Multilevel Analyses
According to Table 3, we can conclude that for the single utility model, the quadratic
function is the best fit model for our data among the four common function forms.
Although the results in Table 4 indicate that demographical characteristics (i.e., gender,
age and education level) may not have a significant effect on the utility, they can still
be regarded as control variables and included in the first step of hierarchical
regressions. Then, the amount of pay change was added in the second step to test the
linear effect. In the last step, the square of pay change was added to test the quadratic
effect. F-statistic was then used to identify the additional variance explained in each
step. The results of hierarchical OLS (ordinary least square) regression for the
relationship between the utility and pay changes as well as the relationship between
the utility/disutility and pay raises/cuts are reported in Table 5 and Table 6, respectively.
Table 5 presents the results of hierarchical regression for a single utility model. For the
utility of pay change, the results suggest that the addition of a quadratic term can

37
significantly explain an additional unique variance over and above the variance
explained by the linear function (∆F =341.439, p<.001). Moreover, the estimated
unstandardized parameters were reported in Model 3 of Table 5. Thus, in the range of
our pay changes (from -25% to +62.5% of the base pay), the utility function is concave.
Our findings supports that the quadratic function is superior to the linear function to
describe the utility of pay change. The results of separate models for positive and
negative pay changes were shown in Table 6. We find that, for pay cuts (i.e., the
negative limb of pay change), Model 2 is significant, whereas Model 3 is not
significant (∆F =.337, p>.05). Thus the relationship between the utility and pay cut is
linear, not quadratic. On the other hand, for pay raises (i.e., the positive limb of pay
change), Model 3 with the variable of square of pay raise has a superior fit to Model 2
(∆F =57.154, p<.001). In summary, when we examine the best utility functions for pay
raises and pay cuts separately, we find that the utility of pay raises and that of pay cuts
are best described by a quadratic function and a linear function, respectively.
The utility of pay raise and the disutility of pay cut
Table 6 shows a linear utility on the loss domain and a concave utility on the gain
domain within the scope of our data (from HK$20 of pay cut to HK$50 of pay raise).
Many researchers have investigated the utility / disutility of monetary gains / losses in
the study of the gambling. For example, according to prospect theory, the utility
function should be concave for gains and convex for losses (Kahneman and Tversky
1979, Kahneman and Tversky 1992). However, in the employment context,
psychological factors may affect the utility of pay change. Mitra et al. (2015)

38
conducted an empirical study in a simulated working environment. Their results
indicated that a quadratic function is the most descriptive to the relationship between
the utility and pay raise among four functional forms (linear, logarithmic, power, and
quadratic), and pay cut is linearly related to the disutility. The findings in this study
support past research. Marginal utility theory for money and reactance theory can
explain the shape of the utility function in positive limb and negative limb, respectively.
According to Brehm (1966), reactance theory concerns people’s reactions to the loss
of behavioral freedom or to the threat of such loss. Mitra et al. (2016) believed that
individual’s heightened reactions to negative issues occur partly because of the
following four reasons. First, the negative issues may evoke stronger physiological
responses than positive issues; secondly, under the negative issues, individual’s
reactions may focus on how to address the immediate dangers or toxicities; thirdly,
people seldom expect to meet any negative issues; and lastly, negative events involve
more cognitive effort (Duffy et al. 2002, Taylor 1991). Thus, the joint impact of under-
met expectations and mobilization effects leads to a linear relationship between
negative pay changes and subjective assessment.
For the negative limb, it is asserted that any pay cut, irrespective of its size, results in
strong negative reaction. This assertion assumes that an employee will show very
negative reaction to a small pay raise due to the under-met expectation. Thus, the
disutility resulting from a small pay cut is in part affected by the under-met expectation
of pay raise. Furthermore, it is well-established that losses loom larger than gains
(Kahneman and Tversky 1979, 1984). Thus, a pay cut should evoke stronger disutility.

39
A single model or separated models
A few additional results can be presented from Table 5 and Table 6. When we consider
the utility function of pay cuts and pay raises separately, the function can be
represented as follows:
Y = f(x) = �f(x−), x < 0f(x+), x ≥ 0
According to the formulas of R2, we can calculate the R2 value of this piecewise
function as .378.
𝑅𝑅2 =∑(𝑌𝑌1 − 𝑌𝑌�)2
∑(𝑌𝑌 − 𝑌𝑌�)2
where 𝑌𝑌� refers to the mean of 𝑌𝑌 (utility), 𝑌𝑌1 refers to f(x), and 𝑌𝑌 refers to the real
value of utility.
The R2 of a quadratic utility model for all pay changes is higher than the R2 value of
the piecewise function (.664 vs .378). This result shows that a single utility model
involving all pay changes has a better fit for the data than two models for pay raises
and pay cuts separately.
The smallest meaningful pay increase
Using the above results of utility models, we did a further analysis of the best fit utility
function (i.e., the quadratic function) to find the threshold of pay raise.
In Table 3, for the quadratic function, the estimated parameters are b0=-171.175,
b1=2.971, and b2=-0.011. The relationship between utility Y and pay level X is given
as follows:
Y = −171.175 + 2.971X − 0.011𝑋𝑋2.
Since we have applied a transformation before estimating the utility functions, the
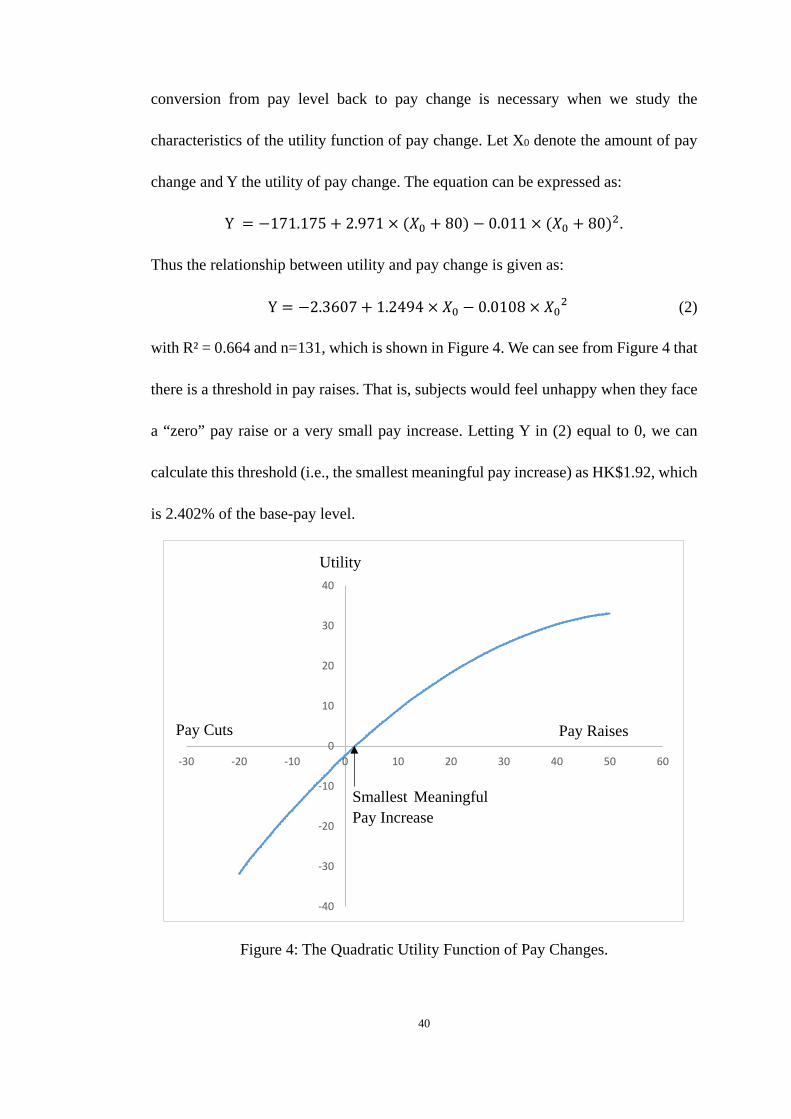
40
conversion from pay level back to pay change is necessary when we study the
characteristics of the utility function of pay change. Let X0 denote the amount of pay
change and Y the utility of pay change. The equation can be expressed as:
Y = −171.175 + 2.971 × (𝑋𝑋0 + 80) − 0.011 × (𝑋𝑋0 + 80)2.
Thus the relationship between utility and pay change is given as:
Y = −2.3607 + 1.2494 × 𝑋𝑋0 − 0.0108 × 𝑋𝑋02 (2)
with R² = 0.664 and n=131, which is shown in Figure 4. We can see from Figure 4 that
there is a threshold in pay raises. That is, subjects would feel unhappy when they face
a “zero” pay raise or a very small pay increase. Letting Y in (2) equal to 0, we can
calculate this threshold (i.e., the smallest meaningful pay increase) as HK$1.92, which
is 2.402% of the base-pay level.
Figure 4: The Quadratic Utility Function of Pay Changes.
-40
-30
-20
-10
0
10
20
30
40
-30 -20 -10 0 10 20 30 40 50 60
Utility
Smallest Meaningful Pay Increase
Pay Raises Pay Cuts

41
Based on expectancy theory, Lawler and Jenkins (1992) showed that both the amount
of pay raise and individual’s expectations on the pay raise may affect his/her reaction
to the pay increase. A person’s expectation to the pay raise can be influenced by
complicated factors, such as the base pay level, the performance appraisal standards,
and other’s pay raise. For instance, an employee may have an expected magnitude of
a merit pay raise, and thus a smaller-than-expected raise could produce an experienced
disutility or negative affective reaction. Thus, according to expectancy theory, ‘‘actual
pay raises’’ that are less than ‘‘expected pay raises’’ could evoke disutility or negative
reactions. Recent work on experienced utility seems to support the need for this
refinement. Carter and McBride (2013) suggested that at least three factors influence
an individual’s reference point: past outcomes, expected outcomes, and outcomes
received by the peer-group. Furthermore, prior research described that not only the
past outcomes, but also the social comparison process may impact the individual’s
expectations to a pay raise (Elster, 2000, Milkovich et. al. 2011). To summarize, pay
raise expectations play a critical role in determining the affective reactions of pay
raises, and it is reasonable that small pay raises may evoke negative affective reactions.
We note that a quadratic function is unimodal. Using the quadratic model in (2), we
can calculate the extreme point for the utility of pay change as HK$57.84 (i.e., 72.3%
of base pay). The utility is increasing in pay change before this point, but is decreasing
after this point. Since the maximum pay raise in our study is HK$50, smaller than this
extreme point, we do not need to consider the extreme point of utility function in the
study.

42
5.4 Summary
In summary, a number of conclusions can be drawn from our results. (i) The quadratic
function best fits the relationship between the utility and pay change than other three
common functional forms including the linear, logarithmic, and power functions. (ii)
Through separate hierarchical multilevel analyses for pay raises and pay cuts, we
showed that quadratic and linear functions are the most descriptive of the positive and
negative limbs, respectively. (iii) A single quadratic utility model involving all pay
changes has a better fit for the data than two models for pay raises and pay cuts
separately. (iv) The best-fit utility model reveals that a sufficiently small amount of
pay increase may generate a negative value of utility, and this percentage of smallest
meaningful pay increase is calculated to be 2.402% of the base-pay level.

43
Table 3: Regression Results of Individual Responses to Pay Levels
Equation Model Summary Parameter Estimates R2 F df1 df2 Sig. Constant b1 b2
Linear .628 5523.318 1 3273 .000 -80.449 .951 Logarithmic .653 6169.922 1 3273 .000 -387.258 87.638 Quadratic .663 3218.425 2 3272 .000 -171.175 2.971 -.011 Power .638 5762.867 1 3273 .000 -171.058 .436
Note: n = 131. Independent variable: pay level, dependent variable utility.
Table 4: Correlations and Descriptive Statistics
Variables Mean SD 1 2 3 4 5 1. Gender .824 .381 - -.202** .027 - -.025 2. Age 21.046 1.786 - .583*** - .004 3. Education level .206 .548 - - .017 4. Pay change 8.040 18.512 - .792*** 5. Utility 3.303 22.224 -
Note: n = 131. * p < .05 ** p < .01 *** p < .001

44
Table 5: Hierarchical Multilevel Analyses for Utility of Pay Change (Involving all
Data of Pay Changes)
Predictor Utility of pay change Model 1 Model 2 Model 3
(constant) 9.403 1.755 3.739 Gender -1.753 -1.753* -1.753** Age -.233 -.233 -.233 Education level 1.183 1.183* 1.183* PC(Pay change) .951*** 1.249*** PC2 -.011*** ∆R² .001 .628 .035 AdjR² .000 .629 .664 R² .001 .629 .664 ∆F 1.303 5536.010*** 341.439***
Notes: n = 131. * p <.05, ** p<.01, *** p<.001
45
Table 6: Hierarchical Multilevel Analyses for Utility of Pay Change (Pay Cuts and
Pay Raises Separately)
Predictor Utility of pay change
Negative limb Positive limb Model 1 Model 2 Model 3 Model 1 Model 2 Model 3
(constant) 4.406 15.455* 15.888* 11.628* -.488 -2.660 Gender -1.054 -.931 -.935 -1.971* -2.115** -2.192** Age -.997** -.984** -.984** .216 .200 .192 Education level 2.741* 2.735** 2.735** .298 .305 .309 PC(Pay change) 1.200*** 1.346*** .703*** 1.116*** PC2 .007 -.009*** ∆R² .008 .247 .000 .003 .441 .015 AdjR² .006 .252 .252 .002 .443 .458 R² .008 .255 .255 .003 .445 .459 ∆F 3.271* 387.807*** .337 2.409 1662.883*** 57.154***
Notes: n = 131. * p <.05, ** p<.01, *** p<.001

46
6 DISCUSSION
This section consists of two parts. First, we discuss the theoretical contributions and
practical implications of our findings. Then, we discuss the limitations of this study,
and provide the directions on further research.
6.1 Contributions and Implications
Our research has a number of contributions to the literature. First, this study provides
an empirical evidence about the specific relationship between utility and pay change
in the context of employment. Previous studies have proposed a nonlinear utility
function, such as the logarithmic form, the power form (Giles and Barrett 1971,
Stevens 2012, and Brandstateer and Brandstateer 1996), and the quadratic form or
inverted-U function (Heneman et al. 1997, Mitra et al. 2015). Our study provides
additional experimental evidences for the curvilinear utility function.
Secondly, our results offer a support for the decreasing marginal utility of pay change
in the reasonable range of pay levels from 75% to 162.5% of the base pay, and the
quadratic function is a best fit to our data. Concave utility in the pay raises means that
a pay raise of $200 does not yield twice the benefit that a pay raise of $100 does. The
findings confirm previous research with respect to the decreasing marginal utility of
pay raises (Layardy and Nickellx 2006). However, no prior study has jointly
considered pay cuts and pay raises to investigate a best fit utility function form in the
context of employment. We found that the change in utility for all pay changes can be
described by a single utility function, and the utility function is shown to be concave.
Our third contribution is that the results highlight the problems inherent in small pay
47
raises, revealing the disturbing effects of small pay raises. In both work and non-work
settings, prior studies rarely considered the influence of a very small pay raise on
subjects’ reactions to monetary changes. All previous studies on monetary gains in the
economics literature assumed that positive gains would always have a positive utility.
We demonstrated that small gains can have disutility, which represents a logical
extension, namely, the identification of stable SMPI thresholds.
Our findings also have implications to the practice. It is important for managers to
recognize that very small pay raises may cause disappointment, rather than be
perceived as a reward. The finding is consistent with the research on the smallest
meaningful pay increases (Mitra et al. 1997, Champlin and Kopelman 1991, Mitra et
al. 2016, Worley et al. 1992). In the working settings, the allocation of monetary
increase presumably enhances employees’ motivation, performance, and retention
(Heneman 1992). Unfortunately, with the economic crisis or low inflation, companies
may have small budget increases, and little growth often means that there is little merit
money to distribute. Even so, companies continue to allocate merit raises. Our finding
points to a problem with this approach. If cognitive recognition of pay raises does not
even occur until pay raises reach about 2 per cent of the base pay, then smaller raises
may not evoke any positive cognitive and behavioral reactions.
6.2 Limitation and Future Work
First of all, the composition of the sample of participants may limit the generalizability
of our results in this study. In order to empirically test the specific utility functional
forms, we conducted an experimental simulation. In the simulated working

48
environment, various realistic factors were controlled, and we could get desirable data
for employee reactions to pay raises and pay cuts. However, this may not be feasible
in field settings, and a complex set of organizational factors may influence employees’
reactions to pay changes. Moreover, the compensation structure is more complicated
in the working settings. Laboratory studies, on the other hand, involve the issues of
generalizability to reality.
Base pay
In our experimental simulation, the pay structure was simple and there was only one
base pay level. In our results, the smallest meaningful pay increase is approximately
2.4% of the base pay level. Previous studies indicated that an increase of about 5–8%
of the base pay level can be regarded as meaningful (Mitra et al. 1997, Mitra et al.
2016, and Worley et al. 1992). The magnitude of SMPI in the previous studies is two
to three times larger than our result. One possible reason is that our experimental
simulation where subjects are paid real money differs from the complex field contexts.
The duration of work and the frequency of payoff (i.e., hourly or monthly) may
influence individual responses to pay changes. Future research can investigate the
impact of base pay level on the magnitude of SMPI.
Performance and performance feedback
Performance-based pay change is the second direction for future research. In recent
years, organizations have increasingly adopted performance-based compensation
schemes. Hewitt Associates (2005), an American provider of human capital and
management consulting services, reported that 47 percent of more than 1,000
49
companies surveyed had incentive systems where rewards were based on specific
employee performance criteria. In addition, the performance-related pay has attracted
great attention from academics. Extant publications have provided insights into the
effects of pay level, merit pay, and performance on satisfaction. Merit pay is
significantly associated with employee motivation, performance, and satisfaction (e.g.,
Gerhart and Rynes 2003, Green and Heywood 2008, and Bassett 1994).
Different types of performance feedback may lead to different levels of expected pay,
and influence people’s subjective value of pay changes. However, little research has
studied the impact of performance feedback on the utility of pay changes.
Individual differences
Individual differences are often ignored in the study of pay satisfaction, or perceived
value (i.e., utility) of pay changes. For example, the concept of attitudes towards
money can be involved in the relationship between pay change and utility. Extant
studies generally considered money attitudes as a psychological factor, but seldom
associated it with the reactions to pay changes. As found by Roznowski and Hulin
(1992), jobs that provide good income may be satisfactory to some individuals, but
people with fewer material desires may not find money particularly satisfying. Tang et
al. (1997) indicated three major components of money attitudes: affective (Good and
Evil); cognitive (Achievement, Respect, and Power); behavioral (Budget). People with
different levels of money attitudes have different patterns of pay satisfaction
(Roznowski and Hulin 1992). The affective, as an important component of money
attitudes, plays a major role in the relationship between pay level and pay satisfaction.

50
Other researchers (e.g., Pfeffer and Langton, 1993 and Tang et al. 2005) also indicated
that the love of money moderates the income-pay satisfaction relationship. For high-
love-of-money individuals, the relationship between income and pay satisfaction was
positive and significant, however, for low-love-of-money individuals, the relationship
was not significant. And they also argued the high- and low- love-of-money regression
lines intersected at a point. Therefore, our future research can investigate whether
individual differences, such as the love of money, mediate the relationship between
pay change and utility.
6.3 Conclusion
We conducted an experimental simulation to investigate the relationship between pay
changes and utility. We evaluated four functional forms including linear, quadratic,
power, and logarithmic functions, and found that a quadratic function best fits the
utility of pay change including reasonable pay raises and pay cuts. We also showed
that a single utility model is preferred over two separate models for pay raises and pay
cuts. In addition, we calculated the smallest meaningful pay increase and discussed its
practical implications.

51
REFERENCES
Abdellaoui, M. (2000). Parameter-free elicitation of utility and probability weighting functions. Management Science, 46(11), 1497-1512.
Allen, R. G. D. (1933). On the marginal utility of money and its application. Economica, (40), 186-209.
Bassett, G. (1994). Merit pay increases are a mistake. Compensation & Benefits Review, 26(2), 20-22.
Bernoulli, D. (1954). Exposition of a new theory on the measurement of risk. Econometrica: Journal of the Econometric Society, 23-36.
Black, R. C. (1990). Utility. Utility and Probability, 295-302. Boettcher, W. A. (2004). The prospects for prospect theory: An empirical evaluation
of international relations applications of framing and loss aversion. Political Psychology, 25(3), 331-362.
Booij, A. S., & Van de Kuilen, G. (2009). A parameter-free analysis of the utility of money for the general population under prospect theory. Journal of Economic psychology, 30(4), 651-666.
Brandstätter, E., & Brandstätter, H. (1996). What's money worth? Determinants of the subjective value of money. Journal of Economic Psychology, 17(4), 443-464.
Brehm, J. W. (1966). A theory of psychological reactance. Broome, J. (1991). Utility. Economics and Philosophy, 7(1), 1-12. Carter, S., & McBride, M. (2013). Experienced utility versus decision utility: Putting
the “S” in satisfaction. The Journal of Socio-Economics, 42, 13-23. Champlin, F. C., & Kopelman, R. E. (1991). Hinrichs revisited: Individual evaluations
of income increments. The Journal of Psychology, 125(3), 359-373. Cohen, J., Cohen, P., West, S. G., & Aiken, L. S. (2013). Applied multiple
regression/correlation analysis for the behavioral sciences. Cross, D. V. (1982). On judgments of magnitude. Social Attitudes and Psychophysical
Measurement, 73-88. Diener, E., Suh, E. M., Lucas, R. E., & Smith, H. L. (1999). Subjective well-being:
Three decades of progress. Psychological Bulletin, 125(2), 276-302. Diener, E., & Seligman, M. E. (2004). Beyond money: Toward an economy of well-
being. Psychological Science in the Public Interest, 5(1), 1-31. Dreher, G. F., Ash, R. A., & Bretz, R. D. (1988). Benefit coverage and employee cost:
Critical factors in explaining compensation satisfaction. Personnel Psychology, 41(2), 237-254.
Duffy, M. K., Ganster, D. C., & Pagon, M. (2002). Social undermining in the workplace. Academy of management Journal, 45(2), 331-351.
Elster, J. (2000). Social norms and economic theory. Culture and Politics, 363-380. Etchart-Vincent, N. (2004). Is probability weighting sensitive to the magnitude of
consequences? An experimental investigation on losses. Journal of Risk and Uncertainty, 28(3), 217-235.
Fennema, H., & Van Assen, M. (1998). Measuring the utility of losses by means of the tradeoff method. Journal of Risk and Uncertainty, 17(3), 277-296.

52
Galanter, E. (1990). Utility functions for nonmonetary events. The American Journal of Psychology, 449-470.
Galanter, E., & Pliner, P. (1974). Cross-modality matching of money against other continua. Sensation and measurement, 65-76.
Gerhart, B., & Rynes, S. (2003). Compensation: Theory, evidence, and strategic implications.
Gerlach, K., Levine, D., Stephan, G., & Struck, O. (2006). The acceptability of layoffs and pay cuts: Comparing North America with Germany. IAB discussion paper.
Gescheider, G. A. (1976). Psychophysics: Method and theory. Giles, B. A., & Barrett, G. V. (1971). Utility of merit increases. Journal of Applied
Psychology, 55(2), 103. Green, C. P., & Heywood, J. S. (2008). Are flexible contracts bad for workers?
Evidence from job satisfaction data. Hamblin, R. L. (1971). Ratio measurement for the social sciences. Social Forces, 191-
206. Harsanyi, J. C. (1953). Cardinal utility in welfare economics and in the theory of risk-
taking. Journal of Political Economy, 61(5), 434-435. Heneman, R. L. (1992). Merit pay: Linking pay increases to performance ratings. Heneman, R. L., Porter, G., Greenberger, D. B., & Strasser, S. (1997). Modeling the
relationship between pay level and pay satisfaction. Journal of Business and Psychology, 12(2), 147-158.
Hewitt Associates. (2005). Hewitt study shows base pay increases flat for 2006 with variable pay plans picking up the slack.
Hinrichs, J. R. (1969). Correlates of employee evaluations of pay increases. Journal of Applied Psychology, 53(6), 481.
Jenkins, Jr G. D., Mitra, A., Gupta, N., & Shaw, J. D. (1998). Are financial incentives related to performance? A meta-analytic review of empirical research. Journal of Applied Psychology, 83, 777-787.
Jevons, W. S. (1879). The theory of political economy. Judge, T. A., Piccolo, R. F., Podsakoff, N. P., Shaw, J. C., & Rich, B. L. (2010). The
relationship between pay and job satisfaction: A meta-analysis of the literature. Journal of Vocational Behavior, 77(2), 157-167.
Kahneman, D., Wakker, P. P., & Sarin, R. (1997). Back to Bentham? Explorations of experienced utility. The Quarterly Journal of Economics, 112(2), 375-406.
Kahneman, D., & Tversky, A. (1979). Prospect theory: An analysis of decision under risk. Econometrica: Journal of the Econometric Society, 263-291.
Kapteyn, A., & Wansbeek, T. (1985). The individual welfare function: A rejoinder. Journal of Economic Psychology, 6(4), 375-381.
Katkowski, D. A., Medsker, G. J., & Pritchard, K. H. (2002). Literature review of “acceptable” or “just noticeably different” pay increases. Industrial and Organizational Psychology.
Kauder, E. (2015). History of marginal utility theory. Lawler, E. L. (1971). Pay and organization effectiveness: A psychological view. Lawler, E. E., & Jenkins, G. D. (1992). Strategic reward systems. Malka, A., & Chatman, J. A. (2003). Intrinsic and extrinsic work orientations as
53
moderators of the effect of annual income on subjective well-being: A longitudinal study. Personality and Social Psychology Bulletin, 29(6), 737-746.
Marshall, A. (1961). Principles of economics: An introductory volume. Mosteller, F., & Nogee, P. (1951). An experimental measurement of utility. Journal of
Political Economy, 59(5), 371-404. Miceli, M. P., & Lane, M. C. (1990). Antecedents of pay satisfaction: A review and
extension. Research in Personnel and Human Resource Management, 9, 235-309. Milkovich, T., Newman, M., & Gerhart, B. (2011). Compensation. Mitchell, M. S., & Ambrose, M. L. (2007). Abusive supervision and workplace
deviance and the moderating effects of negative reciprocity beliefs. Journal of Applied Psychology, 92(4), 1159.
Mitra, A., Gupta, N., & Jenkins Jr, G. D. (1997). A drop in the bucket: When is a pay raise a pay raise? Journal of Organizational Behavior, 117-137.
Mitra, A., Jenkins, G. D., Gupta, N., & Shaw, J. D. (2015). The utility of pay raises/cuts: A simulation experimental study. Journal of Economic Psychology, 49, 150-166.
Mitra, A., Tenhiälä, A., & Shaw, J. D. (2016). Smallest meaningful pay increases: Field test, constructive replication, and extension. Human Resource Management, 55(1), 69-81.
Nyberg, A. J., Pieper, J. R., & Trevor, C. O. (2016). Pay-for-performance’s effect on future employee performance: Integrating psychological and economic principles toward a contingency perspective. Journal of Management, 42(7), 1753-1783.
Pfeffer, J., & Langton, N. (1993). The effect of wage dispersion on satisfaction, productivity, and working collaboratively: Evidence from college and university faculty. Administrative Science Quarterly, 382-407.
Porter, G., Greenberger, D. B., & Heneman, R. L. (1990). Pay and pay satisfaction: A comparison of economic, political, psychological, and psychophysical predictions. Academy of Management Proceedings, 1, 289-293.
Rambo, W. W., & Pinto, J. N. (1989). Employees' perception of pay increases. Journal of Occupational Psychology, 62(2), 135-145.
Roznowski, M., & Hulin, C. (1992). The scientific merit of valid measures of general constructs with special reference to job satisfaction and job withdrawal. Job Satisfaction, 123-163.
Russell, C. J., & Bobko, P. (1992). Moderated regression analysis and Likert scales: Too coarse for comfort. Journal of Applied Psychology, 77(3), 336.
Schaubroeck, J., Shaw, J. D., Duffy, M. K., & Mitra, A. (2008). An under-met and over-met expectations model of employee reactions to merit raises. Journal of Applied Psychology, 93(2), 424.
Schunk, D., & Betsch, C. (2006). Explaining heterogeneity in utility functions by individual differences in decision modes. Journal of Economic Psychology, 27(3), 386-401.
Schuster, J. R., Colletti, J. A., & Knowles, L. (1973). The relationship between perceptions concerning magnitudes of pay and the perceived utility of pay: Public and private organizations compared. Organizational Behavior and Human Performance, 9(1), 110-119.
Shaw, J. D., Duffy, M. K., Mitra, A., Lockhart, D. E., & Bowler, M. (2003). Reactions

54
to merit pay increases: A longitudinal test of a signal sensitivity perspective. Journal of Applied Psychology, 88(3), 538.
Smith, J. C. (2002). Pay cuts and morale: a test of downward nominal rigidity. Warwick Economic Research Papers, 649.
Stevens, S. S. (2012). Perceptual magnitude and its measurement. Handbook of Perception, 2, 361-389.
Stigler, G. J. (1950). The development of utility theory. I. Journal of Political Economy, 58(4), 307-327.
Tang, T. (1993). The meaning of money: Extension and exploration of the money ethic scale in a sample of university students in Taiwan. Journal of Organizational Behavior, 14(1), 93-99.
Tang, T. L. P., Arocas, R. L., & Whiteside, H. D. (1997). Attitudes toward money and demographic variables as related to income and life satisfaction: USA vs Spain. Proceedings of the International Colloquium of Economic Psychology, 1, 256-266.
Tang, T., Luna-Arocas, R., & Sutarso, T. (2005). From income to pay satisfaction: The love of money and pay equity comparison as mediators and culture (the United States and Spain) and gender as moderators. Management Research: Journal of the Iberoamerican Academy of Management, 3(1), 7-26.
Taylor, S. E. (1991). Asymmetrical effects of positive and negative events: the mobilization-minimization hypothesis. Psychological Bulletin, 110(1), 67.
Tversky, A., & Kahneman, D. (1992). Advances in prospect theory: Cumulative representation of uncertainty. Journal of Risk and Uncertainty, 5(4), 297-323.
Williams, M., Brower, H., Ford, L., Williams, L. and Carraher, S. (2008). A comprehensive model and measure of compensation satisfaction. Journal of Occupational and Organizational Psychology, 81(4), 639-668.
Williams, M. L., McDaniel, M. A., & Ford, L. R. (2007). Understanding multiple dimensions of compensation satisfaction. Journal of Business and Psychology, 21(3), 429-459.
Williams, M. L., McDaniel, M. A., & Nguyen, N. T. (2006). A meta-analysis of the antecedents and consequences of pay level satisfaction. Journal of Applied Psychology, 91, 392-413.
Worley, C. G., Bowen, D. E., & Lawler, E. E. (1992). On the relationship between objective increases in pay and employees' subjective reactions. Journal of Organizational Behavior, 13(6), 559-571.