icar- ifpri experimental methods to measure willingness to pay avinash kishore
Upload: international-food-policy-research-institute-south-asia-office
Post on 22-Jan-2017
349 views
TRANSCRIPT
Experimental Methods
to Measure
Willingness to Pay
Avinash Kishore, IFPRI
23rd Sept 2015
NASC Complex
1Note: This presentation is a slightly modified version of an earlier
lecture prepared by Dr. Ekin Birol, IFPRI
2
Choice Experiment Method (CEM)
• Choice Experiment Method (CEM) is a state of the art method, which has been applied to economic valuation of environment recently, and the method is still in the process of being developed
• CEM is similar to CVM, as it a survey based, hypothetical method, which can be used to estimate economic values for virtually any environmental good and service, and can be used to estimate non-use as well as use values.

3
CEM-Overview
• However, it differs from contingent valuation because it does not directly ask people to state their valuation in monetary terms. Instead, values are inferred from the hypothetical choices or tradeoffs that people make among many alternatives.
• CEM is grounded in Lancaster’s characteristics theory of value (1966), which states that any good can be described in terms of its attributes and the levels these attributes take, and consumers purchase the attributes rather than the good itself

4
CEM- Overview
• In a CE respondent is presented with two or
more alternatives of the environmental good
with different levels of its attributes at
different prices and asked to choose their
most preferred alternative in each set of
alternatives.
• As long as one of the attributes of the good
is price, it is possible to derive the WTP for
changes in the levels of the good's other
attributes.

5
CEM-Overview
• CEM can estimate the TEV of an
environmental good or service and the
value of its attributes as well as the
value of more complex changes in
several attributes
6
CEM-Overview
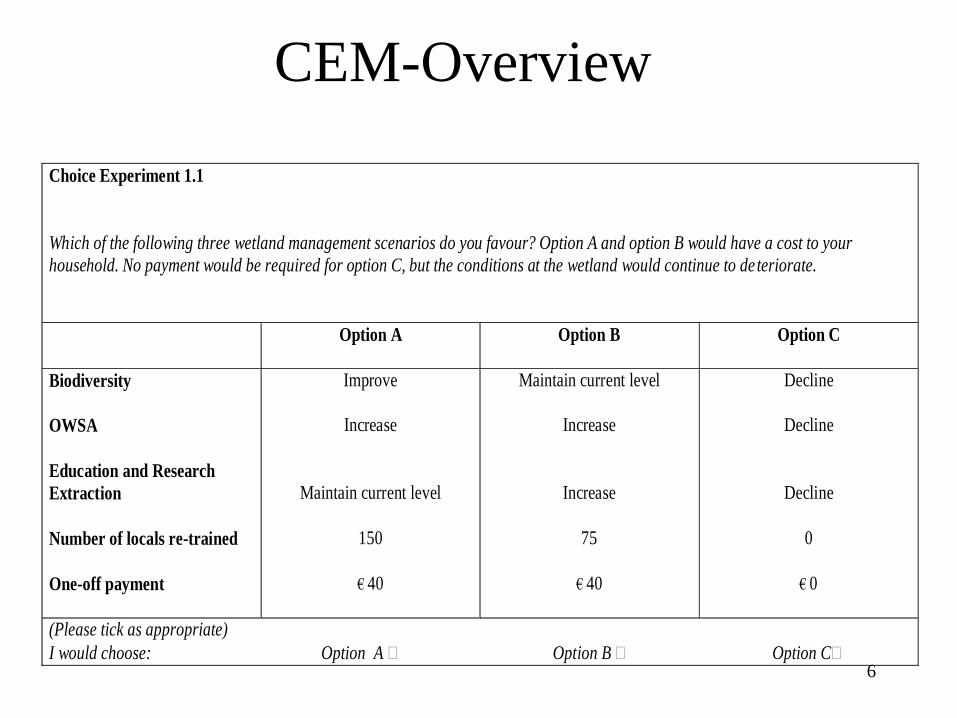
Choice Experiment 1.1
Which of the following three wetland management scenarios do you favour? Option A and option B would have a cost to your
household. No payment would be required for option C, but the conditions at the wetland would continue to de teriorate.
Option A
Option B Option C
Biodiversity
OWSA
Education and Research
Extraction
Number of locals re-trained
One-off payment
Improve
Increase
Maintain current level
150
€ 40
Maintain current level
Increase
Increase
75
€ 40
Decline
Decline
Decline
0
€ 0
(Please tick as appropriate)
I would choose: Option A Option B Option C

7
CEM-Design: Step 1
• Because both CVM and CEM are
hypothetical survey-based methods, their
application is very similar. The main
differences are in the design of the valuation
question(s), and the data analysis.
• The first step is to define the valuation
problem. This would include determining
exactly what services are being valued, and
who the relevant population is.
8
CEM-Design: Step 2
• The second step is to make preliminary decisions about the survey itself, including whether it will be conducted by mail, phone or in person, how large the sample size will be, who will be surveyed, and other related questions.
• The answers will depend, among other things, on the importance of the valuation issue, the complexity of the question(s) being asked, and the size of the budget.

9
CEM-Design: Step 2• In-person interviews are generally the most
effective for complex questions, because it is often easier to explain the required background information to respondents in person, and people are more likely to complete a long survey when they are interviewed in person.
• In some cases, visual aids such as videos or photographs may be presented to help respondents understand the conditions of the scenario(s) that they are being asked to value.

10
CEM-Design: Step 2
• In-person interviews are generally the most expensive type of survey. However, mail surveys that follow procedures that aim to obtain high response rates can also be quite expensive.
• Telephone surveys are generally not appropriate for CEM, because of the difficulty of conveying the trade-off questions to people over the telephone.

11
CEM-Design: Step 3
• The next step is the actual survey design. It is accomplished in several steps.
• The survey design process usually starts with initial interviews and/or focus groups with the relevant population and also with experts and scientists who can help identify the important attributes of the environmental good/service and the levels the levels these can take under different scenarios.

12
CEM-Design: Step 3
• In the initial focus groups, the researchers would ask general questions, including questions about peoples’ understanding of the issues related to the environmental good or service being valued, whether they are familiar with the good or service and what are the important attributes of the environmental good or service to the respondents.
• Researchers would ask questions to the scientists about to what level these attributes can be increased to when management or conservation actions are taken and to what levels they might fall to when deterioration/degradation of the environmental good or service continue or increase.
13
CEM-Design: Step 3
• In later focus groups, the questions would get more detailed and specific, to help develop specific questions for the survey, as well as decide what kind of background information is needed and how to present it.
• For example, people might need information on the location and characteristics of the good, its uniqueness and possible substitutes.

14
CEM-Design: Step 3• At this stage, the researchers would test
different approaches to the choice question.
• A CEM will ask each respondent a series of choice questions, each presenting different combinations of the level of attributes of the environmental good or service at different cost to the respondent.
• These different combinations of the levels of the environmental good are used to describe different alternatives of the good, and these alternatives are put together in pairs or more in choice sets using experimental design theory.
15
CEM-Design: Step 3
• After a number of focus groups have been conducted, and researchers have reached a point where they have an idea of how to provide background information, describe the hypothetical scenario, do the experimental design and ask the choice questions, they will start pre-testing the survey.
• Researchers continue this process until they’ve developed a survey that researchers seem to understand and answer in a way that makes sense and reveals their values for the good.

16
CEM-Design: Step 4
• The next step is the actual survey implementation.
• The first task is to select the survey sample.
• Ideally, the sample should be a randomly selected sample of the relevant population, using standard statistical sampling methods.

17
CEM-Design: Step 5
• The final step is to compile, analyse and
report the results.
• The statistical analysis for CEM is often
more complicated than that for CVM,
requiring the use of discrete choice analysis
methods to infer WTP from the tradeoffs
made by respondents.

18
CEM-Design: Step 5• From the analysis, the researchers can
estimate the average value for each of the attributes of the good or service, for an individual or household in the sample.
• This can be extrapolated to the relevant population in order to calculate the total benefits from the good/service under different policy scenarios.
• The average value for a specific action and its outcomes can also be estimated, or the different policy options can simply be ranked in terms of peoples’ preferences.

19
CEM-Application
• When applying CEM the following points should be taken into consideration:
• Before designing the survey, learn as much as possible about how people think about the good or service in question.
• Consider people’s familiarity with the good or service, as well as the importance of such factors as quality, quantity, accessibility, the availability of substitutes, and the reversibility of the change.

20
CEM-Application• Determine the extent of the affected
populations in question, and choose the survey sample based on the appropriate population.
• The choice scenario must provide an accurate and clear description of the change in environmental good or service associated with the event, program, investment, or policy choice under consideration.
• If possible, convey this information using photographs, videos, or other multi-media techniques, as well as written and verbal descriptions.

21
CEM-Application• The nature of the good and the changes to
be valued must be specified in detail.
• The respondent must believe that if the money was paid, whoever was collecting it could effect the specified environmental change.
• Respondents should be reminded to consider their budget constraints.
• Specify whether comparable services are available from other sources, when the good is going to be provided, and whether the losses or gains are temporary or permanent.

22
CEM-Application
• Respondents should understand the
frequency of payments required, for
example monthly or annually, and whether
or not the payments will be required over a
long period of time in order to maintain the
quantity or quality change.
• Respondents should also understand who
would have access to the good and who else
will pay for it, if it is provided.

23
CEM-Application
• The scenario should clearly indicate
whether the levels being valued are
improvements over the status quo, or
potential declines in the absence of
sufficient payments.
• If the household is the unit of analysis, the
reference income should be the household’s,
rather than the respondent’s, income.
24
CEM-Application
• Thoroughly pre-test the questionnaire for
potential biases.
• Pre-testing includes testing different ways
of asking the same question, testing whether
the question is sensitive to changes in the
description of the good or service being
valued, and conducting post-survey
interviews to determine whether
respondents are stating their values as
expected.

25
CEM-Application
• Interview a large, clearly defined,
representative sample of the affected
population.
• Achieve a high response rate and a mix of
respondents that represents the population.
• The survey results should be analysed using
discrete choice models.

26
CEM-Advantages
• The CEM can be used to estimate TEV of any environmental good or service as a whole, as well as the various attributes and complex changes in the attributes of the good or service.
• The method allows respondents to think in terms of tradeoffs, which may be easier than directly expressing money values.
• The tradeoff process may encourage respondent introspection and make it easier to check for consistency of responses.

27
CEM-Advantages
• In addition, respondents may be able to give more meaningful answers to questions about their behaviour (i.e. they prefer one alternative over another), than to questions that ask them directly about the money value of a good or service or the value of changes in environmental quality.
• Thus, an advantage of CEM over the CVM is that it does not ask the respondent to make a tradeoff directly between environmental quality and money.
28
CEM-Advantages
• Respondents are generally more comfortable providing their choice of attribute bundles that include prices, rather than money valuation of the same bundles without prices, by de-emphasizing price as simply another attribute.
• Survey methods may be better at estimating relative values than absolute values. Thus, even if the absolute monetary values estimated are not precise, the relative values or priorities elicited by a CEM are likely to be valid and useful for policy decisions.
29
CEM-Advantages
• The method minimizes many of the biases
that can arise in open-ended CV where
respondents are presented with the
unfamiliar and often unrealistic task of
putting prices on non-market amenities.
• The method has the potential to reduce
problems such as expressions of strategic
values, protest bids, embedding effects, and
yea-saying bias associated with CVM.
30
CEM-Limitations
• Respondents may find some tradeoffs difficult to evaluate, because they are unfamiliar.
• The respondents’ behaviour underlying the results of a CEM is not well understood. Respondents may resort to simplified decision rules if the choices are too complicated, which can bias the results of the statistical analysis.

31
CEM-Limitations
• If the number of attributes or levels of attributes is increased, the sample size and/or number of comparisons each respondent makes must be increased.
• When presented with a large number of tradeoff questions, respondents may lose interest or become frustrated.
• By only providing a limited number of options, it may force respondents to make choices that they would not voluntarily make.

32
CEM-Example
• Valuation of Drought-Tolerant Varieties of
Rice in Bihar
• DT varieties offer higher yield in drought
conditions
• Yield in normal conditions is also higher
than traditional varieties—but not always.
• So, adoption is not straightforward. For
example, it depends on farmers’ degree of
risk aversion
• Seeds are more expensive than the own use
seeds. So, credit/cash crunch also an issue.

33
CEM-Example
• Droughts—a major constraint to rainfed rice yields in Bihar
– 6 droughts in last 7 years
• ICAR and IRRI developing DT varieties.
•
• Development of DT traits in rice—a potential way to mitigate the impact of drought on rice production, food security and farmer income
• Recent varieties have no yield penalties in normal conditions

Choice Experiment Study
• Discrete choice experiment to examine
– Farmers’ preferences for DT traits embodied in
hybrid and varietal rice
– Explore heterogeneity in preferences
• Large and small farmers
• Women and men farmers
• Irrigated and un-irrigated farmers
• Farmers in high and low productivity regions
34

35
CEM-Example
• Through focus groups with farmers and
agricultural scientists, important attributes
of the DT rice for farmers in Bihar were
identified to be • Crop duration: <120 days; 120-135 days; >135 days
• Crop yield under different levels of drought (normal,
deficit, scant/severe)
• If the grain can be stored and reused as seed the next
season (Yes/No)
• Seed price (Rs. 15, 20 and 220 per kg)
• Seed-rate (4-6 kg/acre; 12-16 kg/acre)

36
CEM-Example
• Experimental design theory is used to assemble these attributes and their levels into choice sets with 3 alternatives
• 4 groups of 9 choice sets each.
• Each set offered 3 alternatives and the status quo option
• Each farmer made 9 choices
• 475 randomly selected farmers from 3 districts in 3 agro-ecological zones of Bihar

37

38
CEM-Results– There is a significant demand for DT characteristics
– Farmers are willing to pay more for seeds that offer higher yields in drought conditions even if these seeds offer no yield advantage in normal rainfall years
– More risk averse farmers are more likely to choose DT seeds over their current seeds
– Many farmers do not like having to buy seed every year
– Greater demand for DT varieties, but lower WTP than DT hybrids
– Both DT varieties and DT hybrids can coexist in the market

Auctions to measure WTP
• Vickrey (Second Price Auction)
– each bidder maximizes their expected utility by
bidding (revealing) their valuation of the item for sale
– Highest bidder is the winner: so, efficient.
– Does not allow price-discovery if buyers are unsure
of their own valuations
• BDM (Becker–DeGroot–Marschak)
– Vickrey acution against an unknown bidder
– Incentive compatible
– Widely used in experimental economics
– Common in Agriculture too 39

Thanks!
40