a simplified method for the estimation of the seismic
TRANSCRIPT

Tenth U.S. National Conference on Earthquake EngineeringFrontiers of Earthquake Engineering July 21-25, 2014 Anchorage, Alaska
A SIMPLIFIED METHOD FOR THE ESTIMATION OF THE SEISMIC
RESISTANCE OF RC FRAMES WITH WEAK INFILL PANELS
Austin Reese1 and Andreas Stavridis2
ABSTRACT
This paper discusses a simplified procedure for the determination of the lateral force-vs.-drift relation of RC frames with weak masonry infill panels. With the proposed method, the force-vs.-drift curve for an infilled RC frame can be estimated based on the frame geometry, design details, and basic material properties. The procedure takes into account the relative strengths and stiffnesses of the infill with respect to the bounding frame, which influence the failure mechanism and strength of an infilled frame. The framework has been validated with data from experimental and analytical studies on single-bay, single-story specimens with a wide range of geometries, design details, and material properties. The comparison of the analytical and experimental results indicates that the proposed methodology can successfully capture the main features of the seismic response, including the initial stiffness, peak strength, and residual load capacity.
1 Graduate Student Researcher, Dept. of Civil Engineering, University of Texas at Arlington, Arlington, TX 76019 2 Assistant Professor, Dept. of Civil, Structural, and Environmental Engineering, University at Buffalo, Buffalo, NY, 14260
Tenth U.S. National Conference on Earthquake EngineeringFrontiers of Earthquake Engineering July 21-25, 2014 Anchorage, Alaska
A Simplified method for the estimation of the seismic resistance of RC frames with weak infill panels
Austin Reese1 and Andreas Stavridis2
ABSTRACT
This paper discusses a simplified procedure for the determination of the lateral force-vs.-drift relation of RC frames with weak masonry infill panels. With the proposed method, the force-vs.-drift curve for an infilled RC frame can be estimated based on the frame geometry, design details, and basic material properties. The procedure takes into account the relative strengths and stiffnesses of the infill with respect to the bounding frame which influence the failure mechanism and strength of an infilled frame. The framework has been validated with data from experimental and analytical studies on single-bay, single-story specimens with a wide range of geometries, design details, and material properties. The comparison of the analytical and experimental results indicates that the proposed methodology can successfully capture the main features of the seismic response, including the initial stiffness, peak strength, and residual load capacity.
Introduction
Reinforced concrete (RC) frames with masonry infill panels are widely used in areas with high seismic activity around the world. The masonry panels are often considered to serve a non-structural role as partition or exterior walls. Field and laboratory evidence however, indicate that the masonry infill panels typically have a considerable impact on the strength and stiffness of the structure. This impact can lead to brittle failure patterns and catastrophic collapses in extreme earthquakes (e.g. EERI 2000). Due to the number of possible failure mechanisms for infilled frames shown in Fig. 1, estimating the influence of the infills on the seismic behavior is challenging even for detailed finite element models.
The complexity in predicting the exact failure mechanism can be attributed to the non-linear behavior of both the masonry and concrete frame which are susceptive to cracking and crushing failures. Furthermore, the interaction between the masonry infill with the surrounding frame makes the actual behavior of each component highly dependent on the properties and behavior of the adjacent element. For example, a configuration of well-designed RC columns and beams infilled with single wythe hollow clay tiles will result in a strong frame with a weak infill. This configuration exhibits a ductile behavior which is dominated by the behavior and
1 Graduate Student Researcher, Dept. of Civil Engineering, University of Texas at Arlington, Arlington, TX 76019 2 Assistant Professor, Dept. of Civil, Structural, and Environmental Engineering, University at Buffalo, Buffalo, NY, 14260

strength of the frame that typically lead to an overall ductile behavior with plastic hinges forming in the columns. An example to the contrary would be a poorly detailed RC frame with inadequate shear reinforcement and a triple wythe, solid clay-brick infill. In this case of a weaker frame combined with a strong infill, the overall strength is governed by the shear strength of the infill and it often leads to shear cracks in the columns and a brittle failure as demonstrated in Fig. 1b. Finally, if the infill and frame have comparable strengths a variety of failure mechanisms are possible including those mentioned above as well as sliding and crushing in the infill.
To address this complex issue, Stavridis (2009) proposed a simplified procedure to obtain the backbone curve for RC frames with strong infill. This method has been extended here to address cases with weak infills.
Available Simplified Methods for Analysis of Infilled Frames
Over the last 50 years a number of methods have been proposed for the analysis of infilled RC frames. These methods typically aim at estimating the ultimate strength and/or the stiffness of an infilled frame. The proposed approaches typically involve either limit analysis methods that calculate the capacity corresponding to a given failure type, or the most commonly used strut method in which the effect of the infill is modeled with diagonal struts.
The equivalent strut method was initially proposed by Stafford-Smith (1969). The equivalent strut would have the same thickness and material properties as the infill itself, but the width of the strut cannot be estimated unambiguously leading to a variety of proposed methods. These methods are typically based on case-specific data and lack general applicability. One of the first methods proposed that is still in use was proposed by Stafford-Smith (1969) who focused on the strut stiffness to estimate the frame displacements. This study suggested the strut width be a function of the infill and frame material properties and dimensions as shown in Eq. 1 which been widely used for the estimation of the stiffness of infilled frames. ℎ = ℎ sin(2 )4 (1)
where ℎ the equivalent strut width, , , if the elastic modulus of the masonry infill, is
the thickness of the infill, ℎ is the height of the infill, is the angle of infill diagonal, is the elastic modulus of the RC frame, and is the moment of inertia of the columns.
Mainstone (1971) proposed a method for the estimation of the capacity of the infilled frame by adding the lateral strength of the bare frame to the lateral strength of the bare infill. Wood (1978) proposed another method for determining the collapse load of an infilled frame in which the overall strength is the sum of the flexural strength of the columns and the compressive
Figure 1. Failure mechanisms observed by Mehrabi et al. (1994)

strength of the infill. Another approach for finding the infill capacity is presented by Mehrabi et al. (1994) and is based on the Mohr-Coulomb failure where the sliding strength of the masonry infill, , is a combination of the cohesive strength provided by the infill mortar, and the frictional resistance which is a function of the applied vertical load. = + (1)
where is the shear strength of the masonry infill, is the elastic modulus of the frame, is the cohesive resistance of the infill, is the vertical load carried by the infill wall, is the
coefficient of friction The list of methods mentioned above is not exhaustive as there is a considerable number
of researchers that have proposed ways to estimate the strength of infilled RC frames. The proposed methods aim at predicting the capacity of an infilled frame based on the expected failure pattern. However, in most cases, the failure pattern is not known a priori. Hence, the methods cannot be used in practice as their limitations and applicability are not clearly stated.
Experimental Studies A number of researchers, including Mehrabi et al. (1994), Leuchars and Scrivener (1976), Kakaletsis and Karayannis (2009) have conducted experiments on frames with a variety of design details and material properties. These tests as well as other tests on infilled frames with solid panels have been included in a database (Reese 2013). Of these experiments, of particular interest is the study conducted by Mehrabi et al. (1994) which included 12 specimens. This study is well-documented and provides insight into the influence of brick strength, vertical load, aspect ratio, and loading pattern on the behavior of an infilled frame. From the tests it is evident that the use of hollow bricks or solid bricks drastically differentiates the structural performance as infills with hollow bricks have ductile behavior while the specimens with solid bricks exhibit a brittle behavior.
A study conducted in the University of Colorado, Boulder investigated the influence of openings on the lateral response of infilled frame structures built in California in the 1920s with triple-wythe wall. The control specimen (CU1) for this study had a solid infill consisting of solid bricks. The specimen exhibited a failure mechanism with dominant shear cracks initiating in the infill and propagating though the RC columns similar to that in Fig. 1b (Stavridis 2009).
Numerical Parametric Study
A parametric study has been conducted to enhance the experimental database (Reese 2013). The study has used the validated finite element modeling scheme proposed by Stavridis and Shing (2010) to further investigate the influence of each parameter on the structural response. The specimens tested by Mehrabi et al. (1994) and specimen CU1 that had solid infill (Stavridis 2009) have been used as references for the geometry, reinforcement detailing, vertical load and material properties in the parametric study.
The finite element model used for the parametric study combines the smeared and the discrete crack approaches to capture the various modes of failure. In more detail, the RC columns are modeled with smeared crack elements as well as interface elements which allow the

development of discrete shear and flexural cracks at 0, 90 and 45o. The cracks are resisted by truss elements representing the longitudinal and transverse reinforcement. The masonry units are discretized with two smeared crack elements connected by an interface element which allows the tensile splitting of the bricks and the relative rotation of each half-brick element. Finally, the mortar joints are also represented with interface elements which are appropriately calibrated to represent the mortar layers as well as the interface between the mortar and the brick. More information on the modeling scheme and its validation can be found in Stavridis and Shing (2010). Figs. 2 and 3 present the experimental and numerical results for Specimens 8 (Mehrabi et al. 1994) and CU1 (Stavridis 2009) and demonstrate the capabilities of the finite element model.
Specimen CU1 (Stavridis 2009) and Specimen 8 (Mehrabi et al. 1994) were used as base
models for the parametric study discussed here. A total of 21 cases were based on the material properties of specimen CU1, all of which had strong infills and are not discussed here in detail. Another 21 models with weaker infill were constructed by combining the weakly reinforced frame of specimen CU1 with an infill of two wythes of hollow clay brick matching the properties of Specimen 8. Fifteen of these models were weak infill cases and behaved in a ductile manner as anticipated. Finally, a third set of 17 frames were considered using as a baseline the frame of CU1 but with increased shear reinforcement as the spacing of ties was reduced to one fourth of the original non-ductile configuration. The adjustment of the shear reinforcement led to a strong frame design and changed the failure mode of these structures, eight of which had a weak manner. The properties of the base models are shown in Table 1, while Table 2 summarizes the parameters considered in the parametric study. Table 1. Parametric Study Base Models
Specimen Infill dimensions
(LxHxW)(in)
Column dimensions
(in)
f'c
(psi)
f'm
(psi)
Stirrup area (in2)
Spacing of stirrups
(in)
Vertical load
(kips)
Infill class
Frame class
Specimen 8 84x56x1.25 7x7 3900 1400 0.097 2.5 66 Weak Weak
CU1 130x73.5x7.2 11x11 4350 3500 0.147 11.5 76 Strong Weak CU1s* 130x73.5x7.2 11x11 4350 3500 0.147 2.75 76 Strong Strong
*These models had the RC frame of CU1 with ties spaced every 2.75in. instead of 11.5 in.
a. analytical and experimental
force-displacement curve b. experimental failure
pattern c. finite element model
failure pattern at 0.8% drift Figure 2. Validation of FE modeling scheme with Specimen 3 from Mehrabi et al. (1994)

a. analytical and experimental force-
displacement curve b. experimental failure
pattern c. finite element model
failure pattern at 1% drift Figure 3. CU1 illustration and model results (Stavridis 2009) Table 2. Parametric study overview
Results from Parametric study and Experiments
The analysis presented here focused on identifying the failure mechanisms and the force distribution patterns between the infill and the RC frame at three critical instances: the apparent yield point, the point of the peak load, and the point signifying the onset of residual load capacity. The study also characterized the behavior as brittle or ductile based on the failure pattern and the force-vs.-displacement relation. The cases that exhibited brittle behavior typically had failure patterns which included major shear cracks in the columns and sliding/diagonal cracking of the infill. The cases with ductile behavior had failure patterns with sliding in the infill with minor shear cracks or flexural failure of the columns. In these models, the infills had a relatively small contribution to the overall strength and are therefore referred to as ‘weak infill’ models. Models whose capacity was dominated by the strength of the infill are referred to as ‘strong infill’ cases and are not discussed further here. Similarly to the infill, the frame could be also categorized as strong or weak based on its load resistance and the failure pattern it exhibited. Definition of ‘Strong’ and ‘Weak’ Infill The analysis of the results indicates that the ratio of masonry strength, Vm, to the frame shear strength, Vn, could consistently identify the infill as strong or weak. The ratio ⁄ , where is given by Eq. 2 and given by Eq. 3, has been found to provide a good measure for this.
-750
-500
-250
0
250
500
750
-1.5 -1 -0.5 0 0.5 1 1.5
Drift Ratio, %
Late
ral F
orce
, kN
-170
-85
0
85
170
Late
ral F
orce
, ki
ps
ExperimentFE model
Positive Direction1. Infill-frame separation2. Shear-sliding crack in infill3. Shear crack in top right (WW) column4. Shear crack in bottom left (LW) column
Negative Direction1. Infill-frame separation2. Shear-sliding crack in infill3. Shear crack in top left (WW) column4. Shear crack in bottom right (LW) column
132
4
1234
Parametric study set
Infill material
properties
RC Frame material
properties
Frame & infill
dimensions
Parameter changed
Ver
tical
load
Asp
ect r
atio
Tra
nsve
rse
stee
l
Tra
nsve
rse
stee
l spa
cing
Lon
gitu
dina
l st
eel
Col
umn
size
1 CU1 CU1 CU1 X X X X X 2 M8 CU1 CU1 X X X X X 3 CU1 CU1s CU1 X X X X
Positive direction

A ratio greater than one indicates that the frame is more likely to fail in flexure than shear while the opposite is true if the ratio is less than one.
where ′ is the compressive strength of concrete, is the column width, is the effective depth of the column, is the stirrup area at each section of the RC columns, is the yield strength of the stirrups, is the number of stirrups resisting a shear crack in the column.
Steps of Simplified Method The proposed simplified method can be used to estimate the lateral force and drift at three characteristic points to develop a backbone curve similar to that defined in ASCE 41-06 (ASCE 2006) for any single-bay, single-story infilled frame. Initial Stiffness The initial stiffness, Ki, can be calculated as a combination of the flexural stiffness of the composite section and the shear stiffness of the infill with Eq. 4. = +
(4)
The flexural stiffness of the composite section, , is determined for a cantilever wall
with Eq. 5 which can be applicable for a composite section by substituting the equivalent moment of inertia of a homogenous section, . The shear stiffness, , is found with Eq. 6. = (5) = (6)
where Ec is the Young’s modulus of concrete, h is the height of the infill, Aw is the area of
the infill along a horizontal cross section, Gw is the shear modulus of the masonry. Apparent Yield Point
The apparent yield point on the curve indicates the point at which the infilled frame begins to act non-linearly. The experimental and analytical results indicate that the force at the yield point, , is typically 60-80% of the peak load, Vmax. Based on this observation, a conservative relation presented in Eq. 7 for the yield strength is proposed. The drift at this point of the force displacement curve is not directly given by an equation, but it can be estimated using the initial stiffness and the yield load.
= 2 ′ + (3)

= (7)
Point at Peak Strength As discussed in the previous section, the drift at the peak load can be expressed as a function of the aspect ratio. To find the drift at the peak load, one can determine if the infill is weak or strong and use Eq. 4. The steps for finding the peak strength are different for weak and strong infills. Eqs. 8 and 9 provide the peak strength for weak infill cases. Eq. 8 includes the shear capacity of the columns as it applies to cases in which shear failure of the columns are expected. Eq. 9 applies to cases where flexural failure is expected hence the inclusion of the plastic strength term. Eq. 13 is used to account for the increase of the normal confining force on the infill due to the shear dilation along the joints of the infill. The dilatation causes the vertical expansion of the infill which is confined by the bounding frame. As a result of the confining stresses, the infill exhibits tension in the columns which impose compressive stresses in the infill.
where μ is the coefficient of friction, C is the cohesive strength of the infill, Aw is the area
along a horizontal section of the wall, f’c is the compressive strength of concrete, b is the column width, d is the column effective depth, h is the infill height, As is the area of longitudinal steel in the column, d’ is the distance between extreme rows of reinforcement in the columns, and Es is the Young’s modulus of the reinforcing bars.
Stavridis (2009) proposed a relation to estimate the drift at peak strength for frames with a strong infill. This relation has been adjusted as a set of similar equations has been developed for structures with weak infills based on the results of the parametric study presented here. As expected, the weak infills have a higher drift at the peak load for a given aspect ratio compared to frames with strong infills as reflected in Eq. 14. It can be also noted that longer infills reach the peak strength at smaller drifts as shown in Eq. 14 which expresses the drift at peak, Δpeak, as a function of the wall length to height ratio, Lw/h.
For Lw/h <1: ∆ = 0.9 For 1< Lw/h<2: ∆ = 1.6 − 0.7 /ℎ (14) For 2<Lw/h: ∆ = 0.15
Infilled frame strength For ⁄ <0.2: = ( 1 + 2) + + (8) For ⁄ >0.2: = ( + ) + + 2 (9) Column shear strength = 2 ′ (10) Column flexural strength = , + ,ℎ (11)
Column plastic moment capacity
= (1.25 )( ) (12)
Vertical load carried by infill
= 0.001 (13)
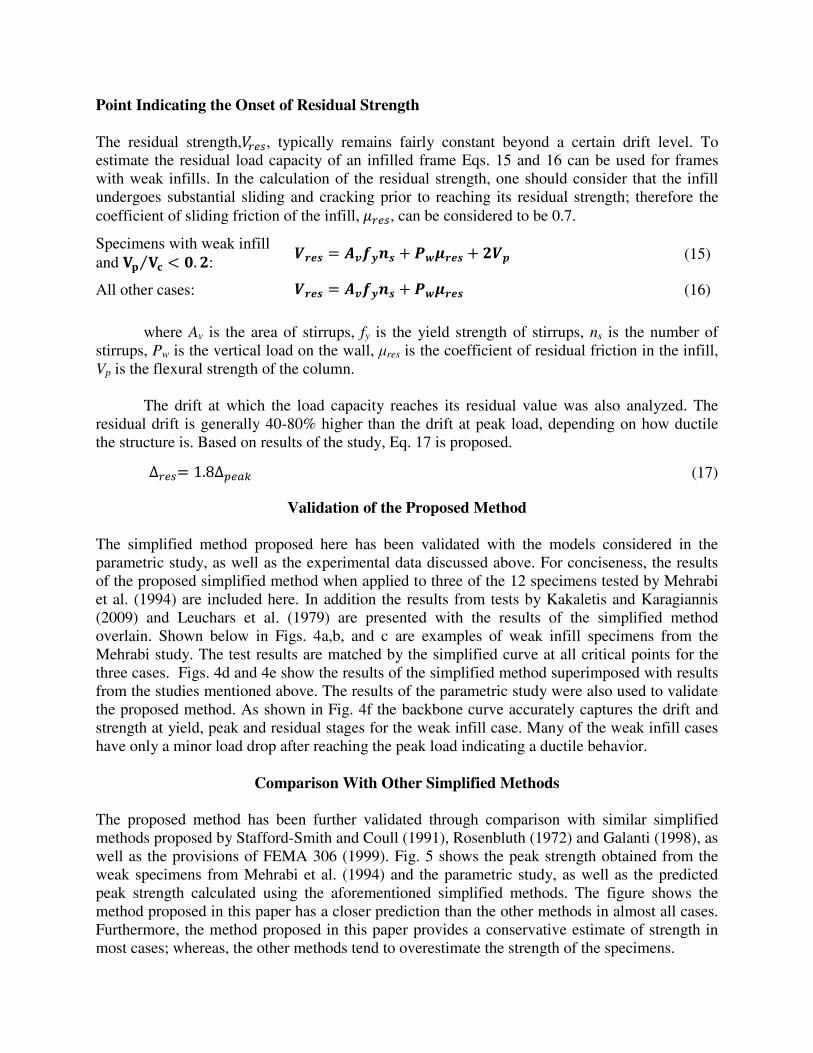
Point Indicating the Onset of Residual Strength The residual strength, , typically remains fairly constant beyond a certain drift level. To estimate the residual load capacity of an infilled frame Eqs. 15 and 16 can be used for frames with weak infills. In the calculation of the residual strength, one should consider that the infill undergoes substantial sliding and cracking prior to reaching its residual strength; therefore the coefficient of sliding friction of the infill, , can be considered to be 0.7.
where Av is the area of stirrups, fy is the yield strength of stirrups, ns is the number of
stirrups, Pw is the vertical load on the wall, μres is the coefficient of residual friction in the infill, Vp is the flexural strength of the column.
The drift at which the load capacity reaches its residual value was also analyzed. The residual drift is generally 40-80% higher than the drift at peak load, depending on how ductile the structure is. Based on results of the study, Eq. 17 is proposed.
Validation of the Proposed Method
The simplified method proposed here has been validated with the models considered in the parametric study, as well as the experimental data discussed above. For conciseness, the results of the proposed simplified method when applied to three of the 12 specimens tested by Mehrabi et al. (1994) are included here. In addition the results from tests by Kakaletis and Karagiannis (2009) and Leuchars et al. (1979) are presented with the results of the simplified method overlain. Shown below in Figs. 4a,b, and c are examples of weak infill specimens from the Mehrabi study. The test results are matched by the simplified curve at all critical points for the three cases. Figs. 4d and 4e show the results of the simplified method superimposed with results from the studies mentioned above. The results of the parametric study were also used to validate the proposed method. As shown in Fig. 4f the backbone curve accurately captures the drift and strength at yield, peak and residual stages for the weak infill case. Many of the weak infill cases have only a minor load drop after reaching the peak load indicating a ductile behavior.
Comparison With Other Simplified Methods The proposed method has been further validated through comparison with similar simplified methods proposed by Stafford-Smith and Coull (1991), Rosenbluth (1972) and Galanti (1998), as well as the provisions of FEMA 306 (1999). Fig. 5 shows the peak strength obtained from the weak specimens from Mehrabi et al. (1994) and the parametric study, as well as the predicted peak strength calculated using the aforementioned simplified methods. The figure shows the method proposed in this paper has a closer prediction than the other methods in almost all cases. Furthermore, the method proposed in this paper provides a conservative estimate of strength in most cases; whereas, the other methods tend to overestimate the strength of the specimens.
Specimens with weak infill and ⁄ < . :
= + + (15)
All other cases: = + (16)
∆ = 1.8∆ (17)

a. Specimen 3 from Mehrabi et al. (1994)
b. Specimen 8 from Mehrabi et al. (1994)
c. Specimen 10 from Mehrabi et al (1994)
Lateral drift (I .)( )
Lateral drift (In.) d. Results from Kakaletsis and Karagiannis specimen b (2009)
e. Results from Leuchars et al. specimen 2 (1976)
f. Results from parametric study specimen Cu1M8
Figure 4. Validation of simplified method with experimental and parametric study results
Figure 5. Comparison of simplified methods
Conclusions
A new analytical tool has been proposed for the estimation of the force-vs-drift relationship for
-50
-30
-10
10
30
50
-2 -1 0 1 2
Late
ral f
orce
, kip
s
Lateral drift, %
0
10
20
30
40
50
0 1 2
Late
ral f
orce
, kip
s
Lateral drift, %-50
-30
-10
10
30
50
-2.5 -1.25 0 1.25 2.5
Late
ral f
orce
, kip
s
Lateral displacement, %
0
20
40
60
80
0 0.4 0.8 1.2La
tera
l Loa
d, k
ips
Lateral drift (%)
Late
ral f
orce
(KN) (K)
Mehrabi et al. (1994)
Cases with specimen CU1 frame, Mehrabi (1994) specimen 8 infill Cases with modified specimen CU1 frame

RC frames with weak masonry panels under in-plane lateral loads. This method has been validated with data from previous experimental studies that have been complemented with the results of a numerical parametric study. The proposed method provides a reliable means to obtain the backbone curve of the response of an infilled frame, including its initial stiffness, ‘yield’ point, peak strength and residual strength, as well as the drifts associated with these points. It has been shown that the method is accurate for weak infills with various frame types. Furthermore, the method is validated for structures subjected to both cyclic and monotonic lateral loads. The advantage of the proposed method is that it can be used to generate the force-displacement behavior of an infilled frame without the need for finite element modeling or the use of any structural analysis software. The calculations can be carried out if the material properties and specimen geometry are known with minimal, if any, computational effort. With this framework an infilled frame can be classified as having a strong or weak infill and from there the anticipated failure pattern, lateral strength and stiffness can be computed.
References
1. EERI (2000). “1999 Kocaeli, Turkey earthquake reconnaissance report.” Earthquake Spectra, Vol. 16, Issue S1. 2. Mehrabi, A.B., Shing, P.B., Schuller, M. and Noland, J. (1994). “Performance of masonry-infilled R/C frames
under in-plane lateral loads.” Rep. CU/SR-94-6, Dept. of Civ., Envir., and Arch. Engrg., Univ. of Colorado, Boulder CO.
3. Stafford-Smith, B. and Carter, C. (1969). “’A Method for the Analysis of Infilled Frames,” Proceedings of the Institution of Civil Engineers, 44, 31-48.
4. Mainstone, R. (1971). “On the Stiffnesses and Strengths of Infilled Frames,” Proceedings of the Institution of Civil Engineers, Supplement IV, 57-90.
5. Wood, R.H. (1978). Plasticity, Composite Action and Collapse Design of Unreinforced Shear Wall Panels in Frames,” Proceedings of the Institution of Civil Engineers, Part 2, 65, 381-411.
6. Leuchars, J. and Scrivener, J. (1976). “Masonry Infill Panels Subjected to Cyclic In-Plane Loading,” Bulletin of the New Zealand National Society for Earthquake Engineering, 9, No. 2, 122-131.
7. Kakaletsis, D. and Karayannis, C. (2009). “Experimental Investigation of Infilled Reinforced Concrete Frames with Openings,” ACI Structural Journal, 106, No. 2, 132-141.
8. Stavridis, A. (2009). “Analytical and Experimental Study of Seismic Performance of Reinforced Concrete Frames Infilled with Masonry Walls,” Ph.D. Dissertation, University of California at San Diego, La Jolla CA.
9. Reese, A. (2013). “Simplified Analysis of Masonry-Inifilled RC Frames Subject to Lateral Loading,” Master’s Thesis, University of Texas at Arlington, Arlington TX.
10. Stavridis, A. and Shing, P.B. (2010). “Finite Element Modeling of Nonlinear Behavior of Masonry-Infilled RC Frames,” Journal of Structural Engineering, 136, No.3, 285-296.
11. American Society of Civil Engineers (ASCE) standard ASCE/SEI 41-06 (2006). “Seismic rehabilitation of existing buildings,” Reston VA.
12. Federal Emergency Management Agency (FEMA). (1999). “Evaluation of Earthquake Damaged Concrete and Masonry Wall Buildings – Basic Procedures Manual,” FEMA-306, Applied Technology Council (ATC-43 Project), Redwood City CA.
13. Stafford-Smith, B. and Coull, A. (1991). “Ch. 8 Infilled-frame structures,” Tall building structures: analysis and design, 168-183.
14. Galanti, F., A. Scarpas, and A. Vrouwenvelder (1998). "Calibration of a capacity design procedure for infilled reinforced concrete frames." Proc., 11th European Conf. on Earthquake Engineering.
15. Rosenbluth, E. (1980). “Design of Earthquake Resistant Structures”, 214-223.