a simple combinatorial method to describe particle retention time in random media with applications...
TRANSCRIPT

Physica A 391 (2012) 1–7
Contents lists available at SciVerse ScienceDirect
Physica A
journal homepage: www.elsevier.com/locate/physa
A simple combinatorial method to describe particle retention time inrandommedia with applications in chromatographyRoberto da Silva a,∗, Luis C. Lamb b, Eder C. Lima c, Jairton Dupont ca Institute of Physics, Federal University of Rio Grande do Sul, Porto Alegre, RS, 91501-970, Brazilb Institute of Informatics, Federal University of Rio Grande do Sul, Porto Alegre, RS, 91501-970, Brazilc Institute of Chemistry, Federal University of Rio Grande do Sul, Porto Alegre, RS, 91501-970, Brazil
a r t i c l e i n f o
Article history:Received 7 August 2011Available online 19 August 2011
Keywords:Combinatorial methods in chromatographyTransport properties of materials inrandom interfaces
Statistical and theoretical methods inchemistry
a b s t r a c t
We propose a foundational model to explain properties of the retention time distributionof particle transport in a random medium. These particles are captured and released bydistributed theoretical plates in a random medium as in standard chromatography. Ourapproach differs from current models, since it is not based on simple randomwalks, but ona directed and coordinated movement of the particles whose retention time dispersion inthe column is due to the imprisonment time of the particle spent in the theoretical plates.Given a pair of fundamental parameters (λc , λe) the capture and release probabilities, weuse simple combinatorial methods to predict the Probability Distribution of the retentiontimes. We have analyzed several distributions typically used in chromatographic peak fits.We show that a log–normal distribution with only two parameters describes with highaccuracy chromatographic distributions typically used in experiments. This distributionshow a better fit than distributions with a larger number of parameters, possibly allowingfor better control of experimental data.
© 2011 Elsevier B.V. All rights reserved.
1. Introduction
Properties of particles’ movement in random media are important in several contexts including chromatographicprocesses [1], electron transport in semiconductor devices [2–4] and several other applications. One of the importantproperties of particle movement in random media is the retention time: the time spent as the particle goes through allobstacles in an environment to complete the desired path. We consider the retention time in an environment characterizedby its number of sojourn theoretical plates (also referred to in the paper as traps), as well as the analysis of the retention timefluctuation as function of the randomness of the medium i.e., how well it is distributed considering the different captureand release rates.
More specifically, when analyzing the experimental results in the literature, we can see a large number of chromato-graphic process applications, including separation/purification of substances such as biologically active globin in mRNA [5],or of nucleic acids (see e.g. Ref. [6]), partition of steroids [7] and several others. However, from a more theoretical point ofview, the problem was modeled by Giddings and Eyring [8] who developed a stochastic model to explain the separationphenomenon in a molecular level. In summary, they consider the linear range of the adsorption isotherm, and studied therandom migration of a single molecule in a column, and then sorption rates were experimentally determined. Giddings [9]
∗ Corresponding author. Tel.: +55 51 3308 9464; fax: +55 51 3308 7308.E-mail addresses: [email protected], [email protected] (R. da Silva), [email protected] (L.C. Lamb), [email protected] (E.C. Lima),
[email protected] (J. Dupont).
0378-4371/$ – see front matter© 2011 Elsevier B.V. All rights reserved.doi:10.1016/j.physa.2011.08.006

2 R. da Silva et al. / Physica A 391 (2012) 1–7
Fig. 1. An example of directed one dimension path in a scenario with 6 traps. After captures, releases and sojourn times 16 time units were spent tocomplete this path.
developed prototypical strategies to select the most appropriate separation tools and techniques for specific applications inchemistry, physics, biology, and forensic and environmental science.
Other authors (see, e.g. Ref. [10,11]) studied this phenomenon by the characteristic function of the retention timedistribution of amolecule in the column. They analyze the description of the chromatogram, i.e., the probability distributionof the retention times, with specific interest in the chromatographic peak for homogeneous and heterogeneous surfaces,provided that distribution of the sorption energies are known.
However, an essentially combinatorial model to study and analyze the retention time of a particle in a column wouldmake it possible, for example, to study the continuous limits since arbitrary capture and release probabilities can beconsidered. It would also bemore appropriate not only for chromatography theory, but also for a class of similar processes inrandommedia: for example, the stochastic nature of successive capture and release of electrons by traps in semiconductordevices, generating the well-known random telegraph signals [3].
Our aim is to develop a combinatorial method capable of modeling a generalized and directed movement of particlesconsidering arbitrary capture and release probabilities of a trap unlike the traditional approach used in chromatography.Our idea differs from classical models in Chemistry, since we are interested in other theoretical details inspired by studiesof fluctuations of retention time not described by existing models.
We believe that our approach can shed new light to the ‘‘classical approach’’ developed extensively since the foundationalworks of Giddings. Our work can be seen as a complementary analysis to existing approaches, since we propose closeddiscrete formulas for the retention time distribution, as well as its moments, analyzing the convergence and computationto the continuum limit of chromatograms. In addition, a simple, fast and robust MCMC algorithm was developed andimplemented to support the non-analytical parts of our work or, further, when the exact numerical computation presentedsome kind of instability. (The code of this simple algorithm is omitted for the sake of simplicity, but can be obtained fromthe authors.)
2. Results
First, let us illustrate a typical directed path of a particle in our approach. We can look at Fig. 1 that shows a typicalenvironment with 6 theoretical plates. Initially, the single particle is captured by the first trap and after two time unitsarrested in the trap (represented by two loops in the figure), it escapes. The particle is not captured by the second trap, butit is then captured by the third trap. However, at this time it stays arrested only one time unit (one loop in the figure). Inthe fourth trap, the particle is captured but it escapes immediately in the next time unit. Finally, it is not captured by thefifth trap, but it is then captured by the sixth trap; remaining captured over three time steps, then escaping and finishing itspath. The computation of time units (steps) is as follows: first trap – one capture, two sojourn time units (two unsuccessfulattempts to escape) and one escape, resulting in four units; second trap – one time unit, since the particle passes throughwithout being captured, third trap – three units, fourth trap – two units, fifth trap – one unit and finally in the sixth trap – fiveunits, which resulting in 16 time units.
By denoting λc and λe, the capture and escape probabilities, respectively, and we can initially imagine that they arethe same for all traps; we can ask what is the probability that one particle takes t = m time units to complete a pathcontaining L traps. If one success means to pass through a trap without being captured, this can occur in two ways: direct —the particle is not captured, or indirect — the particle is captured, remains captured a limited number of time steps in thetrap and escaped from it. By considering that L− k successes are direct and k are indirect, where k = 0, . . . , L, we have thattu = L − k + 2k = L + k denotes the number of useful time units really used to perform the path, while ts = m − L − kcorresponds to the time spent by sojourns during the movement of the particle. If ts ≥ 0, then k ≤ m − L. However, k ≤ Lsince we have at most L direct successes (the particle goes through all traps without being captured).
So, if m < L, we have Pr(t = m) = 0. If m = L, we have exactly L direct successes and this occurs with probabilityPr(t = L) = (1 − λc)
L. Finally, for m > L many possibilities can occur: among L success k can be chosen as indirect, whichis done in
Lk
ways. For each one of these ways, we have to distribute ts = m − L − k time units (identical balls), in k

R. da Silva et al. / Physica A 391 (2012) 1–7 3
P(t)
P(t)
t
t
a
b
Fig. 2. Distribution of retention time. Plot (a) shows the shape of distribution for λc = 0.001, while Plot (b) corresponds to λc = 0.1. For both cases, λechanges from 0.001 to 0.5.
distinct boxes, and this happens in
m−L−1k−1
different distinct ways. From these considerations form > L, we have that the
retention time distribution is
Pr(t = m) =
min{L,m−L}−k=1
Lk
m − L − 1
k − 1
· λk
cλke(1 − λc)
L−k(1 − λe)m−L−k. (1)
So, depending on the values of λc and λe we can observe a discontinuity in t = L. First, we studied the shape of thedistribution fixing two suggestive values of λc (0.001 and 0.1), and in both cases λe changes from 0.001 up to 0.1. Forλc = 0.001 (plot (a) in Fig. 2), we can observe a unique behavior: most of the retention times correspond to ‘‘holdup time’’,i.e., the particle passes by all traps without being captured; however, in some situations few captures should bring a delayin retention time. Here, a log–log plot is taken to stylize and characterize the differences. Notice that the same behavior(a peak of discontinuity) is observed for all values of λe.
For λc = 0.1 the holdup time disappears when large values of λe are considered and the retention time distributionassumes more and more a ‘‘bell shape’’ (see small figures inset in Fig. 2 without log scale). Notice that fluctuations in plot(b) are due to the numerical approach used1 to avoid numerical instabilities of direct numerical computation of (1). So after
1 It must be observed that due to numerical instability for computing Eq. (2) or (1) a simple MCMC algorithm is used, where each possible situation ofthe particle in the medium is considered (e.g. to overcome the trap, or to be captured or to remain captured over one time step). After going through alltraps, the total number of time steps is computed. The number of runs supplies a sample used to build both the ‘‘chromatogram’’ and statistical estimatesof the moments for the general case (ref. Eq. (2)).

4 R. da Silva et al. / Physica A 391 (2012) 1–7
a
b
Fig. 3. Plot (a) the average time for different values of L. This plot shows a simple relation described by relation (3). Plot (b) we show a plot for variance. Alinear behavior (red line) is observed when λe + λc = 1, since in this situation the problem is described as a negative binomial. (For interpretation of thereferences to colour in this figure legend, the reader is referred to the web version of this article.)
illustrating some peculiar points of retention time distribution, we study the characteristic nontrivial fluctuations of thisprocess. Formally, we write the moments of distribution as
t l= (1 − λc)
LLl +∞−
m=L+1
mlmin{L,m−L}−
k=1
L!k!(L − k)!
·(m − L − 1)!
(k − 1)!(m − L − k)!λkcλ
ke(1 − λc)
L−k(1 − λe)m−L−k. (2)
We do not have a closed form for these moments (not even for the average case). However, we can numerically check asimple but nontrivial relation to average time:
⟨t⟩L
= 1 +λc
λe. (3)
Fig. 3 (plot a) shows this linear behavior. The plot was elaborated by computing ⟨t⟩ changing λc and λe from 0.005 to 1, with∆λe = ∆λc = 0.005. Different size lattices were experimented and all curves collapse to the same straight line.
By studying a particular case λc + λe = 1 and by using the Vandermonde identity∑min{L,m−L}
k=1
Lk
m−L−1k−1
=
m−1L−1
,
we have that the distribution is reduced to a negative binomial distribution
Pr(t = m, λe + λc = 1) =
m − 1L − 1
λLeλ
m−Lc .

R. da Silva et al. / Physica A 391 (2012) 1–7 5
t
Fig. 4. Top plot: the retention time distribution for λc = 0.2 and λe = 0.5. Bottom plot: the same plot for λc = λe = 0.5. Normal and log–normal fits areshown in log scales. The inset plots correspond to the same fits in linear scale.
In this case we have ⟨t⟩ =∑
∞
m=L m Pr(t = m) = L/λe, and var(t) =t2
− ⟨t⟩2 = Lλc/λ
2e . So, in this case λ2
evar(t)has a linear dependence in λc . Plot (b) in Fig. 3 shows the results of an experiment which computes the variance for eachpair (λc, λe). We can check that there is no univocous dependence in β = λc/λe as the average behavior. However, whenλc +λe = 1, we can check the expected robust linear behavior (red straight line — both black straight lines (continuous anddashed)) are used for the sake of clarity.
Let us now analyze the cases where the retention time distribution has no accentuated peak corresponding to a ballisticsituation (holdup time). A natural motivation, looking at chromatographic models, (see e.g. Ref. [11]) is to consider thatthe average sojourn times (τ ), in a regular column chromatography process of molecules, follow a log normal distribution
f (τ ) =
RT/
2πτ 2σ 2
E
exp
−
(ln τ−ln τ∗)2
2(σE/RT )2
. Here it is supposed that themean sojourn time has an exponential dependence
on energy τ = τ0eE/RT where τ0 is a constant and E follows a normal N(E∗, σE), such that τ∗ = τ0eE∗/RT . Here R =8.314510 J mol−1 K−1 is the universal gas constant, while T is the temperature. Now we can ask for the fitting of thedistribution of the retention times in our model. Clearly, this value is related to the mean sojourn time in the traps, butmore precisely, its definition considers a superposition of these sojourn times. On the other hand, our model is totallycombinatorial and does not consider energy dependences; therefore, some empirical fits can be more interesting in thiscontext.
So, a straightforward question arises: is our retention time log–normal or is there another peak distribution, from thechromatography literature, more suitable to fit our distribution (since all traps have the same probability of capture andrelease)? Thus, we analyze two cases here: (i) λc = 0.2 and λe = 0.5, and (ii) λc = λe = 0.5.
6 R. da Silva et al. / Physica A 391 (2012) 1–7
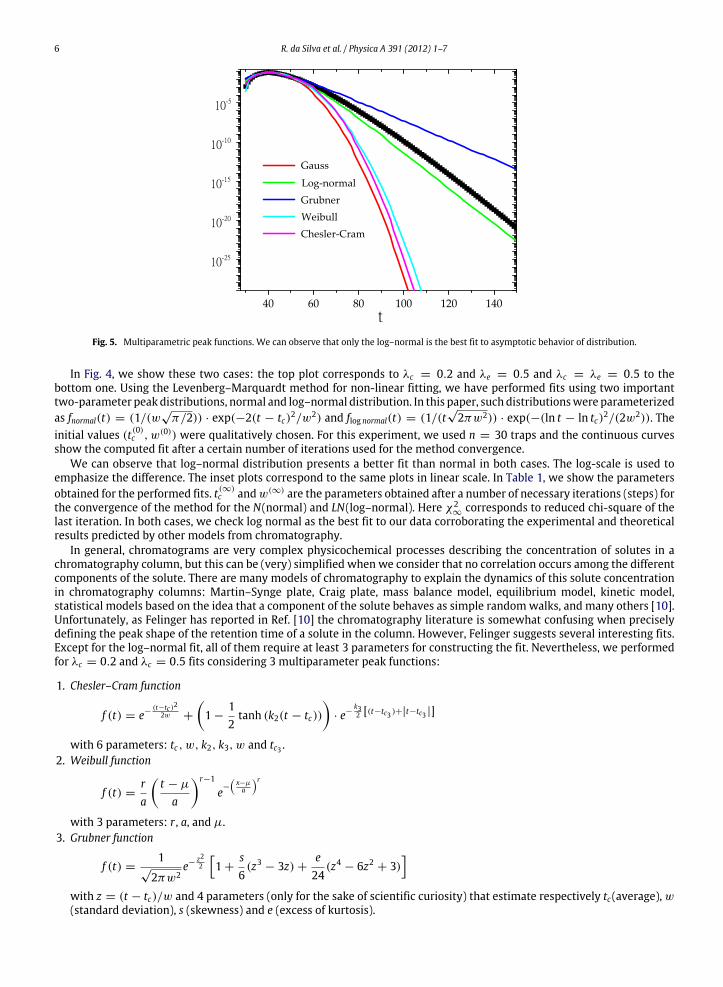
Fig. 5. Multiparametric peak functions. We can observe that only the log–normal is the best fit to asymptotic behavior of distribution.
In Fig. 4, we show these two cases: the top plot corresponds to λc = 0.2 and λe = 0.5 and λc = λe = 0.5 to thebottom one. Using the Levenberg–Marquardt method for non-linear fitting, we have performed fits using two importanttwo-parameter peak distributions, normal and log–normal distribution. In this paper, such distributionswere parameterizedas fnormal(t) = (1/(w
√π/2)) · exp(−2(t − tc)2/w2) and flog normal(t) = (1/(t
√2πw2)) · exp(−(ln t − ln tc)2/(2w2)). The
initial values (t(0)c , w(0)) were qualitatively chosen. For this experiment, we used n = 30 traps and the continuous curvesshow the computed fit after a certain number of iterations used for the method convergence.
We can observe that log–normal distribution presents a better fit than normal in both cases. The log-scale is used toemphasize the difference. The inset plots correspond to the same plots in linear scale. In Table 1, we show the parametersobtained for the performed fits. t(∞)
c andw(∞) are the parameters obtained after a number of necessary iterations (steps) forthe convergence of the method for the N(normal) and LN(log–normal). Here χ2
∞corresponds to reduced chi-square of the
last iteration. In both cases, we check log normal as the best fit to our data corroborating the experimental and theoreticalresults predicted by other models from chromatography.
In general, chromatograms are very complex physicochemical processes describing the concentration of solutes in achromatography column, but this can be (very) simplified when we consider that no correlation occurs among the differentcomponents of the solute. There are many models of chromatography to explain the dynamics of this solute concentrationin chromatography columns: Martin–Synge plate, Craig plate, mass balance model, equilibrium model, kinetic model,statistical models based on the idea that a component of the solute behaves as simple randomwalks, and many others [10].Unfortunately, as Felinger has reported in Ref. [10] the chromatography literature is somewhat confusing when preciselydefining the peak shape of the retention time of a solute in the column. However, Felinger suggests several interesting fits.Except for the log–normal fit, all of them require at least 3 parameters for constructing the fit. Nevertheless, we performedfor λc = 0.2 and λc = 0.5 fits considering 3 multiparameter peak functions:
1. Chesler–Cram function
f (t) = e−(t−tc )2
2w +
1 −
12tanh (k2(t − tc))
· e−
k32 [(t−tc3 )+|t−tc3 |]
with 6 parameters: tc, w, k2, k3, w and tc3 .2. Weibull function
f (t) =ra
t − µ
a
r−1
e−
x−µa
r
with 3 parameters: r , a, and µ.3. Grubner function
f (t) =1
√2πw2
e−z22
1 +
s6(z3 − 3z) +
e24
(z4 − 6z2 + 3)
with z = (t − tc)/w and 4 parameters (only for the sake of scientific curiosity) that estimate respectively tc(average), w(standard deviation), s (skewness) and e (excess of kurtosis).

R. da Silva et al. / Physica A 391 (2012) 1–7 7
Table 1Values obtained for normal and log–normal fits.
Curve (λc , λe) (t(0)c , w(0)) (t(∞)c , w(∞)) Steps χ2
∞
N (0.2, 0.5) (40, 8.21) (41, 10.76) 8 3.10 ·10−6
LN (0.2, 0.5) (40, 0.31) (41.22, 0.13) 47 7.32 ·10−7
N (0.5, 0.5) (58, 1.55) (59.25, 15.25) 12 7.06 ·10−7
LN (0.5, 0.5) (58, 0.30) (59.49, 0.13) 59 4.77 ·10−9
Our results, using the Levenberg–Marquardt method [12], lead to χ2∞
= O(10−7) for the Weibull and Grubner function,and O(10−6) for the Chesler–Cram function. Although χ2
∞is very similar to the log–normal, a semi-log plot can indeed show
the difference when t → ∞. The plot shows that the asymptotic behavior is reproduced just for log–normal distribution ascan be observed in Fig. 5.
3. Discussion
In summary, we proposed a simple combinatorial method that is able to describe the retention time distribution ofparticles in one-dimensional random media when n traps of the same type are considered. Particularly, our method showsinteresting limits when we consider some restrictions for the capture and release probabilities. A simple scaling relationfor the average retention time is obtained showing that this time depends on the ratio of capture and release probabilities.Finally, we have shown that the retention time distribution is a binomial negative distribution when λc + λe = 1; further,there are peaks of discontinuity in the minimal time (holdup time) for some values of capture and release probabilities.However, for larger values of λc a bell shaped arises. In this situation, for large values of λe such peaks vanish and alog–normal fit is obtained, thus corroborating some expected results from the literature. These results illustrate that asimple combinatorial model provides an interesting foundational contribution to chromatography, with a possible rangeof applications.
Acknowledgment
This research is partly supported by the Brazilian Research Council CNPq.
References
[1] J.C. Giddings, Chromatography: introduction, Chem. Rev. 89–2 (1989) 277.[2] M.J. Kirton, M.J. Uren, Noise in solid-state microstructures: a new perspective on individual defects, interface states and low-frequency (1/f ) noise,
Adv. Phys. 38–4 (1989) 367–468.[3] R. da Silva, L.C. Lamb, G.I. Wirth, Collective poisson process with periodic rates: applications in physics frommicro-to nanodevices, Phil. Trans. R. Soc.
A 369–1935 (2011) 307–321.[4] R. da Silva, L. Brusamarello, G. Wirth, Statistical fluctuations for the noise current from random telegraph signals in semiconductor devices: Monte
Carlo computer simulations and best fits, Physica A 389 (2010) 2687–2699.[5] H. Aviv, P. Leider, Purification of biologically active globin messenger RNA by chromatography on oligothymidylic acid-cellulose, Proc. Natl. Acad. Sci.
USA 69–6 (1972) 1408–1412.[6] L.W. McLaughlin, Mixed-mode chromatography of nucleic acids, Chem. Rev. 89–2 (1989) 309–319.[7] E. Heftmann, Partition chromatography of steroids, Chem. Rev. 55–4 (1955) 679–711.[8] J.C. Giddings, H. Eyring, A molecular dynamic theory of chromatography, J. Phys. Chem. 59 (1955) 416–421.[9] J.C. Giddings, Dynamics of Chromatography: Principles and Theory, second ed., M. Dekker, New York, 1965.
[10] A. Felinger, Data analysis and signal processing in chromatography, in: B.G.M. Vandeginste, S.C. Rutan (Eds.), Data Handling in Science and Technology,Elsevier, Amsterdam, 1998.
[11] A. Felinger, A. Cavazzini, M. Remelli, F. Dondi, Stochastic–dispersive theory of chromatography, Anal. Chem. 71 (1999) 4472–4479.[12] W. Press, S.A. Teukolsky,W.T. Vetterling, B.P. Flannery, Numerical recipes, in: The Art of Scientific Computing, Cambridge Univ Press, Cambridge, 2009.