a robust, modular approach to produce graphene–mox
TRANSCRIPT

Nanoscale
PAPER
Cite this: Nanoscale, 2019, 11, 5265
Received 14th November 2018,Accepted 9th January 2019
DOI: 10.1039/c8nr09195a
rsc.li/nanoscale
A robust, modular approach to producegraphene–MOx multilayer foams as electrodesfor Li-ion batteries†
Zhen Yuan Xia, a,b Meganne Christian, c Catia Arbizzani, d
Vittorio Morandi, c Massimo Gazzano, a Vanesa Quintano, a
Alessandro Kovtun a and Vincenzo Palermo *a,b
Major breakthroughs in batteries would require the development of new composite electrode materials,
with a precisely controlled nanoscale architecture. However, composites used for energy storage are typi-
cally a disordered bulk mixture of different materials, or simple coatings of one material onto another. We
demonstrate here a new technique to create complex hierarchical electrodes made of multilayers of verti-
cally aligned nanowalls of hematite (Fe2O3) alternated with horizontal spacers of reduced graphene oxide
(RGO), all deposited on a 3D, conductive graphene foam. The RGO nanosheets act as porous spacers,
current collectors and protection against delamination of the hematite. The multilayer composite, formed
by up to 7 different layers, can be used with no further processing as an anode in Li-ion batteries, with a
specific capacity of up to 1175 μA h cm−2 and a capacity retention of 84% after 1000 cycles. Our coating
strategy gives improved cyclability and rate capacity compared to conventional bulk materials. Our pro-
duction method is ideally suited to assemble an arbitrary number of organic–inorganic materials in an
arbitrary number of layers.
Introduction
Graphene, a two-dimensional (2D) nanomaterial, is composedof a monoatomic layer of carbon atoms. This 2D material pos-sesses fascinating characteristics such as high surface area,excellent electrical conductivity and extraordinary flexibility.Graphene nanosheets can be shaped in three-dimensional(3D) structures, such as porous foams, either by processingfrom solution or direct growth on metal templates, using achemical vapour deposition (CVD) approach.1–5 A 3D graphenefoam (GF) inherits most of the attractive physical properties of2D graphene; the self-supported porous network of GF alsoavoids aggregation or restacking issue of individual graphenesheets.6,7 More importantly, the strong and conductive GFmatrix could incorporate different electroactive materials toboost the electrochemical performance of thesenanocomposites.8–12 The unique macro/mesoporous mor-
phology of GF provides large electrode/active material contactarea and effective multidimensional electrolyte-accessiblechannels. Thus, the production of 3D graphene-based nano-composites represents a promising approach to achieve light-weight, durable and efficient electrode materials in energystorage.13–17
For example, hematite (α-Fe2O3) is a promising anodematerial for lithium ion batteries due to low cost, naturalabundance, and high theoretical energy capacity values (ca.1006 mA h g−1). However, the poor electronic conductivity,large volume changes (ca. 74.7%), and serious aggregation ofFe2O3 particles during lithiation/delithiation cycles limit itspractical application.18 To solve this issue, reduced grapheneoxide (RGO) can be combined with α-Fe2O3.
19–25 The self-assembled RGO/α-Fe2O3 3D hybrids efficiently prevent nano-particle aggregation, alleviate the stress of volume expansionand maintain the mechanical integrity of the electrode.Although RGO-based 3D foam structure can improve thecycling behaviour of the Fe2O3 anode, the complicated oxi-dative-exfoliation/post-reduction steps of RGO and the sub-sequent long-term hydrothermal synthesis process of Fe2O3–
RGO composites are still a challenge for real industrialapplications.
GF can also be directly grown on metallic templates usingCVD growth. This gives foams with superior electrical conduc-tivity and better mechanical stability with respect to RGO.
†Electronic supplementary information (ESI) available. See DOI: 10.1039/c8nr09195a
aIndustrial and Materials Science, Chalmers University of Technology, 41258
Göteborg, Sweden. E-mail: [email protected] per la Sintesi Organica e la Fotoreattività, CNR, 40129 Bologna, ItalycIstituto per la Microelettronica e Microsistemi, CNR, 40129 Bologna, ItalydDipartimento di Chimica “Giacomo Ciamician”, University of Bologna, 40126
Bologna, Italy
This journal is © The Royal Society of Chemistry 2019 Nanoscale, 2019, 11, 5265–5273 | 5265
Ope
n A
cces
s A
rtic
le. P
ublis
hed
on 0
7 M
arch
201
9. D
ownl
oade
d on
10/
6/20
21 1
2:47
:20
AM
. T
his
artic
le is
lice
nsed
und
er a
Cre
ativ
e C
omm
ons
Attr
ibut
ion
3.0
Unp
orte
d L
icen
ce.
View Article OnlineView Journal | View Issue

However, the hydrophobic and chemically inert CVD graphenesurface renders the deposition of uniform metal oxide filmson it extremely difficult. To overcome the surface adhesionissue special techniques, such as oxygen plasma, or supercriti-cal carbon dioxide (scCO2) pre-treatment, are required. Forexample, mesoporous magnetite nanoparticles (Fe3O4) weresuccessfully grafted onto an O2 plasma pre-treated CVD-GFmatrix by a sacrificial ZnO layer using atomic layer deposition(ALD) or by the supercritical CO2 (scCO2) assisted method.10,26
The good adhesion of iron oxide on CVD-GF guarantees thelong cycle behaviour with high performance in lithium ion bat-teries. However, the unavoidable oxidative damage of GFduring the O2 plasma treatment, the use of an expensive metalorganic precursor (diethyl zinc) with vacuum processing inALD techniques, and the complex high-pressure system inscCO2 techniques inevitably decrease the GF quality andincrease its cost.
With the aim of obtaining better performance and simplify-ing the production process, we developed here an electrodepo-sition method to functionalize GF with multiple layers ofmesoporous α-Fe2O3 arranged in nanowall structures(Fig. 1).27–30 Electrodeposition is a low-cost and solution-pro-cessable technique that can be easily upscaled from the beakerlevel in lab to the industrial prototype size level. By tuning theanodic deposition time and electrolytes, homogeneous andwell-adherent iron oxide thin films could be obtained onvarious conductive substrates.31
To further enhance the adhesion of the active Fe2O3
material and increase the loading amount and stability of thecoating, we tried to deposit an additional protective layer bysolution casting of electrochemically exfoliated graphene oxide(EGO) solution. EGOs are moderately oxidized graphene sheetswith less defects and much better electronic conductivity thanconventional GO.32,33 The peculiar electronic properties ofEGO make it a promising material for energy storage appli-cation.25,34 Our synthetic strategy aims at using EGOnanosheets as multifunctional additives in the composite,acting as an electrical conductor, a binder, a spacer and aprimer to achieve uniform, multilayer deposition of metaloxides. The modular coating process can be repeated an arbi-trary number of times; after alternative coating of FeOOHand EGO layers and subsequent annealing, multilayer
(RGO–Fe2O3)x–GF (x = 1–3) composites with hierarchicallyinterconnected meso- and macro-porosity were successfullyfabricated, and tested as long life and high capacity anodes inlithium-ion batteries.
Experimental sectionMaterials
Graphite flakes (+100 mesh series) were purchased fromAldrich. Sodium perchlorate (Sigma-Aldrich, 98%) and sulphu-ric acid (Sigma-Aldrich, 95–97%) were used as electrolytes;acetonitrile (Sigma-Aldrich, 99%), N,N-dimethylformamide(Sigma, 99%) and deionized (DI) water were used as solvents.A platinum foil (99.99%) with the size of 5 mm × 10 mm ×0.1 mm was used as an anode connector. A platinum wire(99.99%, 0.3 mm) was used as a counter electrode. Nickelfoams (380 g m−2 in areal density and 1.5 mm in thickness,compressed to 0.2 mm) were used as 3D templates for gra-phene coating. FeCl3 (Sigma-Aldrich, 45%) and HCl (Sigma-Aldrich, 37%) were utilized as etching acids for Ni foam.CH3COONa (Sigma-Aldrich, 99%) and Fe(NH4)2(SO4)2·6H2O(Sigma-Aldrich, 99%) were used for the electrochemical depo-sition of FeOOH on GF foam.
Synthesis of graphene-based compounds
Preparation of 3D graphene foam. Nickel foams were usedas the 3D templates for CVD graphene growth. A piece of Nifoam with the size of 60 mm × 30 mm was washed thoroughlyby ultra-sonication in dilute HCl (3%), DI water and acetonerespectively, to remove the contaminants. It was placed in astandard quartz tube furnace and heated up to 1000 °C underH2 (50 s.c.c.m.) gas flow, and then annealed for 30 minutes toclean the surface and remove the thin nickel oxide layer. Then,CH4 was introduced into the tube with low concentration (50 s.c.c.m) while the H2 flow was increased to 500 s.c.c.m. for10 minutes’ growth time. The sample was quickly cooled toroom temperature with a cooling rate of approximately 100 °Cmin−1 under an argon atmosphere. The prepared sample wasimmersed in a FeCl3 (4.5% in DI water) solution at 80 °C over-night, and then etched in 10% HCl for 4 hours at 80 °C, tocompletely remove the nickel metal and salt residues.
Preparation of EGO solution. Electrochemical exfoliation ofgraphite is an efficient method to produce graphene or GO;however, it should be performed on monolithic pieces ofgraphite to ensure electrical percolation. Conversely, we couldexfoliate electrochemically graphite powders also using aspecial setup. For this aim, graphite powder (1 g) was put intoa nylon filter bag (200 mesh porosity) and compressed bypressing a plastic cap on the top of the tube. The plastic gridwith filter mesh had a mechanical containment role, keepingthe graphite flakes compressed inside the tube to ensure thatthey were all electrically connected to the metal electrode, andthus subjected to exfoliation.
A platinum foil was then connected to the graphite on thetop of the tube through a slot in the plastic cap, to act as the
Fig. 1 Schematic illustration of the preparation process for multilayerRGO–Fe2O3 graphitic foam architectures.
Paper Nanoscale
5266 | Nanoscale, 2019, 11, 5265–5273 This journal is © The Royal Society of Chemistry 2019
Ope
n A
cces
s A
rtic
le. P
ublis
hed
on 0
7 M
arch
201
9. D
ownl
oade
d on
10/
6/20
21 1
2:47
:20
AM
. T
his
artic
le is
lice
nsed
und
er a
Cre
ativ
e C
omm
ons
Attr
ibut
ion
3.0
Unp
orte
d L
icen
ce.
View Article Online
working electrode. Another platinum wire was used as acounter-electrode. The ionic solution was prepared by dissol-ving 1.3 g of sodium perchlorate in 10 mL of acetonitrile(1 mol L−1). Then, exfoliation was performed following anapproach already described in previous work.34 In brief,uncharged acetonitrile molecules were intercalated in thegraphite by the electrochemical treatment, due to the synergis-tic action of perchlorate ions dissolved in the acetonitrile.Then, the acetonitrile molecules were decomposed with micro-waves, causing gas production and rapid graphite exfoliation.This method uses the gas produced by the decomposition ofacetonitrile molecules as a powerful blowing agent to promotegraphite exfoliation in a few seconds.
The first electrochemical intercalation/exfoliation stage wascarried out for 30 min by applying a DC bias on the graphiteelectrode at a voltage of +5 V. After the reaction, the partiallyexfoliated graphite samples were washed with acetonitrileseveral times and blow-dried with dry nitrogen for 2 min.
A commercial microwave oven (Whirlpool JT379) with arotating tray was used for further expansion. The graphitesamples were placed in a porcelain crucible (capacity 50 mL)and heated in the microwave oven for 30 s under 90 W. Then,the expanded foam-like graphite was compressed again tomake the whole material coherent. The material was fixed asecond time in a porous plastic tube, connected to a Pt foiland further exfoliated in 0.1 M H2SO4 solution as an anode at+10 V for 2 hours. Then, the graphene sheets were collected byvacuum filtration onto a PTFE membrane and cleaned severaltimes by repeated washing with DI water. Afterwards, the exfo-liated flakes were re-dispersed in DMF by sonication for30 min (37 kHz, 100 W effective ultrasonic power, ModelELMA P70H Ultrasonic). The graphene oxide solution was cen-trifuged at 2000 rpm for 30 min to remove any re-aggregatedparticles.
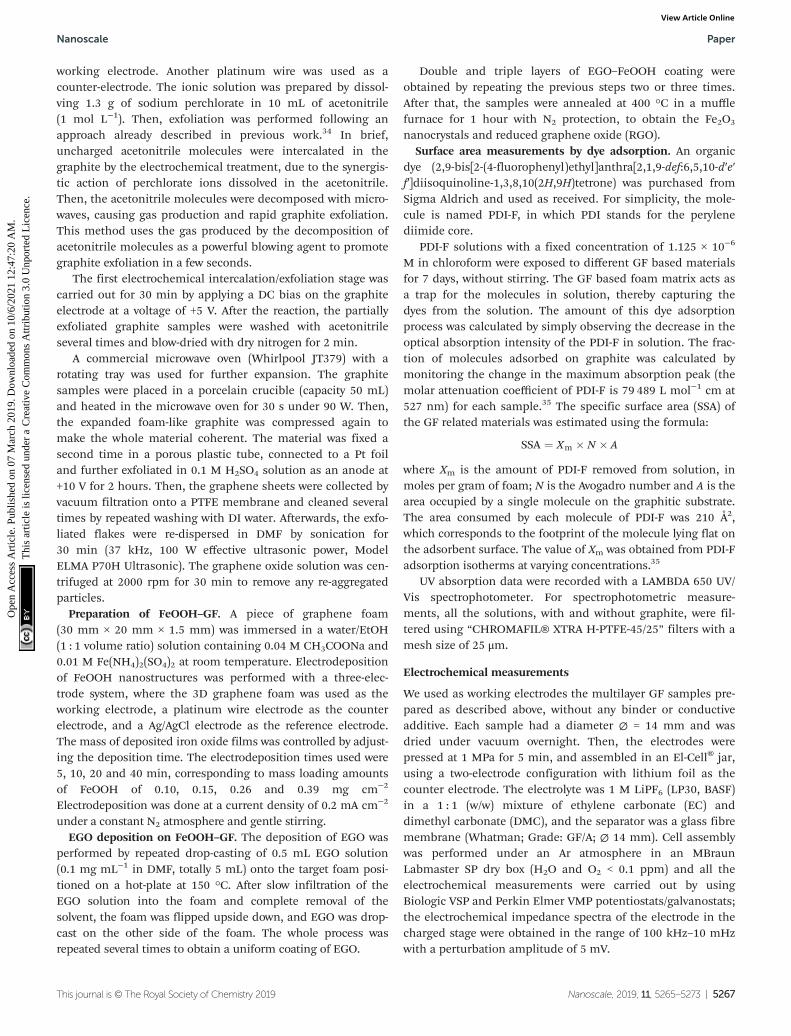
Preparation of FeOOH–GF. A piece of graphene foam(30 mm × 20 mm × 1.5 mm) was immersed in a water/EtOH(1 : 1 volume ratio) solution containing 0.04 M CH3COONa and0.01 M Fe(NH4)2(SO4)2 at room temperature. Electrodepositionof FeOOH nanostructures was performed with a three-elec-trode system, where the 3D graphene foam was used as theworking electrode, a platinum wire electrode as the counterelectrode, and a Ag/AgCl electrode as the reference electrode.The mass of deposited iron oxide films was controlled by adjust-ing the deposition time. The electrodeposition times used were5, 10, 20 and 40 min, corresponding to mass loading amountsof FeOOH of 0.10, 0.15, 0.26 and 0.39 mg cm−2
Electrodeposition was done at a current density of 0.2 mA cm−2
under a constant N2 atmosphere and gentle stirring.EGO deposition on FeOOH–GF. The deposition of EGO was
performed by repeated drop-casting of 0.5 mL EGO solution(0.1 mg mL−1 in DMF, totally 5 mL) onto the target foam posi-tioned on a hot-plate at 150 °C. After slow infiltration of theEGO solution into the foam and complete removal of thesolvent, the foam was flipped upside down, and EGO was drop-cast on the other side of the foam. The whole process wasrepeated several times to obtain a uniform coating of EGO.
Double and triple layers of EGO–FeOOH coating wereobtained by repeating the previous steps two or three times.After that, the samples were annealed at 400 °C in a mufflefurnace for 1 hour with N2 protection, to obtain the Fe2O3
nanocrystals and reduced graphene oxide (RGO).Surface area measurements by dye adsorption. An organic
dye (2,9-bis[2-(4-fluorophenyl)ethyl]anthra[2,1,9-def:6,5,10-d′e′f′]diisoquinoline-1,3,8,10(2H,9H)tetrone) was purchased fromSigma Aldrich and used as received. For simplicity, the mole-cule is named PDI-F, in which PDI stands for the perylenediimide core.
PDI-F solutions with a fixed concentration of 1.125 × 10⁻⁶
M in chloroform were exposed to different GF based materialsfor 7 days, without stirring. The GF based foam matrix acts asa trap for the molecules in solution, thereby capturing thedyes from the solution. The amount of this dye adsorptionprocess was calculated by simply observing the decrease in theoptical absorption intensity of the PDI-F in solution. The frac-tion of molecules adsorbed on graphite was calculated bymonitoring the change in the maximum absorption peak (themolar attenuation coefficient of PDI-F is 79 489 L mol−1 cm at527 nm) for each sample.35 The specific surface area (SSA) ofthe GF related materials was estimated using the formula:
SSA ¼ Xm � N � A
where Xm is the amount of PDI-F removed from solution, inmoles per gram of foam; N is the Avogadro number and A is thearea occupied by a single molecule on the graphitic substrate.The area consumed by each molecule of PDI-F was 210 Å2,which corresponds to the footprint of the molecule lying flat onthe adsorbent surface. The value of Xm was obtained from PDI-Fadsorption isotherms at varying concentrations.35
UV absorption data were recorded with a LAMBDA 650 UV/Vis spectrophotometer. For spectrophotometric measure-ments, all the solutions, with and without graphite, were fil-tered using “CHROMAFIL® XTRA H-PTFE-45/25” filters with amesh size of 25 μm.
Electrochemical measurements
We used as working electrodes the multilayer GF samples pre-pared as described above, without any binder or conductiveadditive. Each sample had a diameter ∅ = 14 mm and wasdried under vacuum overnight. Then, the electrodes werepressed at 1 MPa for 5 min, and assembled in an El-Cell® jar,using a two-electrode configuration with lithium foil as thecounter electrode. The electrolyte was 1 M LiPF6 (LP30, BASF)in a 1 : 1 (w/w) mixture of ethylene carbonate (EC) anddimethyl carbonate (DMC), and the separator was a glass fibremembrane (Whatman; Grade: GF/A; ∅ 14 mm). Cell assemblywas performed under an Ar atmosphere in an MBraunLabmaster SP dry box (H2O and O2 < 0.1 ppm) and all theelectrochemical measurements were carried out by usingBiologic VSP and Perkin Elmer VMP potentiostats/galvanostats;the electrochemical impedance spectra of the electrode in thecharged stage were obtained in the range of 100 kHz–10 mHzwith a perturbation amplitude of 5 mV.
Nanoscale Paper
This journal is © The Royal Society of Chemistry 2019 Nanoscale, 2019, 11, 5265–5273 | 5267
Ope
n A
cces
s A
rtic
le. P
ublis
hed
on 0
7 M
arch
201
9. D
ownl
oade
d on
10/
6/20
21 1
2:47
:20
AM
. T
his
artic
le is
lice
nsed
und
er a
Cre
ativ
e C
omm
ons
Attr
ibut
ion
3.0
Unp
orte
d L
icen
ce.
View Article Online
Structural and electrical characterization
Scanning Electron Microscopy (SEM) images were obtainedwith a ZEISS LEO 1530 microscope equipped with a Schottkyemitter, operated at 5 kV and secondary electrons were col-lected by means of an In-Lens detector. X-ray diffraction (XRD)measurements were collected with a PANalytical X’PertProinstrument in Bragg–Brentano reflection mode (λ = 0.1542 nm,X’Celerator detector). The mass of deposited Fe2O3 and EGOcomposites was measured by using a microbalance (CPA225D,Sartorius). X-ray photoemission spectroscopy (XPS) was per-formed exploiting an ultrahigh vacuum (UHV) apparatus (basepressure 1 × 10⁻¹⁰ mbar) using a non-monochromatic Mg Kαexcitation source (XR-50, Specs) and a hemispherical energyanalyser (Phoibos 100, Specs). Zeta potential determinationwas performed by using a NanoBrook OMNI (BrookhavenInstruments).
The electrical resistance of the graphene foams wasmeasured with a four-point probe system (Keithley 2700 multi-meter). First, silver contacts were evaporated onto glass slidesin a van der Pauw configuration, then the GF was placed in thecentre and brought into contact with the geometry using silverpaste on the four corners. Metallic probes were placed ontothe evaporated silver contacts for the measurements to achievea reproducible contact.
Electrochemical impedance spectroscopy (EIS) analysis
The EIS spectrum of the as-prepared electrodes was collectedfrom fully charging the cells, after waiting 5 minutes for astable open circuit voltage (OCV) before the EIS measure-ments. The EIS spectra were composed of two partially over-lapped semicircles at the high and medium frequency regionand a straight sloping line at the low frequency region. Thepattern of EIS can be fitted by an equivalent circuit as shownin Fig. S11c.† In this case, Re is the internal resistance of thecell, which reflects a combined resistance of the electrolyte,separator, and electrodes. RSEI and CSEI are resistance andcapacitance related to the SEI film on the surface of two elec-trodes from the high frequency region. Rct and Cdl are charge-transfer resistance and the corresponding double-layer capaci-tance from the medium frequency region. W is the Warburgimpedance related to a combined effect of the solid-statediffusion of Li+ ions on the electrolyte–electrolyte interfaces,which is related to the sloping line at the low frequencyregion. The combination of Re and RSEI is considered asohmic impedance, which reflects their ohmic characteristic.Meanwhile, the combination of Rct and Cdl is regarded as fara-daic impedance.
Electrochemical impedance spectroscopy (EIS) measure-ments were performed from 100 kHz to 10 mHz at the open-circuit potential, to further evaluate the electrochemical beha-viours of the RGO–Fe2O3 coated anode materials. It wasdifficult to monitor the charge-transfer process in these cellsdue to the mixed state-of-lithiation for both graphite andFe2O3 under the OCV conditions. Hereby, we only discussabout the ohmic behaviour of the above electrodes. As shown
in the Nyquist plots in Fig. S11a,† the values of the SEI film re-sistance RSEI of the RGO–Fe2O3–GF, (RGO–Fe2O3)2–GF and(RGO–Fe2O3)3–GF were 24.1, 23.2 and 18.5 Ω respectively,which were lower than those of Fe2O3–GF (30.3 Ω) and pure GF(31.3 Ω) electrodes. The results indicate that the unique archi-tecture of the RGO multilayer efficiently improves the electricalconductivity of the whole electrodes. After long-term cycling at2C, there was a decrease in the electrode resistance on theRGO coated electrodes (Fig. S11b†), which might be due to theformation of better passivation layers on the surfaces of elec-trodes compared to the bare Fe2O3 electrode.
Results and discussion
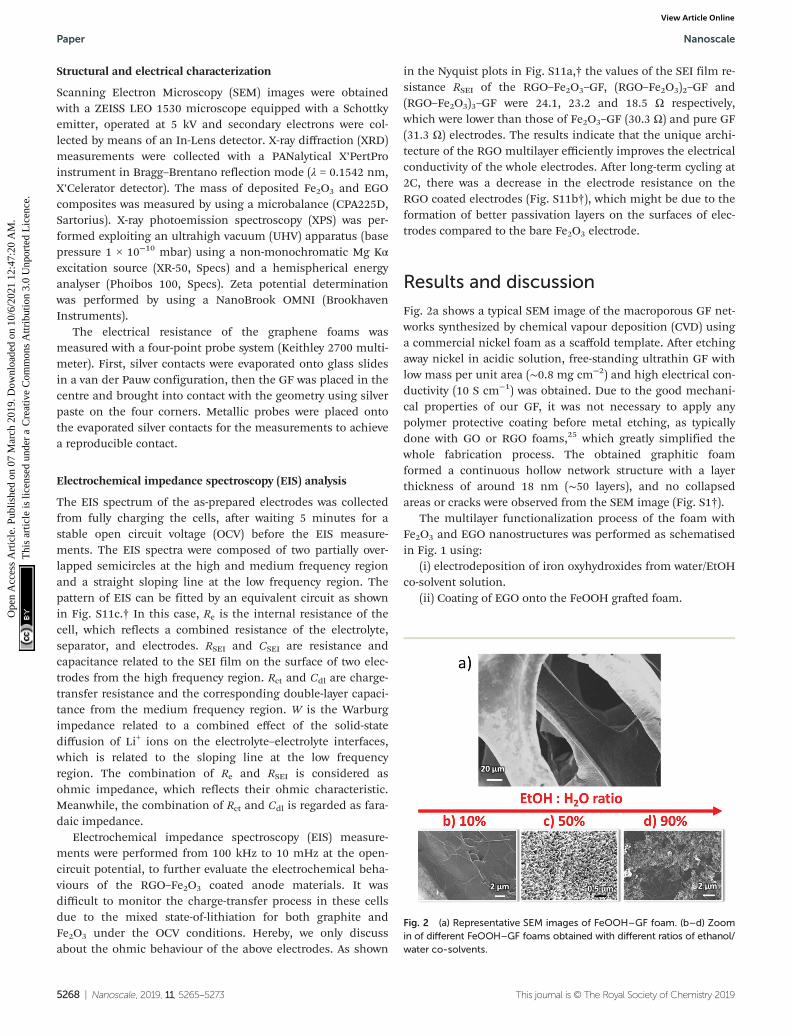
Fig. 2a shows a typical SEM image of the macroporous GF net-works synthesized by chemical vapour deposition (CVD) usinga commercial nickel foam as a scaffold template. After etchingaway nickel in acidic solution, free-standing ultrathin GF withlow mass per unit area (∼0.8 mg cm−2) and high electrical con-ductivity (10 S cm−1) was obtained. Due to the good mechani-cal properties of our GF, it was not necessary to apply anypolymer protective coating before metal etching, as typicallydone with GO or RGO foams,25 which greatly simplified thewhole fabrication process. The obtained graphitic foamformed a continuous hollow network structure with a layerthickness of around 18 nm (∼50 layers), and no collapsedareas or cracks were observed from the SEM image (Fig. S1†).
The multilayer functionalization process of the foam withFe2O3 and EGO nanostructures was performed as schematisedin Fig. 1 using:
(i) electrodeposition of iron oxyhydroxides from water/EtOHco-solvent solution.
(ii) Coating of EGO onto the FeOOH grafted foam.
Fig. 2 (a) Representative SEM images of FeOOH–GF foam. (b–d) Zoomin of different FeOOH–GF foams obtained with different ratios of ethanol/water co-solvents.
Paper Nanoscale
5268 | Nanoscale, 2019, 11, 5265–5273 This journal is © The Royal Society of Chemistry 2019
Ope
n A
cces
s A
rtic
le. P
ublis
hed
on 0
7 M
arch
201
9. D
ownl
oade
d on
10/
6/20
21 1
2:47
:20
AM
. T
his
artic
le is
lice
nsed
und
er a
Cre
ativ
e C
omm
ons
Attr
ibut
ion
3.0
Unp
orte
d L
icen
ce.
View Article Online

(iii) Repetition of previous steps to create multilayer 3Dstructures.
(iv) Thermal annealing at 400 °C to convert FeOOH intoFe2O3 and EGO into reduced graphene oxide (RGO).
The initial FeOOH coating was deposited onto the GFmatrix via anodic electrodeposition in 0.04 M CH3COONa and0.01 M Fe(NH4)2(SO4)2.
A common problem in the functionalization of foams is thepoor wetting of the inner pores by the solvent. For this, weused a co-solvent system (water and EtOH), instead of usingdestructive pre-treatment (e.g. O2 plasma) usually needed toensure hydrophilicity of GF. Different ratios of ethanol (10vol%, 50 vol% and 90 vol%) were mixed with water to improvethe wettability of the graphitic foam and enhance the adhesionof deposits onto the GF electrode surfaces. The morphology ofthe nanostructures after deposition with different ethanol/water ratios was monitored by scanning electron microscopy(SEM), as shown in Fig. 2b–d. FeOOH deposited with a lowvolume of ethanol (10 vol%) showed some coated areas.However, the coating of FeOOH layers was not uniform on theGF network, as the inner branches of the foam were only partiallycovered with the FeOOH layer (Fig. 2b). On increasing theethanol content to 50 vol% a homogeneous coating of FeOOHperfectly covered both the outer and the inner part of the GF net-works. The FeOOH formed vertical nanowalls with nanometricthickness, roughly oriented perpendicular to the substrate(Fig. 2c). The uniform coating could be attributed to the lowersurface tension of the mixture of solvents, which improved thewetting of the GF foam in aqueous solution and helped thediffusion of iron ions into the inner part of the networks.However, a further increase of the ethanol fraction (90 vol%) wasnot beneficial, giving poor solubility of the inorganic salts andthus poor deposition of FeOOH on the foams (Fig. 2d).
Using the best EtOH concentration (50%), we then opti-mized the amount of the material deposited on the substrateby varying the electrodeposition time. Only amorphous island-like structures, due to the nucleation of the iron oxyhydroxidecrystals, were observed on the GF surface after 5 min depo-sition (Fig. 3a, loading 0.10 mg cm−2). Increasing the electro-deposition time to 10 min led to a homogeneous coating ofFeOOH, assembled in nanoscopic lamellar structures (Fig. 3cand S2a, b,† loading 0.15 mg cm−2). However, the maximumloading achievable was limited; for example long electrodepo-sition time (40 min) caused cracks in the FeOOH layer (Fig. 3b,loading 0.39 mg cm−2), as we also observed in previouswork.25 The FeOOH could then be converted to nano-porousFe2O3 by heating at 400 °C under an N2 atmosphere.25 Thelamellar structure was well preserved upon conversion toFe2O3 (Fig. S2c†).
In order to improve the adhesion of Fe2O3 on the GFsurface, we coated it with a protective layer of EGO drop-castfrom dimethylformamide (DMF) solutions (Fig. 3d). The EGOlayer adhered efficiently on the iron hydroxide thanks to theelectrostatic attractions between the two materials; measuredzeta potential in DMF for EGO was ζ = −30 mV, while forFeOOH it was ζ = +32 mV.
The EGO coating layer had multifunctional roles in thecomposite structures, acting as an electrically conductive layer,a binder and a spacer, favouring further FeOOH adsorption.During thermal annealing of FeOOH, EGO could be reduced toconductive EGO (RGO).25 Its crumpled structure, analogue tothe conventional RGO, can allow unimpeded flow of ionswhile ensuring mechanical containment and good electricalconnection.
Noteworthily, the coating steps could be repeated multipletimes on the same substrate. On performing the coating stepsx times we could obtain (EGO–FeOOH)x multilayer structures,then transformed into (RGO–Fe2O3)x by annealing. The layeredsandwich-structures could be clearly identified by SEMon the cross section of the GF networks (see Fig. 4 and S2d†).Each Fe2O3 layer was ca. ∼100 nm thick, with some variabilitydue to the curved structure of the foam. In comparison, thedirect growth of FeOOH by repeated electrodeposition withoutEGO spacers caused the formation of cracks on the nanowallarrays. Obviously, the introduction of the EGO layer couldincrease the loading amount of mesoporous iron oxide, andyield a crack-free, homogeneous multilayer architecture.
To better understand the surface morphology changes dueto multiple coatings, the specific surface areas (SSA) of thepure GF and the RGO/Fe2O3 functionalized GF were measured.Standard SSA measurements in gas could not be used due tothe low SSA of the mesoscopic foams, thus we measured SSAby adsorption of a commercial organic dye, as described in ref.35, 36 and in exp. details (see Fig. S3 and Table S1†). Pure GF,Fe2O3/GF and single, double, and triple layer RGO coated elec-trodes gave SSA equal to 2.3, 5.7, 7.3, 10.9 and 11.6 m2 g−1,respectively. The initial SSA value was quite low, as expecteddue to the mesoscopic structure of the graphitic foam, but the
Fig. 3 (a, b) SEM image of CVD–GF with low and high loading amountsof FeOOH: (a) 0.10 mg cm−2, (b) 0.39 mg cm−2. The insets show highermagnification of the surface. (c) FeOOH nano-walls grown on GF with amoderate loading (0.15 mg cm−2) showing a uniform nanowall mor-phology. (d) The same nano-walls of (c), coated with EGO. Brighterareas (shown by white arrows) indicate holes in the EGO coating.
Nanoscale Paper
This journal is © The Royal Society of Chemistry 2019 Nanoscale, 2019, 11, 5265–5273 | 5269
Ope
n A
cces
s A
rtic
le. P
ublis
hed
on 0
7 M
arch
201
9. D
ownl
oade
d on
10/
6/20
21 1
2:47
:20
AM
. T
his
artic
le is
lice
nsed
und
er a
Cre
ativ
e C
omm
ons
Attr
ibut
ion
3.0
Unp
orte
d L
icen
ce.
View Article Online

increasing trend of the surface area indicates that the graftingof Fe2O3 nano-wall patterns and further coating of EGO mul-tiple layers could efficiently improve up to 5 times the availablesurface area on the GF.
The chemical composition of iron oxide and RGO func-tional layers was confirmed by XPS analysis of the bindingenergy (B.E.) of C 1s and Fe 2p spectra (see in Fig. 5 and S4a†).The chemical state of Fe 2p was used to detect the presence ofiron oxide:37 no FeO (Fe2+) was present (Fe 2p3/2 B.E. = 709.6 eV),while the peak values of Fe2O3 (711.0–711.6 eV) and FeOOH(711.9 eV) were close to the experimental value reported in theliterature.37,38 The O 1s peak (see in Fig. S4a†) was fitted by usingtwo main components and a shoulder: FeO (530.1 eV), Fe–OH(531.4 eV) and mixed oxides (532.8 eV).38 After thermal annealingtreatment at 400 °C, there was a decrease of the Fe–OH signalfrom 26% to 12% of the total O 1s signal (Fig. S4a†), indicating aconversion of FeOOH to Fe2O3.
The C 1s spectrum was measured on bare GF, Fe2O3–GFand RGO–Fe2O3–GF samples; a sharp peak was observed in allthe samples at 284.6 eV (Fig. 5a) due to the sp2 CvC bond.
The O/C ratio was calculated from the fit of the C 1s spectrumwith CvC sp2 (asymmetric red peak), C–C, C–OH, C–O–C,CvO and O–CvO components. More details on the C 1sfitting procedure are in ref. 39. After Fe2O3 coating, the overallO/C ratio increased from 0.02 to 0.10, but the intensity of C 1sdrastically decreased due to coverage of the iron oxide layer(the oxygen contribution from the substrate or Fe2O3 wasremoved from the estimate, and only the carbon–oxygen bondwas considered). The C 1s spectra of the pristine EGO and theEGO after annealing (RGO) are shown in Fig. S4b.† The O/Cratio decreased significantly from 0.20 ± 0.01 to 0.07 ± 0.01;moreover, the chemical structure of EGO evolved from a C–Odefect rich structure to a mainly sp2 aromatic carbon structurewith few C–O defects. The C 1s peak of RGO was similar to theone of RGO–Fe2O3–GF.
Noteworthily, after subsequent coating of EGO and thermalannealing (RGO–Fe2O3–GF), the absolute intensity of carbonincreased. The O/C ratio of RGO–Fe2O3–GF was similar to theO/C of pure RGO under the same annealing conditions,suggesting that the thermal treatment efficiently reduced EGOinto graphene (RGO). We observed two peaks in the Fe 2pspectra, 724.7 and 711.1 eV, in both Fe2O3–GF and RGO–Fe2O3–GF samples, corresponding to the Fe 2p1/2 and Fe 2p3/2states (Fig. 5b). Such peaks are characteristic of ferric (Fe3+)compounds, belonging to the Fe2O3 functional nano-composites, and were not observed on the bare GF samples.
Further characterization of the iron oxide structures wasobtained by XRD. The weak and broad peaks of FeOOH (see inFig. S4c†) could be indexed to the orthorhombic phase ofα-FeOOH with low-crystalline structures (goethite, JCPDS 29-0713).29 After the annealing process (Fig. 5c), a rhombohedralphase of α-Fe2O3 (hematite, JCPDS 33-0664) was observed withthe characteristic peaks (2θ = 24.1°, 33.2°, 35.6°, 40.9°, 49.5°,62.4°, and 64.1°). The other diffraction peaks at 26°, 44° and55° observed in all the samples were due to the graphiticcarbon matrix (JCPDS 12-0212). EDS elemental mappingimages (Fig. S5 and S6†) also confirmed a homogeneous distri-bution of carbon, iron and oxygen elements on both Fe2O3
and EGO–Fe2O3 coated foam composites.The multilayer foams could be compressed into thin films
and used as anodes in half-cells with lithium foil as thecounter electrode (see SEM images in Fig. S7 and Table S2†).Cyclic voltammograms (CV) of Fe2O3–GF and RGO–Fe2O3–GFelectrodes were recorded between 0.05 and 3.2 V (vs. Li/Li+) ata scan rate of 1 mV s−1. The two step reversible Li+ insertion/extraction process with α-Fe2O3 (Fe2O3 + 6Li+ + 6e− ⇄ 2Fe +3Li2O) was clearly identified during the first two cycles (seeFig. 6) for both electrodes. Two cathodic peaks located at 0.73and 1.65 V and the corresponding anodic ones at 1.61 and2.35 V were observed during the first cycle. The cathodic peakat around 0.73 V was due to the two-step reversible lithiuminsertion/extraction process within Fe2O3 (the reduction ofFe3+ and Fe2+ to Fe0). The cathodic peak at 1.65 V disappearedafter the first cycle, likely due to the irreversible formation ofLixFe2O3. Another pair of redox peaks located at 0.14 and0.40 V came from the intercalation/de-intercalation of lithium
Fig. 5 XPS (a) C 1s and (b) Fe 2p spectrum of bare GF, Fe2O3–GF andRGO–Fe2O3–GF composites; (c) XRD patterns of bare GF, Fe2O3–GFand RGO–Fe2O3–GF composites.
Fig. 4 SEM images of GF coated with an increasing number of Fe2O3
and RGO layers; (a) single RGO–Fe2O3 coating; (b) double (RGO–
Fe2O3)2 coating; (c, d) triple (RGO–Fe2O3)3 coating. Red numbers in (d)indicate the well-separated different Fe2O3 layers formed by verticalnanowalls. Insets show the schematic representation of the differentlayers in the sandwich structure.
Paper Nanoscale
5270 | Nanoscale, 2019, 11, 5265–5273 This journal is © The Royal Society of Chemistry 2019
Ope
n A
cces
s A
rtic
le. P
ublis
hed
on 0
7 M
arch
201
9. D
ownl
oade
d on
10/
6/20
21 1
2:47
:20
AM
. T
his
artic
le is
lice
nsed
und
er a
Cre
ativ
e C
omm
ons
Attr
ibut
ion
3.0
Unp
orte
d L
icen
ce.
View Article Online

ions within the graphite foam. The CV curve of the RGO–Fe2O3–GF electrode showed similar results to that of Fe2O3–GF,indicating that the RGO coating did not hinder Li ion trans-port to/from the electrode surface.
Galvanostatic charge–discharge cycling performances of theas-prepared Fe2O3–GF, RGO–Fe2O3–GF, (RGO–Fe2O3)2–GF, and(RGO–Fe2O3)3–GF electrodes were performed at various C ratesbetween 0.02 and 3 V (vs. Li/Li+) (Table S3†). The presence ofthe sandwich layer structures had a significant influence onthe electrochemical performance of these anode materials.
First, we observed that the areal capacity of uncoatedFe2O3–GF electrodes at 0.2 C rapidly decreased from1052 μA h cm−2 (coulombic efficiency: 77.3%) to 473 μA h cm−2
after 5 cycles and to 211 μA h cm−2 after 25 cycles (Fig. 7a andS9a†). Longer cycling of the Fe2O3–GF electrode at 2 C alsoresulted in serious decay of the specific capacity. This isbecause of the detachment of Fe2O3 from the conductive GFsubstrate, due to the large volume changes during the Li+ inser-tion/extraction process. The capacity of Fe2O3–GF after1000 cycles was only 27% of the initial value, as bad as the oneof bare GF.
Conversely, the RGO-coated electrodes demonstrated betterand more stable electrochemical performance. The initialcapacity gradually increased to 1070 μA h cm−2 for the singleRGO–Fe2O3 layer (coulombic efficiency 87.0%); to 1182 μA hcm−2 for the bilayer (coulombic efficiency 87.7%); and to anexcellent 1403 μA h cm−2 for the tri-layer (coulombic efficiency93.1%), see Fig. 7b, S8, S9a, and b.†
All the RGO coated electrodes maintained a high capacityafter 1000 cycles at 2 C (Fig. 7c). Single, double and triplelayers of RGO–Fe2O3 showed capacities of 650 μA h cm−2,976 μA h cm−2 and 1175 μA h cm−2, with capacity retention of61%, 83% and 84%, respectively (Fig. 7d). Given that the thick-ness of these thin films was ≈6.0 μm, the volumetric energyand power density in the half-cell system were significantlyhigh. In particular, with the thicker (RGO–Fe2O3)3–GF electrode,a specific energy density of 176 μW h cm−2 μm−1 at 0.2 C(144 μA cm−2) and a specific power density of 544 μW cm−2 μm−1
at 2 C (1445 μA cm−2) were delivered after long-term cycling.Thus, our multilayer RGO–Fe2O3 based electrode showed anexcellent performance in half cell, as compared to previouslyreported 3D thin film electrodes (10–100 µW h cm−2 μm−1).40–42
Noteworthily, the capacity increased gradually during thecycling test for all the samples (Fig. 7c). This behaviour wasobserved in other metal oxide/graphene hybrid materials10,43
and might be explained by the gradual activation of the ironoxide nanoparticles in the porous structure during the cyclingmeasurements.14
We also studied by SEM the changes in the material struc-ture after extensive charge/discharge cycling tests (Fig. S10†).Cycling of uncoated Fe2O3–GF composites (1000 cycles)showed an extensive detachment of Fe2O3, causing the capacityto drop close to the one of bare GF. On the other hand, thecoated RGO–Fe2O3–GF electrodes showed well preserved meso-porous iron oxide structures. This indicates that the RGOsheets can act as a binder and a flexible spacer to accommo-date the volume expansion of Fe2O3 layers without detachmentduring cycling.
The significantly enhanced cyclability of the RGO–Fe2O3–
GF anodes can be attributed to the collective and synergisticinteraction between the Fe2O3 layers and RGO sheets at thenanoscale. RGO not only acts as a conductive additive, butworks as a binder to promote the adhesion of additional ironoxide nanoflakes on the foam. More importantly, RGO is anexcellent flexible spacer to achieve high loading of crack-freeFe2O3 mesoporous structures. The resulting hierarchical sand-wich architecture shows uniformly distributed Fe2O3 nanowallpatterns and guarantees the extraordinary cycling stability ofthese Li ion batteries.
Conclusion
In summary, we demonstrated a fast and highly efficientelectrochemical approach for the uniform deposition of Fe2O3
nanowall structured layers on graphene foam substrates. Thelow-cost of these electrodeposition techniques would allow the
Fig. 6 Cyclic voltammetry curves of (a) Fe2O3–GF composites and (b)RGO–Fe2O3–GF composites for the 1st and 2nd cycles at a scan rate of1 mV s−1.
Fig. 7 Charge–discharge profiles of (a) Fe2O3–GF and (b) (RGO–Fe2O3)3–GFelectrodes at 0.2 C. (c) Cycling performance of different electrodes at acharge rate of 2 C. (d) Discharge rate capability of the different electrodesat different discharge rates, after 1000 cycles at 2 C.
Nanoscale Paper
This journal is © The Royal Society of Chemistry 2019 Nanoscale, 2019, 11, 5265–5273 | 5271
Ope
n A
cces
s A
rtic
le. P
ublis
hed
on 0
7 M
arch
201
9. D
ownl
oade
d on
10/
6/20
21 1
2:47
:20
AM
. T
his
artic
le is
lice
nsed
und
er a
Cre
ativ
e C
omm
ons
Attr
ibut
ion
3.0
Unp
orte
d L
icen
ce.
View Article Online

facile upscaling from the beaker level to large scale industrialreactors. We showed the beneficial role of a protective thinlayer of EGO to improve the cycling stability of the Fe2O3–GFcomposite electrodes. Sandwich structures of multilayer RGO–Fe2O3 could be successfully fabricated with improved arealcapacitance and good cycling stability. We envisage that theversatility of such multilayer functionalization on porous sub-strates could allow the fabrication of other multilayer gra-phene/metal oxide sandwich structures for energy storageapplications; while we used here the same material (Fe2O3) foreach layer, more complex structures with different materialson each layer could also be produced, to obtain more tunableor exotic electrochemical properties.
Conflicts of interest
The authors declare no conflicts of interest.
Acknowledgements
The research leading to these results has received fundingfrom the European Union’s Horizon 2020 research and inno-vation programme under GrapheneCore2 785219 – GrapheneFlagship and grant agreement no. 642196 – Marie-Curie ITN-iSwitch.
References
1 Z. P. Chen, W. C. Ren, L. B. Gao, B. L. Liu, S. F. Pei andH. M. Cheng, Nat. Mater., 2011, 10, 424–428.
2 M. Mecklenburg, A. Schuchardt, Y. K. Mishra, S. Kaps,R. Adelung, A. Lotnyk, L. Kienle and K. Schulte, Adv.Mater., 2012, 24, 3486–3490.
3 H. Hu, Z. B. Zhao, W. B. Wan, Y. Gogotsi and J. S. Qiu, Adv.Mater., 2013, 25, 2219–2223.
4 S. Drieschner, M. Weber, J. Wohlketzetter, J. Vieten,E. Makrygiannis, B. M. Blaschke, V. Morandi, L. Colombo,F. Bonaccorso and J. A. Garrido, 2D Mater., 2016, 3, 045013.
5 R. Mo, D. Rooney, K. Sun and H. Y. Yang, Nat. Commun.,2017, 8, 13949.
6 B. G. Choi, M. Yang, W. H. Hong, J. W. Choi and Y. S. Huh,ACS Nano, 2012, 6, 4020–4028.
7 B. H. Min, D. W. Kim, K. H. Kim, H. O. Choi, S. W. Jangand H. T. Jung, Carbon, 2014, 80, 446–452.
8 M. B. Sassin, A. N. Mansour, K. A. Pettigrew, D. R. Rolisonand J. W. Long, ACS Nano, 2010, 4, 4505–4514.
9 K. Parvez, R. J. Li, S. R. Puniredd, Y. Hernandez, F. Hinkel,S. H. Wang, X. L. Feng and K. Mullen, ACS Nano, 2013, 7,3598–3606.
10 J. S. Luo, J. L. Liu, Z. Y. Zeng, C. F. Ng, L. J. Ma, H. Zhang,J. Y. Lin, Z. X. Shen and H. J. Fan, Nano Lett., 2013, 13,6136–6143.
11 X. M. Feng, Y. Zhang, J. H. Zhou, Y. Li, S. F. Chen,L. Zhang, Y. W. Ma, L. H. Wang and X. H. Yan, Nanoscale,2015, 7, 2427–2432.
12 Y. Bai, W. Q. Wang, R. R. Wang, J. Sun and L. Gao, J. Mater.Chem. A, 2015, 3, 12530–12538.
13 Z. S. Wu, Y. Sun, Y. Z. Tan, S. B. Yang, X. L. Feng andK. Mullen, J. Am. Chem. Soc., 2012, 134, 19532–19535.
14 J. Y. Ji, L. L. Zhang, H. X. Ji, Y. Li, X. Zhao, X. Bai, X. B. Fan,F. B. Zhang and R. S. Ruoff, ACS Nano, 2013, 7, 6237–6243.
15 T. Q. Lin, I. W. Chen, F. X. Liu, C. Y. Yang, H. Bi,F. F. Xu and F. Q. Huang, Science, 2015, 350, 1508–1513.
16 B. Wang, S. M. Li, X. Y. Wu, J. H. Liu and W. M. Tian, Phys.Chem. Chem. Phys., 2016, 18, 908–915.
17 Z. Y. Xia, C. Arbizzani, L. Ortolani, V. Morandi, V. Bellani,G. Giambastiani, M. Gazzano and V. Palermo, FlatChem,2017, 3, 8–15.
18 Q. M. Su, D. Xie, J. Zhang, G. H. Du and B. S. Xu, ACSNano, 2013, 7, 9115–9121.
19 X. J. Zhu, Y. W. Zhu, S. Murali, M. D. Stollers andR. S. Ruoff, ACS Nano, 2011, 5, 3333–3338.
20 W. F. Chen, S. R. Li, C. H. Chen and L. F. Yan, Adv. Mater.,2011, 23, 5679–5683.
21 S. Guo, G. K. Zhang, Y. D. Guo and J. C. Yu, Carbon, 2013,60, 437–444.
22 D. Z. Chen, G. S. Wang, S. He, J. Liu, L. Guo and M. S. Cao,J. Mater. Chem. A, 2013, 1, 5996–6003.
23 S. K. Liu, Z. X. Chen, K. Xie, Y. J. Li, J. Xu and C. M. Zheng,J. Mater. Chem. A, 2014, 2, 13942–13948.
24 J. S. Cho, Y. J. Hong and Y. C. Kang, ACS Nano, 2015, 9,4026–4035.
25 Z. Y. Xia, D. Wei, E. Anitowska, V. Bellani, L. Ortolani,V. Morandi, M. Gazzano, A. Zanelli, S. Borini andV. Palermo, Carbon, 2015, 84, 254–262.
26 X. Hu, M. Ma, M. Zeng, Y. Sun, L. Chen, Y. Xue, T. Zhang,X. Ai, R. G. Mendes, M. H. Ruemmeli and L. Fu, ACS Appl.Mater. Interfaces, 2014, 6, 22527–22533.
27 M. Cohen and V. Markovac, J. Electrochem. Soc., 1967, 114,674–678.
28 R. L. Spray and K.-S. Choi, Chem. Mater., 2009, 21, 3701–3709.
29 S. H. Jiao, L. F. Xu, K. L. Hu, J. J. Li, S. Gao and D. S. Xu,J. Phys. Chem. C, 2010, 114, 269–273.
30 O. Zandi, A. R. Schon, H. Hajibabaei and T. W. Hamann,Chem. Mater., 2016, 28, 765–771.
31 M.-S. Wu, R.-H. Lee, J.-J. Jow, W.-D. Yang, C.-Y. Hsieh andB.-J. Weng, Electrochem. Solid-State Lett., 2009, 12,A1–A4.
32 Z. Y. Xia, S. Pezzini, E. Treossi, G. Giambastiani,F. Corticelli, V. Morandi, A. Zanelli, V. Bellani andV. Palermo, Adv. Funct. Mater., 2013, 23, 4684–4693.
33 P. Yu, Z. M. Tian, S. E. Lowe, J. C. Song, Z. R. Ma, X. Wang,Z. J. Han, Q. L. Bao, G. P. Simon, D. Li and Y. L. Zhong,Chem. Mater., 2016, 28, 8429–8438.
34 Z. Y. Xia, G. Giambastiani, C. Christodoulou, M. V. Nardi,N. Koch, E. Treossi, V. Bellani, S. Pezzini, F. Corticelli,
Paper Nanoscale
5272 | Nanoscale, 2019, 11, 5265–5273 This journal is © The Royal Society of Chemistry 2019
Ope
n A
cces
s A
rtic
le. P
ublis
hed
on 0
7 M
arch
201
9. D
ownl
oade
d on
10/
6/20
21 1
2:47
:20
AM
. T
his
artic
le is
lice
nsed
und
er a
Cre
ativ
e C
omm
ons
Attr
ibut
ion
3.0
Unp
orte
d L
icen
ce.
View Article Online

V. Morandi, A. Zanelli and V. Palermo, ChemPlusChem,2014, 79, 439–446.
35 A. Liscio, K. Kouroupis-Agalou, A. Kovtun, E. Gebremedhn,M. El Garah, W. Rekab, E. Orgiu, L. Giorgini, P. Samorì,D. Beljonne and V. Palermo, ChemPlusChem, 2017, 82, 358–367.
36 P. T. Hang and G. W. Brindley, Clays Clay Miner., 1970, 18,203–212.
37 P. Mills and J. L. Sullivan, J. Phys. D: Appl. Phys., 1983, 16,723–732.
38 N. S. McIntyre and D. G. Zetaruk, Anal. Chem., 1977, 49,1521–1529.
39 A. Kovtun, D. Jones, S. Dell’Elce, E. Treossi, A. Liscio andV. Palermo, Carbon, 2019, 143, 68–275.
40 Y. Yang, X. J. Fan, G. Casillas, Z. W. Peng, G. D. Ruan,G. Wang, M. J. Yacaman and J. M. Tour, ACS Nano, 2014, 8,3939–3946.
41 J. H. Pikul, H. G. Zhang, J. Cho, P. V. Braun and W. P. King,Nat. Commun., 2013, 4, 1732.
42 W. H. Lai, Y. Wang, Z. W. Lei, R. H. Wang, Z. Y. Lin,C. P. Wong, F. Y. Kang and C. Yang, J. Mater. Chem. A, 2018,6, 3933–3940.
43 M. F. Hassan, Z. P. Guo, Z. X. Chen and H. K. Liu, Mater.Res. Bull., 2011, 46, 858–864.
Nanoscale Paper
This journal is © The Royal Society of Chemistry 2019 Nanoscale, 2019, 11, 5265–5273 | 5273
Ope
n A
cces
s A
rtic
le. P
ublis
hed
on 0
7 M
arch
201
9. D
ownl
oade
d on
10/
6/20
21 1
2:47
:20
AM
. T
his
artic
le is
lice
nsed
und
er a
Cre
ativ
e C
omm
ons
Attr
ibut
ion
3.0
Unp
orte
d L
icen
ce.
View Article Online