a risk-based methodology to assist in the regulation … · in the regulation of domestic waste...
TRANSCRIPT

A Risk-Based Methodology to Assist in the Regulation of Domestic
Waste Water Treatment Systems
Environmental Protection Agency The Environmental Protection Agency (EPA) is a statutory body responsible for protecting the environment in Ireland. We regulate and police activities that might otherwise cause pollution. We ensure there is solid information on environmental trends so that necessary actions are taken. Our priorities are protecting the Irish environment and ensuring that development is sustainable.
The EPA is an independent public body established in July 1993 under the Environmental Protection Agency Act, 1992. Its sponsor in Government is the Department of the Environment, Community and Local Government.
OUR RESPONSIBILITIES
LICENSING We license the following to ensure that their emissions do not endanger human health or harm the environment:
• waste facilities (e.g., landfills, incinerators, waste transfer stations);
• large scale industrial activities (e.g., pharmaceutical manufacturing, cement manufacturing, power plants);
• intensive agriculture;
• the contained use and controlled release of Genetically Modified Organisms (GMOs);
• large petrol storage facilities.
• waste water discharges
NATIONAL ENVIRONMENTAL ENFORCEMENT • Conducting over 2,000 audits and inspections of EPA
licensed facilities every year.
• Overseeing local authorities’ environmental protection responsibilities in the areas of - air, noise, waste, waste-water and water quality.
• Working with local authorities and the Gardaí to stamp out illegal waste activity by co-ordinating a national enforcement network, targeting offenders, conducting investigations and overseeing remediation.
• Prosecuting those who flout environmental law and damage the environment as a result of their actions.
MONITORING, ANALYSING AND REPORTING ON THE ENVIRONMENT • Monitoring air quality and the quality of rivers, lakes, tidal
waters and ground waters; measuring water levels and river flows.
• Independent reporting to inform decision making by national and local government.
REGULATING IRELAND’S GREENHOUSE GAS EMISSIONS • Quantifying Ireland’s emissions of greenhouse gases in the
context of our Kyoto commitments.
• Implementing the Emissions Trading Directive, involving over 100 companies who are major generators of carbon dioxide in Ireland.
ENVIRONMENTAL RESEARCH AND DEVELOPMENT • Co-ordinating research on environmental issues (including
air and water quality, climate change, biodiversity, environmental technologies).
STRATEGIC ENVIRONMENTAL ASSESSMENT • Assessing the impact of plans and programmes on the Irish
environment (such as waste management and development plans).
ENVIRONMENTAL PLANNING, EDUCATION AND GUIDANCE • Providing guidance to the public and to industry
on various environmental topics (including licence applications, waste prevention and environmental regulations).
• Generating greater environmental awareness (through environmental television programmes and primary and secondary schools’ resource packs).
PROACTIVE WASTE MANAGEMENT • Promoting waste prevention and minimisation projects
through the co-ordination of the National Waste Prevention Programme, including input into the implementation of Producer Responsibility Initiatives.
• Enforcing Regulations such as Waste Electrical and Electronic Equipment (WEEE) and Restriction of Hazardous Substances (RoHS) and substances that deplete the ozone layer.
• Developing a National Hazardous Waste Management Plan to prevent and manage hazardous waste.
MANAGEMENT AND STRUCTURE OF THE EPA • The organisation is managed by a full time Board,
consisting of a Director General and four Directors.
• The work of the EPA is carried out across four offices:
• Office of Climate, Licensing and Resource Use
• Office of Environmental Enforcement
• Office of Environmental Assessment
• Office of Communications and Corporate Services
• The EPA is assisted by an Advisory Committee of twelve members who meet several times a year to discuss issues of concern and offer advice to the Board.

A Risk-Based Methodology to Assist in the Regulation of Domestic Waste Water Treatment Systems

Authors and Acknowledgements
This guidance document, as well as the maps that accompany it, is the result of work by EPA personnel,
Geological Survey of Ireland Groundwater Section staff, and an independent geological consultant. A
peer review process was undertaken.
Working Group Members
Donal Daly, Environmental Protection Agency Leo Sweeney, Environmental Protection Agency
Claire Byrne, Environmental Protection Agency
Matthew Craig, Environmental Protection Agency
Natalya Hunter-Williams, Groundwater Section, Geological Survey of Ireland
Margaret Keegan, Environmental Protection Agency
Monica Lee, Groundwater Section, Geological Survey of Ireland
Anthony Mannix, Environmental Protection Agency
Robert Meehan, Consultant Geologist
Peer Reviewers
Phil Jordan, Professor of Catchment Science, School of Environmental Sciences,University of UlsterTony Marsland, formerly Groundwater Policy Manager, Environment Agency, England and Wales.
Disclaimer
Although every effort has been made to ensure the accuracy of the material contained in this publication, complete accuracy cannot be guaranteed. Neither the Environmental Protection Agency nor the author(s) accept any responsibility whatsoever for loss or damage occasioned, or claimed to have been occasioned, in part or in full as a consequence of any person acting or refraining from acting, as a result of a matter contained in this publication. All or part of this publication may be reproduced without further permission, provided the source is acknowledged.
Published by the
Environmental Protection Agency
An Ghníomhaireacht um Chaomhnú Comhshaoil
Johnstown Castle, Wexford, Ireland
Telephone: +353 53 916 0600
LoCall: 1890 33 55 99
Fax: +353 53 916 0699
Email: [email protected]
Website: www.epa.ie
01/13/free to download ISBN: 978-1-84095-481-4
Report available on EPA website www.epa.ie

Executive Summary
v
Executive Summary
Aim of Report
Under the Water Services (Amendment) Act, 2012 (S.I. No. 2 of 2012), the EPA is responsible for making
a National Inspection Plan having regard to relevant risks to human health and the environment. The aim
of this report is to set out a methodology to enable the EPA to adopt a risk-based approach to organising
inspections of domestic waste water treatment systems (DWWTSs), whereby the level of inspection will be
proportionate to the risk posed to human health and the environment.
Risk-Based Methodology
The methodology is based on the source-pathway-receptor (S-P-R) model for environmental management.
The development of the methodology was influenced by:
◆ the data and map information available as GIS datasets;
◆ the current understanding of the hydrological and hydrogeological settings present in Ireland;
◆ results of research on DWWTSs and hydrogeology undertaken in Ireland.
Discharges from DWWTSs
DWWTSs located, constructed, installed and maintained in accordance with the best practice guidance
generally provide adequate treatment and disposal of domestic waste water. However, where the location,
construction, operation and/or maintenance are inadequate, impacts may occur. This report focuses on
the issues that may arise in the areas that are problematical with regard to inadequate percolation and/or
attenuation. Three pollutants were taken as representative of the threat posed by discharges from DWWTSs
to water quality and human health – molybdate reactive phosphate (MRP), nitrate and microbial pathogens.
Receptors of Concern
The receptors of concern are human health from direct contact with microbial pathogens, surface water
from eutrophication and/or polluted groundwater being used as a private water supply (e.g. untreated well
water).
Evaluation of Pathways Linking DWWTSs with Receptors
The pathway is the link between the source of pollution and the receptor, and can be either at or close
to the surface or underground, or a combination of the two. Natural vertical and horizontal pathways for
effluent migration are determined by the on-site subsurface geology, particularly the nature of the soils,
subsoils and underlying aquifers. Artificial pathways may include drainage ditches, land drainage pipes and
stream culverts.
The characteristics of both the surface and subsurface pathways are defined by the ‘pathway susceptibility’,
which is a measure of the degree of attenuation between source and receptor.

Domestic Waste Water Treatment Systems — Risk Ranking
vi
◆ The factors that influence attenuation along the surface pathway (which is present where percolation
is inadequate) include: whether the effluent is piped directly to ditches/streams or ponds at the
surface; uptake of nutrient by plants in the ponded areas; die-off or predation of microbial pathogens;
attenuation in the topsoil; and percolation during dry weather conditions.
◆ The factors that influence attenuation along the subsurface pathway include: the thickness and
permeability of the subsoil; the type of aquifer (whether bedrock or sand/gravel); and whether or not
the bedrock facilitates denitrification.
The presence of areas with ‘inadequate percolation’ due to low-permeability soils and subsoils, high water
tables and/or low-permeability bedrock presents the greatest challenge in Ireland to dealing with effluent
from DWWTSs, as engineering measures to alleviate the situation are not usually readily available. It is
estimated that the overall proportion of the country with inadequate percolation, which can arise all year
round or be intermittent during wet weather conditions, is approximately 39%.
Risk Characterisation
The risk is determined by a combination of the following elements:
◆ estimated pollutant load from each individual DWWTS, derived from typical discharge concentrations
and quantities;
◆ pathway susceptibility, indicating the ease with which pollutants can enter surface water or groundwater;
◆ cumulative load entering the surface water or groundwater environment derived from DWWTS density
and estimations of attenuation;
◆ dilution of load at the water receptor; calculations are based on the effective rainfall and groundwater
recharge estimations in 1 km2 grids country-wide;
◆ risk ranking using estimates of predicted pollutant – MRP and nitrate – concentrations at the receptor
in comparison to appropriate standards for MRP and nitrate. Microbial pathogens are considered to be
influenced by pathway factors in a similar manner to MRP.
Four categories of relative risk are used: low, moderate, high and very high.
The percentage areas of the country in the different relative risk categories are given in the table below.
Relative risk
category
MRP & Pathogens Nitrate
Streams
via surface
pathway
Streams and wells
via subsurface
pathway
Streams via
surface pathway
Streams and wells
via subsurface
pathway
Low 63.1 89.0 97.2 97.4
Moderate 10.5 4.1 0.2 0.1
High 6.4 1.9 0.1 <0.1
Very High 17.5 2.6 0.1 <0.1
Area Sewered 2.4 2.4 2.4 2.4
Percentages may not sum to 100% due to rounding.

Executive Summary
vii
The results indicate that:
◆ The risk to human health from DWWTS waste water is significantly higher in areas with a high density
of DWWTSs and inadequate percolation; and in vulnerable areas with private wells.
◆ MRP is the main pollutant posing a threat to the environment, particularly to surface water, either
where there is inadequate percolation or where there is inadequate attenuation prior to entry of waste
water into bedrock aquifers, particularly karstified (cavernous limestone) aquifers. While the cumulative
pollutant load arising from DWWTSs will be insignificant compared to urban waste water treatment
systems and agriculture at river basin scale, it can be significant in certain physical settings at small
catchment scale.
◆ The threat posed by nitrogen from DWWTSs is low at catchment scale and at the scale of this assessment
– 1 km2 – due to dilution; however, in exceptional circumstances, at site scale (a few hectares), a high
density of DWWTSs can cause localised plumes with elevated nitrate concentrations in groundwater.
Next Steps
The output from the risk-based methodology indicates the relative risk of impacts from DWWTSs. Detailed
criteria for site selection, which take account of sensitive receptors, have been established for use in
conjunction with the risk-based methodology in developing the National Inspection Plan and in proposing
the level of inspection, based on risk. This will assist Water Service Authorities in identifying areas to focus
inspections and achieve the best outcome for the environment.
The results of the inspections undertaken will be used to verify and calibrate the S-P-R model as appropriate.
Domestic Waste Water Treatment Systems — Risk Ranking
viii
Table of Contents1. Background 1
1.1 Introduction 1
1.2 Report Scope 1
1.3 Domestic Waste Water Treatment Systems 2
1.4 Historical and Current Requirements for Siting, Design and Installation of DWWTSs 3
1.5 Risk-Based Enforcement 4
1.6 National Inspection Plan 4
2. A risk-based approach to assessing the impact of existing Domestic Waste Water Treatment Systems 5
2.1 Risk Assessment 5
2.2 Source-Pathway-Receptor Framework 5
3. Source Characteristics 8
3.1 Domestic Waste Water Quality 8
3.2 Microbial pathogens 8
3.3 Phosphorus 9
3.4 Nitrogen 9
3.5 Volumes of Waste Water Generated by DWWTSs 9
3.6 Pollutant Load 9
4. Surface and subsurface pathways 10
4.1 Understanding and Using the ‘Pathway’ Concept 10
4.2 Characteristics of Surface and Subsurface Pathways 10
4.3 Pathway Susceptibility 13
4.4 Factors Influencing Surface Water Susceptibility to Contamination 13
4.5 Factors Influencing Groundwater Susceptibility to Contamination 14

Table of Contents
ix
5. Classifying pathway susceptibility 16
5.1 Introduction 16
5.2 Inadequate Percolation 16
5.3 Inadequate Attenuation 18
5.4 Use of Pathway Susceptibility Ranking Maps 19
5.5 Map Confidence and Forthcoming County Maps 20
6. Risk characterisation 24
6.1 Introduction 24
6.2 Pollutant Load 25
6.3 Pathway Attenuation 25
6.4 Estimating Cumulative Load and Resultant Concentration 27
6.5 Risk Ranking 29
6.6 Results of Risk Ranking Process 30
6.7 Next Steps 31
7. Summary and Conclusions 37
8. Glossary 38
9. References 43
Appendix 1 45
Susceptibility Matrices 45
Appendix 2 55
Bedrock Types that are Rich in Pyrite and Hence Denitrify (‘Denitrifying’ Bedrock Aquifers) 55
Appendix 3 56
Worked Example of Calculations of Load Input, Attenuation, Dilution and Impact Risk for an Area 56
Appendix 4 59
Examples of the Output of the Excel Workbook for Surface and Subsurface Pathways 59

Domestic Waste Water Treatment Systems — Risk Ranking
x

Background
1
1. Background
1.1 Introduction
A domestic waste water treatment system (DWWTS) is the primary method used for the treatment and
disposal of sewage from houses in rural and suburban areas that are not serviced by a public sewer system.
Properly located, constructed, installed and operated domestic waste water treatment systems generally
provide adequate treatment of domestic waste water and will ensure that the waste water is discharged
with minimal risk to human health or the environment.
The Water Services (Amendment) Act, 2012 (S.I. No. 2 of 2012) requires homeowners connected
to a DWWTS to register and ensure that the system does not constitute a risk to human health or the
environment through compliance with standards for the performance and operation of DWWTSs. Water
Services Authorities (WSAs) (local authorities) are required to maintain a register of DWWTS and undertake
inspections to regulate the discharges from these systems. The Environmental Protection Agency (EPA) is
responsible for the development of the National Inspection Plan (NIP), the appointment of inspectors and
the establishment and maintenance of a register of inspectors, and is the supervisory authority over the
WSAs in the performance of their functions under the Act.
The new legislation will also assist Ireland in meeting the objectives of the Water Framework Directive
(2000/60/EC). Ireland must maintain current ‘high’ and ‘good’ status water bodies and it is of critical
importance that this is achieved. All water bodies at less than good status must show no deterioration and
must be restored to good status by 2015 (there are extended deadlines to 2021 and 2027 for some water
bodies). A major programme, through the implementation of River Basin Management Plans, is under
way to achieve this ambitious target. The NIP specifically addresses one of the measures in the River Basin
Management Plans, which deals with inspection and remediation of DWWTSs.
A review of enforcement procedures internationally revealed that environmental considerations are key to
developing enforcement strategies, in prioritising enforcement activities and in allocating resources where they
are needed most. The Environmental Protection Agency (EPA) has developed this environmental risk assessment
methodology to allow it to prioritise the inspection of DWWTSs through the implementation of the NIP.
1.2 Report Scope
The aim of this report is to provide a scientific basis for enabling consideration of the risk to human health
and the environment when deciding on the inspection regime. The report includes descriptions of the
following:
◆ the risk-based approach;
◆ characteristics (quality and quantity) of discharges from DWWTSs;
◆ characteristics of the surface and subsurface pathways for the discharge after it leaves the wastewater
treatment tank;
◆ the process followed in ranking pathway susceptibility;
◆ the basis for ranking areas based on the risk of impact to human health and the environment.

Domestic Waste Water Treatment Systems — Risk Ranking
2
The maps produced to accompany this methodology are intended to give a guide as to where issues are most
likely to occur with respect to inadequate percolation or susceptibility of groundwater to the occurrence
of pathogens/molybdate reactive phosphorus (MRP) or nitrate across Ireland, with respect to existing
DWWTSs. The maps have been produced at a 1:40,000 scale. Further enlargement would potentially be
misleading as the spatial resolution of the underlying data is insufficient to show detail beyond this scale.
The depicted boundaries and interpretations derived from the maps do not eliminate the need for on-site
sampling, testing, and detailed study of specific sites. The maps should be used appropriately, and users are
responsible for this process.
1.3 Domestic Waste Water Treatment Systems
Domestic waste water disposal accounts for approximately one-third of residences in Ireland. There are an
estimated 497,000 (CSO, 2012) DWWTSs in Ireland treating waste water from single houses not connected
to a public sewer system.
In most cases the DWWTS utilised is a conventional septic tank system. The conventional septic tank system
consists of two main parts:
◆ the septic tank itself, and
◆ the percolation area, which comprises the effluent distribution system and the adsorption and treatment
beneath it, which occurs in the biomat and in the soil and subsoil layers and where the main treatment
of the effluent takes place.
Secondary treatment systems (often called ‘advanced’ systems) are also employed. These systems offer
secondary treatment of discharged effluent and include those constructed on-site and packaged treatment
systems. Secondary waste water treatment systems may include a package treatment system and a polishing
filter, which may comprise soil, sand or peat.
Both conventional septic tank systems and secondary treatment systems must include two elements in their
make-up, namely the tank or mechanical treatment unit and the percolation or polishing filter set in the
ground. Septic tank systems require greater depths of subsoil and a larger area for distribution of discharged
effluent than secondary treatment systems.
All new DWWTSs, whether of the conventional septic tank type or of the secondary type, should meet
the requirements of the appropriate European Standards (EN 12566 series of standards). Such systems are
designed to:
◆ treat the wastewater to minimise contamination of soils and water bodies;
◆ prevent direct discharge of untreated wastewater to the groundwater or surface water;
◆ protect humans from contact with wastewater;
◆ keep animals, insects, and vermin from contact with waste water; and
◆ minimise the generation of foul odours.

Background
3
It should be noted that there are many localities across Ireland where neither a conventional septic tank nor a
secondary treatment system discharging to ground will operate adequately, due to unsuitable site conditions.
For existing systems, in such cases, some additional remedial measures or non-conventional systems may be
necessary to provide adequate protection (e.g. importation of suitable soil for the construction of mound
systems or tertiary treated effluent discharging to surface waters with a licence).
1.4 Historical and Current Requirements for Siting, Design and Installation of DWWTSs
In 1975, the Institute for Industrial Research and Standards (IIRS) published the Recommendation for Septic
Tank Drainage Systems Suitable for Single Houses (SR6:1975), which was the first document outlining best
practice with respect to septic tank systems in Ireland. The National Standard Authority of Ireland (NSAI)
followed this in 1991 by publishing Septic Tank Systems: Recommendations for Domestic Effluent Treatment
and Disposal from a Single House (SR6:1991). This document required that a site suitability assessment be
carried out before the installation of a DWWTS, and outlined how this assessment should be carried out and
how percolation areas should be constructed. Where sites were deemed unsuitable for reasons such as poor
percolation, remedial measures were suggested which included mounding percolation areas using imported
suitable material. However, while remedial measures such as this are satisfactory in some circumstances,
they may not address the hydraulic issue sufficiently where there is inadequate percolation.
The EPA published the guidance manual Wastewater Treatment Manual: Treatment Systems for Single
Houses in 2000, which further defined the site assessment process and gave detailed accounts of the types
of secondary treatment systems available in Ireland at that time. Acceptable limits to percolation values were
set out in this document, and the site assessment process from this time on was a more involved procedure.
Currently, where new houses are being constructed in unsewered areas and waste water from a single
house needs to be treated on-site, the EPA Code of Practice: Wastewater Treatment and Disposal Systems
Serving Single Houses (p.e. ≤ 10) (CoP) provides guidance from the assessment stage through to the design,
installation and maintenance stages of a DWWTS, in such a way as to prevent water pollution and protect
public health. This document, published in late 2009, applies to new systems only and does not account for
the many older houses with existing DWWTSs that pre-date it.
The importance of proper design, installation, operation and maintenance of DWWTSs cannot be
overestimated. In particular, a well designed and constructed distribution device and percolation area/
polishing filter is critically important in terms of maintaining an even flow of waste water and promoting
biomat development that will adequately distribute and allow treatment of the effluent. A clogged
percolation area/polishing filter due to poor construction and maintenance can result in backing up and
surface ponding in some locations otherwise suitable for subsurface percolation. A good percolation area/
polishing filter can occasionally assist where marginal subsurface percolation conditions exist, but it will
never overcome the problem of fundamentally unsuitable subsurface percolation conditions, hence the
focus on soil/geological conditions in this report.
Correct operation and maintenance of DWWTSs is essential to ensure ongoing treatment of waste water.
A ‘duty of care’ is placed on homeowners by Section 70 of the Water Services Act, 2007 and the Water
Services Acts 2007 and 2012 (Domestic Waste Water Treatment Systems) Regulations 2012 (S.I. 223 of
2012), which details the requirements for operation and maintenance of systems including the requirements
Domestic Waste Water Treatment Systems — Risk Ranking
4
for de-sludging of DWWTSs. If systems are not de-sludged properly solids can be carried over and cause
blockages in the percolation area/polishing filter, thus preventing adequate treatment and/or causing
ponding of effluent on-site.
It is expected that all new DWWTSs will be designed, installed, operated and maintained to accepted
standards; however, the risk assessment methodology does not make particular assumptions about
adherence of existing systems to these standards as its purpose is to underpin a risk-based inspection
scheme relying only on underlying environmental conditions.
1.5 Risk-Based Enforcement
The EPA is committed to delivering effective risk-based regulation (Lynott and O’Leary, 2011), recognising
that the most effective and efficient way to protect human health and the environment is to target resources
towards activities that pose the greatest risk and those areas at greatest risk of impact. The EPA considers
that, while the overall risk from DWWTSs to the environment at a national scale is lower than that from
agricultural activities and urban wastewater treatment systems, there are areas of the country where the
potential risk from DWWTSs may be important at a local level due to the density of systems and the
prevailing ground conditions.
In line with European and international best practice, the EPA has developed this risk-based methodology
to provide for the prioritising of the enforcement of DWWTS management. The methodology has built on
previous research work carried out by the Western River Basin District in the development of the River Basin
Management Plans (WRBD, 2008), which estimated that a significant proportion of existing septic tanks
have the potential to impact on groundwater and/or surface waters.
1.6 National Inspection Plan
The Water Services (Amendment) Act 2012 requires the EPA to prepare a National Inspection Plan for
DWWTSs. It sets out the issues to be considered by the EPA when drawing up the plan, to include relevant
and potential risks to human health and the environment, and makes provision for the revision of the plan.
The WSAs will be required to give effect to the plan. The development of this risk-based methodology
provides a decision-making framework to prioritise and target sensitive areas, and allocate and deploy
resources with a view to facilitating compliance with the Water Services (Amendment) Act.

A risk-based approach to assessing the impact of existing Domestic Waste Water Treatment Systems
5
2. A risk-based approach to assessing the impact of existing Domestic Waste Water Treatment Systems
2.1 Risk Assessment
Risk assessment is a fundamental step in the protection of human health and the environment, and in
effective water management planning. Risk assessment allows environmental problems to be identified,
likely problem areas to be located, monitoring programmes to be designed, and appropriate cost-effective
inspection, protection and improvement measures to be formulated and implemented.
The assessment of the performance of DWWTSs, as outlined in this report, is receptor-focused and risk-
based. The receptors of concern are human health, aquatic ecosystems and groundwater resources.
2.2 Source-Pathway-Receptor Framework
The basis for risk assessment is the source-pathway-receptor (S-P-R) model, which underpins all groundwater
protection schemes in Ireland, as well as the EU Water Framework Directive on which both surface water
and groundwater regulations are based.
The S-P-R model is depicted schematically in Figure 1, whereby a source is linked to one or more receptors
via pathways. In the example, the source is represented by a DWWTS, which disposes of discharged effluent
through a percolation area situated in an area where bedrock is at a shallow depth. The discharge infiltrates
through subsoils into groundwater in the bedrock, from where it migrates through fractures and fissures
to a down-gradient abstraction well and towards a river. There are in fact three potential receptors in the
diagram: the abstraction well, the river, and the bedrock aquifer (the last as a groundwater resource). Figure
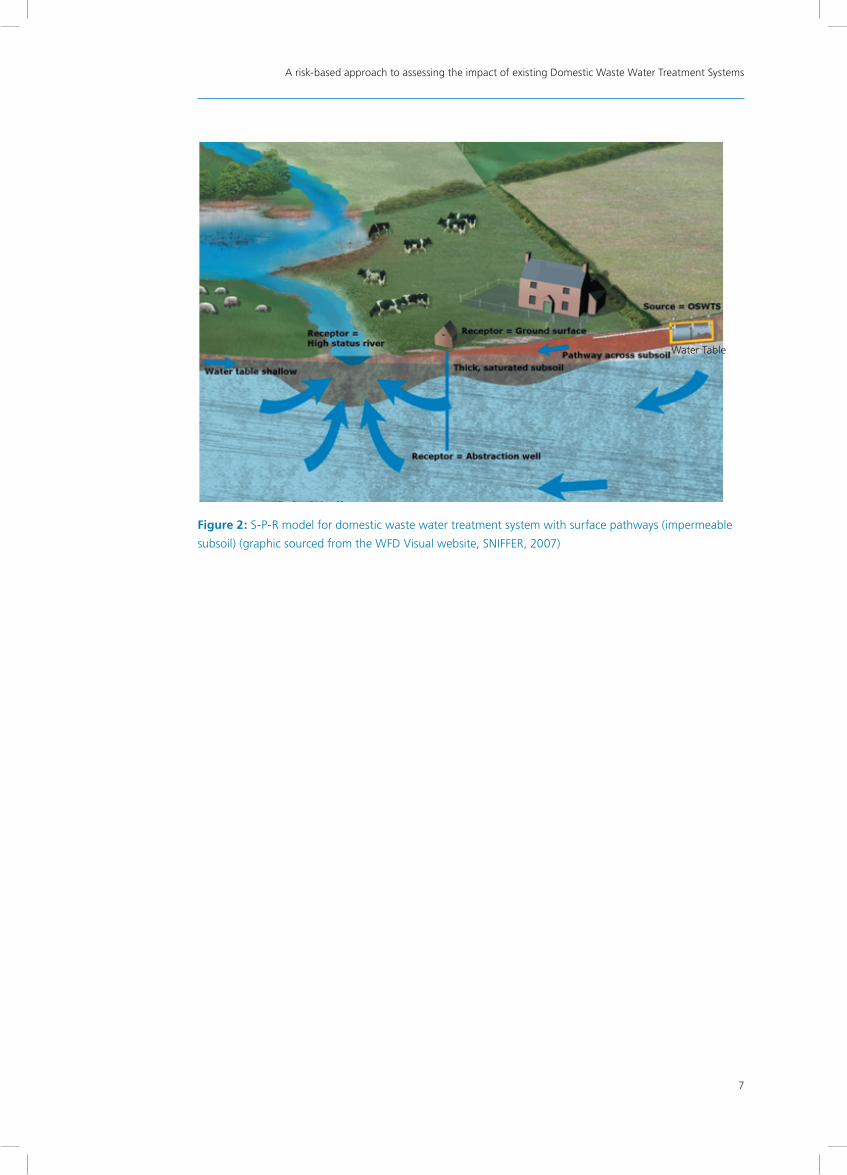
2 represents a situation where a properly installed and maintained DWWTS will not impact on the water
receptors via underground flow due to the protection provided by the subsoils underlying the percolation
area. However, if the permeability of the subsoil is sufficiently low that adequate percolation cannot occur,
ponding of DWWTS discharge at the surface is likely, with a consequent threat to human health. In such
a situation, effluent can also flow ‘downhill’ in the more permeable topsoil, could enter wells down the
outside of well casings where well protection may be inadequate, and typically will enter nearby ditches or
streams, maintaining a water impact especially during lEvery DWWTS carries a degree of risk of impacting
on water quality and receptors. In many cases, the risk may be low or manageable through well sited,
designed and managed systems. In other cases, the discharge activity can pose a significant threat to human
health, groundwater or surface water quality and related receptors.
It is relatively easy to develop a conceptual model of a surface water flow system around a DWWTS from
a topographic map and a site walkover survey. It is more difficult to obtain a similar, site-specific image
for groundwater flow because groundwater is not visible. Changes in the geology in three dimensions
will influence the volume and velocity of groundwater flows, as well as groundwater levels, directions and
chemistry. The S-P-R model for environmental management presents a basis for a conceptual model of both
the groundwater and surface water flow systems.

Domestic Waste Water Treatment Systems — Risk Ranking
6
Figure 1: S-P-R model for domestic waste water treatment system with subsurface pathways (permeable
subsoil) (graphic sourced from the WFD Visual website, SNIFFER, 2007)1
In order to assess fully the impact of a DWWTS at a site, it is necessary to have a credible conceptual
model to determine the potential pathways underground, and to assess the risk to down-gradient receptors.
In particular, it is important to realise that a two-dimensional ‘plan view’ is not adequate for assessing
the risk posed by an existing DWWTS, as groundwater flow systems consist of flows in three dimensions
underground. Changing conditions through time also need to be taken into account.
When examining S-P-R relationships, the main questions to be considered are:
◆ Source characterisation – how significant is the potential discharge (input) from the DWWTS, and
what volume of wastewater is involved? What are the pollutants of concern? What is the density of
systems in the area? What is the nature and condition of these systems?
◆ Pathways analysis – how and where would the pollutants flow, and to what extent would the
pollutants be expected to attenuate? Is there a hydrogeological or hydrological link that can deliver a
pollutant source to a nearby receptor?
◆ Receptor identification – who or what would potentially be affected? Receptors may be of different
types, and may be linked to a source via different pathways. Are any wells present nearby and down-
gradient of the DWWTS? Are there any particularly sensitive ecosystems nearby?
These three elements are dealt with in more detail in the following sections.
Water Table
1 OSWTS is the acronym for ‘on-site wastewater treatment system’ and can be used interchangeably with DWWTS.
A risk-based approach to assessing the impact of existing Domestic Waste Water Treatment Systems
7
Figure 2: S-P-R model for domestic waste water treatment system with surface pathways (impermeable
subsoil) (graphic sourced from the WFD Visual website, SNIFFER, 2007)
Water Table

Domestic Waste Water Treatment Systems — Risk Ranking
8
3. Source CharacteristicsThe pollution source is characterised by its location, size, quantity, and type. Key source descriptors for
domestic waste water include information on its composition, discharge rate and resulting load to both
surface water and groundwater.
3.1 Domestic Waste Water Quality
The quality of domestic waste water is summarised in Table 1. The discharge from the tank component of
conventional septic tank systems and secondary treatment systems poses a hazard to human health and
the water environment, particularly if the waste water ponds on the surface or enters groundwater without
adequate treatment. It is therefore essential that further treatment of this effluent occurs to facilitate safe
disposal.
Table 1: Typical pollutant concentrations that arise from DWWTSs, per household (after Ó Súilleabháin,
2004 and Gill et al., 2005)
Pollutant Conventional Septic Tank Secondary Treatment Tank
Faecal Coliforms >1 million/100 ml >5,000–10,000/100 ml
Nitrogen (mg/l N) 30–80 20–35
Phosphorus (mg/l P) 5–20 1–5
Biochemical Oxygen Demand
(BOD) (mg/l)
150–500 20–50
Where DWWTSs are not properly located, designed, installed, operated and managed they pose a risk
to the homeowner’s health through possible contamination of their own or their neighbour’s well or by
resulting in effluent ponding in their gardens, thus restricting the play activities of their children or pets. In
addition to the risk posed to human health, malfunctioning DWWTS pose a risk to our watercourses and
therefore may result in impact on fishing, bathing waters and other amenities. It is essential that adequate
treatment of this effluent occurs before safe disposal by percolation.
Typically there are more than 1 million coliform bacteria (includes faecal coliforms) in 100 ml of effluent
from a septic tank serving a normal household, while the drinking water standard is zero. Also, in general a
DWWTS emits 0.5 kg phosphorus/person per year and that is enough to pollute 14.5 million litres of water.
The main pollutants in waste water dealt with in this report are microbial pathogens, phosphorus and
nitrogen.
3.2 Microbial pathogens
Microbial pathogens are bacteria, viruses and protozoa which can cause gastroenteritis, polio, hepatitis,
meningitis and eye infections, among others. The occurrence of faecal indicator organisms (FIOs) such
as E. coli, enterococci, streptococci and faecal coliforms, with the same enteric origin as other microbial
pathogens, indicates whether these pathogens may be present in waste water. The drinking water standard
for E. coli and coliform bacteria is zero.
Source Characteristics
9
3.3 Phosphorus
Phosphorus is the major limiting factor for plant growth in many freshwater ecosystems. The addition of
phosphorus encourages algal growth, depletes dissolved oxygen, and causes algal blooms in lakes and fish
kills in rivers. Phosphorus is the main cause of eutrophication in rivers and lakes in Ireland.
For the purposes of this report, molybdate reactive phosphorus, or MRP, which is often used as a measure
of the soluble reactive inorganic phosphorus in water, is taken as the primary phosphorus pollutant arising
from DWWTSs.
3.4 Nitrogen
The percolation process converts nitrogen and ammonia from organic matter almost entirely into nitrite
and then to nitrate. Nitrate, unlike ammonium, is mobile in the ground and therefore is a good indicator of
contamination. Reduction of nitrate concentrations in groundwater occurs primarily through dilution, both
by recharge from rainfall and, where background nitrate concentrations are low, by groundwater. In certain
hydrogeological settings in Ireland, denitrification can occur (see Appendix 2).
In this report, nitrate is taken as the main nitrogen pollutant, although in some circumstances ammonium
from DWWTSs also causes water pollution.
3.5 Volumes of Waste Water Generated by DWWTSs
DWWTSs accept waste water from toilets, showers, sinks, wash hand basins, washing machines and
dishwashers. The greater the population of the dwelling, the greater is the volume of waste water produced.
In order to calculate the waste water capacity for any DWWTS, it is assumed that a typical daily hydraulic
loading for each person is 150 litres, as stated in the CoP (2009).
3.6 Pollutant Load
The pollutant load is derived from multiplying the hydraulic loading from the number of people by the
average pollutant concentrations. Further details are given in Section 6.2.

Domestic Waste Water Treatment Systems — Risk Ranking
10
4. Surface and subsurface pathwaysThe pathway is the link between the source of pollution and the receptor, and can be either at or close
to the surface or underground, or a combination of the two. Natural vertical and horizontal pathways for
effluent migration are determined by the on-site subsurface geology, particularly the nature of the soils,
subsoils and underlying aquifers. Artificial pathways may include drainage ditches, land drainage pipes and
stream culverts.
4.1 Understanding and Using the ‘Pathway’ Concept
Understanding and taking account of the pathways through which pollutants from a site move towards a
receptor creates a 3-D conceptual understanding of water presence and movement at a site, and is critical
to:
◆ assessing the link between DWWTS and impacts;
◆ locating critical source areas that contribute contaminant load;
◆ predicting the likelihood of an impact;
◆ describing ‘why’ there could be or has been an impact;
◆ locating any monitoring that may be required;
◆ enabling monitoring data to be understood and assessed;
◆ enabling ‘responses’ to the risk or appropriate ‘measures’ to be derived and implemented.
There is often a danger that the critical role of the characteristics of the ‘environmental pathway’ may
be forgotten about, as emphasis may tend to be put on (1) the system itself, its type and workings, and/
or (2) monitoring/impact data. Encouraging greater consideration of the ‘pathway’ elements can prevent
important factors from being missed, such as:
◆ the possible role of the subsurface pathway in both attenuating pollutants and transmitting pollutants
to receptors; for instance, rivers and wells; and/or
◆ the role of hydrogeological information/maps in helping understand ponding, runoff and percolation
rates and in predicting impacts.
4.2 Characteristics of Surface and Subsurface Pathways
The effluent that leaves a DWWTS may receive a degree of attenuation in the environment depending on
the soil/subsoil/bedrock properties along the pathway to the water environment.
Pathway characteristics are determined from hydrological and hydrogeological information accessed from
various data sources, as well as site walkover surveys and site investigations. Key pathway descriptors include
subsoil type and permeability; wet or dry soil type; and aquifer type and hydraulic properties. While slope
can be a factor in certain circumstances, it has not been included in the methodology outlined in this report.

Surface and subsurface pathways
11
4.2.1. Data Availability
Table 2 outlines the main regional-scale pathway components – all of which have been mapped and are
available in national GIS data layers – and summarises their characteristics and relevance.
Table 2: Examples of relevant characteristics of pathways interacting with wastewater following initial
treatment, and their implications (adapted from Table 2 of WGGW, 2005a)
Component Factor Relevant ‘Intrinsic’
Characteristic
Implication Water Receptor at
Risk
Soil ‘Wet’ (gley) soils
‘Dry’ (brown
earth etc.)
‘Organic’
Low permeability
Moderate/high
permeability
Low permeability
Rapid runoff
Leaching of
pollutants, e.g. NO3
and P
High % of runoff
Surface water
Groundwater and
surface water
Surface water
Subsoil SAND2 and
GRAVEL
CLAY
Depth to bedrock
High permeability
Low permeability
Bedrock at or near
(<0.6 m) the surface
Leaching of
pollutants, e.g. NO3
Rapid runoff
a) No protection of
groundwater
b) Rapid runoff if
low permeability
Groundwater and
surface water
Surface water
Groundwater and
surface water
Groundwater
vulnerability
‘Extreme’ and
‘High’
‘Low’
Rapid transit time
Slow vertical
transit time and
groundwater
recharge
High attenuation
High leaching
potential
Minimal leaching
potential and often
rapid runoff
Groundwater and
surface water (via
groundwater)
Surface water
Aquifer flow
regime
Poor aquifers
Regionally
important
aquifers
Karst aquifers
Sand/gravel
aquifers
Short underground
flowpaths
Denitrification
Long underground
flowpaths
Point recharge
Rapid infiltration
Attenuation
High surface
drainage density
possible
Low surface
drainage density
Pollutants can reach
receptor quickly
Mobility of NO3
Phosphate
Surface water
Groundwater and
surface water (via
groundwater)
Groundwater and
surface water (via
groundwater)
Groundwater and
surface water (via
groundwater)
2 See Table 3 and British Standards: BS5930 (1999) methodology.
Domestic Waste Water Treatment Systems — Risk Ranking
12
Component Factor Relevant ‘Intrinsic’
Characteristic
Implication Water Receptor at
Risk
Karstification Point recharge Presence of swallow
holes and bare rock
No retardation of
contaminants
Groundwater and
surface water (via
groundwater)
Topography Slope Gradient Rate of runoff Surface water
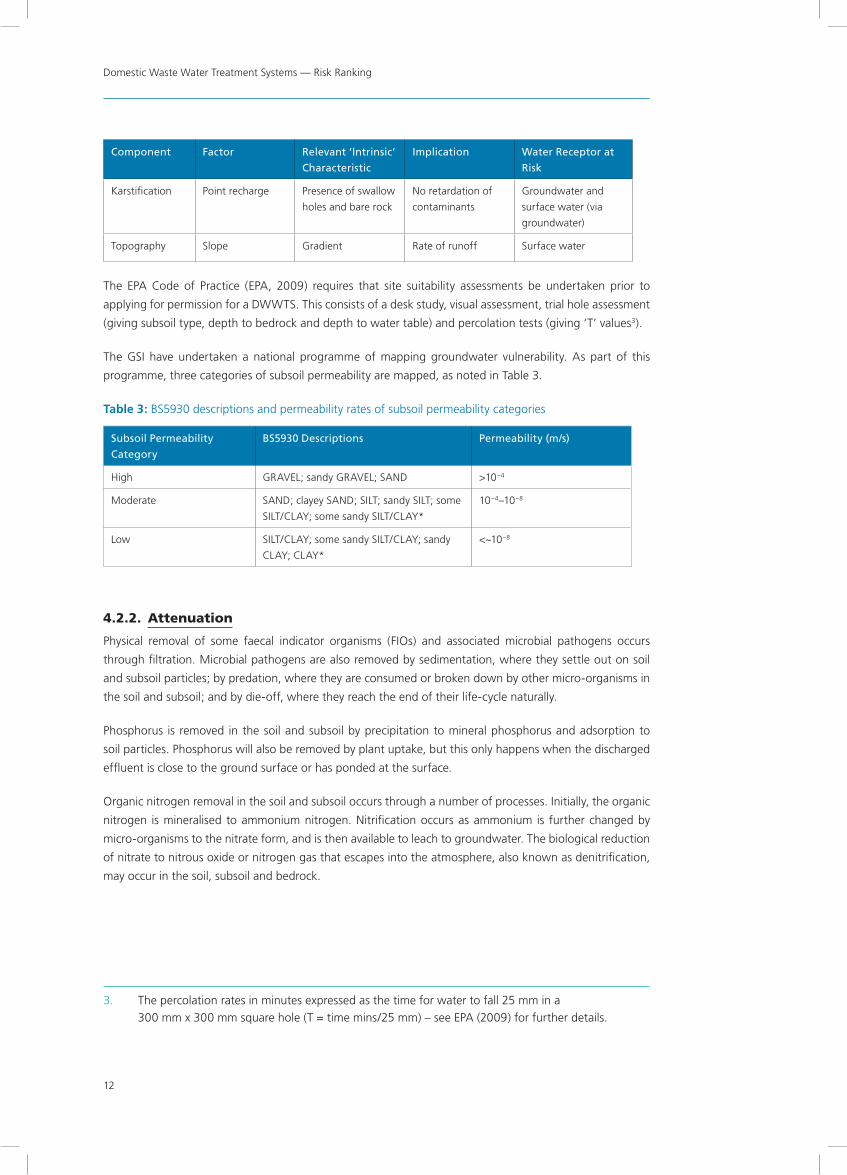
The EPA Code of Practice (EPA, 2009) requires that site suitability assessments be undertaken prior to
applying for permission for a DWWTS. This consists of a desk study, visual assessment, trial hole assessment
(giving subsoil type, depth to bedrock and depth to water table) and percolation tests (giving ‘T’ values3).
The GSI have undertaken a national programme of mapping groundwater vulnerability. As part of this
programme, three categories of subsoil permeability are mapped, as noted in Table 3.
Table 3: BS5930 descriptions and permeability rates of subsoil permeability categories
Subsoil Permeability
Category
BS5930 Descriptions Permeability (m/s)
High GRAVEL; sandy GRAVEL; SAND >10–4
Moderate SAND; clayey SAND; SILT; sandy SILT; some
SILT/CLAY; some sandy SILT/CLAY*
10–4–10–8
Low SILT/CLAY; some sandy SILT/CLAY; sandy
CLAY; CLAY*
<~10–8
4.2.2. Attenuation
Physical removal of some faecal indicator organisms (FIOs) and associated microbial pathogens occurs
through filtration. Microbial pathogens are also removed by sedimentation, where they settle out on soil
and subsoil particles; by predation, where they are consumed or broken down by other micro-organisms in
the soil and subsoil; and by die-off, where they reach the end of their life-cycle naturally.
Phosphorus is removed in the soil and subsoil by precipitation to mineral phosphorus and adsorption to
soil particles. Phosphorus will also be removed by plant uptake, but this only happens when the discharged
effluent is close to the ground surface or has ponded at the surface.
Organic nitrogen removal in the soil and subsoil occurs through a number of processes. Initially, the organic
nitrogen is mineralised to ammonium nitrogen. Nitrification occurs as ammonium is further changed by
micro-organisms to the nitrate form, and is then available to leach to groundwater. The biological reduction
of nitrate to nitrous oxide or nitrogen gas that escapes into the atmosphere, also known as denitrification,
may occur in the soil, subsoil and bedrock.
3. The percolation rates in minutes expressed as the time for water to fall 25 mm in a 300 mm x 300 mm square hole (T = time mins/25 mm) – see EPA (2009) for further details.

Surface and subsurface pathways
13
Nitrate will also be removed by biological oxidation and plant uptake, again only where the discharged
effluent is close to the surface. When nitrate reaches the groundwater, it moves freely. Reduction of nitrate
concentrations in groundwater may occur, however, primarily through dispersion and dilution, although this
depends on the background nitrate concentrations.
4.3 Pathway Susceptibility
‘Pathway susceptibility’ is a measure of the degree of attenuation between source and receptor. It is a
measure of the ability of the pathway factors to reduce the impact of a pressure, in terms of: time to
reach the receptor; proportion of pollutant load reaching the receptor; pollutant concentration level in the
receptor; and duration of the pollution event.
The pathway susceptibility concept has been used previously in the Irish context in the derivation of risk
matrices for groundwater in Ireland by the Working Group on Groundwater (WGGW, 2005a, 2005b).
In this report, the ‘pathway susceptibility’ concept has been applied specifically to discharges from DWWTSs.
Keeping in mind the purposes of this document, only three pollutants arising from DWWTSs were considered
– microbial pathogens, MRP and nitrate.
Pathway susceptibility is based on combinations of the following maps that capture the relevant
hydrogeological properties of an area:
◆ soil type;
◆ subsoil permeability;
◆ groundwater vulnerability4; and
◆ aquifer category5.
Four categories of susceptibility are used: ‘very high’, ‘high’, ‘moderate’ and ‘low’. Generally, the categories
of most concern are ‘very high’ and ‘high’.
4.4 Factors Influencing Surface Water Susceptibility to Contamination
Surface water receptors are at risk where there is inadequate percolation in the ground for the waste water
arising from DWWTSs. This can arise both from poorly constructed drainage fields and (more likely) from
low-permeability subsoil and bedrock.
4. ‘Groundwater vulnerability’ is the term used to represent the intrinsic geological and hydrogeological characteristics that determine the ease with which groundwater may be contaminated by human activities. Maps at 1:50,000 scale have been produced based on mapping (i) subsoil permeability, (ii) subsoil thickness and (iii) karst features. Further information can be obtained in the Groundwater Protection Schemes Report (DELG/EPA/GSI, 1999).
5. For more information on aquifer categories, see DELG/GSI/EPA (1999)
Domestic Waste Water Treatment Systems — Risk Ranking
14
In areas where there is inadequate percolation, the combination of rainwater and DWWTS waste water can
result in saturation of the soil and subsoil and, at times, in ponding and breakout of untreated or partially
treated effluent at surface, backup of sewage in pipes, odour issues, and the potential for insects and
vermin. In short, the effluent cannot drain away and this situation poses a general risk to human health and
surface water, both on the site itself and in drains and streams around the site.
Where wet (gleyed) soils occur and where inadequate percolation exists in subsoil layers, the vast majority
of pathway attenuation processes are limited, as effluent cannot enter the subsurface environment. Some
attenuation of contaminants does occur where there is ponding of discharge, but only via small amounts of
nitrate and phosphorus being taken up by plant roots. Also, predation and die-off of pathogens can occur.
In many circumstances, effluent enters directly into ditches and streams with no attenuation other than
dilution in the surface water receptor. In other circumstances, ponded effluent may become flushed during
subsequent storm flows and be mixed with other diffuse signals of pollution runoff.
The main factors influencing inadequate percolation in the subsurface, and therefore the susceptibility of
surface water to contaminants, are as follows.
◆ The subsoil type on the site: if an area has subsoil with a high proportion of CLAY, this material
does not have sufficiently large pore spaces within it to allow water to flow through it. CLAY is, by its
very nature, a low-permeability material. Examples of areas where CLAY subsoil dominates include the
north central and northeastern portions of the country.
◆ The type of bedrock under the site: if soil and subsoil depth is relatively shallow and the bedrock is
of low permeability, the rock has few significant fractures within and therefore water ‘backs up’ in the
subsurface over time, resulting in a waterlogged landscape with a dense network of streams. Examples
include the uplands of the west and northwest of the country.
◆ The landscape setting: if a portion of land is in a low-lying area within the landscape, where the
water table is close to the surface for all or part of the year, there may not be enough depth of ‘dry’ soil
and subsoil to allow percolation to occur. Examples throughout Ireland occur along the floodplains of
rivers, areas reclaimed from bogs, and other flat, low-lying portions of the landscape.
4.5 Factors Influencing Groundwater Susceptibility to Contamination
The factors influencing the susceptibility of groundwater to contamination by pollutants arising from
DWWTSs are:
◆ the thickness and permeability of the subsoil;
◆ the type of soil (whether wet or dry);
◆ the type of aquifer (whether bedrock or sand and gravel); and
◆ whether or not the bedrock enables denitrification.
Where only a shallow cover of soil/subsoil over bedrock exists on a site with an existing DWWTS, elevated
levels of nitrate, MRP and FIOs/pathogens in the underlying groundwater may result. Such cases occur where
bedrock is within 1–2 m of the surface and preferential flowpaths in soil and subsoil take the contaminants
rapidly towards groundwater below. In these areas, the attenuation processes of filtration, sedimentation,

Surface and subsurface pathways
15
cation exchange, adsorption, precipitation and biological oxidation, which remove contaminants where soil
and subsoil treat wastewater effectively, are limited, as there is an insufficient depth of soil and subsoil on
sites to allow them to occur effectively.
In cases such as these, discharge to ground may be acceptable, but only through site remediation works
such as the importation of suitable soil/subsoil to enable construction of an adequate percolation area or
polishing filter. Historically, this was not often completed as the percolation on-site was adequate and the
processes that treat the wastewater in the subsoil before it reaches groundwater were not recognized or
not taken into account.
In some situations around Ireland where DWWTSs have been installed without an adequate depth of
suitable subsoil to remove pathogens and MRP by the processes outlined above, there is little protection
of groundwater. In circumstances such as these, a high density of DWWTSs may also pose a threat to
surface water receptors as groundwater provides a high proportion of surface water flow in dry weather. In
addition, pollution of nearby wells by FIOs and associated microbial pathogens can occur.
Some rock types have high levels of pyrite and other minerals which can lead to denitrifying conditions
within the bedrock itself and thus natural removal of nitrate (see Appendix 2). Therefore, even where there
is a high density of DWWTSs, nitrate concentrations are not likely to be increased significantly in these areas.
In most areas of Ireland, however, the bedrock does not have a natural capacity to reduce nitrate
concentration in groundwater. Consequently, in areas where there is adequate percolation, there may be
small, localized plumes of relatively high nitrate, particularly where the density of DWWTSs is high. This
scenario is especially of concern where nearby private wells are sources of drinking water, and where there
are sensitive groundwater terrestrial ecosystems nearby.

Domestic Waste Water Treatment Systems — Risk Ranking
16
5. Classifying pathway susceptibility
5.1 Introduction
As all effluent from DWWTSs poses a threat to human health and the environment, whether the DWWTSs
are properly constructed or not, the key factor in assessing the degree of potential impact is ‘pathway
susceptibility’. This section describes the considerations that are taken into account when combining the
soils, subsoil permeability, groundwater vulnerability and aquifer national data layers in order to derive the
‘pathway susceptibility’ category (i.e. ‘very high’, ‘high’, ‘moderate’ and ‘low’) for effluent from DWWTSs.
The way in which these data layers are combined is illustrated in the ‘susceptibility matrices’ (Appendix 1). By
combining these national data layers in a GIS, the resulting pathway susceptibility category can be displayed
as simple, colour-coded risk assessment maps.
The susceptibility matrices were developed in the context of two overarching environmental scenarios:
◆ inadequate percolation, which may result in surface ponding of effluent, bypass directly to surface
water and the associated threats to human health and surface water quality, and
◆ insufficient attenuation (subsurface treatment of the effluent), which may result in directly
polluting groundwater/drinking water supplies (wells and springs), and/or indirectly impacting on
surface water.
This report only considers pathway susceptibility with respect to microbial pathogens, MRP and nitrate.
5.2 Inadequate Percolation
The presence of inadequate subsurface percolation at any point in the landscape is determined by the
soil, subsoil and bedrock permeability (as indicated by aquifer category). The different scenarios that are
likely to result in inadequate percolation are outlined in Table A1, Appendix 1. The main considerations are
summarised below.
◆ In areas of ‘extreme’ groundwater vulnerability (i.e. soil/subsoil <3 m thick), the subsoil permeability can
be very heterogeneous and therefore is not classified by the Geological Survey of Ireland. In these areas,
the likelihood of inadequate percolation is determined by evaluating the aquifer type (an indication of
permeability) and the drainage class of the topsoil, as shown in Table A1, Appendix 1.
◆ Where soil/subsoil is greater than 3 m thick, subsoil permeability (‘high’, ‘moderate’ or ‘low’) (see Table
3 for details) and soil types (‘wet’ or ‘dry’) determine the likelihood of inadequate percolation.
◆ Where the percolation ‘T’ test results on a site are found to be greater than 90, the site is deemed to
be unsuitable for discharge of treated effluent to ground owing to inadequate percolation. The value
of 90 means that it takes greater than 5 hours for water to drop 100 mm (or 4 inches) in a percolation
test hole. In this situation, the principal subsoil types recorded in trial holes are usually CLAY or SILT/
CLAY. T > 90 corresponds to a ‘low’ subsoil permeability.

Classifying pathway susceptibility
17
The likelihood of inadequate percolation arising at a site is subdivided into four categories – low, moderate,
high and very high (Table A1, Appendix 1). Based on an evaluation of the hydrogeological settings outlined
in Table A1 and practical site assessment experience, the probability of finding inadequate percolation or
inadequate depth to water table within these categories is given in Table 4.
Table 4: The probability of finding inadequate percolation for each susceptibility category
Susceptibility Category Probability of Finding Inadequate Percolation
within the Category
Low <5% of sites
Moderate Approximately 25% of sites
High Approximately 50% of sites
Very High >80% of sites
In all cases, these figures represent the average within a range. Also, the mapping scale (approximately
1:40,000) will not have enabled local variations to be captured.
Groundwater discharge zones, low-lying areas and areas with a low slope gradient may have groundwater
levels close to surface in winter and may have water table constraint issues. Many of the wet soils, and thus
areas with inadequate percolation, in high or moderate permeability subsoil areas occur in such localities
and will therefore indicate such zones; however, shallow groundwater table is not mapped and therefore is
not directly included in this risk assessment.
By combining the available data layers as outlined in Table A1, Appendix 1, a national map of the likelihood of
inadequate percolation has been derived. This is shown in Figure 3 for illustration purposes. The proportion
of the country in each category is given in Table 5. The overall proportion of the country with inadequate
percolation is estimated to be 39% – this proportion is derived by applying the probabilities given in Table
4. A corresponding summary for County Meath is presented in Table 6 as an example at a county scale.
Table 5: National summary of areas within each susceptibility category and the overall likelihood of
finding inadequate percolation
Susceptibility Category Percentage (%) Land
Area
Overall National Likelihood of
Inadequate Percolation (%)
Low 25.8
39Moderate 25.7
High 22.0
Very High 25.2
Made Ground 1.3
Domestic Waste Water Treatment Systems — Risk Ranking
18
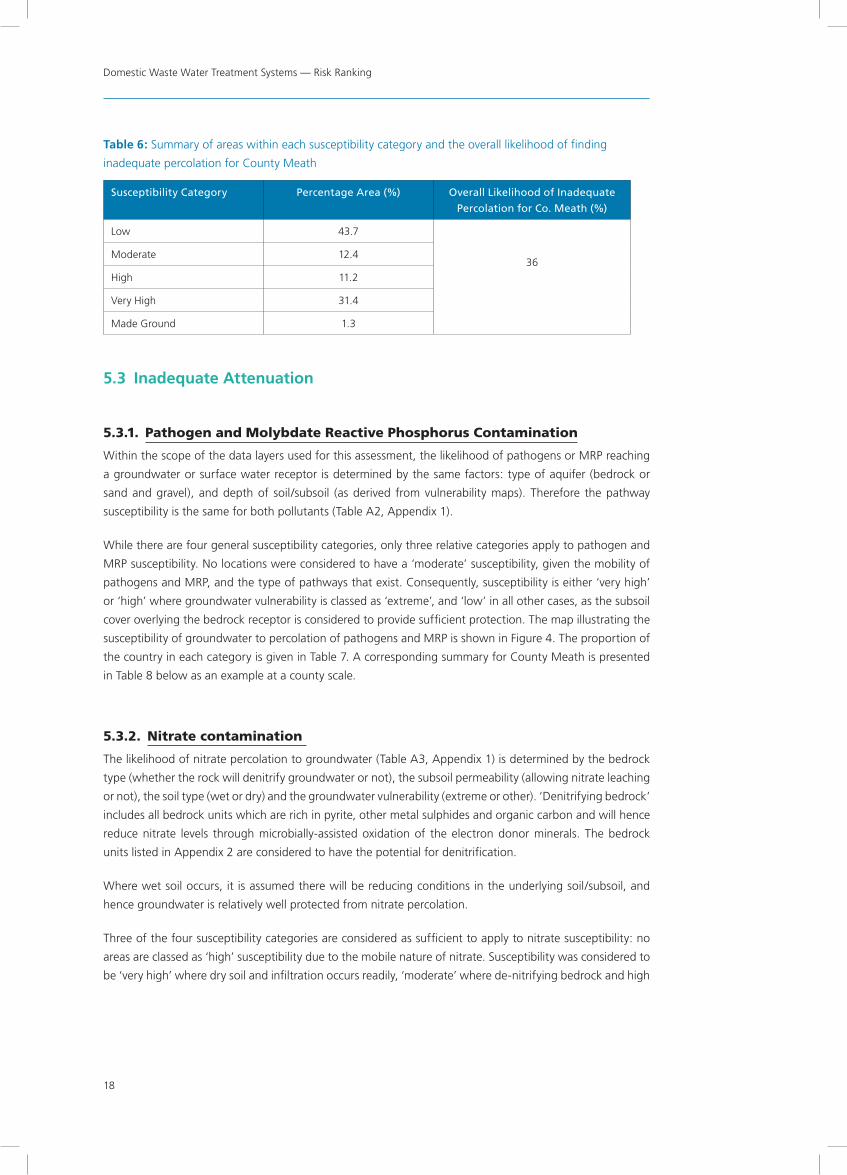
Table 6: Summary of areas within each susceptibility category and the overall likelihood of finding
inadequate percolation for County Meath
Susceptibility Category Percentage Area (%) Overall Likelihood of Inadequate
Percolation for Co. Meath (%)
Low 43.7
36Moderate 12.4
High 11.2
Very High 31.4
Made Ground 1.3
5.3 Inadequate Attenuation
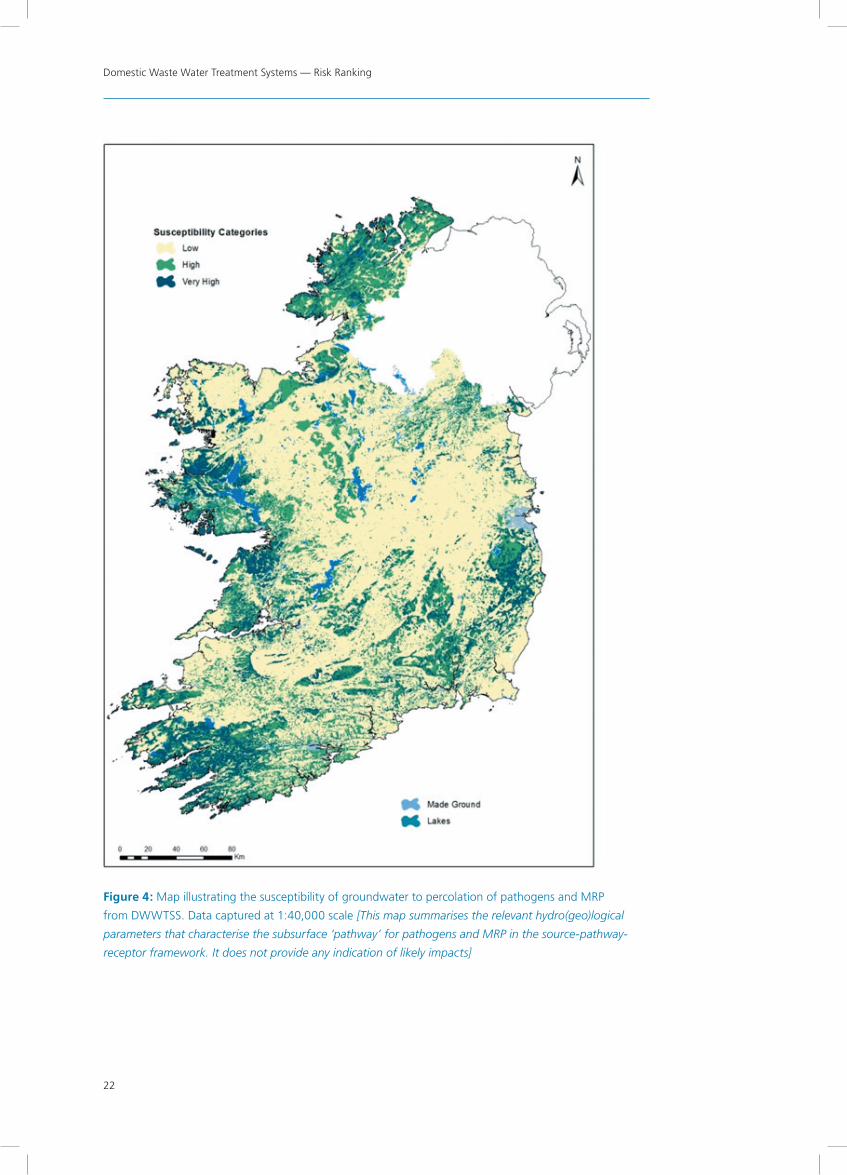
5.3.1. Pathogen and Molybdate Reactive Phosphorus Contamination
Within the scope of the data layers used for this assessment, the likelihood of pathogens or MRP reaching
a groundwater or surface water receptor is determined by the same factors: type of aquifer (bedrock or
sand and gravel), and depth of soil/subsoil (as derived from vulnerability maps). Therefore the pathway
susceptibility is the same for both pollutants (Table A2, Appendix 1).
While there are four general susceptibility categories, only three relative categories apply to pathogen and
MRP susceptibility. No locations were considered to have a ‘moderate’ susceptibility, given the mobility of
pathogens and MRP, and the type of pathways that exist. Consequently, susceptibility is either ‘very high’
or ‘high’ where groundwater vulnerability is classed as ‘extreme’, and ‘low’ in all other cases, as the subsoil
cover overlying the bedrock receptor is considered to provide sufficient protection. The map illustrating the
susceptibility of groundwater to percolation of pathogens and MRP is shown in Figure 4. The proportion of
the country in each category is given in Table 7. A corresponding summary for County Meath is presented
in Table 8 below as an example at a county scale.
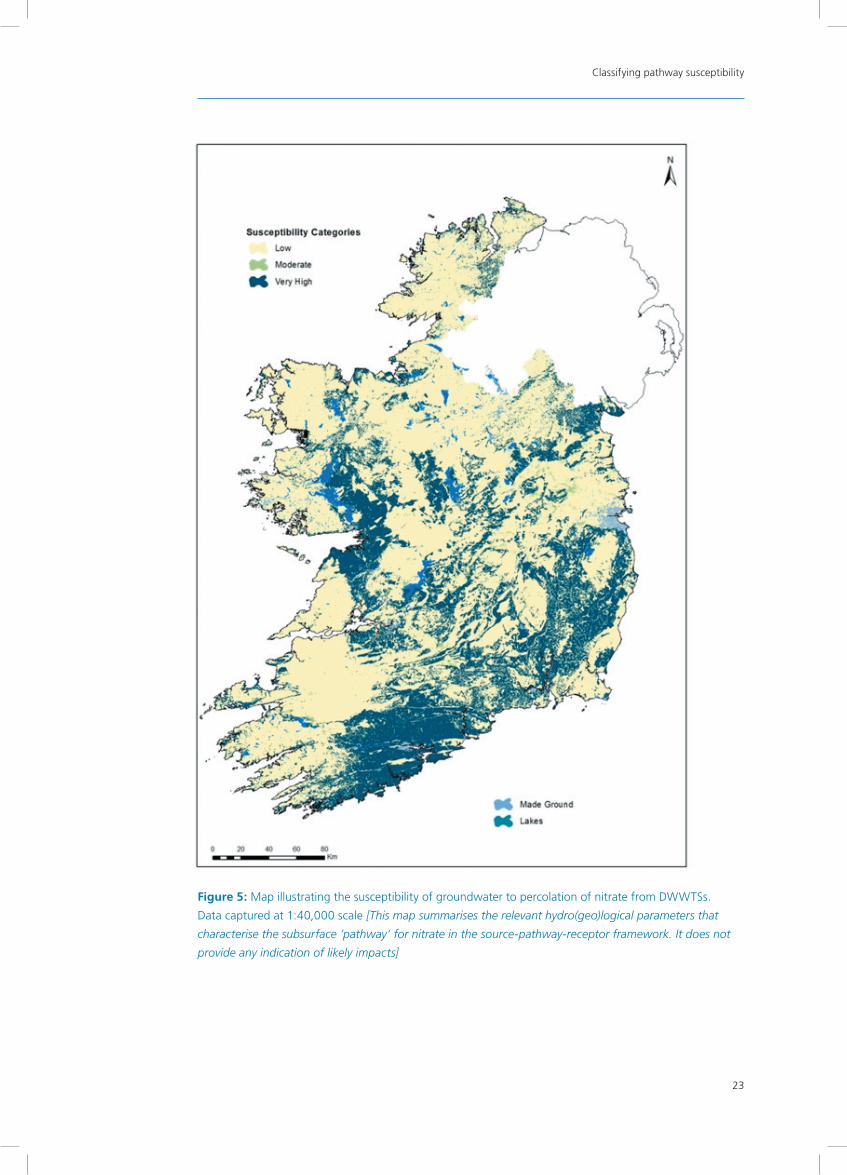
5.3.2. Nitrate contamination
The likelihood of nitrate percolation to groundwater (Table A3, Appendix 1) is determined by the bedrock
type (whether the rock will denitrify groundwater or not), the subsoil permeability (allowing nitrate leaching
or not), the soil type (wet or dry) and the groundwater vulnerability (extreme or other). ‘Denitrifying bedrock’
includes all bedrock units which are rich in pyrite, other metal sulphides and organic carbon and will hence
reduce nitrate levels through microbially-assisted oxidation of the electron donor minerals. The bedrock
units listed in Appendix 2 are considered to have the potential for denitrification.
Where wet soil occurs, it is assumed there will be reducing conditions in the underlying soil/subsoil, and
hence groundwater is relatively well protected from nitrate percolation.
Three of the four susceptibility categories are considered as sufficient to apply to nitrate susceptibility: no
areas are classed as ‘high’ susceptibility due to the mobile nature of nitrate. Susceptibility was considered to
be ‘very high’ where dry soil and infiltration occurs readily, ‘moderate’ where de-nitrifying bedrock and high

Classifying pathway susceptibility
19
permeability subsoils are in evidence, or ‘low’ where wet soils and all other situations overlying de-nitrifying
bedrock are found. The map illustrating the susceptibility of groundwater to percolation of nitrate is given in
Figure 5. The proportion of the country in each category is given in Table 7. A corresponding summary for
County Meath is presented in Table 8 as an example at a county scale.
Table 7: National summary of areas within each category of susceptibility of groundwater to percolation
of pathogens and MRP and to the percolation of nitrate*
Susceptibility Category Percentage Area for Each Susceptibility Category (%)
Percolation of Pathogens/MRP to
GW (%)
Percolation of Nitrate to
GW (%)
Low 61.0 67.8
Moderate n/a 0.7
High 23.1 n/a
Very High 14.6 30.3
Made Ground 1.3 1.3
*Percentages may not sum to 100% due to rounding.
Table 8: Summary of areas within each category of susceptibility of groundwater to percolation of
pathogens and MRP and to the percolation of nitrate for County Meath*
Susceptibility Category Percentage Area for Each Susceptibility Category (%)
Percolation of Pathogens/MRP to GW
(%)
Percolation of Nitrate to
GW (%)
Low 87.1 72.6
Moderate n/a 5.1
High 6.5 n/a
Very High 5.2 21.1
Made Ground 1.3 1.3
*Percentages may not sum to 100% due to rounding.
5.4 Use of Pathway Susceptibility Ranking Maps
The susceptibility maps are designed for general information and strategic planning usage; modelled
evidence and local details have been generalized to fit the map scale, which is approximately 1:40,000.
As these geological and hydrogeological settings are complex in some areas, exceptions can be expected.
The matrices and maps derived apply to the discharge of treated wastewater to ground from DWWTSs only.
They do not reflect risks associated with any other potential environmental issues and thus should not be
used for assessments other than that intended.

Domestic Waste Water Treatment Systems — Risk Ranking
20
5.5 Map Confidence and Forthcoming County Maps
The subsoil permeability map is one of the most critical datasets used for the generation of the map showing
the likelihood of inadequate percolation, as well as the risk of high nitrates, and pathogens/MRP occurring
in groundwater. This map was obtained by the EPA from the Groundwater Section of the Geological Survey
of Ireland (GSI).
Three counties have preliminary work completed on the subsoil permeability across their extents, and
therefore have a slightly lower confidence level than all other counties depicted on the maps. These are
Wicklow, Laois and Kilkenny, which will have updated and revised subsoil permeability maps produced by
the GSI in early 2013.

Classifying pathway susceptibility
21
Figure 3: Map illustrating the distribution of susceptibility categories for inadequate percolation.
Data captured at 1:40,000 scale [This map summarises the relevant hydro(geo)logical parameters that
characterise the surface ‘pathway’ for water in the source-pathway-receptor framework]source-pathway-
receptor framework]
Domestic Waste Water Treatment Systems — Risk Ranking
22
Figure 4: Map illustrating the susceptibility of groundwater to percolation of pathogens and MRP
from DWWTSS. Data captured at 1:40,000 scale [This map summarises the relevant hydro(geo)logical
parameters that characterise the subsurface ‘pathway’ for pathogens and MRP in the source-pathway-
receptor framework. It does not provide any indication of likely impacts]
Classifying pathway susceptibility
23
Figure 5: Map illustrating the susceptibility of groundwater to percolation of nitrate from DWWTSs.
Data captured at 1:40,000 scale [This map summarises the relevant hydro(geo)logical parameters that
characterise the subsurface ‘pathway’ for nitrate in the source-pathway-receptor framework. It does not
provide any indication of likely impacts]

Domestic Waste Water Treatment Systems — Risk Ranking
24
6. Risk characterisation
6.1 Introduction
The purpose of the approach outlined in this section is to rank the risk to human health and surface water
and groundwater quality from DWWTSs, as a means of apportioning the inspections relative to the risk
presented. The general concept is represented graphically in Figure 6.
Figure 6: General concept for determining risk from DWWTS contamination via the surface or subsurface
pathways
The risk characterisation is based on the combination of the following elements:
◆ pollutant load from each DWWTS, derived from typical discharge concentrations and quantities;
◆ pathway susceptibility, which includes consideration of attenuation by physical process, such as dilution,
and biological and chemical processes. Two pathways are considered: surface (i.e. surface water) and
subsurface (i.e. groundwater);
◆ cumulative load entering the surface water or groundwater environment derived from DWWTS density
and estimation of attenuation;
◆ dilution of load at the water receptor;
◆ risk ranking using estimates of predicted pollutant concentrations at the receptor.
A more detailed graphical summary of the method proposed to estimate the risk is provided in Figure
7. Worked examples of the calculations are presented in Appendix 3 and Appendix 4; the examples are
simplified to some degree to demonstrate the methodology used (each 1 km 2 grid is assumed to have
uniform pathway susceptibility – this is not the approach taken in GIS processing, where the pathway
susceptibility at each individual DWWTS was used).

Risk characterisation
25
While the approach used predictions of pollutant concentrations as the basis for the risk ranking, the maps
are not intended to be used for predicting precise impacts; they are intended to show relative risk on which
an inspection regime can be based.
Figure 7: Outline of methodology for risk ranking
6.2 Pollutant Load
The pollutant load is derived by combining typical effluent quantity and quality from each DWWTS.
The average inputs of pathogens, MRP and nitrate from an individual septic tank, prior to treatment in the
subsoil or polishing filter, are given in Table 10. These data can enable an estimate of the pollutant load
produced in an area to be calculated by multiplication of the values by the number of systems present there.
6.3 Pathway Attenuation
The pollutant load to water may be reduced by amounts that depend on the various factors that have been
described in Section 5.3 on pathway susceptibility to attenuation. In general terms, the higher the category
of pathway susceptibility, the lower is the degree of attenuation and the greater is the likelihood that
contaminants will enter water.

Domestic Waste Water Treatment Systems — Risk Ranking
26
It should be noted that the risk ranking for MRP also reflects the risk ranking for microbial pathogens, and
therefore the risk to human health.
Table 10: Data sources for the calculation of overall load
Input Parameter Input Value Data Source
Pathogen Load (E. coli) 5,000–1 million per 100 ml Gill et al., TCD Research
Phosphate Load in kg per person/year
(in Liquid Discharge leaving Septic Tank)
0.56 Gill et al., TCD Research
Nitrate Load in kg per person/year (in
Liquid Discharge leaving Septic Tank)
2.77 Gill et al., TCD Research
Persons per House 2.8 CSO data
Density of Systems Variable GIS layer created for DWWTS
locations based on use of
Geodirectory and unsewered
areas
6.3.1. Surface Pathway
Where discharges cannot infiltrate underground in areas of inadequate percolation, either many systems are
piped directly to ditches and/or streams, or ponding and overflow into ditches and/or streams occurs. The
inadequate percolation map is used as the basis for calculating the pollutant quantity that either may pond
or is piped to surface water. Using Table 4, 80% of the initial pollutant load is estimated to be present at
the surface or piped away directly to drains and/or streams where the likelihood of inadequate percolation
is ‘very high’, whereas this estimate is only 5% where the likelihood of inadequate percolation is ‘low’. All
effluent not directed to surface water is assumed to move via the subsurface pathway noted below and
attenuated accordingly.
Where effluent ponds or is piped to ditches/streams, it is likely that there will be some removal of MRP and
nitrogen, for instance uptake by plants growing in the ponded areas, attenuation as a proportion of the
effluent moves through the topsoil or some percolation in dry weather. An arbitrary pollutant reduction
factor of 25% is taken to account for a best estimate attenuation in the immediate vicinity of the percolation
area. Evidence from future research will be used to refine the risk methodology.
Table 11 summarises the factors used in estimating the pollutant load entering surface water via the surface
pathway from each DWWTS in any area.
6. Compares with SRP loads cited by Withers et al. (2011) of 0.38 kg/yr in and 0.44 kg/yr in Britain and Northern Ireland, respectively.
7. Compares with total dissolved nitrogen loads cited by Withers et al. (2011) of 2–4 kg/yr in the USA, UK and Netherlands.

Risk characterisation
27
6.3.2. Subsurface Pathway
The factors applied to enable an estimation of attenuation in the geological materials as discharged
effluent percolates underground are given in Table 12. Therefore, it is assumed, for instance, that where the
susceptibility of groundwater to percolation of microbial pathogens and MRP is ‘low’, no pathogens or MRP
will reach groundwater. Where the susceptibility is high (see Table A2 for physical setting), it is assumed
that the effluent will percolate through at least 1 m of subsoil, with a consequent significant reduction of
MRP concentration (this is based on research by Gill et al. (2009)). Where the susceptibility is very high, little
attenuation of MRP is considered to occur.
With regard to nitrate, significant attenuation in the biomat is assumed to occur; this reduces the loading
proportions given in Table 12.
Table 11: Factors applied to estimate contaminant load from individual DWWTS reaching surface water by
the surface pathway
Surface Water Pathway Input Value Data
Source
Comment
% of Load leaving
Septic Tank that will
reach receptor8
LOW Susceptibility 5
Risk
Matrices
These figures relate to the
likelihood of finding inadequate
depth to water table or
inadequate percolation as
noted in Table 4
MODERATE Susceptibility 25
HIGH Susceptibility 50
VERY HIGH Susceptibility 80
Second factor applied for reduction in overland flow
Overland Flow (Pathogens/MRP
and Nitrate)
75
(% of Load that will
NOT be removed in
overland flow)
Estimate
This is a best estimate – some
DWWTSs will be piped directly
to streams with 100% of load
reaching surface water; in
other scenarios attenuation
may occur during ponding,
reinfiltration, etc.
6.4 Estimating Cumulative Load and Resultant Concentration
For each 1 km grid square, the load of pollutants calculated to reach the surface water or groundwater
receptor via the surface or underground pathways from individual DWWTSs was summed to estimate the
cumulative load. Dilution of the cumulative load in the environment was then applied to derive an estimated
concentration. The method is described below.
8. Percentages will be a range, with the values averaged here.
Domestic Waste Water Treatment Systems — Risk Ranking
28
6.4.1. Cumulative Load
The density of DWWTSs used to calculate cumulative load was derived by combining information derived
from the An Post’s Geodirectory and the sewered areas as recorded by WRBD (2008). In the unsewered
areas, it is assumed that all houses use DWWTSs. The accuracy of the unsewered areas used in the
methodology outlined in this report will need to be verified at a local level by the Water Services Authorities
when implementing the National Inspection Plan.
A map illustrating the density of systems in unsewered areas in County Meath is shown in Figure 8.
Table 12: Factors applied to estimate contaminant load from individual DWWTS reaching groundwater
Groundwater Pathway Input Value Data Source Comment
% of Load leaving
septic tank that will
reach receptor
LOW Susceptibility for MRP/
Pathogens0
Guidance on the
Authorisation
of Discharges to
Groundwater 9
Note – these
figures apply only
to conventional
septic tanks
No MRP or pathogens
to groundwater at LOW
susceptibility
For nitrate at least 70%
reduction in the biomat
is assumed, giving
maximum input value
of 30%
HIGH Susceptibility for MRP/
Pathogens10
VERY HIGH Susceptibility for MRP/
Pathogens90
LOW Susceptibility for Nitrate 10
MODERATE Susceptibility for Nitrate 15
VERY HIGH Susceptibility for Nitrate 30
6.4.2. Dilution
Once contaminants reach a water receptor, further attenuation will occur due to dilution. The main factor
determining the degree of dilution of the contaminant load in groundwater and surface water is the
estimated effective rainfall at each locality. The approach taken to estimate the degree of dilution is outlined
in Table 13.
With regard to groundwater, the quantity of water in an area providing dilution is derived from the GSI
recharge map. The average annual recharge for each locality is regarded as adequate for the purposes of
this risk ranking procedure.
DWWTSs are likely to have a greater impact on surface water during low flow conditions than at other
flow conditions (Macintosh et al., 2011). This is due to the lower dilution capacity (and thus higher resultant
concentration) at these times. A low flow reduction factor can be applied to the average flow volume in an
attempt to account for low flow conditions. Q90/Q50 is a ratio that is often used as an index of baseflow
contribution. In this case an estimation of Q90/Q50 of 0.22 was applied nationally to average flow to give
an estimation of low flow conditions. The value of 0.2210 was taken as an approximate mid-range value of
the Q90/Q50 that might be expected in Irish conditions.
9. This document can be downloaded from the EPA website, www.epa.ie/whatwedo/advice/wat/guidegw/dischgw
10. Median of Q90/Q50 from EPA’s hydrotool for estimation of flow for ungauged catchments.

Risk characterisation
29
Table 13: Model values used to calculate the volume of water to dilute the nutrient load
Receptor Field Input Value Data Source Comment
Surface water
Effective rainfall
(mm/yr)Variable
Effective rainfall
GIS layer
Low flow factor Variable Hydrotool output
Median of Q90/Q50
from EPA’s tool for
estimation of flow for
ungauged catchments –
0.22 was used in these
calculations
Groundwater Recharge (mm/yr) Variable Recharge GIS layer11
Bedrock recharge
acceptance capacity limit
was not used
6.5 Risk Ranking
The final step in deriving relative risk maps involves calculating the resulting concentrations of MRP and
nitrate entering water from DWWTSs for each 1 km2 area.
It should be noted that the MRP map also reflects the likely presence of microbial pathogens in both surface
water and groundwater, and therefore the risk to human health.
In the case of MRP, where the predicted resulting concentration in either surface water (during arbitrary
baseflow conditions) or groundwater is greater than 0.035 mg/l P – the environmental quality standard
(EQS) that forms the boundary between good and moderate status river water bodies (DEHLG, 2009) – a
ranking of ‘very high’ is given. The ‘high’ category for MRP is based on the EQS that forms the boundary
between high and good status river water bodies (0.025 mg/l P) (see Table 14).
In the case of nitrate, the categories are based on boundaries used by the European Environment Agency
for cross-European comparison (EPA, 2010) (see Table 14).
Table 14: Molybdate reactive phosphorus and nitrate concentrations used in deriving surface pathway
and subsurface pathway risk rankings
Risk Ranking
Low Medium High Very High
Likely MRP Impact
(concentration mg/l P)
<0.015 0.015-0.025 0.025-0.035 >0.035
Likely Nitrate Impact
(concentration mg/l N)
<2 2–3.6 3.6–5.6 >5.6
11. The GSI provided both the effective rainfall and recharge maps.

Domestic Waste Water Treatment Systems — Risk Ranking
30
The MRP and nitrate risk ranking for groundwater as a receptor is the same as for the surface water receptor
as it is based on the concentration of nutrients in groundwater that is delivered to surface water.
While the approach outlined here uses results from the prediction of pollutant concentrations, the maps are
not intended to be used for predicting precise impacts; they are intended to show relative risk on which an
inspection regime can be based.
6.6 Results of Risk Ranking Process
The results are available in GIS data layers produced by the Informatics and GIS Section of EPA and will be
offered to each local authority.12
The following maps for County Meath have been produced to illustrate the results that arise from this
process.
Figure Receptor Pollutant Pathway
9 Surface water Microbial pathogens and MRP Surface
10 Groundwater Microbial pathogens and MRP Underground
11 Surface water Nitrate Surface
12 Groundwater Nitrate Underground
The percentage areas in each relative risk category for County Meath and nationally for the following are
given in Tables 15 and 16, respectively:
◆ relative risk of ponding and pollution of streams by MRP and pathogens via the surface pathway due
to inadequate percolation;
◆ relative risk of pollution of streams and wells by MRP and pathogens via the subsurface pathway due
to inadequate attenuation;
◆ relative risk of pollution of streams by nitrogen via the surface pathway due to inadequate percolation;
◆ relative risk of pollution of streams and wells by nitrogen via the subsurface pathway due to inadequate
attenuation.
These four categories are given for the following reasons.
1. The subdivision into surface and subsurface pathways may influence the approach taken to site
inspections, particularly the visual assessments.
2. The subdivision based on pollutant type enables a better understanding of the threat posed to
human health and the environment.
12. The maps have been produced at a 1:40,000 scale. Further enlargement would potentially be misleading as the spatial resolution of the underlying data is insufficient to show detail beyond this scale. The maps are intended as a guide as to where issues are most likely to occur with respect to inadequate percolation or susceptibility of groundwater to the occurrence of pathogens/MRP or nitrate across the Irish landscape, with respect to existing DWWTSs. The depicted boundaries and interpretations derived from the maps do not eliminate the need for on-site sampling, testing, and detailed study of specific sites.

Risk characterisation
31
Table 15: Percentage areas in the different relative risk categories for County Meath*
Relative risk
category
MRP & Pathogens Nitrate
Streams
via surface
pathway
Streams and wells
via subsurface
pathway
Streams
via surface
pathway
Streams and wells
via subsurface
pathway
Low 50.7 86.8 95.4 95.9
Moderate 10.0 3.5 0.4 0.1
High 6.8 2.0 0.1 0.2
Very High 28.9 4.0 0.5 0.1
Area Sewered 3.6 3.6 3.6 3.6
*Percentages may not sum to 100% due to rounding.
Table 16: Percentage areas in the different relative risk categories nationally*
Relative risk
category
MRP & Pathogens Nitrate
Streams
via surface
pathway
Streams and wells
via subsurface
pathway
Streams
via surface
pathway
Streams and wells
via subsurface
pathway
Low 63.1 89.0 97.2 97.4
Moderate 10.5 4.1 0.2 0.1
High 6.4 1.9 0.1 <0.1
Very High 17.5 2.6 0.1 <0.1
Area Sewered 2.4 2.4 2.4 2.4
*Percentages may not sum to 100% due to rounding.
Two national maps – Figures 13 and 14 – illustrate the relative risk of ponding and pollution of water
by MRP and pathogens via surface and subsurface pathways, respectively. In general, the ‘very high’ risk
ranking category coincides with areas where there is a relatively high density of DWWTSs and either a high
likelihood of inadequate percolation or extreme groundwater vulnerability.
6.7 Next Steps
The output from the risk-based methodology will be used in developing the National Inspection Plan and
in proposing the level of inspection, based on risk. Detailed criteria for site selection, which take account of
sensitive receptors, have been developed for use in conjunction with the risk-based methodology. This will
assist WSAs in identifying areas to focus inspections and achieve the maximum outcome for the environment.

Domestic Waste Water Treatment Systems — Risk Ranking
32
Figure 8: Map of housing density across County Meath
Figure 9: Relative risk of water pollution (streams) from MRP and pathogens in DWWTS waste water via
the surface pathway in County Meath

Risk characterisation
33
Figure 10: Relative risk of water pollution (streams and wells) from MRP and pathogens in DWWTS waste
water via the subsurface pathway in County Meath
Figure 11: Relative risk of water pollution (streams) from nitrogen in DWWTS waste water via the surface
pathway in County Meath
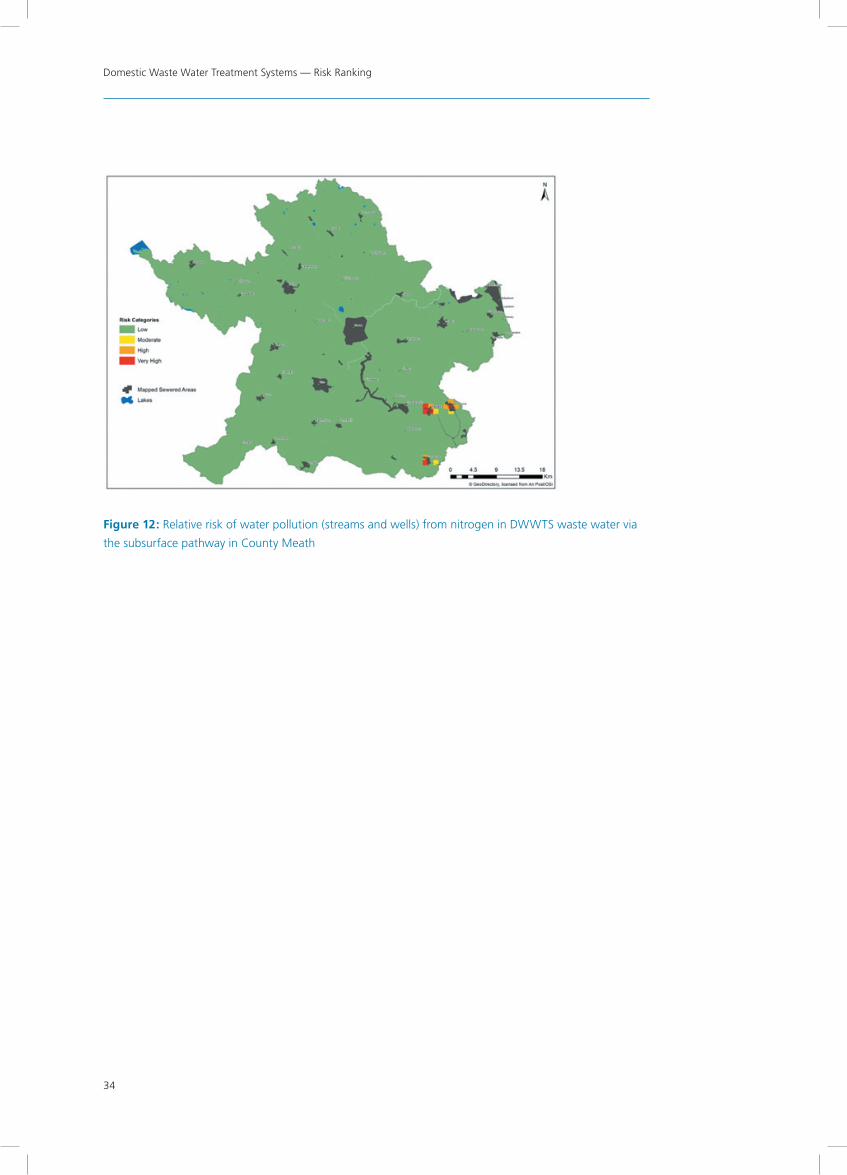
Domestic Waste Water Treatment Systems — Risk Ranking
34
Figure 12: Relative risk of water pollution (streams and wells) from nitrogen in DWWTS waste water via
the subsurface pathway in County Meath

Risk characterisation
35
Figure 13: Relative risk of water pollution (streams) from MRP and pathogens in DWWTS waste water via
the surface pathway

Domestic Waste Water Treatment Systems — Risk Ranking
36
Figure 14: Relative risk of water pollution (streams and wells) from MRP and pathogens in DWWTS waste
water via the subsurface pathway
Summary and Conclusions
37
7. Summary and Conclusions ◆ The aim of this report is to set out a methodology to enable the EPA to adopt a risk-based approach
to organising inspections of DWWTSs, whereby the level of inspection will be proportionate to the risk
posed to human health and the environment.
◆ The development of the methodology was influenced by:
➤ the data and map information available as GIS datasets;
➤ the current understanding of the hydrological and hydrogeological settings present in Ireland;
➤ results of research undertaken in Ireland.
◆ The methodology is based on the source-pathway-receptor (S-P-R) model for environmental
management.
◆ DWWTSs located, constructed and installed in accordance with the best practice guidance generally
provide adequate treatment and disposal of domestic waste water. However, there are areas where
the percolation characteristics are problematical due to the hydrogeology – the properties of the soils,
subsoils and bedrock – resulting in inadequate percolation or over-rapid percolation. The methodology
uses the available information to locate these areas.
◆ The risk ranking outcome is based on calculating the concentration of two pollutants – MRP and nitrate
– in both surface water and groundwater arising from existing DWWTSs.
◆ The results for MRP are considered to reflect the likely presence of microbial pathogens and therefore
the risk to human health from waste water that has not percolated underground.
◆ The approach uses a 1 km2 area as appropriate to evaluating likely impacts from DWWTSs.
◆ The calculations take account of housing density, attenuation in both surface and subsurface pathways,
dilution at the water receptor and predicted concentrations of pollutants in the water receptor.
◆ Four categories of risk are used: low, medium, high and very high.
◆ The results indicate that:
➤ A substantial proportion of the country is problematical with regard to percolation characteristics.
➤ The risk to human health from DWWTS waste water is significantly higher in areas with a high
housing density and inadequate percolation; and/or where there are private wells in vulnerable
areas.
➤ MRP is the main pollutant posing a threat to the environment, particularly to surface water, either
where there is inadequate percolation or where there is inadequate attenuation prior to entry of
waste water into bedrock aquifers, particularly karstified (cavernous limestone) aquifers. While the
cumulative pollutant load arising from DWWTSs will be insignificant compared to urban waste
water treatment systems and agriculture at river basin scale, it can be significant in certain physical
settings at small catchment scale.
◆ The next stage in the National Inspection Plan will be to apportion the level of inspections based on
the risk ranking outcome. While this will be the main basis, account will be taken of sensitive receptors
and the possibility of inadequate design and maintenance of systems in areas generally suitable for
DWWTSs, and random inspections will be undertaken.

Domestic Waste Water Treatment Systems — Risk Ranking
38
8. Glossary
Aquifer
A subsurface layer or layers of rock, or other geological strata, of sufficient porosity and permeability to
allow either a significant flow of groundwater or the abstraction of significant quantities of groundwater
(Groundwater Regulations, 2010).
Attenuation
A decrease in pollutant concentrations, flux, or toxicity as a function of physical, chemical and/or biological
processes, individually or in combination, in the subsurface environment. Attenuation processes include
dilution, dispersion, filtration, sorption, decay, and retardation.
Biomat
A biologically active layer that covers the bottom and sides of percolation trenches and penetrates a short
distance in the percolation soil. It includes complex bacterial saccharides and accumulates organic substances
as well as micro-organisms.
Conceptual Hydrogeological Model
A simplified representation or working description of how a real hydrogeological system is believed to
behave on the basis of qualitative analysis of desk study information, field observations and field data. A
quantitative conceptual model includes preliminary calculations of water balances, including groundwater
flow.
Diffuse Sources
Diffuse sources of pollution are spread over wider geographical areas rather than at individual point
locations. Diffuse sources include general land use activities and landspreading of industrial and municipal
wastes and agricultural organic and inorganic fertilisers.
Domestic Waste Water
Waste water of a composition and concentration (biological and chemical) normally discharged by a
household, and which originates predominantly from the human metabolism or from day-to-day domestic-
type human activities, including washing and sanitation, but does not include fats, oils, grease or food
particles discharged from a premises in the course of, or in preparation for, providing a related service or
carrying on a related trade (Water Services Act, 2007).
Glossary
39
Domestic Waste Water Treatment System (DWWTS)
A system involving physical, chemical, biological or thermal processes, or a combination of such processes,
utilised for the treatment or disposal of domestic waste water, or the sludge derived from domestic waste
water. This includes:
(a) all septic tanks and waste water tanks and systems receiving, storing, treating or disposing of domestic
waste water and all drains associated with such tanks or systems,
and
(b) all drains associated with the discharge of domestic waste water, whether or not they discharge to a
septic tank or waste water tank (i.e. including percolation area or polishing filter).
Down-gradient
The direction of decreasing groundwater levels, i.e. flow direction. Opposite of up-gradient.
Groundwater
All water which is below the surface of the ground in the saturation zone and in direct contact with the
ground or subsoil (Groundwater Regulations, 2010).
Groundwater Dependent Terrestrial Ecosystems (GWDTEs)
These are groundwater dependent wetlands, whereby the dependency is on groundwater flow, level or
chemistry as the controlling factors or qualifying interests of associated habitats. Examples are raised bogs,
alkaline fens and turloughs. GWDTEs are listed on the EPA’s register of protected areas in accordance with
Regulation 8 of the Water Policy Regulations, 2003.
Groundwater Protection Scheme (GWPS)
A scheme comprising two principal components: a land surface zoning map which encompasses the
hydrogeological elements of risk (of pollution); and a groundwater protection response matrix for different
potentially polluting activities (DELG/EPA/GSI, 1999).
Groundwater Recharge
Two definitions: (a) the process of rainwater or surface water infiltrating to the groundwater table; (b) the
volume (amount) of water added to a groundwater system.
Groundwater Resource
An aquifer capable of providing a groundwater supply of more than 10 m3 a day as an average or serving
more than 50 persons.

Domestic Waste Water Treatment Systems — Risk Ranking
40
Hydraulic Gradient
The change in total head of water with distance; the slope of the groundwater table or the piezometric
surface.
Karst
A distinctive landform characterised by features such as surface collapses, sinking streams, swallow holes,
caves, turloughs and dry valleys, and a distinctive groundwater flow regime where drainage is largely
underground in solutionally enlarged fissures and conduits.
On-site Waste Water Treatment Systems (OSWTSs)
A generic term for small-scale waste water treatment systems associated with single houses and small
communities or facilities, and mostly associated with septic tanks and intermittent filter systems offering
secondary treatment of raw waste water effluent.
Pathway
The route that a particle of water and/or chemical or biological substance takes through the environment
from a source to a receptor location. Pathways are determined by natural hydrogeological characteristics
and the nature of the contaminant, but can also be influenced by the presence of features resulting from
human activities (e.g. abandoned ungrouted boreholes which can direct surface water and associated
pollutants preferentially to groundwater).
Percolation
The movement and filtering of fluids through porous materials; with regard to DWWTSs this refers to the
movement and filtering through soil and/or subsoil.
Permeability
A measure of a soil or rock’s ability or capacity to transmit water under a potential hydraulic gradient
(synonymous with hydraulic conductivity).
Point Source
Any discernible, confined or discrete conveyance from which pollutants are or may be discharged. These
may exist in the form of pipes, ditches, channels, tunnels, conduits, containers, and sheds, or as distinct
percolation areas, integrated constructed wetlands, or other surface application of pollutants at individual
locations. Examples are discharges from waste water works and effluent discharges from industry.
Glossary
41
Pollution
The direct or indirect introduction, as a result of human activity, of substances or heat into the air, water or
land which may be harmful to human health or the quality of aquatic ecosystems or terrestrial ecosystems
directly depending on aquatic ecosystems which result in damage to material property, or which impair or
interfere with amenities and other legitimate uses of the environment (Groundwater Regulations, 2010).
Poorly Productive Aquifers (PPAs)
Low-yielding bedrock aquifers that are generally not regarded as important sources of water for public
water supply but that nonetheless may be important in terms of providing domestic and small community
water supplies and of delivering water and associated pollutants to rivers and lakes via shallow groundwater
pathways.
Population Equivalent (p.e.)
A conversion value that aims at evaluating non-domestic pollution in reference to domestic pollution fixed
by EEC directive (Urban Waste Water Treatment Directive 91/271/EEC) at 60 g/day BOD.
Preferential Flow
A generic term used to describe water movement along favoured pathways through a geological medium,
bypassing other parts of the medium. Examples include pores formed by soil fauna, plant root channels,
weathering cracks, fissures and/or fractures.
Receptors
Receptors are existing and potential future groundwater resources, drinking water supplies (e.g. springs and
abstraction wells), surface water bodies into which groundwater discharges (e.g. streams) and groundwater
dependent terrestrial ecosystems (GWDTEs).
River Basin
The area of land from which all surface water runoff flows, through a sequence of streams, rivers and lakes,
into the sea at a single river mouth, estuary or delta.
River Basin District (RBD)
A group of river basins formally defined by Water Policy (2003) for the purposes of reporting Water
Framework Directive requirements to the European Commission.
Domestic Waste Water Treatment Systems — Risk Ranking
42
Saturated Zone
The zone below the water table in an aquifer in which all pores and fissures and fractures are filled with
water at a pressure that is greater than atmospheric.
Soil (topsoil)
The uppermost layer of the earth in which plants grow and which is capable of supporting life.
Source-Pathway-Receptor (S-P-R) Model
An S-P-R model involves identifying whether and how pollution sources are connected to a receptor via a
pathway. A conceptual model provides an understanding of all the relationships between S-P-R factors in a
particular hydrogeological setting.
Subsoil
Unlithified (uncemented) geological strata or materials beneath the topsoil and above bedrock.
Surface Water
An element of water on the land’s surface such as a lake, reservoir, stream, river or canal. Can also be part
of transitional or coastal waters (Surface Waters Regulations, 2009).
UK TAG
The United Kingdom Technical Advisory Group, a partnership of UK environment and conservation agencies
set up to interpret and support the implementation of the Water Framework Directive. The EPA is an invited
member of the UK TAG.
Unsaturated Zone
The zone between the land surface and the water table, in which pores, fractures and fissures are only
partially filled with water. Also known as the vadose zone.
Vulnerability
The intrinsic geological and hydrogeological characteristics that determine the ease with which groundwater
may be contaminated by human activities (Fitzsimmons et al., 2003).
Water Table
The uppermost level of saturation in an aquifer at which the pressure is atmospheric.

References
43
9. ReferencesAnalysis of Pressures and Impacts (IMPRESS) (2002). The Key Implementation Requirements of the Water
Framework Directive. Policy Summary to the Guidance Document. Fifth Draft, October. Brussels.
Black, J. (2008). Risk-based regulation: Choices, practices and lessons learnt. In Risk and Regulatory Policy:
Improving the Governance of Risk. OECD, Paris, pp. 185–224.
British Standards (1999). Code of Practice for Site Investigations BS5930. As amended. BSI, London.
Daly, D. (2006). Site suitability for on-site wastewater treatment systems – the role of the water table. GSI
Groundwater Newsletter, No. 45. Geological Survey of Ireland, Dublin.
DEHLG (2009). European Communities environmental objectives (surface waters) regulations. S.I. No. 272
of 2009. Department of Environment, Heritage and Local Government, Dublin.
DELG/EPA/GSI (1999). Groundwater Protection Schemes. Document prepared jointly by the Geological
Survey of Ireland (GSI), the Environmental Protection Agency, and the Department of Environment, Heritage
and Local Government. Available at www.gsi.ie
EN12566-3 (2005). Small Wastewater Treatment Systems for up to 50 PT. European Standards Organisation
(CEN), Brussels.
EPA (1999). Waste Water Treatment Manual – Treatment for Small Communities, Business, Leisure Centres
and Hotels. EPA, Wexford.
EPA (2003). Towards Setting Guideline Values for the Protection of Groundwater in Ireland. Interim Report.
EPA, Wexford.
EPA (2009). Code of Practice: Wastewater Treatment and Disposal Systems Serving Single Houses (p.e. ≤ 10).
EPA, Wexford. Available at www.epa.ie
EPA (2010). Water Quality in Ireland 2007–2009. McGarrigle, M., Lucey, J. and Ó Cinneide, M (Eds). EPA,
Wexford.
EPA (2011). Guidance on the Authorisation of Discharges to Groundwater. EPA, Wexford.
Fitzsimons, V., Daly, D. and Deakin, J. (2003). Draft GSI Guidelines for Assessment and Mapping of
Groundwater Vulnerability to Contamination. Groundwater Section, Geological Survey of Ireland, Dublin.
Gill, L. (2006). Expert Assistance for Assessment of Percolation Test Methods and Wastewater Treatment
Effluent Characteristics: Final Report. Prepared for the Environmental Protection Agency, Wexford.
Gill, L., Johnston, P., Misstear, B., O’Luanaigh, N. and Patel, T. (2008). On-site Waste Water Treatment:
Investigation of Rapid Percolating Subsoils, Reed Beds and Effluent Distribution. Final Report for project
2005-MS-15 ERTDI. Prepared for the Environment Protection Agency by The Environmental Engineering
Group, TCD, Dublin.
Gill, L.W., O’Luanaigh, N., Johnston, P.M., Misstear, B.D.R and Ó Súilleabháin, C. (2009a). Nutrient loading
on subsoils from on-site wastewater effluent, comparing septic tank and secondary treatment systems.
Water Research, 43, 2739–2749.

Domestic Waste Water Treatment Systems — Risk Ranking
44
Gill, L., O’Luanaigh, N., Patel, T., Misstear, B. and Johnston, P (2009b). On-Site Waste Water Treatment:
Investigation of Rapid Percolating Subsoils, Reed Beds and Effluent Distribution. Final Report for project
2005-MS-15 ERTDI. Prepared for the Environment Protection Agency by The Environmental Engineering
Group, TCD, Dublin.
Gill, L., Ó Súilleabháin, C., Johnston, P. and Misstear, B. (2005). An Investigation into the Performance of
Subsoils and Stratified Sand Filters for the Treatment of Waste Water from On-Site Systems (2001-MS-15-
M1). Synthesis Report. Prepared for EPA by The Environmental Engineering Group, TCD, Dublin.
GSI (2006). Criteria Used in Aquifer Classification. Available at www.gsi.ie/Programmes/Groundwater/
Aquifer+Classification.htm
Lynott, D. and O’Leary, G. (2011). A Strategic Approach to Managing Risk and Delivering Outcomes through
Environmental Enforcement. Available at http://inece.org/conference/9/confproceedings
Macintosh, K.A., Jordan, P., Cassidy, R., Arnscheidt, J. and Ward, C. (2011). Low flow water quality in rivers;
septic tank systems and high-resolution phosphorus signals. Science of the Total Environment, 412–413,
58–65.
National Standards Authority of Ireland (1991). Septic Tank Systems – Recommendations for Domestic
Effluent Disposal from a Single Dwelling House, SR 6: 1991. Eolas, Dublin.
Ó Súilleabháin, C., (2000). Assessing the boundary between high and moderately permeable subsoils.
Unpublished MSc thesis, Department of Civil, Structural and Environmental Engineering, Trinity College
Dublin.
ó Súilleabháin, C. (2004). The attenuation capacity of subsoils receiving domestic wastewater effluent. PhD
dissertation, Department of Civil, Structural and Environmental Engineering, Trinity College Dublin.
SNIFFER (2007). WFD Visualisation Package. Published by the Scotland & Northern Ireland Forum for
Environmental Research. Available at www.wfdvisual.com
Swartz, M., Misstear, B., Daly, D. and Farrell, E. (2003). Assessing subsoil permeability for groundwater
vulnerability. Quarterly Journal of Engineering Geology & Hydrogeology, 36, 173–184
UK Technical Advisory Group WP7a(01) (2004). Draft Guidance on General Principles for Risk Assessment
(PR2v6.19-01-04). Available at www.wfduk.org
UK Technical Advisory Group (2008). Application of Groundwater Standards to Regulation. Paper 11b(iii).
Available at www.wfduk.org
UK Technical Advisory Group (2011). Defining & Reporting on Groundwater Bodies. Working Draft Paper.
Available at www.wfduk.org
Western River Basin District (2008). Programme of Measures, Unsewered Wastewater Treatment Systems
National Study. Available at www.wfdireland.ie
WGGW (2005a). Guidance on the Assessment of the Impact of Groundwater Abstractions. Guidance
Document No. GW5. Paper by the Working Group on Groundwater, Available at www.wfdireland.ie
WGGW (2005b). Methodology for Risk Characterisation of Ireland’s Groundwater. Guidance Document No.
GW8. Paper by the Working Group on Groundwater. Available at www.wfdireland.ie
Withers, P.J., Jarvie, H.P. and Stoate, C. (2011). Quantifying the impact of septic tank systems on eutrophication
risk in rural headwaters. Environment International, 37, 644–653.

Appendix 1
45
Appendix 1
Susceptibility Matrices
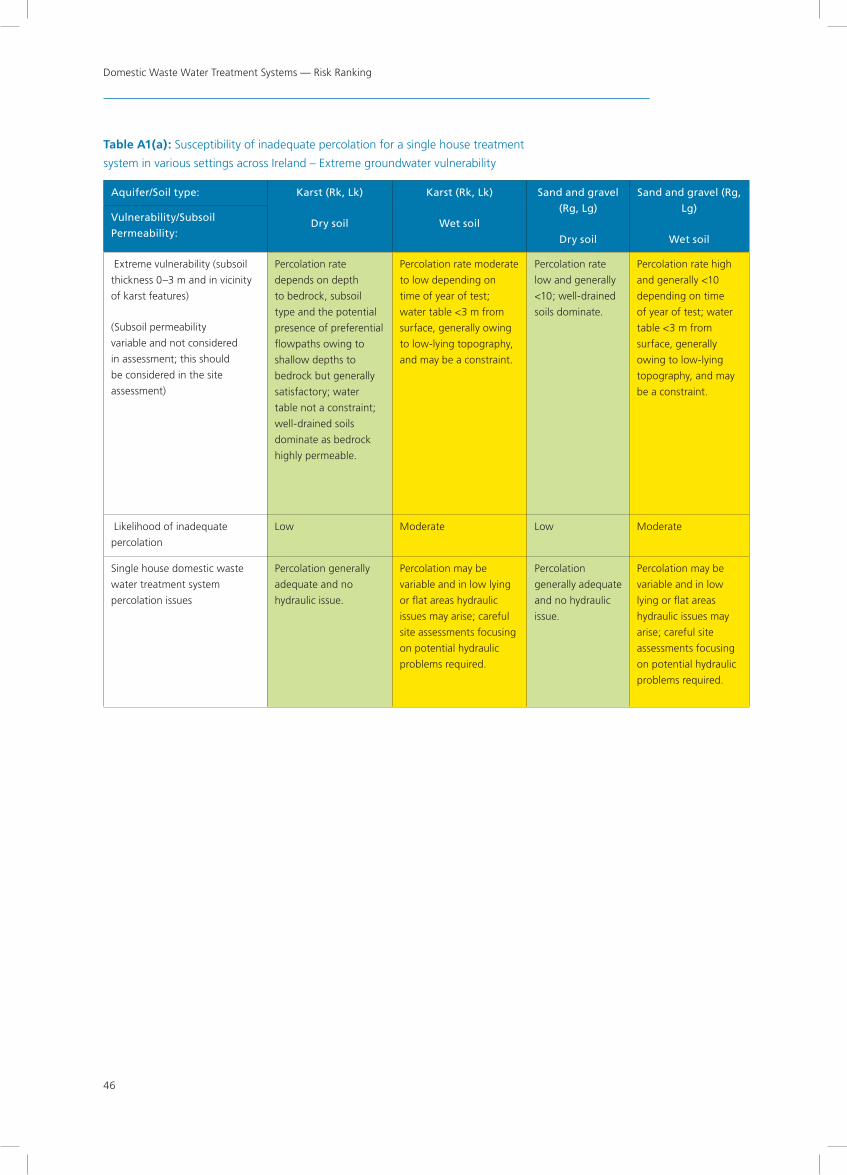
Domestic Waste Water Treatment Systems — Risk Ranking
46
Table A1(a): Susceptibility of inadequate percolation for a single house treatment
system in various settings across Ireland – Extreme groundwater vulnerability
Aquifer/Soil type: Karst (Rk, Lk)
Dry soil
Karst (Rk, Lk)
Wet soil
Sand and gravel
(Rg, Lg)
Dry soil
Sand and gravel (Rg,
Lg)
Wet soil
Productive
bedrock (Rf, Lm)
Dry soil
Productive bedrock
(Rf, Lm)
Wet soil
Poorly productive
bedrock (Ll)
Dry soil
Poorly productive
bedrock (Ll)
Wet soil
Poorly Productive
Bedrock (Pl, Pu)
Dry soil
Poorly Productive
Bedrock (Pl, Pu)
Wet soil
Vulnerability/Subsoil
Permeability:
Extreme vulnerability (subsoil
thickness 0–3 m and in vicinity
of karst features)
(Subsoil permeability
variable and not considered
in assessment; this should
be considered in the site
assessment)
Percolation rate
depends on depth
to bedrock, subsoil
type and the potential
presence of preferential
flowpaths owing to
shallow depths to
bedrock but generally
satisfactory; water
table not a constraint;
well-drained soils
dominate as bedrock
highly permeable.
Percolation rate moderate
to low depending on
time of year of test;
water table <3 m from
surface, generally owing
to low-lying topography,
and may be a constraint.
Percolation rate
low and generally
<10; well-drained
soils dominate.
Percolation rate high
and generally <10
depending on time
of year of test; water
table <3 m from
surface, generally
owing to low-lying
topography, and may
be a constraint.
Percolation rate
depends on depth
to bedrock and
subsoil type,
but generally
satisfactory;
water table not
a constraint;
well-drained
soils dominate
as bedrock
permeable.
Percolation rate
depends on depth to
bedrock and subsoil
type; but generally
satisfactory; water
table potentially a
constraint; saturated
soils dominate.
Percolation rate
variable and
depends on
permeability of
upper bedrock
layers; winter
water table may
be high in low
lying or flat areas;
lateral groundwater
movement may
be limited in some
circumstances;
variable soils
or bare rock
dominate.
Percolation rate
variable and depends
on permeability of
upper bedrock layers;
winter water table
may be high in low
lying or flat areas;
lateral groundwater
movement may
be limited in some
circumstances; variable
soils or bare rock
dominate.
Percolation rate
variable and
depends on
permeability of
upper bedrock
layers; winter
water table may
be high in low
lying or flat areas;
lateral groundwater
movement may
be limited in some
circumstances;
variable soils
or bare rock
dominate.
Percolation rate
variable but often
problematical;
lateral groundwater
movement limited;
rainfall runoff
predominates; shallow
water table especially
in winter; poorly
drained soils, peats or
bare rock dominate.
Likelihood of inadequate
percolation
Low Moderate Low Moderate Low Moderate Moderate Moderate Moderate High
Single house domestic waste
water treatment system
percolation issues
Percolation generally
adequate and no
hydraulic issue.
Percolation may be
variable and in low lying
or flat areas hydraulic
issues may arise; careful
site assessments focusing
on potential hydraulic
problems required.
Percolation
generally adequate
and no hydraulic
issue.
Percolation may be
variable and in low
lying or flat areas
hydraulic issues may
arise; careful site
assessments focusing
on potential hydraulic
problems required.
Percolation
generally
adequate and no
hydraulic issue.
Percolation may be
variable and in low
lying or flat areas
hydraulic issues may
arise; careful site
assessments focusing
on potential hydraulic
problems required.
Percolation may be
variable and in low
lying or flat areas
hydraulic issues
may arise; careful
site assessments
focusing on
potential hydraulic
problems required.
Percolation may be
variable and in low
lying or flat areas
hydraulic issues may
arise; careful site
assessments focusing
on potential hydraulic
problems required.
Percolation may be
variable and in low
lying or flat areas
hydraulic issues
may arise; careful
site assessments
focusing on
potential hydraulic
problems required.
Percolation often
inadequate and
lateral groundwater
movement often
restricted, thereby
giving rise to hydraulic
issues.

Appendix 1
47
Table A1(a): Susceptibility of inadequate percolation for a single house treatment
system in various settings across Ireland – Extreme groundwater vulnerability
Aquifer/Soil type: Karst (Rk, Lk)
Dry soil
Karst (Rk, Lk)
Wet soil
Sand and gravel
(Rg, Lg)
Dry soil
Sand and gravel (Rg,
Lg)
Wet soil
Productive
bedrock (Rf, Lm)
Dry soil
Productive bedrock
(Rf, Lm)
Wet soil
Poorly productive
bedrock (Ll)
Dry soil
Poorly productive
bedrock (Ll)
Wet soil
Poorly Productive
Bedrock (Pl, Pu)
Dry soil
Poorly Productive
Bedrock (Pl, Pu)
Wet soil
Vulnerability/Subsoil
Permeability:
Extreme vulnerability (subsoil
thickness 0–3 m and in vicinity
of karst features)
(Subsoil permeability
variable and not considered
in assessment; this should
be considered in the site
assessment)
Percolation rate
depends on depth
to bedrock, subsoil
type and the potential
presence of preferential
flowpaths owing to
shallow depths to
bedrock but generally
satisfactory; water
table not a constraint;
well-drained soils
dominate as bedrock
highly permeable.
Percolation rate moderate
to low depending on
time of year of test;
water table <3 m from
surface, generally owing
to low-lying topography,
and may be a constraint.
Percolation rate
low and generally
<10; well-drained
soils dominate.
Percolation rate high
and generally <10
depending on time
of year of test; water
table <3 m from
surface, generally
owing to low-lying
topography, and may
be a constraint.
Percolation rate
depends on depth
to bedrock and
subsoil type,
but generally
satisfactory;
water table not
a constraint;
well-drained
soils dominate
as bedrock
permeable.
Percolation rate
depends on depth to
bedrock and subsoil
type; but generally
satisfactory; water
table potentially a
constraint; saturated
soils dominate.
Percolation rate
variable and
depends on
permeability of
upper bedrock
layers; winter
water table may
be high in low
lying or flat areas;
lateral groundwater
movement may
be limited in some
circumstances;
variable soils
or bare rock
dominate.
Percolation rate
variable and depends
on permeability of
upper bedrock layers;
winter water table
may be high in low
lying or flat areas;
lateral groundwater
movement may
be limited in some
circumstances; variable
soils or bare rock
dominate.
Percolation rate
variable and
depends on
permeability of
upper bedrock
layers; winter
water table may
be high in low
lying or flat areas;
lateral groundwater
movement may
be limited in some
circumstances;
variable soils
or bare rock
dominate.
Percolation rate
variable but often
problematical;
lateral groundwater
movement limited;
rainfall runoff
predominates; shallow
water table especially
in winter; poorly
drained soils, peats or
bare rock dominate.
Likelihood of inadequate
percolation
Low Moderate Low Moderate Low Moderate Moderate Moderate Moderate High
Single house domestic waste
water treatment system
percolation issues
Percolation generally
adequate and no
hydraulic issue.
Percolation may be
variable and in low lying
or flat areas hydraulic
issues may arise; careful
site assessments focusing
on potential hydraulic
problems required.
Percolation
generally adequate
and no hydraulic
issue.
Percolation may be
variable and in low
lying or flat areas
hydraulic issues may
arise; careful site
assessments focusing
on potential hydraulic
problems required.
Percolation
generally
adequate and no
hydraulic issue.
Percolation may be
variable and in low
lying or flat areas
hydraulic issues may
arise; careful site
assessments focusing
on potential hydraulic
problems required.
Percolation may be
variable and in low
lying or flat areas
hydraulic issues
may arise; careful
site assessments
focusing on
potential hydraulic
problems required.
Percolation may be
variable and in low
lying or flat areas
hydraulic issues may
arise; careful site
assessments focusing
on potential hydraulic
problems required.
Percolation may be
variable and in low
lying or flat areas
hydraulic issues
may arise; careful
site assessments
focusing on
potential hydraulic
problems required.
Percolation often
inadequate and
lateral groundwater
movement often
restricted, thereby
giving rise to hydraulic
issues.

Domestic Waste Water Treatment Systems — Risk Ranking
48
Table A1(b): Susceptibility of inadequate percolation for a single house treatment
system in various settings across Ireland – High-permeability subsoil
Aquifer/Soil type: Karst (Rk, Lk)
Dry soil
Karst (Rk, Lk)
Wet soil
Sand and gravel
(Rg, Lg)
Dry soil
Sand and gravel
(Rg, Lg)
Wet soil
Productive
bedrock (Rf, Lm)
Dry soil
Productive bedrock
(Rf, Lm)
Wet soil
Poorly productive
bedrock (Ll)
Dry soil
Poorly productive
bedrock (Ll)
Wet soil
Poorly Productive
Bedrock (Pl, Pu)
Dry soil
Poorly Productive
Bedrock (Pl, Pu)
Wet soil Vulnerability/Subsoil
permeability:
High-permeability Subsoil (>3
m thick and with permeability
>10–4 m/s); broadly equates to
BS5930 GRAVEL, sandy GRAVEL
and SAND
Percolation rate high
and generally <10; >3
m of subsoil; water
table not a constraint;
well-drained soils
dominate.
Percolation rate high and
generally <10 depending
on time of year of test;
water table <3 m from
surface, generally owing
to low-lying topography,
and may be a constraint.
Percolation
rate high and
generally <10;
>3 m of subsoil;
water table not
a constraint;
well-drained soils
dominate.
Percolation rate high
and generally <10
depending on time
of year of test; water
table <3 m from
surface, generally
owing to low-lying
topography, and may
be a constraint.
Percolation
rate high and
generally <10;
>3 m of subsoil;
water table not
a constraint;
well-drained soils
dominate.
Percolation rate high
and generally <10
depending on time
of year of test; water
table <3 m from
surface, generally
owing to low-lying
topography, and may
be a constraint.
Percolation rate
high and generally
<10; >3 m of
subsoil; water table
not a constraint;
well-drained soils
dominate.
Percolation rate high
and generally <10
depending on time of
year of test; >3 m of
subsoil; water table
may be near-surface
owing to low-lying
topo-graphy; saturated
soils dominate.
Percolation rate
high and generally
<10; >3 m of
subsoil; water table
not a constraint;
well-drained soils
dominate.
Percolation rate high
and generally <10
depending on time of
year of test; >3 m of
subsoil; water table
may be near-surface
owing to low-lying
topography; saturated
soils dominate.
Likelihood of inadequate
percolation
Low Moderate Low Moderate Low Moderate Low Moderate Low Moderate
Single house domestic waste
water treatment system
percolation issues
Percolation generally
adequate and no
hydraulic issue.
Percolation may be
variable and in low lying
or flat areas hydraulic
issues may arise; careful
site assessments focusing
on potential hydraulic
problems required.
Percolation
generally adequate
and no hydraulic
issue.
Percolation may be
variable and in low
lying or flat areas
hydraulic issues may
arise; careful site
assessments focusing
on potential hydraulic
problems required.
Percolation
generally
adequate and no
hydraulic issue.
Percolation may be
variable and in low
lying or flat areas
hydraulic issues may
arise; careful site
assessments focusing
on potential hydraulic
problems required.
Percolation
generally adequate
and no hydraulic
issue.
Percolation may be
variable and in low
lying or flat areas
hydraulic issues may
arise; careful site
assessments focusing
on potential hydraulic
problems required.
Percolation
generally adequate
and no hydraulic
issue.
Percolation may be
variable and in low
lying or flat areas
hydraulic issues may
arise; careful site
assessments focusing
on potential hydraulic
problems required.

Appendix 1
49
Table A1(b): Susceptibility of inadequate percolation for a single house treatment
system in various settings across Ireland – High-permeability subsoil
Aquifer/Soil type: Karst (Rk, Lk)
Dry soil
Karst (Rk, Lk)
Wet soil
Sand and gravel
(Rg, Lg)
Dry soil
Sand and gravel
(Rg, Lg)
Wet soil
Productive
bedrock (Rf, Lm)
Dry soil
Productive bedrock
(Rf, Lm)
Wet soil
Poorly productive
bedrock (Ll)
Dry soil
Poorly productive
bedrock (Ll)
Wet soil
Poorly Productive
Bedrock (Pl, Pu)
Dry soil
Poorly Productive
Bedrock (Pl, Pu)
Wet soil Vulnerability/Subsoil
permeability:
High-permeability Subsoil (>3
m thick and with permeability
>10–4 m/s); broadly equates to
BS5930 GRAVEL, sandy GRAVEL
and SAND
Percolation rate high
and generally <10; >3
m of subsoil; water
table not a constraint;
well-drained soils
dominate.
Percolation rate high and
generally <10 depending
on time of year of test;
water table <3 m from
surface, generally owing
to low-lying topography,
and may be a constraint.
Percolation
rate high and
generally <10;
>3 m of subsoil;
water table not
a constraint;
well-drained soils
dominate.
Percolation rate high
and generally <10
depending on time
of year of test; water
table <3 m from
surface, generally
owing to low-lying
topography, and may
be a constraint.
Percolation
rate high and
generally <10;
>3 m of subsoil;
water table not
a constraint;
well-drained soils
dominate.
Percolation rate high
and generally <10
depending on time
of year of test; water
table <3 m from
surface, generally
owing to low-lying
topography, and may
be a constraint.
Percolation rate
high and generally
<10; >3 m of
subsoil; water table
not a constraint;
well-drained soils
dominate.
Percolation rate high
and generally <10
depending on time of
year of test; >3 m of
subsoil; water table
may be near-surface
owing to low-lying
topo-graphy; saturated
soils dominate.
Percolation rate
high and generally
<10; >3 m of
subsoil; water table
not a constraint;
well-drained soils
dominate.
Percolation rate high
and generally <10
depending on time of
year of test; >3 m of
subsoil; water table
may be near-surface
owing to low-lying
topography; saturated
soils dominate.
Likelihood of inadequate
percolation
Low Moderate Low Moderate Low Moderate Low Moderate Low Moderate
Single house domestic waste
water treatment system
percolation issues
Percolation generally
adequate and no
hydraulic issue.
Percolation may be
variable and in low lying
or flat areas hydraulic
issues may arise; careful
site assessments focusing
on potential hydraulic
problems required.
Percolation
generally adequate
and no hydraulic
issue.
Percolation may be
variable and in low
lying or flat areas
hydraulic issues may
arise; careful site
assessments focusing
on potential hydraulic
problems required.
Percolation
generally
adequate and no
hydraulic issue.
Percolation may be
variable and in low
lying or flat areas
hydraulic issues may
arise; careful site
assessments focusing
on potential hydraulic
problems required.
Percolation
generally adequate
and no hydraulic
issue.
Percolation may be
variable and in low
lying or flat areas
hydraulic issues may
arise; careful site
assessments focusing
on potential hydraulic
problems required.
Percolation
generally adequate
and no hydraulic
issue.
Percolation may be
variable and in low
lying or flat areas
hydraulic issues may
arise; careful site
assessments focusing
on potential hydraulic
problems required.
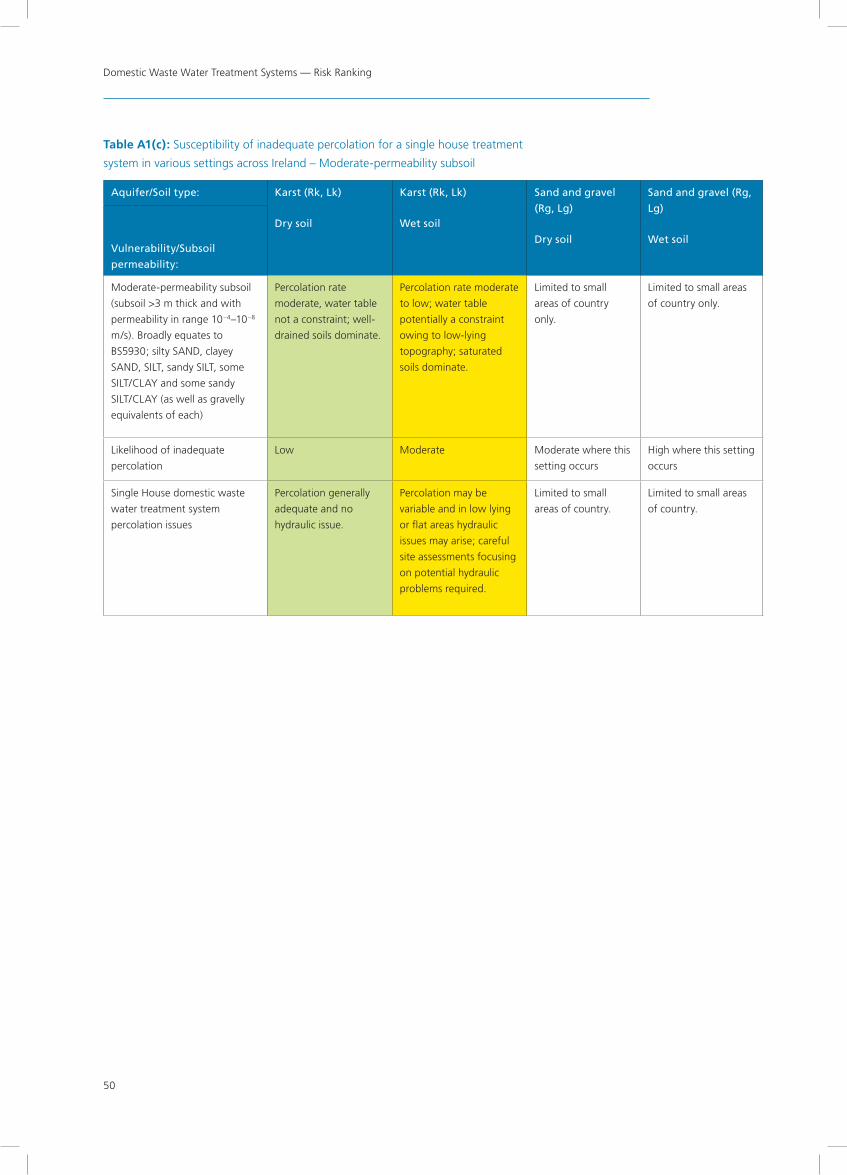
Domestic Waste Water Treatment Systems — Risk Ranking
50
Table A1(c): Susceptibility of inadequate percolation for a single house treatment
system in various settings across Ireland – Moderate-permeability subsoil
Aquifer/Soil type: Karst (Rk, Lk)
Dry soil
Karst (Rk, Lk)
Wet soil
Sand and gravel
(Rg, Lg)
Dry soil
Sand and gravel (Rg,
Lg)
Wet soil
Productive
bedrock (Rf, Lm)
Dry soil
Productive bedrock
(Rf, Lm)
Wet soil
Poorly productive
bedrock (Ll)
Dry soil
Poorly productive
bedrock (Ll)
Wet soil
Poorly Productive
Bedrock (Pl, Pu)
Dry soil
Poorly Productive
Bedrock (Pl, Pu)
Wet soil Vulnerability/Subsoil
permeability:
Moderate-permeability subsoil
(subsoil >3 m thick and with
permeability in range 10–4–10–8
m/s). Broadly equates to
BS5930; silty SAND, clayey
SAND, SILT, sandy SILT, some
SILT/CLAY and some sandy
SILT/CLAY (as well as gravelly
equivalents of each)
Percolation rate
moderate, water table
not a constraint; well-
drained soils dominate.
Percolation rate moderate
to low; water table
potentially a constraint
owing to low-lying
topography; saturated
soils dominate.
Limited to small
areas of country
only.
Limited to small areas
of country only.
Percolation
rate moderate;
water table not
a constraint; well
drained soils
usually dominate.
Percolation rate
moderate to low;
water table potentially
a constraint owing to
low-lying topography;
saturated soils
dominate.
Percolation
rate moderate;
water table not
a constraint; well
drained soils usually
dominate.
Percolation rate low
depending on time of
year of test; water table
probably a constraint
owing to low-lying
topography; saturated
soils dominate.
Percolation
rate moderate;
water table not
a constraint; well
drained soils usually
dominate.
Percolation rate low
depending on time of
year of test; water table
probably a constraint
owing to low-lying
topography; saturated
soils dominate.
Likelihood of inadequate
percolation
Low Moderate Moderate where this
setting occurs
High where this setting
occurs
Low Moderate Low High Low High
Single House domestic waste
water treatment system
percolation issues
Percolation generally
adequate and no
hydraulic issue.
Percolation may be
variable and in low lying
or flat areas hydraulic
issues may arise; careful
site assessments focusing
on potential hydraulic
problems required.
Limited to small
areas of country.
Limited to small areas
of country.
Percolation
generally
adequate and no
hydraulic issue.
Percolation may be
variable and in low
lying or flat areas
hydraulic issues may
arise; careful site
assessments focusing
on potential hydraulic
problems required.
Percolation
generally adequate
and no hydraulic
issue.
Percolation may be
variable and in low
lying or flat areas
hydraulic issues may
arise; careful site
assessments focusing
on potential hydraulic
problems required.
Percolation
generally adequate
and no hydraulic
issue.
Percolation may be
variable and in low lying
or flat areas hydraulic
issues may arise; careful
site assessments focusing
on potential hydraulic
problems required.

Appendix 1
51
Table A1(c): Susceptibility of inadequate percolation for a single house treatment
system in various settings across Ireland – Moderate-permeability subsoil
Aquifer/Soil type: Karst (Rk, Lk)
Dry soil
Karst (Rk, Lk)
Wet soil
Sand and gravel
(Rg, Lg)
Dry soil
Sand and gravel (Rg,
Lg)
Wet soil
Productive
bedrock (Rf, Lm)
Dry soil
Productive bedrock
(Rf, Lm)
Wet soil
Poorly productive
bedrock (Ll)
Dry soil
Poorly productive
bedrock (Ll)
Wet soil
Poorly Productive
Bedrock (Pl, Pu)
Dry soil
Poorly Productive
Bedrock (Pl, Pu)
Wet soil Vulnerability/Subsoil
permeability:
Moderate-permeability subsoil
(subsoil >3 m thick and with
permeability in range 10–4–10–8
m/s). Broadly equates to
BS5930; silty SAND, clayey
SAND, SILT, sandy SILT, some
SILT/CLAY and some sandy
SILT/CLAY (as well as gravelly
equivalents of each)
Percolation rate
moderate, water table
not a constraint; well-
drained soils dominate.
Percolation rate moderate
to low; water table
potentially a constraint
owing to low-lying
topography; saturated
soils dominate.
Limited to small
areas of country
only.
Limited to small areas
of country only.
Percolation
rate moderate;
water table not
a constraint; well
drained soils
usually dominate.
Percolation rate
moderate to low;
water table potentially
a constraint owing to
low-lying topography;
saturated soils
dominate.
Percolation
rate moderate;
water table not
a constraint; well
drained soils usually
dominate.
Percolation rate low
depending on time of
year of test; water table
probably a constraint
owing to low-lying
topography; saturated
soils dominate.
Percolation
rate moderate;
water table not
a constraint; well
drained soils usually
dominate.
Percolation rate low
depending on time of
year of test; water table
probably a constraint
owing to low-lying
topography; saturated
soils dominate.
Likelihood of inadequate
percolation
Low Moderate Moderate where this
setting occurs
High where this setting
occurs
Low Moderate Low High Low High
Single House domestic waste
water treatment system
percolation issues
Percolation generally
adequate and no
hydraulic issue.
Percolation may be
variable and in low lying
or flat areas hydraulic
issues may arise; careful
site assessments focusing
on potential hydraulic
problems required.
Limited to small
areas of country.
Limited to small areas
of country.
Percolation
generally
adequate and no
hydraulic issue.
Percolation may be
variable and in low
lying or flat areas
hydraulic issues may
arise; careful site
assessments focusing
on potential hydraulic
problems required.
Percolation
generally adequate
and no hydraulic
issue.
Percolation may be
variable and in low
lying or flat areas
hydraulic issues may
arise; careful site
assessments focusing
on potential hydraulic
problems required.
Percolation
generally adequate
and no hydraulic
issue.
Percolation may be
variable and in low lying
or flat areas hydraulic
issues may arise; careful
site assessments focusing
on potential hydraulic
problems required.

Domestic Waste Water Treatment Systems — Risk Ranking
52
Table A1(d): Susceptibility of inadequate percolation for a single house treatment
system in various settings across Ireland – Low-permeability subsoil
Aquifer/Soil type: Karst (Rk, Lk)
Dry soil
Karst (Rk, Lk)
Wet soil
Sand and gravel
(Rg, Lg)
Dry soil
Sand and gravel (Rg,
Lg)
Wet soil
Productive
bedrock (Rf, Lm)
Dry soil
Productive bedrock
(Rf, Lm)
Wet soil
Poorly productive
bedrock (Ll)
Dry soil
Poorly productive
bedrock (Ll)
Wet soil
Poorly productive
bedrock (Pl, Pu)
Dry soil
Poorly productive
bedrock (Pl, Pu)
Wet soil Vulnerability/Subsoil
permeability:
Low-permeability Subsoil (>3
m thick and with permeability
<~10-8 m/s.); Broadly equates
to BS 5930; some SILT/CLAY,
some sandy SILT/CLAY, CLAY,
sandy CLAY, CLAY, and the
gravelly equivalents of each of
these
Percolation rate very
low except where
bypass flow at karst
features (e.g. swallow
holes, dolines); rainfall
runoff predominates;
generally shallow
‘perched’ water table in
winter; poorly drained
soils dominate.
Percolation rate very low
except where bypass
flow at karst features
(e.g. swallow holes,
dolines); rainfall runoff
predominates; generally
shallow ‘perched’ water
table in winter; poorly
drained soils dominate.
Limited to small
areas of country.
Limited to small areas
of country.
Percolation
rate very low;
rainfall runoff
predominates;
generally shallow
‘perched’ water
table; poorly
drained soils
dominate.
Percolation rate very
low; rainfall runoff
predominates; generally
shallow ‘perched’ water
table; poorly drained
soils dominate.
Percolation
rate very low;
rainfall runoff
predominates;
generally shallow
‘perched’ water
table; poorly
drained soils
dominate.
Percolation rate very
low; rainfall runoff
predominates; generally
shallow ‘perched’ water
table; poorly drained
soils dominate.
Percolation
rate very low;
rainfall runoff
predominates;
generally shallow
‘perched’ water
table; poorly
drained soils
dominate.
Percolation rate very
low; rainfall runoff
predominates; generally
shallow ‘perched’ water
table; poorly drained soils
dominate.
Likelihood of inadequate
percolation
Very high Very high Very high where this
setting occurs
Very high where this
setting occurs
Very high Very high Very high Very high Very high Very high
Single house domestic waste
water treatment system
percolation issues
Percolation often
inadequate and
therefore saturated
subsoil a constraint in
winter. Hydraulic issues
likely.
Percolation often
inadequate and therefore
saturated subsoil a
constraint in winter.
Hydraulic issues likely.
Limited to small
areas of the country.
Limited to small areas
of the country.
Percolation often
inadequate
and therefore
saturated subsoil
a constraint in
winter. Hydraulic
issues likely.
Percolation often
inadequate and
therefore saturated
subsoil a constraint in
winter. Hydraulic issues
likely.
Percolation often
inadequate and
therefore saturated
subsoil a constraint
in winter. Hydraulic
issues likely.
Percolation often
inadequate and
therefore saturated
subsoil a constraint in
winter. Hydraulic issues
likely.
Percolation often
inadequate and
therefore saturated
subsoil a constraint
in winter. Hydraulic
issues likely.
Percolation often
inadequate and therefore
saturated subsoil a
constraint in winter.
Hydraulic issues likely.
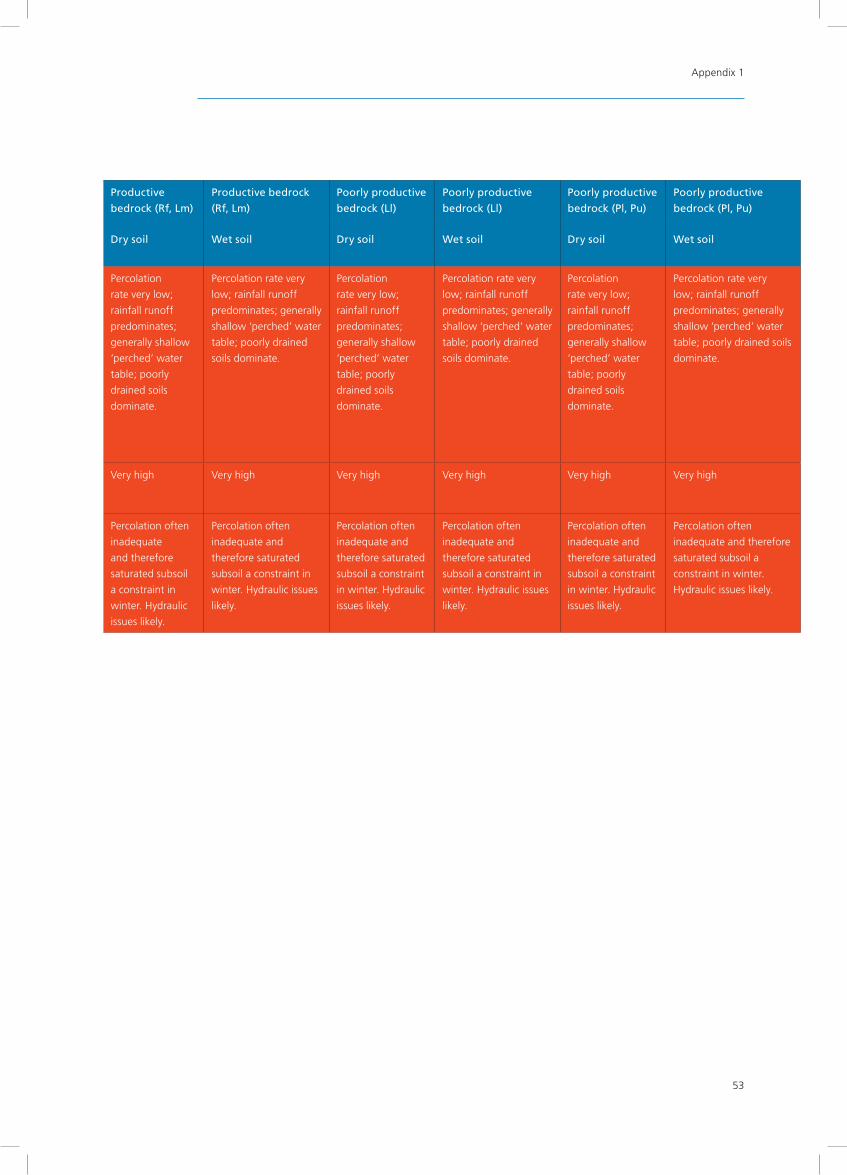
Appendix 1
53
Table A1(d): Susceptibility of inadequate percolation for a single house treatment
system in various settings across Ireland – Low-permeability subsoil
Aquifer/Soil type: Karst (Rk, Lk)
Dry soil
Karst (Rk, Lk)
Wet soil
Sand and gravel
(Rg, Lg)
Dry soil
Sand and gravel (Rg,
Lg)
Wet soil
Productive
bedrock (Rf, Lm)
Dry soil
Productive bedrock
(Rf, Lm)
Wet soil
Poorly productive
bedrock (Ll)
Dry soil
Poorly productive
bedrock (Ll)
Wet soil
Poorly productive
bedrock (Pl, Pu)
Dry soil
Poorly productive
bedrock (Pl, Pu)
Wet soil Vulnerability/Subsoil
permeability:
Low-permeability Subsoil (>3
m thick and with permeability
<~10-8 m/s.); Broadly equates
to BS 5930; some SILT/CLAY,
some sandy SILT/CLAY, CLAY,
sandy CLAY, CLAY, and the
gravelly equivalents of each of
these
Percolation rate very
low except where
bypass flow at karst
features (e.g. swallow
holes, dolines); rainfall
runoff predominates;
generally shallow
‘perched’ water table in
winter; poorly drained
soils dominate.
Percolation rate very low
except where bypass
flow at karst features
(e.g. swallow holes,
dolines); rainfall runoff
predominates; generally
shallow ‘perched’ water
table in winter; poorly
drained soils dominate.
Limited to small
areas of country.
Limited to small areas
of country.
Percolation
rate very low;
rainfall runoff
predominates;
generally shallow
‘perched’ water
table; poorly
drained soils
dominate.
Percolation rate very
low; rainfall runoff
predominates; generally
shallow ‘perched’ water
table; poorly drained
soils dominate.
Percolation
rate very low;
rainfall runoff
predominates;
generally shallow
‘perched’ water
table; poorly
drained soils
dominate.
Percolation rate very
low; rainfall runoff
predominates; generally
shallow ‘perched’ water
table; poorly drained
soils dominate.
Percolation
rate very low;
rainfall runoff
predominates;
generally shallow
‘perched’ water
table; poorly
drained soils
dominate.
Percolation rate very
low; rainfall runoff
predominates; generally
shallow ‘perched’ water
table; poorly drained soils
dominate.
Likelihood of inadequate
percolation
Very high Very high Very high where this
setting occurs
Very high where this
setting occurs
Very high Very high Very high Very high Very high Very high
Single house domestic waste
water treatment system
percolation issues
Percolation often
inadequate and
therefore saturated
subsoil a constraint in
winter. Hydraulic issues
likely.
Percolation often
inadequate and therefore
saturated subsoil a
constraint in winter.
Hydraulic issues likely.
Limited to small
areas of the country.
Limited to small areas
of the country.
Percolation often
inadequate
and therefore
saturated subsoil
a constraint in
winter. Hydraulic
issues likely.
Percolation often
inadequate and
therefore saturated
subsoil a constraint in
winter. Hydraulic issues
likely.
Percolation often
inadequate and
therefore saturated
subsoil a constraint
in winter. Hydraulic
issues likely.
Percolation often
inadequate and
therefore saturated
subsoil a constraint in
winter. Hydraulic issues
likely.
Percolation often
inadequate and
therefore saturated
subsoil a constraint
in winter. Hydraulic
issues likely.
Percolation often
inadequate and therefore
saturated subsoil a
constraint in winter.
Hydraulic issues likely.

Domestic Waste Water Treatment Systems — Risk Ranking
54
Table A2: Susceptibility of MRP and pathogens entering groundwater via subsurface pathways from a
single house treatment system
Vulnerability/Subsoil permeability Bedrock
aquifers
Sand and
gravel
aquifers
Extreme vulnerability (X – subsoil thickness 0–1 m and in vicinity of karst
features)
Very high n/a
Extreme vulnerability (E – subsoil thickness 1—3 m) High High
High, moderate, low vulnerability High subsoil
permeability
Low Low
Moderate
subsoil
permeability
Low Low
Low subsoil
permeability
Low n/a
Table A3: Susceptibility of nitrate entering groundwater via subsurface pathways from a single house
treatment system
Bedrock/Soil type
Vulnerability/Subsoil
permeability
Sand and
gravel
aquifers
– dry soil
Sand and
gravel
aquifers
– wet soil
Bedrock
aquifers –
dry soil
Includes
most
bedrock
types
Bedrock
aquifers –
wet soil
Includes
most
bedrock
types
‘Denitrifying’
bedrock
aquifers
Includes
rocks that
remove nitrate
through
chemical
reactions
Extreme vulnerability (X and
E – subsoil thickness 0–3
m and in vicinity of karst
features)
Very high Low Very high Low Low
High,
moderate,
low
vulnerability
High subsoil
permeability
Very high Low Very high Low Moderate
Moderate
subsoil
permeability
Very high Low Very high Low Low
Low subsoil
permeability
n/a n/a Low Low Low

Appendix 2
55
Appendix 2
Bedrock Types that are Rich in Pyrite and Hence Denitrify (‘Denitrifying’ Bedrock Aquifers)
Impure Limestones Westphalian Shales
Ballina Limestone Formation Coolbaun Formation
Ballymartin Formation Moyadd Coal Formation
Ballysteen Formation Westphalian (undifferentiated)
Calp Ordovician Volcanics
Finlough Formation Aghamore Formation
Loughshinny Formation Avoca Formation
Lucan Formation Ballyhoge Formation
Parsonage and Corgrig Lodge Formation Ballymalone Formation
Dinantian (early) Sandstones,
Shales and Limestones
Dunabrattin Formation
Lower Limestone Shale Tawnyinagh Formation
Namurian Sandstones Ordovician Metasediments
Ballynahown Sandstone Formation Carrickatee Formation
Cloone Flagstone Formation Carrighalia Formation
Feale Sandstone Formation Hornfels in Finnlaghhta Formation
Namurian Shales Kehernaghkilly Formation
Ardagh Shale Formation Laragh Formation
Bencroy Shale Formation One Brook Formation
Clare Shale Formation Toberelatan Formation
Craggagh Shale Formation Silurian Metasediments and Volcanics
Dergvone Shale Formation Aghaward Formation
East Point Formation Basalts and other volcanic rocks
Giants Grave Formation Carrigcleenamore Volcanics
Glenoween Shale Formation Precambrian Quartzites, Gneisses and
Schists
Gowlaun Shale Formation Cornamona Marble Formation
Killeshin Siltstone Formation Precambrian Marbles
Lackantedane Formation Lakes Marble Formation
Longstone Shale Member Granites and other igneous intrusive rocks
Luggacurren Shale Formation Crossdoney Granite
Moanour Formation

Domestic Waste Water Treatment Systems — Risk Ranking
56
Appendix 3
Worked Example of Calculations of Load Input, Attenuation, Dilution and Impact Risk for an Area
Step 1: Calculation of Load Input for an Area of 1 km2.*
Load = (load per person (kg/yr)) x (number of persons per house) x (density of houses (per km2)) = kg/km2/yr
Housing density is 20 houses per km2.
N Load = 2.7 kg/yr x 2.8 persons per house x 20 houses/km2 = 151.2 kg/km2/yr
MRP Load = 0.5 kg/yr x 2.8 persons per house x 20 houses/km2 = 28 kg/km2/yr
* A 1 km2 grid was taken as the most appropriate for the analysis.
Step 2: Calculation of Load Following Attenuation (Surface Pathway)
Load following Attenuation (Groundwater Pathway) = Load Input (kg/km2/yr) x (% of Load leaving Septic
Tank that will reach receptor based on Susceptibility Risk) x (% of Load that will NOT be removed in overland
flow)
(i) N Load
N Load = 151.2 kg/km2/yr and there is LOW Susceptibility for N
N Load following attenuation = 151.2 kg/km2/yr X 5% X75% = 5.67 kg/km2/yr
(ii) MRP Load
MRP Load = 28 kg/km2/yr and there is MODERATE Susceptibility for MRP
MRP Load following attenuation = 28 kg/km2/yr X 25% X 75% = 5.25 kg/km2/yr
The example is simplified to a certain degree to demonstrate the methodology used. The load following
attenuation will be calculated for each DWWTS individually and aggregated over the given grid square. This
would allow for taking account of variation in susceptibility ranking within a given area.
Step 3: Calculation of Load Following Attenuation (Subsurface Pathway).
Load following Attenuation (Subsurface Pathway) = Load Input (kg/km2/yr) x (% of Load leaving Septic Tank
that will reach receptor based on Susceptibility Risk)
(i) N Load
N Load = 151.2 kg/km2/yr and there is VERY HIGH Susceptibility for N
N Load following attenuation = 151.2 kg/km2/yr x 30% = 45.36 kg/km2/yr
(ii) MRP Load
MRP Load = 28 kg/km2/yr and there is VERY HIGH Susceptibility for MRP
MRP Load following attenuation = 28 kg/km2/yr x 90% = 25.2 kg/km2/yr
The example is simplified to a certain degree to demonstrate the methodology used. The load following
attenuation will be calculated for each domestic waste water treatment system individually and aggregated
over the given grid square. This would allow for taking account of variation in susceptibility ranking within
a given area.

Appendix 3
57
Step 4: Calculation of Dilution of Load and Resultant Concentration
Surface Pathway
Effective Rainfall = 500 mm/yr; Low Flow reduction Factor =0.22
Dilution Volume (at low flow) per 1km2 area = (500/1,000)*(1*1,000,000)*0.22= 110,000 m3
N
Load following attenuation = 5.67 kg/km2/yr
N Concentration (Surface water) = (5.67*1,000,000)/(110,000*1,000) = 0.052 mg/l N
MRP Load following attenuation = 5.25 kg/km2/yr
MRP Concentration (Surface water) = (5.25*1,000,000)/(110,000*1,000) = 0.048 mg/l P
Subsurface Pathway
Recharge = 350 mm/yr
Annual Dilution Volume per 1km2 area = (350/1,000)*(1*1,000,000) = 350,000 m3
N
Load following attenuation = 45.36 kg/km2/yr
N Concentration (Groundwater) = (45.36*1,000,000)/(350,000*1,000) = 0.130 mg/l N
MRP Load following attenuation = 25.2 kg/km2/yr
MRP Concentration (Groundwater) = (25.2*1,000,000)/(350,000*1,000) = 0.072 mg/l P
Dilution Volumem3
km2
yr( )
Effective Rainfallmmyr( )
=
1,000mmm( )
x (Area (km2) x (1,000,000 (m2)) x Low Flow Reduction Factor
Concentrationmg
l( ) =
Load following attentuation kgyr( ) x 1,000,000
mgkg( )
Dilution Volumem3
km2
yr( ) x 1,000
lm3( )
=
Recharge mmyr( )
x (Area (km2) x 1,000,000 (m2))Dilution Volumem3
km2
yr( )
1,000mmm( )
Dilution Volumem3
km2
yr( )
Effective Rainfallmmyr( )
=
1,000mmm( )
x (Area (km2) x (1,000,000 (m2)) x Low Flow Reduction Factor
Concentrationmg
l( ) =
Load following attentuation kgyr( ) x 1,000,000
mgkg( )
Dilution Volumem3
km2
yr( ) x 1,000
lm3( )
=
Recharge mmyr( )
x (Area (km2) x 1,000,000 (m2))Dilution Volumem3
km2
yr( )
1,000mmm( )Dilution Volume
m3
km2
yr( )
Effective Rainfallmmyr( )
=
1,000mmm( )
x (Area (km2) x (1,000,000 (m2)) x Low Flow Reduction Factor
Concentrationmg
l( ) =
Load following attentuation kgyr( ) x 1,000,000
mgkg( )
Dilution Volumem3
km2
yr( ) x 1,000
lm3( )
=
Recharge mmyr( )
x (Area (km2) x 1,000,000 (m2))Dilution Volumem3
km2
yr( )
1,000mmm( )

Domestic Waste Water Treatment Systems — Risk Ranking
58
Step 5: Summary and Risk Derived from Proposed Risk Ranking
Surface Pathway
From earlier steps: Density = 20 houses per km2; Effective Rainfall = 500 mm/yr; LOW Susceptibility for N;
MODERATE Susceptibility for MRP
N Concentration (Surface water) = 0.052 mg/l N – Impact Risk = LOW
MRP Concentration (Surface water) = 0.048 mg/l P – Impact Risk = VERY HIGH
Subsurface Pathway
From earlier steps: Density = 20 houses per km2; Recharge = 350 mm/yr; VERY HIGH Susceptibility for N;
VERY HIGH Susceptibility for MRP
N Concentration (Groundwater) = 0.130 mg/l N – Impact Risk = LOW
MRP Concentration (Groundwater) = 0.072 mg/l P – Impact Risk = VERY HIGH

Appendix 4
59
Appendix 4
Examples of the Output of the Excel Workbook
for Surface and Subsurface Pathways
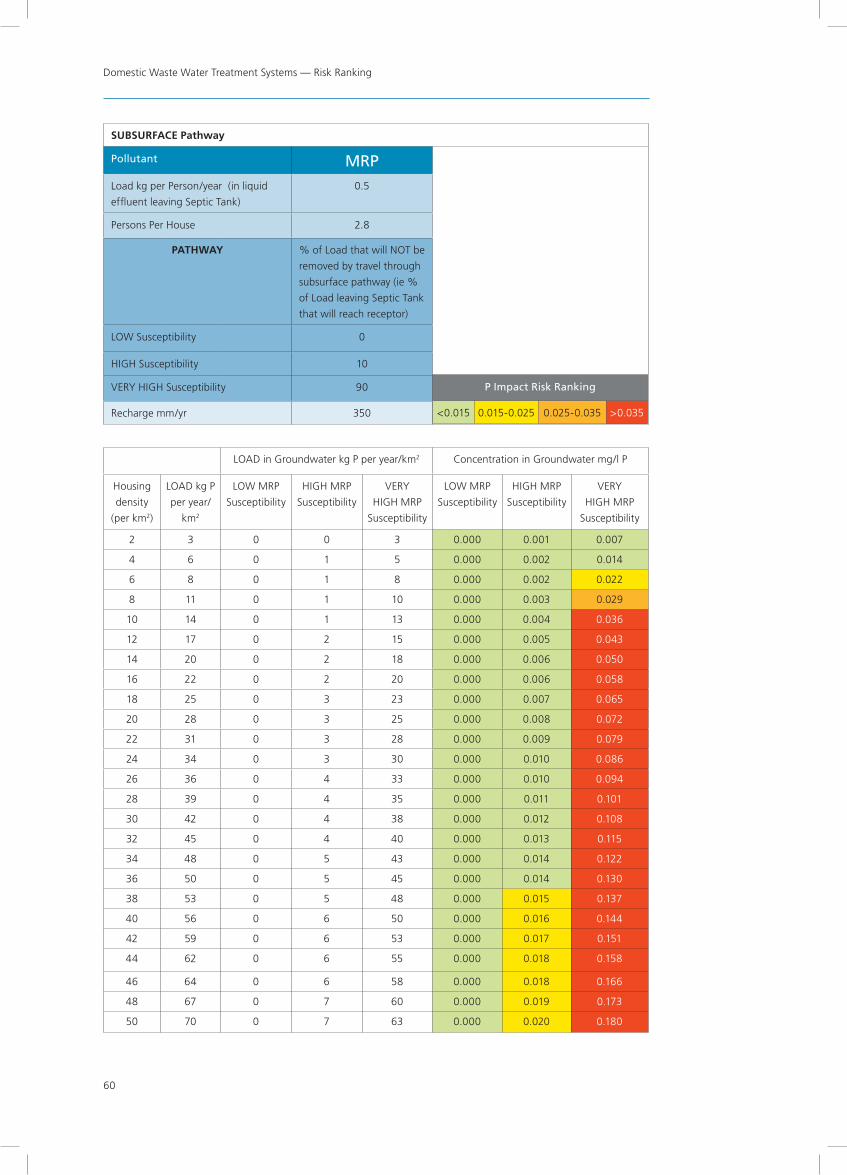
Domestic Waste Water Treatment Systems — Risk Ranking
60
SUBSURFACE Pathway
Pollutant MRPLoad kg per Person/year (in liquid
effluent leaving Septic Tank)
0.5
Persons Per House 2.8
PATHWAY % of Load that will NOT be
removed by travel through
subsurface pathway (ie %
of Load leaving Septic Tank
that will reach receptor)
LOW Susceptibility 0
HIGH Susceptibility 10
VERY HIGH Susceptibility 90
Recharge mm/yr 350
LOAD in Groundwater kg P per year/km2 Concentration in Groundwater mg/l P
Housing
density
(per km2)
LOAD kg P
per year/
km2
LOW MRP
Susceptibility
HIGH MRP
Susceptibility
VERY
HIGH MRP
Susceptibility
LOW MRP
Susceptibility
HIGH MRP
Susceptibility
VERY
HIGH MRP
Susceptibility
2 3 0 0 3 0.000 0.001 0.007
4 6 0 1 5 0.000 0.002 0.014
6 8 0 1 8 0.000 0.002 0.022
8 11 0 1 10 0.000 0.003 0.029
10 14 0 1 13 0.000 0.004 0.036
12 17 0 2 15 0.000 0.005 0.043
14 20 0 2 18 0.000 0.006 0.050
16 22 0 2 20 0.000 0.006 0.058
18 25 0 3 23 0.000 0.007 0.065
20 28 0 3 25 0.000 0.008 0.072
22 31 0 3 28 0.000 0.009 0.079
24 34 0 3 30 0.000 0.010 0.086
26 36 0 4 33 0.000 0.010 0.094
28 39 0 4 35 0.000 0.011 0.101
30 42 0 4 38 0.000 0.012 0.108
32 45 0 4 40 0.000 0.013 0.115
34 48 0 5 43 0.000 0.014 0.122
36 50 0 5 45 0.000 0.014 0.130
38 53 0 5 48 0.000 0.015 0.137
40 56 0 6 50 0.000 0.016 0.144
42 59 0 6 53 0.000 0.017 0.151
44 62 0 6 55 0.000 0.018 0.158
46 64 0 6 58 0.000 0.018 0.166
48 67 0 7 60 0.000 0.019 0.173
50 70 0 7 63 0.000 0.020 0.180
P Impact Risk Ranking
<0.015 0.015-0.025 0.025-0.035 >0.035

Appendix 4
61
SUBSURFACE Pathway
Pollutant NLoad kg per Person/year (in liquid
effluent leaving Septic Tank)2.7
Persons Per House 2.8
PATHWAY % of Load that will NOT be
removed by travel through
subsurface pathway (ie %
of Load leaving Septic Tank
that will reach receptor)
LOW Susceptibility 10
MODERATE Susceptibility 15
VERY HIGH Susceptibility 30
Recharge mm/yr 350
LOAD in Groundwater kg N per year/km2 Concentration in Groundwater mg/l N
Housing
density
(per km2)
LOAD kg N
per year/
km2
LOW N
Susceptibility
HIGH N
Susceptibility
VERY
HIGH N
Susceptibility
LOW N
Susceptibility
HIGH N
Susceptibility
VERY
HIGH N
Susceptibility
2 15 2 2 5 0.004 0.006 0.013
4 30 3 5 9 0.009 0.013 0.026
6 45 5 7 14 0.013 0.019 0.039
8 60 6 9 18 0.017 0.026 0.052
10 76 8 11 23 0.022 0.032 0.065
12 91 9 14 27 0.026 0.039 0.078
14 106 11 16 32 0.030 0.045 0.091
16 121 12 18 36 0.035 0.052 0.104
18 136 14 20 41 0.039 0.058 0.117
20 151 15 23 45 0.043 0.065 0.130
22 166 17 25 50 0.048 0.071 0.143
24 181 18 27 54 0.052 0.078 0.156
26 197 20 29 59 0.056 0.084 0.168
28 212 21 32 64 0.060 0.091 0.181
30 227 23 34 68 0.065 0.097 0.194
32 242 24 36 73 0.069 0.104 0.207
34 257 26 39 77 0.073 0.110 0.220
36 272 27 41 82 0.078 0.117 0.233
38 287 29 43 86 0.082 0.123 0.246
40 302 30 45 91 0.086 0.130 0.259
42 318 32 48 95 0.091 0.136 0.272
44 333 33 50 100 0.095 0.143 0.285
46 348 35 52 104 0.099 0.149 0.298
48 363 36 54 109 0.104 0.156 0.311
50 378 38 57 113 0.108 0.162 0.324
P Impact Risk Ranking
<0.015 0.015-0.025 0.025-0.035 >0.035
N Impact Risk Ranking
<2 2-3.5 3.5-5 >5.6
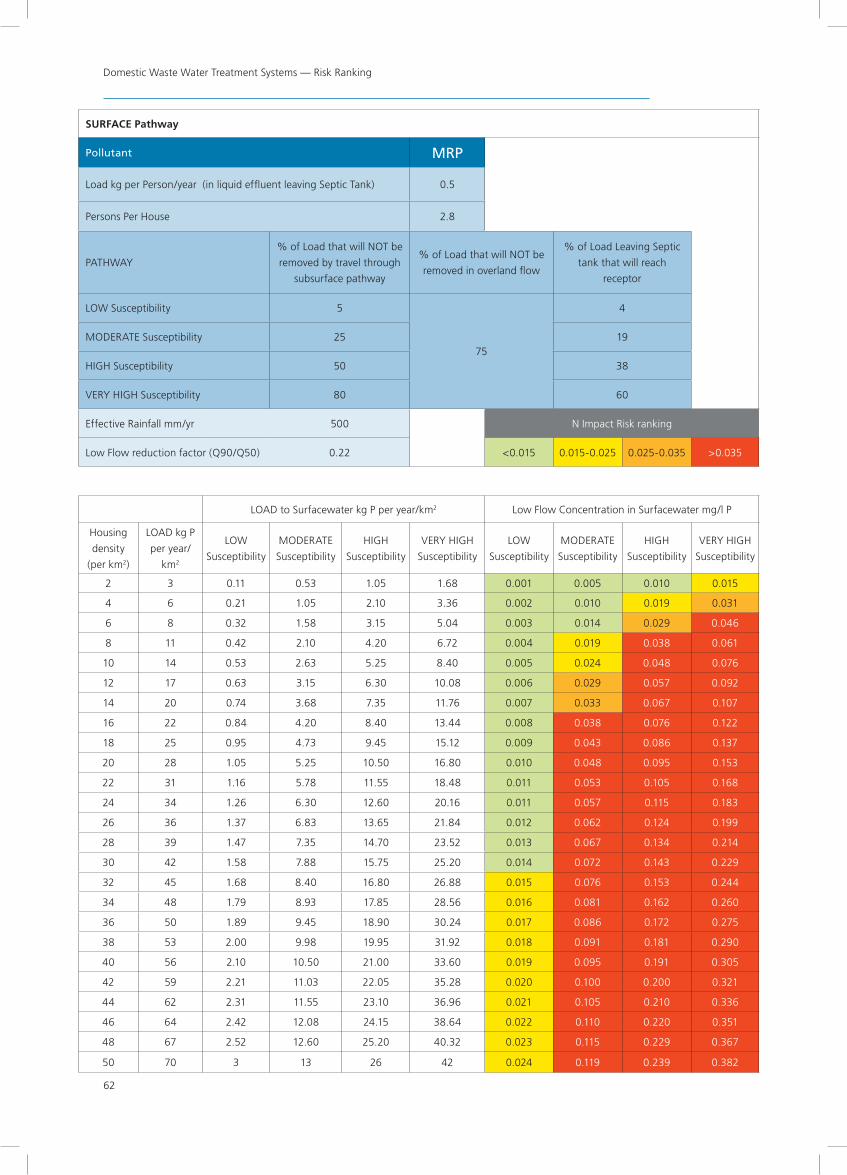
Domestic Waste Water Treatment Systems — Risk Ranking
62
SURFACE Pathway
Pollutant MRP
Load kg per Person/year (in liquid effluent leaving Septic Tank) 0.5
Persons Per House 2.8
PATHWAY
% of Load that will NOT be
removed by travel through
subsurface pathway
% of Load that will NOT be
removed in overland flow
% of Load Leaving Septic
tank that will reach
receptor
LOW Susceptibility 5
75
4
MODERATE Susceptibility 25 19
HIGH Susceptibility 50 38
VERY HIGH Susceptibility 80 60
Effective Rainfall mm/yr 500 N Impact Risk ranking
Low Flow reduction factor (Q90/Q50) 0.22 <0.015 0.015-0.025 0.025-0.035 >0.035
LOAD to Surfacewater kg P per year/km2 Low Flow Concentration in Surfacewater mg/l P
Housing
density
(per km2)
LOAD kg P
per year/
km2
LOW
Susceptibility
MODERATE
Susceptibility
HIGH
Susceptibility
VERY HIGH
Susceptibility
LOW
Susceptibility
MODERATE
Susceptibility
HIGH
Susceptibility
VERY HIGH
Susceptibility
2 3 0.11 0.53 1.05 1.68 0.001 0.005 0.010 0.015
4 6 0.21 1.05 2.10 3.36 0.002 0.010 0.019 0.031
6 8 0.32 1.58 3.15 5.04 0.003 0.014 0.029 0.046
8 11 0.42 2.10 4.20 6.72 0.004 0.019 0.038 0.061
10 14 0.53 2.63 5.25 8.40 0.005 0.024 0.048 0.076
12 17 0.63 3.15 6.30 10.08 0.006 0.029 0.057 0.092
14 20 0.74 3.68 7.35 11.76 0.007 0.033 0.067 0.107
16 22 0.84 4.20 8.40 13.44 0.008 0.038 0.076 0.122
18 25 0.95 4.73 9.45 15.12 0.009 0.043 0.086 0.137
20 28 1.05 5.25 10.50 16.80 0.010 0.048 0.095 0.153
22 31 1.16 5.78 11.55 18.48 0.011 0.053 0.105 0.168
24 34 1.26 6.30 12.60 20.16 0.011 0.057 0.115 0.183
26 36 1.37 6.83 13.65 21.84 0.012 0.062 0.124 0.199
28 39 1.47 7.35 14.70 23.52 0.013 0.067 0.134 0.214
30 42 1.58 7.88 15.75 25.20 0.014 0.072 0.143 0.229
32 45 1.68 8.40 16.80 26.88 0.015 0.076 0.153 0.244
34 48 1.79 8.93 17.85 28.56 0.016 0.081 0.162 0.260
36 50 1.89 9.45 18.90 30.24 0.017 0.086 0.172 0.275
38 53 2.00 9.98 19.95 31.92 0.018 0.091 0.181 0.290
40 56 2.10 10.50 21.00 33.60 0.019 0.095 0.191 0.305
42 59 2.21 11.03 22.05 35.28 0.020 0.100 0.200 0.321
44 62 2.31 11.55 23.10 36.96 0.021 0.105 0.210 0.336
46 64 2.42 12.08 24.15 38.64 0.022 0.110 0.220 0.351
48 67 2.52 12.60 25.20 40.32 0.023 0.115 0.229 0.367
50 70 3 13 26 42 0.024 0.119 0.239 0.382

Appendix 4
63
SURFACE Pathway
Pollutant N
Load kg per Person/year (in liquid effluent leaving Septic Tank) 2.7
Persons Per House 2.8
PATHWAY
% of Load that will NOT be
removed by travel through
subsurface pathway
% of Load that will NOT be
removed in overland flow
% of Load Leaving Septic
tank that will reach
receptor
LOW Susceptibility 5
75
4
MODERATE Susceptibility 25 19
HIGH Susceptibility 50 38
VERY HIGH Susceptibility 80 60
Effective Rainfall mm/yr 500 N Impact Risk ranking
Low Flow reduction factor (Q90/Q50) 0.22 <2 2-3.6 3.6-5.6 >5.6
LOAD to Surfacewater kg N per year/km2 Low Flow Concentration in Surfacewater mg/l N
Housing
density
(per km2)
LOAD kg N
per year/
km2
LOW
Susceptibility
MODERATE
Susceptibility
HIGH
Susceptibility
VERY HIGH
Susceptibility
LOW
Susceptibility
MODERATE
Susceptibility
HIGH
Susceptibility
VERY HIGH
Susceptibility
2 15 0.57 2.84 5.67 9.07 0.005 0.026 0.052 0.082
4 30 1.13 5.67 11.34 18.14 0.010 0.052 0.103 0.165
6 45 1.70 8.51 17.01 27.22 0.015 0.077 0.155 0.247
8 60 2.27 11.34 22.68 36.29 0.021 0.103 0.206 0.330
10 76 2.84 14.18 28.35 45.36 0.026 0.129 0.258 0.412
12 91 3.40 17.01 34.02 54.43 0.031 0.155 0.309 0.495
14 106 3.97 19.85 39.69 63.50 0.036 0.180 0.361 0.577
16 121 4.54 22.68 45.36 72.58 0.041 0.206 0.412 0.660
18 136 5.10 25.52 51.03 81.65 0.046 0.232 0.464 0.742
20 151 5.67 28.35 56.70 90.72 0.052 0.258 0.515 0.825
22 166 6.24 31.19 62.37 99.79 0.057 0.284 0.567 0.907
24 181 6.80 34.02 68.04 108.86 0.062 0.309 0.619 0.990
26 197 7.37 36.86 73.71 117.94 0.067 0.335 0.670 1.072
28 212 7.94 39.69 79.38 127.01 0.072 0.361 0.722 1.155
30 227 8.51 42.53 85.05 136.08 0.077 0.387 0.773 1.237
32 242 9.07 45.36 90.72 145.15 0.082 0.412 0.825 1.320
34 257 9.64 48.20 96.39 154.22 0.088 0.438 0.876 1.402
36 272 10.21 51.03 102.06 163.30 0.093 0.464 0.928 1.485
38 287 10.77 53.87 107.73 172.37 0.098 0.490 0.979 1.567
40 302 11.34 56.70 113.40 181.44 0.103 0.515 1.031 1.649
42 318 11.91 59.54 119.07 190.51 0.108 0.541 1.082 1.732
44 333 12.47 62.37 124.74 199.58 0.113 0.567 1.134 1.814
46 348 13.04 65.21 130.41 208.66 0.119 0.593 1.186 1.897
48 363 13.61 68.04 136.08 217.73 0.124 0.619 1.237 1.979
50 378 14 71 142 227 0.129 0.644 1.289 2.062

Domestic Waste Water Treatment Systems — Risk Ranking
64

An Ghníomhaireacht um Chaomhnú ComhshaoilIs í an Gníomhaireacht um Chaomhnú Comhshaoil (EPA) comhlachta reachtúil a chosnaíonn an comhshaol do mhuintir na tíre go léir. Rialaímid agus déanaimid maoirsiú ar ghníomhaíochtaí a d’fhéadfadh truailliú a chruthú murach sin. Cinntímid go bhfuil eolas cruinn ann ar threochtaí comhshaoil ionas go nglactar aon chéim is gá. Is iad na príomh-nithe a bhfuilimid gníomhach leo ná comhshaol na hÉireann a chosaint agus cinntiú go bhfuil forbairt inbhuanaithe.
Is comhlacht poiblí neamhspleách í an Ghníomhaireacht um Chaomhnú Comhshaoil (EPA) a bunaíodh i mí Iúil 1993 faoin Acht fán nGníomhaireacht um Chaomhnú Comhshaoil 1992. Ó thaobh an Rialtais, is í an Roinn Comhshaoil, Pobal agus Rialtais Áitiúil.
ÁR bhFREAGRACHTAÍ
CEADÚNÚ Bíonn ceadúnais á n-eisiúint againn i gcomhair na nithe seo a leanas chun a chinntiú nach mbíonn astuithe uathu ag cur sláinte an phobail ná an comhshaol i mbaol:
• áiseanna dramhaíola (m.sh., líonadh talún, loisceoirí, stáisiúin aistrithe dramhaíola);
• gníomhaíochtaí tionsclaíocha ar scála mór (m.sh., déantúsaíocht cógaisíochta, déantúsaíocht stroighne, stáisiúin chumhachta);
• diantalmhaíocht;
• úsáid faoi shrian agus scaoileadh smachtaithe Orgánach Géinathraithe (GMO);
• mór-áiseanna stórais peitreail.
• scardadh dramhuisce
FEIDHMIÚ COMHSHAOIL NÁISIÚNTA • Stiúradh os cionn 2,000 iniúchadh agus cigireacht de
áiseanna a fuair ceadúnas ón nGníomhaireacht gach bliain.
• Maoirsiú freagrachtaí cosanta comhshaoil údarás áitiúla thar sé earnáil - aer, fuaim, dramhaíl, dramhuisce agus caighdeán uisce.
• Obair le húdaráis áitiúla agus leis na Gardaí chun stop a chur le gníomhaíocht mhídhleathach dramhaíola trí comhordú a dhéanamh ar líonra forfheidhmithe náisiúnta, díriú isteach ar chiontóirí, stiúradh fiosrúcháin agus maoirsiú leigheas na bhfadhbanna.
• An dlí a chur orthu siúd a bhriseann dlí comhshaoil agus a dhéanann dochar don chomhshaol mar thoradh ar a ngníomhaíochtaí.
MONATÓIREACHT, ANAILÍS AGUS TUAIRISCIÚ AR AN GCOMHSHAOL • Monatóireacht ar chaighdeán aeir agus caighdeáin
aibhneacha, locha, uiscí taoide agus uiscí talaimh; leibhéil agus sruth aibhneacha a thomhas.
• Tuairisciú neamhspleách chun cabhrú le rialtais náisiúnta agus áitiúla cinntí a dhéanamh.
RIALÚ ASTUITHE GÁIS CEAPTHA TEASA NA HÉIREANN • Cainníochtú astuithe gáis ceaptha teasa na hÉireann i
gcomhthéacs ár dtiomantas Kyoto.
• Cur i bhfeidhm na Treorach um Thrádáil Astuithe, a bhfuil baint aige le hos cionn 100 cuideachta atá ina mór-ghineadóirí dé-ocsaíd charbóin in Éirinn.
TAIGHDE AGUS FORBAIRT COMHSHAOIL • Taighde ar shaincheisteanna comhshaoil a chomhordú
(cosúil le caighdéan aeir agus uisce, athrú aeráide, bithéagsúlacht, teicneolaíochtaí comhshaoil).
MEASÚNÚ STRAITÉISEACH COMHSHAOIL • Ag déanamh measúnú ar thionchar phleananna agus
chláracha ar chomhshaol na hÉireann (cosúil le pleananna bainistíochta dramhaíola agus forbartha).
PLEANÁIL, OIDEACHAS AGUS TREOIR CHOMHSHAOIL • Treoir a thabhairt don phobal agus do thionscal ar
cheisteanna comhshaoil éagsúla (m.sh., iarratais ar cheadúnais, seachaint dramhaíola agus rialacháin chomhshaoil).
• Eolas níos fearr ar an gcomhshaol a scaipeadh (trí cláracha teilifíse comhshaoil agus pacáistí acmhainne do bhunscoileanna agus do mheánscoileanna).
BAINISTÍOCHT DRAMHAÍOLA FHORGHNÍOMHACH • Cur chun cinn seachaint agus laghdú dramhaíola trí
chomhordú An Chláir Náisiúnta um Chosc Dramhaíola, lena n-áirítear cur i bhfeidhm na dTionscnamh Freagrachta Táirgeoirí.
• Cur i bhfeidhm Rialachán ar nós na treoracha maidir le Trealamh Leictreach agus Leictreonach Caite agus le Srianadh Substaintí Guaiseacha agus substaintí a dhéanann ídiú ar an gcrios ózóin.
• Plean Náisiúnta Bainistíochta um Dramhaíl Ghuaiseach a fhorbairt chun dramhaíl ghuaiseach a sheachaint agus a bhainistiú.
STRUCHTÚR NA GNÍOMHAIREACHTA • Bunaíodh an Ghníomhaireacht i 1993 chun comhshaol na
hÉireann a chosaint. Tá an eagraíocht á bhainistiú ag Bord lánaimseartha, ar a bhfuil Príomhstiúrthóir agus ceithre Stiúrthóir.
• Tá obair na Gníomhaireachta ar siúl trí ceithre Oifig:
• An Oifig Aeráide, Ceadúnaithe agus Úsáide Acmhainní
• An Oifig um Fhorfheidhmiúchán Comhshaoil
• An Oifig um Measúnacht Comhshaoil
• An Oifig Cumarsáide agus Seirbhísí Corparáide
• Tá Coiste Comhairleach ag an nGníomhaireacht le cabhrú léi. Tá dáréag ball air agus tagann siad le chéile cúpla uair in aghaidh na bliana le plé a dhéanamh ar cheisteanna ar ábhar imní iad agus le comhairle a thabhairt don Bhord.

Printed on an environmentally friendly paper stock
Headquarters, PO Box 3000Johnstown Castle EstateCounty Wexford, Ireland
T +353 53 916 0600F +353 53 916 0699
E [email protected] 1890 33 55 99www.epa.ie
Regional InspectorateMcCumiskey House, Richview, Clonskeagh Road, Dublin 14, Ireland
T +353 1 268 0100F +353 1 268 0199
Regional InspectorateInniscarra, County Cork, Ireland
T +353 21 487 5540F +353 21 487 5545
Regional InspectorateSeville Lodge, Callan Road, Kilkenny, Ireland
T +353 56 779 6700F +353 56 779 6798
Regional InspectorateJohn Moore Road, CastlebarCounty Mayo, Ireland
T +353 94 904 8400F +353 94 902 1934
Regional InspectorateThe Glen, Monaghan, Ireland
T +353 47 77600F +353 47 84987
Regional OfficesAnnabella, Mallow, Co. Cork, Ireland
T +353 22 43865
The Civic Centre, Church St., Athlone, Co. Westmeath, Ireland
T +353 906 475722
Room 3, Raheen Conference Centre, Pearse House, Pearse Road, Raheen Business Park, Limerick, Ireland
T +353 61 224764