quality report on waste statistics 2014 generation of ... to eu regulation on waste statistics...
TRANSCRIPT

Quality Report
on Waste Statistics 2014 generation of waste and recovery and disposal of waste
according to EU Regulation on Waste Statistics
Sweden
Content
1. CONTACT 5
2. INTRODUCTION 6
3. QUALITY MANAGEMENT – ASSESSMENT 7
4. RELEVANCE 8
5. ACCURACY AND RELIABILITY 10
6. TIMELINESS AND PUNCTUALITY 26
7. ACCESSIBILITY AND CLARITY 27
8. COMPARABILITY 29
9. COHERENCE 43
10. COST AND BURDEN 44
11. CONFIDENTIALITY 45
12. STATISTICAL PROCESSING 46
13. COMMENT 57
14. RELATED METADATA 58
ANNEX 1. DESCRIPTION OF METHODS FOR DETERMINING WASTE GENERATION 59
ANNEX 2 WASTE GENERATION IN THE ECONOMY – SAMPLE SURVEY 61
ANNEX 3. WASTE GENERATION IN THE ECONOMY ON THE BASIS OF INFORMATION ON WASTE TREATMENT 65
ANNEX 4. WASTE GENERATION IN THE ECONOMY ON THE BASIS OF MODELS OR OTHER METHODS 66
ANNEX 5. DETERMINATION METHODS FOR WASTE GENERATED BY HOUSEHOLDS 71
4

1. Contact 1.1 Contact organisation Swedish Environmental Protection Agency
1.2 Contact organisation unit Name: Christina Jonsson, Staffan Ågren Telephone: +46 10-698 10 00 E-mail: [email protected] [email protected] Organisation: Swedish Environmental Protection Agency,
SE-106 48 Stockholm, Sweden
1.5 Contact mail address SE-106 48 Stockholm, Sweden
5
2. Introduction The Swedish Environmental Protection Agency (Swedish EPA) is responsible for reporting to the Commission according to the Waste Statistic Regulation and other waste related regulations, and for producing and publishing the official national statistics on waste according to the Swedish Ordinance on Official Statistics. The Swedish EPA has a framework agreement with the SMED consortium (Swedish Environmental Emission Data) for the provision of services regarding data collection, statistics production and the development of methodology for waste statistics production. The waste statistics with accompanying documentation have been produced by SMED. There have also been a large number of other organisations and authorities which have provided data to the production of the statistics.
6

3. Quality management – assessment Relevance and accuracy
For most economic activities (NACE), relevance and accuracy are good. However, for a few activities, data is more uncertain which is indicated with the “E” flag in GENER.
Timeliness
The time table was set up in order to deliver data to Eurostat and Swedish EPA in time, and the deadlines have been met.
Accessibility
Data is published in Statistics Sweden’s Statistical database1. The quality report and the report “Waste in Sweden 2014” will be published by Swedish EPA in June 2016.
Comparability
The regulatory framework and guidelines from Eurostat have been followed as far as possible. All surveys have been carried out to achieve 100% coverage of waste quantities. This should guarantee that the statistics are comparable with corresponding statistics from other member states. The current survey WStatR2016 is basically comparable to the prior surveys WStatR2014 and WStatR2012. Coherence
The Swedish official statistics on generated and treated waste are planned to be based on the same general statistical information, same general methods, scopes and limitations as other statistics that are to be reported to Eurostat.
1 http://www.scb.se/en_/Finding-statistics/Statistics-by-subject-area/Environment/Waste/Waste-generated-and-treated/
7

4. Relevance 4.1. Relevance - User Needs There are many different users of waste statistics - citizens, politicians, municipal, regional and national authorities, central government offices, industry, researchers, press reporters, private people, etc. The needs differ depending on type of user. Some users are interested in the total numbers from the statistics, whereas others are interested in certain NACE or sub-categories of NACE, or certain waste types.
4.2. Relevance - User Satisfaction Relevance (validity) refers in general to whether you measure what you intend to measure. Here, relevance refers also to how the statistics are used on a national level and how complete the produced statistics are (using the requirements in the waste statistics regulation as a starting point). Apart from the reporting obligations to the EU in accordance with the waste statistics regulation, statistics on waste generation and recovery and disposal of waste are needed in Sweden for the follow-up and development of environmental policies, the 16 national environmental quality objectives, the national waste management plan, and other action plans. The existing waste statistics are considered to be useful for both the follow-up and the development of action plans in this field, even if follow-up indicators and other uses based on the statistics need to be further developed.
4.3. Completeness Table 1. Description of missing data in data set 1 on waste generation.
Description of missing data (waste category, economic activity, ..)
Explanation How to overcome the deficit
No missing data in dataset 1. Table 2. Description of missing data in data set 2 and 3 on treated waste quantities
and capacities.
Description of missing data (waste category, treatment category, region, ...)
Explanation How to overcome the deficit
No missing data in dataset 2 and 3.
8

4.3.1. Data completeness – rate
The data on waste generation is considered to be complete, i.e. the rate is 100%. In those cells where the reported values are zero, there are strong indications that the combinations of waste and economic activities are actually not occurring. These indications are typically the fact that the waste item is not reported by any of the several hundred enterprises included in the survey, or that the combinations of activity and waste type is extremely unlikely.
The data on waste treatment is also considered to be complete for all facilities with permission (which covers all incineration with and without energy recovery, all landfilling, all other disposal, and most of the recovery, but not backfilling and recovery of inert wastes (mineral waste and soils) in smaller facilities , i.e. the rate is 100%. In those cells where the reported values are zero, the combinations of waste type and treatment method are not occurring. These indications are typically the fact that the waste item is not reported by any of the more than 1 500 activities included in the survey, and that the combination of activity and waste type is extremely unlikely.
9

5. Accuracy and reliability 5.1. Accuracy – overall Random errors are described under sampling errors below. Regarding bias, it is assumed to be negligible on a total level for non-hazardous waste, because the mining industry accounts for most of the non-hazardous waste and this industry is subject to a total survey. For hazardous waste, the main source of bias is the assumptions made in estimation of hazardous waste in NACE G-U excl 46.77. However, we have not been able to quantify this potential bias.
5.2. Sampling error Sampling errors may occur when a selection of the local units/facilities/enterprises that are included in the group in question is surveyed. The error is due to the degree of variation in the data and can be controlled by choosing the right sample design. In the sample surveys the sampling errors are assessed by the coefficients of variation.
In cases where data on the generation of waste and on the recovery and disposal of waste have been produced from surveys (questionnaire or environmental reports as the data source), sampling errors (coefficients of variation) are estimated together with the estimates of population totals for each waste category. Surveys are used for estimation of waste generation in mining and quarrying and manufacturing industries. Web surveys were used for NACE 10-12, 17-18, 20-22, 23, 24-25 and 26-30. Environmental reports were used for generation in NACE 05-09, 10-12, 17-18, 19, 20-22, 23, 24-25, 26-30, 38 and 46.77. For NACE 05-09, 19, and 38.1-2 a total survey of environmental reports is the only data source, and hence there are no sampling errors in these industries. In NACE 38.3 and 46.77 environmental reports from all facilities with permission to treat waste (from environmental court or county administrative boards) are used for adjustment to cover facilities with missing data.
10

−−
−= ∑
∑∑
=
=
=
h
h
m
k h
m
khk
hkhh
hH
h h
hz m
zz
mNm
mN
tV1
2
12
1
2
111)ˆ(ˆ
The variance is calculated according to the formula:
where
The mean error of the estimate is then calculated using
and the relative mean error (rmf) or coefficient of variation is calculated as
In the tables reported, the variance coefficients are expressed as per cent of the point estimate.
In NACE 01-03, 41-43, G-U excl 46.77 and households, only macro data and/or waste factors are used and hence sampling error is not applicable for these sectors.
For disposal and recovery of waste all facilities with a permission to treat waste is surveyed by environmental reports.
5.2.1. Sampling error – indicators
Uncertainties in key aggregates
Table 3 presents the key aggregates reported. For waste generation, coefficients of variation are calculated as the overall standard deviation from the sample surveys in relation to the estimated total amount of waste. Only administrative data sources are used for waste generation from households, and hence there is no sampling error. The mining industry (05 – 09) accounts for 83% of the non-hazardous wastes generation from enterprises. Since a total survey is conducted for this industry, the contribution to the sampling error is zero for non-hazardous waste.
( )t̂
t̂SErmf =
( ) ( )t̂V̂t̂SE =
= point estimate
H = number of strata
= population in stratum h
= total responses in stratum h
11
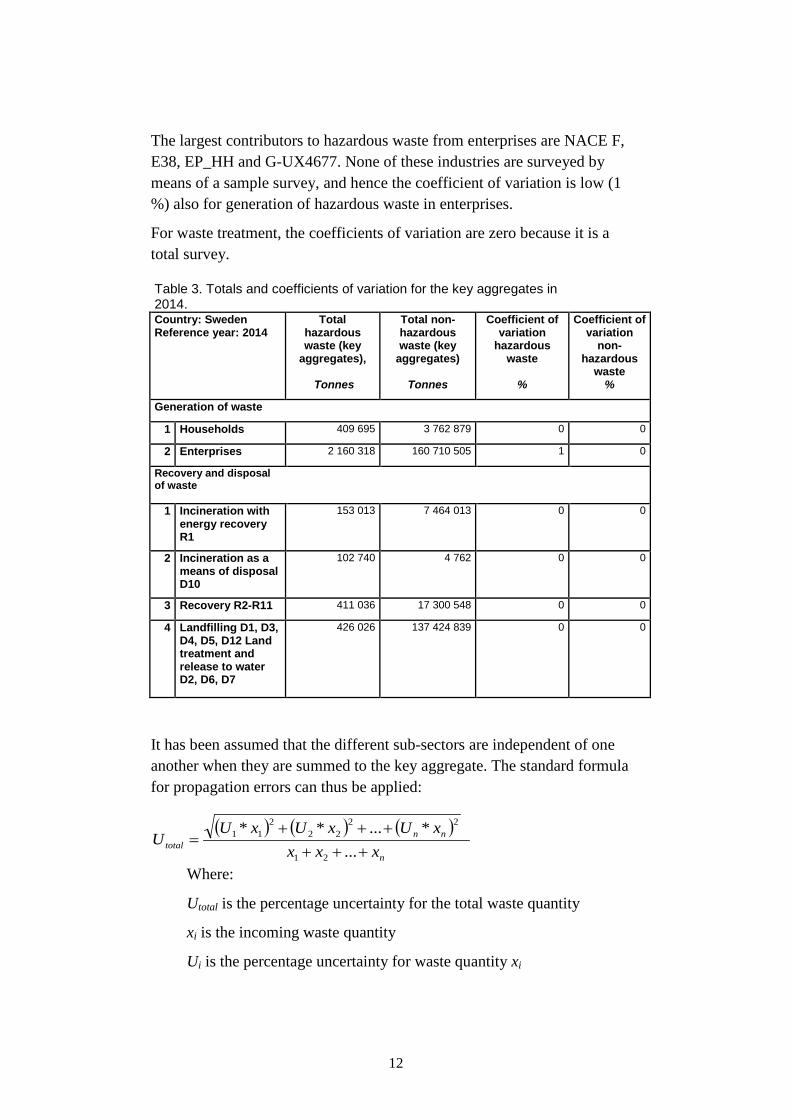
The largest contributors to hazardous waste from enterprises are NACE F, E38, EP_HH and G-UX4677. None of these industries are surveyed by means of a sample survey, and hence the coefficient of variation is low (1 %) also for generation of hazardous waste in enterprises.
For waste treatment, the coefficients of variation are zero because it is a total survey. Table 3. Totals and coefficients of variation for the key aggregates in 2014.
Country: Sweden Reference year: 2014
Total hazardous waste (key
aggregates),
Total non-hazardous waste (key
aggregates)
Coefficient of variation
hazardous waste
Coefficient of variation
non-hazardous
waste Tonnes Tonnes % %
Generation of waste
1 Households 409 695 3 762 879 0 0
2 Enterprises 2 160 318 160 710 505 1 0
Recovery and disposal of waste
1 Incineration with energy recovery R1
153 013 7 464 013 0 0
2 Incineration as a means of disposal D10
102 740 4 762 0 0
3 Recovery R2-R11 411 036 17 300 548 0 0
4 Landfilling D1, D3, D4, D5, D12 Land treatment and release to water D2, D6, D7
426 026 137 424 839 0 0
It has been assumed that the different sub-sectors are independent of one another when they are summed to the key aggregate. The standard formula for propagation errors can thus be applied:
Where:
Utotal is the percentage uncertainty for the total waste quantity
xi is the incoming waste quantity
Ui is the percentage uncertainty for waste quantity xi
( ) ( ) ( )n
nntotal x...xx
x*U...x*Ux*UU
++++++
=21
2222
211
12
For all the sub-categories that are not subject to sample surveys, Ui = 0. Waste treatment is surveyed by a total survey to all registered waste treatment facilities. Since it is a total survey the variation coefficient is 0.
5.3. Non-sampling error In the Swedish reporting to WStatR, sample surveys account for only part of the estimates and hence various types of non-sampling errors are the main contributors to the total survey error (TSE).
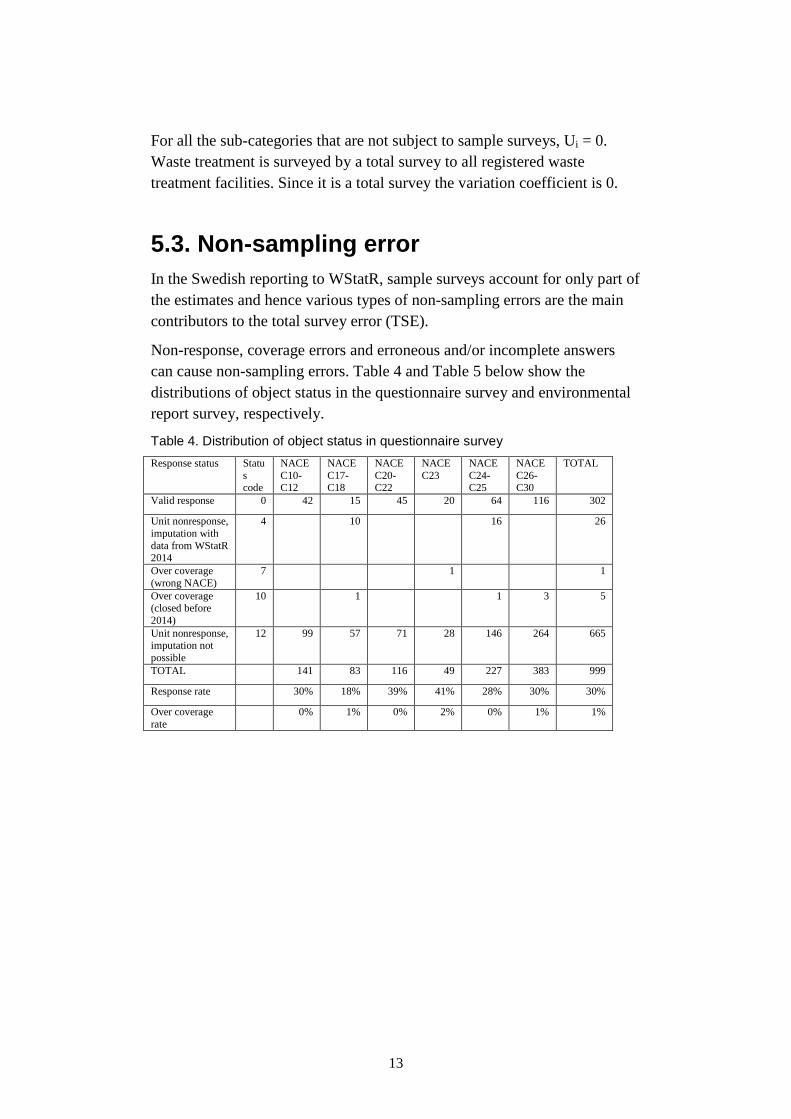
Non-response, coverage errors and erroneous and/or incomplete answers can cause non-sampling errors. Table 4 and Table 5 below show the distributions of object status in the questionnaire survey and environmental report survey, respectively.
Table 4. Distribution of object status in questionnaire survey Response status Statu
s code
NACE C10-C12
NACE C17-C18
NACE C20-C22
NACE C23
NACE C24-C25
NACE C26-C30
TOTAL
Valid response 0 42 15 45 20 64 116 302
Unit nonresponse, imputation with data from WStatR 2014
4 10 16 26
Over coverage (wrong NACE)
7 1 1
Over coverage (closed before 2014)
10 1 1 3 5
Unit nonresponse, imputation not possible
12 99 57 71 28 146 264 665
TOTAL 141 83 116 49 227 383 999
Response rate 30% 18% 39% 41% 28% 30% 30%
Over coverage rate
0% 1% 0% 2% 0% 1% 1%
13

Table 5. Distribution of object status in environmental reports Response status Stat
us code
B C10-C12
C17-C18
C19 C20-C22
C23 C24-C25
C26-C30
E38 and 4677
TOTAL
Valid response 0 19 92 64 13 86 28 135 80 567 1084
No waste generated
1 2 231 233
Some items imputated
2 1 1 1 86 89
All items imputated
3 2 1 30 33
Env. report not accessible, imputation with data from WStatR 2014
4 1 3 5 9
Env. report not accessible, imputation not possible
5 1 4 2 53 60
Env. report not complete, imputation not possible
6 15 1 14 3 26 22 127 208
Over coverage (wrong NACE)
7 5 1 142 148
Over coverage (duplicate)
8 1 1
Over coverage (closed before 2014)
10 2 1 30 33
Over coverage (not active in 2014)
11 1 1 1 1 39 43
TOTAL 24 115 67 15 103 31 169 106 1311 1941
Proportion of missing or incomplete reports
0% 16% 3% 7% 16% 10% 20% 24% 23% 21%
Over coverage rate 13% 4% 1% 7% 1% 0% 1% 1% 16% 12%
14
5.3.1. Coverage error
Coverage errors regarding the population occur when the survey method results in:
• Waste quantities from some local units/facilities are included in the target group, but not included (is missing) in the survey. This is known as “under-coverage”.
• The same local unit or facility is included in several sub-surveys, known as “over-coverage”.
Coverage errors lead to waste quantities either being missed or counted twice. Under- and over-coverage problems that have been detected in connection to the collection of data include:
• Local units with incorrect NACE codes in the business register. • Out-of-date information in the business register on local units that
are no longer active or new enterprises starting during the last year (under-coverage).
To compile data adapted to the waste statistics regulation, different methods have been used for different sectors. In the surveys for waste generation reaching 100 % coverage has been aimed for by the following strategies/techniques:
• In sample surveys, waste generation in small local units below cutoff (less than 10 employees) has been covered by multiplying each reported amount of waste by a factor defined as
𝑛𝑢𝑚𝑏𝑒𝑟 𝑜𝑓 𝑒𝑚𝑝𝑙𝑜𝑦𝑒𝑒𝑠 𝑖𝑛 𝑡ℎ𝑒 𝑝𝑜𝑝𝑢𝑙𝑎𝑡𝑖𝑜𝑛𝑛𝑢𝑚𝑏𝑒𝑟 𝑜𝑓 𝑒𝑚𝑝𝑙𝑜𝑦𝑒𝑒𝑠 𝑖𝑛 𝑢𝑛𝑖𝑡𝑠 𝑎𝑏𝑜𝑣𝑒 𝑐𝑢𝑡𝑜𝑓𝑓
• When using waste factors, activity data that covers the whole sector have been used when applicable (e.g. turn-over, number of employees).
• When using other methods (e.g. surveying only major enterprises as in NACE 38.3 and 46.77) proportional adjustment to reach 100 % coverage has been made. The adjustment factor has been assessed by for example number of employees or turn-over.
Depending on the size and activity, waste treatment facilities can be divided into three categories:
• “A activities” requires a permission from the environmental court. Larger waste incineration plants, landfill sites, composting plants, anaerobic digestion plants and industrial plants are A activities. All A activities are obliged to annually upload an environmental report with waste data to the Swedish Portal for Environmental Reporting (SMP).
15
• “B activities” requires permission from the county administrative boards. Other waste incineration plants, landfill sites, composting plants, anaerobic digestion plants and industrial plants that are B activities. All B activities are obliged to annually upload an environmental report with waste data to (SMP).
• “C activities” requires an application to the local authority, usually the municipality. Examples of C activities are some preparatory treatment and storage, and smaller facilities that use soils and mineral waste from construction and demolition for backfilling or construction purposes. C activities are generally not obliged to upload environmental reports to SMP.
In the survey of waste treatment all A and B activities that manage waste are investigated (about 1500 activities), and therefore no facility was excluded from the frame. The C activities (estimated to more than 3000 activities) were not included in the frame. Compared to A and B activities, C activities are considered to be of less importance regarding amount of waste treated (on national total level). C activities don’t report to SMP and are not registered in SMP. Thus Sweden lacks a comprehensive national data source/inventory that covers C activities. The lack of data, combined with the assumption that C activities are of less importance when it comes to waste treatment, is the reason why the C activities are not surveyed. Recent pilot studies though, indicate that, on national total level, C activities can in fact contribute to a non-negligible amount of treated waste for some waste categories (for example soils). This will be further investigated for future WStatR.
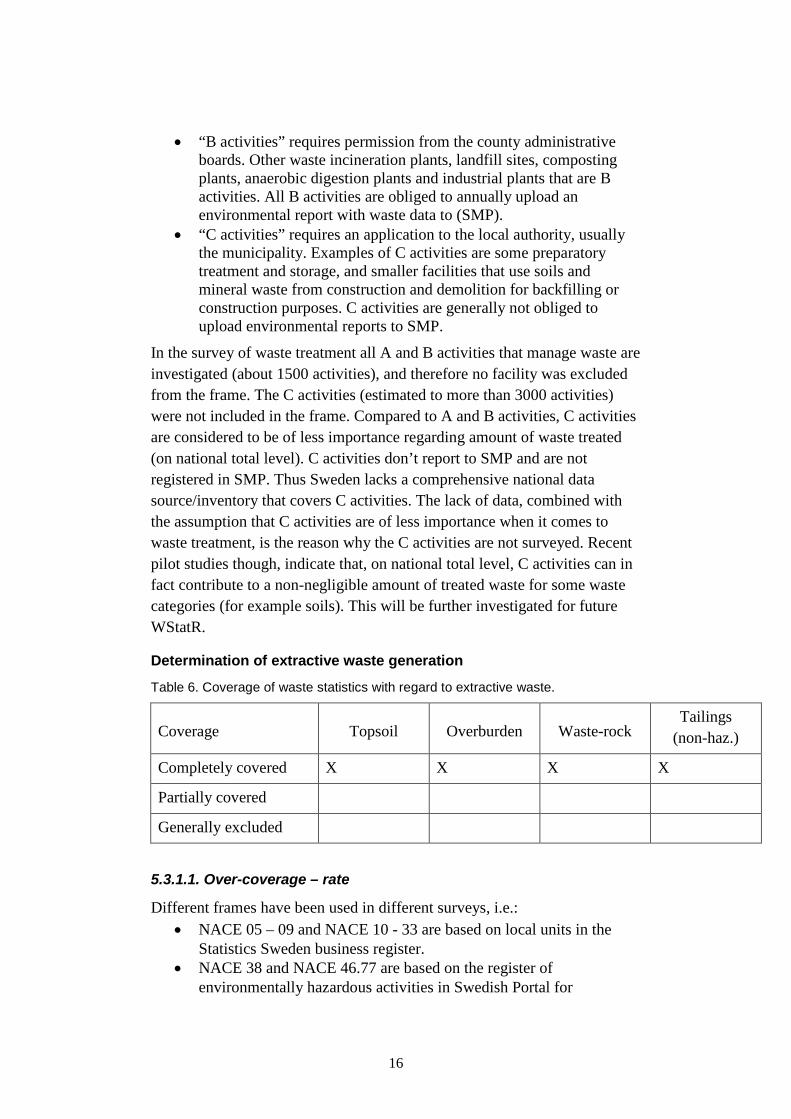
Determination of extractive waste generation Table 6. Coverage of waste statistics with regard to extractive waste.
Coverage Topsoil Overburden Waste-rock Tailings
(non-haz.)
Completely covered X X X X
Partially covered
Generally excluded
5.3.1.1. Over-coverage – rate
Different frames have been used in different surveys, i.e.: • NACE 05 – 09 and NACE 10 - 33 are based on local units in the
Statistics Sweden business register. • NACE 38 and NACE 46.77 are based on the register of
environmentally hazardous activities in Swedish Portal for
16

Environmental Reporting (SMP) operated by the county administrative boards and the Swedish EPA, which covers facilities with permits for environmentally harmful operations according to the Environmental Code. Facilities with permits for the treatment of waste were selected from this database.
• The frame of waste incineration plants in NACE 35 is based on the annual energy statistics survey (Electricity supply, district heating and supply of natural and gasworks gas 2014)
This may lead to over-coverage (object being counted twice in several surveys) as well as under-coverage (an object being missed by several frames). The different frames have been checked against each other with the aim of detecting objects that have appeared in several of the frames. Any cases identified where data have appeared twice have been corrected. It is hence assumed that no data have been counted twice.
Local units have been used as statistical unit in the surveys of Mining and Quarrying and Manufacture. In the surveys of NACE 38 and 46.77 facilities were applied. A "facility", in this case, is a unit that has permission for environmental hazardous activities and is registered in SMP. Usually a facility is equivalent to local unit, but there are exceptions since the facility is based on the environmental hazardous activities and the local unit is based on the economic activities. There are examples where one local unit consists of two or more facilities (two separate permissions), as well as where one facility consists of two or more local units. This causes coverage problems in those sectors where the frame is based on the business register, i.e. local units, while the data is actually collected on facility level. We have tried to overcome this problem by checking that each local unit is only counted in one of the sub populations (web-survey and environmental reports population respectively). In a few cases, data from one environmental report had to be distributed over several local units belonging to different strata.
There is a risk that several types of activities can occur at the same local unit. This is a problem only if the combination of activities leads to a classification under NACE codes outside the reporting sectors. We do not know how big this particular problem is, and we do not have a method or the intention of solving it. This does not have any influence on the total amount, but may affect the distribution of waste between different sectors. Rates of over coverage detected in the questionnaire survey and environmental report survey, respectively, are shown in Table 4 and Table 5 above.
17
Coverage errors regarding waste quantities
The methods used are intended to give 100% coverage of waste generation, waste treatment and capacities. There is no reason to suspect that over- and under-coverage occurs to a greater extent than that which is described under the errors noted below.
As mentioned earlier, there may be an under-coverage of recovery of soils and mineral waste from construction and demolition – smaller facilities do not need permission (only application to the local authority), and they are not included in the survey of waste treatment. This will also have an influence of the generation of the same wastes, since the generated amounts are estimated from treated amounts.
Another possible under-coverage is when wastes, usually well-defined “clean” wastes, are used as fuel or raw material in industries. We have discovered several examples where the industries do not report this in the environmental report as waste treatment. We have tried to identify most of these facilities.
The definition of waste has been interpreted according to European regulation and practices. After 2008 there has been a tendency towards classifying some rest-products as by-products instead of waste. This means that rest products that earlier have been included in the waste statistics are no longer included. A difficulty is when a waste generator and a waste treatment facility classify the same rest-product in different ways. Since waste generation and waste treatment are, more or less, separate surveys there are usually no possibilities to discover those discrepancies. It is a recognized task for the supervising authorities to give guidance so the classifying of rest products as waste and by-product becomes harmonized in all parts of the waste management chain.
5.3.2. Measurement error
Measurement errors can occur when incorrect data are received from respondents (in questionnaires or in environmental reports) and are not corrected during reviewing. Furthermore, estimated values have been permitted in the surveys. This can affect the precision of the reported quantities.
Classification errors
The information in environmental reports is not always unambiguous. The information can sometimes be interpreted in different ways, for example classification of waste (e.g. when the waste is called only "sludge") or treatment (e.g. is it a pre-treatment or is it a final treatment).
18

The corresponding error may also arise in questionnaire surveys. The respondents have to make the interpretation of which information that should be reported in the questionnaire and how, and there is an obvious risk for misunderstanding and misinterpretation.
In the questionnaires and in the use of environmental reports we have primarily used LoW codes to label the waste. However, in many cases, both in questionnaires and environmental reports, as well as in both waste generation and waste treatment, the respondents do not always apply the LoW classification, but use their own nomenclature, for example naming wastes as “other waste”, “rest waste”, “oil waste”,” sludge”, “combustible waste”, “landfill waste”, and similar. For those cases we have made a reclassification to LoW. However, several waste types are difficult to unambiguously classify to LoW or EWC-Stat:
1. "Oil wastes" (waste that contains oil) can be classified under several different LoW codes which can several different EWC-Stat categories such as 01.3H, 03.2H, 02H, 10.2H, and 08H.
2. "Sludge" can be classified in a lot of different ways giving different EWC-Stat categories such as Industrial effluent sludge (03.2), Sludges and liquid wastes from waste treatment (03.3) or Common sludge (11), but can also be other categories such as EWC-Stat 12, 09.2, 09.1, 02H, 01.3H.
3. “Ash” and “slag” can mean both EWC-Stat 12.4 and 12.8. 4. “Other wastes” and “rest wastes” have usually been classified as
EWC-Stat-10.2, unless further information was given, but could have been other wastes.
Errors in precision of quantities
Most waste quantities are based on weighing. In principle all major waste management facilities are equipped with weighing-machines. Figures from waste generators are usually based on data from the waste management facilities.
Conversion factors have been used if other units have been reported. Conversion factors have been obtained from data from respondents and other experts, including Swedish Waste Management (Avfall Sverige), Statistics Sweden’s energy statistics, etc. Some of the conversion factors are not particularly controversial, such as tonne per m3 of oil or tonne per m3 of sludge. Problems have occurred when the waste has been mixed, for example, or when we do not know whether the waste has been compressed or not. The same conversion factors have been used in all sub-surveys for similar wastes. Some waste types are sometimes given in number of items, for example refrigerators, freezers, fluorescent tubes, other sources of light,
19
and similar. These have been converted to weight by different weight conversion factors.
When checking the data in the environmental reports and questionnaires, we have carried out a rationality test: is the type of waste reasonable for the sector, is the magnitude reasonable, is there some other type of waste not given that should arise in the sector, etc. In several cases, we have detected relatively large errors in the submitted responses/environmental reports. There can however still be incorrect responses/data that we have not detected. It is difficult to quantify these errors but we have made a lot of effort to eliminate them.
Questionnaires were used in WStatR 2016. The forms and the design of the survey have been discussed with the Board of Swedish Industry and Commerce for Better Regulation (NNR). The questionnaires have also been discussed with Statistics Sweden's questionnaire design department. This effort was made to eliminate risks of misunderstanding etc.
5.3.3. Nonresponse error
The response rate for the web surveys on waste generation was 33 percent on the total level. However, on the aggregate level, the response rate is much better because all facilities with significant environmental impact were surveyed by using environmental reports, where unit nonresponse (i.e. the environmental report is missing or does not include the relevant information) is very rare, except in NACE 26-30 and NACE 38.
In NACE C17-18 and C24-25, data from the survey regarding 2012 was used for imputation of unit nonresponse when possible, but usually a proportional adjustment to compensate for the non-response was made, that is, linear expansion within each stratum. Thus it was assumed that each stratum is homogeneous and that the respondents are representative for the non-respondents. The non-response adjustment and the sample adjustment are made at the same time. Such adjustments have been made for the surveys in Manufacture Industry. With the assumption that the population is homogeneous within each stratum, the coefficient of variation will reflect the uncertainties arisen by the variation within the sample group.
In the waste generation survey for NACE 38.1 and 38.2 there was non-response due to environmental reports with classified information or with missing information about waste generation. No compensation for these rare cases was made, and hence there is a small negative nonresponse bias in waste generation in NACE 38.
Also, in the survey of waste treatment there was non-response due to environmental reports with classified information or with missing
20

information about waste treatment. This also leads to a small negative nonresponse bias.
The description above concerns unit non-response. Item non-response can also occur. In NACE B 05-09, item non-response on mining waste has been imputed with data from Geological Survey of Sweden (SGU). Apart from this, no adjustment for item nonresponse has been made because it is not obvious which types of waste that should occur for a specific facility.
When making adjustments for non-response at least two different errors can occur:
1. Straight expansion within strata is based on the assumption that the responding and non-responding parts of the population have similar properties regarding the parameters that are surveyed, in this case waste generation. If this assumption is wrong and waste generation is systematically lower or higher in non-responding units than in the responding units used for estimation, straight expansion leads to over- or underestimation.
2. Some of the objects in the sample could be extreme in some way. An extreme value together with a high design weight and/or low response rate implies a risk for errors. The result can be a large over-estimation of a particular type of waste. This risk for error is not easy to detect if the error is not so large that experienced waste and industry experts can detect it when checking various compilations. However, extreme outliers have been reallocated to separate strata (with weight = 1) in order to avoid over estimation when straight expansion is used. The weights of the objects remaining in the original strata have been adjusted accordingly.
5.3.3.1. Unit non-response – rate
On total level, the unit non-response rate in the web-survey was 67%. (In Sweden, it is not mandatory to reply on the waste survey). For environmental reports, 88 of the 629 sampled reports in the mining and quarrying and manufacturing industries were missing or did not contain useful information (see status codes 5 and 6 in Table 5 above).
21
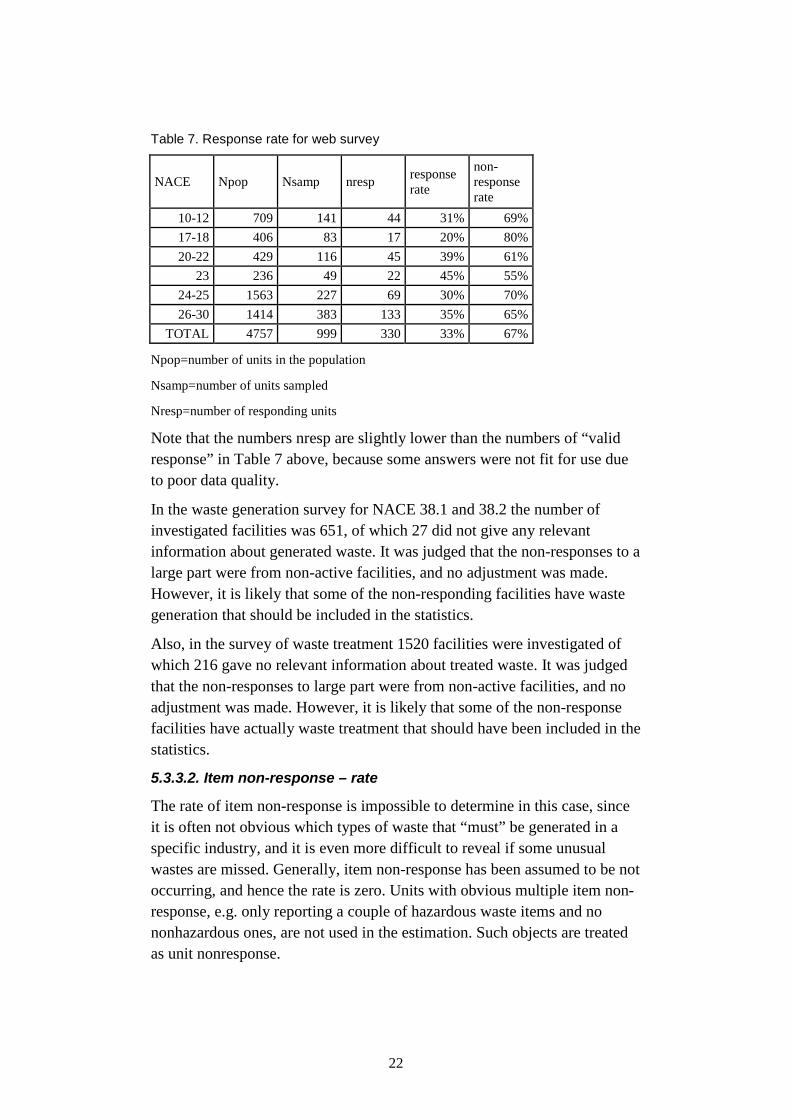
Table 7. Response rate for web survey
NACE Npop Nsamp nresp response rate
non-response rate
10-12 709 141 44 31% 69% 17-18 406 83 17 20% 80% 20-22 429 116 45 39% 61%
23 236 49 22 45% 55% 24-25 1563 227 69 30% 70% 26-30 1414 383 133 35% 65%
TOTAL 4757 999 330 33% 67%
Npop=number of units in the population
Nsamp=number of units sampled
Nresp=number of responding units
Note that the numbers nresp are slightly lower than the numbers of “valid response” in Table 7 above, because some answers were not fit for use due to poor data quality.
In the waste generation survey for NACE 38.1 and 38.2 the number of investigated facilities was 651, of which 27 did not give any relevant information about generated waste. It was judged that the non-responses to a large part were from non-active facilities, and no adjustment was made. However, it is likely that some of the non-responding facilities have waste generation that should be included in the statistics.
Also, in the survey of waste treatment 1520 facilities were investigated of which 216 gave no relevant information about treated waste. It was judged that the non-responses to large part were from non-active facilities, and no adjustment was made. However, it is likely that some of the non-response facilities have actually waste treatment that should have been included in the statistics.
5.3.3.2. Item non-response – rate
The rate of item non-response is impossible to determine in this case, since it is often not obvious which types of waste that “must” be generated in a specific industry, and it is even more difficult to reveal if some unusual wastes are missed. Generally, item non-response has been assumed to be not occurring, and hence the rate is zero. Units with obvious multiple item non-response, e.g. only reporting a couple of hazardous waste items and no nonhazardous ones, are not used in the estimation. Such objects are treated as unit nonresponse.
22
5.3.4. Processing error
Processing errors occur when the raw data are processed in various ways during the data production. The following processing errors can occur:
• Editing errors. In the surveys, all the submitted questionnaires and environmental reports are checked and corrected. Minor errors have been corrected and some imputations have been carried out when data were missing.
• Input errors. The environmental reports are checked and reviewed in paper format or pdf format, and then the data has been entered into a database manually. When entering the data, the “right figure” can be input in the “wrong place”, or a mistake can be made (e.g. one digit too few or too many). The database also has a built-in system to prevent some of the most common input errors (for example only approved classification codes for waste classification as well as treatment method).
• Coding errors. If a waste or treatment method is described in free text, the waste or treatment code must be assessed manually which could lead to coding errors. These errors can occur when the person checking the questionnaire or environmental report misunderstands the responses and makes an incorrect amendment.
The processing errors mentioned above have been avoided by regularly checking the results. The project group has checked the results several times (individual types of waste in every reporting sector or sub-survey) in order to identify extraordinary values. Checks are made both before and after the input to the database. Industry experts, both within SMED and within the Swedish EPA, have also carried out review, assessing the rationality of the produced data.
5.3.4.1. Imputation – rate
Numbers of units per industry and survey for which all or some data is imputed are shown in Table 4 and Table 5 above. Rates in terms of amounts of waste have not been calculated as it is not systematically documented exactly which items that are imputated for partly imputated units.
In the survey of waste generation in NACE 38.1-2 there were 651 investigated facilities, of which waste data waste imputed for 25.
In waste treatment 1520 facilities were investigated. Waste data was imputed for 29 of them.
5.3.4.2. Common units – proportion
Ideally, there should be no common units since the web survey frame has been constructed as the complement to the register of environmental
23

hazardous activities (SMP). However, due to the different unit definitions, in total 16 units sampled in the web survey showed to be included in SMP. 5.3.5. Model assumption error Data from earlier surveys has been reused for some industries, which have shown to have only small amounts of waste, especially small amounts of hazardous waste. These industries and sub categories generally have small amounts of waste according to earlier surveys. It is to expect that the waste quantities in these industries change over time, but these changes have a very small impact on the total flow of each waste type.
Adjustments of macro data collected from various sources
In e.g. NACE 01-03, 41-43 and G-U excl 46.77, the data available covers only part of the population, and various assumptions have been made to estimate the amounts for the whole population. Typically, waste generation is assumed to be proportional to turnover, number of employees etc. but these assumptions have not been verified.
Waste from small enterprises
None of the surveys cover the entire population in the industries surveyed. Waste generated in local units with less than 10 employees is estimated by means of cutoff expansion as described under “Coverage errors“.
Proportional adjustments
In NACE 38.3 and NACE 46.77 only major facilities were investigated (usually facilities that have permission to handle more than 10 000 tonnes of waste per year). A proportional adjustment based on the number of employees (metal facilities in one group and non-metal in another) has been made. This calculation is based on the assumption that the waste generation is the same per employee in small enterprises as in big enterprises.
Waste factors
The main problem with waste factors is that only one or a few factors that can affect the amount of generated waste is reflected by the factor. For example, if the factor is expressed as tonnes of waste per employee, the change in amounts of generated waste between two years only mirrors the change in number of employees and does for example not capture any measures taken to reduce the amount of waste generated per employee or improved sorting at source in different waste types.
Waste factors have been used in several cases. In some cases the factors are based on current measurements, e.g. household waste from enterprises,
24

paper waste from offices. These factors can be regarded as rather accurate. In other cases data from pilot studies, e.g. degradable wastes from shops and restaurants have been used.
The office paper factor has been projected by dividing the quantity of office paper waste by the number of assumed office workers in all industries. A selection of different professions has been regarded as “office workers”, such as accountants, administrators and many consultants. The distribution of these professions in different industries has been calculated using national labor statistics. The quantity of office paper waste on national level is an accurate number, although the distribution of "office workers" is uncertain. In those industries where this factor is applied, there is an under estimation of paper waste because only office paper is reported, not other types of paper waste such as packaging waste from services.
5.3.6. Data revision
5.3.6.1. Data revision – policy
Normally, no data revisions are made unless special reasons exist, e.g. new standards or requirements from Eurostat.
5.3.6.2. Data revision – practice
When errors have been detected in the Eurostat review process, corrected data has been reported to Eurostat.
5.3.6.3. Data revision - average size
Generally, revisions are small.
5.3.7. Seasonal adjustment
Not relevant since the statistics only includes annual data.
25

6. Timeliness and punctuality A general time schedule for the reporting according to the EU waste statistics regulation is shown in Table 8.
Table 8. Time schedule for reporting waste statistics
Activity Start Completed Planning, preparations and supplementary method developments October 2014 March 2015 Data collection and processing March 2015 Feb 2016 Compilation of statistics Sept 2015 March 2016 Compilation of checking documentation September 2015 April 2016 Drafting of Quality Report Jan 2016 April 2016 Final checking of statistics and documentation Feb 2016 May 2016 Data processing (checks of accuracy, completeness etc.) Jan 2016 March 2016 National independent controls and approval for reporting October 2015 May 2016 Drafting of national statistical report Jan 2016 May 2016 Supplementary work, follow-up, archiving June 2016 September 2016 Delivery of statistics and quality report to Eurostat 30 June 2016 or
earlier National publication of statistical reports and available statistics in public database
June 2016
6.1. Timeliness 6.1.1. Time lag - first result
The time lag between the end of the reference period and the publishing date is around 18 months.
6.1.2. Time lag - final result
Final results are submitted to Eurostat two weeks after the publishing date.
6.2. Punctuality 6.2.1. Punctuality - delivery and publication
All data and publications were delivered in time. No delays to report.
26
7. Accessibility and clarity Statistics on waste generation and recovery and disposal of waste and the current quality report are planned to be published on the website of the Swedish EPA2, when reporting to Eurostat is complete. A report will be published in June 2016, in which the numerical material will be presented and discussed. Also, the statistics will be available in Statistic Sweden´s public database.
The intention for this quality report is to be a resource for more advanced statistical users in order to increase clarity regarding methods and checking procedures, for example.
The statistics have been collected according to the Official Statistics Act and the Public Access to Information and Secrecy Act.
7.1. Dissemination format - News release Swedish EPA is responsible for dissemination formats, e.g. press releases.
7.2. Dissemination format – Publications Report: Waste in Sweden 2014 will be published by Swedish EPA in June, 2016.
7.3. Dissemination format - online database 7.3.1. Data tables – consultations
Data tables are published in Statistics Sweden’s public database3. During the first quarter of 2016, 250 requests were made.
7.4. Dissemination format - microdata access Not applicable. Micro data is confidential and no public user files are produced.
7.5. Documentation on methodology 2 www.naturvardsverket.se 3 http://www.scb.se/en_/Finding-statistics/Statistics-by-subject-area/Environment/Waste/Waste-generated-and-treated/
27

7.5.1. Metadata completeness – rate
Not applicable.
7.5.2. Metadata – consultations
Not applicable.
7.6. Quality management – documentation SMED has its own quality management documentation, which was used during the project.
7.7. Dissemination format – other Not applicable.
28

8. Comparability The regulatory framework and guidelines from Eurostat have been followed as far as possible. All surveys have been carried out to achieve 100% coverage of waste quantities. This should guarantee that the statistics are comparable with corresponding statistics from other member states. However, the following areas should be highlighted as somewhat problematic concerning comparability:
• The concept household waste contains, apart from waste generated by households, both in practice and legally, also similar waste from shops, offices and other business. The majority of waste flows, such as bag and dustbin waste, packaging waste, electronic scrap, etc. contain both waste generated by households and waste from different operations. For every waste flow included in household waste (according to EWC-Stat), an assessment has been made by industry experts of how much originates from households and how much from other operations.
• The distinctions between waste and by-products have had a considerable effect on the statistics and hence on comparability with other countries. Different countries may have different practices how to handle the by-products in the waste surveys.
• Local unit, establishment, facility, station have mostly been used as survey objects. A local unit, establishment, facility or station can have several different activities, one main activity and several secondary activities. In this case the entire local unit, establishment, facility, station has been classified by its main activity. For example, coking plants can be found at steelworks. Independent coking plants should be classified as NACE 19 and steelworks as NACE 24. In our survey, coking plants at steelworks have been classified as belonging to NACE 24, and the waste generated there has been allocated to NACE 24.
8.1 Comparability – geographical The same methods are used in all parts of the country.
For the generation of waste and the recovery and disposal of waste, mobile equipment has been reported where it has been used. Capacity data have, however, been reported in the municipality where it is registered. Only very few mobile operations have been found in the surveys, so the locations of these facilities is not considered to have any significant impact on the total reported quantities of waste or treatment capacities.
29

Table 9. Description of classification used.
Name of classification(s) used
Description of the classification(s) (in particular compatibility with WStatR requirements)
Economic activities SNI 2007 National classification based on NACE REV 2. Four first digits identical.
Waste types List of waste Converted into EWC-STAT Ver. 4 with conversion key
Recovery and treatment operations
Disposal operations and Recovery operations (so-called R code and D code) according to Annex I and Annex II in the Waste Directive
Converted to recovery and disposal operations according to WStatR The national statistics is presented in a less aggregated form (recovery is presented in several classes)
8.1.1. Asymmetry for mirror flow statistics – coefficient
This measure has not been calculated.
8.2. Comparability - over time The current survey WStatR2016 is basically comparable to the prior surveys WStatR 2014 and WStatR2012. All surveys follow the guidelines from Eurostat, why they should be comparable over time.
Data on waste generation and waste treatment have as far as possible been checked against other administrative data and other sources, e.g. Avfall Sverige (Waste Management Sweden), trade organisations, earlier surveys and other international reporting, such as packaging waste, ELV, dredging spoils, etc.
There were earlier some changes that gave relatively large changes between WStatR2008 and WStatR2010 due to the new categories of EWC-Stat in the reporting and rearrangement of the sectors following the NACE revision.
Over the years there have also been some changes in methodology and interpretations described in earlier quality reports:
• The amounts of rest products classified as by-products are increasing. In the first surveys (WStatR2006 and WStatR2008) these rest products were reported as waste, but not in later reporting. For example, there are two waste types in the steel sector which now have been classified as by-products: electric arc furnace slag and blast furnace slag. In paper industry bark and wood residues that are used as fuel have been classified as by-products.
30
The results so far have shown that there sometimes may be relatively large uncertainties associated with some results. This means that even if the results are comparable, it can be difficult to interpret the differences. The differences can, in some cases, reflect statistical uncertainties and, in other cases, be due to actual changes or different interpretations of for example by-products.
Results from the next survey (which will be reported in 2018 and refers to generation of waste and waste treatment during 2016) will be possible to compare with this year’s survey.
Major changes compared with previous year
WASTE GENERATION
NACE A
The amount EWC-stat code 09.2 has increased by 307 percent compared to WStatR 2012. This is mainly an effect of changing data sources. From the Swedish Waste Management and Recycling association to three different treatment facilities in; waste treatment, energy plants and farm facilitation that generates manure which is compiled from different environmental reports. The new data source is considered to be more reliable due to suspected under coverage in the old one.
NACE B (05-09)
The largest explanation to the increase of waste compared to previous year occurs from the increase of waste code 12.A. Between years 2012 and 2014, the amounts of 12.A have increased approximately 9 000 000 tonnes, or 7 percent. Several facilities report that the latest years have been an expansive phase, which of course affects the amount of waste generated. The majority of the mines were included in both WStatR2014 and WStatR2016 and reported 12.A. Most of the facilities increased 12.A. However, some facilities are new compared to last WStatR which also increases the amount of waste. Other facilities are not operating anymore or produce less. This could be an explanation to why the amount of 12.A has not increased as much as between WStatR 2010 and 2012.
NACE C10-12
This industry is subject to methodological changes. Generally the data from the sector is based on 22% more answers than last time. The most important change in micro data from last time is that a selection of facilities that do not have a permit are covered in the survey. Surveys have been used to retrieve more data from the subsectors which had very few or none environmental
31

reports, e.g. bakeries and tobacco. This improvement in coverage should lead to more reliable results.
Vegetal waste (09.2) has decreased with about 150 000 tonnes, which is a major change. More vegetal rest-products are used as animal feed which makes it a byproduct instead of a waste. For juice companies the pipes are cleansed. In previous WStatR the amount with water included was reported, but this WStatR only amount except water are reported.
Some specific changes can be seen, in the case of 08.A* and 08.41* which have increased a lot. This time electronic waste and batteries has been more consequently coded as hazardous waste, even if the companies did not report it as such in the environmental reports. This gives a large increase which is explained by reclassification of this waste towards hazardous waste. This gives a larger total for the hazardous waste as well.
NACE C13-15
No major changes, due to that data are largely reused.
NACE C16
No major changes, due to that data are largely reused.
NACE C17-18
There are some changes in EWC 12.4 (-51 000 tonnes), EWC 12.8 (-46 000 tonnes) and EWC 12.8* (- 19 000 tonnes), which in practice in this sector is bottom and fly ash. This is also due to difficulties for the companies as well as us to determine which the best code is. Several companies have reported 12.4 while they reported 12.8 last WStatR. It is assumed that the decrease in 12.8* is correct since the bottom and fly ashes in this sector should be non-hazardous. To conclude, we assume that the estimates for 2014 are correct due to improved coding compared to 2012.
There is a large increase in hazardous chemical waste (EWC 01.4, 02 and 03.1). There are 61 companies which report on this code where 37 have reported an increase and 24 a decrease. The companies with largest changes have been double checked and it seems to be correct.
NACE C19
In the waste survey regarding 2012, there was a large increase in the amount of waste classified as "12.6 non-hazardous soil waste". This increase was due to temporary construction activities in 2012 which generated a large amount of soil waste. This “type” of waste dropped to a normal level for the industry in the last waste survey (WStatR 2016).
32

In WStatR 2014, there were missing data for the EWC-stat code 09.1. The amounts of waste from this code were registered in WStatR 2016, which causes the difference in quantities between the years.
Because of lack of information in environmental reports, amounts which were earlier interpreted as 03.2 are now interpreted as 01.2, which affects the differences between the years.
NACE C20-22
EWC-Stat 10.2 (Mixed and undifferentiated materials) accounts for the largest increase, by 31 378 tonnes (45%). Some companies have not specified their wastes in the environmental reports but indicated a total amount of hazardous and non-hazardous waste. The non-hazardous waste was therefore recorded on the EWC Stat 10.2
EWC-Stat 07.5 (Wood wastes) and 07.2 (Paper and cardboard waste) increased by 9 300 tonnes (86%) respectively 7 300 tonnes (85%) compared to previous year (WStatR2014 based on data from WStatR 2010). No errors have been found in the editing process.
EWC-Stat 01.2 (Acid, alkaline or saline wastes) has decreased by 16 700 tonnes (-95%) compared to previous year (WStatR2014 based on data from WStatR 2010). The estimate of this waste type is very uncertain.
EWC-stat 02A* (Chemical wastes) increased by 58 900 tonnes (257 %). This large increase is mainly due to inclusion of process water in the environmental reports for 2014.
NACE C23
EWC-Stat 12.A (Other mineral waste) accounts for the largest increase by 42 900 tonnes (82%). This increase is mainly due to larger reported amounts of other mineral waste.
EWC-Stat 07.5 (Wood wastes) has increased by 29 300 tonnes (754%). This increase is due to information on increased amounts of the waste, which affects the enumeration for the industry.
EWC-Stat 10.2 (Mixed and undifferentiated materials) has increased by 11 534 tonnes. Companies with large amounts of this type of waste have not specified its non-hazardous waste. All non-hazardous waste is registered in the EWC Stat 10.2. This is mainly due to the structure of population between data regarding 2010 and 2014. The latest is the same for EWC Stat 12.4, 07.4 and 01.3*.
NACE C24-25
33
The sum of non-hazardous waste is basically unchanged between 2012 and 2014. Combustion waste (12.4*) have increased by around 90 000 tonnes, while metal waste has fallen by roughly the same amount, which means that differences in total are small. The hazardous waste has decreased by about 70 000 tonnes. The wastes categories that contribute to this difference is the reduction of chemical waste (30 000 tons), oil waste (19 000 tonnes) and acid, alkaline or saline wastes (10 000 tonnes).
The variation of waste amounts between years likely depends on facilities that have started to report waste on other facilities within the company, or that the waste has been reclassified as a byproduct.
NACE C26-30
Mixed materials and soils (10.2* and 12.6*) stand for the second and third in biggest increases of hazardous waste categories. This is mainly due to lack of information from the environmental reports. The categorization of different mineral wastes (EWC code 12) has changed since the last survey and no waste has been categorized as EWC code 12.8A or 12.8A* for 2014 data. Since these two waste codes are connected with waste treatment, and there is normally no waste treatment in this industry, in this survey we made sure no waste was entered into these two waste categories (both corresponding to the LoW code 19).
The waste categories 07.5 wood (-25 000 tonnes),, 07.2 paper (-7 000 tonnes), 06.1 06.2 06.3 metal (-41 000 tonnes) and 07.4 plastic (-270 tonnes) have all decreased:
At the same time, the mixed fractions (10.2 and 10.2*) have increased (about 27 000 tonnes). However, this need not be due to a decrease in sorting of these materials. It could also be that the generation of these categories of waste has decreased, and that the categories of mixed fractions have increased due to the generation of for instance waste from renovations of buildings at these sites.
NACE C31-33
No major changes, due to that data are largely reused.
NACE D
Differences in waste category level, apart from 12.4, 12.7 and 12.8, is to a large extent explained by the extrapolation model used to estimate waste amounts from combustion plant. See Annex 4 for further explanation.
02A * Chemical waste (decrease 17 500 tonnes)
11 Common sludges (decrease 16 000 tonnes)
34

12.6 Soils (increase 6 300 tonnes)
08A Discarded equipment (increase 5 300 tonnes)
10.2 Mixed and undifferentiated materials (decrease 13 900 tonnes)
The decrease/increase is due to the decrease/increase in production /reduced weight percentage of the combustion plants in 2012 which generated the wastes. Increased generation of 10.2 in the nuclear power plants (5 000 tonnes) "relieves", to some extent, the overall decline in 10.2.
12.4 Combustion wastes (decrease 66 000 tonnes).
The decrease of 16% is derived from incinerators burning less non-waste fuels compared to 2012. Instead, a greater proportion of the fuel in the combustion plants are waste-based fuels, see 12.8A Mineral waste from waste treatment below.
12.7 Dredging spoils (increase 5 400 tonnes)
From 0 tones 2012 to 5 400 tonnes (dry weight) in 2014. The increase is a one-off item from one of the power plants; dredged spoils deposited at sea.
12.8A / 12.8A * Mineral wastes from waste treatment and stabilised wastes increase 141 000 tonnes. The increase is due to increased burning of waste fuels and is considered reasonable. Given the current situation in Sweden it is reasonable that 12.8 increases while 12.4 decreases.
NACE E36, 37, 39
No major changes.
NACE E38 Waste collection, treatment and disposal activities; materials recovery; and G46.77 Wholesale of waste and scrap
The amounts generated in both E38 and G46.77 have changed between WStatR2014 and WStatR2016. There are some major reasons for these changes:
1. Changed NACE coding between E38 and G46.77. Some waste management companies have changed NACE coding and switched between NACE E38.3 and G46.77. This leads to shifts in generated wastes. Most of the changes have been from G46.77 to E38. For example, the total amount of generated non-hazardous wastes was decreased in G46.77 and increased in E38.
2. Definition/interpretation of secondary wastes. In NACE E38 and G46.77 the generated wastes are to a predominant part secondary waste generated by both preparatory treatment and final treatment. In WStatR2016 a change was made in the interpretation of secondary
35

waste. Earlier the interpretation was that a secondary waste was generated when a treatment process (preparatory treatment or final treatment) gave an output with considerably new physical and chemical properties, in practice when the output was classified in another EWC-Stat category than the input. In WStatR2016 a more rigid interpretation was used, also wastes that had changed only physical properties were classified as secondary waste, especially when the output had another LoW code than the input. Increased amounts of non-hazardous glass waste (07.1), non-hazardous wood waste (07.5) and hazardous wood waste (07.5*) are results of classifying crushing, milling and chipping as pre-treatment of waste, generating secondary wastes as mentioned above.
3. Consistent use of waste conversion factors when information is missing in environmental reports. The increased amounts of sorting residues (10.3), hazardous sorting residues (10.3*) and mineral waste from waste treatment and stabilized waste (12.8A) are probably a result of more consequent use of waste factors for estimating secondary wastes from preparatory treatment, when appropriate information is missing in the environmental reports. Earlier these flows were not recorded at all when information was missing.
Further, the increase of discarded vehicles (08.1) is a result of the inclusion of vehicles outside the producer responsibility (earlier only discarded vehicles within the producer’s responsibility were surveyed). Discarded vehicles enter the treatment facilities as hazardous wastes (08.1H) and are dismantled into hazardous and non-hazardous (secondary) waste. The dismantled coaches constitute the largest part and are registered as 08.1. Also, the increase of hazardous batteries and accumulators (08.41*) is also a result of the inclusion of vehicles outside the producer responsibility.
The large decrease of generated soils (12.6) in NACE 38 might be a result of a different classification of wastes from treatment of contaminated soil, especially when the waste information is incomplete in the environmental reports.
The overall generation of hazardous wastes in E38 increased by 200%, from ca 141 000 tons to 423 000 tons. The increase is largely the result of changed interpretation of (partly) missing and/or vague information in the environmental reports and of new classification/interpretation of certain handling of waste as pre-treatment (generating secondary waste), as mentioned above. The single largest increases are of hazardous wood waste, 07.5* (increase by 124 000 tons), hazardous sorting residues, 10.3*
36

(increase by 50 000 tons), hazardous chemical waste, 02.A* (increase by 81 000 tons) and hazardous used oils, 01.3* (increase by 21 000 tons).
NACE F41-43
06.1 Metal wastes, ferrous, 06.2 Metal wastes, non-ferrous, 06.3 Metal wastes, mixed ferrous and non-ferrous, 07.5 Wood wastes and 08A* Discarded electrical and electronic equipment : A larger number of companies have sent data on generated waste amounts for 2014 with an improved quality in the estimated amounts as result. In addition a better method of calculation has been used when scaling up the waste amounts on a national level for 2014. For 08A*, the waste amounts were underestimated for 2012.
10.2 Mixed and undifferentiated materials: In 2012, and earlier, some mixed waste from construction and demolition have been classified as EWC-Stat 10.2 (usually LoW 20 01 99) by the respondents. In 2014 we have changed the classification to LoW 17 09 04, when it is waste from construction and demolition.
12.1 Mineral construction and demolition wastes: For previous estimations the treatment of received amounts at waste treatment facilities has to a greater extent been classified as “intermediate storage”. This year the treatment of the amounts has been classified as pretreatment (to larger extent) and the amounts have thus been included in the statistics to a greater extent. In addition the estimated amounts from 2012 were underestimated.
12.6 Soils: The amounts vary between years depending on the size and the number of infrastructure projects.
12.6* Soils: For previous estimations the treatment of received amounts at waste treatment facilities has to a greater extent been classified as “intermediate storage”. This year the treatment of the amounts have been classified as pretreatment and thus been included in the statistics to a greater extent. In addition the estimated amounts for 2012 were underestimated.
12.7 Dredging spoil: For 2012 there was a major dredging project which contributed to very large amounts.
NACE G-U XG46.77
Hazardous waste
The total amount of hazardous waste from the service sector has decreased much. This waste is accounted for by a study of waste management companies and their registered collection at different businesses. Statistics from waste management companies are then counted up to represent the
37

nation, with respect to their monetary turnover in the business. Statistics regarding this was reused from WStatR 2014, but for WStatR 2016 a new study has been conducted. Because only a few companies were willing to share data, uncertainty is high and the variations are large for many hazardous waste fractions. The fact that total amounts are lower is however credible as it was believed to have been overestimated previously.
It is difficult to assess which fractions of hazardous waste that have been over- or underestimated due to the complex and heterogeneous nature of the service sector. Here are some comments: 01.1* was probably overestimated in previous studies, the new data is most likely closer to the truth. 01.3* might be underestimated, a lot of oil waste should arise from workshops and transport companies. The amounts of 12.1*, 12.6* and 12A* vary but are still large. Soil and construction waste should perhaps not arise from the service sector at all, but the reason is mainly that consultants within the service sector are costumers to the contacted waste management companies. This means that this waste does not really belong to the service sector but is not accounted for elsewhere.
Non-hazardous waste
The lower amounts of 06.1 and 06.2 are most likely explained by different reclassification of scrap metal from airports and hospital etc. into 06.3. The main increase in 06.3 is however due to allocation of metal packaging, which has not been done previously. The allocation is between households and the service sector to better account for the total amount of packaging material collected in Sweden.
The same type of allocation has been done for glass packaging in 07.1 and plastic packaging in 07.4.
A new data source for rubber tires 07.3 has been used, based on the total amount of tires collected and allocated between households, farming, forestry, fishing (NACE 01-03) and the service sector.
There has been an increase in the amount of paper waste 07.2 compared to WStatR 2014. The main contributor to this increase is that the total amount of collected packaging material has been allocated to households and the service sector.
Food waste in 09.1 has decreased. Sweden has a national goal for biological treatment of food waste, which has been monitored since 2013. That follow-up study has been used as a new and more precise data source. Due to a change in classification, 09.2 have increased a lot whereas 07.5 and 09.1 have decreased.
38

HOUSEHOLDS
01.2* (hazardous) is no longer reported due to the assumption that this quantity is included in other waste categories.
07.1 have increased with 76 ktonnes (31 %) compared to 2012. This is mainly due to the fact of a new assumption in the method that returnable glass bottles no longer should be included in the quantities.
07.4 have increased with 26 ktonnes (37 %) compared to 2012. This is mainly due to the fact that the sorting out of plastic packaging has increased.
07.5 (non-hazardous) have increased with 412 ktonnes. This is the first time non-hazardous wood waste is included in the household sector.
09.1 have increased with 93 ktonnes (47 %) compared to 2012. This is mainly due to changes in methodology and definitions.
10.1 have decreased with 620 ktonnes (27 %) compared to 2012. The data source is the amount of household waste incinerated in Sweden. The reduction is due to a new factor for this incineration. The factor, for what belongs to households, has determined to 78 % instead of 100 %. The remaining 22 % incinerated waste is now allocated to the service sector. The reduction is also due to the assumption that landfilling is included in 12.1.
12.1 (non-hazardous) have increased with 147 ktonnes. This is the first time this waste is included in the household sector, due to new assumptions and methodology.
12A (hazardous) have decreased with 5 222 ktonnes (100 %) compared to 2012. This is due to new assumptions that these amounts instead belong to the construction sector.
WASTE TREATMENT
The waste treatment is dominated by the mining waste (Other mineral waste EWC-Stat 12 from NACE B05-09). The amount of generated mining waste have changed between WStatR2014 and WStatR2016, and thus also the treatment of it. Between WStatR2014 and WStatR2016 some mines were closed down, but several mines had a considerable increased mining production. The major treatment of mine tailings is surface impoundment (classified as “other disposal” in WStatR), and the major treatment of rocks, topsoils and overburden are deposit onto land (landfilling in WStatR). Some rocks are used for backfilling (usually use of rock wastes for stowage of mines and quarries) and some for construction of roads and walls in surface impoundments at the mining site. The treatment tendencies are much the same in WStatR2016 as WStatR2014: the major parts are disposed by
39
landfilling or surface impoundments, but rocks and soil is used for backfilling and construction when possible.
In the discussion below we have excluded the mining waste and discuss only the changes in treatment of other wastes than mining waste.
In the survey of waste treatment we also investigate preparatory treatment as an own treatment category, besides incineration R1, incineration D10, recovery, landfilling and other disposal. Preparatory treatment is in balance with generation of secondary wastes. Recovery is also investigated in several sub-categories: anaerobic digestion, composting, material recycling, use as construction material, use as landfill cover and other recovery. This makes it possible to follow up changes more in detail, than otherwise if only the treatment categories in WStatR were analysed.
There are several large changes (increases and decreases) of amounts in waste treatment between WStatR2016 and WStatR2014. There are several reasons for this. A general comment is that data in the environmental reports often are vague and hard to interpret. This results in potential misinterpretations of waste types and waste treatment methods. The problem with lacking and/or vague data in the environmental reports has increased compared to WStatR2014 and might cause changes both in waste types and waste treatment methods.
The surveyed population of waste treatment facilities included more waste treatment installations than in previous projects. In WStaR2014 about 1250 facilities were surveyed, and in WStatR2016 more than 1500 facilities. The additional facilities were most intermediate storage and transfer plants, but some industries using “clean” wastes as fuel or raw material were also added.
The total amount waste treated, including pretreatment, has increased: treatment of non-hazardous waste with 7% and treatment of hazardous waste with 32%. Whereas the treated amount of non-hazardous waste is only increased by 7%, the allocation between different waste management types has changed more. This concerns primarily landfill of waste (increase by 29%) and other disposal (decrease by 42%). With regard to landfilling of waste the increase might be a result of different classification of treatment of specific waste types, e.g. soils and mineral waste put/used on landfills. If the soils are used for covering landfills the waste treatment installation counts this as recovery whereas WStatR 2016 might to a larger degree have classified it as landfill when it was evident that the main purpose was to dispose the waste, not to use the waste.
40

The reduced treatment (mostly recovery) of metals (06.1, 06.2 and 06.3) seems to be a consequence of less recycling of metals in the country. Several steel mills report lower quantities of metal scrap used in WStatR2016 than in WStatR2014. This may be a consequence of by-product and end-of waste criteria.
The reduced treatment of paper waste (07.2) corresponds to information from the forestry industry showing a reduced recycling of paper as well as a reduced overall production of paper.
Large increases in treated amounts of animal faeces, urine and manure (09.3) is probably a result of increased anaerobic digestion on farms. It is assumed that the waste previously was spread on agricultural land without being registered as treatment of waste.
Foreseen changes
The only known amendment today that affects the waste statistics is the implementation of the end-of-waste-criteria for different waste streams. These may give other figures for generation of secondary waste and for recovery.
It is also to expect that more rest products will be reclassified from waste to by-product, usually with a change of the management of the rest product.
An emerging problem is that the waste information in the environmental reports tends to be more and more reported in classified appendices, which are only available for the responsible authority (county administrative board). In the surveys of waste generation and waste treatment in NACE 38 and 46.77 there were only a few classified environmental reports in the 2010 survey (WStatR2012), but in the 2012 survey (WStatR2014) and in 2014 survey (WStatR2016) there were about 100 facilities with classified waste data or with waste data omitted. In most cases we imputed data from earlier years, or ask for supplementary information by direct contact with the facility, or make numerical adjustment (facilities in NACE 38.3 and 46.77). We expect even more environmental reports with classified data in the next survey. There is a discussion going on how to tackle this problem in the future.
From 2016 all waste facilities that manage wastes from construction and demolition have to every year report waste types (LoW), quantities (ton) and treatment (R and D codes) and others according to a special template. The first reporting is in March 2016 referring to waste management during 2015. This is expected to give better quality of both treatment and generation of construction and demolition waste.
41
8.2.1. Length of comparable time series
The time series for reference years 2010-2014 is comparable (as described above).
8.3. Comparability - domain The estimates of waste generated in manufacturing industries are reasonably comparable across domains, because the methodology is consistent and response rates and data quality is quite similar across industries. For other domains, e.g. NACE A, D, F, G-U excl 46-77 and households, the comparability is poorer since a broad range of methods are used and a number of independent assumptions are made in different domains.
42

9. Coherence The Swedish official statistics on generated and treated waste are planned to be based on the same statistical information (same methods, scopes and limitations of statistics) as other statistics that are to be reported to Eurostat.
9.1. Coherence - cross domain 9.1.1. Coherence - sub annual and annual statistics
Not relevant. No sub annual or annual waste statistics is produced in Sweden.
9.1.2. Coherence - National Accounts
The same classifications and frames are used in most business surveys at Statistics Sweden.
9.2. Coherence - internal Efforts are made to avoid double counting and data gaps, but it could still occur to a very limited extent. There are differences between total amounts of treated and generated waste. This has been investigated in a special project and the results has partly been applied this WStatR. The results will be applied also in next WStatR.
43
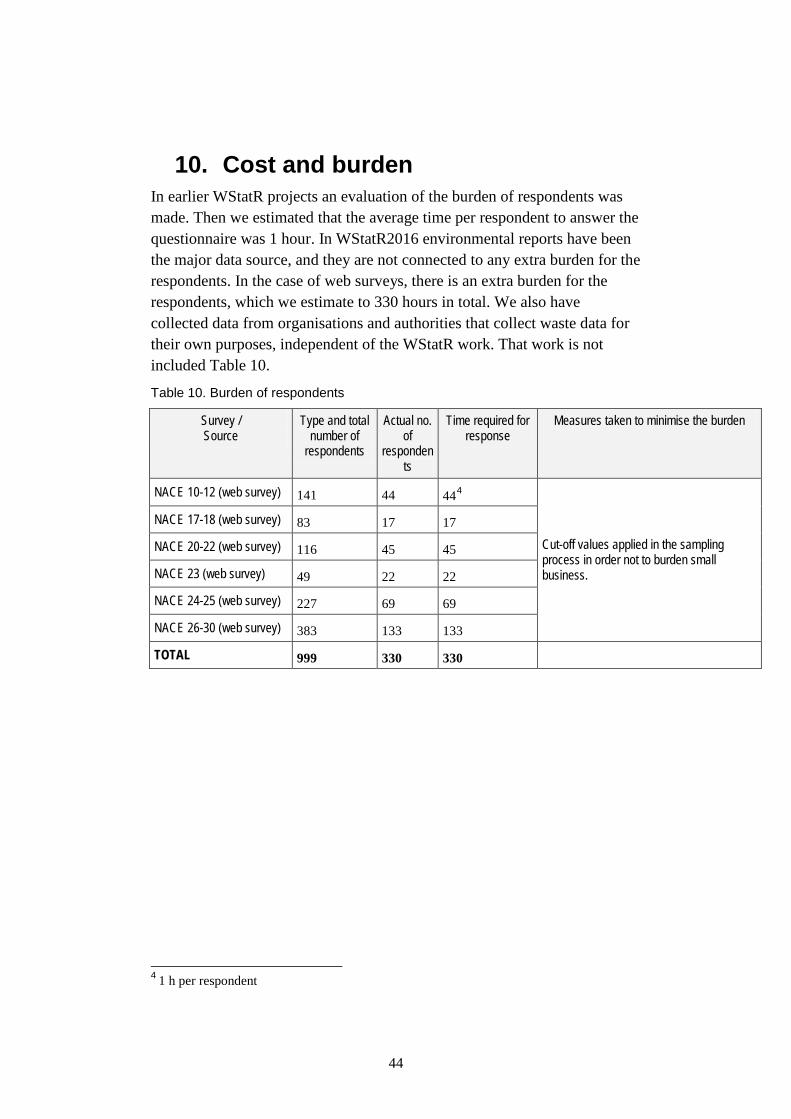
10. Cost and burden In earlier WStatR projects an evaluation of the burden of respondents was made. Then we estimated that the average time per respondent to answer the questionnaire was 1 hour. In WStatR2016 environmental reports have been the major data source, and they are not connected to any extra burden for the respondents. In the case of web surveys, there is an extra burden for the respondents, which we estimate to 330 hours in total. We also have collected data from organisations and authorities that collect waste data for their own purposes, independent of the WStatR work. That work is not included Table 10.
Table 10. Burden of respondents
Survey / Source
Type and total number of
respondents
Actual no. of
respondents
Time required for response
Measures taken to minimise the burden
NACE 10-12 (web survey) 141 44 444
Cut-off values applied in the sampling process in order not to burden small business.
NACE 17-18 (web survey) 83 17 17
NACE 20-22 (web survey) 116 45 45
NACE 23 (web survey) 49 22 22
NACE 24-25 (web survey) 227 69 69
NACE 26-30 (web survey) 383 133 133
TOTAL 999 330 330
4 1 h per respondent
44
11. Confidentiality 11.1 Confidentiality – policy Data is treated according to the Public Access to Information and Secrecy Act (2009:400).
11.2. Confidentiality - data treatment The p% rule is used for primary cell suppression, and secondary cell suppression is done manually.
45
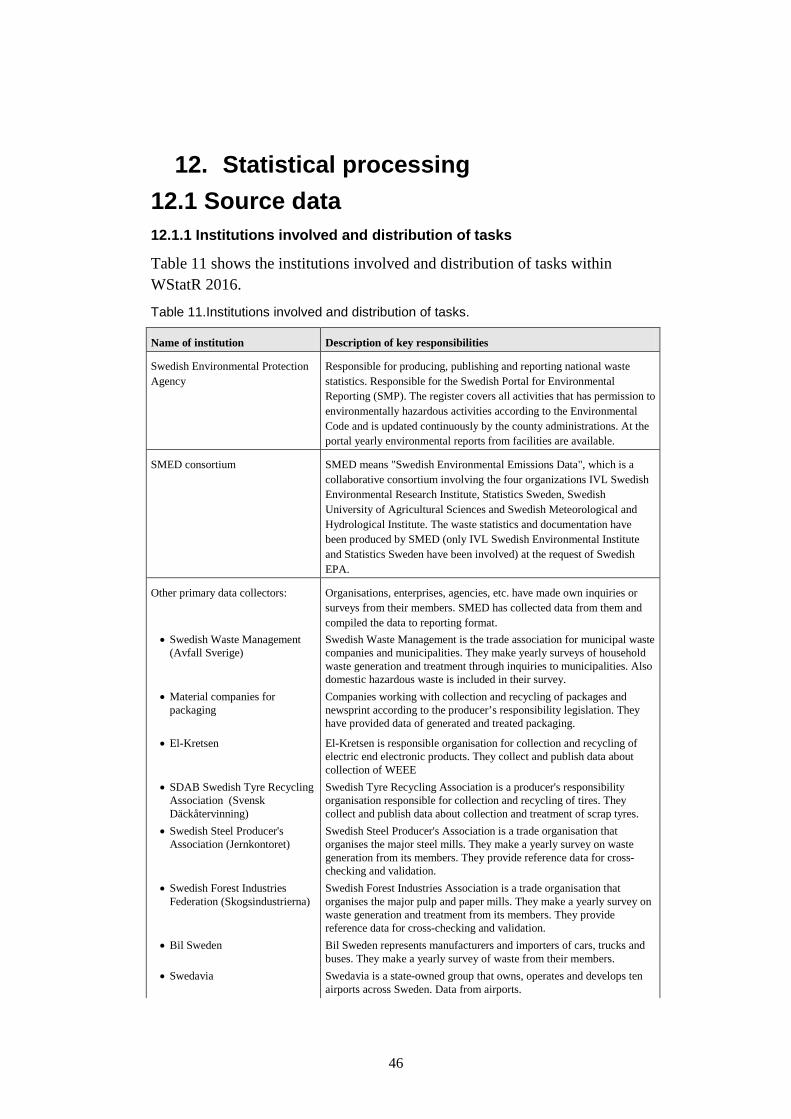
12. Statistical processing 12.1 Source data 12.1.1 Institutions involved and distribution of tasks
Table 11 shows the institutions involved and distribution of tasks within WStatR 2016.
Table 11.Institutions involved and distribution of tasks.
Name of institution Description of key responsibilities
Swedish Environmental Protection Agency
Responsible for producing, publishing and reporting national waste statistics. Responsible for the Swedish Portal for Environmental Reporting (SMP). The register covers all activities that has permission to environmentally hazardous activities according to the Environmental Code and is updated continuously by the county administrations. At the portal yearly environmental reports from facilities are available.
SMED consortium SMED means "Swedish Environmental Emissions Data", which is a collaborative consortium involving the four organizations IVL Swedish Environmental Research Institute, Statistics Sweden, Swedish University of Agricultural Sciences and Swedish Meteorological and Hydrological Institute. The waste statistics and documentation have been produced by SMED (only IVL Swedish Environmental Institute and Statistics Sweden have been involved) at the request of Swedish EPA.
Other primary data collectors: Organisations, enterprises, agencies, etc. have made own inquiries or surveys from their members. SMED has collected data from them and compiled the data to reporting format.
• Swedish Waste Management (Avfall Sverige)
Swedish Waste Management is the trade association for municipal waste companies and municipalities. They make yearly surveys of household waste generation and treatment through inquiries to municipalities. Also domestic hazardous waste is included in their survey.
• Material companies for packaging
Companies working with collection and recycling of packages and newsprint according to the producer’s responsibility legislation. They have provided data of generated and treated packaging.
• El-Kretsen El-Kretsen is responsible organisation for collection and recycling of electric end electronic products. They collect and publish data about collection of WEEE
• SDAB Swedish Tyre Recycling Association (Svensk Däckåtervinning)
Swedish Tyre Recycling Association is a producer's responsibility organisation responsible for collection and recycling of tires. They collect and publish data about collection and treatment of scrap tyres.
• Swedish Steel Producer's Association (Jernkontoret)
Swedish Steel Producer's Association is a trade organisation that organises the major steel mills. They make a yearly survey on waste generation from its members. They provide reference data for cross-checking and validation.
• Swedish Forest Industries Federation (Skogsindustrierna)
Swedish Forest Industries Association is a trade organisation that organises the major pulp and paper mills. They make a yearly survey on waste generation and treatment from its members. They provide reference data for cross-checking and validation.
• Bil Sweden Bil Sweden represents manufacturers and importers of cars, trucks and buses. They make a yearly survey of waste from their members.
• Swedavia Swedavia is a state-owned group that owns, operates and develops ten airports across Sweden. Data from airports.
46

• Swedish Armed Forces (Försvarsmakten)
Swedish Armed Forces has provided data about waste from the Armed Forces facilities.
• Swedish Transport Agency Swedish Transport Agency has provided data about waste from harbours.
• Region Västra Götaland The Regions and County Councils are responsible for e.g. health care. Generated waste is compiled by and combined into national reports by Region Västra Götaland.
• Returpappercentralen i Uppsala The amounts of collected office paper is calculated by a member company of the voluntary extended producer responsibility, this time it was the company Returpappercentralen i Uppsala.
• Board of Swedish Industry and Commerce for Better Regulation (NNR)
Specification of requirements for inquiries, e.g. recommendation of scope and layout of inquiries.
In preparation for the current reporting, the work has been organised as in Figure 1.
47
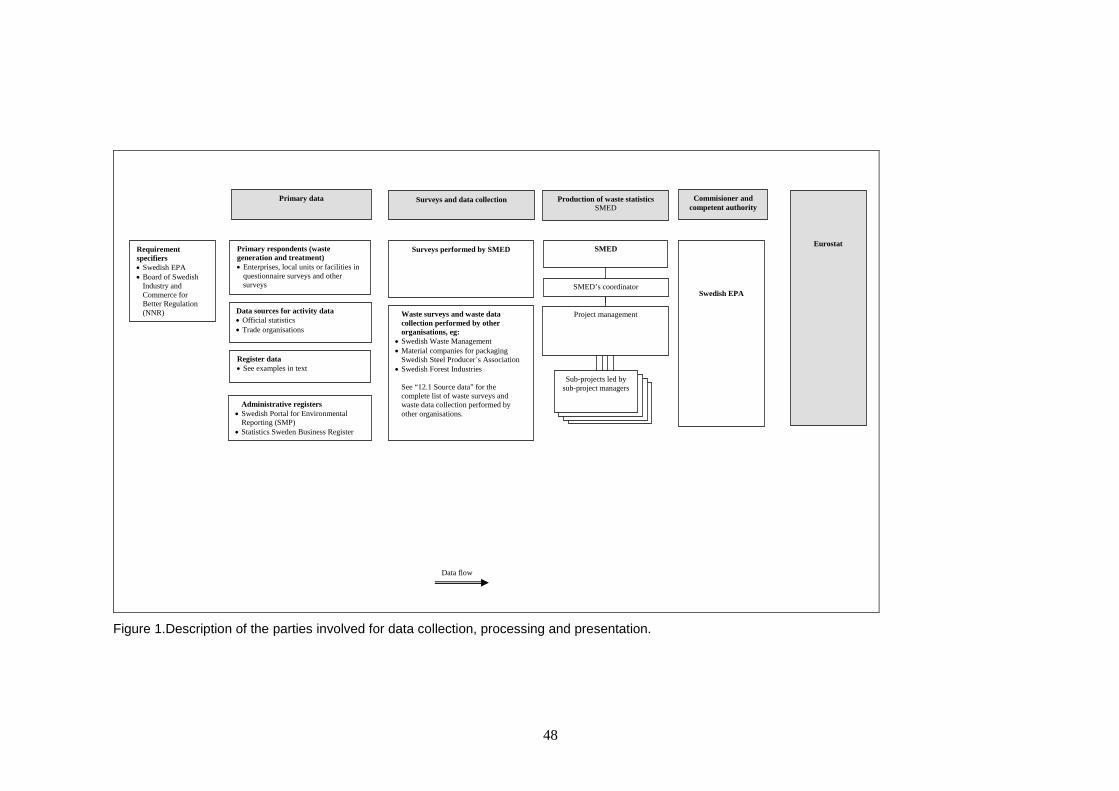
Sub-projects led by sub-project managers
Primary respondents (waste generation and treatment) • Enterprises, local units or facilities in
questionnaire surveys and other surveys
Production of waste statistics SMED
Project management
SMED’s coordinator
Waste surveys and waste data collection performed by other organisations, eg:
• Swedish Waste Management • Material companies for packaging
Swedish Steel Producer´s Association • Swedish Forest Industries See “12.1 Source data” for the
complete list of waste surveys and waste data collection performed by other organisations.
Data sources for activity data • Official statistics • Trade organisations
Register data • See examples in text
Surveys performed by SMED
Primary data Commisioner and competent authority
Surveys and data collection
SMED
Eurostat
Swedish EPA
Administrative registers • Swedish Portal for Environmental
Reporting (SMP) • Statistics Sweden Business Register
Requirement specifiers • Swedish EPA • Board of Swedish
Industry and Commerce for Better Regulation (NNR)
Data flow
Figure 1.Description of the parties involved for data collection, processing and presentation.
48

12.1.2. General description of which methods are used in which part of the data set
Data set 1: Waste generation by waste category (EWC-Stat) and economic activities (NACE)
General description of methodology
Several methods have been combined to collect data. When selecting methods, a starting-point has been to prioritise good quality of statistics for flows of hazardous waste and large flows of waste that have been associated with environmental or resource problems. Another starting point has been to reduce the burden of respondents.
In the survey environmental reports were used as a data source. The environmental report is a legal requirement, and it is one of the instruments that the authorities have to inspect an environmental hazardous activity. The information in the environmental report is expected to be of high quality and does not increase the burden of respondents.
In Table 14 an overview of the methodologies used is given. It should be pointed out that there are usually several methods used to get the data for a sector. For example a web survey can be the main method, but model calculations are used for small enterprises (less than 10 employees). Some NACE sectors may also consist of several sub sectors, where different methods have been used for different sub sectors. The methods indicated in Table 14 are the major methods used.
Determination of waste generation in the economy on the basis of information on waste collection
Information from waste collection has not been used.
Determination of waste generation in the economy on the basis of administrative sources
Environmental reports
The most common administrative source in WStatR is environmental reports. Statistics from different industries are based on the register of environmentally hazardous activities in The Swedish Emission Reporting Portal (SMP). It is operated by the county administrative boards and the Swedish EPA, which covers facilities with permits for environmentally harmful operations according to the Environmental Code. Facilities with permits for the treatment of waste were selected from this database. Information on treatment and generation of waste was extracted manually
49

from the text reports and registered in the WStatR production database. Obvious coding- and unit errors were corrected.
End-of-Life-Vehicle
Statistics Sweden and the Swedish Agency for Transport Policy Analysis publish statistics about registration of vehicles, including private cars, lorries, cars, buses, trailers, semi-trailers, caravans, motor-bikes, mopeds class 1, tractors, snow mobiles. Also the organisation registration number (VAT number) of the owner, in the case of private car the birth registration number, is registered as well as the kerb weight of each vehicle. All changes in the ownership, as well as deregistering are reported to the register continuously.
A search in the register was made to extract all information about all deregistered vehicles, including organisation registration number of the last owner and the kerb weight that were deregistered during 2014. It was assumed that the main reason for deregistering is that the deregistered cars have been handed over to an authorised car dismantling facility5. There may be some or exceptional reasons for deregistering, e.g. export of private car, or sole use of the car on private property, but we have judged that can be negligible.
The organisation registration number was linked and matched with the business register. In this manner the weight of deregistered vehicles for each NACE was obtained, including households for vehicles owned by private persons.
Data sets 2 and 3: Waste treatment, general description of methodology
Waste treatment occurs in several economic sectors. The waste treatment in all sectors has been investigated in a coordinated survey. The investigation was based on facilities registered as waste treatment plants in the register of environmentally hazardous activities. Also industrial facilities with treatment of waste are included in the register. Environmental reports were used as data sources.
Identification of relevant treatment facilities
The registers used for identification of waste treatment plants are presented in Table 12. It is the register of environmentally hazardous activities that has been the base register. The other registers have been used to check the completeness.
5 It should be mentioned that occasional deregistration is not included.
50

Table 12.Registers used for identification of waste treatment operations.
Identification of register(s) used
Description of register
Environmentally hazardous activities (responsible: Swedish EPA and the county administrative boards)
The register covers all activities that have permission to environmentally hazardous activities (according to the Environmental Code). The register is obtained through SMP The Swedish Portal for Environmental Reporting. It is updated continuously by the administrative boards.
Facilities for household waste (Responsible Avfall Sverige /Waste Management Sweden/)
Avfall Sverige (Waste Management Sweden) is a trade organisation where municipalities, municipality-owned waste companies and private waste companies are members. They keep a record of facilities that manage household wastes. The register covers all waste facilities that incinerate compost, digest or landfill household waste. It is updated yearly through a survey to the municipalities. The register is voluntary.
Business Register (responsible: Statistics Sweden)
All types of legal forms with some kind of economic activity are included in Statistics Sweden's business register. Earlier surveys have shown that waste treatment facilities, especially facilities run by municipalities, often cannot be identified as waste treatment facilities from the register. (The municipal waste treatment plants are often incorporated in other municipal activities and difficult to identify).
Records from earlier WStatR surveys (responsible SMED)
The databases from the earlier surveys contain the treatment plants that have been identified in the earlier surveys.
The waste treatment plants were identified by their activity code in the register of environmental hazardous waste activities. Both primary codes and secondary codes were assessed. All facilities with incineration, landfilling and biological treatment of more than 50 tonnes per year are in the register. Treatment facilities for household waste were also identified by information from the trade organisation Avfall Sverige (Waste Management Sweden), see Table 12.
Some types of waste are legally used as fuel in facilities or used as raw materials in manufacturing processes without waste treatment permits. These facilities cannot be identified by their activity code. Most of them have been identified in earlier surveys or in connection with the waste generation surveys, but there may be some facilities that are not included.
From the registers 1567 facilities with waste treatment were identified. Pre-treatment plants and sorting plants were included in this figure. The register also contained some non-active facilities, for example older facilities that have closed down but still were registered, or new facilities with new permits or licenses that still were in the planning or building stage.
The register of waste treatment plants included all facilities with a permitted or licensed treatment capacity of more than 50 tonnes/year of incineration, landfilling and biological treatment. Treatment plants with lower capacity have been excluded. Also smaller plants that use soils and mineral waste for backfilling or for construction purposes are excluded. As already mentioned, there are also facilities in manufacturing industry that use different wastes or rest products as raw material in their production without being registered as waste treatment facilities. We have tried to identify as many as possible of
51
these (for example in connection with the waste generation surveys), but there may still be an under-coverage.
The register of all permitted or licensed waste treatment plants does not contain any facilities with permission to release waste to water. However, we have judged that release to water occurs mainly from facilities already in the register (for example landfills releasing leachate water), or from industries that are studied in the waste generation survey (in which also treatment not included in our register was looked for). There is also information from earlier surveys about facilities with release of waste into water.
52

Data collection on treated quantities
An overview of methods and sources for waste treatment is shown in Table 13.
Table 13. Determination of treated waste quantities.
Description of data sources and methods by treatment categories
Item 1 Incineration
(R1)
Item 2 Incineration
(D10)
Item 3a Recycling (R2 – R11)
Item 3b Backfilling
Item 4 Landfilling
(D1, D5, D12)
Item 5 Other
disposal (D2, D3, D4,
D6, D7)
Environmental report,
Supplementary data for household waste facilities were obtained from Avfall Sverige (Waste Management Sweden)
Environmental reports
Environmental reports.
In a few cases data were also obtained from the facility by telephone or mail contact.
Recovery of rubber waste (tires) was collected from producer’s organisation.
Recycling of metal waste at minor foundries was reused.
Supplementary data for household waste facilities were obtained from Avfall Sverige (Waste Management Sweden)
Environmental reports
Environmental reports.
In a few cases data were also obtained from the facility by telephone or mail contact when data were missing in the environmental reports.
Supplementary data for household waste facilities were obtained from Avfall Sverige (Waste Management Sweden)
Environmental reports.
Other disposal of Dredging spoils: from the reporting according to Helcom and OSPAR
The data on treated quantities were collected as follows: 1. Data from the HELCOM and OSPAR reporting were used for
dredging spoils dumped at sea. 2. Data from producers responsibility organisation Svensk
Däckåtervinning (Swedish Tyre Recycling organisation), was used for amounts of recovery of used tires (those are not included in the registers above).
53
3. Data were reused from WStatR2014 for recycling of metal waste recycled at minor foundries (those are not included in the registers above).
4. For all other treatment we used environmental reports. 5. The environmental reports were available digitally through the
Swedish Portal for Environmental Reporting (SMP). The content in the environmental report is regulated by a decree from the Swedish EPA. There is no standardized reporting of waste treatment, but the decree states that the environmental report shall contain "production data".
6. If the environmental report was not available, or if it contained no usable data about treatment, we reused data from earlier environmental reports, or data from WStatR2014 (reference year 2012 was reused).
Data from more than 90% of the facilities were obtained. No adjustment due to non-response (that is if no environmental report was available) was made, since it was judged that the non-responding facilities in most cases did not have any activity in 2014. There were a few facilities with classified waste information in the environmental reports, and that was expected to have relevant waste treatment. However, we have made no imputation or adjustment for these.
When evaluating the environmental reports, the following information was extracted from the environmental reports:
• Treatment method according to WStatR plus pre-treatment. The treatment “Other recovery” was divided into composting, anaerobic digestion, material recycling, land recovery (including landfill cover on closed landfills and use as construction material) and other recovery.
• Waste type (List of Waste) and quantity treated (in tonnes). • Waste generated at treatment plant (used for the waste generation
survey in NACE 38 and 46.77). Both primary and secondary wastes were investigated.
• Capacity of facility, when required. When the capacity or the permitted treatment quantity was not given in the environmental report, a model calculation was used, assuming that the facility worked close to the upper capacity or permission.
• All facilities were identified with a code giving the location on NUTS3 level.
54
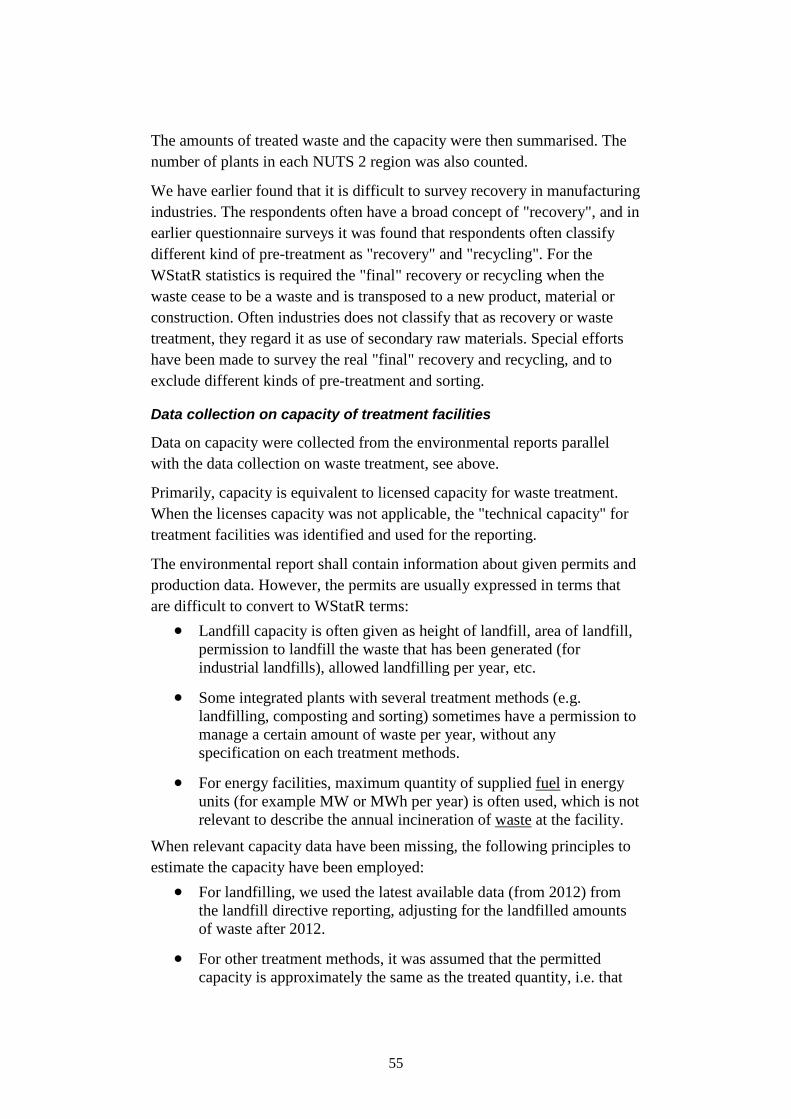
The amounts of treated waste and the capacity were then summarised. The number of plants in each NUTS 2 region was also counted.
We have earlier found that it is difficult to survey recovery in manufacturing industries. The respondents often have a broad concept of "recovery", and in earlier questionnaire surveys it was found that respondents often classify different kind of pre-treatment as "recovery" and "recycling". For the WStatR statistics is required the "final" recovery or recycling when the waste cease to be a waste and is transposed to a new product, material or construction. Often industries does not classify that as recovery or waste treatment, they regard it as use of secondary raw materials. Special efforts have been made to survey the real "final" recovery and recycling, and to exclude different kinds of pre-treatment and sorting.
Data collection on capacity of treatment facilities
Data on capacity were collected from the environmental reports parallel with the data collection on waste treatment, see above.
Primarily, capacity is equivalent to licensed capacity for waste treatment. When the licenses capacity was not applicable, the "technical capacity" for treatment facilities was identified and used for the reporting.
The environmental report shall contain information about given permits and production data. However, the permits are usually expressed in terms that are difficult to convert to WStatR terms:
• Landfill capacity is often given as height of landfill, area of landfill, permission to landfill the waste that has been generated (for industrial landfills), allowed landfilling per year, etc.
• Some integrated plants with several treatment methods (e.g. landfilling, composting and sorting) sometimes have a permission to manage a certain amount of waste per year, without any specification on each treatment methods.
• For energy facilities, maximum quantity of supplied fuel in energy units (for example MW or MWh per year) is often used, which is not relevant to describe the annual incineration of waste at the facility.
When relevant capacity data have been missing, the following principles to estimate the capacity have been employed:
• For landfilling, we used the latest available data (from 2012) from the landfill directive reporting, adjusting for the landfilled amounts of waste after 2012.
• For other treatment methods, it was assumed that the permitted capacity is approximately the same as the treated quantity, i.e. that
55

the facilities receive close to the maximum quantity of waste allowed.
The number of facilities in different regions has been retrieved automatically from the database.
12.2. Frequency of data collection Data on waste generation is collected every second year for households and most industries. However, a few industries which generate very small amounts of waste are surveyed less frequently, e.g. NACE 13-15, 16 and 31-33. Data on waste treatment is collected every second year.
12.3. Data collection Prior to each WStatR, all relevant data sources are listed, e.g. environmental reports and data from business associations. For the manufacturing industry, a sample survey is also carried out as described in Annex 2 Waste generation in the economy – sample survey. In order to minimize response burden and optimize the use of resources, some industries are surveyed less frequently as described above. The data collection takes place in March- February. Data processing (editing, imputation, estimation etc.) starts as soon as the data collection is complete for each industry.
12.4. Data validation When possible, the estimated amounts of waste in different industries have been checked by an external expert. When reference data sources have been available these have been used for validation of WStatR data. The scripts used for estimation and table production are reviewed independently by several persons in order to detect errors.
12.5. Data compilation All input data is stored in a database. Estimation for each activity item is made by a standardized script. Statistical disclosure control is made when all data is in place.
12.6. Adjustment No adjustments are made.
56

13. Comment No comments.
57

14. Related metadata No related metadata.
58

Annex 1. Description of methods for determining waste generation
An overview of applied methods is presented in Table 14. The methods are described in the following Annexes.
59

Table 14. Description of methods for determining waste generation.
Item 1 2 3 4 5 6 7 8 9 10 11 12 13 14 15 16 17 18 19
NACE 01-03 04-09 10-12 13 -
15 16 17 - 18 19 20 -
22 23 24 - 25
26 -30
31 - 33 35 36 37 39 38 41 -
43
G - U, excl. 46.77
46.77 HH
01.1H
Mix of m
ethods
Environmental reports
Environmental reports, W
eb survey
Reuse of data
Reuse of data
Environmental reports, W
eb survey
Environmental reports
Environmental reports, W
eb survey
Environmental reports, W
eb survey
Environmental reports, W
eb survey
Environmental reports, W
eb survey
Reuse of data
Mix of m
ethods
Reuse of data
Sewage sludge from
official statistics, other waste factors
Reuse of data
Mix of m
ethods, primarily Environm
ental reports
Mix of m
ethods
Mix of m
ethods
Environmental reports
Mix of m
ethods
1.2 01.2H
..
..
..
..
..
..
..
..
.. 12.8, 13
12.8H, 13H
60

Annex 2 Waste generation in the economy – sample survey
The business register was used as base for the sampling, except for NACE 38 and NACE 46.77 where the register of environmentally hazardous activities was used. Local unit has been used as statistical unit. A local unit can have several different activities, one main activity and several secondary activities. The entire local unit has been classified by its main activity. Local unit is used because in most cases the entire local unit has a common waste management and local unit is often equivalent to facility registered as environmental hazardous activities. Those facilities have to make a yearly environmental report which usually contains waste data.
Several data sources were used in the survey: - The main data source has been environmental reports from
facilities that are registered as environmentally hazardous activities according to the Environmental Code. These reports were available as PDF-files at the website Swedish Portal for Environmental Reporting (SMP). In NACE 05-09 and NACE 19 the environmental reports are the only data source since all relevant facilities are registered as environmentally hazardous activities.
- For some sectors, units not registered as environmentally hazardous, data was also collected by web-questionnaires, see below. The local units covered by these reports were excluded from the sample frame to the web survey that was based on the business register.
Number of statistical units per strata and item according to the available register, number of statistical units selected for sample survey and questionnaire sent out and number of non-responses are not shown due to risk of disclosure.
61
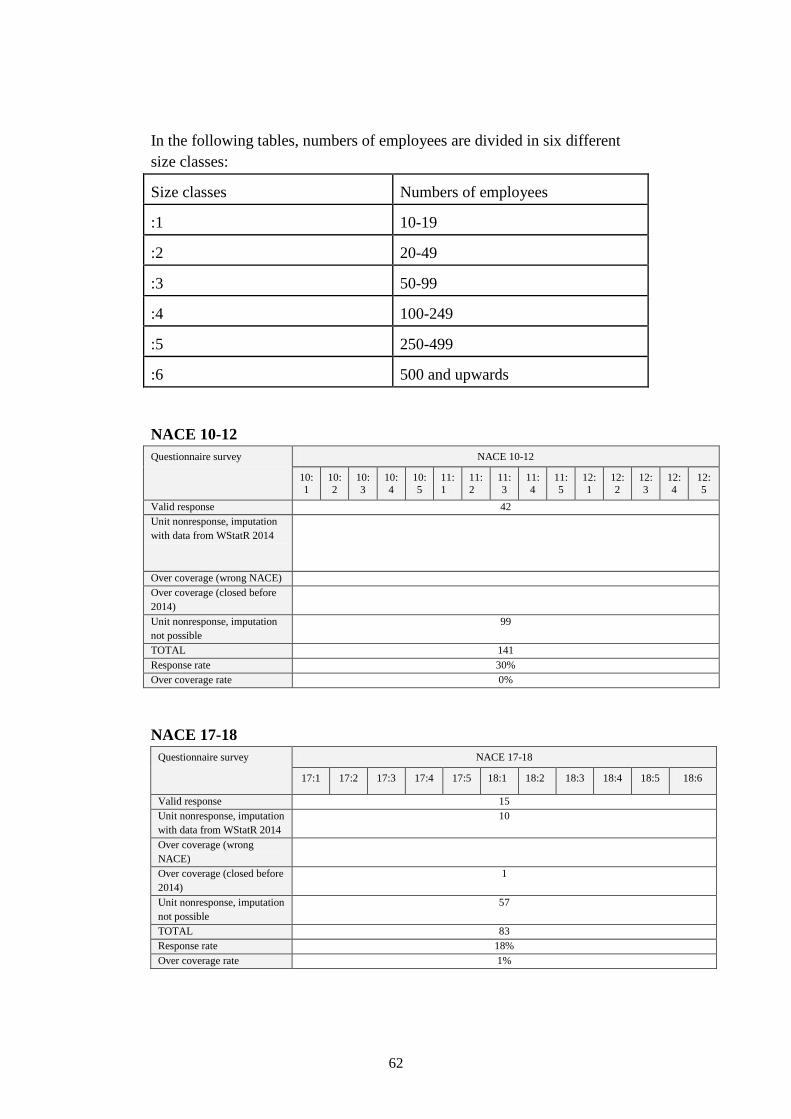
In the following tables, numbers of employees are divided in six different size classes:
Size classes Numbers of employees
:1 10-19
:2 20-49
:3 50-99
:4 100-249
:5 250-499
:6 500 and upwards
NACE 10-12 Questionnaire survey NACE 10-12
10:1
10:2
10:3
10:4
10:5
11:1
11:2
11:3
11:4
11:5
12:1
12:2
12:3
12:4
12:5
Valid response 42 Unit nonresponse, imputation with data from WStatR 2014
Over coverage (wrong NACE) Over coverage (closed before 2014)
Unit nonresponse, imputation not possible
99
TOTAL 141 Response rate 30% Over coverage rate 0%
NACE 17-18 Questionnaire survey NACE 17-18
17:1 17:2 17:3 17:4 17:5 18:1 18:2 18:3 18:4 18:5 18:6
Valid response 15 Unit nonresponse, imputation with data from WStatR 2014
10
Over coverage (wrong NACE)
Over coverage (closed before 2014)
1
Unit nonresponse, imputation not possible
57
TOTAL 83 Response rate 18% Over coverage rate 1%
62
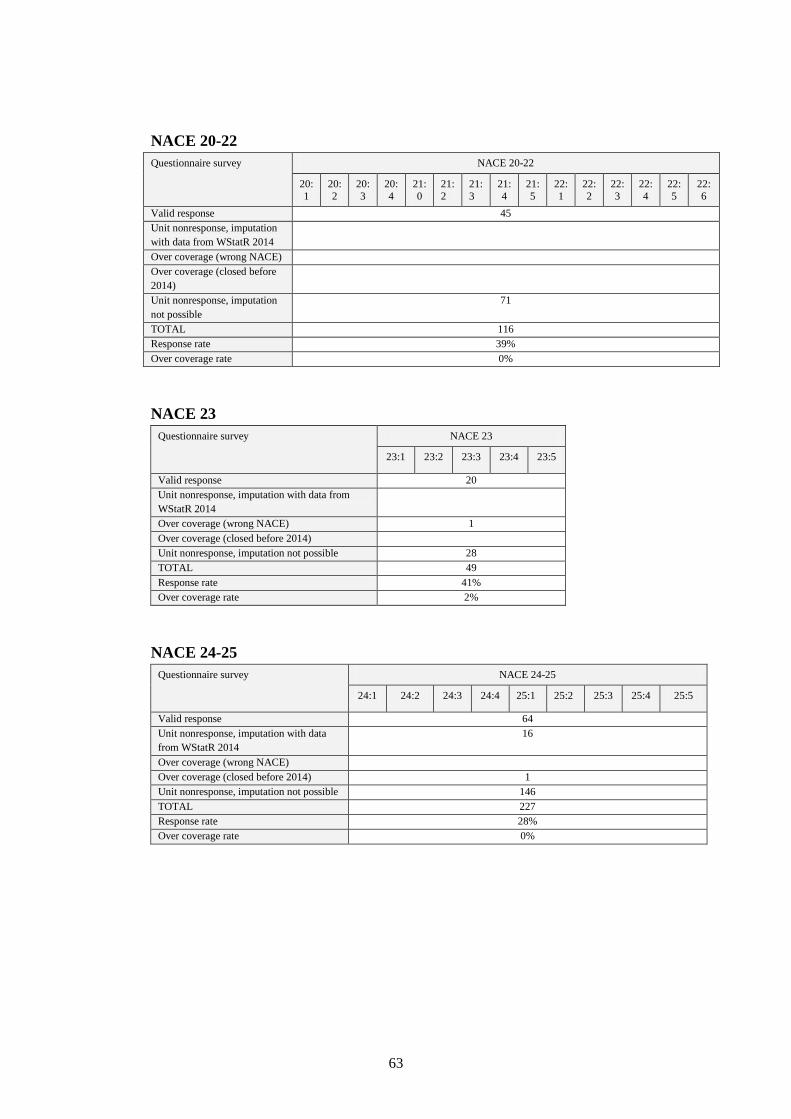
NACE 20-22 Questionnaire survey NACE 20-22
20:1
20:2
20:3
20:4
21:0
21:2
21:3
21:4
21:5
22:1
22:2
22:3
22:4
22:5
22:6
Valid response 45 Unit nonresponse, imputation with data from WStatR 2014
Over coverage (wrong NACE) Over coverage (closed before 2014)
Unit nonresponse, imputation not possible
71
TOTAL 116 Response rate 39% Over coverage rate 0%
NACE 23 Questionnaire survey NACE 23
23:1 23:2 23:3 23:4 23:5
Valid response 20 Unit nonresponse, imputation with data from WStatR 2014
Over coverage (wrong NACE) 1 Over coverage (closed before 2014) Unit nonresponse, imputation not possible 28 TOTAL 49 Response rate 41% Over coverage rate 2%
NACE 24-25 Questionnaire survey NACE 24-25
24:1 24:2 24:3 24:4 25:1 25:2 25:3 25:4 25:5
Valid response 64 Unit nonresponse, imputation with data from WStatR 2014
16
Over coverage (wrong NACE) Over coverage (closed before 2014) 1 Unit nonresponse, imputation not possible 146 TOTAL 227 Response rate 28% Over coverage rate 0%
63
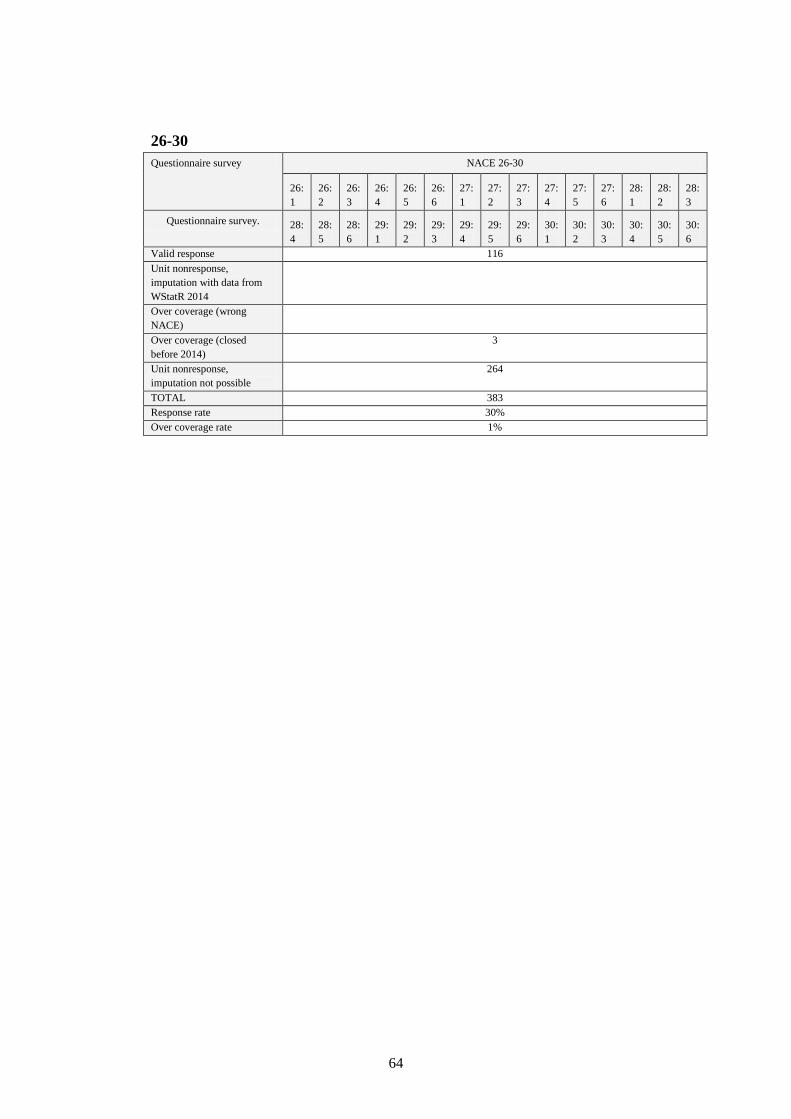
26-30 Questionnaire survey NACE 26-30
26:1
26:2
26:3
26:4
26:5
26:6
27:1
27:2
27:3
27:4
27:5
27:6
28:1
28:2
28:3
Questionnaire survey. 28:4
28:5
28:6
29:1
29:2
29:3
29:4
29:5
29:6
30:1
30:2
30:3
30:4
30:5
30:6
Valid response 116 Unit nonresponse, imputation with data from WStatR 2014
Over coverage (wrong NACE)
Over coverage (closed before 2014)
3
Unit nonresponse, imputation not possible
264
TOTAL 383 Response rate 30% Over coverage rate 1%
64

Annex 3. Waste Generation in the economy on the basis of information on waste treatment
Data for waste generation in construction (NACE 41-43) has partly been taken from waste treatment. Treatment data was made for EWC- Stat groups 07.5, 07.5, 12.1, 12.6, 12.7 both hazardous and non-hazardous. Data on treatment of wastes with LoW code 17 XX XX were used, but these figures were reduced by the quantities of same wastes generated in other sectors. Other waste types in NACE 41-43 has been taken by other methods.
65

Annex 4. Waste generation in the economy on the basis of models or other methods
In some cases waste data has been reused from earlier years. These sectors and sub sectors have very small amounts of waste according to earlier surveys. Other NACE are based on other methods, see below.
Table 15. Waste generation in the economy on the basis of models or other methods.
Waste from Agriculture, Forestry and Fishing (NACE 1-3)
1 Scope of the model (waste types and economic sectors covered)
All wastes in NACE 1-3.
2 Basic data for the estimations (production figures etc.)
The results obtained from this sector were based on a combination of several different methods, mainly:
• Waste factors • Trade organizations and other companies • Official statistics • Input from the Service Sector in WStatR • Development project • Reuse of data
3 Description of the model and the factors applied
- Waste factors: Based on an earlier development projects (“Metodutveckling för Jordbruks-, skogsbruks- och fiskesektorn” by Kjell Rasmusson, SCB and Jan-Olov Sundqvist, IVL. 2007. And also “Översyn av NACE A inför ASP 2016” by Jonas Allerup and Annika Gerner, SCB. 2015) - Trade organizations and other companies: Organizations such as Keep Sweden Tidy, Konvex AB (cremation of animals), Swedish Waste Management and Swedish Ensilage Plastic Recycling. - Official statistics: From Swedish EPA, The Swedish Agency for Marine and Water Management and the Swedish Board of Agriculture. - Input from the Service Sector: Data from the Service Sector in WStatR, regarding paper/cardboard and scrapped vehicles. - Development project: See “Household waste from business” later in this annex. - Reuse of data: For some waste streams there was no other possibility than to reuse data from the prior WStatR 2008.
Manufacture of textiles, wearing apparel and leather (NACE 13-15) 1 Scope of the model (waste types and
economic sectors covered) 13-15 Data reused from WStatR 2014.
66

Waste from Manufacture of wood and products of wood and cork (NACE 16)
1 Scope of the model (waste types and economic sectors covered)
16 Data reused from WStatR 2014.
Manufacture of furniture, other manufacturing, repair and installation of machinery etc. (NACE 31-33)
1 Scope of the model (waste types and economic sectors covered)
31-33 Data reused from WStatR 2014.
Electricity, gas, steam and air conditioning supply (NACE 35)
1 Scope of the model (waste types and economic sectors covered)
Combustion Plants The waste amounts generated (2014) in the combustion plant is estimated by extrapolation. The waste amounts generated (2014) in the combustion plant is estimated by extrapolation from a survey regarding 2012. For all waste types except ashes, the extrapolation is made on plant level assuming that waste generation is proportional to energy generation. Expansion to the whole population is made based on total energy generation in 2014. Since the model for extrapolation is based on plant-level, changes in energy production for individual plants can influence the estimated amount of generated waste a lot. Concerning the large waste categories, 12.4 and 12.8 (both ashes), a slightly different model is applied. Based on the 2012 survey, factors of ash generation per MWH of combusted fuel (per fuel type) were derived, and these factors were multiplied with total amounts of fuels combusted in the population in 2014. Other sub sectors Some sub sectors have been reused. Other sub sectors have been adjusted (e.g. according to quantity produced, number of facilities in service).
Water supply, sewage, remediation act (NACE 36, 37 and 39)
1 Scope of the model (waste types and economic sectors covered)
NACE 37: Common sludges. The reporting according to Council Directive of 12 June 1986 on the protection of the environment, and in particular of the soil, when sewage sludge is used in agriculture (86/278/EEC) is due every second year. The last reporting period, referring to 2012 data, was published in April 20146.Next reporting period, referring to 2014 data, was not be available before April 2016. As a result, data from 2012 were used. These were the newest available data. It should be noted, that the sector is considered as very stable and that sludge quantities vary only marginally between years. NACE 37 Other wastes: Waste factors from WStatR 2012 was used but updated with regards to quantity of produced sludge. Data reused from WStatR 2014 for 36 and 39.
6 Statistics Sweden (SCB). (2012). Discharges to water and sewage sludge production in 2010 Municipal wastewater treatment plants, pulp and paper industry and other industry. MI 22 SM 1201. http://www.scb.se/Statistik/MI/MI0106/2010A01/MI0106_2010A01_SM_MI22SM1201.pdf
67

Construction (NACE 41-43)
1 Scope of the model (waste types and economic sectors covered)
All wastes in NACE 41-43 Construction
2 Basic data for the estimations (production figures etc.)
The results obtained from the construction- and demolition sector were based on a combination of three different methods:
• Survey to companies in the sector • Information from waste treatment plants • Waste factors
3 Description of the model and the factors applied
Information from construction and demolition companies: The major companies in the construction sector were contacted and information on the generated amounts and types of waste was obtained. Based on this information and national statistics on sales the amounts were scaled up to a national level. The response frequency was however poor.
Information from waste treatment facilities: The data were obtained from environmental reports which have been reviewed from waste treatment facilities. In the review, all waste quantities originating from the construction and demolition sector (List of waste chapter 17) were collected. As the origin of the waste was not specified in many of the reports, this method underestimates the total amount of waste for some waste flows such as mixed and combustible waste. Waste streams which with certainty have their origins in the construction and demolition sector, have been assumed to originate from this sector. This regardless of whether it has been indicated in the environmental report or not. Examples of these waste flows are asbestos, contaminated soils and soils from construction works.
Waste factors: Based on the results from several construction- and demolition projects in Norway from which data was obtained regarding amounts and types of waste being generated per m2. These factors were adjusted to better adapt to the conditions in Sweden. Based on national statistics regarding new constructions, retrofits/conversions and demolitions, the total amount of waste for each type of waste was calculated using m2 as a scale factor.
The three methods have then been compared with each other. An expert panel has made a final assessment of which of the three methods is most appropriate to use for each EWC-Stat category.
68

Service sector (part of G and Q)
1 Scope of the model (waste types and economic sectors covered)
In the service sector data from several different public enterprises, authorities and agencies have been used, for example: - Swedish Transport Agency - Swedavia (Swedish Aviation Authority) - Swedish Armed Forces - Material companies They make their own surveys to cover their own needs. Usually they cover all kind of wastes from their sphere of interest. Data for hazardous waste, from other sub-sectors than those above, has been calculated by scaling up data on collected waste by a few large waste companies. Waste from public cleansing (street, parks etc.) was reused. Data about discarded vehicles is included. 09.1 Animal and mixed food waste from the retail sector (47), Restaurants and similar (55, 56) and institutional kitchens (education, health, elderly care and prison care) is included. Household waste has been calculated using either a reused factor by hired personnel or several updated sub-sector specific factors by hotel night, school student etc.
2 Basic data for the estimations (production figures etc.)
The amount of collected hazardous waste from service companies by waste companies was scaled up based on the turnover share of the waste businesses. The food waste factors have been obtained from previous studies in Sweden. Factors for household waste was developed using the same data. The number of employees in different sub sectors and guest nights in hotels is obtained from Statistics Sweden. The number of students in different schools or residents in elderly care was obtained from the respective authority.
-
3 Description of the model and the factors applied
See 2.
4 Routines applied or foreseen to guarantee sufficient quality (periodical revision of factors, focused surveys for verification etc.)
All data that was gathered to account for an entire sub sector or to update factors concerned 2014.
69

Waste paper from offices (“office paper”) (included in other sectors, where no other data source was available)
1 Scope of the model (waste types and economic sectors covered)
We have assumed that waste paper from offices is the major paper waste (07.2 Paper and cardboard wastes) in some sectors. The factor was obtained by taking the total amount of collected office paper and dividing it with the number of "office employees".
2 Basic data for the estimations (production figures etc.)
The total amount of office paper is obtained from the trade organisation. The number of "office employees" is obtained from Statistics Sweden. The waste factor derived for 2014 is 0,0388 kg/office employee
3 Description of the model and the factors applied
From the statistics a number of "office employees" in different sectors was obtained to calculate the amount of office paper in each sector or sub sectors where no other data on paper and cardboard waste was available.
4 Routines applied or foreseen to guarantee sufficient quality (periodical revision of factors, focused surveys for verification etc.)
This factor is updated every revision time.
Household waste from business (included in other sectors, where no other data source was available)
1 Scope of the model (waste types and economic sectors covered)
This model concerns "10.1 Household wastes" generated in business. This factor can be used in all industries, when there is no other data source for this waste (the surveys does usually cover the household waste).
2 Basic data for the estimations (production figures etc.)
The factor is 86 kg per employee. The number of employees is obtained from Statistics Sweden.
3 Description of the model and the factors applied
In 2013 a special analysis from enterprises (or rather local units) was made that has reported the household waste in the inquiries. The result showed that it was 86 kg/employee (CV = 31 %).
4 Routines applied or foreseen to guarantee sufficient quality (periodical revision of factors, focused surveys for verification etc.)
This factor is expected to develop. Improved source separation and waste prevention programs may change the amounts.
70
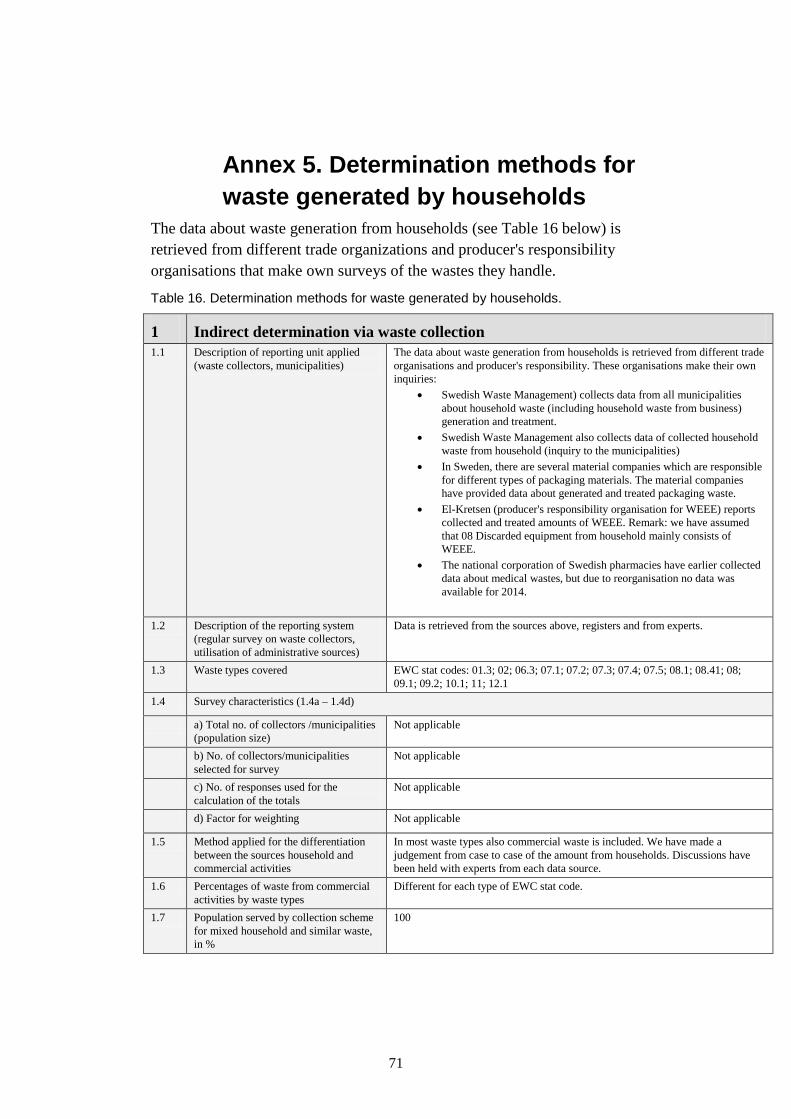
Annex 5. Determination methods for waste generated by households
The data about waste generation from households (see Table 16 below) is retrieved from different trade organizations and producer's responsibility organisations that make own surveys of the wastes they handle.
Table 16. Determination methods for waste generated by households.
1 Indirect determination via waste collection 1.1 Description of reporting unit applied
(waste collectors, municipalities) The data about waste generation from households is retrieved from different trade organisations and producer's responsibility. These organisations make their own inquiries:
• Swedish Waste Management) collects data from all municipalities about household waste (including household waste from business) generation and treatment.
• Swedish Waste Management also collects data of collected household waste from household (inquiry to the municipalities)
• In Sweden, there are several material companies which are responsible for different types of packaging materials. The material companies have provided data about generated and treated packaging waste.
• El-Kretsen (producer's responsibility organisation for WEEE) reports collected and treated amounts of WEEE. Remark: we have assumed that 08 Discarded equipment from household mainly consists of WEEE.
• The national corporation of Swedish pharmacies have earlier collected data about medical wastes, but due to reorganisation no data was available for 2014.
1.2 Description of the reporting system
(regular survey on waste collectors, utilisation of administrative sources)
Data is retrieved from the sources above, registers and from experts.
1.3 Waste types covered EWC stat codes: 01.3; 02; 06.3; 07.1; 07.2; 07.3; 07.4; 07.5; 08.1; 08.41; 08; 09.1; 09.2; 10.1; 11; 12.1
1.4 Survey characteristics (1.4a – 1.4d)
a) Total no. of collectors /municipalities (population size)
Not applicable
b) No. of collectors/municipalities selected for survey
Not applicable
c) No. of responses used for the calculation of the totals
Not applicable
d) Factor for weighting Not applicable
1.5 Method applied for the differentiation between the sources household and commercial activities
In most waste types also commercial waste is included. We have made a judgement from case to case of the amount from households. Discussions have been held with experts from each data source.
1.6 Percentages of waste from commercial activities by waste types
Different for each type of EWC stat code.
1.7 Population served by collection scheme for mixed household and similar waste, in %
100
71

2 Indirect determination via waste treatment 2.1 Specification of waste treatment
facilities selected Not applicable
2.2 Waste types covered Not applicable
2.3 Method applied for the differentiation between the sources household and commercial activities
Not applicable
2.4 Percentages of waste from commercial activities by waste types
Not applicable
72