a review of tropospheric atmospheric chemistry and gas-phase
TRANSCRIPT
Atmosphere 2012, 3, 1-32; doi:10.3390/atmos3010001
atmosphereISSN 2073-4433
www.mdpi.com/journal/atmosphere
Review
A Review of Tropospheric Atmospheric Chemistry and Gas-Phase Chemical Mechanisms for Air Quality Modeling
William R. Stockwell 1,*, Charlene V. Lawson 1, Emily Saunders 1 and Wendy S. Goliff 2
1 Department of Chemistry, Howard University, 525 College Street, NW, Washington, DC 20059,
USA; E-Mails: [email protected] (C.V.L.); [email protected] (E.S.) 2 Center for Environmental Research and Technology, University of California, Riverside,
CA 92521, USA; E-Mail: [email protected]
* Author to whom correspondence should be addressed; E-Mail: [email protected];
Tel.: +1-202-806-6913; Fax: +1-202-806-5442.
Received: 25 October 2011; in revised form: 24 November 2011 / Accepted: 12 December 2011 /
Published: 21 December 2011
Abstract: Gas-phase chemical mechanisms are vital components of prognostic air quality
models. The mechanisms are incorporated into modules that are used to calculate the
chemical sources and sinks of ozone and the precursors of particulates. Fifty years ago
essential atmospheric chemical processes, such as the importance of the hydroxyl radical,
were unknown and crude air quality models incorporated only a few parameterized
reactions obtained by fitting observations. Over the years, chemical mechanisms for air
quality modeling improved and became more detailed as more experimental data and more
powerful computers became available. However it will not be possible to incorporate a
detailed treatment of the chemistry for all known chemical constituents because there are
thousands of organic compounds emitted into the atmosphere. Some simplified method of
treating atmospheric organic chemistry is required to make air quality modeling
computationally possible. The majority of the significant differences between air quality
mechanisms are due to the differing methods of treating this organic chemistry. The purpose
of this review is to present an overview of atmospheric chemistry that is incorporated into
air quality mechanisms and to suggest areas in which more research is needed.
Keywords: atmospheric chemistry; troposphere; gas-phase; chemical mechanisms; ozone;
nitrogen oxides; volatile organic compounds
OPEN ACCESS
Atmosphere 2012, 3
2
1. Introduction
The gas-phase chemistry of the polluted atmosphere determines the effect of emissions on the
production of ozone (O3), particulate matter, acids and other air pollutants. The chemical mechanism is
developed from laboratory and field measurement data and consists of chemical species, reactions, rate
constants and photochemical data (used to calculate photolysis frequencies). Nitrogen oxides, organic
compounds and sulfur compounds are the key chemical compounds treated by air quality chemical
mechanisms for modeling the polluted troposphere. The mechanism is translated into differential
equations. The differential equations are coded into computer models that include numerical solvers
that are used to simulate the chemical fate of air pollutants. Therefore mechanism developers must
consider both chemistry and the limitations of computational resources.
The first goal of this paper is to present a brief overview of the approaches to create chemical
mechanisms for modeling the chemistry of the polluted troposphere. The most significant differences
between these air quality mechanisms are due to the differing methods of treating atmospheric organic
chemistry. The three major types are surrogate mechanisms, mechanisms that aggregate organic
compounds by chemical moiety and mechanisms that aggregate organic compounds by chemical species.
The second goal is to present a discussion of the behavior of the chemical mechanisms that are used
for air quality modeling. Although previous studies of mechanism behavior have been published
(e.g., [1-4]), very substantial changes have been made to the mechanisms over the last forty years due
to growth in the chemical knowledge [5-8].
2. Atmospheric Chemical Mechanisms for Modeling the Polluted Troposphere
2.1. Explicit Mechanisms
Explicit mechanisms consist of explicit reactions for individual compounds. Atmospheric chemistry
mechanisms usually include explicit mechanisms for the reactions of inorganic compounds, O3, nitric
oxide (NO), nitrogen dioxide (NO2), NOx (NO + NO2), hydroxyl radical (HO•), the hydroperoxy
radical (HO2•) and sulfur dioxide (SO2). A typical mechanism for tropospheric inorganic chemistry
consists of fewer than 20 species in about 45 inorganic reactions.
The organic chemistry of the troposphere is much more complicated. There are thousands of
compounds emitted from biological sources [9] and from anthropogenic sources [10]. The NCAR
(National Center for Atmospheric Research) Master Mechanism includes about 800 organic species
and 2200 reactions [11] while the Master Chemical Mechanism (MCM) mechanism consists of
2400 species, 7100 reactions for 124 emitted organic compounds [12]. A completely explicit chemical
mechanism for the troposphere with all the chemical reactions of every compound could contain
millions of reactions [13].
It is impossible to construct an atmospheric gas-phase mechanism from only published laboratory
chemical kinetics data because there are significant gaps [14]. Many assumptions and estimates are
made to fill in the gaps in order to construct an explicit atmospheric chemistry mechanism (and any
other atmospheric chemical mechanism). Some of the largest gaps exist with radical-radical reactions
and the oxidation schemes for aromatic and biogenically emitted compounds. For example, the MCM
includes detail that exceeds available laboratory data. Many of the mechanism’s organic degradation
Atmosphere 2012, 3
3
schemes were developed according to theoretical methodologies such as structure activity relationships
(SARs). The MCM has been tested against environmental chamber experiments and field data. This
testing has shown that the mechanism can simulate these measurements reasonably well.
Explicit mechanisms are mainly used in box models for chemical research. They are not very
practical for 3-D air quality models because of their extensive computational requirements. A reduced
version of the MCM has been developed and used for 3-D air quality modeling [15,16]. The practical
problem is due to computational issues involving three-dimensional Eulerian regional air quality
models. These models consist of 105 or more grid boxes [17]. Every chemical species that exists long
enough to be transported by atmospheric motions is a prognostic variable that must be calculated
explicitly. Each prognostic variable adds one ordinary differential equation that must be solved and an
additional storage location for every grid box. Increasing the number of chemical species also
increases significantly the computational demands for transport calculations [18]. A complete, explicit,
gas-phase chemical mechanism in Eulerian regional air quality models is not practical with present
computer technology. Therefore chemical mechanisms must be condensed to limit the size of the
mechanism to no more than a few hundred reactions and near one hundred model chemical species [19].
Classes of simplified chemical mechanisms for air quality modeling include surrogate mechanisms and
aggregated mechanisms as discussed in the next sections.
2.2. Surrogate Mechanisms
A surrogate mechanism is a mechanism that is somewhere between explicit and aggregated
mechanisms. A surrogate mechanism uses the explicit chemistry of a few selected organic species to
represent the atmospheric chemistry of all volatile organic compounds (VOC). One of the earliest was
the Empirical Kinetics Modeling Approach (EKMA) developed by Dimitriades and Dodge [20]. The
EKMA mechanism represented atmospheric organic chemistry with butane and propene as surrogate
species. The combination of a less reactive alkane and a more reactive alkene allowed representation of
a wide range of the overall reactivity of a mixture of VOCs.
The EKMA mechanism was implemented in a box model for most applications. The model was
used to simulate the air quality of a particular site. An estimate of an appropriate mixture of butane and
propene was determined from the site’s emissions inventory. Then the box model was used to make a
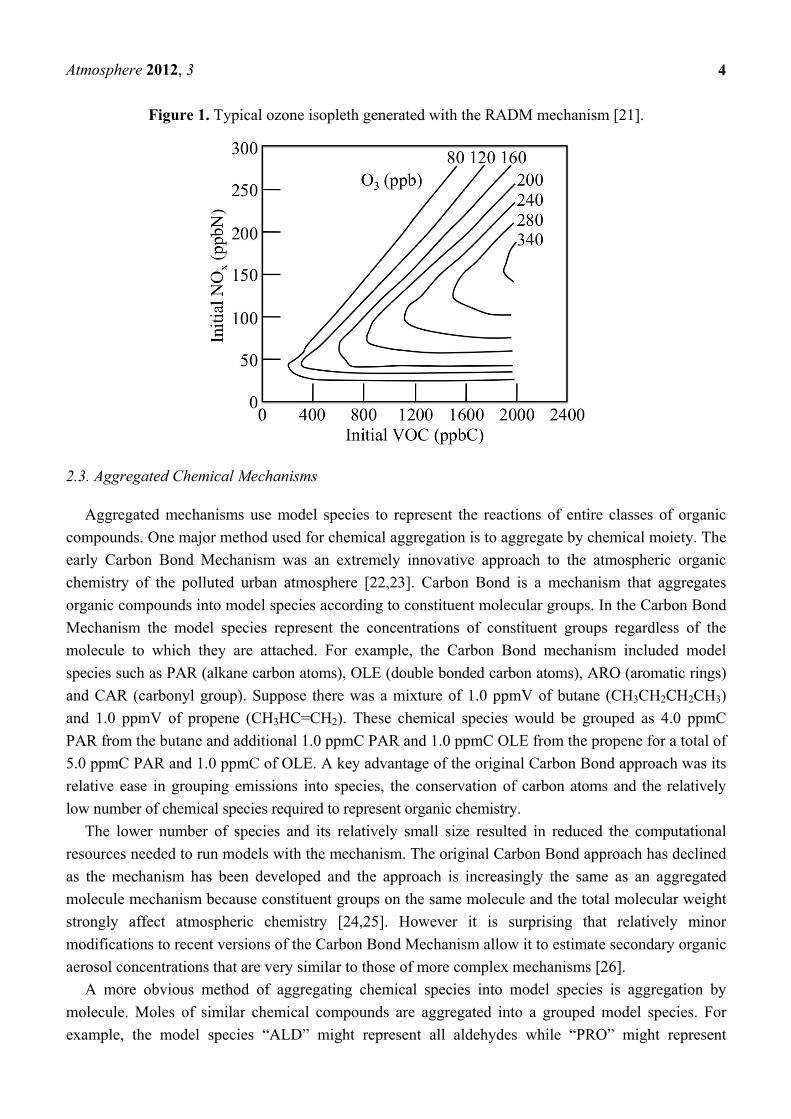
series of simulations with various initial concentrations and/or emissions of NOx and VOC. Maximum
O3 concentrations were plotted as contour diagrams as functions of the initial NOx and VOC
concentrations; these diagrams are known as an ozone isopleths. The EKMA ozone isopleths were
used for developing air quality control strategies and ozone isopleths calculated by more rigorous
methods. Figure 1 shows a sample ozone isopleth generated with the RADM2 (Regional Acid
Deposition Mechanism, version 2) mechanism [21]. For example, the figure shows that when NOx
concentrations are below 50 ppb (ppbN) that further reductions in NOx would not be effective in
reducing the O3 concentration. However at this level of NOx the O3 concentrations are very sensitive to
the VOC concentration. The figure also shows that for greater NOx concentrations that reductions in
either the initial NOx or VOC concentration may lead to less O3.
Atmosphere 2012, 3
4
Figure 1. Typical ozone isopleth generated with the RADM mechanism [21].
2.3. Aggregated Chemical Mechanisms
Aggregated mechanisms use model species to represent the reactions of entire classes of organic
compounds. One major method used for chemical aggregation is to aggregate by chemical moiety. The
early Carbon Bond Mechanism was an extremely innovative approach to the atmospheric organic
chemistry of the polluted urban atmosphere [22,23]. Carbon Bond is a mechanism that aggregates
organic compounds into model species according to constituent molecular groups. In the Carbon Bond
Mechanism the model species represent the concentrations of constituent groups regardless of the
molecule to which they are attached. For example, the Carbon Bond mechanism included model
species such as PAR (alkane carbon atoms), OLE (double bonded carbon atoms), ARO (aromatic rings)
and CAR (carbonyl group). Suppose there was a mixture of 1.0 ppmV of butane (CH3CH2CH2CH3)
and 1.0 ppmV of propene (CH3HC=CH2). These chemical species would be grouped as 4.0 ppmC
PAR from the butane and additional 1.0 ppmC PAR and 1.0 ppmC OLE from the propene for a total of
5.0 ppmC PAR and 1.0 ppmC of OLE. A key advantage of the original Carbon Bond approach was its
relative ease in grouping emissions into species, the conservation of carbon atoms and the relatively
low number of chemical species required to represent organic chemistry.
The lower number of species and its relatively small size resulted in reduced the computational
resources needed to run models with the mechanism. The original Carbon Bond approach has declined
as the mechanism has been developed and the approach is increasingly the same as an aggregated
molecule mechanism because constituent groups on the same molecule and the total molecular weight
strongly affect atmospheric chemistry [24,25]. However it is surprising that relatively minor
modifications to recent versions of the Carbon Bond Mechanism allow it to estimate secondary organic
aerosol concentrations that are very similar to those of more complex mechanisms [26].
A more obvious method of aggregating chemical species into model species is aggregation by
molecule. Moles of similar chemical compounds are aggregated into a grouped model species. For
example, the model species “ALD” might represent all aldehydes while “PRO” might represent
Atmosphere 2012, 3
5
propane and all less reactive alkanes according to an aggregation by molecule approach. In some
schemes weighting factors to account for chemical reactivity or carbon mass may be applied in the
aggregation scheme (e.g., [27]). The series of mechanisms produced by the Statewide Air Pollution
Research Center (SAPRC) at the University of California, Riverside, is an important example of
aggregated chemical mechanisms. This series of mechanisms includes SAPRC-90, SAPRC-99 and
SAPRC-07 air quality mechanisms [28-30]. Versions of SAPRC can represent about 400 categories of
VOCs while condensed versions with less complexity in the VOC chemistry has been created for
urban and regional air quality models. SAPRC was originally designed for the treatment of highly
polluted urban atmospheres and it has evolved to treat regional chemistry as well.
Some mechanisms were developed originally for regional applications and therefore needed to
account for a wider range of pollutant concentrations. Regional mechanisms are designed to provide
predictions for urban regions and for the regional scale. The regional scale includes locations where
NOx concentrations are lower and where the reactivity of more slowly reacting organic compounds is
more important than in urban areas. One widely used example is the Regional Atmospheric Chemical
Mechanism, version 1 (RACM1), the Regional Atmospheric Chemical Mechanism, version 2 (RACM2)
and their predecessors aggregate organic compounds by molecule [21,27,31,32]. RACM2 currently has
a total of 118 model chemical species with a total of 356 reactions.
3. The Chemistry of Air Pollution
3.1. Methods and Models
Simulations were made to illustrate important chemical processes relevant to air quality in this
study. They were performed using a box modeling system described previously with the RACM2
mechanism [31,33]. All simulations were made with gas-phase chemistry for clear sky and constant
meteorological conditions. Physical loss processes, such as deposition, were not included. The first set
included simulations of simple mixtures without emissions. A second set of simulations were made for
a polluted urban case was simulated that included emissions.
The rate of photolysis of O3 and any other compound is the product of the compound’s concentration
and the reaction’s photolysis frequency, J. The photolysis frequency is the integral of the product of
the wavelength dependent, λ, spherically integrated actinic flux, I(λ), the absorption cross-section, σ(λ),
and the quantum yield, φ(λ), (probability that molecule will react after absorbing a photon of
wavelength λ), Equation 1.
( ) ( ) ( )J I λ σ λ φ λ dλ (1)
The photolysis rate coefficients for the photochemical reactions were calculated using the
delta-Eddington radiative transfer model [34]. The RACM2 mechanism includes 33 photolysis
reactions. The absorption cross-sections and quantum yields have been revised to be consistent with
recent recommendations [7,8]. Aldehydes that have photolysis reactions included in RACM2 are
formaldehyde, acetaldehyde, a higher aldehyde, unsaturated aldehyde (formed from aromatic
oxidation) and benzaldehyde. Two photolysis reactions are included for peroxyacetyl nitrate. The
ketones with photolysis reactions in RACM2 are acetone, methethylketone, methylvinylketone and a
Atmosphere 2012, 3
6
higher ketone. The product yields glyoxal, methyl glyoxal and higher dicarbonyl species have been
revised for RACM2 based on the recent data.
All simulations discussed below were made for the surface level with the conditions given in Table 1.
Simulations were performed for an O3 only system, with variations upon the addition of NOx, and
VOCs. Specific cases included adjusting the VOC to NOx ratio by doubling and halving ethene
concentrations, Table 2. Simulations were made with the RACM2 mechanism with initial conditions
and emissions for a polluted urban atmosphere, Tables 1 and 3. Note that in Table 3 for temperatures
of 298 K and pressures of 1 atmosphere, “Slow Alkanes” in RACM2 are defined to have HO• rate
constants less than 3.4 × 10⁻¹² cm3 s−1, “Medium Alkanes” have HO• rate constants between
3.4 × 10⁻¹² and 6.8 × 10⁻¹² cm3 s−1and “Fast Alkanes” have HO• rate constants greater than
6.8 × 10⁻¹² cm3 s−1. “Internal Alkenes” have double bond in an internal position and “Terminal
Alkenes” have a double bond in the terminal position.
These simulations were repeated for a range of temperatures 296, 298 and 300 and these are
discussed in section “3.8. The Effect of Temperature on Ozone Formation”.
Table 1. Conditions used for all simulations.
Initial Condition Value Start-Time 6:00 Duration 48 h Temperature 298 K Pressure 1013.25 mbar H2O Mixing Ratio 15,500 ppm H2 Mixing Ratio 550 ppm Date for photolysis calculation 21 June Latitude 40
Table 2. Simplified simulations made to illustrate atmospheric chemistry mechanisms.
Case O3 (ppb) NO2 (ppb) Ethene (ppb) O3 only 30 0 0 NO2 only 0 30 0 Ethene 4 * 30 2.5 5 Ethene 8 * 30 2.5 10 Ethene 16 * 30 2.5 20
* VOC/NOx ratio.

Atmosphere 2012, 3
7
Table 3. Initial concentrations and emissions used for the simulation of a polluted urban
atmosphere. The initial VOC to NOx ratio is 19.
Species Initial Concentration
(ppb) Emission Rate
(ppb min−1) Inorganic Ozone 30 --- Nitric Oxide 8. 2.77 × 10⁻³ Nitrogen Dioxide 2 5.43 × 10⁻⁴ Sulfur Dioxide 30 2.94 × 10⁻³ Carbon Monoxide 1000 4.53 × 10⁻³ Hydrogen 550 --- Organic Methane 1800 Ethane 3 8.03 × 10⁻⁵ Slow Reacting Alkanes 10 1.86 × 10⁻³ Medium Reacting Alkanes 2.5 6.81 × 10⁻⁴ Fast Reacting Alkanes 1.5 5.10 × 10⁻⁴ Ethene 2.0 6.78 × 10⁻⁴ Internal Alkenes 1.0 3.47 × 10⁻⁴ Terminal Alkenes 2.0 6.94 × 10⁻⁴ Dienes 0.5 1.74 × 10⁻⁴ Benzene 0.9 1.06 × 10⁻⁴ Toluene 2.0 6.05 × 10⁻⁴ Xylene 2.0 6.94 × 10⁻⁴ o-Xylene 1.0 3.44 × 10⁻⁴ Methanol 0.1 --- Ethanol 0.1 --- Higher Alcohols 0.1 --- Formaldehyde 2.5 3.21 × 10⁻⁵ Acetylene 2.0 1.58 × 10⁻⁴ Acetaldehyde 1.0 3.15 × 10⁻⁵ Higher Aldehyde 0.5 --- Acetone 0.3 --- Methyl Ethyl Ketone 2.0 --- Higher Ketone 2.0 --- Ethylene Glycol 0.2 --- Methylglyoxal 0.05 --- Methacrolein 0.1 --- Methyl Vinyl Ketone 0.1 --- Isoprene 3.4 1.18 × 10⁻³ α-Pinenes 1.0 3.47 × 10⁻⁴ d-Limonene 1.0 3.47 × 10⁻⁴
Atmosphere 2012, 3
8
3.2. The Inorganic Chemistry of Ozone Production
Ozone is a constituent of the natural troposphere due primarily to its production in the
stratosphere [35]. A fraction of stratospheric O3 passes to the troposphere (transported by folding
events, for example). Some of the O3 is lost through photochemistry and other reactions and it is
deposited to the Earth’s surface. Excited oxygen atoms, O(1D), are produced by the photolysis of O3.
O3 + hυ → O(1D) + O2 (2)
The majority of the O(1D) are quenched to yield ground state oxygen atoms (O(3P)).
O(1D) + N2 → O(3P) + N2 (3)
O(1D) + O2 → O(3P) + O2 (4)
The O(3P) react with oxygen molecules to form O3, Reaction 5.
O(3P) + O2 + M → O3 + M (5)
In Reaction 5, M represents molecular nitrogen, oxygen or other gaseous species that transfers excess
energy from the transition state to stabilize the potential O3 molecule. Almost all of the O(3P) in the
troposphere react with oxygen molecules (except in highly polluted emission plumes) because
Reaction 5 is very fast in the troposphere due to its high oxygen concentrations and high pressure.
Although most of the O(1D) are quenched to reform O(3P) a fraction of the O(1D) react with water
vapor to form HO•. The HO• radical is the most important oxidant found in the troposphere.
O(1D) + H2O 2HO• (6)
The effects of these reactions are illustrated by a simulation of a mixture of O3 in background air
without NOx or reactive VOC. In the simulation O3 is photolyzed during the daytime to produce
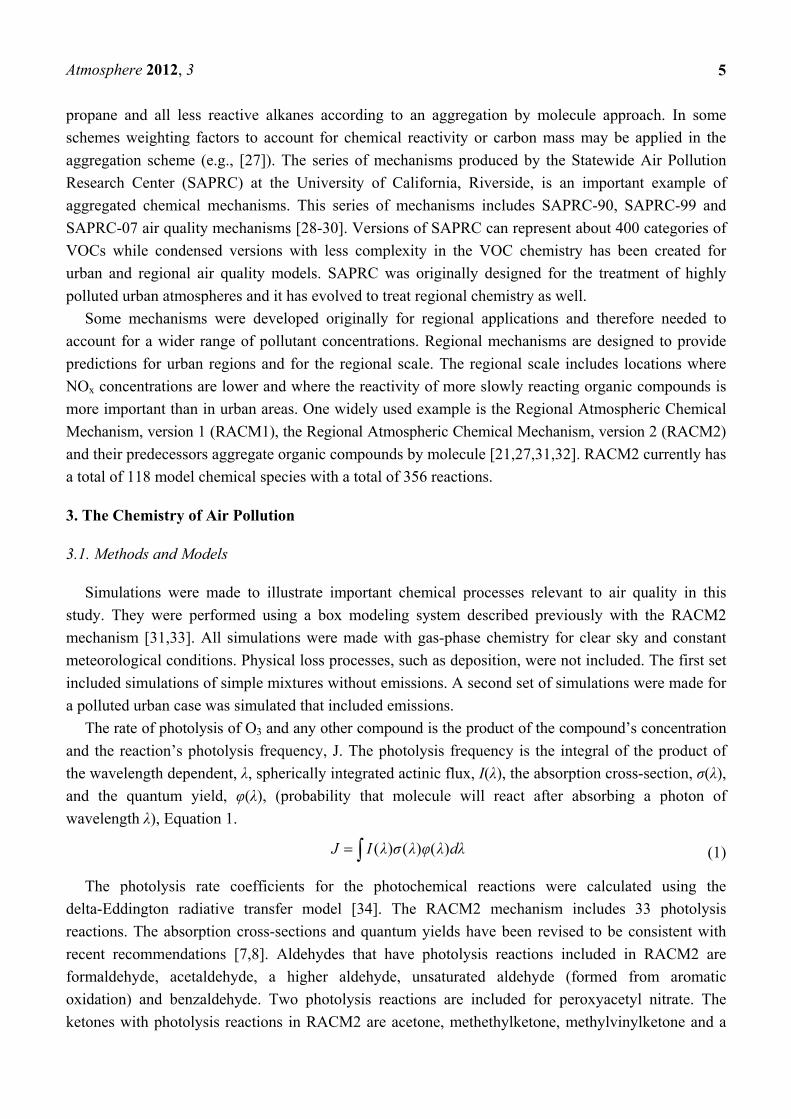
O(1D), Figure 2. Note the extremely low mixing ratios of the O(1D).
Figure 2. Excited oxygen atom (O(1D)) for the O3 only case.

Atmosphere 2012, 3
9
The mixing ratio of the O(1D) follows the solar zenith angle with the peak mixing ratio occurring at
the local solar noon due to its photochemical production. The HO• reacts rapidly with O3 to produce
HO2•, Figure 3.
HO• + O3 → HO2• + O2 (7)
Figure 3. HO• and HO2• radicals for the O3 only case.
The net effect of the photolysis of O3 and its reactions with HO• and HO2• is to reduce O3 mixing
ratios on the second day, Figure 4. On the second day the lower mixing ratios of O3 reduce the
formation rate of O(1D) from photolysis and therefore the O(1D) mixing ratios are lower, Figure 2. The
lower second day O(1D) mixing ratios reduce the mixing ratios of the HO• radical, Figure 3. The HO2•
mixing ratios are lower on the second day but the relative reduction is not as great for HO2• as it is for
O(1D) and HO•.
Figure 4. Ozone mixing ratios for the O3 only case.
Atmosphere 2012, 3
10
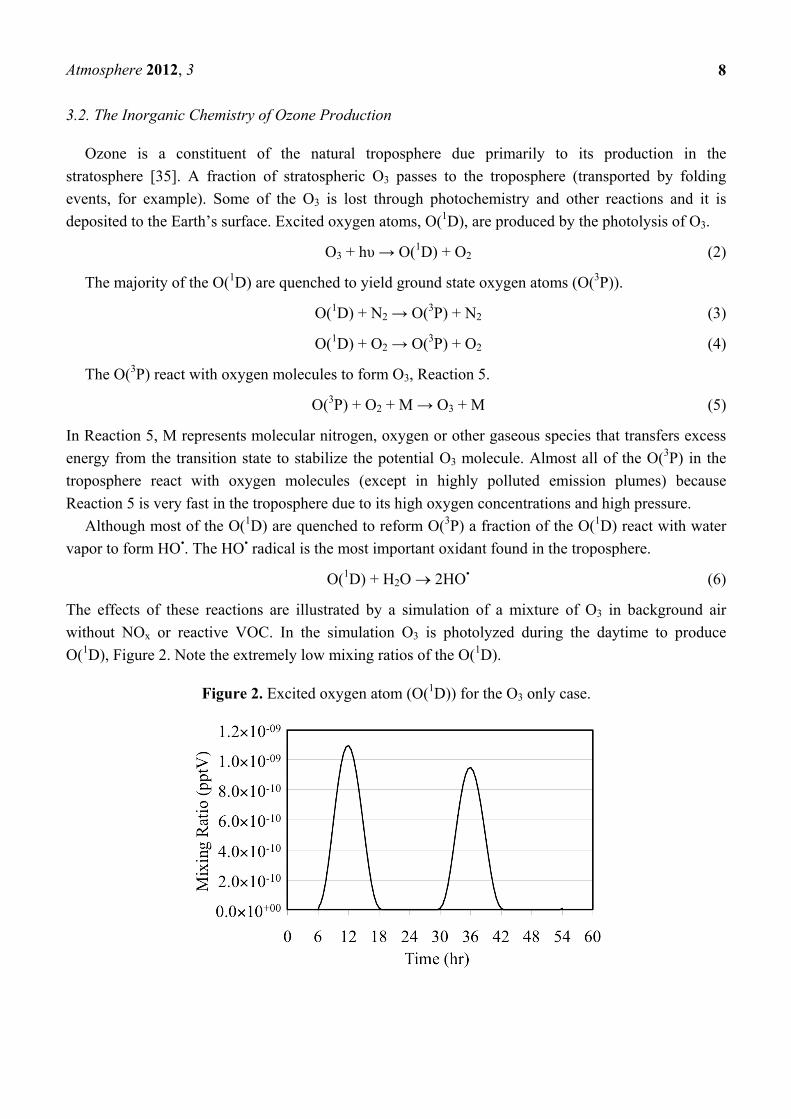
The photolysis of NO2 is the major source of O(3P). These react to produce tropospheric O3 through
Reaction 5.
NO2 + hν → NO + O(3P) (8)
Reaction 9 is a major sink reaction for O3 and NO.
O3 + NO → NO2 + O2 (9)
Reactions 8 and 9 play a major role in controlling tropospheric O3 concentrations. As stated above,
Reaction 5 is very fast in the troposphere so all of the O(3P) produced by NO2 photolysis can be
assumed to react to produce O3. If Reactions 8 and 9 are in equilibrium then the O3 concentration is
given by the O3 photostationary state approximation (PSSA), Equation 10 [36].
2NO 2
3
[NO ]O
NO
J
k (10)
The brackets indicate chemical concentrations for the respective species, JNO2 is the solar radiation
dependant photolysis frequency of Reaction 8 and k is the rate constant of Reaction 9. The value of
JNO2 depends on the intensity of solar radiation and for this reason JNO2 follows the solar diurnal cycle.
According to t34he PSSA the O3 concentration follows the solar diurnal cycle if there is no carbon
monoxide or reactive organic compounds present, Figure 5.
Figure 5. Ozone mixing ratios are shown for the NO2 only case.
3.3. The Effects of Hydrocarbons on Ozone Production
Real tropospheric O3 production occurs when additional reactions involving CO, VOC, nitrogen
oxides, HO•, HO2• and organic peroxy radicals (RO2
• and RCO3•), increase the NO2 to NO
concentration ratio [3,36]. The reaction of HO• radicals with CO and VOC produce peroxy radicals
that convert NO to NO2. Reaction 11 illustrates the formation of the hydroperoxy radical.
HO• + CO (+ O2) → HO2• + CO2 (11)
The formation of the hydroperoxy radical provides a key pathway to the “extra” conversions of NO
to NO2 that are needed for O3 production.

Atmosphere 2012, 3
11
HO2• + NO → HO• + NO2 (12)
There are many VOC compounds that are important for atmospheric chemistry [3,35]. For example,
alkanes are hydrocarbons (containing only hydrogen and carbon atoms) and the atoms are bonded
together with only single bonds. Methane (CH4) is the simplest example of an alkane. Other examples
include ethane (CH3CH3), propane (CH3CH2CH3), n-butane (CH3CH2CH2CH3) and tertiary-butane
(CH3)3CH. The hydrogen atoms on the CH3, CH2 and CH groups are called primary, secondary and
tertiary hydrogen atoms, respectively.
Alkanes react with HO• through abstraction of a hydrogen atom, leading to the production of
hydroperoxy radicals and organic peroxy radicals [3]. Methane reacts with HO• and it abstracts a
hydrogen atom to form a methyl radical and water.
HO• + CH4 → CH3• + H2O (13)
The methyl radical rapidly reacts with oxygen to produce a methyl peroxy radical.
CH3• + O2 → CH3O2
• (14)
The methyl peroxy radical reacts with NO to convert it to NO2.
CH3O2• + NO → CH3O
• + NO2 (15)
The methoxy radical CH3O•, reacts with oxygen to form formaldehyde and a hydroperoxy radical.
CH3O• + O2 → CH2O + HO2
• (16)
The HO2• radical reacts with NO to make one more NO to NO2 conversion through Reaction 12.
The net effect of the initial reaction of the HO• radical with an alkane is to produce several NO to NO2
conversions and these conversions increase the [NO2]/[NO] ratio by Equation 10, and so the
concentration of O3 increases.
For alkanes with more complicated structures HO• may abstract any of an alkane’s hydrogen atoms
but both reactivity differences between the different kinds of hydrogen atoms and the number of the
kinds of hydrogen atoms affect the quantity of the different possible products. For alkanes, tertiary
hydrogen atoms are more reactive than secondary and secondary hydrogen atoms are more reactive
than primary hydrogen atoms. Reactions 17 and 18 illustrate the two possible channels for the reaction
of n-butane with HO•.
Primary Hydrogen Abstraction
CH3CH2CH2CH3 + HO• → CH3CH2CH2CH2• + H2O (17)
Secondary Hydrogen Abstraction
CH3CH2CH2CH3 + HO• → CH3(C•H)CH2CH3 + H2O (18)
The two different radicals react with molecular oxygen to produce a primary organic peroxy radical,
Reaction 19 and a secondary organic peroxy radical, Reaction 20.
CH3CH2CH2CH2• + O2 → CH3CH2CH2CH2O2
• (19)
CH3(C•H)CH2CH3 + O2 → CH3CHO2
•CH2CH3 (20)
Atmosphere 2012, 3
12
The primary organic peroxy radical reacts with NO to produce a primary alkoxy radical that reacts
with oxygen to yield n-butanal, CH3CH2CH2CHO and a HO2• radical.
CH3CH2CH2CH2O2• + NO → CH3CH2CH2CH2O
• + NO2 (21)
CH3CH2CH2CH2O• + O2 → CH3CH2CH2CHO + HO2
• (22)
The secondary organic peroxy radical reacts with NO to produce a secondary alkoxy radical that
reacts with oxygen to yield methyl ethyl ketone, CH3(CO)CH2CH3 and a HO2• radical.
CH3(CHO2•)CH2CH3 + NO → CH3(CHO•)CH2CH3 + NO2 (23)
CH3(CHO•)CH2CH3 + O2 → CH3(CO)CH2CH3 + HO2• (24)
Alkenes are hydrocarbons with at least one double bond. Alkenes lead to greater O3 production than
alkanes because of their higher rate constant for the reaction with HO•. Ethene, CH2=CH2, is the
simplest example of an alkene while propene, CH3CH=CH2, is the next higher compound in the series.
An alkene’s rate constant for its reactions with HO•, O3 and the resulting reaction products, depends
very strongly on the location and number of double bonds in the alkene. For example, butene may have
the double bond located at the end of the molecule, CH2=CHCH2CH3 (1-butene), or within the
molecule, CH3CH=CHCH3 (2-butene). In this case the rate constant for the reaction of HO• with
2-butene is greater than its reaction with 1-butene.
In contrast to alkanes, the HO• reacts with alkenes through addition to either carbon atom of the
double bond. For example, propene adds HO• to produce a radical that adds an oxygen molecule to
form a peroxy radical (CH3(HCOH)CH2O2•), Reactions 25 and 26.
CH3HC=CH2 + HO• → CH3(HCOH)CH2• (25)
CH3(HCOH)CH2• + O2 → CH3(HCOH)CH2O2
• (26)
The CH3(HCOH)CH2O2• radical reacts with NO to produce NO2 and a hydroxy-carbonyl
compound, Reactions 27 and 28.
CH3(HCOH)CH2O2• + NO → CH3(HCOH)CH2O
• + NO2 (27)
CH3(HCOH)CH2O• + O2 → CH3(HCOH)CHO + HO2
• (28)
The net effect is to convert NO to NO2 and this produces more O3 as discussed above.
The reaction of alkenes with O3 forms many products including carbonyl compounds and
HO• [4,37-39]. The reactions of alkenes with O3 are a small but dominant nighttime source of HO•. For
example, the O3 molecule inserts itself across the double bond of propene, Reaction 29.
CH3CH=CH2 + O3 → CH3CHOOOCH2 (29)
The CH3CH2OOOCH2product fragments through two different reactions to make acetaldehyde,
formaldehyde, CH2O, and excited Criegee radicals, [•CH2OO•]≠ and [CH3•CHOO•]≠.
CH3CHOOOCH2 → CH3CHO + [•CH2OO•]≠ (30)
CH3CHOOOCH2 → CH2O + [CH3•CHOO•]≠ (31)
The excited Criegee radicals produce a wide variety of products, with one of the reactions producing
HO• radicals [37].

Atmosphere 2012, 3
13
[•CH2OO•]≠ → HCO• + HO• (32)
The effect of reactive organic compounds on O3 formation is illustrated by three of simulations that
initially contained O3, ethene and NO2. The VOC/NOx ratios were 4, 8 and 16 ppbC/ppbN. The
production of ozone for the chosen initial concentration of NO2 was VOC limited because the ozone
mixing ratio increased with increasing initial concentrations of ethene, Figure 6.
Figure 6. Ozone mixing ratios are shown for the ethene cases.
Figure 6 shows that for these cases O3 was formed rapidly on the first day but on the second day the
air was aged and there was a small loss of O3. Notice that the rate of O3 formation during the morning
of the first day depends on the VOC/NOx ratio. The mixture with a VOC/NOx ratio of 16 ppbC/ppbN
forms O3 between 8:00 and 10:00 at a rate of 9.2 ppb h−1 while for VOC/NOx ratios of 8 and
4 ppbC/PPbN the rates are 6.7 and 3.7 ppb h−1, respectively. The presence of ethene leads to the
production of organic peroxy radicals (CH2OH-CH2O2•, in this case), Figure 7 and HO2
• radicals,
Figure 8. Greater VOC/NOx ratios lead to higher mixing ratios of peroxy radicals, CH2OH-CH2O2 (in
this case), and increased production of O3 due to more rapid conversion of NO to NO2.
Figure 7. The CH2OH-CH2O2•, radical mixing ratios are shown for the ethene cases. The
number indicates the initial VOC/NOx ratio in ppbC/ppbN.

Atmosphere 2012, 3
14
Figure 8. Hydroperoxy radical, HO2•, mixing ratios are shown for the ethene cases. The
number indicates the initial VOC/NOx ratio in ppbC/ppbN.
The formation of O3 occurs as a deviation from the PSSA, Equation 10. Equation 10 can be
rearranged to give Equation 33.
2NO 3
2
O NO
NO
J
k (33)
If a simulated atmosphere obeyed the PSSA, the left hand and right hand sides of Equation 33
would be equal. Since JNO2/k, time dependent ratio of the photolysis frequency of NO2 to the rate
constant for the O3 + NO reaction, is fixed for a given set of conditions it can be used as a basis for
comparison with the ratio, [O3] × [NO]/[NO2]. These are plotted on Figure 9 for the three simulated
ethene cases.
Figure 9. The uppermost curve is the time dependent NO2 photolysis frequency divided by
the rate constant for the O3 + NO reaction. The lower plots are the ratio, [O3] × [NO]/[NO2],
for the three ethene cases. The number indicates the initial VOC/NOx ratio in ppbC/ppbN.

Atmosphere 2012, 3
15
Figure 9 shows that the greater the initial mixing ratios of ethene the greater the deviation from the
PSSA. Comparison of Figures 6 and 9 show that the greater the deviation from the PSSA the greater
the formation. This result is in accord with the higher mixing ratios of peroxy radicals that are
associated with higher VOC/NOx ratios. Increased peroxy radical concentrations provide faster
conversion of NO to NO2. This increases the production rate of O3 by the increasing the NO2
photolysis rate. The conversion of NO to NO2 reduces the O3 loss rate by reducing the rate of the O3
reaction with NO. Increasing the O3 production rate and decreasing its destruction rate at the same time
has the net effect of increasing O3 mixing ratios. The greater the O3 production the greater the
deviation from [O3] × [NO]/[NO2] for these reasons [36].
HO2• and HO• radicals are in equilibrium and the partitioning between the concentrations of these
two radicals depends on the NO concentration. In this case higher mixing ratios of HO2• are associated
with lower mixing ratios of HO•, Figures 8 and 10.
Figure 10. Hydroxyl radical, HO•, mixing ratios are shown for the ethene cases. The
number indicates the initial VOC/NOx ratio in ppbC/ppbN.
Aromatic compounds are the third type of hydrocarbon that is important for air pollution, and is the
subject of ongoing research. The oxidation mechanism of aromatic compounds leads to the production
of peroxy radicals and high molecular weight compounds that may condense to produce secondary
organic aerosols. The chemistry of oxidation of aromatic compounds is very complicated and there are
too many compounds and reactions to include in a mechanism to be routinely used for air quality
modeling. There are at least several hundred reactions and products for a parent aromatic compound [40].
The chemistry of a reaction of the HO• radical with an organic substituent attached to an aromatic ring
is the easiest to describe. However, only about 10% of the hydroxy radicals abstract hydrogen atoms
from an alkyl group, attached to an aromatic ring. In this case the chemical mechanism will be that of
the substituent group. For example, when HO• reacts with the methyl group of toluene, the subsequent
chemistry is similar to alkanes. A hydrogen atom is abstracted and an oxygen molecule adds to the
CH2• radical on the aromatic ring to make peroxy radical. The peroxy radical may react with NO to
produce benzaldehyde.

Atmosphere 2012, 3
16
The addition of HO• to an aromatic ring is the dominant aromatic reaction [40]. The subsequent
reactions that follow this addition reaction may lead to either the breaking of the aromatic ring or
ring-retaining products. In the case of the simplest aromatic compound, benzene, phenol is a
ring-retaining product that is produced in high yield. Bloss et al. [41] supports a phenol yield of 0.52
while Berndt and Böge [42] determined the yield of phenol to be 0.61 ± 0.07 in the presence and
absence of NOx.
A very large number of highly reactive compounds result when the ring breaks. The reactive
compounds include a large number of dicarbonyl compounds that contain two carbonyl groups (C=O),
are produced. These dicarbonyl compounds have a complicated and relatively unknown chemistry.
Studies regarding the ring-opening products of the HO•-benzene reaction are sparse. The main aspects
of their formation are uncertain due to lack of good experimental techniques for their quantification, a
lack of commercially available standards, and their high reactivity.
For example, Gomez Alvarez et al. [43] confirmed the existence of dicarbonyl production and they
found that the yields of dicarbonyls could be high. Fast ring-cleavage was observed, due to a peak in
observed γ-dicarbonyls shortly after the chamber was opened to sunlight. Also, high yields of
dicarbonyls (e.g., glyoxal) imply a high formation rate of HO• into the system. They found that yields
of glyoxal with values of 42 ± 3% and 36 ± 2% in two successive experiments. To be able to
investigate the existence of higher molecular weight dicarbonyl compounds they had to synthesize
cis- and trans-butenedial for calibration purposes. For one experiment they found total butenedial
yields of 17 ± 9% with a breakdown of 8 ± 4% cis-butenedial and 9 ± 5% trans-butenedial. For a
second experiment they found total butenedial yields of 15 ± 6%; the breakdown was 7 ± 3% and
7 ± 3% for the cis and trans isomers, respectively.
3.4. The Atmospheric Chemistry of Aldehydes, Ketones and Peroxyacetyl Nitrate
Aldehydes and ketones contain a carbonyl group, C=O. As presented above, aldehydes and ketones
are oxidation products of VOC and many have biogenic and anthropogenic emission sources [9,35].
Formaldehyde is the simplest aldehyde. Higher molecular weight aldehydes follow the template
RCHO; they have one hydrogen atom attached to the carbonyl and another organic functional group
attached to it. Acetone, CH3(CO)CH3 is the simplest ketone. Higher molecular weight ketones follow
the template R1(CO)R2; they have two organic functional groups attached to the carbonyl and these
groups maybe the same or different.
Aldehydes and ketones react with HO• by abstraction of a hydrogen atom. The overall scheme has
some similarity to the alkane oxidation scheme with some exceptions. Reaction 34 shows formaldehyde
as an example of one exception.
CH2O + HO• → CHO• + H2O (34)
The carbonyl radical, CHO•, does not add to oxygen to produce a peroxy radical but rather, it reacts
with oxygen to produce the HO2• radical.
CHO• + O2 → CO + HO2• (35)
The carbonyl group is a strong chromophore for ultraviolet radiation. The absorption of ultraviolet
radiation causes photo-dissociation of these compounds and some of the reaction channels lead to the

Atmosphere 2012, 3
17
production of radicals. For example, formaldehyde has two photolysis reactions that occur in the lower
troposphere. Reaction 36 yields molecular products while Reaction 37 yields radical products.
CH2O + h → H2 + CO (36)
CH2O + h → H• + CHO• (37)
The net effect of Reaction 37 is to produce two HO2• radicals because the CHO• reacts according to
Reaction 35 and the hydrogen atom reacts with oxygen to produce another HO2•.
H• + O2 → HO2• (38)
Under highly polluted urban conditions the photolysis of formaldehyde can be a source of HOx radicals
that is as important as O3.
Acetaldehyde, CH3CHO, is the next higher molecular weight aldehyde. It reacts in the polluted
atmosphere to produce peroxyacetyl nitrate, CH3(CO)O2NO2, (PAN) [3]. PAN is an important
compound because it serves as a reservoir of acetyl radicals and NO2 and it is a strong lachrymator.
The mechanism of PAN formation begins with HO• abstracting the hydrogen atom that is attached to
the carbonyl group in acetaldehyde. The addition of oxygen to the resulting CH3CO• radical produces
the acetyl peroxy radical.
CH3CHO + HO• → CH3CO• + H2O (39)
CH3CO• + O2 → CH3(CO)O2• (40)
CH3(CO)O2• + NO2 → CH3(CO)O2NO2 (41)
PAN decomposes thermally to reproduce acetyl peroxy radicals and NO2.
CH3(CO)O2NO2 → CH3(CO)O2 + NO2 (42)
PAN is in equilibrium with NO2 and the CH3(CO)O2 radical at temperatures near 25 °C. PAN is
much more stable at lower temperatures and the lifetime of PAN becomes longer. PAN can be
transported over long distances in the upper troposphere where the temperatures are colder and its
photolysis becomes important. The photolysis of PAN proceeds by two pathways. The faster pathway
forms the acetyl peroxy radical and NO2. The slower photolysis route involves the destruction of PAN
by the formation of the methyl peroxy radical, CO2 and NO3. Higher molecular weight aldehydes form
acyl peroxy radicals that may react to produce higher homologs of PAN [3,44].
3.5. The Nighttime Chemistry of the Nitrate Radical
The nitrate radical, NO3•, is the nighttime analog of the hydroxyl radical and it is produced by the
reaction of O3 with NO2.
O3 + NO2 → O2 + NO3• (43)
Daytime concentrations of NO3• are low due to its rapid photolysis reactions with photolysis
frequencies that are several times greater than NO2. There are two photolysis reactions.
NO3• + hν → O2 + NO (44)
NO3• + hν → O(3P) + NO2 (45)

Atmosphere 2012, 3
18
The NO3• radical becomes much more important at night when its concentration increases, Figure 11.
Figure 11. Nitrate radical mixing ratios for the ethene cases. The number indicates the
initial VOC/NOx ratio in ppbC/ppbN.
The NO3• reacts with NO2 to produce dinitrogen pentoxide, N2O5, but this is not a stable compound
and it is in equilibrium with NO3• and NO2.
NO3• + NO2 → N2O5 (46)
N2O5 → NO3• + NO2 (47)
What makes N2O5 significant is that it can react with water on aerosol and other surfaces to produce
nitric acid, HNO3. This nighttime loss of reactive nitrogen may reduce the formation of O3 on
subsequent days during the summer season.
The NO3• radical reacts with many organic compounds [45]. Alkanes and aromatic compounds react
slowly with NO3• but the radical reacts rapidly with alkenes by addition. Possibly the most important
organic reaction is the reaction of NO3• with aldehydes because it is a strong source of nighttime
peroxy radicals [46,47]. For example, formaldehyde and NO3• react to produce HNO3 and CHO•
radicals. The reaction proceeds through the abstraction of a hydrogen attached to the carbonyl group.
NO3• + CH2O → HNO3 + CHO• (48)
The CHO• radical reacts immediately with molecular oxygen to produce HO2• radicals as discussed
above, Reaction 35. The reaction of NO3• with acetaldehyde can lead to the formation of PAN. The
hydrogen attached to the carbonyl group is abstracted and then Reaction 49 is followed by Reactions
40 and 41 to produce PAN [47].
NO3• + CH3CHO → HNO3 + CH3CO• (49)
The reaction of NO3• with alkenes is similar to HO•; it reacts by addition but this process is more
prevalent during the nighttime due to the typical higher concentrations of NO3•. The NO3
• participates
in radical termination reactions too and these are discussed below.
Atmosphere 2012, 3
19
3.6. Radical Termination, the Production of Atmospheric Acids and Hydrogen Peroxides
Tropospheric chemistry involves many chain reactions as discussed above. At some point the chain
reactions must terminate. The reaction of HO• with NO2 to the form HNO3, Reaction 50, and the
self-reaction of HO2• to form hydrogen peroxide, Reaction 51 are among the most important.
HO• + NO2 → HNO3 (50)
HO2• + HO2
• (+H2O, M) → H2O2 + O2 (51)
Note that the overall rate parameter for the self-reaction of HO2• depends on atmospheric pressure and
the water vapor concentration [48]. Figure 12 shows the formation of HNO3 for the ethene cases where
NO is relatively high.
Figure 12. Nitric acid mixing ratios are shown for the ethene cases. The number indicates
the initial VOC/NOx ratio in ppbC/ppbN.
Figure 12 shows that the mixing ratios of HNO3 decrease as the VOC/NOx ratio increases for the
ethene simulations. This is consistent with the decrease in the mixing ratio of HO• shown in Figure 10.
The reaction of HO• with NO2 is more important for urban conditions where NO concentrations are
high while the self-reaction of HO2• is more important for rural and remote conditions where NO
concentrations are low. Figure 13 shows hydrogen peroxide formation for the ethene cases.
Figure l3 shows a typical trend with the mixing ratio of H2O2 depending on the VOC to NOx ratio.
Higher VOC concentrations relative to the NO concentration lead to the production of greater
concentrations of HO2•. Higher concentrations of HO2
• result in greater amounts of termination through
the HO2• self reaction, Reaction 51, producing more H2O2.
Some termination of the radical chains occurs through the reactions of HO2• with other peroxy
radicals at low NO concentrations. These reactions typically lead to the production of organic
hydrogen peroxides. For example the methylperoxy radical reacts with the HO2• radical to produce
methyl hydrogen peroxide, CH3OOH.
CH3O2• + HO2
• → CH3OOH + O2 (52)
Atmosphere 2012, 3
20
Figure 13. Hydrogen peroxide mixing ratios are shown for the ethene cases. The number
indicates the initial VOC/NOx ratio in ppbC/ppbN.
The reactions of organic peroxy radicals are more complicated. For many organic peroxy radicals
there are two reactions that occur. The first is the disproportion reaction that yields oxygen and
alkoxy radicals.
CH3O2• + CH3O2
• → 2 CH3O• + O2 (53)
The second type of organic peroxy radicals-radical reaction is the transfer of a hydrogen atom from
a carbon atom that is adjacent to the peroxy oxygen atoms. The hydrogen atom is transferred to the
oxygen atom that is adjacent to the other carbonyl group. For example, in the case of the self-reaction
of the methylperoxy radical, formaldehyde and methanol are produced.
CH3O2• + CH3O2
• → CH3OH + CH2O + O2 (54)
In the case of two different organic peroxy radicals there is the disproportion reaction and the
transfer of the hydrogen atom that can go in both directions.
CH3O2• + CH3CH2O2
• → CH3O + CH3CH2O + O2 (55)
CH3O2• + CH3CH2O2
• → CH3OH + CH3CHO + O2 (56)
CH3O2• + CH3CH2O2
• → CH2O + CH3CH2OH + O2 (57)
The transfer of a hydrogen atom can only go in one direction in the case of acyl organic peroxy
radicals. For acyl organic peroxy radicals there is no adjacent hydrogen atom on the carbon atom
adjacent to the peroxy oxygen atoms [49]. For example the reaction of the methylperoxy radical with
the acetyl peroxy radical there are two major reactions.
CH3O2• + CH3CO3
• → CH3O• + CH3CO2
• + O2 (58)
CH3O2• + CH3CO3
• → CH2O + CH3COOH + O2 (59)
The CH3CO2• reacts with molecular oxygen to produce carbon dioxide and the methyl peroxy radical.

Atmosphere 2012, 3
21
CH3CO2• + O2 → CH3O2 + CO2 (60)
Figure 14 shows the formation of organic peroxides from the reaction of methyl peroxy radical with
organic peroxy radicals to form peroxides of the form CH3OOR.
Figure 14. Organic peroxide mixing ratios are shown for the ethene cases. The number
indicates the initial VOC/NOx ratio in ppbC/ppbN.
The reactions of organic peroxy radicals with NO3 radical may be highly important but there is
relatively little data available as they are difficult to study in the laboratory. Organic peroxy radicals
are expected to react with NO3• as shown in Reaction 61 [50].
RO2• + NO3 → RO• + NO2 + O2 (61)
But the reaction is not chain terminating because the RO will react to produce additional radicals.
Another reaction that is not chain terminating is the reaction of HO• with SO2, in contrast to its
reaction with NO2. The reaction of HO• with SO2 is an important source of sulfate and acid deposition
but it does not greatly affect the atmospheric HOx concentration. The reaction follows the following
mechanism [51].
HO• + SO2 → HOSO2• + O2 (62)
HOSO2• + O2 → SO3
• + HO2• (63)
SO3• + H2O → H2SO4 (64)
3.7. The Behavior of a Complex Atmospheric Chemistry System
The purpose of this section is to illustrate the chemistry discussed above and to show how it applies
to a more complex mixture that is closer to the real polluted atmosphere. There are important
interactions between atmospheric inorganic chemistry and organic chemistry that affect the production
of O3, peroxy radicals, HNO3 organic peroxides and many other species. These interactions are
examined through the simulation of the complex mixture described in Tables 2 and 3. The simulated
Atmosphere 2012, 3
22
case is a relatively realistic mixture of air pollutants with their emissions based on measurements made
at Howard University’s atmospheric field site near Beltsville, Maryland.
Figure 15 shows the production of O3 from NO and NO2. The mixing ratios of NO and O3 were
initialized to high values for this box model simulation. Under polluted urban conditions NO may
accumulate near the surface during the nighttime and during the early morning rush hours. The onset
of convection mixes O3 from aloft to rapidly titrate the NO to produce NO2. The photolysis of NO2
produces O3. This increase in O3 drives down the NO mixing ratio further during the first few hours of
the simulation. Emissions maintain a NO2 mixing ratio of a few parts per billion for the entire episode.
The mixing ratios of O3 and NO2 decrease during the nighttime due to the reaction of NO2 with O3 to
produce NO3 radical and N2O5. Nighttime chemistry converts NOx to HNO3, thereby removing
reactive nitrogen from the atmosphere.
Figure 15. Ozone, NO and NO2 mixing ratios are shown for the polluted urban atmosphere case.
Figure 16. Hydroxyl radical, nitrate radical and dinitrogen pentoxide mixing ratios are
shown for the polluted urban atmosphere case.
Figure 16 shows that after sunset the mixing ratios of N2O5 and NO3 increase rapidly. Later during
the night the NO3 mixing ratios decrease due to the loss of NO3 through titration by NO emissions and,
to a lesser extent, through the reactions of NO3 with aldehydes and alkenes. In addition N2O5 reacts
with liquid water on aerosol and other surfaces although not included in this gas-phase simulation.

Atmosphere 2012, 3
23
The time dependent profiles for the HO• are more complicated than those in Figure 10. The HO•
mixing ratios are much lower during the nighttime but they do not fall to zero due to their production
from the reaction of O3 with alkenes. Another feature is that on the first day there is a double peak due
to changes between the major sources and sinks of HO•. One change in the HO• sink is due to a severe
drop in the initial mixing ratios of biogenically emitted alkenes.
The major daytime sources of HO• are the photolysis of formaldehyde and O3, Figures 17 and 18.
Figure 17 shows the production rates and Figure 18 shows the relative production rates. In these
figures the formaldehyde HO• production rate was calculated by multiplying production rate of HO2•
from formaldehyde photolysis by the fraction of HO2• radicals that react with NO.
Figure 17. Production rates of HO• initiated through the photolysis of formaldehyde (red
line) and the photolysis of O3 (blue line) are shown for the polluted urban atmosphere case.
Figure 18. Daytime relative production rates of HO• resulting from the photolysis of
formaldehyde (red line) and the photolysis of O3 (blue line) are shown for the polluted
urban atmosphere case.
Formaldehyde photolysis is the more important source during the early morning and late afternoon
hours. The time dependent profile of the formaldehyde photolysis source is skewed toward the
morning hours while the time dependent profile of the O3 photolysis source mirrors the O3 photolysis
Atmosphere 2012, 3
24
rate constant. However, when these two HO• sources are examined on a percentage basis the profiles
appear to be much more symmetrical, Figure 18.
Reaction of HO• is almost equally divided between inorganic and organic species, Table 4. A very
large fraction of HO• reacts with CO. For VOC, the reaction of HO• with aldehydes and other products
of hydrocarbon oxidation were the second most important class of hydroxyl radical reactions while the
reaction of HO• with the hydrocarbons was the third.
Table 4. Relative percentages of HO• radicals reacting with chemical species over the
entire simulated period.
Species Percent (%) Inorganic CO 35.12 SO2 4.33 NOx 3.05 H2O2 2.17 O3 1.53 Radicals (HO2 + NO3) 0.81 H2 0.60 HNOy 0.15 Total Inorganic 47.76 VOC CH4 1.85 Hydrocarbons 14.50 Aldehydes, and other hydrocarbon products 35.89 Total Organic 52.24
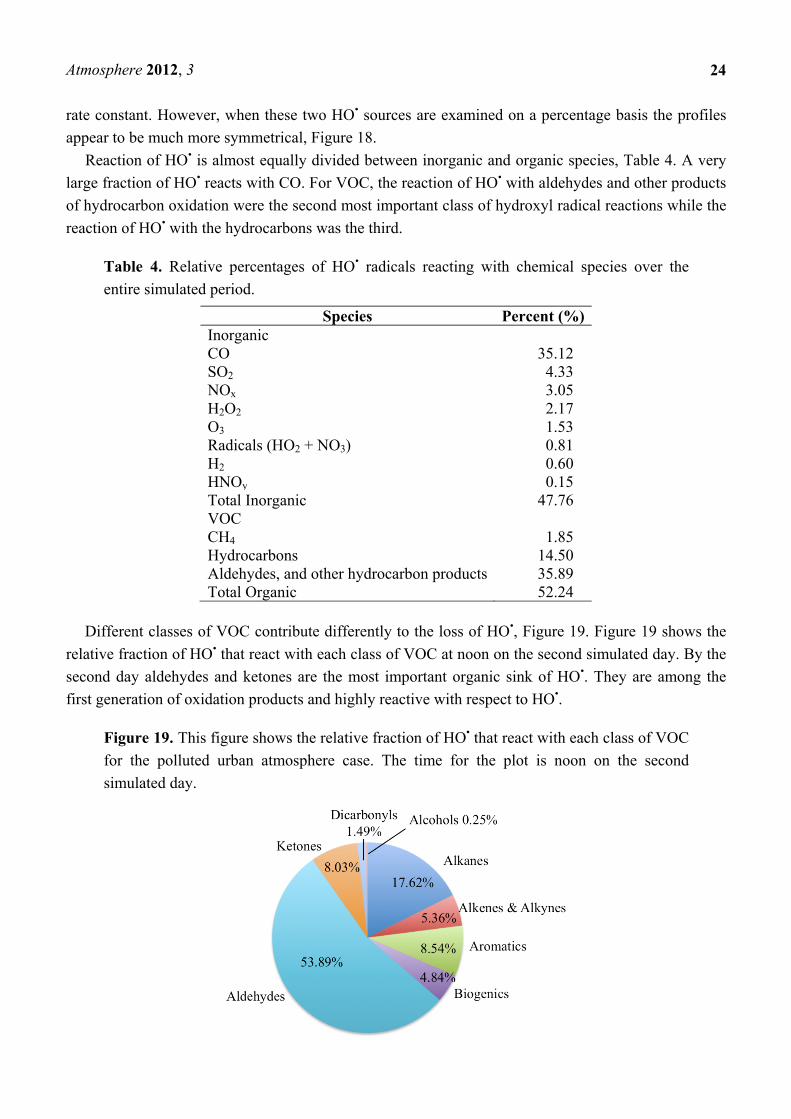
Different classes of VOC contribute differently to the loss of HO•, Figure 19. Figure 19 shows the
relative fraction of HO• that react with each class of VOC at noon on the second simulated day. By the
second day aldehydes and ketones are the most important organic sink of HO•. They are among the
first generation of oxidation products and highly reactive with respect to HO•.
Figure 19. This figure shows the relative fraction of HO• that react with each class of VOC
for the polluted urban atmosphere case. The time for the plot is noon on the second
simulated day.
Atmosphere 2012, 3
25
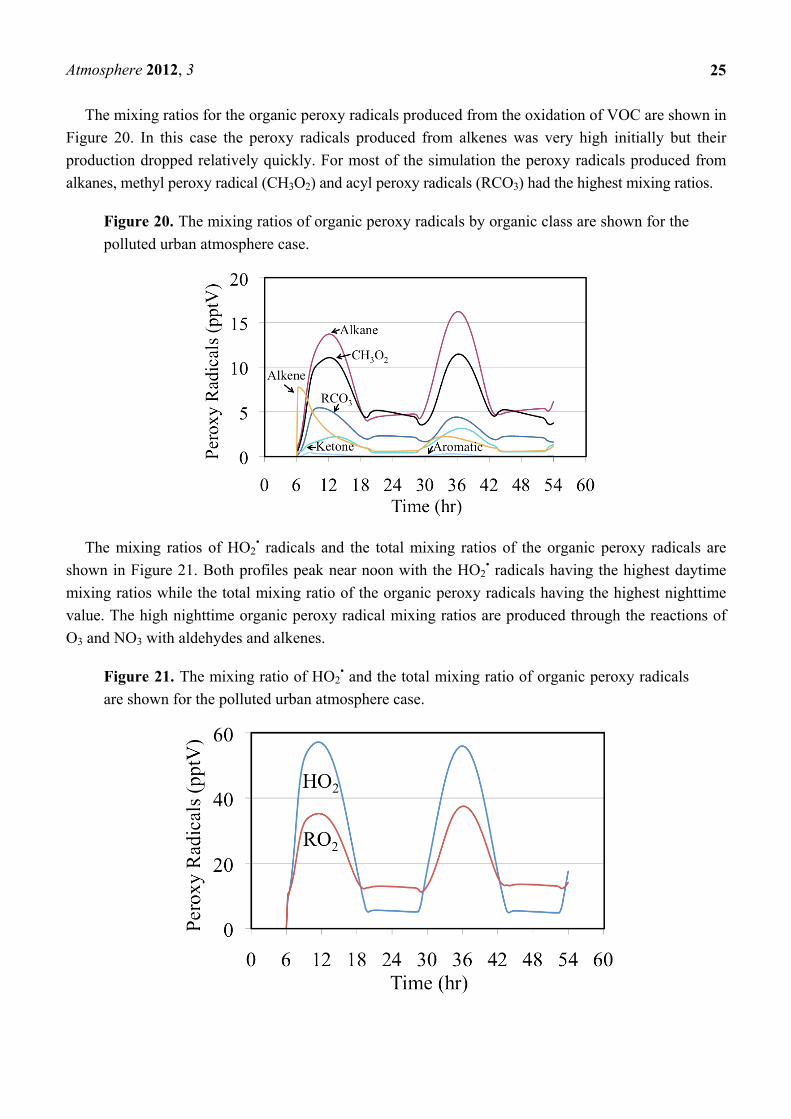
The mixing ratios for the organic peroxy radicals produced from the oxidation of VOC are shown in
Figure 20. In this case the peroxy radicals produced from alkenes was very high initially but their
production dropped relatively quickly. For most of the simulation the peroxy radicals produced from
alkanes, methyl peroxy radical (CH3O2) and acyl peroxy radicals (RCO3) had the highest mixing ratios.
Figure 20. The mixing ratios of organic peroxy radicals by organic class are shown for the
polluted urban atmosphere case.
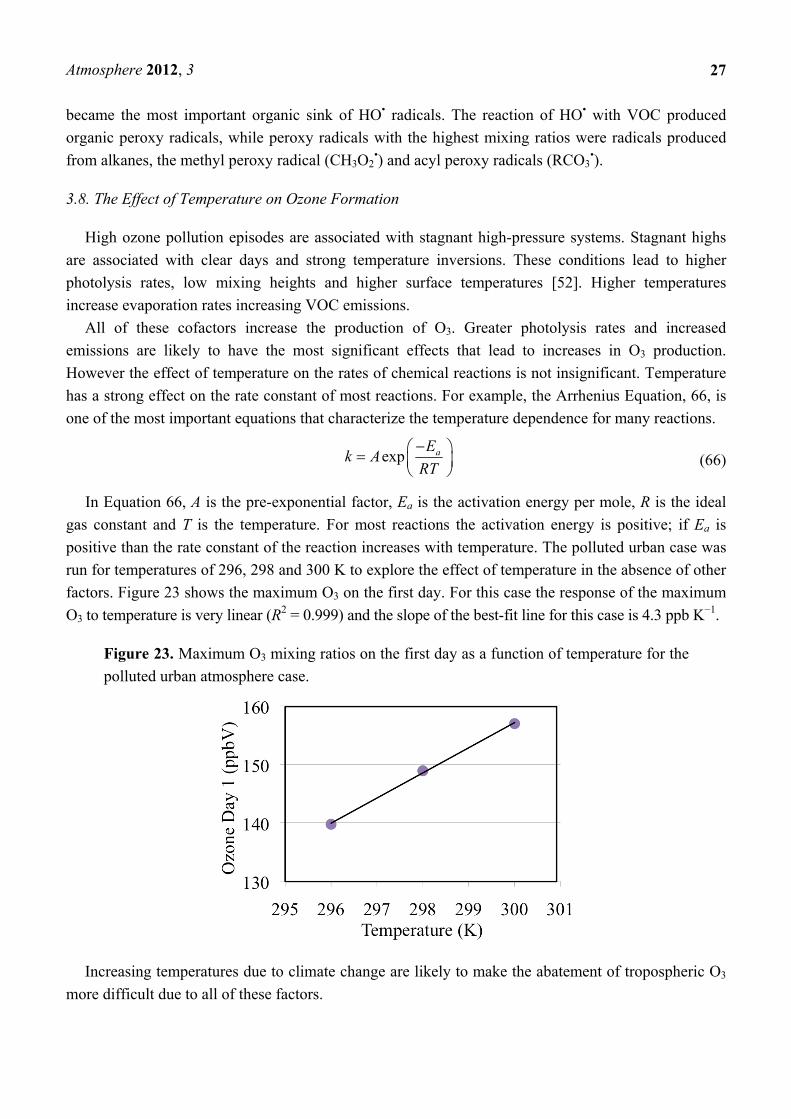
The mixing ratios of HO2• radicals and the total mixing ratios of the organic peroxy radicals are
shown in Figure 21. Both profiles peak near noon with the HO2• radicals having the highest daytime
mixing ratios while the total mixing ratio of the organic peroxy radicals having the highest nighttime
value. The high nighttime organic peroxy radical mixing ratios are produced through the reactions of
O3 and NO3 with aldehydes and alkenes.
Figure 21. The mixing ratio of HO2• and the total mixing ratio of organic peroxy radicals
are shown for the polluted urban atmosphere case.

Atmosphere 2012, 3
26
The initial atmosphere was assumed to be NO2 and NO, Figure 22. These were rapidly converted to
a mixture that also included organic nitrates, peroxyactyl nitrates and HNO3.
Figure 22. The time dependent fate of the nitrogen containing species is shown as a stack
plot for the polluted urban atmosphere case.
Organic nitrates are produced from the reaction of organic peroxy radicals with NO, Reaction 65.
RO2• + NO → RNO3 (65)
The yield of organic nitrates tends to increase for higher molecular weight organic peroxy
radicals [45]. The peroxyactyl nitrates were produced from the reaction of acetyl peroxy radicals with
NO2. There is strong production of HNO3 during the day and nighttime. However the HNO3
production rate is somewhat slower at sunrise and sunset due to the lower concentrations of HO• or
NO3 radicals during these times. The figure shows that over the long term of the simulation that
nitrogen oxide emissions are converted to HNO3 and organic nitrates.
In summary of this section, the polluted urban atmosphere simulation showed that there is a
complex interplay between the daytime and nighttime chemistry induced by the HO• and NO3 radicals,
respectively. Both of these radicals react to convert NOx to HNO3 while oxidizing organic compounds.
The nighttime reactions of O3 and NO3 with aldehydes and alkenes produced HO•, HO2• and organic
peroxy radical production during the night.
The loss of NOx reduces O3 formation because it is the photolysis of NO2 that leads to the
production of O3. While the mixture began with NO and NO2 as the only reactive nitrogen containing
species as the air aged these were converted to HNO3 and organic nitrates. The loss of NOx was
somewhat underestimated in this gas-phase simulation because the heterogeneous conversion of N2O5
to HNO3 was not included. Dry and wet depositions of HNO3 are very significant sinks for
atmospheric nitrogen but these were not included in our simulations. In addition, sulfate, hydrogen
peroxide and organic peroxides are removed from the atmosphere through deposition.
The daytime formaldehyde photolysis was a more important source of HO• radicals than O3
photolysis during the early morning and late afternoon hours and as the air aged aldehydes and ketones
Atmosphere 2012, 3
27
became the most important organic sink of HO• radicals. The reaction of HO• with VOC produced
organic peroxy radicals, while peroxy radicals with the highest mixing ratios were radicals produced
from alkanes, the methyl peroxy radical (CH3O2•) and acyl peroxy radicals (RCO3
•).
3.8. The Effect of Temperature on Ozone Formation
High ozone pollution episodes are associated with stagnant high-pressure systems. Stagnant highs
are associated with clear days and strong temperature inversions. These conditions lead to higher
photolysis rates, low mixing heights and higher surface temperatures [52]. Higher temperatures
increase evaporation rates increasing VOC emissions.
All of these cofactors increase the production of O3. Greater photolysis rates and increased
emissions are likely to have the most significant effects that lead to increases in O3 production.
However the effect of temperature on the rates of chemical reactions is not insignificant. Temperature
has a strong effect on the rate constant of most reactions. For example, the Arrhenius Equation, 66, is
one of the most important equations that characterize the temperature dependence for many reactions.
exp aEk A
RT
(66)
In Equation 66, A is the pre-exponential factor, Ea is the activation energy per mole, R is the ideal
gas constant and T is the temperature. For most reactions the activation energy is positive; if Ea is
positive than the rate constant of the reaction increases with temperature. The polluted urban case was
run for temperatures of 296, 298 and 300 K to explore the effect of temperature in the absence of other
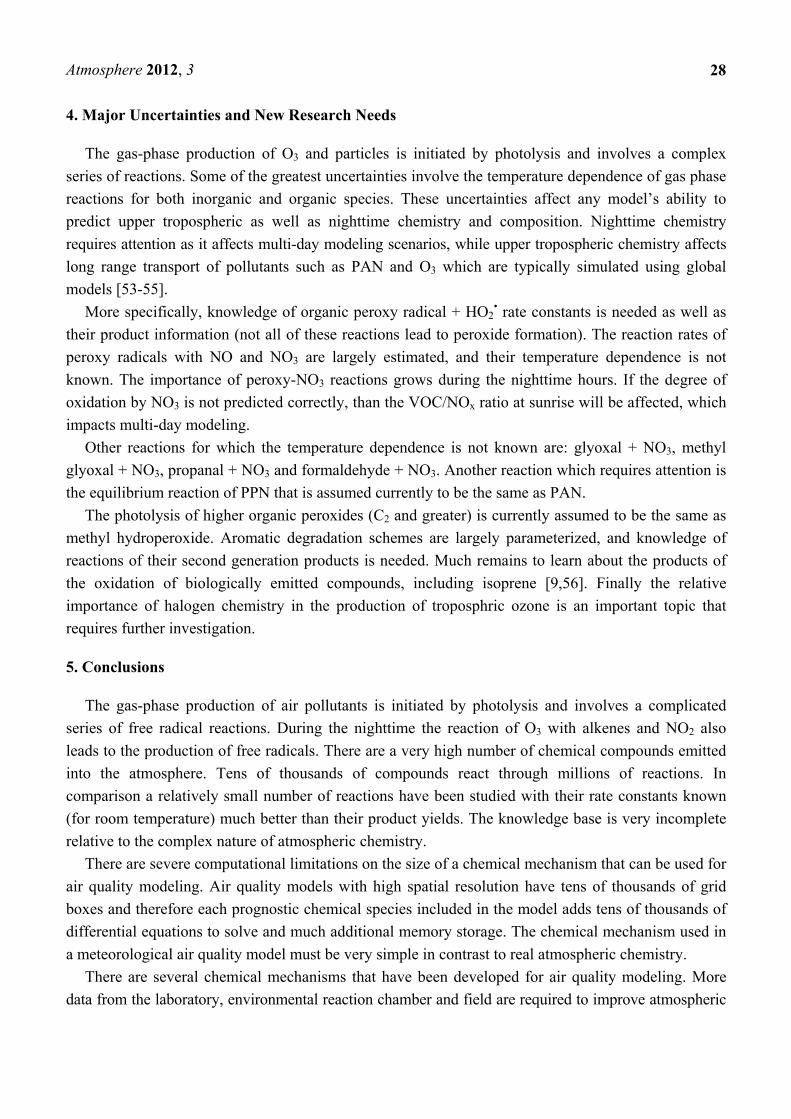
factors. Figure 23 shows the maximum O3 on the first day. For this case the response of the maximum
O3 to temperature is very linear (R2 = 0.999) and the slope of the best-fit line for this case is 4.3 ppb K−1.
Figure 23. Maximum O3 mixing ratios on the first day as a function of temperature for the
polluted urban atmosphere case.
Increasing temperatures due to climate change are likely to make the abatement of tropospheric O3
more difficult due to all of these factors.
Atmosphere 2012, 3
28
4. Major Uncertainties and New Research Needs
The gas-phase production of O3 and particles is initiated by photolysis and involves a complex
series of reactions. Some of the greatest uncertainties involve the temperature dependence of gas phase
reactions for both inorganic and organic species. These uncertainties affect any model’s ability to
predict upper tropospheric as well as nighttime chemistry and composition. Nighttime chemistry
requires attention as it affects multi-day modeling scenarios, while upper tropospheric chemistry affects
long range transport of pollutants such as PAN and O3 which are typically simulated using global
models [53-55].
More specifically, knowledge of organic peroxy radical + HO2• rate constants is needed as well as
their product information (not all of these reactions lead to peroxide formation). The reaction rates of
peroxy radicals with NO and NO3 are largely estimated, and their temperature dependence is not
known. The importance of peroxy-NO3 reactions grows during the nighttime hours. If the degree of
oxidation by NO3 is not predicted correctly, than the VOC/NOx ratio at sunrise will be affected, which
impacts multi-day modeling.
Other reactions for which the temperature dependence is not known are: glyoxal + NO3, methyl
glyoxal + NO3, propanal + NO3 and formaldehyde + NO3. Another reaction which requires attention is
the equilibrium reaction of PPN that is assumed currently to be the same as PAN.
The photolysis of higher organic peroxides (C2 and greater) is currently assumed to be the same as
methyl hydroperoxide. Aromatic degradation schemes are largely parameterized, and knowledge of
reactions of their second generation products is needed. Much remains to learn about the products of
the oxidation of biologically emitted compounds, including isoprene [9,56]. Finally the relative
importance of halogen chemistry in the production of troposphric ozone is an important topic that
requires further investigation.
5. Conclusions
The gas-phase production of air pollutants is initiated by photolysis and involves a complicated
series of free radical reactions. During the nighttime the reaction of O3 with alkenes and NO2 also
leads to the production of free radicals. There are a very high number of chemical compounds emitted
into the atmosphere. Tens of thousands of compounds react through millions of reactions. In
comparison a relatively small number of reactions have been studied with their rate constants known
(for room temperature) much better than their product yields. The knowledge base is very incomplete
relative to the complex nature of atmospheric chemistry.
There are severe computational limitations on the size of a chemical mechanism that can be used for
air quality modeling. Air quality models with high spatial resolution have tens of thousands of grid
boxes and therefore each prognostic chemical species included in the model adds tens of thousands of
differential equations to solve and much additional memory storage. The chemical mechanism used in
a meteorological air quality model must be very simple in contrast to real atmospheric chemistry.
There are several chemical mechanisms that have been developed for air quality modeling. More
data from the laboratory, environmental reaction chamber and field are required to improve atmospheric
Atmosphere 2012, 3
29
chemical mechanisms. It is very possible that there are major surprises to be discovered especially in
the chemistry of HOx and other processes that control O3 and particle formation [57].
Acknowledgments
The authors thank the late Daewon Byun for helping to conceive this paper. The authors thank the
National Science Foundation for grant number 0653997, “Collaborative Research: Nitrate (NO3)
Induced Nighttime Air Chemistry” that partially funded this research. The authors thank the National
Aeronautics and Space Administration for supporting Ms. Lawson under its grant “Howard University
Beltsville Center for Climate System Observation”. Additional support was provided by the California
Air Resources Board and the U.S. Environmental Protection Agency (through Oak Ridge Institute for
Science and Engineering) and a grant from the National Oceanic and Atmospheric Administration to
Howard University’s NOAA Center for Atmospheric Sciences. We thank the reviewers for many
useful comments. The opinions expressed in this publication are those of the authors alone and do not
reflect the policy of any governmental agency.
References
1. Demerjian, K.L.; Kerr, J.A.; Calvert, J.G. The Mechanism of Photochemical Smog Formation. In
Advances in Environmental Science and Technology; Wiley: New York, NY, USA, 1974; Volume 4.
2. Calvert, J.G.; Stockwell, W.R. Acid generation in the troposphere by gas phase chemistry.
Environ. Sci. Technol. 1983, 17, 428A-443A.
3. Finlayson-Pitts, B.J.; Pitts, J.N., Jr. Chemistry of the Upper and Lower Atmosphere; Academic
Press: San Diego, CA, USA, 1999.
4. Seinfeld, J.H.; Pandis, S. Atmospheric Chemistry and Physics from Air Pollution to Climate
Change; John Wiley & Sons: New York, NY, USA, 1998.
5. Jenkin, M.E.; Saunders S.M.; Pilling, M.J. The tropospheric degradation of volatile organic
compounds: A protocol for mechanism development. Atmos. Environ. 1997, 31, 81-104.
6. Geiger, H.; Barnes, I.; Becker, K.H.; Bohn, B.; Brauers, T.; Donner, B.; Dorn, H.-P.; Elend, M.;
Dinis, C.M.F.; Grossmann, D.; et al. Chemical mechanism development: Laboratory studies and
model applications. J. Atmos. Chem. 2002, 42, 323-357.
7. Sander, S.P.; Abbatt, J.; Barker, J.R.; Burkholder, J.B.; Friedl, R.R.; Golden, D.M.; Huie, R.E.;
Kolb, C.E.; Kurylo, M.J.; Moortgat, G.K.; et al. Chemical Kinetics and Photochemical Data for
Use in Atmospheric Studies, Evaluation Number 16, Supplement to Evaluation 15: Update of Key
Reactions; NASA Jet Propulsion Laboratory: Pasadena, CA, USA, 2010.
8. International Union of Pure and Applied Chemistry Subcommittee for Gas Kinetic Data
Evaluation. Evaluated Kinetic Data, 2008. Available online: http://www.iupac-kinetic.ch.cam.ac.uk/
(accessed on 24 October 2011).
9. Fuentes, J.D.; Lerdau, M.; Atkinson, R.; Baldocchi, D.; Botteneheim, J.W.; Ciccioli, P.; Lamb, B.;
Geron, C.; Gu, L.; Guenther, A.; et al. Biogenic hydrocarbons in the atmospheric boundary layer:
A review. Bull. Amer. Meteor. Soc. 2000, 81, 1537-1575.
Atmosphere 2012, 3
30
10. Simon, H.; Beck, L.; Bhave, P.V.; Divita, F.; Hsu, Y.; Luecken, D.; Mobley, J.D.; Pouliot, G.A.;
Reff, A.; Sarwar, G.; et al. The development and uses of EPA’s SPECIATE database. Atmos.
Pollut. Res. 2010, 1, 196-206.
11. Madronich, S.; Calvert, J.G. The NCAR Master Mechanism of the Gas Phase Chemistry—Version
2.0; NCAR/TN-333+SRT; NCAR: Boulder Colorado, CO, USA, 1990.
12. Master Chemical Mechanism, version 3.1. Available online: http://www1.chem.leeds.ac.uk//
Atmospheric/MCM/mcmproj.html (accessed on 24 October 2011).
13. Szopa, S.; Aumont, B.; Madronich, S. Assessment of the reduction methods used to develop
chemical schemes: Building of a new chemical scheme for VOC oxidation suited to
three-dimensional multiscale HOx-NOx-VOC chemistry simulations. Atmos. Chem. Phys. 2005, 5,
2519–2538.
14. Crutzen, P.J. My Life with O3, NOx and Other YZOxs; Nobel Lecture; 8 December 1995.
Available online: http://www.nobelprize.org/nobel_prizes/chemistry/laureates/1995/crutzen-
lecture.html (accessed on 24 October 2011).
15. Jenkin, M.E.; Watson, L.A.; Utembe, S.R.; Shallcross, D.E. A common representative
intermediates (CRI) mechanism for VOC degradation. Part 1: Gas phase mechanism
development. Atmos. Environ. 2008, 42, 7185-7195.
16. Watsona, L.A.; Shallcrossa, D.E.; Utembea, S.R.; Jenkinb, M.E. A Common Representative
Intermediates (CRI) mechanism for VOC degradation. Part 2: Gas phase mechanism reduction.
Atmos. Environ. 2008, 42, 7196-7204.
17. Byun, Q.W.; Ching, J.K.S. Science Algorithms of the EPA Models-3 Community Multiscale Aie
Quality (CMAQ) Modeling System; EPA Report EPA-600/R-89-030; U.S. Environmental
Protection Agency: Washington, DC, USA, 1999.
18. Jacobson, M.Z. Fundamentals of Atmospheric Modeling; Cambridge University Press:
Cambridge, UK, 1999.
19. Makar, P.A.; Stockwell, W.R.; Li, S.-M. Gas-phase chemistry mechanisms compression
strategies: Treatment of reactants. Atmos. Environ. 1996, 30, 831-842.
20. Proceedings of the Empirical Kinetics Modeling Approach (EKMA) Validation Workshop; EPA
Report EPA-600/9-83-014; Dimitriades, B., Dodge, M., Eds.; Environmental Sciences Research
Lab: Research Triangle Park, NC, USA, 1983.
21. Stockwell, W.R.; Middleton, P.; Chang, J.S.; Tang, X. The second generation regional acid
deposition model chemical mechanism for regional air quality modeling. J. Geophys. Res. 1990,
95, 16343-16367.
22. Whitten, G.Z.; Hogo, H. Mathematical Modeling of Simulated Photochemical Smog; EPA Report
EPA-600/3-77-011; Environmental Protection Agency: Washington, DC, USA, 1999.
23. Whitten, G.Z.; Hogo, H.; Killus, J.P. The carbon-bond mechanism: A condensed kinetic
mechanism for photochemical smog. Environ. Sci. Technol. 1980, 14, 690-700.
24. Yarwood, G.; Rao, S.; Yocke, M.; Whitten, G. Updates to the Carbon Bond Chemical
Mechanism: CB05. Final Report to the US EPA; EPA Report RT-0400675, 2005. Available
online: http://www.camx.com/publ/pdfs/CB05_Final_Report_120805.pdf (accessed on
24 October 2011).

Atmosphere 2012, 3
31
25. Gery, M.W.; Whitten, G.Z.; Killus, J.P.; Dodge, M.C. A photochemical mechanism for urban and
regional scale computer modeling. J. Geophys. Res. 1989, 94, 12925-12956.
26. Kim, Y.; Sartelet, K.; Seigneur, C. Formation of secondary aerosols over Europe: Comparison of
two gas-phase chemical mechanisms. Atmos. Chem. Phys. 2011, 11, 583-598.
27. Stockwell, W.R.; Kirchner, F.; Kuhn, M.; Seefeld, S. A new mechanism for regional atmospheric
chemistry modeling. J. Geophys. Res. 1997, 102, 25847-25879.
28. Carter, W.P.L. Development of the SAPRC-07 chemical mechanism. Atmos. Environ. 2010, 44,
5324-5335.
29. Carter, W.P.L. A detailed mechanism for the gas-phase atmospheric reactions of organic
compounds. Atmos. Environ. 1990, 24A, 481-518.
30. Carter, W.P.L. Documentation of the SAPRC-99 Chemical Mechanism for VOC Reactivity
Assessment. Final Report to California Air Resources Board Contract No. 92-329, and 95-308;
California Environmental Protection Agency, Air Resources Board, Research Division:
Sacramento, CA, USA, 2000.
31. Goliff, W.S.; Stockwell, W.R. The Regional Atmospheric Chemistry Mechanism, Version 2, an
Update. In Proceedings of the International Conference on Atmospheric Chemical Mechanisms;
University of California, Davis, CA, USA, 8–10 December 2008; University of California: Davis,
CA, USA, 2008.
32. Middleton, P.; Stockwell, W.R.; Carter, W.P.L. Aggregation and analysis of volatile organic
compound emissions for regional modeling. Atmos. Environ. 1990, 24A, 1107-1133.
33. Seefeld, S.; Stockwell, W.R. First-order sensitivity analysis of models with time dependent
parameters: An application to PAN and ozone. Atmos. Environ. 1999, 33, 2941-2953.
34. Madronich, S. Photodissociation in the atmosphere; 1. actinic flux and the effects on ground
reflections and clouds. J. Geophys. Res. 1987, 92, 9740-9752.
35. Warneck, P. Chemistry of the Natural Atmosphere, 2nd ed.; Academic Press: San Diego, CA,
USA, 1999.
36. Calvert, J.G.; Stockwell, W.R. Deviations from the O3-NO-NO2 photostationary state in
tropospheric chemistry. Can. J. Chem. 1983, 61, 983-992.
37. Horie, O.; Moortgat, G.K. Decomposition pathways of the excited Criegee intermediates in the
ozonolysis of simple alkenes. Atmos. Environ. 1991, 25A, 1881-1896.
38. Atkinson R.; Aschmann, S.M. OH radical production from the gas-phase reactions of O3 with a
series of alkenes under atmospheric conditions. Environ. Sci. Technol. 1993, 27, 1357-1363.
39. Atkinson, R.; Tuazon, E.C.; Aschmann, S.M. Products of the gas-phase reactions of O3 with
alkenes. Environ. Sci. Technol. 1995, 29, 1860-1866.
40. Calvert, J.G.; Atkinson, A.; Becker, K.H.; Kamens, R.M.; Seinfeld, J.H.; Wallington, T.J.;
Yarwood, G. The Mechanisms of Atmospheric Oxidation of Aromatic Hydrocarbons; Oxford
University Press: Oxford, UK, 2002.
41. Bloss, C.; Wagner, V.; Bonzanini, A.; Jenkin, M.E.; Wirtz, K.; Martin-Reviejo, M.; Pilling, M.J.
Evaluation of detailed aromatic mechanisms (MCMv3 and MCMv3.1) against environmental
chamber data. Atmos. Chem. Phys. 2005, 5, 623-639.
42. Berndt, T.; Böge, O. Formation of phenol and carbonyls from the atmospheric reaction of OH
radicals with benzene. Phys. Chem. Chem. Phys. 2006, 8, 1205-1214.
Atmosphere 2012, 3
32
43. Gomez Alvarez, E.G.; Viidanoja, J.; Munoz, A.; Wirtz, K.; Hjorth, J. Experimental confirmation
of the dicarbonyl route in the photo-oxidation of toluene and benzene. Environ. Sci. Technol.
2007, 41, 8362-8369.
44. Atherton, C.; Penner, J. The effects of biogenic hydrocarbons on the transformation of nitrogen
oxides in the troposphere. J. Geophys. Res. 1990, 95, doi:10.1029/JD095iD09p14027.
45. Atkinson, R. Atmospheric chemistry of VOCs and NOx. Atmos. Environ. 2000, 34, 2063-2101.
46. Stockwell, W.R.; Calvert, J.G. The mechanism of NO3 and HONO formation in the nighttime
chemistry of the urban atmosphere. J. Geophy. Res. 1983, 88, 6673-6682.
47. Cantrell, C.A.; Stockwell, W.R.; Anderson, L.G.; Busarow, K.L.; Perner, D.; Schmeltekope, A.;
Calvert, J.G.; Johnston, H.S. Kinetic study of the NO3-CH2O reaction and its possible role in
nighttime tropospheric chemistry. J. Phys. Chem. 1985, 89, 139-146.
48. Stockwell, W.R. On the HO2 + HO2 reaction: Its misapplication in atmospheric chemistry models.
J. Geophys. Res. 1995, 100, 11695-11698.
49. Villenave, E.; Lesclaux, R.; Seefeld, S.; Stockwell, W.R. Kinetics and atmospheric implications
of peroxy radical cross reactions involving CH3C(O)O2 radical. J. Geophys. Res. 1998, 103,
25273-25285.
50. Kirchner, F.; Stockwell, W.R. Effect of peroxy radical reactions on the predicted concentrations
of ozone, nitrogenous compounds and radicals. J. Geophys. Res. 1996, 101, 21007-21022.
51. Stockwell, W.R.; Calvert, J.G. The mechanism of the HO-SO2 reaction. Atmos. Environ. 1983, 17,
2231-2235.
52. Lu, R.; Turco, R.P.; Jacobson, M.Z. An integrated air pollution modeling system for urban and
regional scales: 2. Simulations for SCACS 1987. J. Geophys. Res. 1997, 102, 6081-6098.
53. Henderson, B.H.; Pinder, R.W.; Crooks, J.; Cohen, R.C.; Wennberg, P.O.; Hutzell, W.T.;
Sarwar, G.; Goliff, W.S.; Stockwell, W.R.; Fahr, A.; et al. Evaluation of simulated photochemical
partitioning of oxidized nitrogen in the upper troposphere. Atmos. Chem. Phys. 2011, 11, 275-291.
54. Crowley, J.N.; Schuster, G.; Pouvesle, N.; Bonn, B.; Bingemer, H.; Parchatka, U.; Fischer, H.;
Lelieveld, J. Nocturnal nitrogen oxides at a rural mountain-site in Southwestern Germany. Atmos.
Chem. Phys. 2010, 10, 2795-2812.
55. Emmerson, K.M.; Evans, M.J. Comparison of tropospheric gas-phase chemistry schemes for use
within global models. Atmos. Chem. Phys. 2009, 9, 1831-1845.
56. Galloway, M.M.; Huisman, A.J.; Yee, L.D.; Chan, A.W.H.; Loza, C.L.; Seinfeld, J.H.;
Keutsch, F.N. Yields of oxidized volatile organic compounds during the OH radical initiated
oxidation of isoprene, methyl vinyl ketone, and methacrolein under high-NOx conditions. Atmos.
Chem. Phys. 2011, 11, 10779-10790.
57. Chen, S.; Ren, X.; Mao, J.; Chen, Z.; Brune, W.H.; Lefer, B.; Rappenglück, B.; Flynn, J.; Olson, J.;
Crawford, J.H. A comparison of chemical mechanisms based on TRAMP-2006 field data. Atmos.
Environ. 2010, 44, 4116-4125.
© 2012 by the authors; licensee MDPI, Basel, Switzerland. This article is an open access article
distributed under the terms and conditions of the Creative Commons Attribution license
(http://creativecommons.org/licenses/by/3.0/).